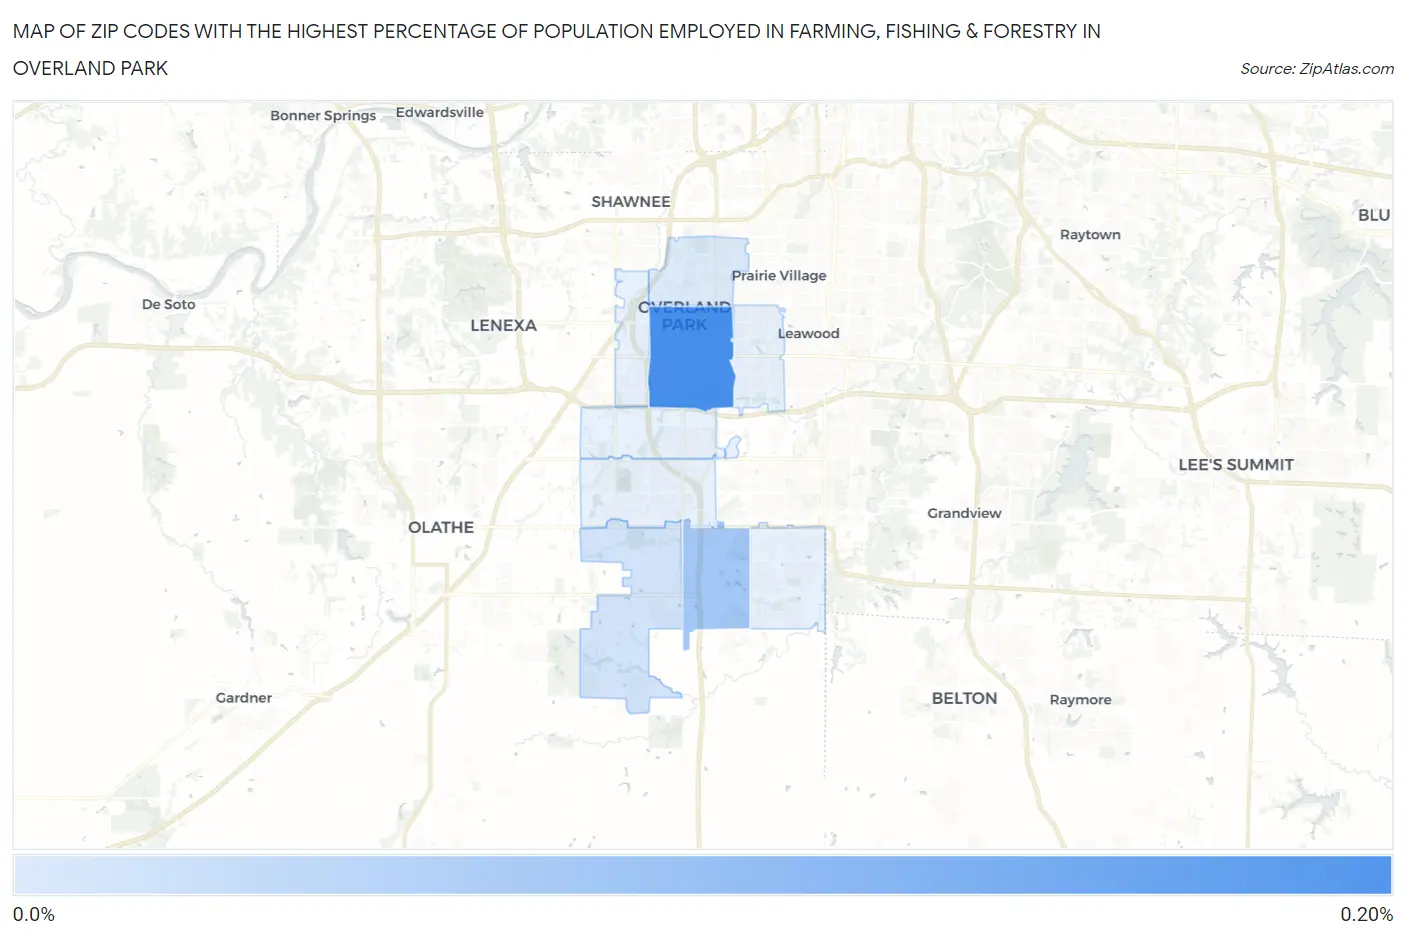
Zip Codes with the Highest Percentage of Population Employed in Farming, Fishing & Forestry in Overland Park, KS
RELATED REPORTS & OPTIONS
Farming, Fishing & Forestry
Overland Park
Compare Zip Codes
Map of Zip Codes with the Highest Percentage of Population Employed in Farming, Fishing & Forestry in Overland Park
0.0%
0.20%
Zip Codes with the Highest Percentage of Population Employed in Farming, Fishing & Forestry in Overland Park, KS
| Zip Code | % Employed | vs State | vs National | |
| 1. | 66212 | 0.18% | 0.91%(-0.730)#429 | 0.61%(-0.426)#16,425 |
| 2. | 66223 | 0.13% | 0.91%(-0.783)#439 | 0.61%(-0.479)#17,313 |
| 3. | 66221 | 0.099% | 0.91%(-0.811)#442 | 0.61%(-0.506)#17,778 |
| 4. | 66204 | 0.093% | 0.91%(-0.817)#445 | 0.61%(-0.512)#17,874 |
1
Common Questions
What are the Top 5 Zip Codes with the Highest Percentage of Population Employed in Farming, Fishing & Forestry in Overland Park, KS?
Top 5 Zip Codes with the Highest Percentage of Population Employed in Farming, Fishing & Forestry in Overland Park, KS are:
What zip code has the Highest Percentage of Population Employed in Farming, Fishing & Forestry in Overland Park, KS?
66212 has the Highest Percentage of Population Employed in Farming, Fishing & Forestry in Overland Park, KS with 0.18%.
What is the Percentage of Population Employed in Farming, Fishing & Forestry in Overland Park, KS?
Percentage of Population Employed in Farming, Fishing & Forestry in Overland Park is 0.068%.
What is the Percentage of Population Employed in Farming, Fishing & Forestry in Kansas?
Percentage of Population Employed in Farming, Fishing & Forestry in Kansas is 0.91%.
What is the Percentage of Population Employed in Farming, Fishing & Forestry in the United States?
Percentage of Population Employed in Farming, Fishing & Forestry in the United States is 0.61%.