Zip Codes with the Highest Percentage of Households Heated by Bottled Gas / Liquid Propane in Olathe, KS
RELATED REPORTS & OPTIONS
Bottled Gas / LP Heating
Olathe
Compare Zip Codes
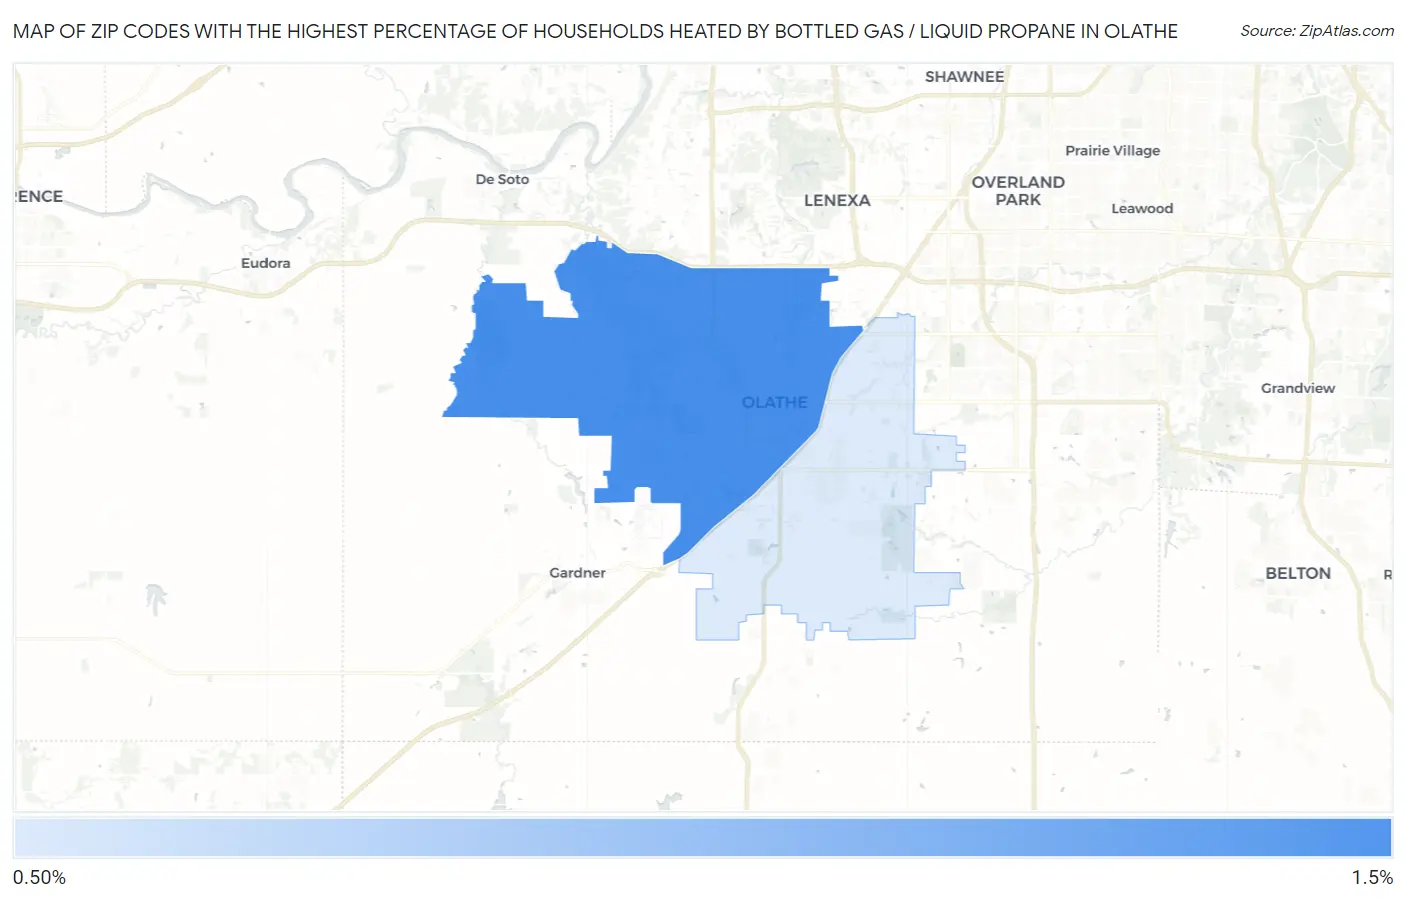
Map of Zip Codes with the Highest Percentage of Households Heated by Bottled Gas / Liquid Propane in Olathe
0.0%
1.5%
Zip Codes with the Highest Percentage of Households Heated by Bottled Gas / Liquid Propane in Olathe, KS
| Zip Code | Bottled Gas / LP Heating | vs State | vs National | |
| 1. | 66061 | 1.5% | 7.8%(-6.30)#637 | 4.9%(-3.40)#24,599 |
| 2. | 66062 | 1.3% | 7.8%(-6.50)#642 | 4.9%(-3.60)#25,329 |
1
Common Questions
What are the Top Zip Codes with the Highest Percentage of Households Heated by Bottled Gas / Liquid Propane in Olathe, KS?
Top Zip Codes with the Highest Percentage of Households Heated by Bottled Gas / Liquid Propane in Olathe, KS are:
What zip code has the Highest Percentage of Households Heated by Bottled Gas / Liquid Propane in Olathe, KS?
66061 has the Highest Percentage of Households Heated by Bottled Gas / Liquid Propane in Olathe, KS with 1.5%.
What is the Percentage of Households Heated by Bottled Gas / Liquid Propane in Olathe, KS?
Percentage of Households Heated by Bottled Gas / Liquid Propane in Olathe is 1.1%.
What is the Percentage of Households Heated by Bottled Gas / Liquid Propane in Kansas?
Percentage of Households Heated by Bottled Gas / Liquid Propane in Kansas is 7.8%.
What is the Percentage of Households Heated by Bottled Gas / Liquid Propane in the United States?
Percentage of Households Heated by Bottled Gas / Liquid Propane in the United States is 4.9%.