Zip Codes with the Highest Percentage of Population Employed in Farming, Fishing & Forestry in Olathe, KS
RELATED REPORTS & OPTIONS
Farming, Fishing & Forestry
Olathe
Compare Zip Codes
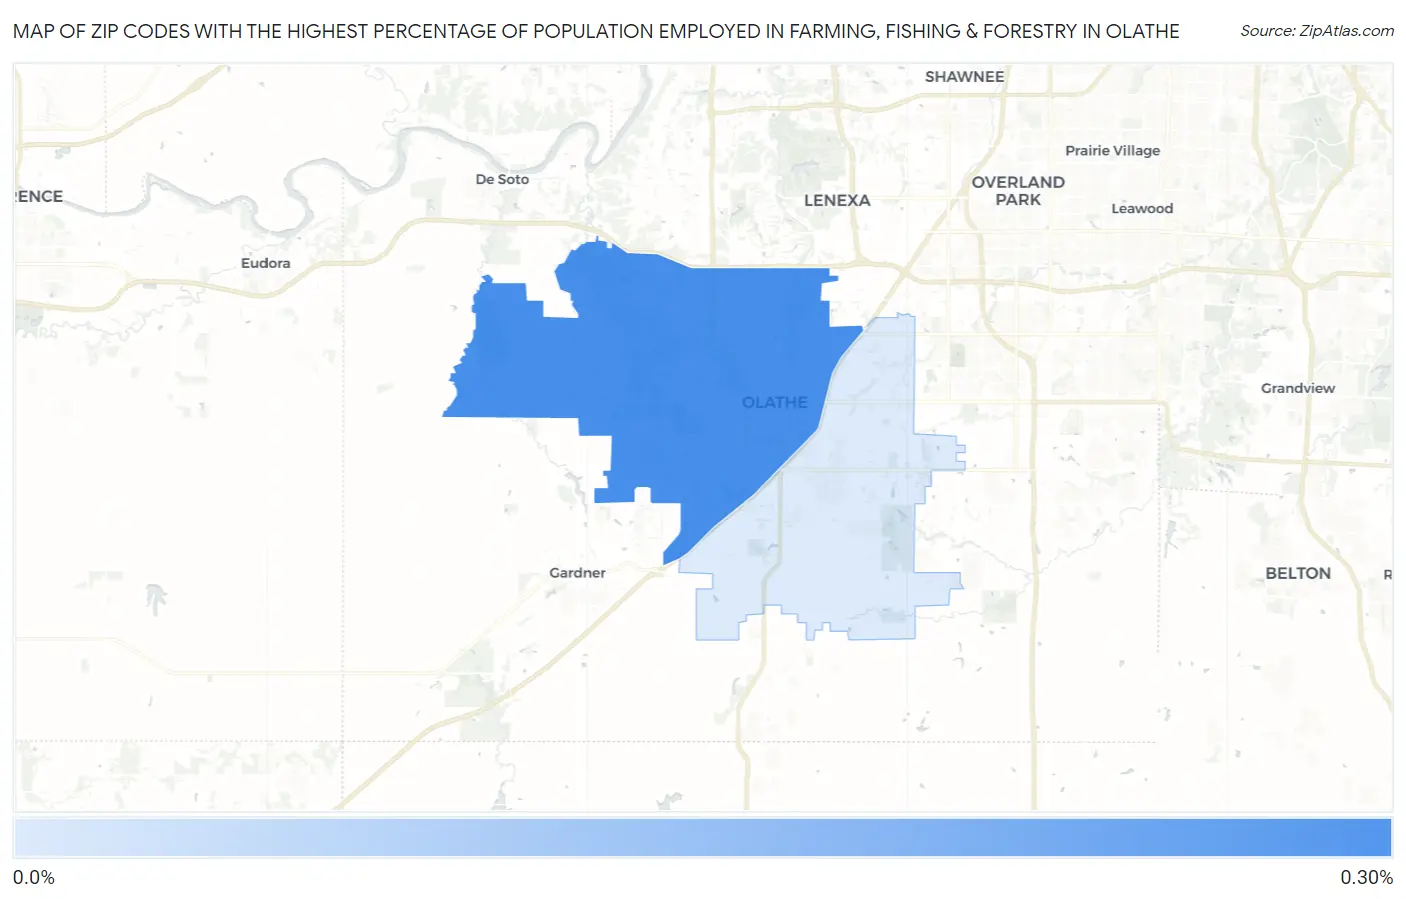
Map of Zip Codes with the Highest Percentage of Population Employed in Farming, Fishing & Forestry in Olathe
0.0%
0.30%
Zip Codes with the Highest Percentage of Population Employed in Farming, Fishing & Forestry in Olathe, KS
| Zip Code | % Employed | vs State | vs National | |
| 1. | 66061 | 0.29% | 0.91%(-0.616)#413 | 0.61%(-0.312)#14,911 |
| 2. | 66062 | 0.069% | 0.91%(-0.842)#448 | 0.61%(-0.537)#18,324 |
1
Common Questions
What are the Top Zip Codes with the Highest Percentage of Population Employed in Farming, Fishing & Forestry in Olathe, KS?
Top Zip Codes with the Highest Percentage of Population Employed in Farming, Fishing & Forestry in Olathe, KS are:
What zip code has the Highest Percentage of Population Employed in Farming, Fishing & Forestry in Olathe, KS?
66061 has the Highest Percentage of Population Employed in Farming, Fishing & Forestry in Olathe, KS with 0.29%.
What is the Percentage of Population Employed in Farming, Fishing & Forestry in Olathe, KS?
Percentage of Population Employed in Farming, Fishing & Forestry in Olathe is 0.14%.
What is the Percentage of Population Employed in Farming, Fishing & Forestry in Kansas?
Percentage of Population Employed in Farming, Fishing & Forestry in Kansas is 0.91%.
What is the Percentage of Population Employed in Farming, Fishing & Forestry in the United States?
Percentage of Population Employed in Farming, Fishing & Forestry in the United States is 0.61%.