Zip Codes with the Highest Percentage of Population Employed in Finance & Insurance in Indiana
RELATED REPORTS & OPTIONS
Finance & Insurance
Indiana
Compare Zip Codes
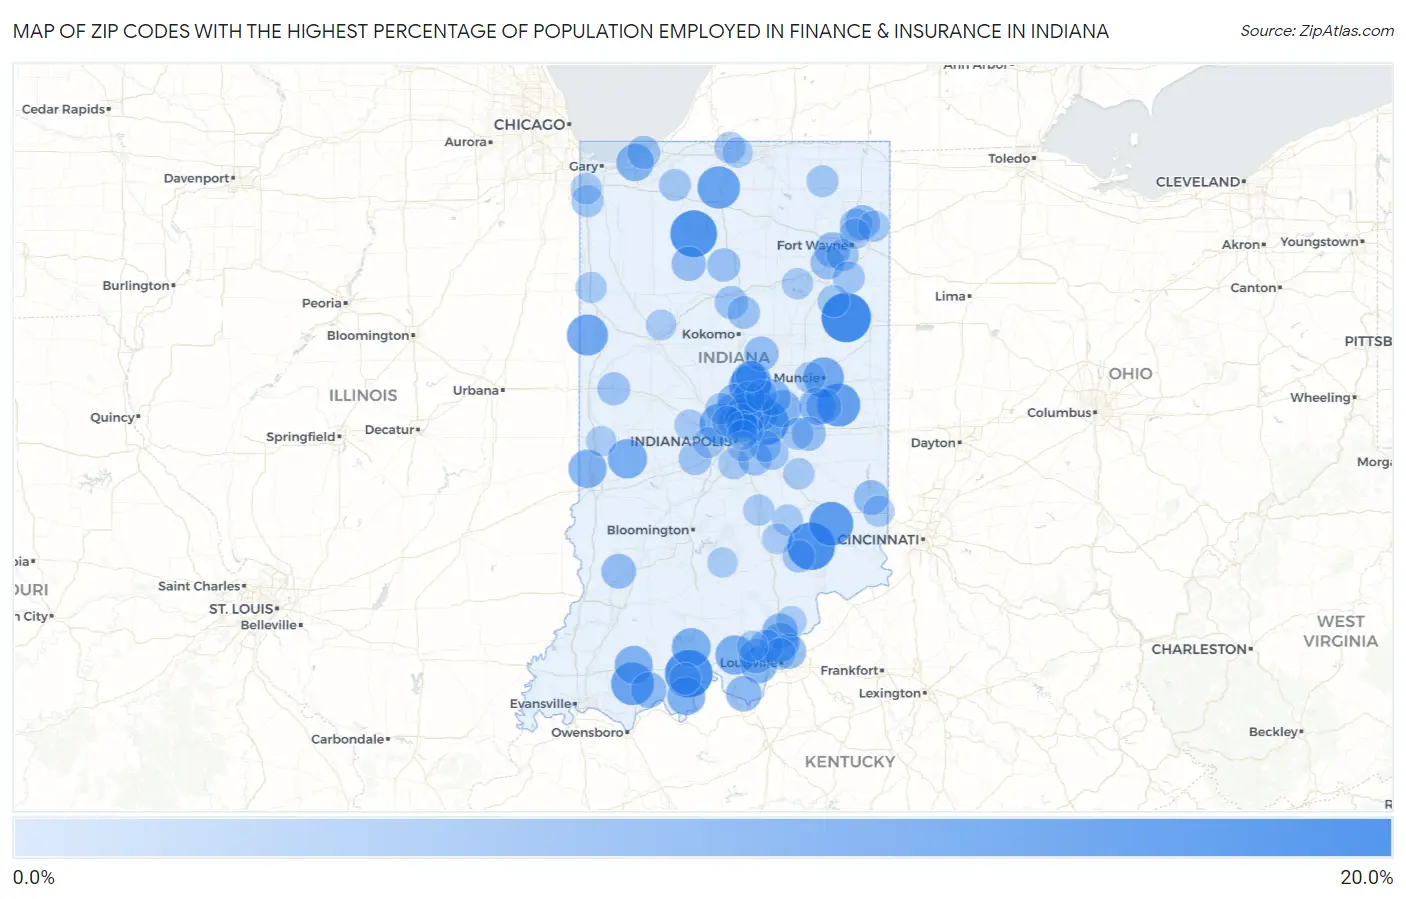
Map of Zip Codes with the Highest Percentage of Population Employed in Finance & Insurance in Indiana
0.0%
20.0%
Zip Codes with the Highest Percentage of Population Employed in Finance & Insurance in Indiana
| Zip Code | % Employed | vs State | vs National | |
| 1. | 46759 | 16.7% | 3.8%(+12.9)#1 | 4.8%(+12.0)#424 |
| 2. | 47223 | 15.6% | 3.8%(+11.8)#2 | 4.8%(+10.8)#502 |
| 3. | 47576 | 15.5% | 3.8%(+11.7)#3 | 4.8%(+10.8)#509 |
| 4. | 46960 | 15.1% | 3.8%(+11.3)#4 | 4.8%(+10.3)#554 |
| 5. | 46055 | 14.0% | 3.8%(+10.2)#5 | 4.8%(+9.25)#669 |
| 6. | 47034 | 13.5% | 3.8%(+9.68)#6 | 4.8%(+8.75)#736 |
| 7. | 47360 | 12.9% | 3.8%(+9.05)#7 | 4.8%(+8.12)#840 |
| 8. | 47537 | 12.8% | 3.8%(+8.96)#8 | 4.8%(+8.03)#855 |
| 9. | 46537 | 12.5% | 3.8%(+8.70)#9 | 4.8%(+7.77)#902 |
| 10. | 46034 | 12.3% | 3.8%(+8.51)#10 | 4.8%(+7.58)#937 |
| 11. | 47917 | 11.8% | 3.8%(+7.96)#11 | 4.8%(+7.03)#1,069 |
| 12. | 46278 | 11.5% | 3.8%(+7.65)#12 | 4.8%(+6.72)#1,144 |
| 13. | 47305 | 11.3% | 3.8%(+7.48)#13 | 4.8%(+6.55)#1,201 |
| 14. | 46030 | 11.1% | 3.8%(+7.28)#14 | 4.8%(+6.35)#1,262 |
| 15. | 47837 | 10.7% | 3.8%(+6.84)#15 | 4.8%(+5.91)#1,414 |
| 16. | 47166 | 10.6% | 3.8%(+6.79)#16 | 4.8%(+5.86)#1,431 |
| 17. | 47175 | 10.4% | 3.8%(+6.61)#17 | 4.8%(+5.68)#1,508 |
| 18. | 47172 | 10.2% | 3.8%(+6.37)#18 | 4.8%(+5.44)#1,609 |
| 19. | 47541 | 10.0% | 3.8%(+6.18)#19 | 4.8%(+5.25)#1,706 |
| 20. | 47863 | 10.0% | 3.8%(+6.16)#20 | 4.8%(+5.23)#1,713 |
| 21. | 47520 | 10.0% | 3.8%(+6.12)#21 | 4.8%(+5.19)#1,730 |
| 22. | 46037 | 9.6% | 3.8%(+5.74)#22 | 4.8%(+4.81)#1,928 |
| 23. | 46064 | 9.6% | 3.8%(+5.73)#23 | 4.8%(+4.80)#1,936 |
| 24. | 46304 | 9.5% | 3.8%(+5.65)#24 | 4.8%(+4.72)#1,975 |
| 25. | 47388 | 9.3% | 3.8%(+5.46)#25 | 4.8%(+4.53)#2,076 |
| 26. | 46038 | 9.2% | 3.8%(+5.38)#26 | 4.8%(+4.45)#2,122 |
| 27. | 47136 | 9.1% | 3.8%(+5.31)#27 | 4.8%(+4.38)#2,156 |
| 28. | 46051 | 9.1% | 3.8%(+5.27)#28 | 4.8%(+4.34)#2,180 |
| 29. | 47550 | 8.7% | 3.8%(+4.83)#29 | 4.8%(+3.90)#2,487 |
| 30. | 46032 | 8.6% | 3.8%(+4.75)#30 | 4.8%(+3.82)#2,546 |
| 31. | 47135 | 8.5% | 3.8%(+4.67)#31 | 4.8%(+3.74)#2,619 |
| 32. | 47143 | 8.5% | 3.8%(+4.65)#32 | 4.8%(+3.72)#2,648 |
| 33. | 47361 | 8.5% | 3.8%(+4.61)#33 | 4.8%(+3.68)#2,675 |
| 34. | 46814 | 8.4% | 3.8%(+4.59)#34 | 4.8%(+3.66)#2,697 |
| 35. | 47130 | 8.2% | 3.8%(+4.35)#35 | 4.8%(+3.42)#2,907 |
| 36. | 46250 | 8.2% | 3.8%(+4.34)#36 | 4.8%(+3.41)#2,916 |
| 37. | 46074 | 8.2% | 3.8%(+4.33)#37 | 4.8%(+3.40)#2,925 |
| 38. | 46765 | 8.1% | 3.8%(+4.27)#38 | 4.8%(+3.34)#2,976 |
| 39. | 47122 | 8.1% | 3.8%(+4.22)#39 | 4.8%(+3.29)#3,021 |
| 40. | 47578 | 8.0% | 3.8%(+4.20)#40 | 4.8%(+3.27)#3,037 |
| 41. | 47012 | 8.0% | 3.8%(+4.14)#41 | 4.8%(+3.21)#3,114 |
| 42. | 46985 | 7.9% | 3.8%(+4.06)#42 | 4.8%(+3.13)#3,181 |
| 43. | 46076 | 7.9% | 3.8%(+4.02)#43 | 4.8%(+3.09)#3,230 |
| 44. | 46148 | 7.7% | 3.8%(+3.85)#44 | 4.8%(+2.92)#3,413 |
| 45. | 46783 | 7.6% | 3.8%(+3.71)#45 | 4.8%(+2.78)#3,546 |
| 46. | 46280 | 7.5% | 3.8%(+3.69)#46 | 4.8%(+2.76)#3,570 |
| 47. | 46259 | 7.4% | 3.8%(+3.57)#47 | 4.8%(+2.64)#3,701 |
| 48. | 47119 | 7.3% | 3.8%(+3.44)#48 | 4.8%(+2.52)#3,853 |
| 49. | 46931 | 7.2% | 3.8%(+3.41)#49 | 4.8%(+2.48)#3,903 |
| 50. | 46033 | 7.2% | 3.8%(+3.40)#50 | 4.8%(+2.47)#3,917 |
| 51. | 46845 | 7.2% | 3.8%(+3.33)#51 | 4.8%(+2.40)#4,005 |
| 52. | 46301 | 7.1% | 3.8%(+3.31)#52 | 4.8%(+2.38)#4,043 |
| 53. | 46967 | 7.1% | 3.8%(+3.31)#53 | 4.8%(+2.38)#4,048 |
| 54. | 47987 | 7.0% | 3.8%(+3.19)#54 | 4.8%(+2.26)#4,202 |
| 55. | 46118 | 6.9% | 3.8%(+3.07)#55 | 4.8%(+2.14)#4,367 |
| 56. | 46914 | 6.8% | 3.8%(+3.01)#56 | 4.8%(+2.08)#4,463 |
| 57. | 47282 | 6.8% | 3.8%(+2.93)#57 | 4.8%(+2.00)#4,566 |
| 58. | 46260 | 6.7% | 3.8%(+2.88)#58 | 4.8%(+1.95)#4,633 |
| 59. | 46809 | 6.7% | 3.8%(+2.87)#59 | 4.8%(+1.94)#4,654 |
| 60. | 46130 | 6.7% | 3.8%(+2.84)#60 | 4.8%(+1.91)#4,690 |
| 61. | 46777 | 6.6% | 3.8%(+2.78)#61 | 4.8%(+1.85)#4,787 |
| 62. | 46240 | 6.5% | 3.8%(+2.71)#62 | 4.8%(+1.78)#4,899 |
| 63. | 46303 | 6.5% | 3.8%(+2.70)#63 | 4.8%(+1.77)#4,921 |
| 64. | 47514 | 6.5% | 3.8%(+2.70)#64 | 4.8%(+1.77)#4,922 |
| 65. | 46062 | 6.5% | 3.8%(+2.69)#65 | 4.8%(+1.76)#4,938 |
| 66. | 46766 | 6.5% | 3.8%(+2.67)#66 | 4.8%(+1.74)#4,966 |
| 67. | 46117 | 6.5% | 3.8%(+2.65)#67 | 4.8%(+1.72)#5,007 |
| 68. | 46346 | 6.5% | 3.8%(+2.63)#68 | 4.8%(+1.70)#5,043 |
| 69. | 46163 | 6.4% | 3.8%(+2.53)#69 | 4.8%(+1.60)#5,185 |
| 70. | 46784 | 6.3% | 3.8%(+2.50)#70 | 4.8%(+1.57)#5,236 |
| 71. | 46226 | 6.3% | 3.8%(+2.46)#71 | 4.8%(+1.53)#5,314 |
| 72. | 47129 | 6.3% | 3.8%(+2.44)#72 | 4.8%(+1.51)#5,350 |
| 73. | 46077 | 6.3% | 3.8%(+2.44)#73 | 4.8%(+1.51)#5,355 |
| 74. | 46373 | 6.2% | 3.8%(+2.37)#74 | 4.8%(+1.44)#5,482 |
| 75. | 46060 | 6.2% | 3.8%(+2.35)#75 | 4.8%(+1.42)#5,516 |
| 76. | 46741 | 6.1% | 3.8%(+2.24)#76 | 4.8%(+1.31)#5,692 |
| 77. | 46702 | 6.1% | 3.8%(+2.23)#77 | 4.8%(+1.30)#5,717 |
| 78. | 46150 | 6.1% | 3.8%(+2.22)#78 | 4.8%(+1.29)#5,730 |
| 79. | 47396 | 6.0% | 3.8%(+2.18)#79 | 4.8%(+1.25)#5,812 |
| 80. | 46142 | 6.0% | 3.8%(+2.17)#80 | 4.8%(+1.24)#5,843 |
| 81. | 46031 | 6.0% | 3.8%(+2.16)#81 | 4.8%(+1.23)#5,864 |
| 82. | 46635 | 6.0% | 3.8%(+2.15)#82 | 4.8%(+1.22)#5,881 |
| 83. | 47280 | 6.0% | 3.8%(+2.14)#83 | 4.8%(+1.21)#5,912 |
| 84. | 47951 | 6.0% | 3.8%(+2.12)#84 | 4.8%(+1.19)#5,961 |
| 85. | 47060 | 6.0% | 3.8%(+2.11)#85 | 4.8%(+1.18)#5,970 |
| 86. | 46149 | 5.9% | 3.8%(+2.09)#86 | 4.8%(+1.16)#6,017 |
| 87. | 47124 | 5.9% | 3.8%(+2.08)#87 | 4.8%(+1.15)#6,039 |
| 88. | 46123 | 5.9% | 3.8%(+2.06)#88 | 4.8%(+1.13)#6,086 |
| 89. | 46220 | 5.9% | 3.8%(+2.05)#89 | 4.8%(+1.12)#6,104 |
| 90. | 47244 | 5.9% | 3.8%(+2.04)#90 | 4.8%(+1.11)#6,118 |
| 91. | 46268 | 5.8% | 3.8%(+2.01)#91 | 4.8%(+1.08)#6,187 |
| 92. | 47232 | 5.7% | 3.8%(+1.91)#92 | 4.8%(+0.981)#6,399 |
| 93. | 46825 | 5.7% | 3.8%(+1.86)#93 | 4.8%(+0.934)#6,498 |
| 94. | 47920 | 5.7% | 3.8%(+1.85)#94 | 4.8%(+0.917)#6,537 |
| 95. | 47163 | 5.7% | 3.8%(+1.82)#95 | 4.8%(+0.887)#6,594 |
| 96. | 46545 | 5.6% | 3.8%(+1.78)#96 | 4.8%(+0.845)#6,692 |
| 97. | 47862 | 5.6% | 3.8%(+1.77)#97 | 4.8%(+0.843)#6,699 |
| 98. | 46203 | 5.6% | 3.8%(+1.71)#98 | 4.8%(+0.783)#6,865 |
| 99. | 47264 | 5.5% | 3.8%(+1.69)#99 | 4.8%(+0.765)#6,909 |
| 100. | 46218 | 5.5% | 3.8%(+1.69)#100 | 4.8%(+0.755)#6,920 |
Common Questions
What are the Top 10 Zip Codes with the Highest Percentage of Population Employed in Finance & Insurance in Indiana?
Top 10 Zip Codes with the Highest Percentage of Population Employed in Finance & Insurance in Indiana are:
What zip code has the Highest Percentage of Population Employed in Finance & Insurance in Indiana?
46759 has the Highest Percentage of Population Employed in Finance & Insurance in Indiana with 16.7%.
What is the Percentage of Population Employed in Finance & Insurance in the State of Indiana?
Percentage of Population Employed in Finance & Insurance in Indiana is 3.8%.
What is the Percentage of Population Employed in Finance & Insurance in the United States?
Percentage of Population Employed in Finance & Insurance in the United States is 4.8%.