Zip Codes with the Highest Percentage of Population Employed in Agriculture, Fishing & Hunting in Kokomo, IN
RELATED REPORTS & OPTIONS
Agriculture, Fishing & Hunting
Kokomo
Compare Zip Codes
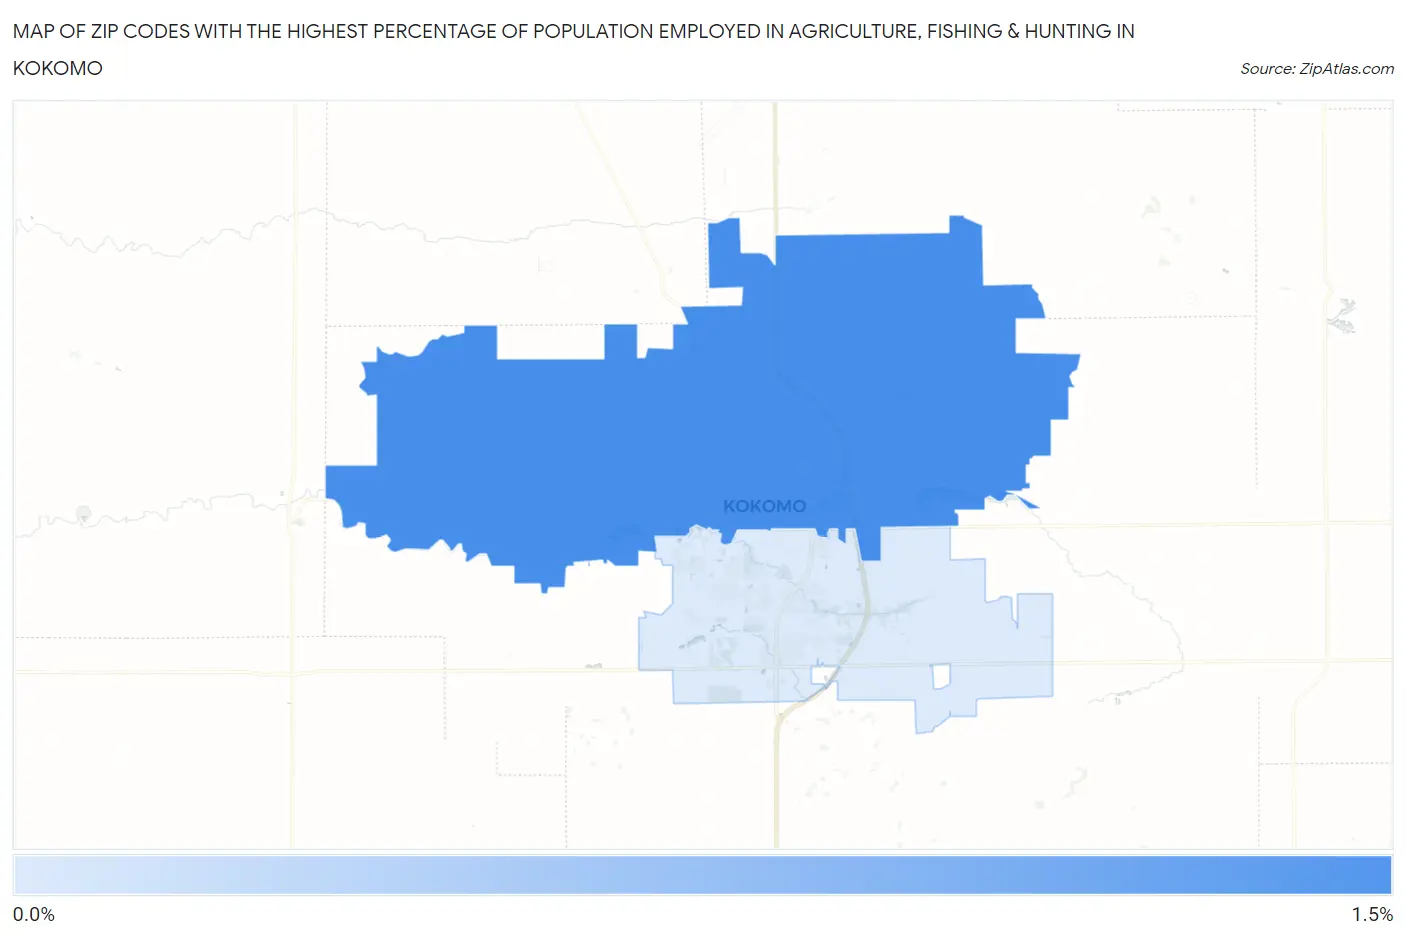
Map of Zip Codes with the Highest Percentage of Population Employed in Agriculture, Fishing & Hunting in Kokomo
0.0%
1.5%
Zip Codes with the Highest Percentage of Population Employed in Agriculture, Fishing & Hunting in Kokomo, IN
| Zip Code | % Employed | vs State | vs National | |
| 1. | 46901 | 1.3% | 1.1%(+0.287)#340 | 1.2%(+0.145)#14,855 |
| 2. | 46902 | 0.38% | 1.1%(-0.673)#497 | 1.2%(-0.816)#20,306 |
1
Common Questions
What are the Top Zip Codes with the Highest Percentage of Population Employed in Agriculture, Fishing & Hunting in Kokomo, IN?
Top Zip Codes with the Highest Percentage of Population Employed in Agriculture, Fishing & Hunting in Kokomo, IN are:
What zip code has the Highest Percentage of Population Employed in Agriculture, Fishing & Hunting in Kokomo, IN?
46901 has the Highest Percentage of Population Employed in Agriculture, Fishing & Hunting in Kokomo, IN with 1.3%.
What is the Percentage of Population Employed in Agriculture, Fishing & Hunting in Kokomo, IN?
Percentage of Population Employed in Agriculture, Fishing & Hunting in Kokomo is 0.34%.
What is the Percentage of Population Employed in Agriculture, Fishing & Hunting in Indiana?
Percentage of Population Employed in Agriculture, Fishing & Hunting in Indiana is 1.1%.
What is the Percentage of Population Employed in Agriculture, Fishing & Hunting in the United States?
Percentage of Population Employed in Agriculture, Fishing & Hunting in the United States is 1.2%.