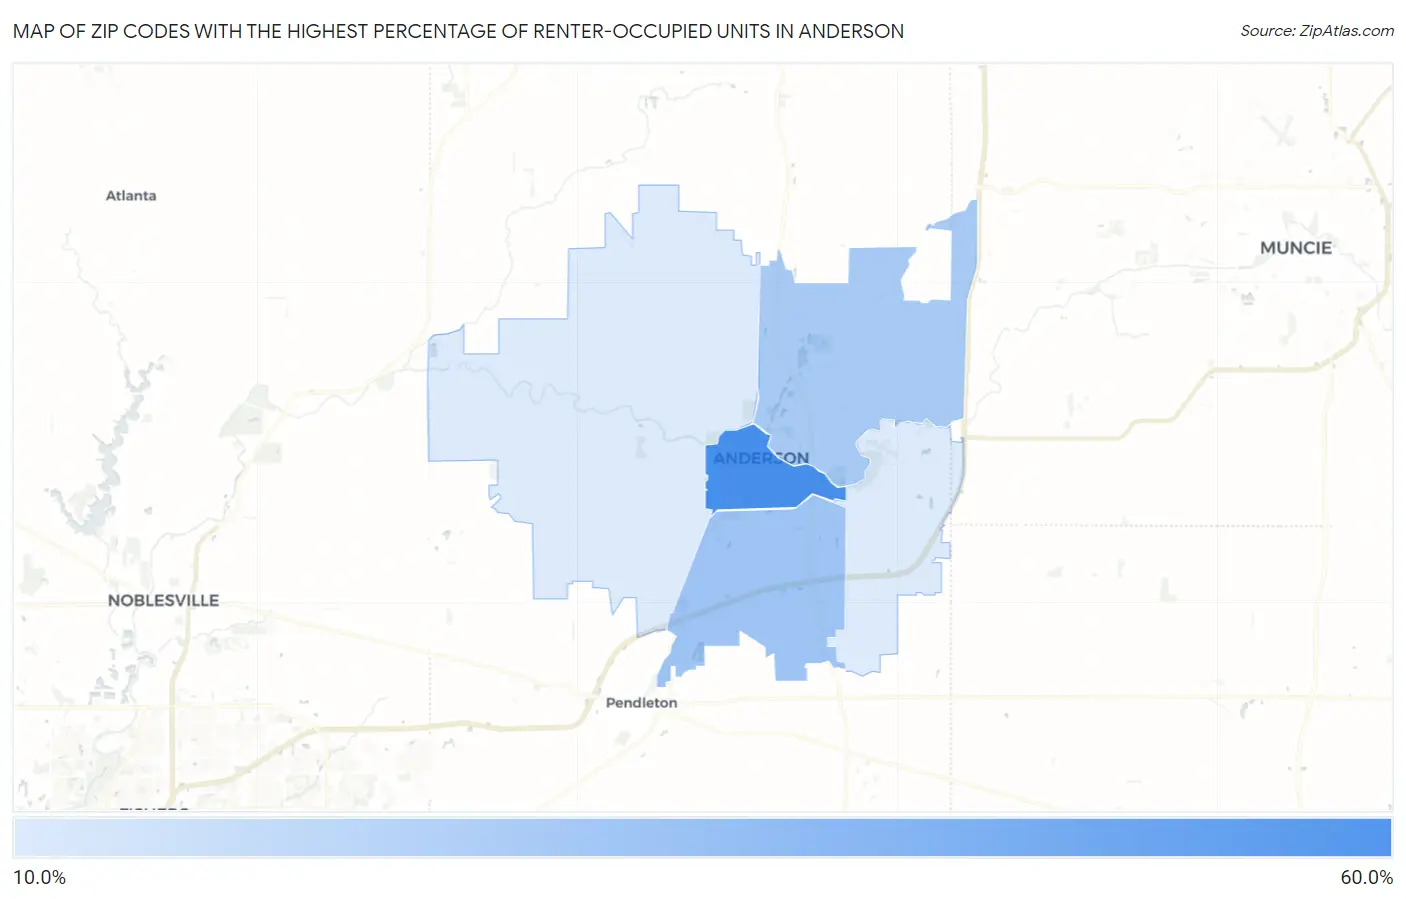
Zip Codes with the Highest Percentage of Renter-Occupied Units in Anderson, IN
RELATED REPORTS & OPTIONS
Highest Renter-Occupied
Anderson
Compare Zip Codes
Map of Zip Codes with the Highest Percentage of Renter-Occupied Units in Anderson
0.0%
60.0%
Zip Codes with the Highest Percentage of Renter-Occupied Units in Anderson, IN
| Zip Code | % Renter-Occupied | vs State | vs National | |
| 1. | 46016 | 58.5% | 29.9%(+28.6)#24 | 35.2%(+23.3)#1,942 |
| 2. | 46013 | 34.4% | 29.9%(+4.56)#133 | 35.2%(-0.739)#7,643 |
| 3. | 46012 | 32.4% | 29.9%(+2.53)#150 | 35.2%(-2.76)#8,622 |
| 4. | 46017 | 19.9% | 29.9%(-10.0)#371 | 35.2%(-15.3)#18,335 |
| 5. | 46011 | 19.8% | 29.9%(-10.1)#374 | 35.2%(-15.4)#18,393 |
1
Common Questions
What are the Top 3 Zip Codes with the Highest Percentage of Renter-Occupied Units in Anderson, IN?
Top 3 Zip Codes with the Highest Percentage of Renter-Occupied Units in Anderson, IN are:
What zip code has the Highest Percentage of Renter-Occupied Units in Anderson, IN?
46016 has the Highest Percentage of Renter-Occupied Units in Anderson, IN with 58.5%.
What is the Percentage of Renter-Occupied Units in Anderson, IN?
Percentage of Renter-Occupied Units in Anderson is 43.8%.
What is the Percentage of Renter-Occupied Units in Indiana?
Percentage of Renter-Occupied Units in Indiana is 29.9%.
What is the Percentage of Renter-Occupied Units in the United States?
Percentage of Renter-Occupied Units in the United States is 35.2%.