Kihei, HI Map & Demographics
Kihei Map
Kihei Overview
$43,099
PER CAPITA INCOME
$99,457
AVG FAMILY INCOME
$89,892
AVG HOUSEHOLD INCOME
17.8%
WAGE / INCOME GAP [ % ]
82.2¢/ $1
WAGE / INCOME GAP [ $ ]
0.41
INEQUALITY / GINI INDEX
22,247
TOTAL POPULATION
10,556
MALE POPULATION
11,691
FEMALE POPULATION
90.29
MALES / 100 FEMALES
110.75
FEMALES / 100 MALES
41.4
MEDIAN AGE
3.3
AVG FAMILY SIZE
2.8
AVG HOUSEHOLD SIZE
13,289
LABOR FORCE [ PEOPLE ]
71.8%
PERCENT IN LABOR FORCE
6.5%
UNEMPLOYMENT RATE
Kihei Zip Codes
Kihei Area Codes
Income in Kihei
Income Overview in Kihei
Per Capita Income in Kihei is $43,099, while median incomes of families and households are $99,457 and $89,892 respectively.
| Characteristic | Number | Measure |
| Per Capita Income | 22,247 | $43,099 |
| Median Family Income | 5,024 | $99,457 |
| Mean Family Income | 5,024 | $123,287 |
| Median Household Income | 8,001 | $89,892 |
| Mean Household Income | 8,001 | $114,764 |
| Income Deficit | 5,024 | $0 |
| Wage / Income Gap (%) | 22,247 | 17.77% |
| Wage / Income Gap ($) | 22,247 | 82.23¢ per $1 |
| Gini / Inequality Index | 22,247 | 0.41 |
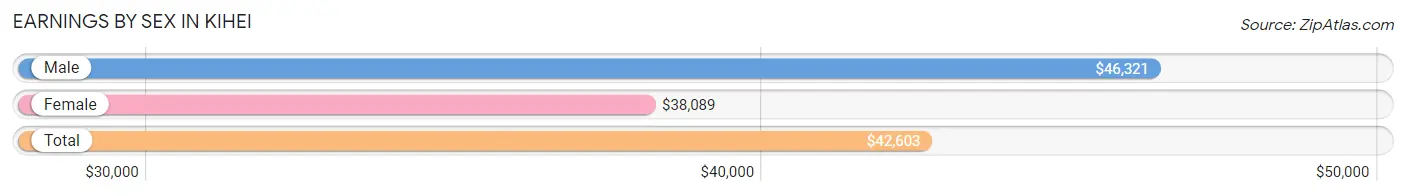
Earnings by Sex in Kihei
Average Earnings in Kihei are $42,603, $46,321 for men and $38,089 for women, a difference of 17.8%.
| Sex | Number | Average Earnings |
| Male | 6,591 (48.2%) | $46,321 |
| Female | 7,076 (51.8%) | $38,089 |
| Total | 13,667 (100.0%) | $42,603 |
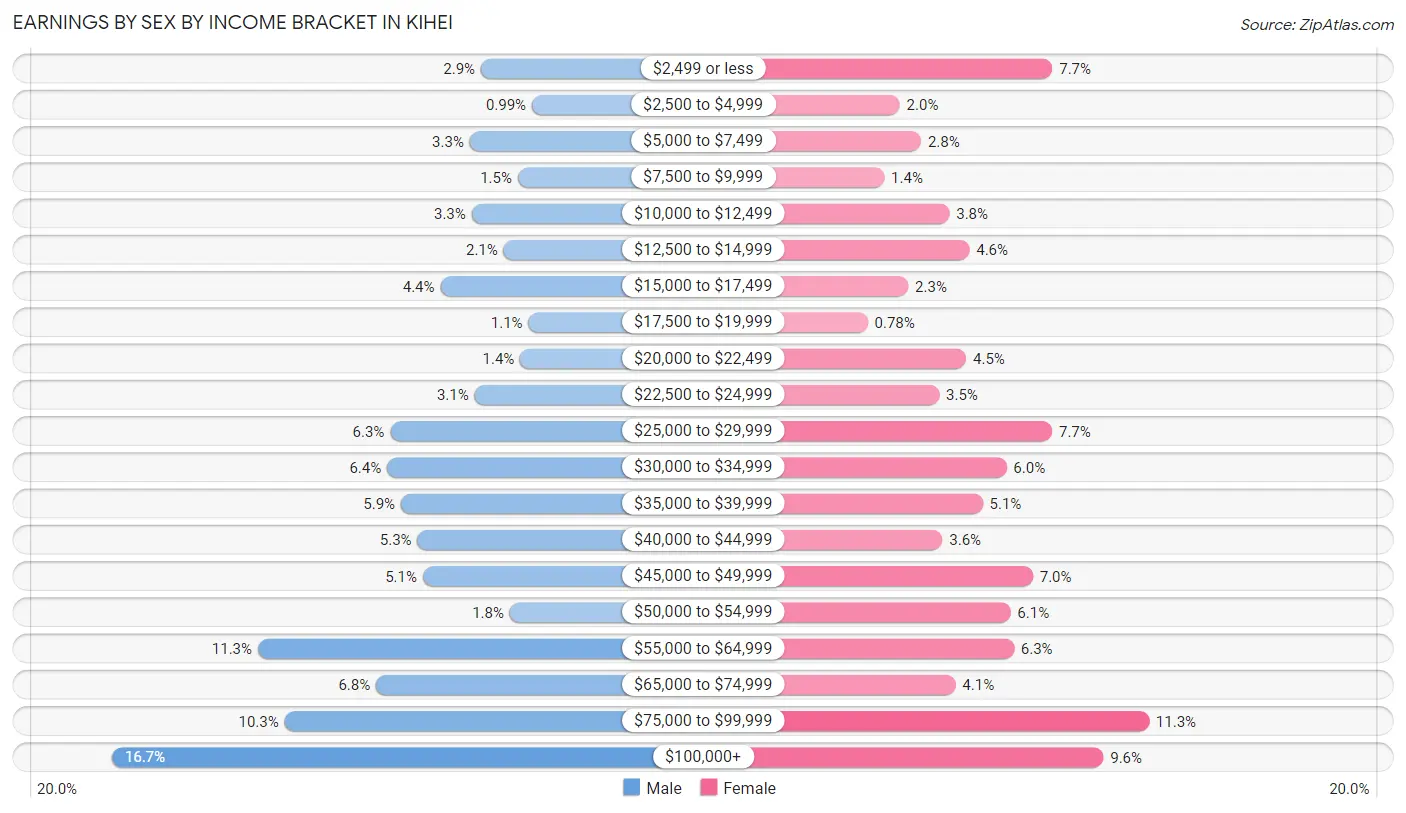
Earnings by Sex by Income Bracket in Kihei
The most common earnings brackets in Kihei are $100,000+ for men (1,103 | 16.7%) and $75,000 to $99,999 for women (801 | 11.3%).
| Income | Male | Female |
| $2,499 or less | 191 (2.9%) | 545 (7.7%) |
| $2,500 to $4,999 | 65 (1.0%) | 140 (2.0%) |
| $5,000 to $7,499 | 219 (3.3%) | 197 (2.8%) |
| $7,500 to $9,999 | 100 (1.5%) | 99 (1.4%) |
| $10,000 to $12,499 | 214 (3.3%) | 272 (3.8%) |
| $12,500 to $14,999 | 135 (2.1%) | 325 (4.6%) |
| $15,000 to $17,499 | 291 (4.4%) | 163 (2.3%) |
| $17,500 to $19,999 | 74 (1.1%) | 55 (0.8%) |
| $20,000 to $22,499 | 94 (1.4%) | 316 (4.5%) |
| $22,500 to $24,999 | 207 (3.1%) | 245 (3.5%) |
| $25,000 to $29,999 | 415 (6.3%) | 544 (7.7%) |
| $30,000 to $34,999 | 423 (6.4%) | 423 (6.0%) |
| $35,000 to $39,999 | 389 (5.9%) | 360 (5.1%) |
| $40,000 to $44,999 | 348 (5.3%) | 253 (3.6%) |
| $45,000 to $49,999 | 335 (5.1%) | 493 (7.0%) |
| $50,000 to $54,999 | 120 (1.8%) | 434 (6.1%) |
| $55,000 to $64,999 | 742 (11.3%) | 443 (6.3%) |
| $65,000 to $74,999 | 450 (6.8%) | 288 (4.1%) |
| $75,000 to $99,999 | 676 (10.3%) | 801 (11.3%) |
| $100,000+ | 1,103 (16.7%) | 680 (9.6%) |
| Total | 6,591 (100.0%) | 7,076 (100.0%) |
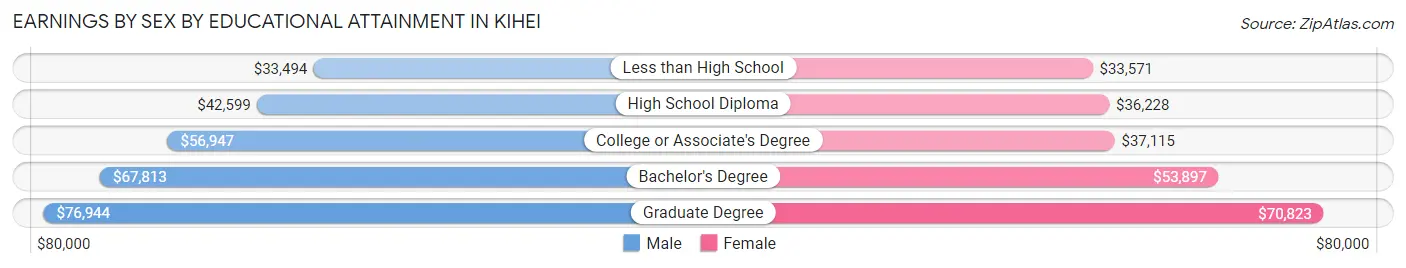
Earnings by Sex by Educational Attainment in Kihei
Average earnings in Kihei are $53,333 for men and $44,798 for women, a difference of 16.0%. Men with an educational attainment of graduate degree enjoy the highest average annual earnings of $76,944, while those with less than high school education earn the least with $33,494. Women with an educational attainment of graduate degree earn the most with the average annual earnings of $70,823, while those with less than high school education have the smallest earnings of $33,571.
| Educational Attainment | Male Income | Female Income |
| Less than High School | $33,494 | $33,571 |
| High School Diploma | $42,599 | $36,228 |
| College or Associate's Degree | $56,947 | $37,115 |
| Bachelor's Degree | $67,813 | $53,897 |
| Graduate Degree | $76,944 | $70,823 |
| Total | $53,333 | $44,798 |
Family Income in Kihei
Family Income Brackets in Kihei
According to the Kihei family income data, there are 1,125 families falling into the $100,000 to $149,999 income range, which is the most common income bracket and makes up 22.4% of all families. Conversely, the less than $10,000 income bracket is the least frequent group with only 85 families (1.7%) belonging to this category.
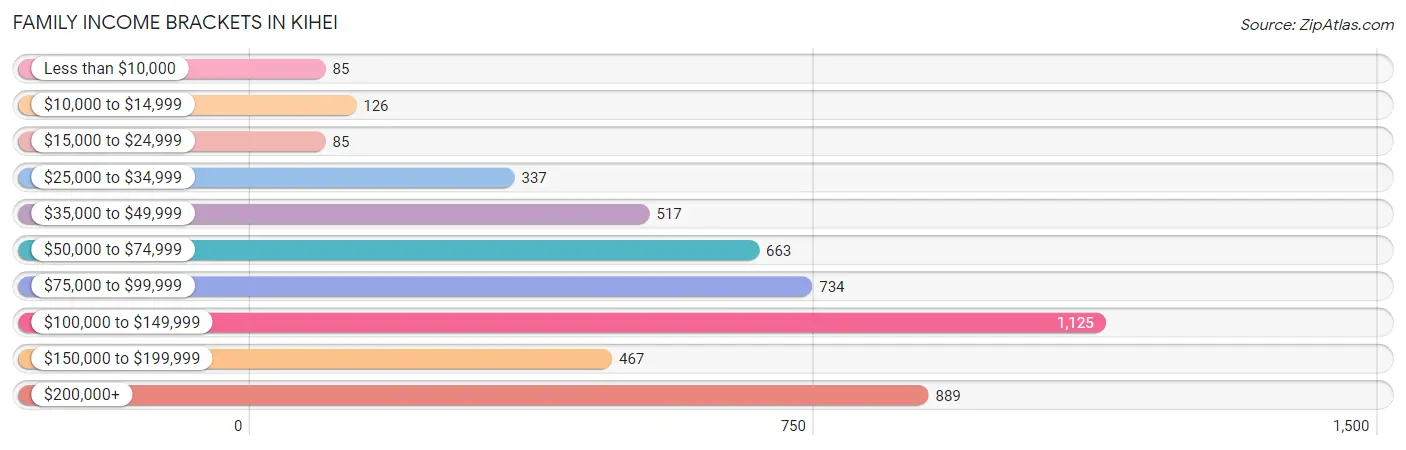
| Income Bracket | # Families | % Families |
| Less than $10,000 | 85 | 1.7% |
| $10,000 to $14,999 | 126 | 2.5% |
| $15,000 to $24,999 | 85 | 1.7% |
| $25,000 to $34,999 | 337 | 6.7% |
| $35,000 to $49,999 | 517 | 10.3% |
| $50,000 to $74,999 | 663 | 13.2% |
| $75,000 to $99,999 | 734 | 14.6% |
| $100,000 to $149,999 | 1,125 | 22.4% |
| $150,000 to $199,999 | 467 | 9.3% |
| $200,000+ | 889 | 17.7% |
Family Income by Famaliy Size in Kihei
7+ person families (177 | 3.5%) account for the highest median family income in Kihei with $250,001 per family, while 2-person families (2,538 | 50.5%) have the highest median income of $48,974 per family member.
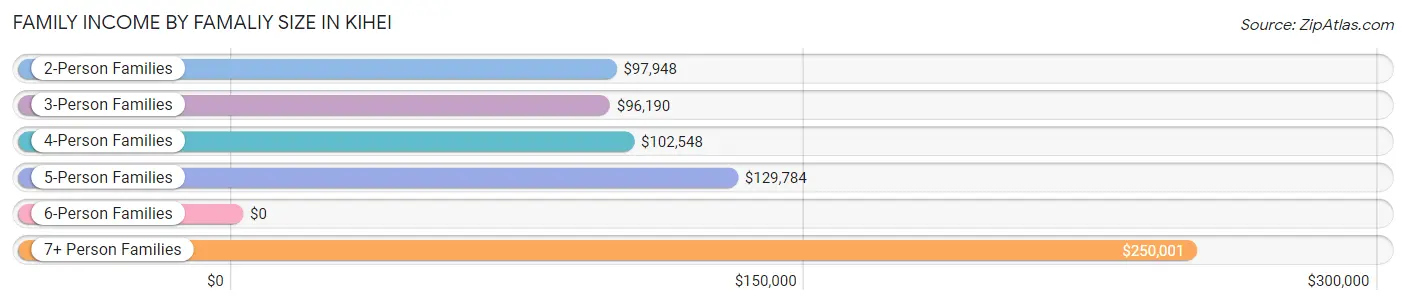
| Income Bracket | # Families | Median Income |
| 2-Person Families | 2,538 (50.5%) | $97,948 |
| 3-Person Families | 1,144 (22.8%) | $96,190 |
| 4-Person Families | 831 (16.5%) | $102,548 |
| 5-Person Families | 197 (3.9%) | $129,784 |
| 6-Person Families | 137 (2.7%) | $0 |
| 7+ Person Families | 177 (3.5%) | $250,001 |
| Total | 5,024 (100.0%) | $99,457 |
Family Income by Number of Earners in Kihei
The median family income in Kihei is $99,457, with families comprising 3+ earners (894) having the highest median family income of $178,571, while families with no earners (720) have the lowest median family income of $58,438, accounting for 17.8% and 14.3% of families, respectively.
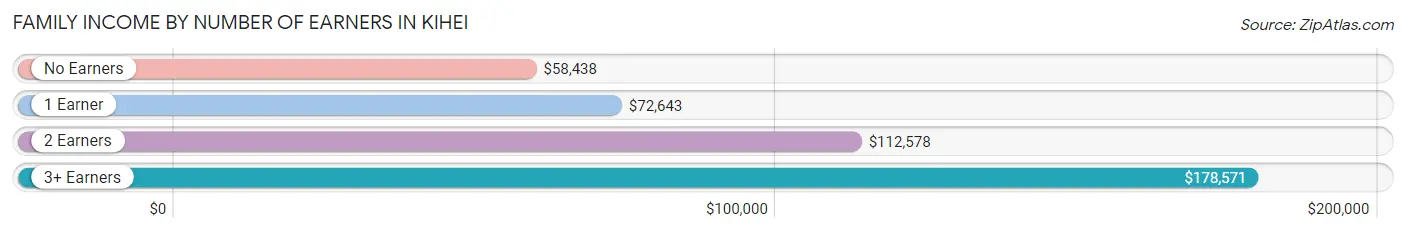
| Number of Earners | # Families | Median Income |
| No Earners | 720 (14.3%) | $58,438 |
| 1 Earner | 1,444 (28.7%) | $72,643 |
| 2 Earners | 1,966 (39.1%) | $112,578 |
| 3+ Earners | 894 (17.8%) | $178,571 |
| Total | 5,024 (100.0%) | $99,457 |
Household Income in Kihei
Household Income Brackets in Kihei
With 1,632 households falling in the category, the $100,000 to $149,999 income range is the most frequent in Kihei, accounting for 20.4% of all households. In contrast, only 176 households (2.2%) fall into the less than $10,000 income bracket, making it the least populous group.
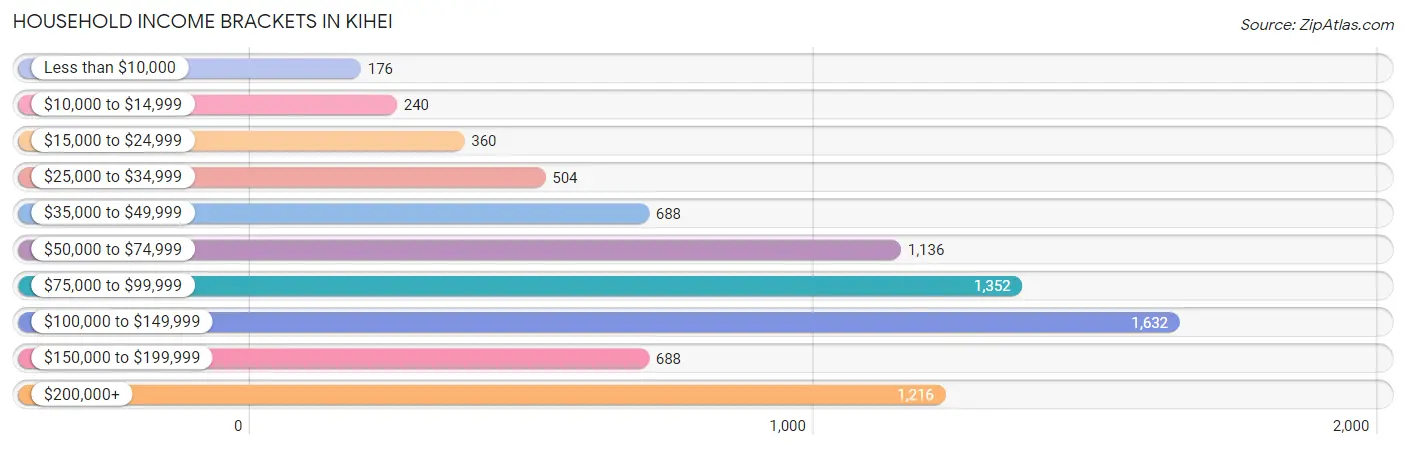
| Income Bracket | # Households | % Households |
| Less than $10,000 | 176 | 2.2% |
| $10,000 to $14,999 | 240 | 3.0% |
| $15,000 to $24,999 | 360 | 4.5% |
| $25,000 to $34,999 | 504 | 6.3% |
| $35,000 to $49,999 | 688 | 8.6% |
| $50,000 to $74,999 | 1,136 | 14.2% |
| $75,000 to $99,999 | 1,352 | 16.9% |
| $100,000 to $149,999 | 1,632 | 20.4% |
| $150,000 to $199,999 | 688 | 8.6% |
| $200,000+ | 1,216 | 15.2% |
Household Income by Householder Age in Kihei
The median household income in Kihei is $89,892, with the highest median household income of $106,766 found in the 45 to 64 years age bracket for the primary householder. A total of 3,083 households (38.5%) fall into this category. Meanwhile, the 15 to 24 years age bracket for the primary householder has the lowest median household income of $68,355, with 174 households (2.2%) in this group.
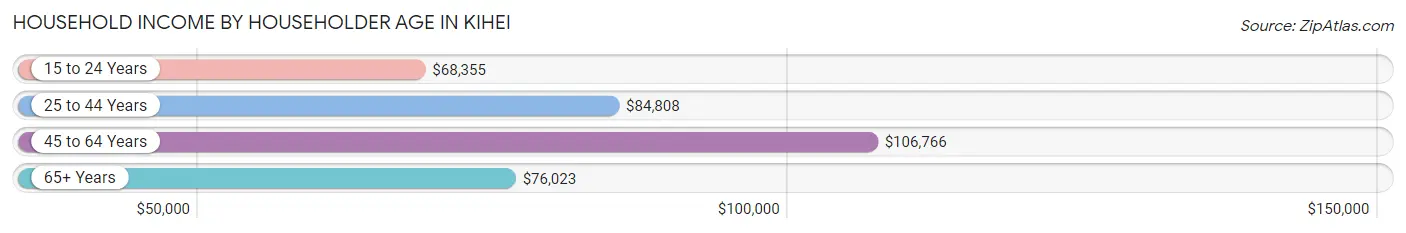
| Income Bracket | # Households | Median Income |
| 15 to 24 Years | 174 (2.2%) | $68,355 |
| 25 to 44 Years | 2,676 (33.5%) | $84,808 |
| 45 to 64 Years | 3,083 (38.5%) | $106,766 |
| 65+ Years | 2,068 (25.9%) | $76,023 |
| Total | 8,001 (100.0%) | $89,892 |
Poverty in Kihei
Income Below Poverty by Sex and Age in Kihei
With 9.3% poverty level for males and 8.4% for females among the residents of Kihei, 5 year old males and 15 year old females are the most vulnerable to poverty, with 22 males (68.8%) and 34 females (40.5%) in their respective age groups living below the poverty level.
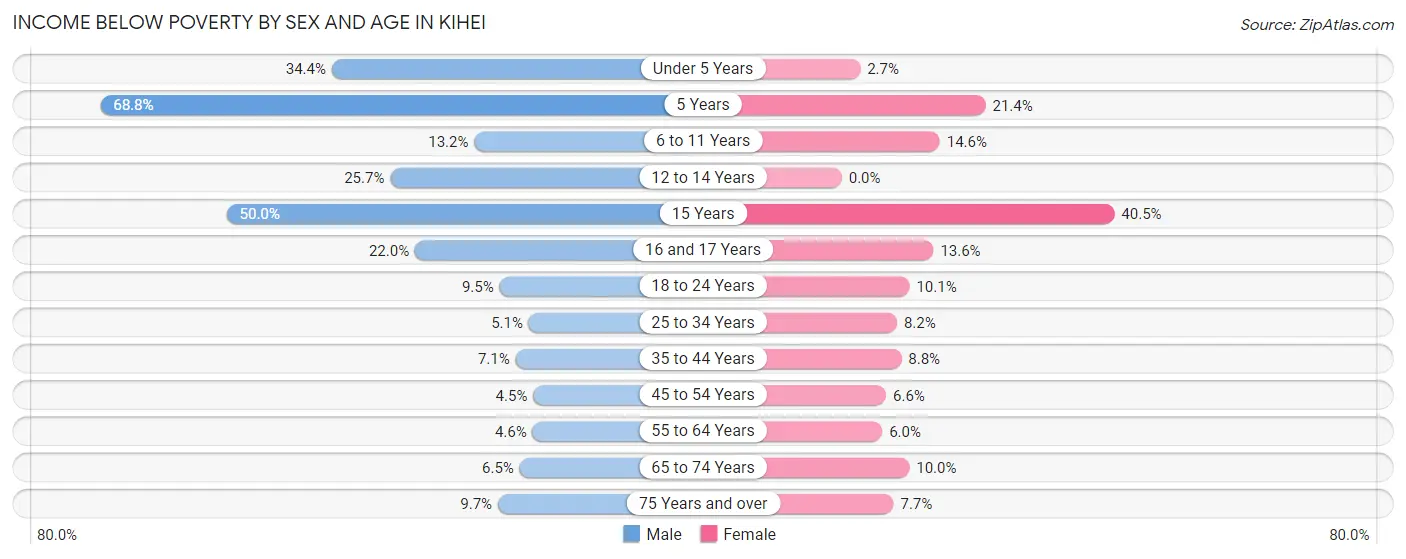
| Age Bracket | Male | Female |
| Under 5 Years | 119 (34.4%) | 20 (2.7%) |
| 5 Years | 22 (68.8%) | 19 (21.3%) |
| 6 to 11 Years | 98 (13.2%) | 102 (14.5%) |
| 12 to 14 Years | 136 (25.7%) | 0 (0.0%) |
| 15 Years | 41 (50.0%) | 34 (40.5%) |
| 16 and 17 Years | 26 (22.0%) | 40 (13.6%) |
| 18 to 24 Years | 89 (9.5%) | 110 (10.1%) |
| 25 to 34 Years | 67 (5.1%) | 132 (8.2%) |
| 35 to 44 Years | 115 (7.1%) | 158 (8.8%) |
| 45 to 54 Years | 69 (4.5%) | 91 (6.6%) |
| 55 to 64 Years | 74 (4.6%) | 93 (6.0%) |
| 65 to 74 Years | 72 (6.5%) | 125 (10.0%) |
| 75 Years and over | 53 (9.7%) | 56 (7.7%) |
| Total | 981 (9.3%) | 980 (8.4%) |
Income Above Poverty by Sex and Age in Kihei
According to the poverty statistics in Kihei, males aged 45 to 54 years and females aged 12 to 14 years are the age groups that are most secure financially, with 95.5% of males and 100.0% of females in these age groups living above the poverty line.
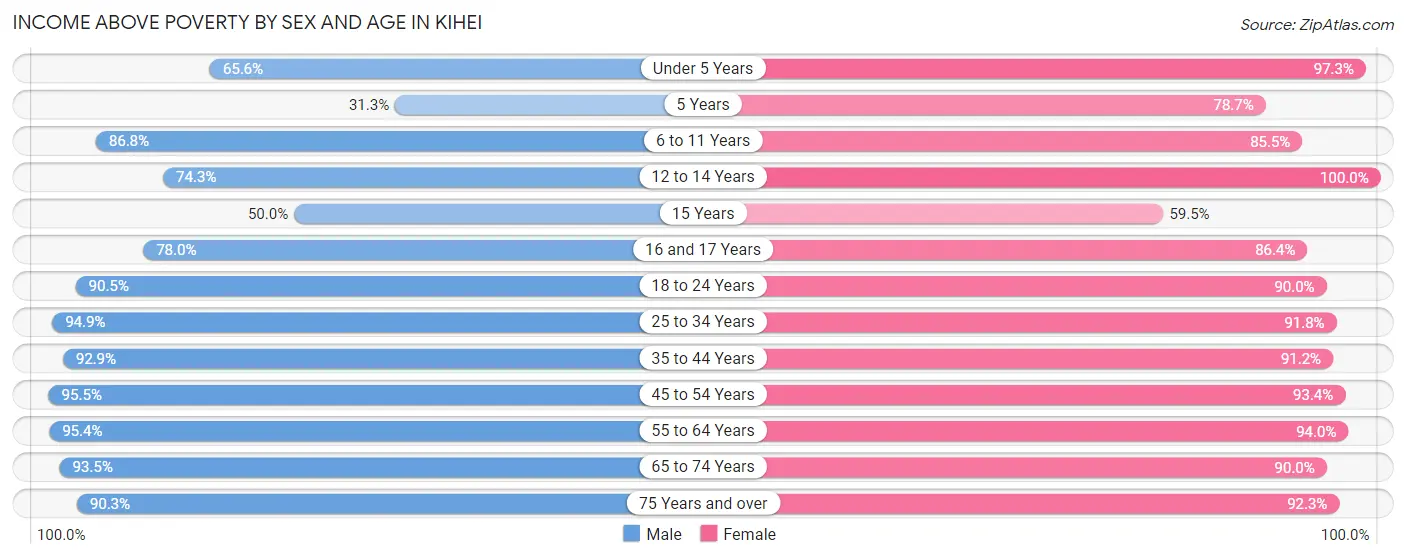
| Age Bracket | Male | Female |
| Under 5 Years | 227 (65.6%) | 709 (97.3%) |
| 5 Years | 10 (31.2%) | 70 (78.6%) |
| 6 to 11 Years | 643 (86.8%) | 599 (85.5%) |
| 12 to 14 Years | 393 (74.3%) | 333 (100.0%) |
| 15 Years | 41 (50.0%) | 50 (59.5%) |
| 16 and 17 Years | 92 (78.0%) | 254 (86.4%) |
| 18 to 24 Years | 851 (90.5%) | 985 (89.9%) |
| 25 to 34 Years | 1,240 (94.9%) | 1,480 (91.8%) |
| 35 to 44 Years | 1,505 (92.9%) | 1,629 (91.2%) |
| 45 to 54 Years | 1,475 (95.5%) | 1,293 (93.4%) |
| 55 to 64 Years | 1,546 (95.4%) | 1,458 (94.0%) |
| 65 to 74 Years | 1,039 (93.5%) | 1,122 (90.0%) |
| 75 Years and over | 493 (90.3%) | 673 (92.3%) |
| Total | 9,555 (90.7%) | 10,655 (91.6%) |
Income Below Poverty Among Married-Couple Families in Kihei
The poverty statistics for married-couple families in Kihei show that 1.5% or 56 of the total 3,632 families live below the poverty line. Families with 5 or more children have the highest poverty rate of 100.0%, comprising of 7 families. On the other hand, families with 1 or 2 children have the lowest poverty rate of 0.0%, which includes 0 families.
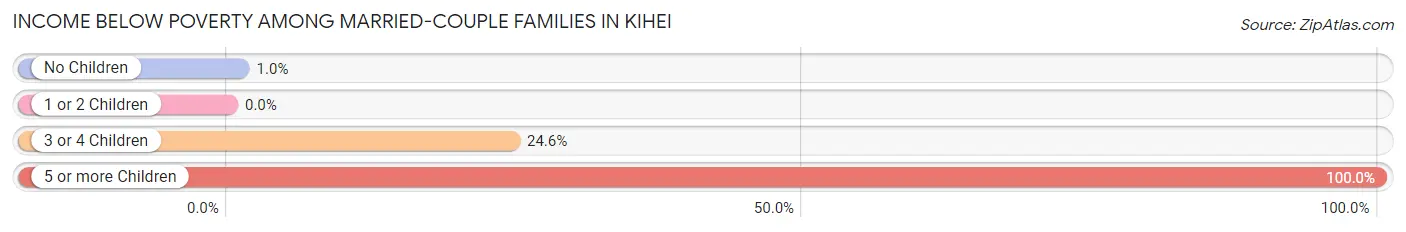
| Children | Above Poverty | Below Poverty |
| No Children | 2,161 (99.0%) | 22 (1.0%) |
| 1 or 2 Children | 1,332 (100.0%) | 0 (0.0%) |
| 3 or 4 Children | 83 (75.4%) | 27 (24.5%) |
| 5 or more Children | 0 (0.0%) | 7 (100.0%) |
| Total | 3,576 (98.5%) | 56 (1.5%) |
Income Below Poverty Among Single-Parent Households in Kihei
According to the poverty data in Kihei, 2.7% or 17 single-father households and 26.5% or 200 single-mother households are living below the poverty line. Among single-father households, those with 1 or 2 children have the highest poverty rate, with 13 households (4.3%) experiencing poverty. Likewise, among single-mother households, those with 5 or more children have the highest poverty rate, with 9 households (100.0%) falling below the poverty line.
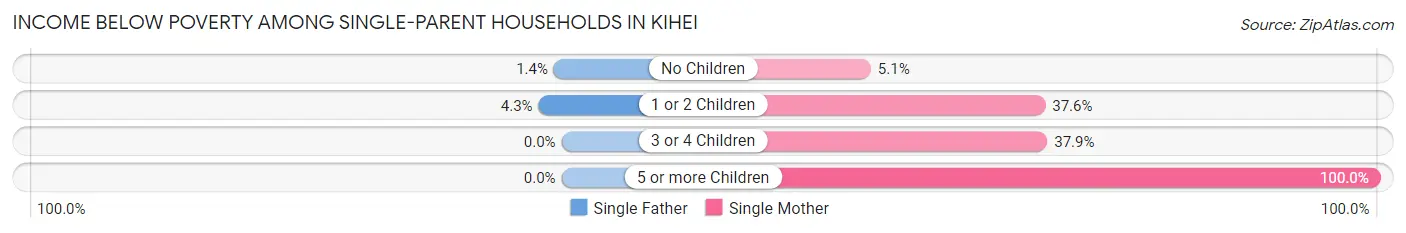
| Children | Single Father | Single Mother |
| No Children | 4 (1.4%) | 14 (5.1%) |
| 1 or 2 Children | 13 (4.3%) | 166 (37.6%) |
| 3 or 4 Children | 0 (0.0%) | 11 (37.9%) |
| 5 or more Children | 0 (0.0%) | 9 (100.0%) |
| Total | 17 (2.7%) | 200 (26.5%) |
Income Below Poverty Among Married-Couple vs Single-Parent Households in Kihei
The poverty data for Kihei shows that 56 of the married-couple family households (1.5%) and 217 of the single-parent households (15.6%) are living below the poverty level. Within the married-couple family households, those with 5 or more children have the highest poverty rate, with 7 households (100.0%) falling below the poverty line. Among the single-parent households, those with 5 or more children have the highest poverty rate, with 9 household (100.0%) living below poverty.
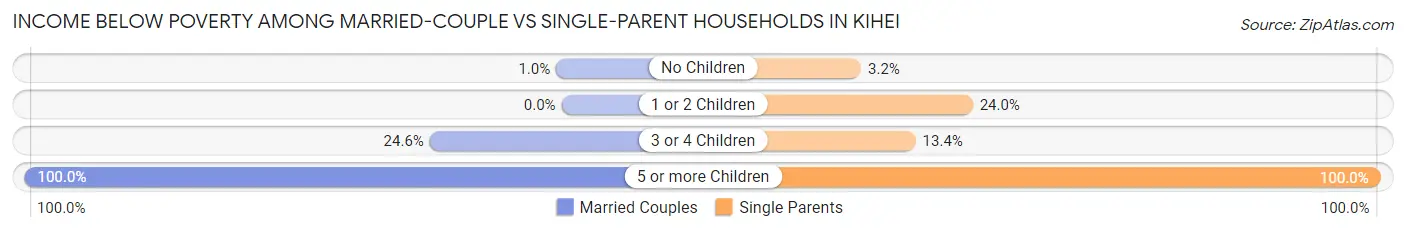
| Children | Married-Couple Families | Single-Parent Households |
| No Children | 22 (1.0%) | 18 (3.2%) |
| 1 or 2 Children | 0 (0.0%) | 179 (24.0%) |
| 3 or 4 Children | 27 (24.5%) | 11 (13.4%) |
| 5 or more Children | 7 (100.0%) | 9 (100.0%) |
| Total | 56 (1.5%) | 217 (15.6%) |
Race in Kihei
The most populous races in Kihei are White / Caucasian (10,014 | 45.0%), Two or more Races (5,767 | 25.9%), and Asian (4,738 | 21.3%).
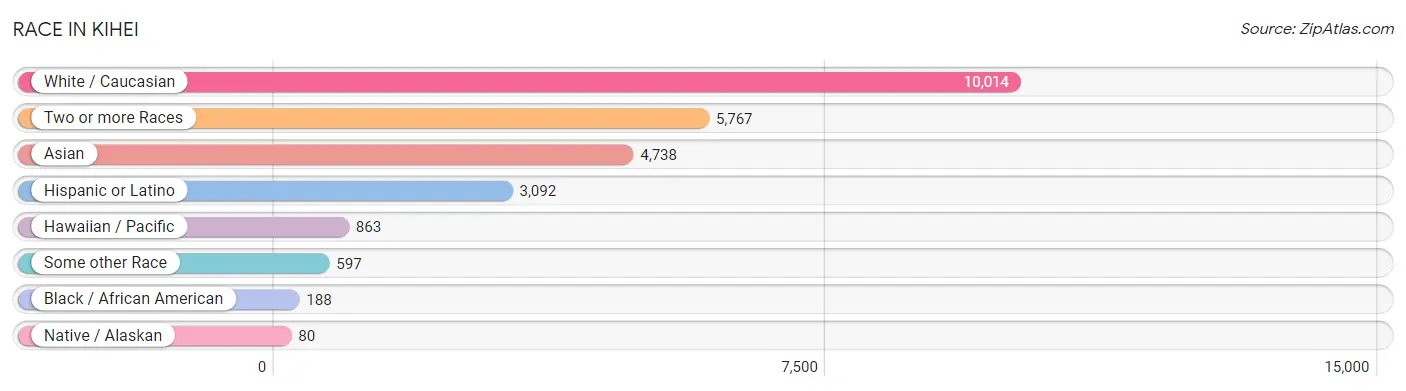
| Race | # Population | % Population |
| Asian | 4,738 | 21.3% |
| Black / African American | 188 | 0.9% |
| Hawaiian / Pacific | 863 | 3.9% |
| Hispanic or Latino | 3,092 | 13.9% |
| Native / Alaskan | 80 | 0.4% |
| White / Caucasian | 10,014 | 45.0% |
| Two or more Races | 5,767 | 25.9% |
| Some other Race | 597 | 2.7% |
| Total | 22,247 | 100.0% |
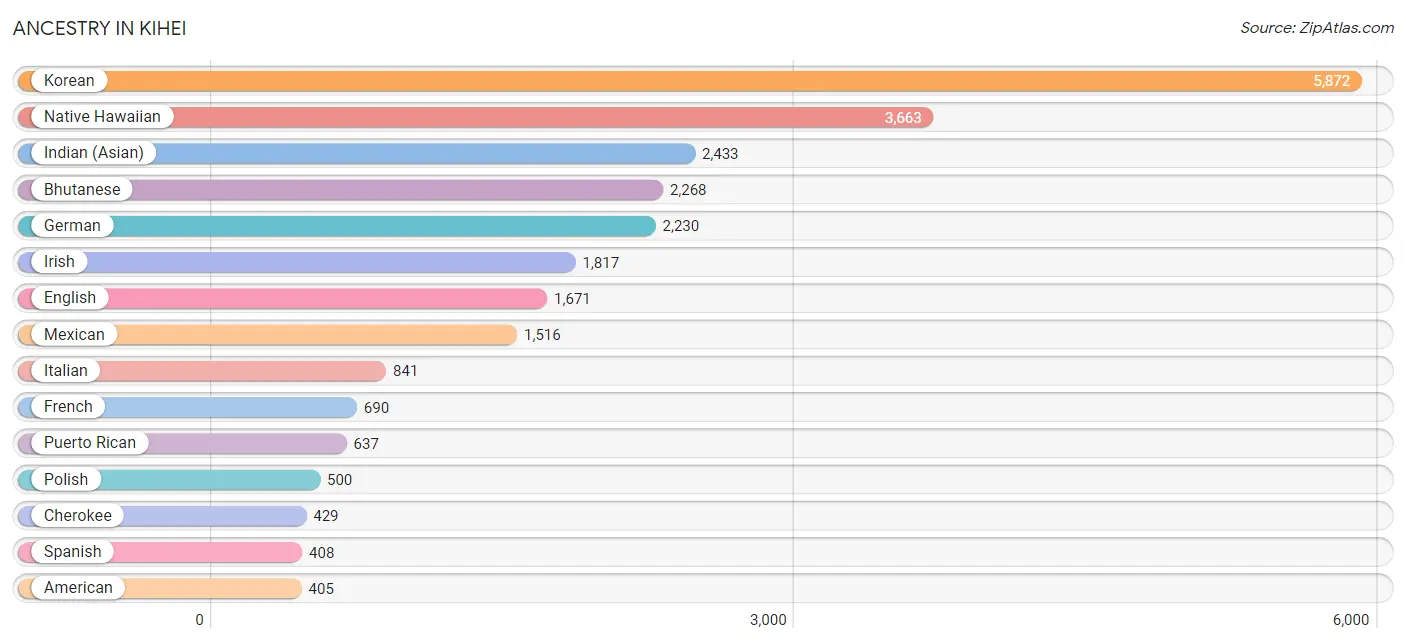
Ancestry in Kihei
The most populous ancestries reported in Kihei are Korean (5,872 | 26.4%), Native Hawaiian (3,663 | 16.5%), Indian (Asian) (2,433 | 10.9%), Bhutanese (2,268 | 10.2%), and German (2,230 | 10.0%), together accounting for 74.0% of all Kihei residents.
| Ancestry | # Population | % Population |
| African | 56 | 0.3% |
| American | 405 | 1.8% |
| Apache | 87 | 0.4% |
| Arab | 64 | 0.3% |
| Argentinean | 7 | 0.0% |
| Australian | 6 | 0.0% |
| Austrian | 58 | 0.3% |
| Basque | 9 | 0.0% |
| Belgian | 24 | 0.1% |
| Bhutanese | 2,268 | 10.2% |
| Blackfeet | 76 | 0.3% |
| Bolivian | 22 | 0.1% |
| Brazilian | 68 | 0.3% |
| British | 80 | 0.4% |
| Burmese | 168 | 0.8% |
| Canadian | 64 | 0.3% |
| Central American | 11 | 0.1% |
| Cherokee | 429 | 1.9% |
| Chickasaw | 15 | 0.1% |
| Chilean | 29 | 0.1% |
| Chinese | 64 | 0.3% |
| Chippewa | 14 | 0.1% |
| Choctaw | 8 | 0.0% |
| Colombian | 78 | 0.4% |
| Cuban | 41 | 0.2% |
| Czech | 24 | 0.1% |
| Czechoslovakian | 5 | 0.0% |
| Danish | 176 | 0.8% |
| Dominican | 28 | 0.1% |
| Dutch | 293 | 1.3% |
| Eastern European | 86 | 0.4% |
| English | 1,671 | 7.5% |
| European | 236 | 1.1% |
| Fijian | 1 | 0.0% |
| Filipino | 6 | 0.0% |
| Finnish | 81 | 0.4% |
| French | 690 | 3.1% |
| French Canadian | 92 | 0.4% |
| German | 2,230 | 10.0% |
| Greek | 300 | 1.3% |
| Guamanian / Chamorro | 210 | 0.9% |
| Guyanese | 17 | 0.1% |
| Haitian | 8 | 0.0% |
| Hungarian | 49 | 0.2% |
| Indian (Asian) | 2,433 | 10.9% |
| Indonesian | 14 | 0.1% |
| Iranian | 48 | 0.2% |
| Irish | 1,817 | 8.2% |
| Israeli | 8 | 0.0% |
| Italian | 841 | 3.8% |
| Jordanian | 5 | 0.0% |
| Korean | 5,872 | 26.4% |
| Laotian | 17 | 0.1% |
| Latvian | 22 | 0.1% |
| Lebanese | 12 | 0.1% |
| Lithuanian | 32 | 0.1% |
| Luxembourger | 12 | 0.1% |
| Malaysian | 17 | 0.1% |
| Maltese | 23 | 0.1% |
| Mexican | 1,516 | 6.8% |
| Mexican American Indian | 38 | 0.2% |
| Moroccan | 14 | 0.1% |
| Native Hawaiian | 3,663 | 16.5% |
| Navajo | 19 | 0.1% |
| Northern European | 31 | 0.1% |
| Norwegian | 344 | 1.5% |
| Okinawan | 39 | 0.2% |
| Pakistani | 118 | 0.5% |
| Peruvian | 22 | 0.1% |
| Polish | 500 | 2.2% |
| Portuguese | 335 | 1.5% |
| Puerto Rican | 637 | 2.9% |
| Romanian | 44 | 0.2% |
| Russian | 211 | 0.9% |
| Salvadoran | 11 | 0.1% |
| Samoan | 291 | 1.3% |
| Scandinavian | 81 | 0.4% |
| Scotch-Irish | 178 | 0.8% |
| Scottish | 381 | 1.7% |
| Serbian | 6 | 0.0% |
| Sioux | 9 | 0.0% |
| South American | 177 | 0.8% |
| South American Indian | 7 | 0.0% |
| Spaniard | 233 | 1.1% |
| Spanish | 408 | 1.8% |
| Sri Lankan | 127 | 0.6% |
| Subsaharan African | 56 | 0.3% |
| Swedish | 234 | 1.1% |
| Swiss | 81 | 0.4% |
| Thai | 15 | 0.1% |
| Tongan | 257 | 1.2% |
| Ukrainian | 37 | 0.2% |
| Venezuelan | 10 | 0.0% |
| Welsh | 379 | 1.7% | View All 94 Rows |
Immigrants in Kihei
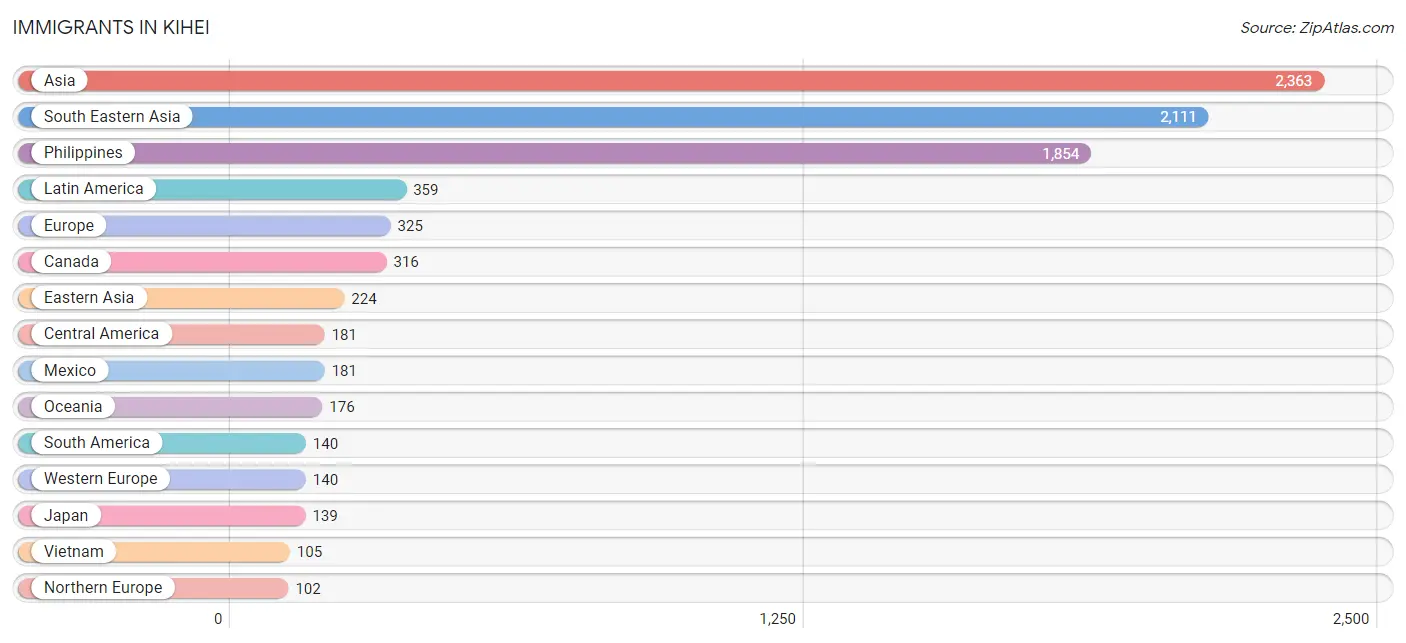
The most numerous immigrant groups reported in Kihei came from Asia (2,363 | 10.6%), South Eastern Asia (2,111 | 9.5%), Philippines (1,854 | 8.3%), Latin America (359 | 1.6%), and Europe (325 | 1.5%), together accounting for 31.5% of all Kihei residents.
| Immigration Origin | # Population | % Population |
| Africa | 41 | 0.2% |
| Argentina | 7 | 0.0% |
| Asia | 2,363 | 10.6% |
| Australia | 6 | 0.0% |
| Austria | 7 | 0.0% |
| Bahamas | 10 | 0.0% |
| Brazil | 41 | 0.2% |
| Canada | 316 | 1.4% |
| Caribbean | 38 | 0.2% |
| Central America | 181 | 0.8% |
| Chile | 12 | 0.1% |
| China | 64 | 0.3% |
| Colombia | 17 | 0.1% |
| Czechoslovakia | 5 | 0.0% |
| Dominican Republic | 28 | 0.1% |
| Eastern Africa | 8 | 0.0% |
| Eastern Asia | 224 | 1.0% |
| Eastern Europe | 66 | 0.3% |
| Ecuador | 20 | 0.1% |
| England | 5 | 0.0% |
| Europe | 325 | 1.5% |
| France | 8 | 0.0% |
| Germany | 39 | 0.2% |
| Guyana | 17 | 0.1% |
| Hong Kong | 30 | 0.1% |
| Indonesia | 16 | 0.1% |
| Iran | 10 | 0.0% |
| Israel | 13 | 0.1% |
| Italy | 5 | 0.0% |
| Japan | 139 | 0.6% |
| Jordan | 5 | 0.0% |
| Korea | 21 | 0.1% |
| Laos | 44 | 0.2% |
| Latin America | 359 | 1.6% |
| Latvia | 22 | 0.1% |
| Mexico | 181 | 0.8% |
| Micronesia | 37 | 0.2% |
| Morocco | 9 | 0.0% |
| Netherlands | 19 | 0.1% |
| Northern Africa | 33 | 0.2% |
| Northern Europe | 102 | 0.5% |
| Oceania | 176 | 0.8% |
| Peru | 7 | 0.0% |
| Philippines | 1,854 | 8.3% |
| Poland | 12 | 0.1% |
| Russia | 27 | 0.1% |
| Singapore | 39 | 0.2% |
| South America | 140 | 0.6% |
| South Central Asia | 10 | 0.0% |
| South Eastern Asia | 2,111 | 9.5% |
| Southern Europe | 17 | 0.1% |
| Sudan | 24 | 0.1% |
| Sweden | 26 | 0.1% |
| Switzerland | 67 | 0.3% |
| Taiwan | 8 | 0.0% |
| Thailand | 53 | 0.2% |
| Venezuela | 19 | 0.1% |
| Vietnam | 105 | 0.5% |
| Western Asia | 18 | 0.1% |
| Western Europe | 140 | 0.6% | View All 60 Rows |
Sex and Age in Kihei
Sex and Age in Kihei
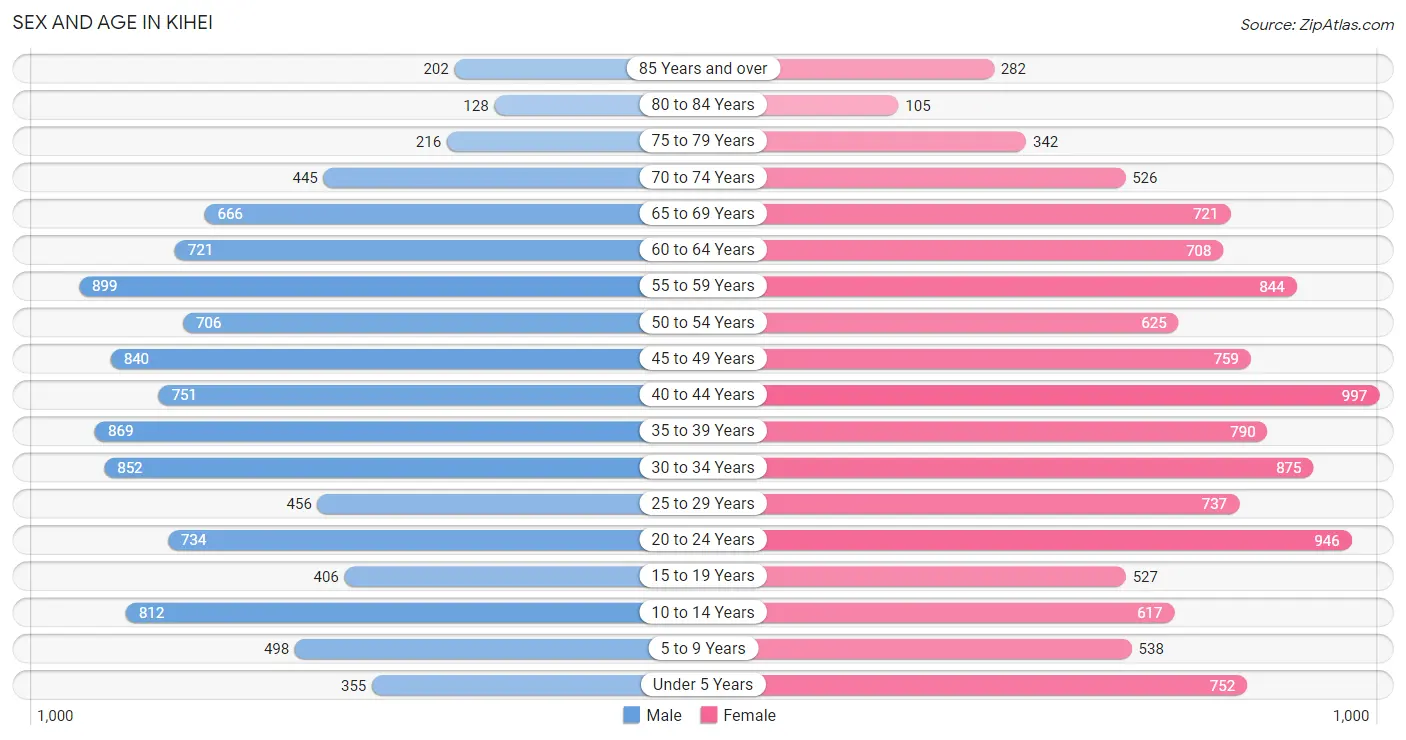
The most populous age groups in Kihei are 55 to 59 Years (899 | 8.5%) for men and 40 to 44 Years (997 | 8.5%) for women.
| Age Bracket | Male | Female |
| Under 5 Years | 355 (3.4%) | 752 (6.4%) |
| 5 to 9 Years | 498 (4.7%) | 538 (4.6%) |
| 10 to 14 Years | 812 (7.7%) | 617 (5.3%) |
| 15 to 19 Years | 406 (3.8%) | 527 (4.5%) |
| 20 to 24 Years | 734 (7.0%) | 946 (8.1%) |
| 25 to 29 Years | 456 (4.3%) | 737 (6.3%) |
| 30 to 34 Years | 852 (8.1%) | 875 (7.5%) |
| 35 to 39 Years | 869 (8.2%) | 790 (6.8%) |
| 40 to 44 Years | 751 (7.1%) | 997 (8.5%) |
| 45 to 49 Years | 840 (8.0%) | 759 (6.5%) |
| 50 to 54 Years | 706 (6.7%) | 625 (5.3%) |
| 55 to 59 Years | 899 (8.5%) | 844 (7.2%) |
| 60 to 64 Years | 721 (6.8%) | 708 (6.1%) |
| 65 to 69 Years | 666 (6.3%) | 721 (6.2%) |
| 70 to 74 Years | 445 (4.2%) | 526 (4.5%) |
| 75 to 79 Years | 216 (2.1%) | 342 (2.9%) |
| 80 to 84 Years | 128 (1.2%) | 105 (0.9%) |
| 85 Years and over | 202 (1.9%) | 282 (2.4%) |
| Total | 10,556 (100.0%) | 11,691 (100.0%) |
Families and Households in Kihei
Median Family Size in Kihei
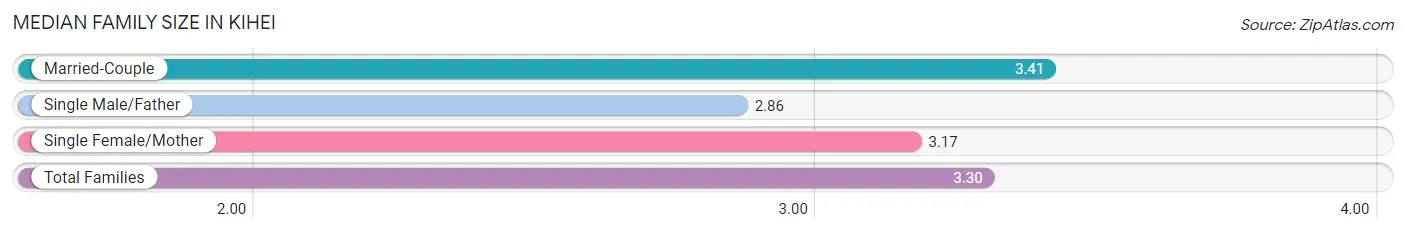
The median family size in Kihei is 3.30 persons per family, with married-couple families (3,632 | 72.3%) accounting for the largest median family size of 3.41 persons per family. On the other hand, single male/father families (636 | 12.7%) represent the smallest median family size with 2.86 persons per family.
| Family Type | # Families | Family Size |
| Married-Couple | 3,632 (72.3%) | 3.41 |
| Single Male/Father | 636 (12.7%) | 2.86 |
| Single Female/Mother | 756 (15.0%) | 3.17 |
| Total Families | 5,024 (100.0%) | 3.30 |
Median Household Size in Kihei
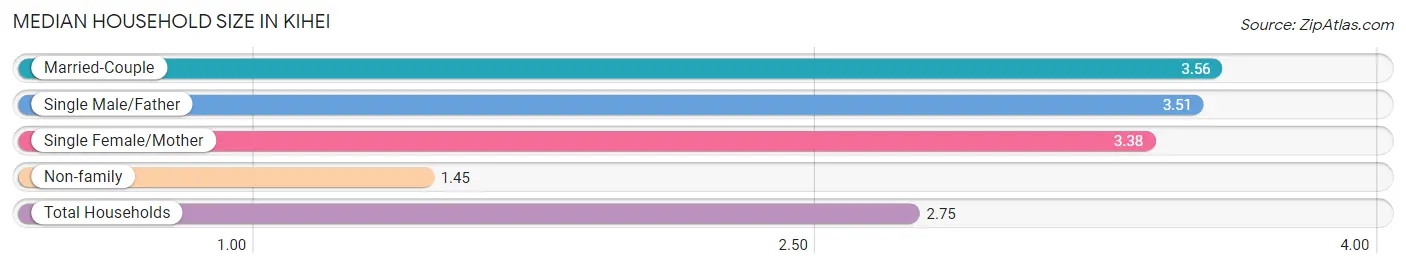
The median household size in Kihei is 2.75 persons per household, with married-couple households (3,632 | 45.4%) accounting for the largest median household size of 3.56 persons per household. non-family households (2,977 | 37.2%) represent the smallest median household size with 1.45 persons per household.
| Household Type | # Households | Household Size |
| Married-Couple | 3,632 (45.4%) | 3.56 |
| Single Male/Father | 636 (8.0%) | 3.51 |
| Single Female/Mother | 756 (9.5%) | 3.38 |
| Non-family | 2,977 (37.2%) | 1.45 |
| Total Households | 8,001 (100.0%) | 2.75 |
Household Size by Marriage Status in Kihei
Out of a total of 8,001 households in Kihei, 5,024 (62.8%) are family households, while 2,977 (37.2%) are nonfamily households. The most numerous type of family households are 2-person households, comprising 2,294, and the most common type of nonfamily households are 1-person households, comprising 2,175.
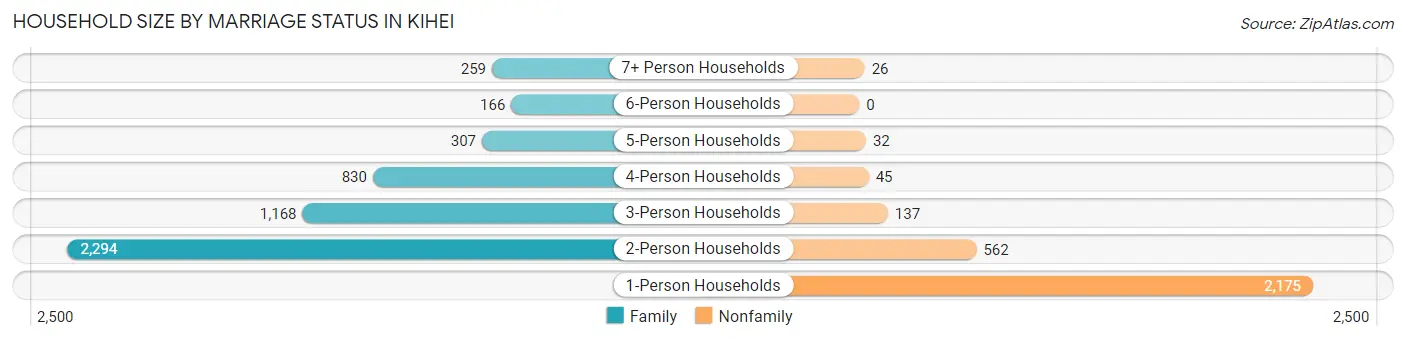
| Household Size | Family Households | Nonfamily Households |
| 1-Person Households | - | 2,175 (27.2%) |
| 2-Person Households | 2,294 (28.7%) | 562 (7.0%) |
| 3-Person Households | 1,168 (14.6%) | 137 (1.7%) |
| 4-Person Households | 830 (10.4%) | 45 (0.6%) |
| 5-Person Households | 307 (3.8%) | 32 (0.4%) |
| 6-Person Households | 166 (2.1%) | 0 (0.0%) |
| 7+ Person Households | 259 (3.2%) | 26 (0.3%) |
| Total | 5,024 (62.8%) | 2,977 (37.2%) |
Female Fertility in Kihei
Fertility by Age in Kihei
Average fertility rate in Kihei is 51.0 births per 1,000 women. Women in the age bracket of 20 to 34 years have the highest fertility rate with 105.0 births per 1,000 women. Women in the age bracket of 20 to 34 years acount for 91.2% of all women with births.
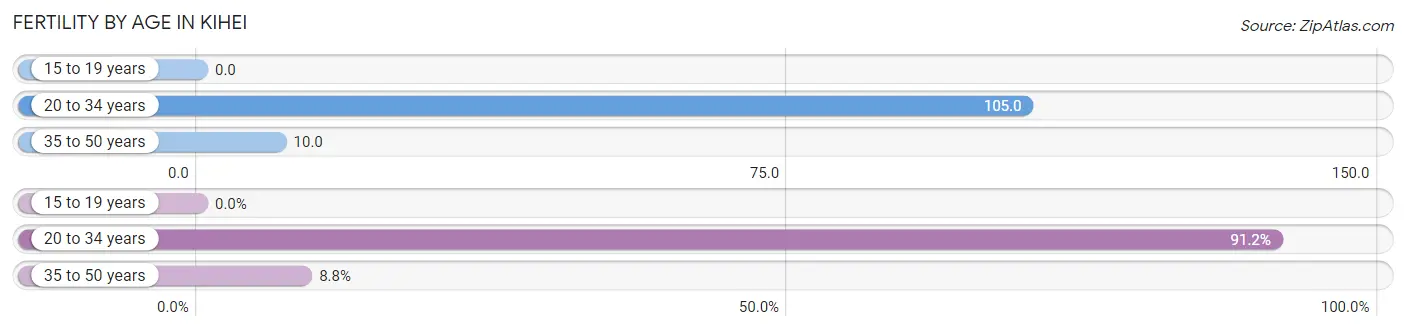
| Age Bracket | Women with Births | Births / 1,000 Women |
| 15 to 19 years | 0 (0.0%) | 0.0 |
| 20 to 34 years | 268 (91.2%) | 105.0 |
| 35 to 50 years | 26 (8.8%) | 10.0 |
| Total | 294 (100.0%) | 51.0 |
Fertility by Age by Marriage Status in Kihei
61.9% of women with births (294) in Kihei are married. The highest percentage of unmarried women with births falls into 20 to 34 years age bracket with 38.4% of them unmarried at the time of birth, while the lowest percentage of unmarried women with births belong to 35 to 50 years age bracket with 34.6% of them unmarried.
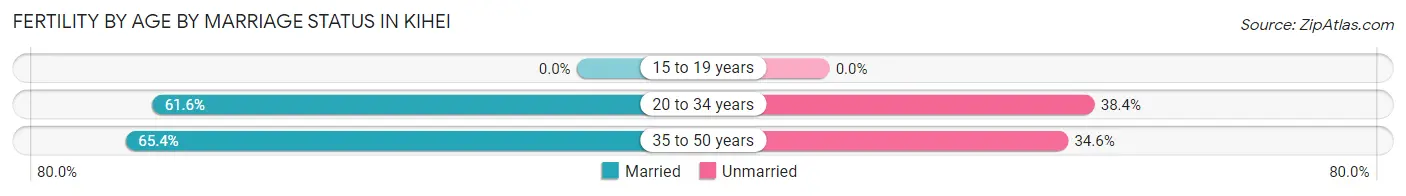
| Age Bracket | Married | Unmarried |
| 15 to 19 years | 0 (0.0%) | 0 (0.0%) |
| 20 to 34 years | 165 (61.6%) | 103 (38.4%) |
| 35 to 50 years | 17 (65.4%) | 9 (34.6%) |
| Total | 182 (61.9%) | 112 (38.1%) |
Fertility by Education in Kihei
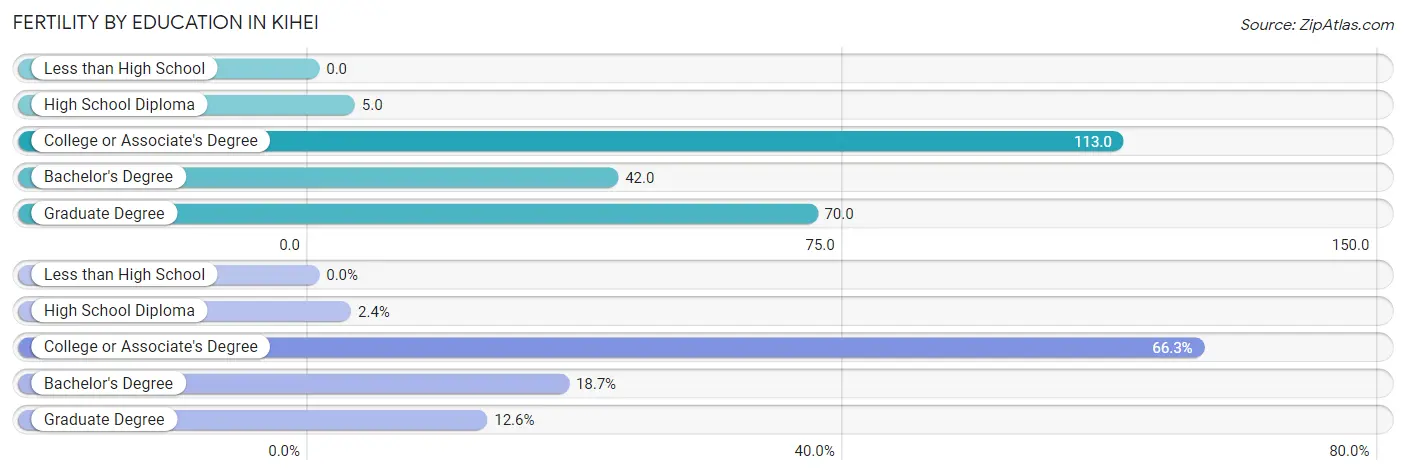
| Educational Attainment | Women with Births | Births / 1,000 Women |
| Less than High School | 0 (0.0%) | 0.0 |
| High School Diploma | 7 (2.4%) | 5.0 |
| College or Associate's Degree | 195 (66.3%) | 113.0 |
| Bachelor's Degree | 55 (18.7%) | 42.0 |
| Graduate Degree | 37 (12.6%) | 70.0 |
| Total | 294 (100.0%) | 51.0 |
Fertility by Education by Marriage Status in Kihei
38.1% of women with births in Kihei are unmarried. Women with the educational attainment of high school diploma are most likely to be married with 100.0% of them married at childbirth, while women with the educational attainment of college or associate's degree are least likely to be married with 57.4% of them unmarried at childbirth.
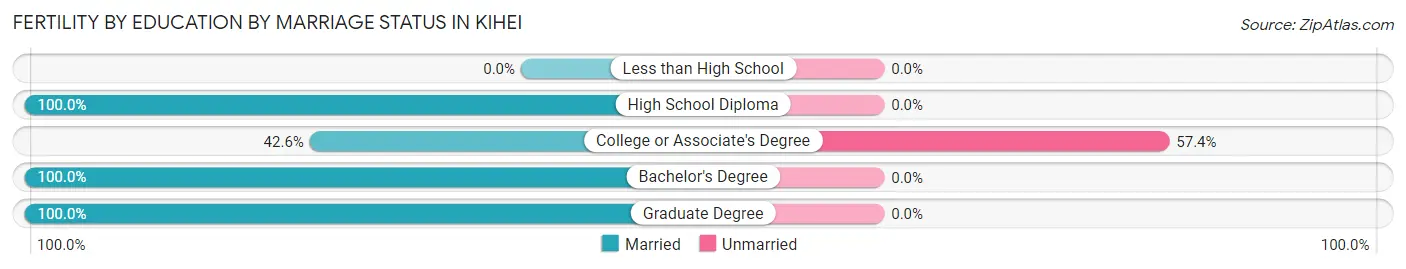
| Educational Attainment | Married | Unmarried |
| Less than High School | 0 (0.0%) | 0 (0.0%) |
| High School Diploma | 7 (100.0%) | 0 (0.0%) |
| College or Associate's Degree | 83 (42.6%) | 112 (57.4%) |
| Bachelor's Degree | 55 (100.0%) | 0 (0.0%) |
| Graduate Degree | 37 (100.0%) | 0 (0.0%) |
| Total | 182 (61.9%) | 112 (38.1%) |
Employment Characteristics in Kihei
Employment by Class of Employer in Kihei
Among the 12,108 employed individuals in Kihei, private company employees (7,899 | 65.2%), self-employed (not incorporated) (1,206 | 10.0%), and self-employed (incorporated) (823 | 6.8%) make up the most common classes of employment.
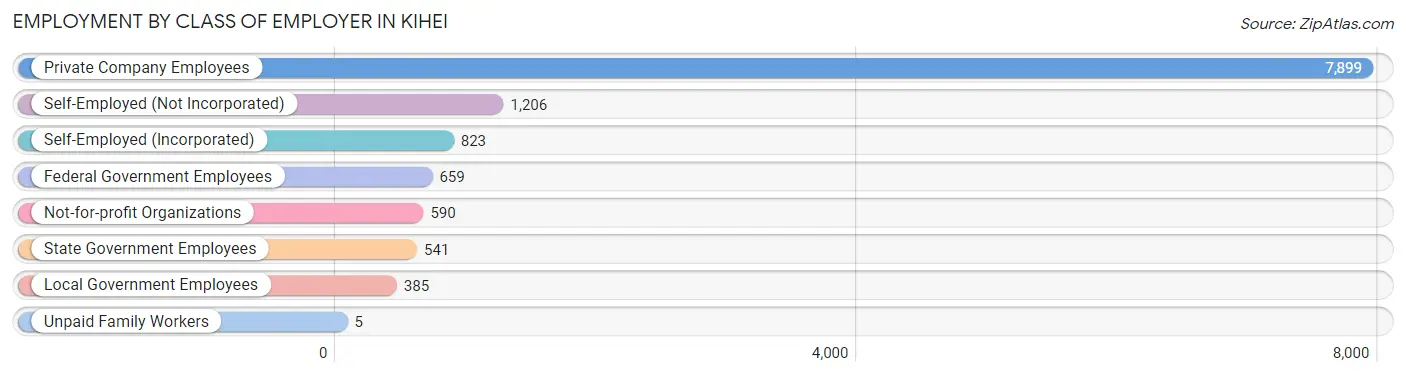
| Employer Class | # Employees | % Employees |
| Private Company Employees | 7,899 | 65.2% |
| Self-Employed (Incorporated) | 823 | 6.8% |
| Self-Employed (Not Incorporated) | 1,206 | 10.0% |
| Not-for-profit Organizations | 590 | 4.9% |
| Local Government Employees | 385 | 3.2% |
| State Government Employees | 541 | 4.5% |
| Federal Government Employees | 659 | 5.4% |
| Unpaid Family Workers | 5 | 0.0% |
| Total | 12,108 | 100.0% |
Employment Status by Age in Kihei
According to the labor force statistics for Kihei, out of the total population over 16 years of age (18,509), 71.8% or 13,289 individuals are in the labor force, with 6.5% or 864 of them unemployed. The age group with the highest labor force participation rate is 25 to 29 years, with 92.7% or 1,106 individuals in the labor force. Within the labor force, the 60 to 64 years age range has the highest percentage of unemployed individuals, with 17.5% or 179 of them being unemployed.
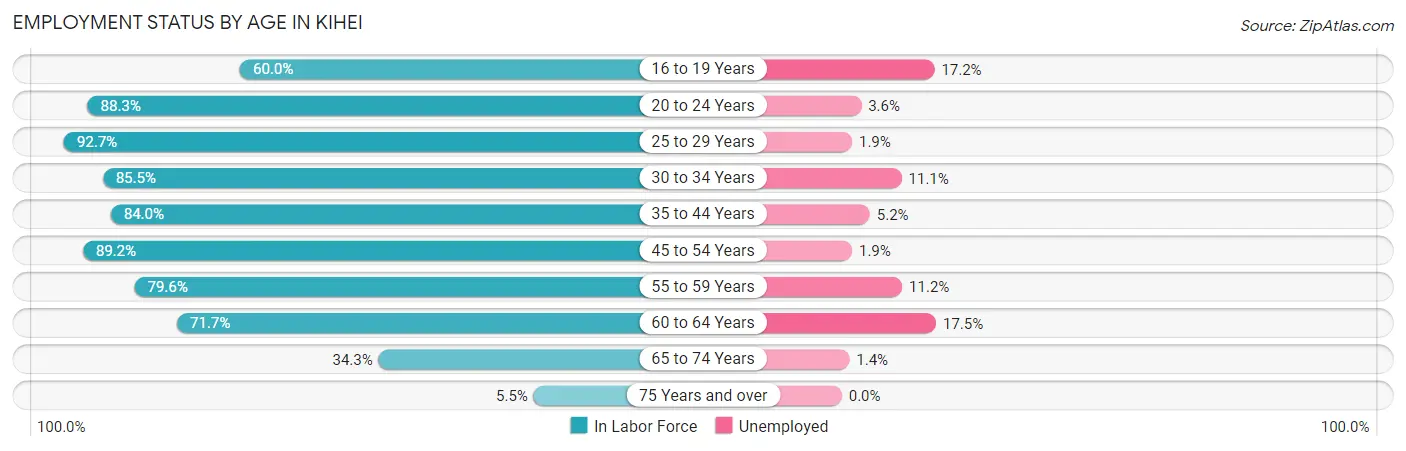
| Age Bracket | In Labor Force | Unemployed |
| 16 to 19 Years | 460 (60.0%) | 79 (17.2%) |
| 20 to 24 Years | 1,483 (88.3%) | 53 (3.6%) |
| 25 to 29 Years | 1,106 (92.7%) | 21 (1.9%) |
| 30 to 34 Years | 1,477 (85.5%) | 164 (11.1%) |
| 35 to 44 Years | 2,862 (84.0%) | 149 (5.2%) |
| 45 to 54 Years | 2,614 (89.2%) | 50 (1.9%) |
| 55 to 59 Years | 1,387 (79.6%) | 155 (11.2%) |
| 60 to 64 Years | 1,025 (71.7%) | 179 (17.5%) |
| 65 to 74 Years | 809 (34.3%) | 11 (1.4%) |
| 75 Years and over | 70 (5.5%) | 0 (0.0%) |
| Total | 13,289 (71.8%) | 864 (6.5%) |
Employment Status by Educational Attainment in Kihei
According to labor force statistics for Kihei, 84.2% of individuals (10,465) out of the total population between 25 and 64 years of age (12,429) are in the labor force, with 6.9% or 722 of them being unemployed. The group with the highest labor force participation rate are those with the educational attainment of high school diploma, with 85.4% or 3,133 individuals in the labor force. Within the labor force, individuals with high school diploma education have the highest percentage of unemployment, with 8.1% or 254 of them being unemployed.
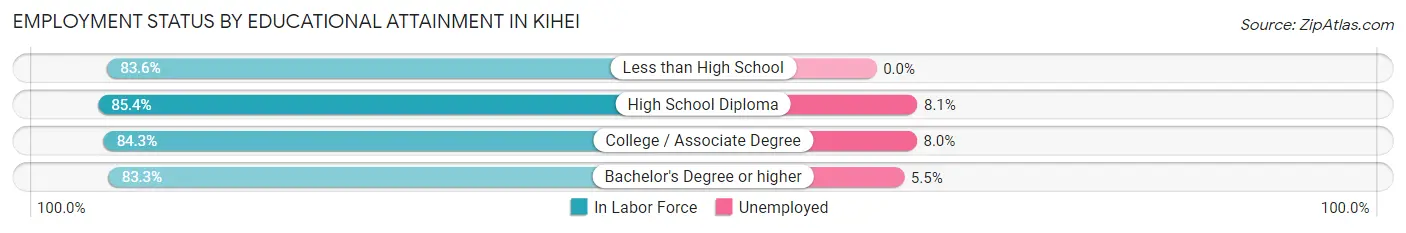
| Educational Attainment | In Labor Force | Unemployed |
| Less than High School | 453 (83.6%) | 0 (0.0%) |
| High School Diploma | 3,133 (85.4%) | 297 (8.1%) |
| College / Associate Degree | 3,533 (84.3%) | 335 (8.0%) |
| Bachelor's Degree or higher | 3,354 (83.3%) | 221 (5.5%) |
| Total | 10,465 (84.2%) | 858 (6.9%) |
Employment Occupations by Sex in Kihei
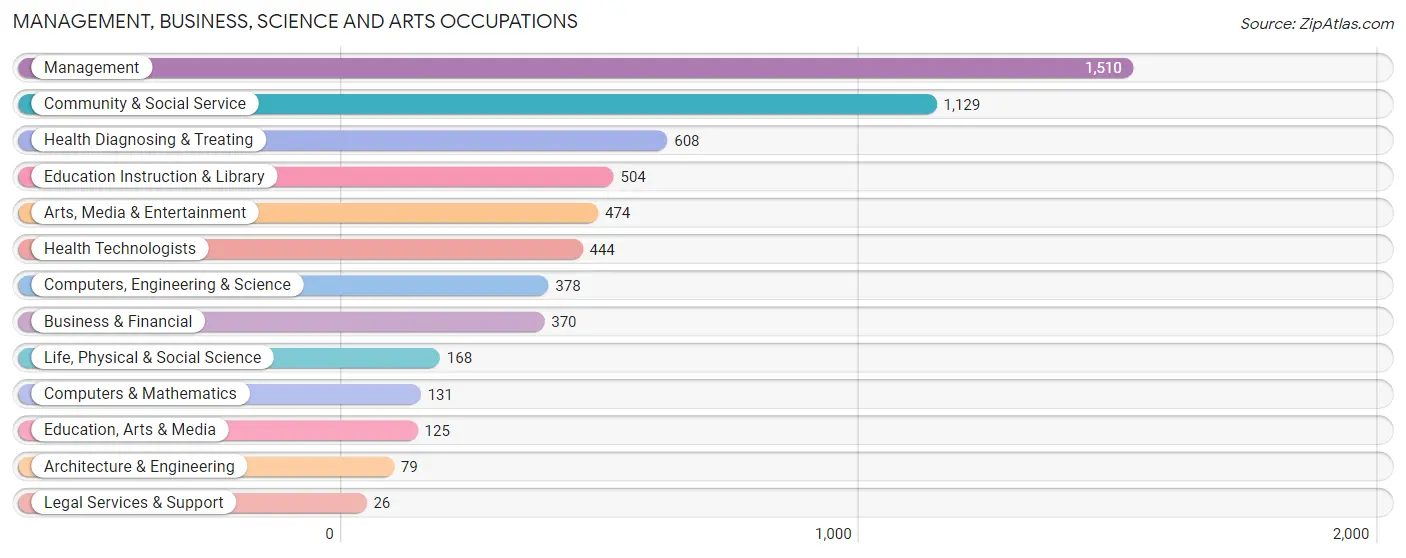
Management, Business, Science and Arts Occupations
The most common Management, Business, Science and Arts occupations in Kihei are Management (1,510 | 12.4%), Community & Social Service (1,129 | 9.3%), Health Diagnosing & Treating (608 | 5.0%), Education Instruction & Library (504 | 4.1%), and Arts, Media & Entertainment (474 | 3.9%).
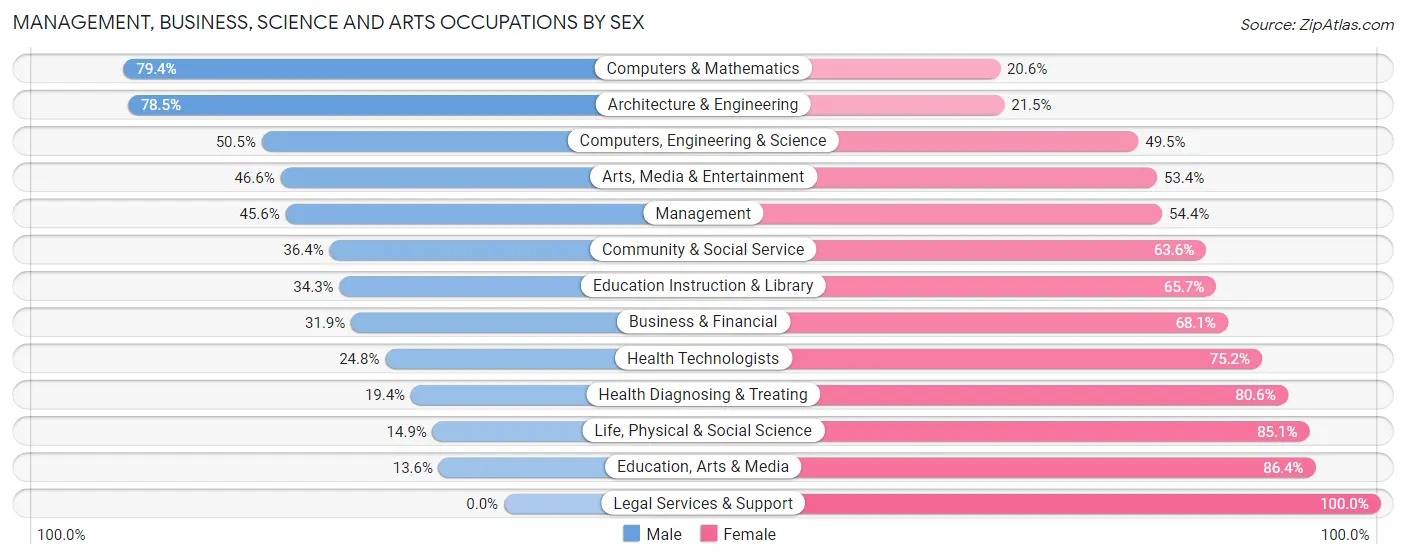
Management, Business, Science and Arts Occupations by Sex
Within the Management, Business, Science and Arts occupations in Kihei, the most male-oriented occupations are Computers & Mathematics (79.4%), Architecture & Engineering (78.5%), and Computers, Engineering & Science (50.5%), while the most female-oriented occupations are Legal Services & Support (100.0%), Education, Arts & Media (86.4%), and Life, Physical & Social Science (85.1%).
| Occupation | Male | Female |
| Management | 688 (45.6%) | 822 (54.4%) |
| Business & Financial | 118 (31.9%) | 252 (68.1%) |
| Computers, Engineering & Science | 191 (50.5%) | 187 (49.5%) |
| Computers & Mathematics | 104 (79.4%) | 27 (20.6%) |
| Architecture & Engineering | 62 (78.5%) | 17 (21.5%) |
| Life, Physical & Social Science | 25 (14.9%) | 143 (85.1%) |
| Community & Social Service | 411 (36.4%) | 718 (63.6%) |
| Education, Arts & Media | 17 (13.6%) | 108 (86.4%) |
| Legal Services & Support | 0 (0.0%) | 26 (100.0%) |
| Education Instruction & Library | 173 (34.3%) | 331 (65.7%) |
| Arts, Media & Entertainment | 221 (46.6%) | 253 (53.4%) |
| Health Diagnosing & Treating | 118 (19.4%) | 490 (80.6%) |
| Health Technologists | 110 (24.8%) | 334 (75.2%) |
| Total (Category) | 1,526 (38.2%) | 2,469 (61.8%) |
| Total (Overall) | 5,922 (48.7%) | 6,242 (51.3%) |
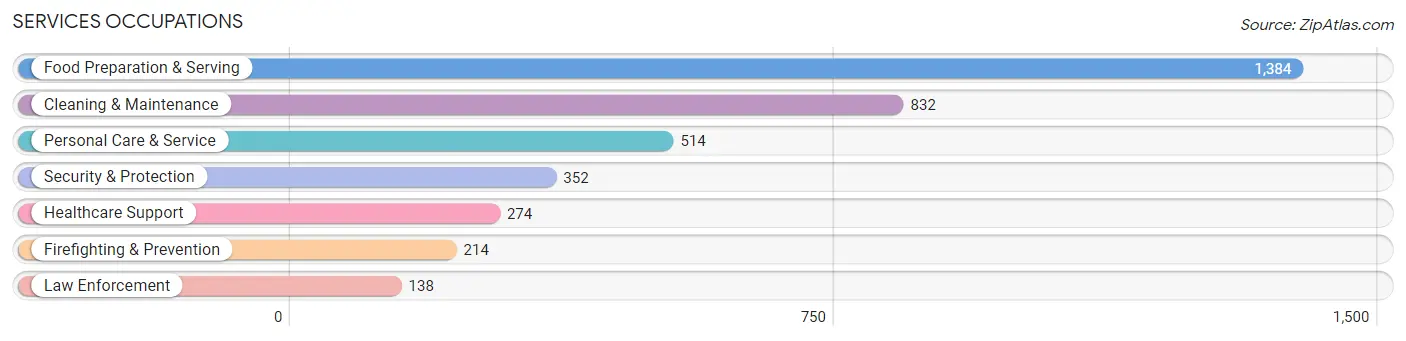
Services Occupations
The most common Services occupations in Kihei are Food Preparation & Serving (1,384 | 11.4%), Cleaning & Maintenance (832 | 6.8%), Personal Care & Service (514 | 4.2%), Security & Protection (352 | 2.9%), and Healthcare Support (274 | 2.2%).
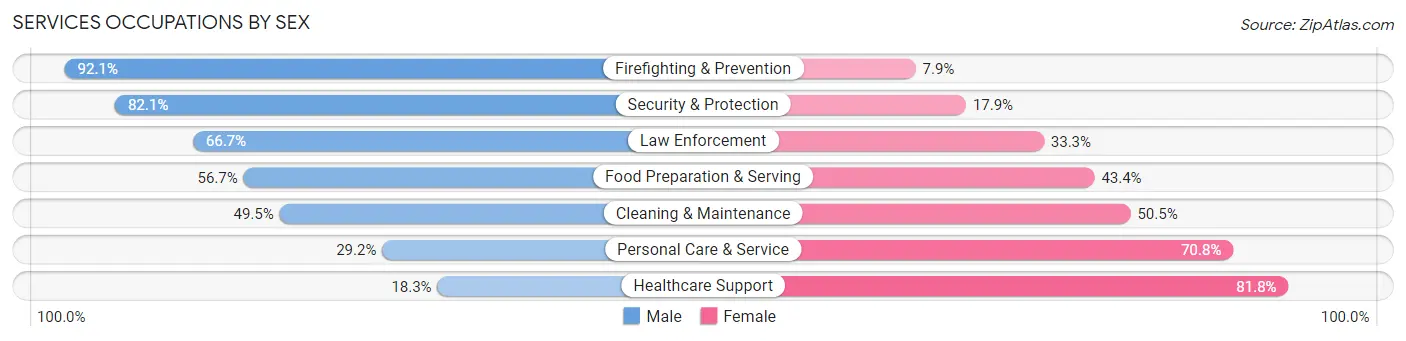
Services Occupations by Sex
Within the Services occupations in Kihei, the most male-oriented occupations are Firefighting & Prevention (92.1%), Security & Protection (82.1%), and Law Enforcement (66.7%), while the most female-oriented occupations are Healthcare Support (81.8%), Personal Care & Service (70.8%), and Cleaning & Maintenance (50.5%).
| Occupation | Male | Female |
| Healthcare Support | 50 (18.2%) | 224 (81.8%) |
| Security & Protection | 289 (82.1%) | 63 (17.9%) |
| Firefighting & Prevention | 197 (92.1%) | 17 (7.9%) |
| Law Enforcement | 92 (66.7%) | 46 (33.3%) |
| Food Preparation & Serving | 784 (56.7%) | 600 (43.3%) |
| Cleaning & Maintenance | 412 (49.5%) | 420 (50.5%) |
| Personal Care & Service | 150 (29.2%) | 364 (70.8%) |
| Total (Category) | 1,685 (50.2%) | 1,671 (49.8%) |
| Total (Overall) | 5,922 (48.7%) | 6,242 (51.3%) |
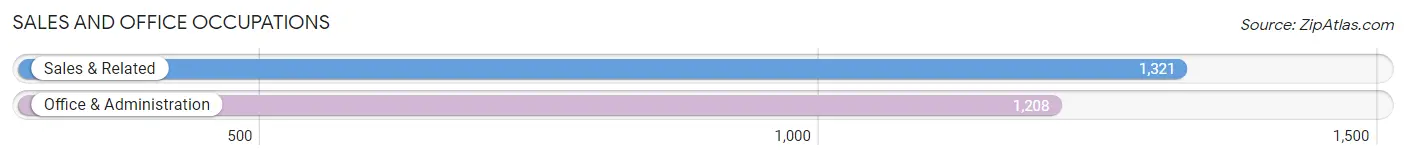
Sales and Office Occupations
The most common Sales and Office occupations in Kihei are Sales & Related (1,321 | 10.9%), and Office & Administration (1,208 | 9.9%).
Sales and Office Occupations by Sex
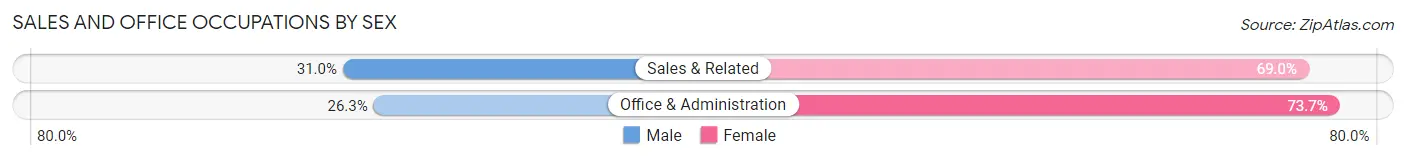
| Occupation | Male | Female |
| Sales & Related | 410 (31.0%) | 911 (69.0%) |
| Office & Administration | 318 (26.3%) | 890 (73.7%) |
| Total (Category) | 728 (28.8%) | 1,801 (71.2%) |
| Total (Overall) | 5,922 (48.7%) | 6,242 (51.3%) |
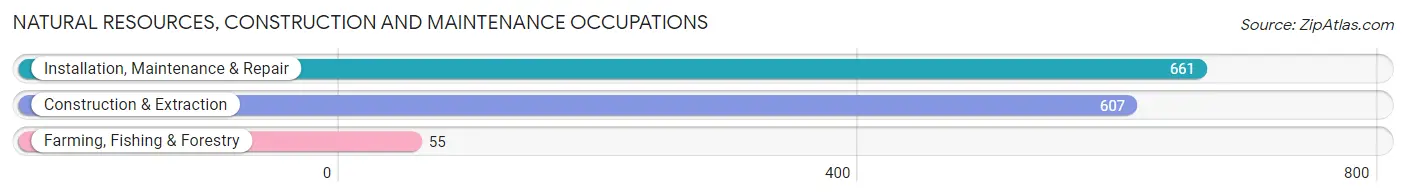
Natural Resources, Construction and Maintenance Occupations
The most common Natural Resources, Construction and Maintenance occupations in Kihei are Installation, Maintenance & Repair (661 | 5.4%), Construction & Extraction (607 | 5.0%), and Farming, Fishing & Forestry (55 | 0.4%).
Natural Resources, Construction and Maintenance Occupations by Sex
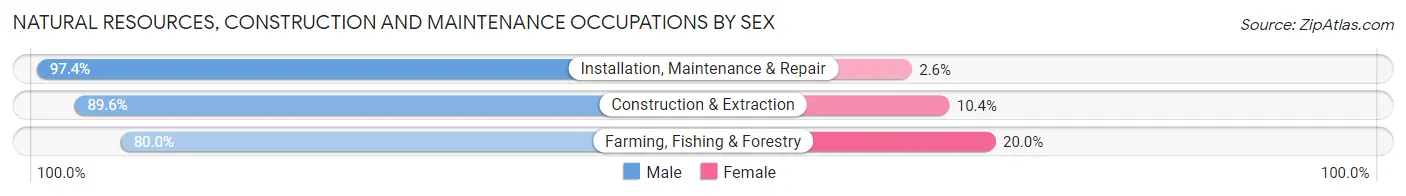
| Occupation | Male | Female |
| Farming, Fishing & Forestry | 44 (80.0%) | 11 (20.0%) |
| Construction & Extraction | 544 (89.6%) | 63 (10.4%) |
| Installation, Maintenance & Repair | 644 (97.4%) | 17 (2.6%) |
| Total (Category) | 1,232 (93.1%) | 91 (6.9%) |
| Total (Overall) | 5,922 (48.7%) | 6,242 (51.3%) |
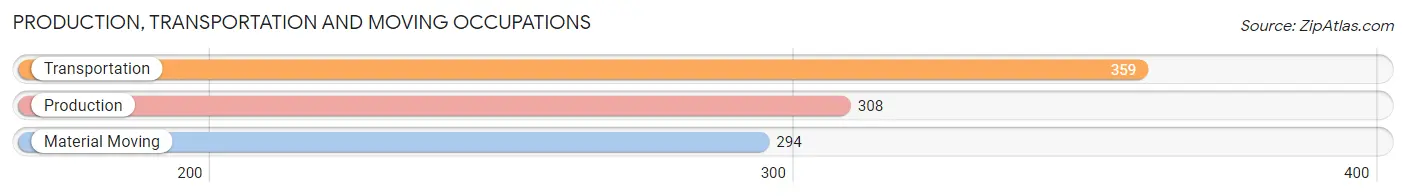
Production, Transportation and Moving Occupations
The most common Production, Transportation and Moving occupations in Kihei are Transportation (359 | 2.9%), Production (308 | 2.5%), and Material Moving (294 | 2.4%).
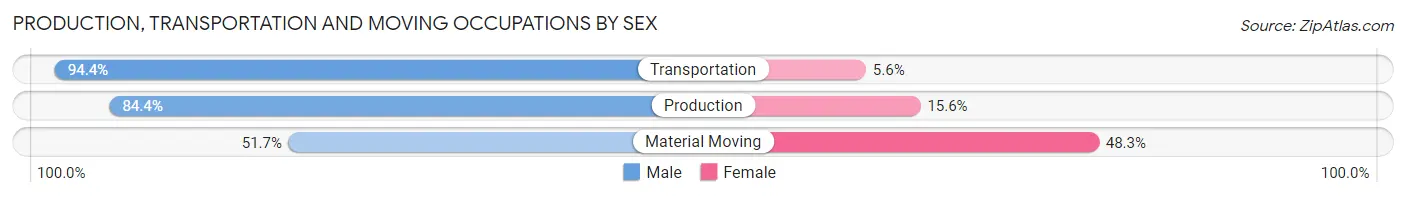
Production, Transportation and Moving Occupations by Sex
| Occupation | Male | Female |
| Production | 260 (84.4%) | 48 (15.6%) |
| Transportation | 339 (94.4%) | 20 (5.6%) |
| Material Moving | 152 (51.7%) | 142 (48.3%) |
| Total (Category) | 751 (78.1%) | 210 (21.8%) |
| Total (Overall) | 5,922 (48.7%) | 6,242 (51.3%) |
Employment Industries by Sex in Kihei
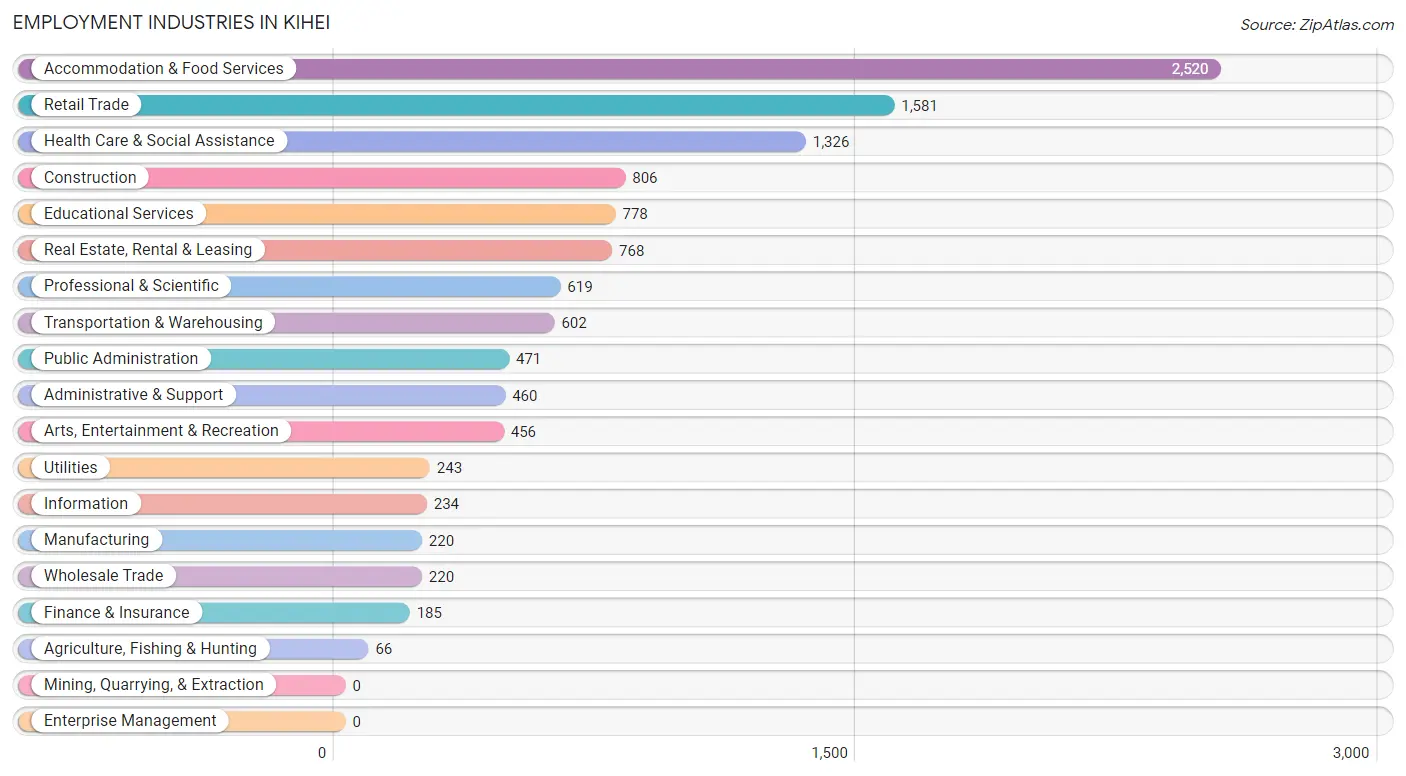
Employment Industries in Kihei
The major employment industries in Kihei include Accommodation & Food Services (2,520 | 20.7%), Retail Trade (1,581 | 13.0%), Health Care & Social Assistance (1,326 | 10.9%), Construction (806 | 6.6%), and Educational Services (778 | 6.4%).
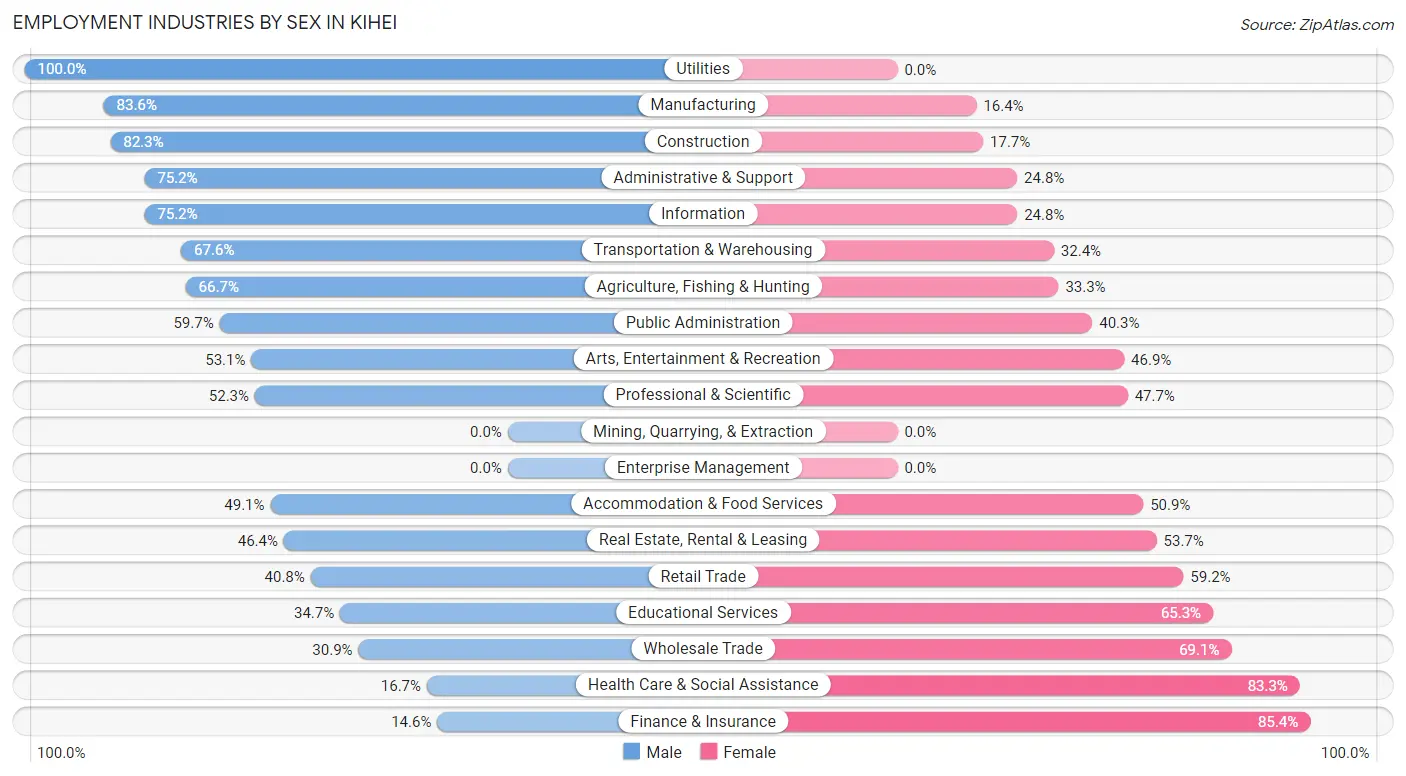
Employment Industries by Sex in Kihei
The Kihei industries that see more men than women are Utilities (100.0%), Manufacturing (83.6%), and Construction (82.3%), whereas the industries that tend to have a higher number of women are Finance & Insurance (85.4%), Health Care & Social Assistance (83.3%), and Wholesale Trade (69.1%).
| Industry | Male | Female |
| Agriculture, Fishing & Hunting | 44 (66.7%) | 22 (33.3%) |
| Mining, Quarrying, & Extraction | 0 (0.0%) | 0 (0.0%) |
| Construction | 663 (82.3%) | 143 (17.7%) |
| Manufacturing | 184 (83.6%) | 36 (16.4%) |
| Wholesale Trade | 68 (30.9%) | 152 (69.1%) |
| Retail Trade | 645 (40.8%) | 936 (59.2%) |
| Transportation & Warehousing | 407 (67.6%) | 195 (32.4%) |
| Utilities | 243 (100.0%) | 0 (0.0%) |
| Information | 176 (75.2%) | 58 (24.8%) |
| Finance & Insurance | 27 (14.6%) | 158 (85.4%) |
| Real Estate, Rental & Leasing | 356 (46.4%) | 412 (53.6%) |
| Professional & Scientific | 324 (52.3%) | 295 (47.7%) |
| Enterprise Management | 0 (0.0%) | 0 (0.0%) |
| Administrative & Support | 346 (75.2%) | 114 (24.8%) |
| Educational Services | 270 (34.7%) | 508 (65.3%) |
| Health Care & Social Assistance | 222 (16.7%) | 1,104 (83.3%) |
| Arts, Entertainment & Recreation | 242 (53.1%) | 214 (46.9%) |
| Accommodation & Food Services | 1,238 (49.1%) | 1,282 (50.9%) |
| Public Administration | 281 (59.7%) | 190 (40.3%) |
| Total | 5,922 (48.7%) | 6,242 (51.3%) |
Education in Kihei
School Enrollment in Kihei
The most common levels of schooling among the 3,698 students in Kihei are high school (963 | 26.0%), middle school (901 | 24.4%), and elementary school (841 | 22.7%).
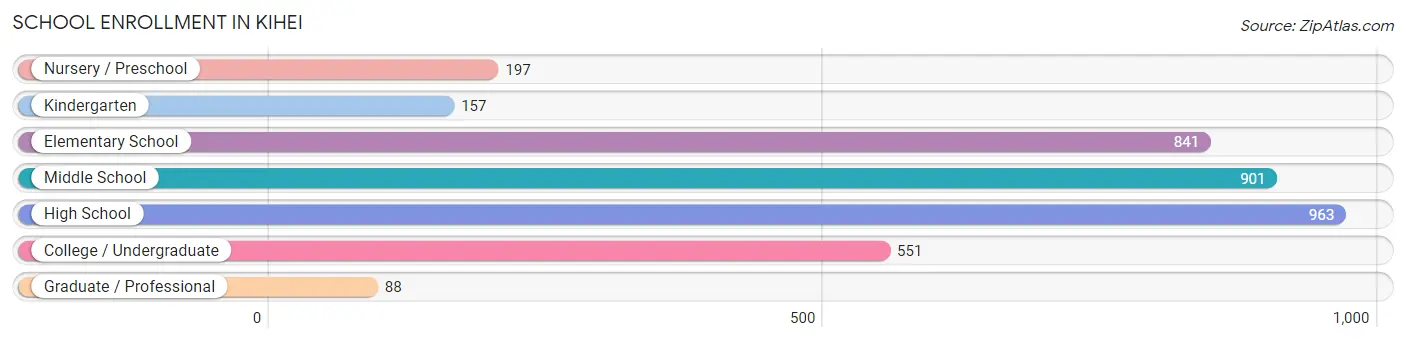
| School Level | # Students | % Students |
| Nursery / Preschool | 197 | 5.3% |
| Kindergarten | 157 | 4.3% |
| Elementary School | 841 | 22.7% |
| Middle School | 901 | 24.4% |
| High School | 963 | 26.0% |
| College / Undergraduate | 551 | 14.9% |
| Graduate / Professional | 88 | 2.4% |
| Total | 3,698 | 100.0% |
School Enrollment by Age by Funding Source in Kihei
Out of a total of 3,698 students who are enrolled in schools in Kihei, 710 (19.2%) attend a private institution, while the remaining 2,988 (80.8%) are enrolled in public schools. The age group of 3 to 4 year olds has the highest likelihood of being enrolled in private schools, with 109 (72.2% in the age bracket) enrolled. Conversely, the age group of 10 to 14 year olds has the lowest likelihood of being enrolled in a private school, with 1,119 (90.7% in the age bracket) attending a public institution.
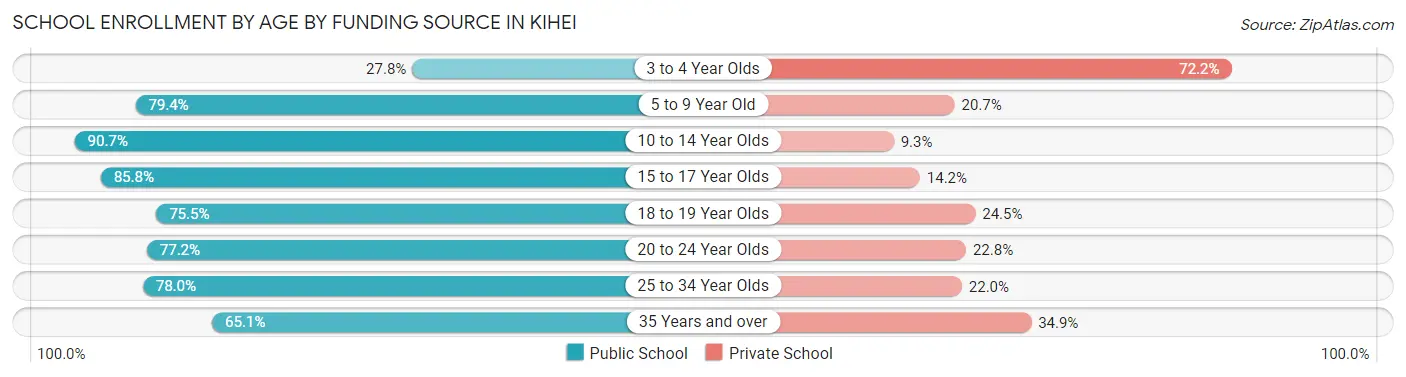
| Age Bracket | Public School | Private School |
| 3 to 4 Year Olds | 42 (27.8%) | 109 (72.2%) |
| 5 to 9 Year Old | 780 (79.3%) | 203 (20.6%) |
| 10 to 14 Year Olds | 1,119 (90.7%) | 115 (9.3%) |
| 15 to 17 Year Olds | 496 (85.8%) | 82 (14.2%) |
| 18 to 19 Year Olds | 117 (75.5%) | 38 (24.5%) |
| 20 to 24 Year Olds | 200 (77.2%) | 59 (22.8%) |
| 25 to 34 Year Olds | 85 (78.0%) | 24 (22.0%) |
| 35 Years and over | 149 (65.1%) | 80 (34.9%) |
| Total | 2,988 (80.8%) | 710 (19.2%) |
Educational Attainment by Field of Study in Kihei
Business (1,105 | 20.1%), social sciences (622 | 11.3%), education (593 | 10.8%), bio, nature & agricultural (440 | 8.0%), and arts & humanities (357 | 6.5%) are the most common fields of study among 5,497 individuals in Kihei who have obtained a bachelor's degree or higher.
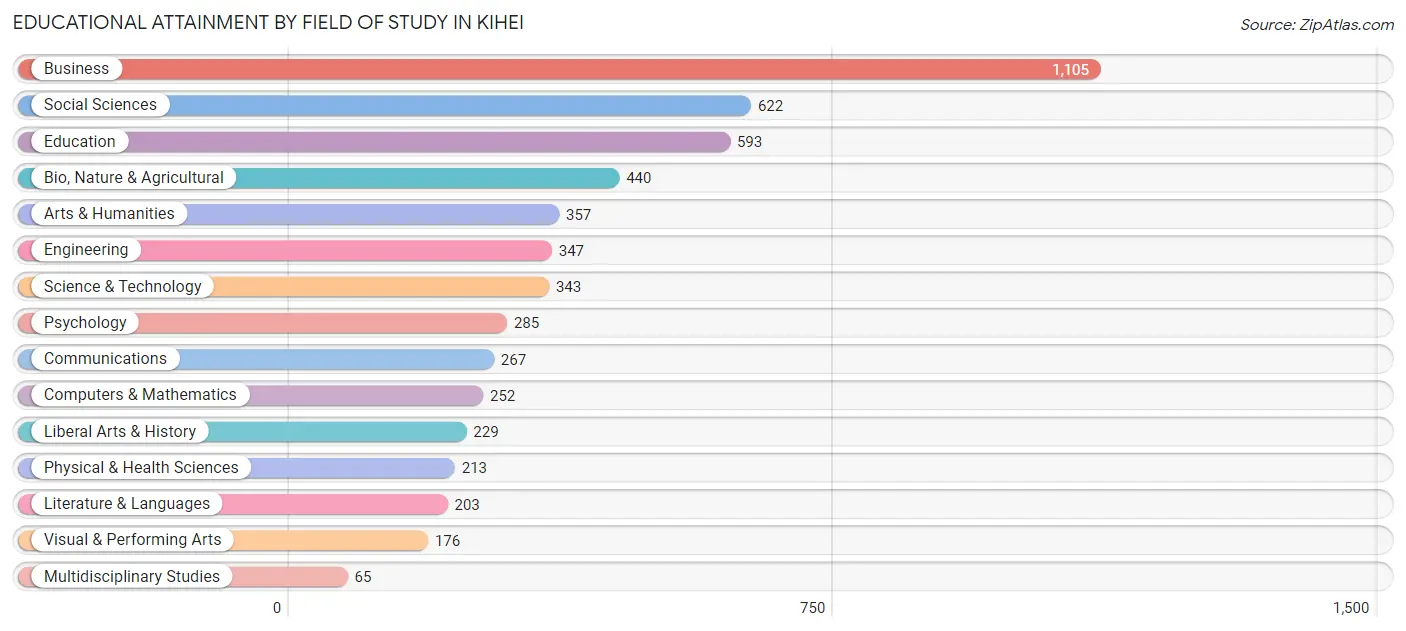
| Field of Study | # Graduates | % Graduates |
| Computers & Mathematics | 252 | 4.6% |
| Bio, Nature & Agricultural | 440 | 8.0% |
| Physical & Health Sciences | 213 | 3.9% |
| Psychology | 285 | 5.2% |
| Social Sciences | 622 | 11.3% |
| Engineering | 347 | 6.3% |
| Multidisciplinary Studies | 65 | 1.2% |
| Science & Technology | 343 | 6.2% |
| Business | 1,105 | 20.1% |
| Education | 593 | 10.8% |
| Literature & Languages | 203 | 3.7% |
| Liberal Arts & History | 229 | 4.2% |
| Visual & Performing Arts | 176 | 3.2% |
| Communications | 267 | 4.9% |
| Arts & Humanities | 357 | 6.5% |
| Total | 5,497 | 100.0% |
Transportation & Commute in Kihei
Vehicle Availability by Sex in Kihei
The most prevalent vehicle ownership categories in Kihei are males with 2 vehicles (2,183, accounting for 37.0%) and females with 2 vehicles (2,136, making up 35.2%).
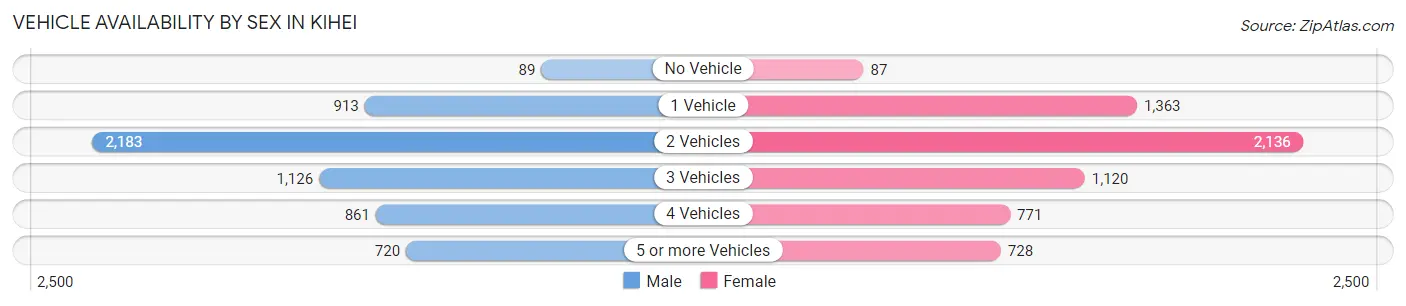
| Vehicles Available | Male | Female |
| No Vehicle | 89 (1.5%) | 87 (1.4%) |
| 1 Vehicle | 913 (15.5%) | 1,363 (22.0%) |
| 2 Vehicles | 2,183 (37.0%) | 2,136 (34.4%) |
| 3 Vehicles | 1,126 (19.1%) | 1,120 (18.0%) |
| 4 Vehicles | 861 (14.6%) | 771 (12.4%) |
| 5 or more Vehicles | 720 (12.2%) | 728 (11.7%) |
| Total | 5,892 (100.0%) | 6,205 (100.0%) |
Commute Time in Kihei
The most frequently occuring commute durations in Kihei are 20 to 24 minutes (2,275 commuters, 20.9%), 15 to 19 minutes (1,793 commuters, 16.5%), and 5 to 9 minutes (1,753 commuters, 16.1%).
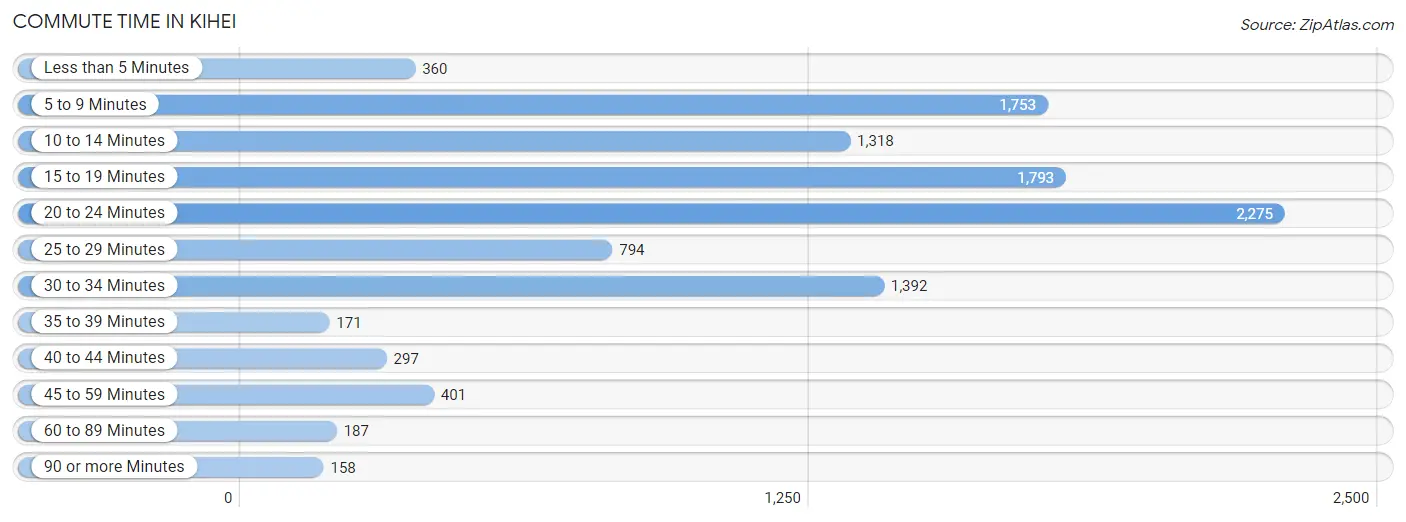
| Commute Time | # Commuters | % Commuters |
| Less than 5 Minutes | 360 | 3.3% |
| 5 to 9 Minutes | 1,753 | 16.1% |
| 10 to 14 Minutes | 1,318 | 12.1% |
| 15 to 19 Minutes | 1,793 | 16.5% |
| 20 to 24 Minutes | 2,275 | 20.9% |
| 25 to 29 Minutes | 794 | 7.3% |
| 30 to 34 Minutes | 1,392 | 12.8% |
| 35 to 39 Minutes | 171 | 1.6% |
| 40 to 44 Minutes | 297 | 2.7% |
| 45 to 59 Minutes | 401 | 3.7% |
| 60 to 89 Minutes | 187 | 1.7% |
| 90 or more Minutes | 158 | 1.5% |
Commute Time by Sex in Kihei
The most common commute times in Kihei are 20 to 24 minutes (1,367 commuters, 24.7%) for males and 15 to 19 minutes (1,012 commuters, 18.9%) for females.
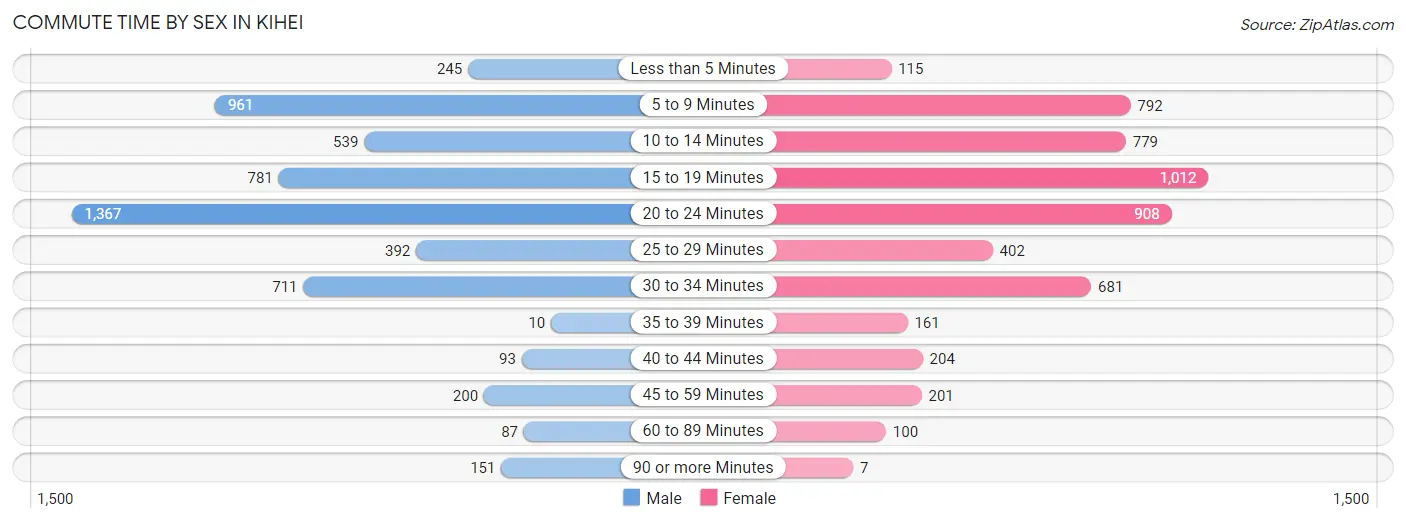
| Commute Time | Male | Female |
| Less than 5 Minutes | 245 (4.4%) | 115 (2.1%) |
| 5 to 9 Minutes | 961 (17.4%) | 792 (14.8%) |
| 10 to 14 Minutes | 539 (9.7%) | 779 (14.5%) |
| 15 to 19 Minutes | 781 (14.1%) | 1,012 (18.9%) |
| 20 to 24 Minutes | 1,367 (24.7%) | 908 (16.9%) |
| 25 to 29 Minutes | 392 (7.1%) | 402 (7.5%) |
| 30 to 34 Minutes | 711 (12.8%) | 681 (12.7%) |
| 35 to 39 Minutes | 10 (0.2%) | 161 (3.0%) |
| 40 to 44 Minutes | 93 (1.7%) | 204 (3.8%) |
| 45 to 59 Minutes | 200 (3.6%) | 201 (3.7%) |
| 60 to 89 Minutes | 87 (1.6%) | 100 (1.9%) |
| 90 or more Minutes | 151 (2.7%) | 7 (0.1%) |
Time of Departure to Work by Sex in Kihei
The most frequent times of departure to work in Kihei are 7:00 AM to 7:29 AM (895, 16.2%) for males and 7:30 AM to 7:59 AM (942, 17.6%) for females.
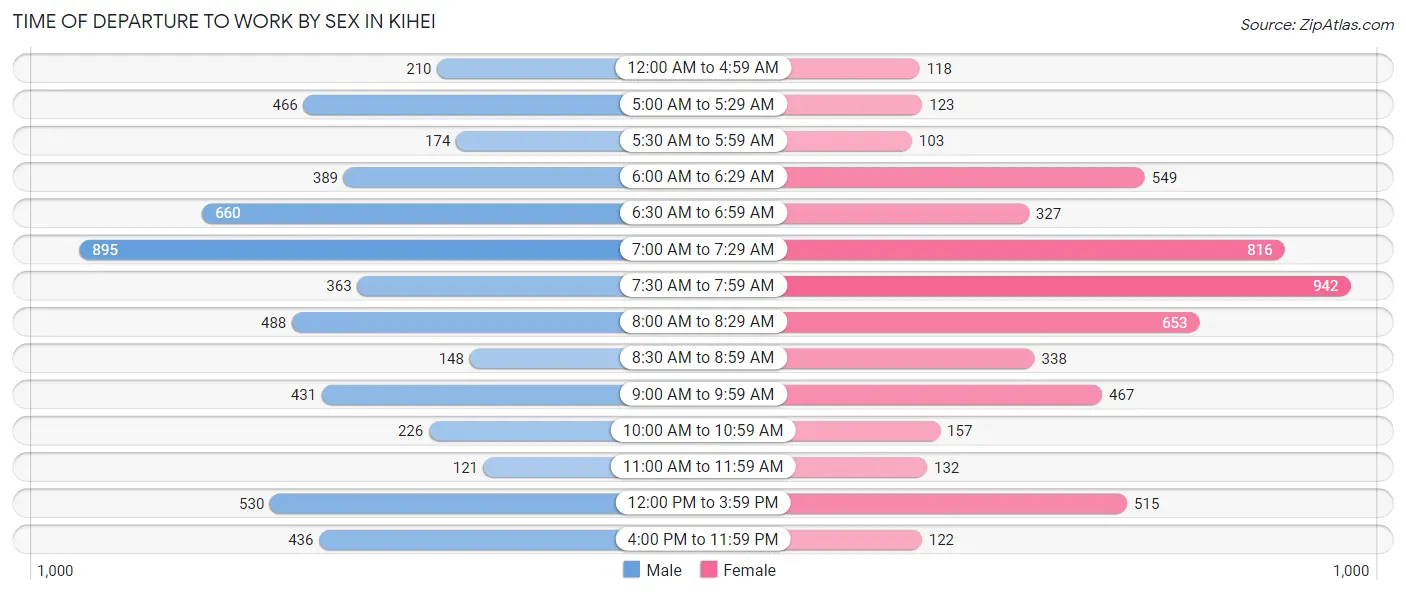
| Time of Departure | Male | Female |
| 12:00 AM to 4:59 AM | 210 (3.8%) | 118 (2.2%) |
| 5:00 AM to 5:29 AM | 466 (8.4%) | 123 (2.3%) |
| 5:30 AM to 5:59 AM | 174 (3.1%) | 103 (1.9%) |
| 6:00 AM to 6:29 AM | 389 (7.0%) | 549 (10.2%) |
| 6:30 AM to 6:59 AM | 660 (11.9%) | 327 (6.1%) |
| 7:00 AM to 7:29 AM | 895 (16.2%) | 816 (15.2%) |
| 7:30 AM to 7:59 AM | 363 (6.6%) | 942 (17.6%) |
| 8:00 AM to 8:29 AM | 488 (8.8%) | 653 (12.2%) |
| 8:30 AM to 8:59 AM | 148 (2.7%) | 338 (6.3%) |
| 9:00 AM to 9:59 AM | 431 (7.8%) | 467 (8.7%) |
| 10:00 AM to 10:59 AM | 226 (4.1%) | 157 (2.9%) |
| 11:00 AM to 11:59 AM | 121 (2.2%) | 132 (2.5%) |
| 12:00 PM to 3:59 PM | 530 (9.6%) | 515 (9.6%) |
| 4:00 PM to 11:59 PM | 436 (7.9%) | 122 (2.3%) |
| Total | 5,537 (100.0%) | 5,362 (100.0%) |
Housing Occupancy in Kihei
Occupancy by Ownership in Kihei
Of the total 8,001 dwellings in Kihei, owner-occupied units account for 4,842 (60.5%), while renter-occupied units make up 3,159 (39.5%).
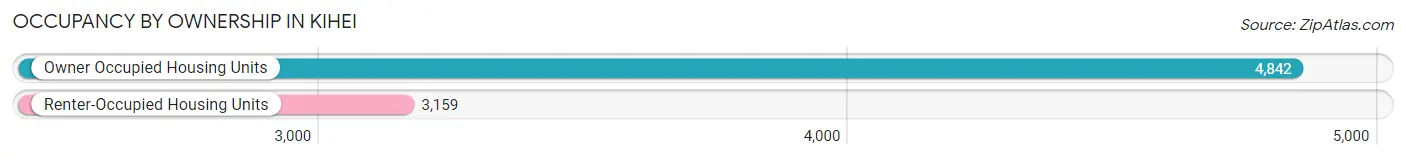
| Occupancy | # Housing Units | % Housing Units |
| Owner Occupied Housing Units | 4,842 | 60.5% |
| Renter-Occupied Housing Units | 3,159 | 39.5% |
| Total Occupied Housing Units | 8,001 | 100.0% |
Occupancy by Household Size in Kihei
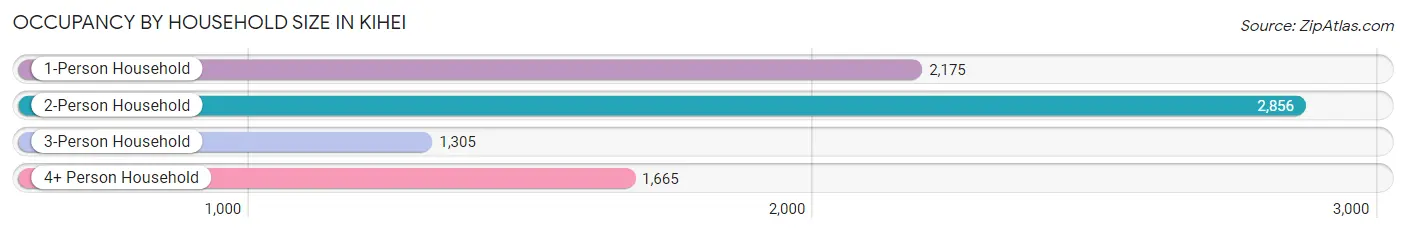
| Household Size | # Housing Units | % Housing Units |
| 1-Person Household | 2,175 | 27.2% |
| 2-Person Household | 2,856 | 35.7% |
| 3-Person Household | 1,305 | 16.3% |
| 4+ Person Household | 1,665 | 20.8% |
| Total Housing Units | 8,001 | 100.0% |
Occupancy by Ownership by Household Size in Kihei
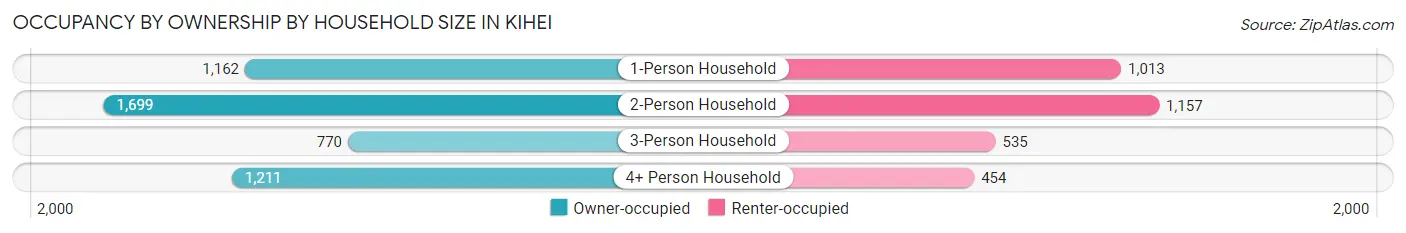
| Household Size | Owner-occupied | Renter-occupied |
| 1-Person Household | 1,162 (53.4%) | 1,013 (46.6%) |
| 2-Person Household | 1,699 (59.5%) | 1,157 (40.5%) |
| 3-Person Household | 770 (59.0%) | 535 (41.0%) |
| 4+ Person Household | 1,211 (72.7%) | 454 (27.3%) |
| Total Housing Units | 4,842 (60.5%) | 3,159 (39.5%) |
Occupancy by Educational Attainment in Kihei
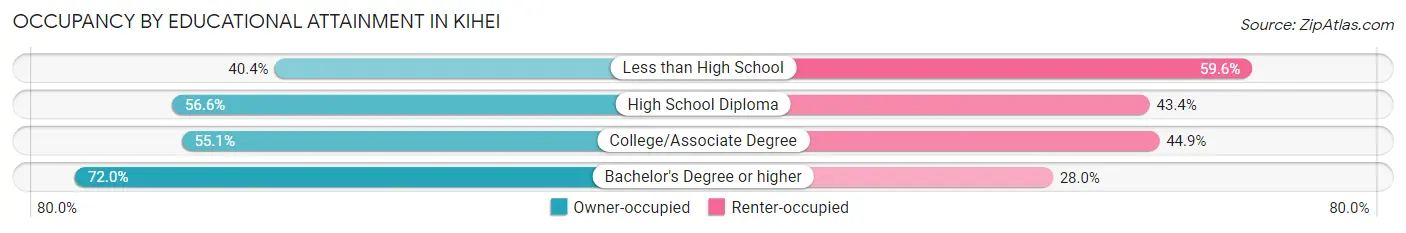
| Household Size | Owner-occupied | Renter-occupied |
| Less than High School | 168 (40.4%) | 248 (59.6%) |
| High School Diploma | 1,072 (56.6%) | 821 (43.4%) |
| College/Associate Degree | 1,619 (55.1%) | 1,319 (44.9%) |
| Bachelor's Degree or higher | 1,983 (72.0%) | 771 (28.0%) |
Occupancy by Age of Householder in Kihei
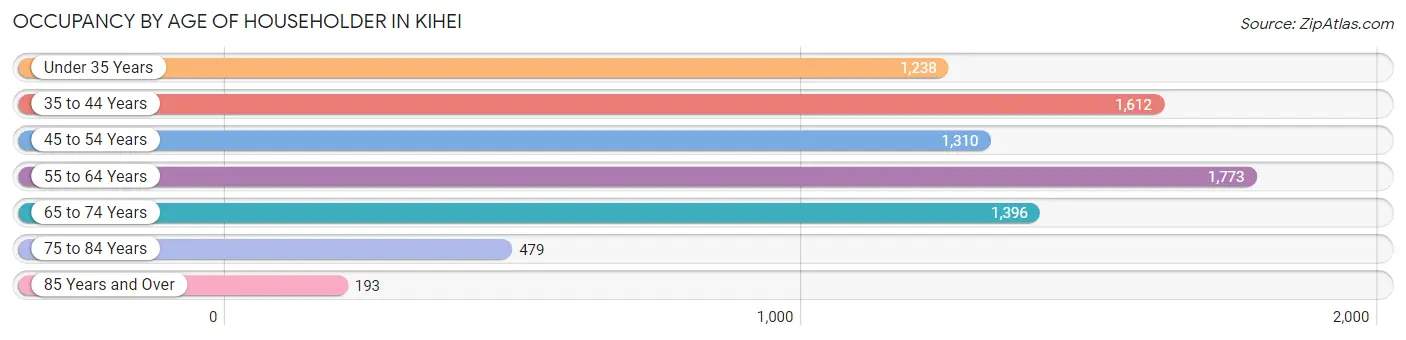
| Age Bracket | # Households | % Households |
| Under 35 Years | 1,238 | 15.5% |
| 35 to 44 Years | 1,612 | 20.2% |
| 45 to 54 Years | 1,310 | 16.4% |
| 55 to 64 Years | 1,773 | 22.2% |
| 65 to 74 Years | 1,396 | 17.4% |
| 75 to 84 Years | 479 | 6.0% |
| 85 Years and Over | 193 | 2.4% |
| Total | 8,001 | 100.0% |
Housing Finances in Kihei
Median Income by Occupancy in Kihei
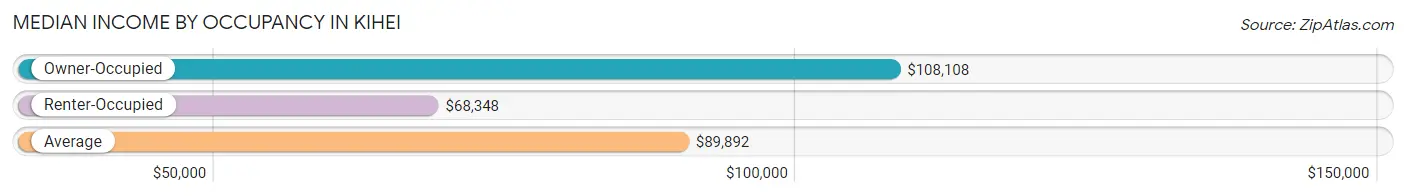
| Occupancy Type | # Households | Median Income |
| Owner-Occupied | 4,842 (60.5%) | $108,108 |
| Renter-Occupied | 3,159 (39.5%) | $68,348 |
| Average | 8,001 (100.0%) | $89,892 |
Occupancy by Householder Income Bracket in Kihei
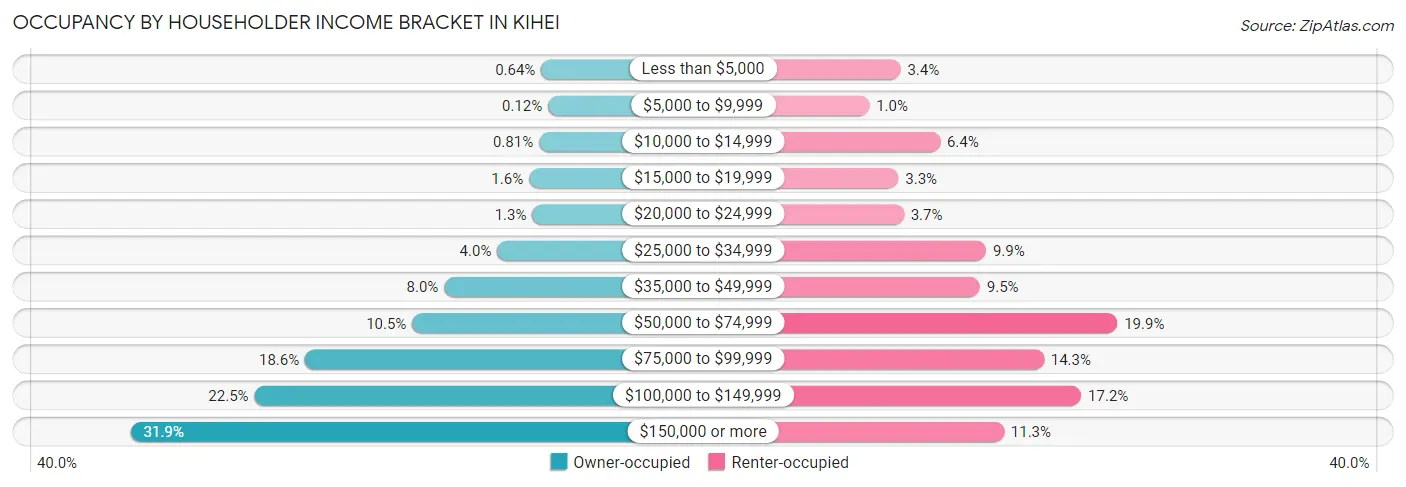
| Income Bracket | Owner-occupied | Renter-occupied |
| Less than $5,000 | 31 (0.6%) | 108 (3.4%) |
| $5,000 to $9,999 | 6 (0.1%) | 33 (1.0%) |
| $10,000 to $14,999 | 39 (0.8%) | 203 (6.4%) |
| $15,000 to $19,999 | 76 (1.6%) | 103 (3.3%) |
| $20,000 to $24,999 | 64 (1.3%) | 116 (3.7%) |
| $25,000 to $34,999 | 193 (4.0%) | 314 (9.9%) |
| $35,000 to $49,999 | 389 (8.0%) | 299 (9.5%) |
| $50,000 to $74,999 | 507 (10.5%) | 630 (19.9%) |
| $75,000 to $99,999 | 902 (18.6%) | 453 (14.3%) |
| $100,000 to $149,999 | 1,089 (22.5%) | 543 (17.2%) |
| $150,000 or more | 1,546 (31.9%) | 357 (11.3%) |
| Total | 4,842 (100.0%) | 3,159 (100.0%) |
Monthly Housing Cost Tiers in Kihei
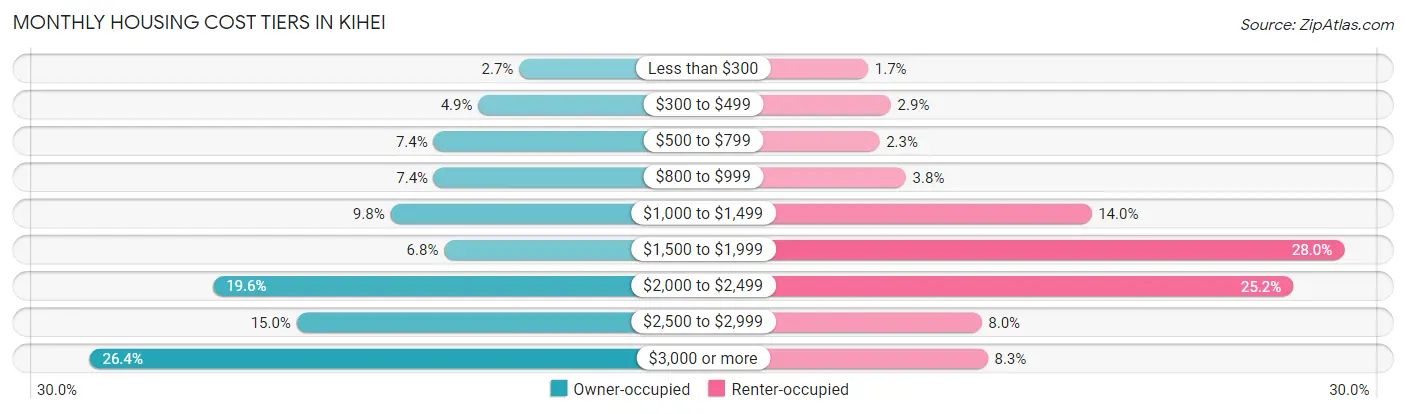
| Monthly Cost | Owner-occupied | Renter-occupied |
| Less than $300 | 130 (2.7%) | 53 (1.7%) |
| $300 to $499 | 239 (4.9%) | 93 (2.9%) |
| $500 to $799 | 359 (7.4%) | 73 (2.3%) |
| $800 to $999 | 358 (7.4%) | 119 (3.8%) |
| $1,000 to $1,499 | 474 (9.8%) | 443 (14.0%) |
| $1,500 to $1,999 | 330 (6.8%) | 884 (28.0%) |
| $2,000 to $2,499 | 948 (19.6%) | 795 (25.2%) |
| $2,500 to $2,999 | 725 (15.0%) | 251 (8.0%) |
| $3,000 or more | 1,279 (26.4%) | 262 (8.3%) |
| Total | 4,842 (100.0%) | 3,159 (100.0%) |
Physical Housing Characteristics in Kihei
Housing Structures in Kihei
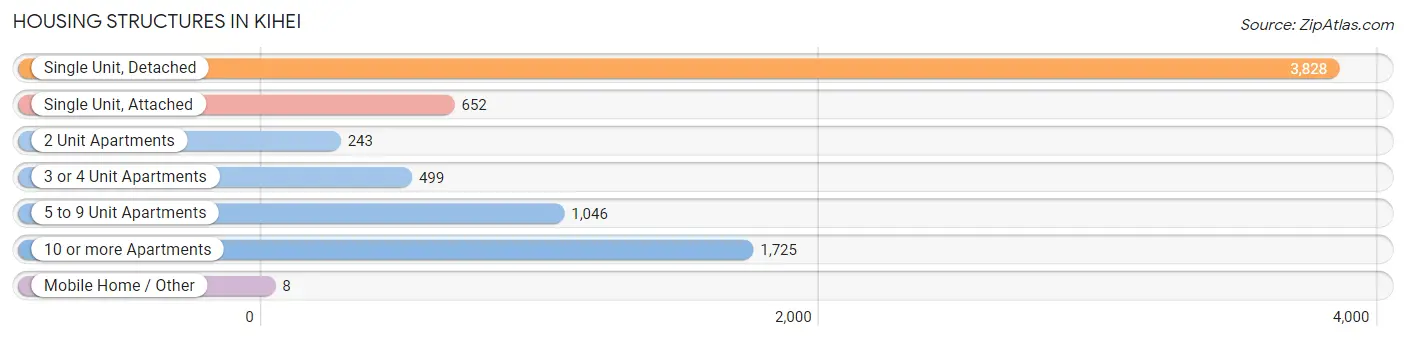
| Structure Type | # Housing Units | % Housing Units |
| Single Unit, Detached | 3,828 | 47.8% |
| Single Unit, Attached | 652 | 8.2% |
| 2 Unit Apartments | 243 | 3.0% |
| 3 or 4 Unit Apartments | 499 | 6.2% |
| 5 to 9 Unit Apartments | 1,046 | 13.1% |
| 10 or more Apartments | 1,725 | 21.6% |
| Mobile Home / Other | 8 | 0.1% |
| Total | 8,001 | 100.0% |
Housing Structures by Occupancy in Kihei
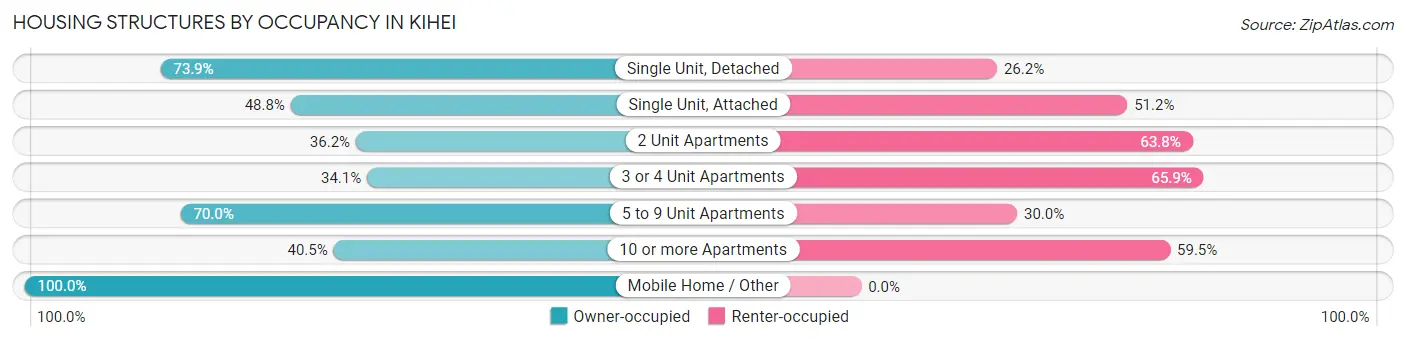
| Structure Type | Owner-occupied | Renter-occupied |
| Single Unit, Detached | 2,827 (73.9%) | 1,001 (26.2%) |
| Single Unit, Attached | 318 (48.8%) | 334 (51.2%) |
| 2 Unit Apartments | 88 (36.2%) | 155 (63.8%) |
| 3 or 4 Unit Apartments | 170 (34.1%) | 329 (65.9%) |
| 5 to 9 Unit Apartments | 732 (70.0%) | 314 (30.0%) |
| 10 or more Apartments | 699 (40.5%) | 1,026 (59.5%) |
| Mobile Home / Other | 8 (100.0%) | 0 (0.0%) |
| Total | 4,842 (60.5%) | 3,159 (39.5%) |
Housing Structures by Number of Rooms in Kihei
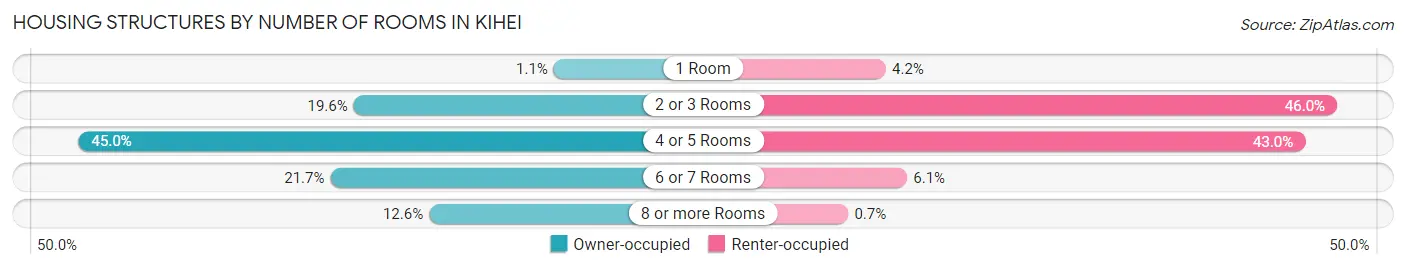
| Number of Rooms | Owner-occupied | Renter-occupied |
| 1 Room | 52 (1.1%) | 132 (4.2%) |
| 2 or 3 Rooms | 948 (19.6%) | 1,452 (46.0%) |
| 4 or 5 Rooms | 2,180 (45.0%) | 1,359 (43.0%) |
| 6 or 7 Rooms | 1,052 (21.7%) | 194 (6.1%) |
| 8 or more Rooms | 610 (12.6%) | 22 (0.7%) |
| Total | 4,842 (100.0%) | 3,159 (100.0%) |
Housing Structure by Heating Type in Kihei
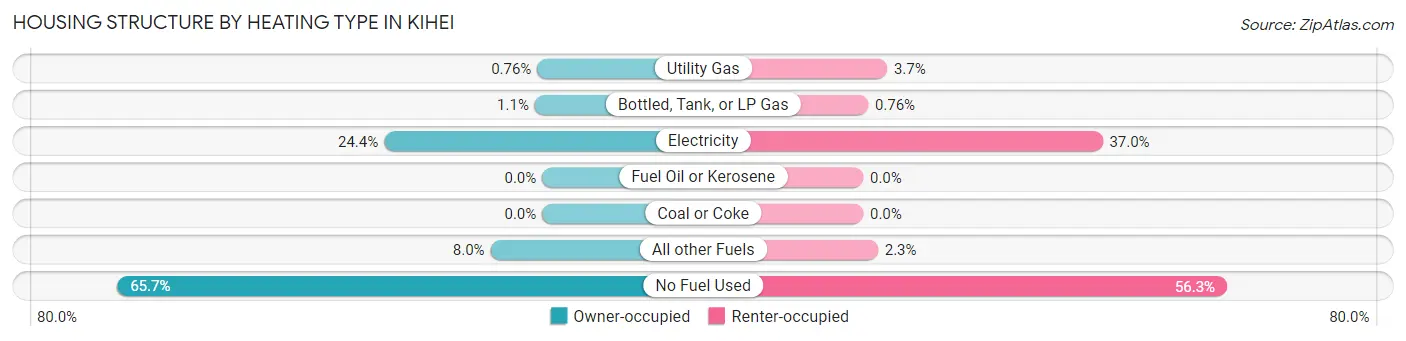
| Heating Type | Owner-occupied | Renter-occupied |
| Utility Gas | 37 (0.8%) | 117 (3.7%) |
| Bottled, Tank, or LP Gas | 55 (1.1%) | 24 (0.8%) |
| Electricity | 1,183 (24.4%) | 1,169 (37.0%) |
| Fuel Oil or Kerosene | 0 (0.0%) | 0 (0.0%) |
| Coal or Coke | 0 (0.0%) | 0 (0.0%) |
| All other Fuels | 387 (8.0%) | 72 (2.3%) |
| No Fuel Used | 3,180 (65.7%) | 1,777 (56.2%) |
| Total | 4,842 (100.0%) | 3,159 (100.0%) |
Household Vehicle Usage in Kihei
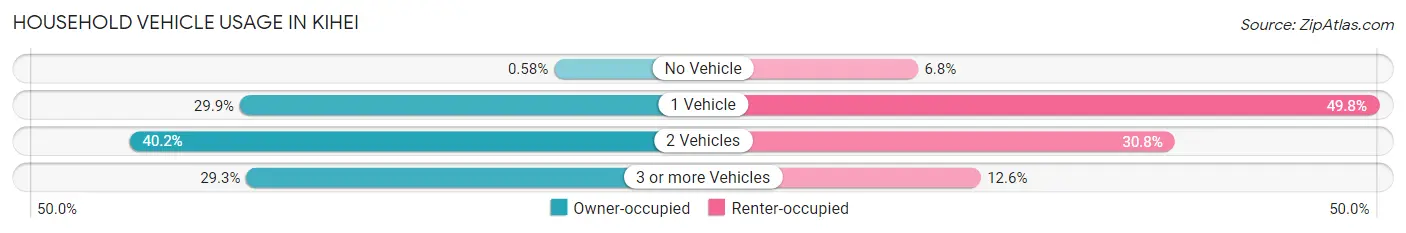
| Vehicles per Household | Owner-occupied | Renter-occupied |
| No Vehicle | 28 (0.6%) | 214 (6.8%) |
| 1 Vehicle | 1,448 (29.9%) | 1,574 (49.8%) |
| 2 Vehicles | 1,947 (40.2%) | 972 (30.8%) |
| 3 or more Vehicles | 1,419 (29.3%) | 399 (12.6%) |
| Total | 4,842 (100.0%) | 3,159 (100.0%) |
Real Estate & Mortgages in Kihei
Real Estate and Mortgage Overview in Kihei
| Characteristic | Without Mortgage | With Mortgage |
| Housing Units | 1,365 | 3,477 |
| Median Property Value | $806,600 | $735,300 |
| Median Household Income | $89,922 | $1,296 |
| Monthly Housing Costs | $783 | $1,266 |
| Real Estate Taxes | $1,466 | $185 |
Property Value by Mortgage Status in Kihei
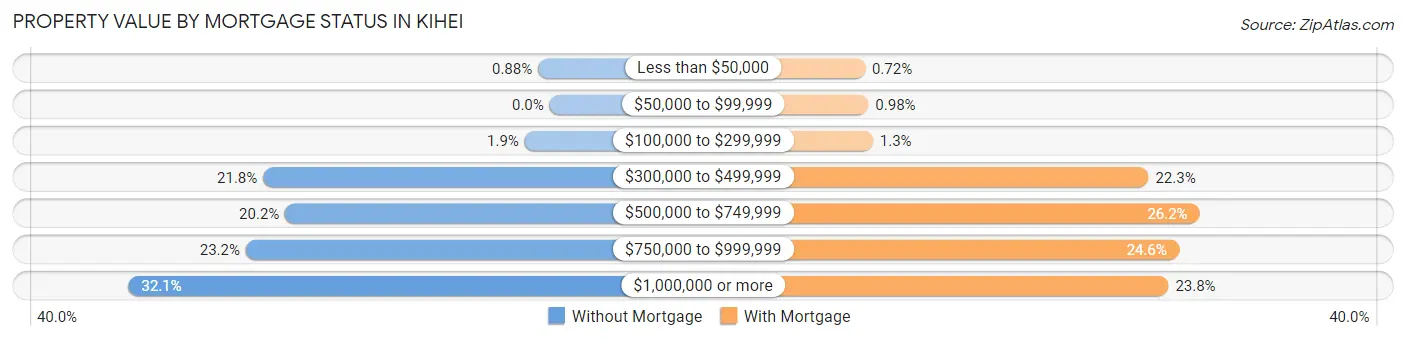
| Property Value | Without Mortgage | With Mortgage |
| Less than $50,000 | 12 (0.9%) | 25 (0.7%) |
| $50,000 to $99,999 | 0 (0.0%) | 34 (1.0%) |
| $100,000 to $299,999 | 26 (1.9%) | 46 (1.3%) |
| $300,000 to $499,999 | 298 (21.8%) | 776 (22.3%) |
| $500,000 to $749,999 | 275 (20.2%) | 911 (26.2%) |
| $750,000 to $999,999 | 316 (23.2%) | 856 (24.6%) |
| $1,000,000 or more | 438 (32.1%) | 829 (23.8%) |
| Total | 1,365 (100.0%) | 3,477 (100.0%) |
Household Income by Mortgage Status in Kihei
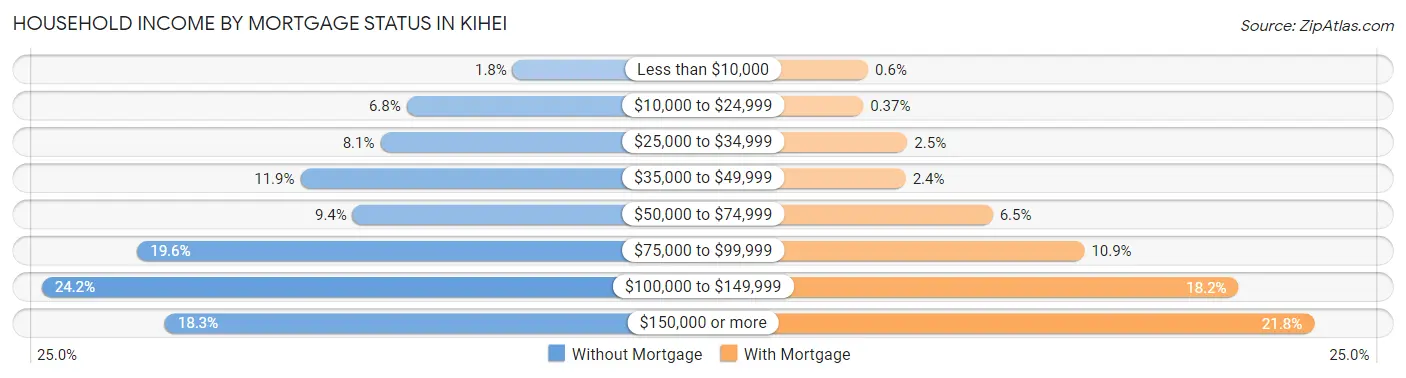
| Household Income | Without Mortgage | With Mortgage |
| Less than $10,000 | 24 (1.8%) | 21 (0.6%) |
| $10,000 to $24,999 | 93 (6.8%) | 13 (0.4%) |
| $25,000 to $34,999 | 110 (8.1%) | 86 (2.5%) |
| $35,000 to $49,999 | 162 (11.9%) | 83 (2.4%) |
| $50,000 to $74,999 | 128 (9.4%) | 227 (6.5%) |
| $75,000 to $99,999 | 268 (19.6%) | 379 (10.9%) |
| $100,000 to $149,999 | 330 (24.2%) | 634 (18.2%) |
| $150,000 or more | 250 (18.3%) | 759 (21.8%) |
| Total | 1,365 (100.0%) | 3,477 (100.0%) |
Property Value to Household Income Ratio in Kihei
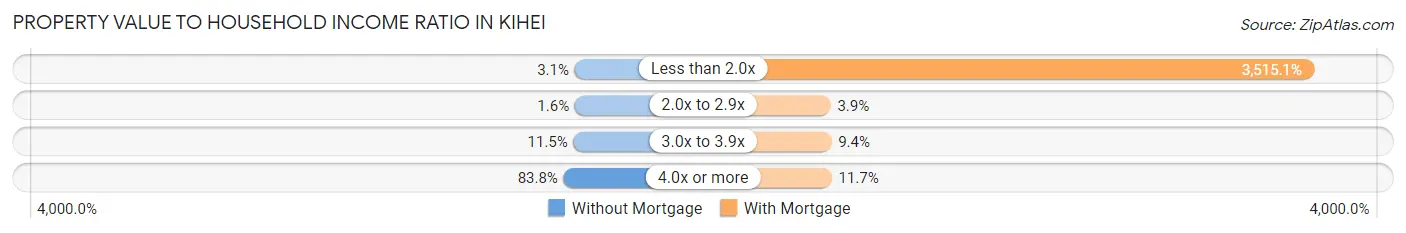
| Value-to-Income Ratio | Without Mortgage | With Mortgage |
| Less than 2.0x | 42 (3.1%) | 122,221 (3,515.1%) |
| 2.0x to 2.9x | 22 (1.6%) | 135 (3.9%) |
| 3.0x to 3.9x | 157 (11.5%) | 327 (9.4%) |
| 4.0x or more | 1,144 (83.8%) | 406 (11.7%) |
| Total | 1,365 (100.0%) | 3,477 (100.0%) |
Real Estate Taxes by Mortgage Status in Kihei
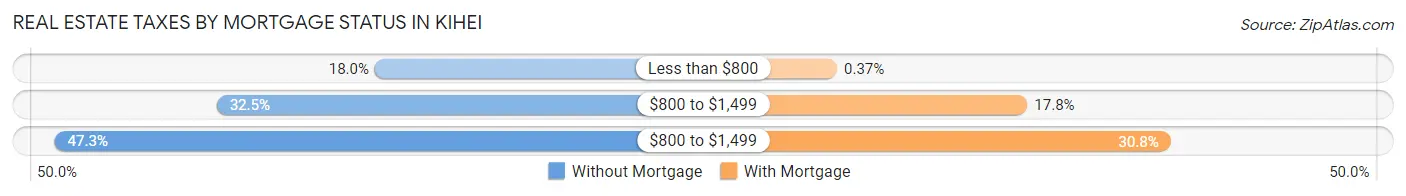
| Property Taxes | Without Mortgage | With Mortgage |
| Less than $800 | 246 (18.0%) | 13 (0.4%) |
| $800 to $1,499 | 443 (32.5%) | 617 (17.7%) |
| $800 to $1,499 | 645 (47.2%) | 1,072 (30.8%) |
| Total | 1,365 (100.0%) | 3,477 (100.0%) |
Health & Disability in Kihei
Health Insurance Coverage by Age in Kihei
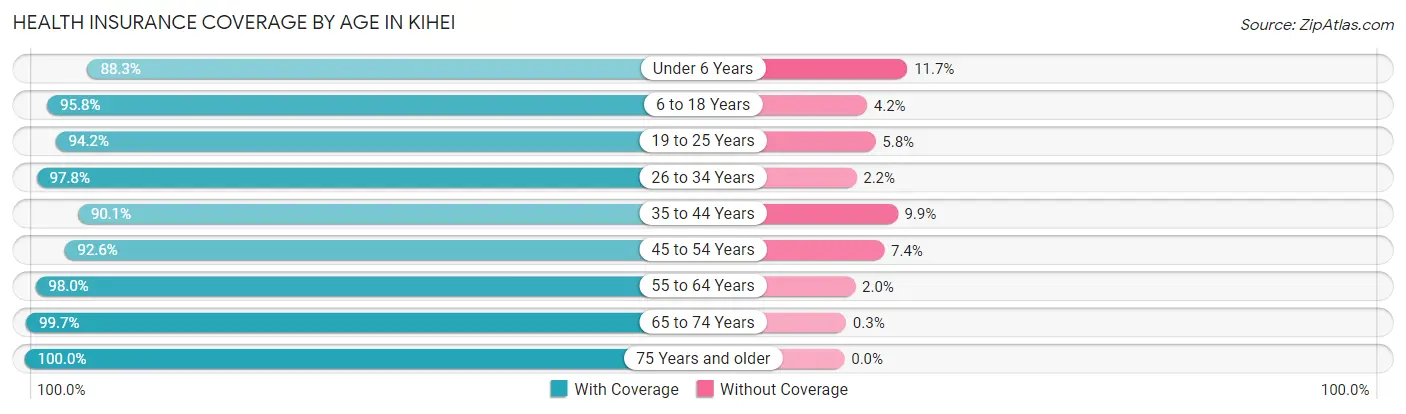
| Age Bracket | With Coverage | Without Coverage |
| Under 6 Years | 1,084 (88.3%) | 144 (11.7%) |
| 6 to 18 Years | 2,962 (95.8%) | 130 (4.2%) |
| 19 to 25 Years | 1,889 (94.2%) | 116 (5.8%) |
| 26 to 34 Years | 2,460 (97.8%) | 56 (2.2%) |
| 35 to 44 Years | 3,069 (90.1%) | 338 (9.9%) |
| 45 to 54 Years | 2,691 (92.6%) | 216 (7.4%) |
| 55 to 64 Years | 3,107 (98.0%) | 64 (2.0%) |
| 65 to 74 Years | 2,351 (99.7%) | 7 (0.3%) |
| 75 Years and older | 1,275 (100.0%) | 0 (0.0%) |
| Total | 20,888 (95.1%) | 1,071 (4.9%) |
Health Insurance Coverage by Citizenship Status in Kihei
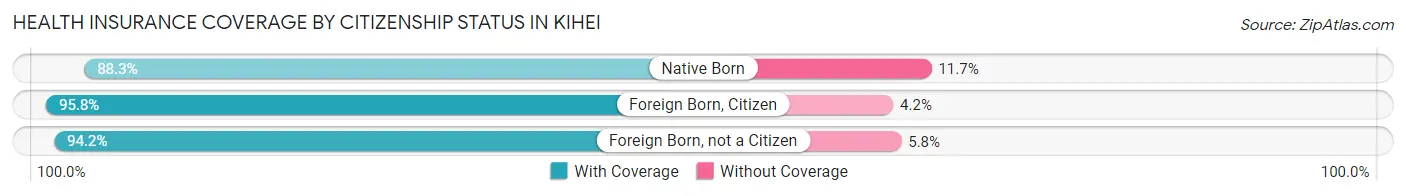
| Citizenship Status | With Coverage | Without Coverage |
| Native Born | 1,084 (88.3%) | 144 (11.7%) |
| Foreign Born, Citizen | 2,962 (95.8%) | 130 (4.2%) |
| Foreign Born, not a Citizen | 1,889 (94.2%) | 116 (5.8%) |
Health Insurance Coverage by Household Income in Kihei
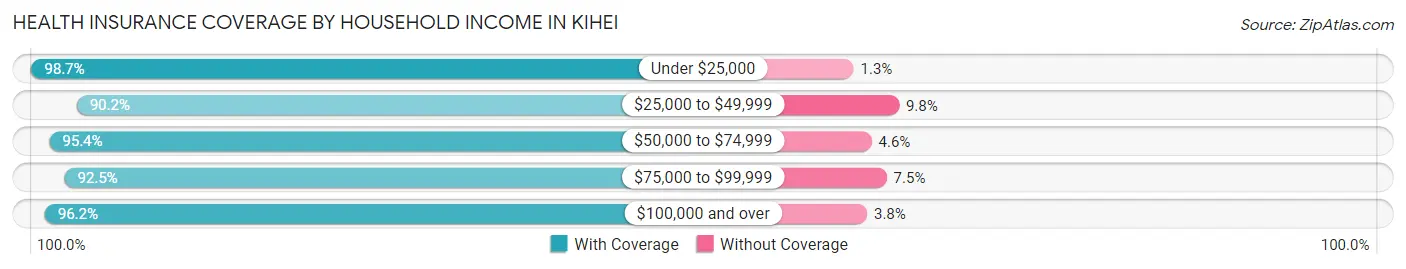
| Household Income | With Coverage | Without Coverage |
| Under $25,000 | 1,404 (98.7%) | 18 (1.3%) |
| $25,000 to $49,999 | 2,290 (90.2%) | 248 (9.8%) |
| $50,000 to $74,999 | 2,486 (95.4%) | 121 (4.6%) |
| $75,000 to $99,999 | 2,714 (92.5%) | 219 (7.5%) |
| $100,000 and over | 11,786 (96.2%) | 464 (3.8%) |
Public vs Private Health Insurance Coverage by Age in Kihei
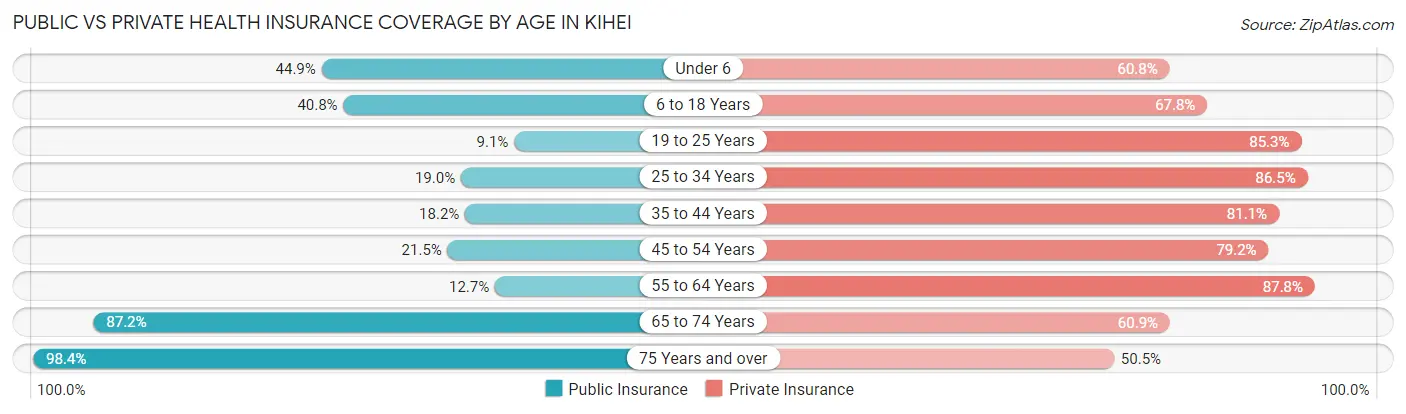
| Age Bracket | Public Insurance | Private Insurance |
| Under 6 | 551 (44.9%) | 747 (60.8%) |
| 6 to 18 Years | 1,262 (40.8%) | 2,097 (67.8%) |
| 19 to 25 Years | 183 (9.1%) | 1,710 (85.3%) |
| 25 to 34 Years | 478 (19.0%) | 2,175 (86.5%) |
| 35 to 44 Years | 621 (18.2%) | 2,764 (81.1%) |
| 45 to 54 Years | 624 (21.5%) | 2,302 (79.2%) |
| 55 to 64 Years | 402 (12.7%) | 2,784 (87.8%) |
| 65 to 74 Years | 2,057 (87.2%) | 1,436 (60.9%) |
| 75 Years and over | 1,255 (98.4%) | 644 (50.5%) |
| Total | 7,433 (33.9%) | 16,659 (75.9%) |
Disability Status by Sex by Age in Kihei
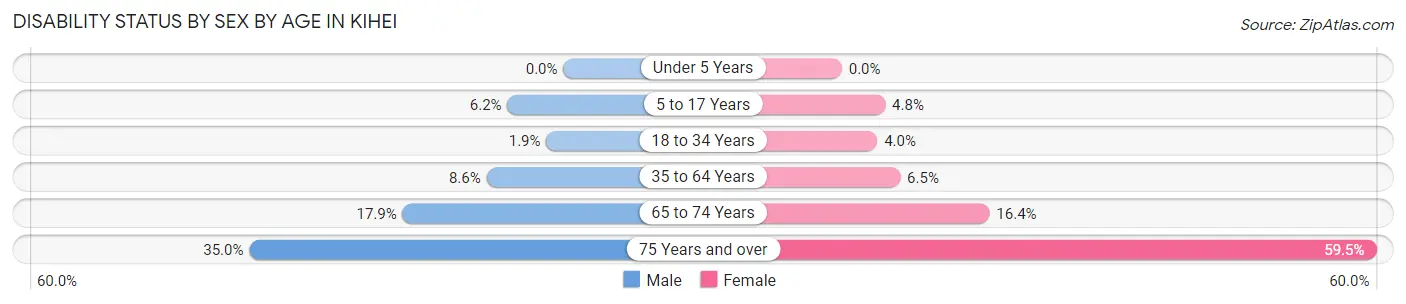
| Age Bracket | Male | Female |
| Under 5 Years | 0 (0.0%) | 0 (0.0%) |
| 5 to 17 Years | 94 (6.2%) | 74 (4.8%) |
| 18 to 34 Years | 39 (1.9%) | 104 (4.0%) |
| 35 to 64 Years | 407 (8.6%) | 307 (6.5%) |
| 65 to 74 Years | 199 (17.9%) | 205 (16.4%) |
| 75 Years and over | 191 (35.0%) | 434 (59.5%) |
Disability Class by Sex by Age in Kihei
Disability Class: Hearing Difficulty
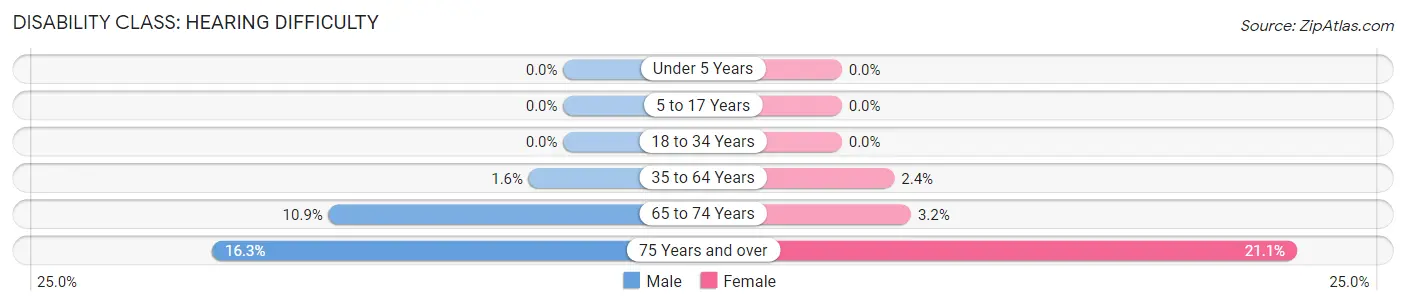
| Age Bracket | Male | Female |
| Under 5 Years | 0 (0.0%) | 0 (0.0%) |
| 5 to 17 Years | 0 (0.0%) | 0 (0.0%) |
| 18 to 34 Years | 0 (0.0%) | 0 (0.0%) |
| 35 to 64 Years | 76 (1.6%) | 115 (2.4%) |
| 65 to 74 Years | 121 (10.9%) | 40 (3.2%) |
| 75 Years and over | 89 (16.3%) | 154 (21.1%) |
Disability Class: Vision Difficulty
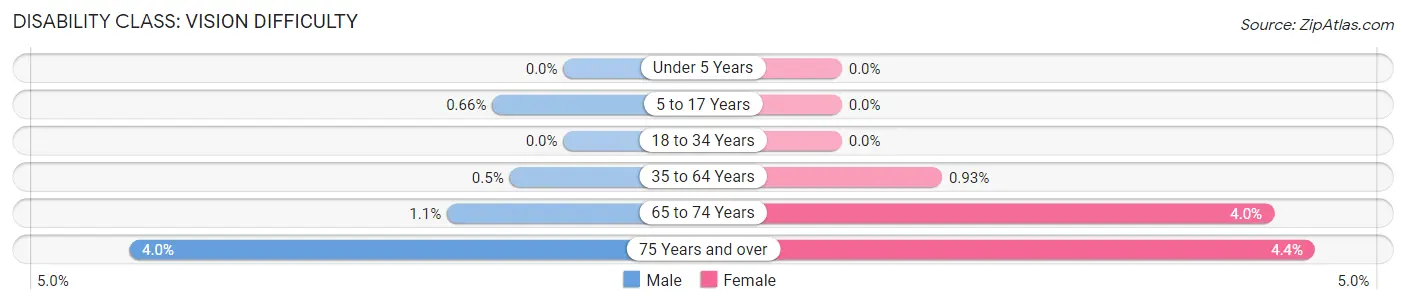
| Age Bracket | Male | Female |
| Under 5 Years | 0 (0.0%) | 0 (0.0%) |
| 5 to 17 Years | 10 (0.7%) | 0 (0.0%) |
| 18 to 34 Years | 0 (0.0%) | 0 (0.0%) |
| 35 to 64 Years | 24 (0.5%) | 44 (0.9%) |
| 65 to 74 Years | 12 (1.1%) | 50 (4.0%) |
| 75 Years and over | 22 (4.0%) | 32 (4.4%) |
Disability Class: Cognitive Difficulty
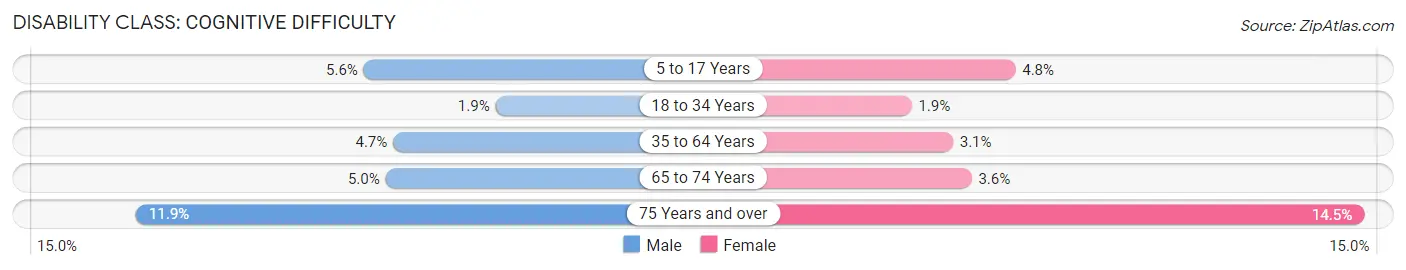
| Age Bracket | Male | Female |
| 5 to 17 Years | 84 (5.6%) | 74 (4.8%) |
| 18 to 34 Years | 39 (1.9%) | 51 (1.9%) |
| 35 to 64 Years | 226 (4.7%) | 146 (3.1%) |
| 65 to 74 Years | 55 (5.0%) | 45 (3.6%) |
| 75 Years and over | 65 (11.9%) | 106 (14.5%) |
Disability Class: Ambulatory Difficulty
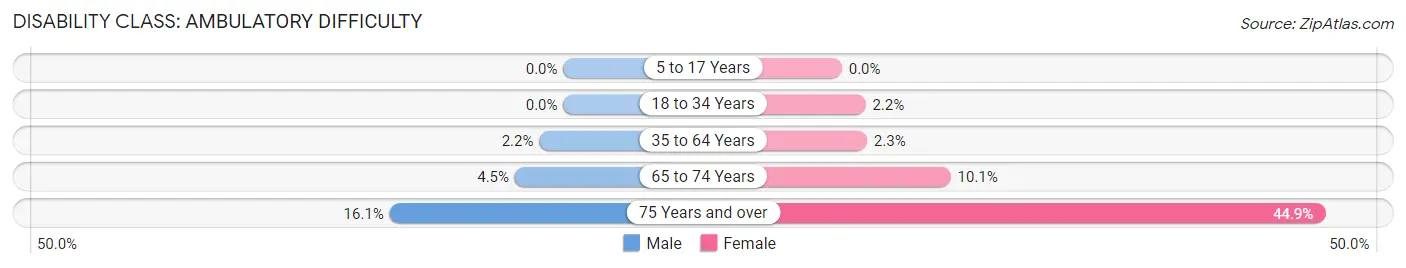
| Age Bracket | Male | Female |
| 5 to 17 Years | 0 (0.0%) | 0 (0.0%) |
| 18 to 34 Years | 0 (0.0%) | 58 (2.2%) |
| 35 to 64 Years | 106 (2.2%) | 110 (2.3%) |
| 65 to 74 Years | 50 (4.5%) | 126 (10.1%) |
| 75 Years and over | 88 (16.1%) | 327 (44.9%) |
Disability Class: Self-Care Difficulty
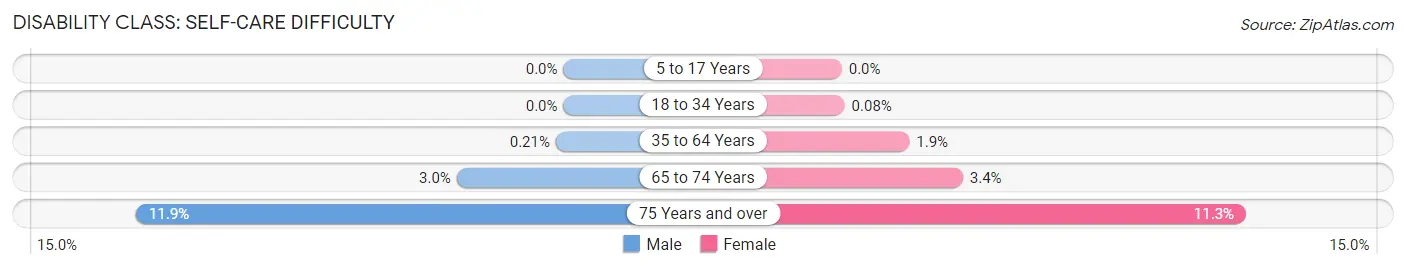
| Age Bracket | Male | Female |
| 5 to 17 Years | 0 (0.0%) | 0 (0.0%) |
| 18 to 34 Years | 0 (0.0%) | 2 (0.1%) |
| 35 to 64 Years | 10 (0.2%) | 89 (1.9%) |
| 65 to 74 Years | 33 (3.0%) | 42 (3.4%) |
| 75 Years and over | 65 (11.9%) | 82 (11.3%) |
Technology Access in Kihei
Computing Device Access in Kihei
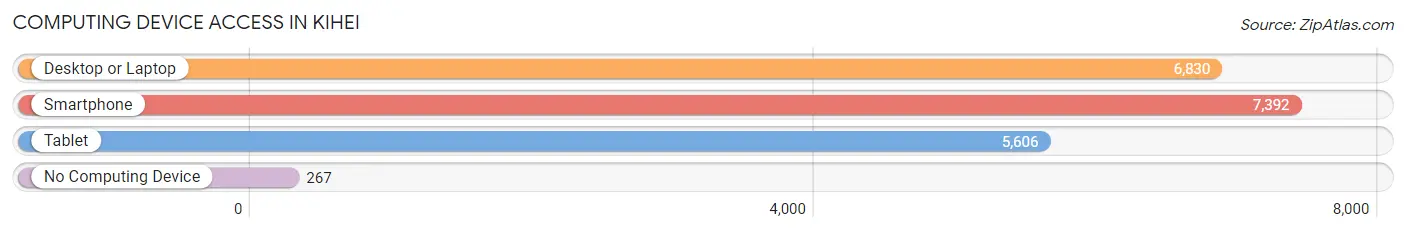
| Device Type | # Households | % Households |
| Desktop or Laptop | 6,830 | 85.4% |
| Smartphone | 7,392 | 92.4% |
| Tablet | 5,606 | 70.1% |
| No Computing Device | 267 | 3.3% |
| Total | 8,001 | 100.0% |
Internet Access in Kihei
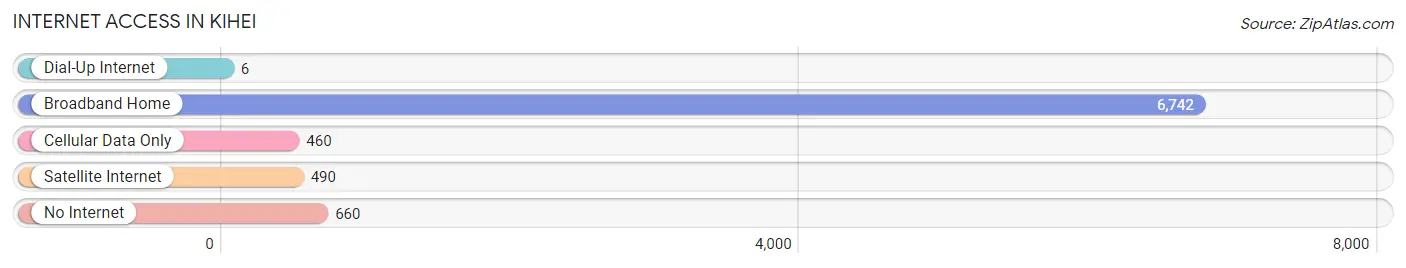
| Internet Type | # Households | % Households |
| Dial-Up Internet | 6 | 0.1% |
| Broadband Home | 6,742 | 84.3% |
| Cellular Data Only | 460 | 5.8% |
| Satellite Internet | 490 | 6.1% |
| No Internet | 660 | 8.3% |
| Total | 8,001 | 100.0% |
Kihei Summary
Kihei is a census-designated place (CDP) located on the island of Maui in the state of Hawaii. It is the second largest town on the island and is located on the south shore of Maui. Kihei is known for its beautiful beaches, warm climate, and abundance of outdoor activities.
Geography
Kihei is located on the south shore of Maui, between the towns of Wailea and Makena. It is bordered by the Pacific Ocean to the east, the West Maui Mountains to the west, and the Ahihi-Kinau Natural Area Reserve to the south. The town is situated on a flat coastal plain, with an average elevation of about 10 feet (3 meters) above sea level. The climate in Kihei is tropical, with temperatures ranging from the mid-70s to the mid-80s Fahrenheit (21-30 Celsius) year-round.
History
Kihei was first settled by Polynesian voyagers in the late 1700s. The area was used for fishing and farming, and the first permanent settlement was established in 1841. In the late 1800s, Kihei became a popular destination for whalers and traders. In the early 1900s, the town began to develop as a tourist destination, and in the 1950s, the first resorts were built in the area.
Economy
Kihei’s economy is largely based on tourism. The town is home to several resorts, hotels, and vacation rental properties, as well as restaurants, shops, and other businesses catering to tourists. The town is also home to several marinas, which provide boat tours and other recreational activities. In addition, Kihei is home to several technology companies, including a software development firm and a data center.
Demographics
As of the 2010 census, Kihei had a population of 20,881. The population is predominantly of Asian descent, with the largest ethnic groups being Filipino (37.2%), Japanese (17.2%), and Chinese (14.2%). The median household income in Kihei is $68,845, and the median age is 44. The town has a high rate of homeownership, with nearly 70% of residents owning their own homes.
Kihei is a vibrant and diverse community, with a rich history and culture. The town is known for its beautiful beaches, warm climate, and abundance of outdoor activities. It is a popular destination for tourists and locals alike, and its economy is largely based on tourism. Kihei is a great place to live, work, and play, and its population is growing steadily.
Common Questions
What is Per Capita Income in Kihei?
Per Capita income in Kihei is $43,099.
What is the Median Family Income in Kihei?
Median Family Income in Kihei is $99,457.
What is the Median Household income in Kihei?
Median Household Income in Kihei is $89,892.
What is Income or Wage Gap in Kihei?
Income or Wage Gap in Kihei is 17.8%.
Women in Kihei earn 82.2 cents for every dollar earned by a man.
What is Inequality or Gini Index in Kihei?
Inequality or Gini Index in Kihei is 0.41.
What is the Total Population of Kihei?
Total Population of Kihei is 22,247.
What is the Total Male Population of Kihei?
Total Male Population of Kihei is 10,556.
What is the Total Female Population of Kihei?
Total Female Population of Kihei is 11,691.
What is the Ratio of Males per 100 Females in Kihei?
There are 90.29 Males per 100 Females in Kihei.
What is the Ratio of Females per 100 Males in Kihei?
There are 110.75 Females per 100 Males in Kihei.
What is the Median Population Age in Kihei?
Median Population Age in Kihei is 41.4 Years.
What is the Average Family Size in Kihei
Average Family Size in Kihei is 3.3 People.
What is the Average Household Size in Kihei
Average Household Size in Kihei is 2.8 People.
How Large is the Labor Force in Kihei?
There are 13,289 People in the Labor Forcein in Kihei.
What is the Percentage of People in the Labor Force in Kihei?
71.8% of People are in the Labor Force in Kihei.
What is the Unemployment Rate in Kihei?
Unemployment Rate in Kihei is 6.5%.