Kahuku, HI Map & Demographics
Kahuku Map
Kahuku Overview
$25,710
PER CAPITA INCOME
$90,227
AVG FAMILY INCOME
$71,758
AVG HOUSEHOLD INCOME
30.1%
WAGE / INCOME GAP [ % ]
69.9¢/ $1
WAGE / INCOME GAP [ $ ]
0.41
INEQUALITY / GINI INDEX
2,274
TOTAL POPULATION
981
MALE POPULATION
1,293
FEMALE POPULATION
75.87
MALES / 100 FEMALES
131.80
FEMALES / 100 MALES
26.9
MEDIAN AGE
4.7
AVG FAMILY SIZE
4.0
AVG HOUSEHOLD SIZE
1,011
LABOR FORCE [ PEOPLE ]
66.1%
PERCENT IN LABOR FORCE
12.2%
UNEMPLOYMENT RATE
Kahuku Zip Codes
Kahuku Area Codes
Income in Kahuku
Income Overview in Kahuku
Per Capita Income in Kahuku is $25,710, while median incomes of families and households are $90,227 and $71,758 respectively.
| Characteristic | Number | Measure |
| Per Capita Income | 2,274 | $25,710 |
| Median Family Income | 444 | $90,227 |
| Mean Family Income | 444 | $109,860 |
| Median Household Income | 561 | $71,758 |
| Mean Household Income | 561 | $97,057 |
| Income Deficit | 444 | $0 |
| Wage / Income Gap (%) | 2,274 | 30.07% |
| Wage / Income Gap ($) | 2,274 | 69.93¢ per $1 |
| Gini / Inequality Index | 2,274 | 0.41 |
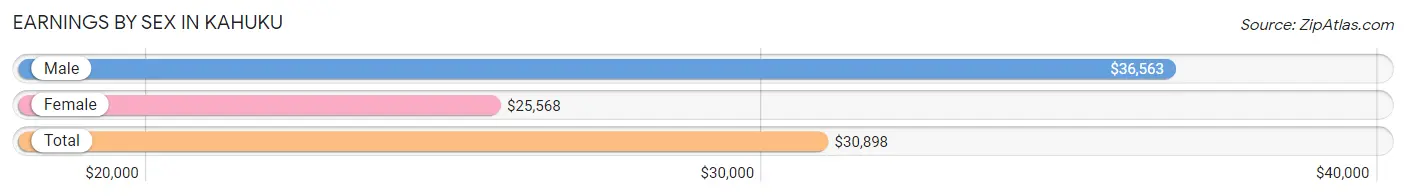
Earnings by Sex in Kahuku
Average Earnings in Kahuku are $30,898, $36,563 for men and $25,568 for women, a difference of 30.1%.
| Sex | Number | Average Earnings |
| Male | 590 (52.2%) | $36,563 |
| Female | 541 (47.8%) | $25,568 |
| Total | 1,131 (100.0%) | $30,898 |
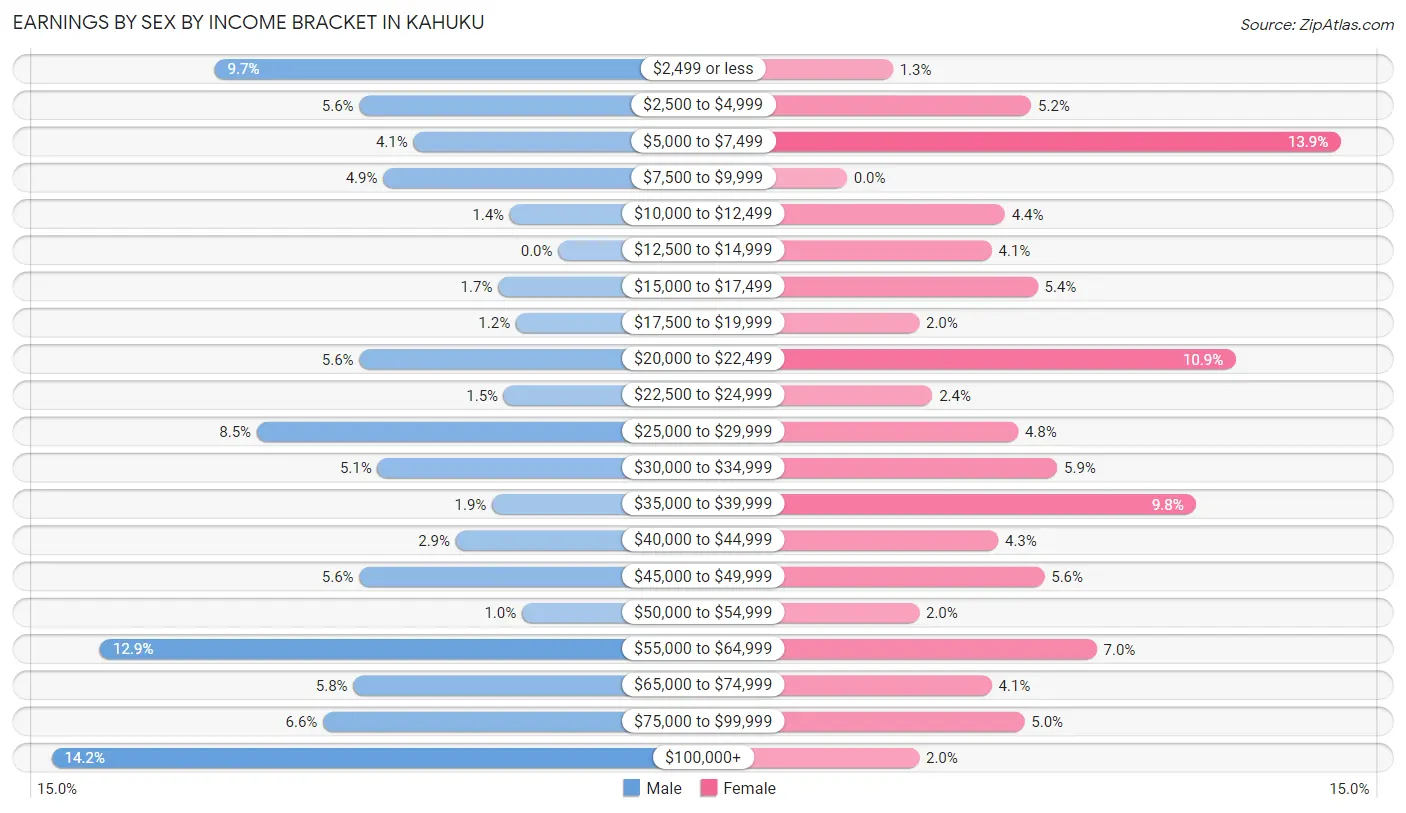
Earnings by Sex by Income Bracket in Kahuku
The most common earnings brackets in Kahuku are $100,000+ for men (84 | 14.2%) and $5,000 to $7,499 for women (75 | 13.9%).
| Income | Male | Female |
| $2,499 or less | 57 (9.7%) | 7 (1.3%) |
| $2,500 to $4,999 | 33 (5.6%) | 28 (5.2%) |
| $5,000 to $7,499 | 24 (4.1%) | 75 (13.9%) |
| $7,500 to $9,999 | 29 (4.9%) | 0 (0.0%) |
| $10,000 to $12,499 | 8 (1.4%) | 24 (4.4%) |
| $12,500 to $14,999 | 0 (0.0%) | 22 (4.1%) |
| $15,000 to $17,499 | 10 (1.7%) | 29 (5.4%) |
| $17,500 to $19,999 | 7 (1.2%) | 11 (2.0%) |
| $20,000 to $22,499 | 33 (5.6%) | 59 (10.9%) |
| $22,500 to $24,999 | 9 (1.5%) | 13 (2.4%) |
| $25,000 to $29,999 | 50 (8.5%) | 26 (4.8%) |
| $30,000 to $34,999 | 30 (5.1%) | 32 (5.9%) |
| $35,000 to $39,999 | 11 (1.9%) | 53 (9.8%) |
| $40,000 to $44,999 | 17 (2.9%) | 23 (4.3%) |
| $45,000 to $49,999 | 33 (5.6%) | 30 (5.6%) |
| $50,000 to $54,999 | 6 (1.0%) | 11 (2.0%) |
| $55,000 to $64,999 | 76 (12.9%) | 38 (7.0%) |
| $65,000 to $74,999 | 34 (5.8%) | 22 (4.1%) |
| $75,000 to $99,999 | 39 (6.6%) | 27 (5.0%) |
| $100,000+ | 84 (14.2%) | 11 (2.0%) |
| Total | 590 (100.0%) | 541 (100.0%) |
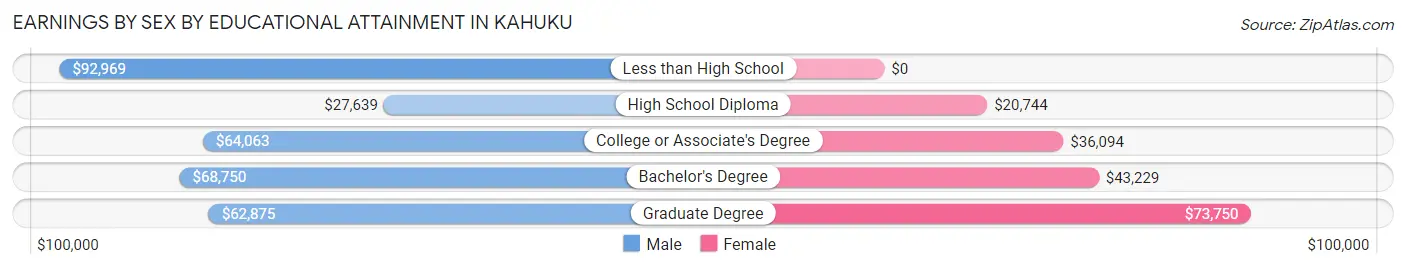
Earnings by Sex by Educational Attainment in Kahuku
Average earnings in Kahuku are $48,906 for men and $33,462 for women, a difference of 31.6%. Men with an educational attainment of less than high school enjoy the highest average annual earnings of $92,969, while those with high school diploma education earn the least with $27,639. Women with an educational attainment of graduate degree earn the most with the average annual earnings of $73,750, while those with high school diploma education have the smallest earnings of $20,744.
| Educational Attainment | Male Income | Female Income |
| Less than High School | $92,969 | $0 |
| High School Diploma | $27,639 | $20,744 |
| College or Associate's Degree | $64,063 | $36,094 |
| Bachelor's Degree | $68,750 | $43,229 |
| Graduate Degree | $62,875 | $73,750 |
| Total | $48,906 | $33,462 |
Family Income in Kahuku
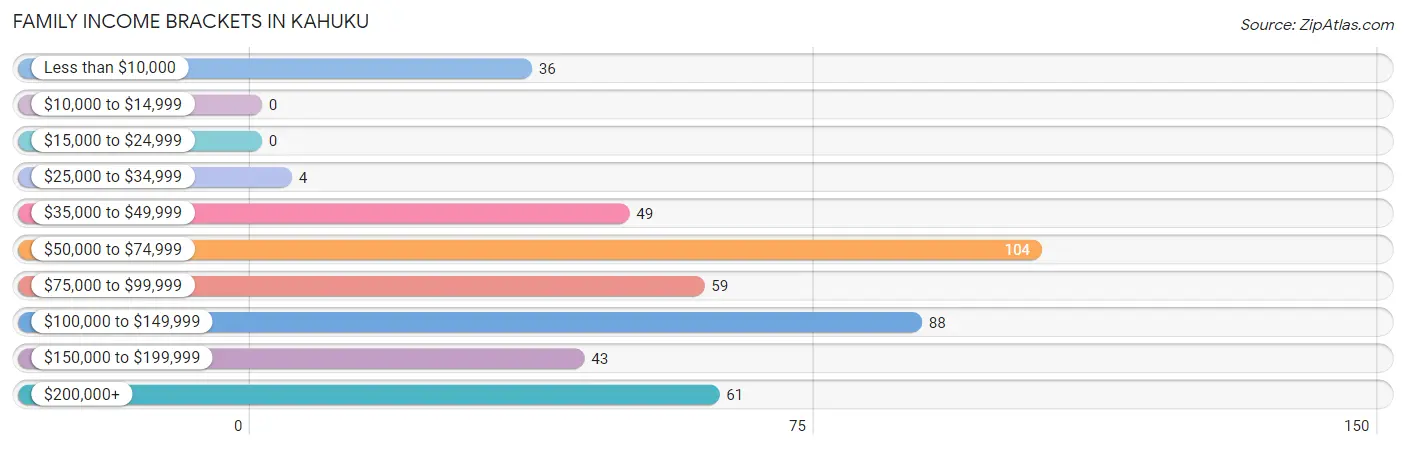
Family Income Brackets in Kahuku
According to the Kahuku family income data, there are 104 families falling into the $50,000 to $74,999 income range, which is the most common income bracket and makes up 23.4% of all families.
| Income Bracket | # Families | % Families |
| Less than $10,000 | 36 | 8.1% |
| $10,000 to $14,999 | 0 | 0.0% |
| $15,000 to $24,999 | 0 | 0.0% |
| $25,000 to $34,999 | 4 | 0.9% |
| $35,000 to $49,999 | 49 | 11.0% |
| $50,000 to $74,999 | 104 | 23.4% |
| $75,000 to $99,999 | 59 | 13.3% |
| $100,000 to $149,999 | 88 | 19.8% |
| $150,000 to $199,999 | 43 | 9.7% |
| $200,000+ | 61 | 13.7% |
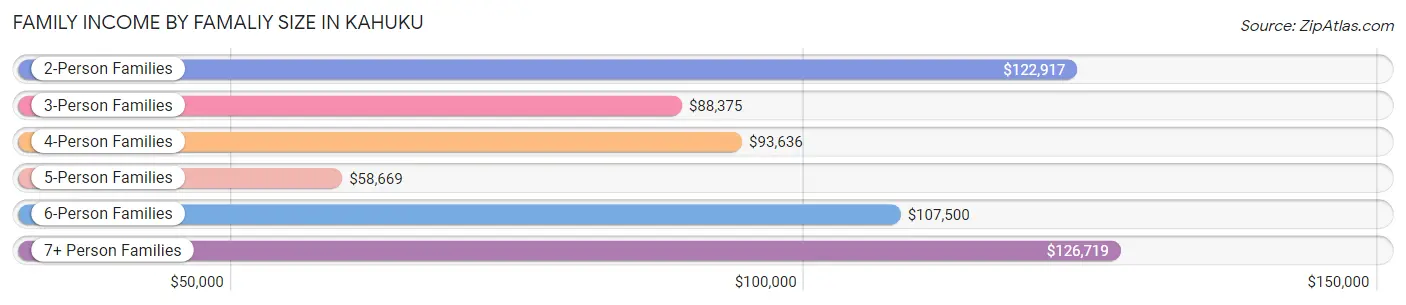
Family Income by Famaliy Size in Kahuku
7+ person families (47 | 10.6%) account for the highest median family income in Kahuku with $126,719 per family, while 2-person families (77 | 17.3%) have the highest median income of $61,458 per family member.
| Income Bracket | # Families | Median Income |
| 2-Person Families | 77 (17.3%) | $122,917 |
| 3-Person Families | 85 (19.1%) | $88,375 |
| 4-Person Families | 146 (32.9%) | $93,636 |
| 5-Person Families | 67 (15.1%) | $58,669 |
| 6-Person Families | 22 (5.0%) | $107,500 |
| 7+ Person Families | 47 (10.6%) | $126,719 |
| Total | 444 (100.0%) | $90,227 |
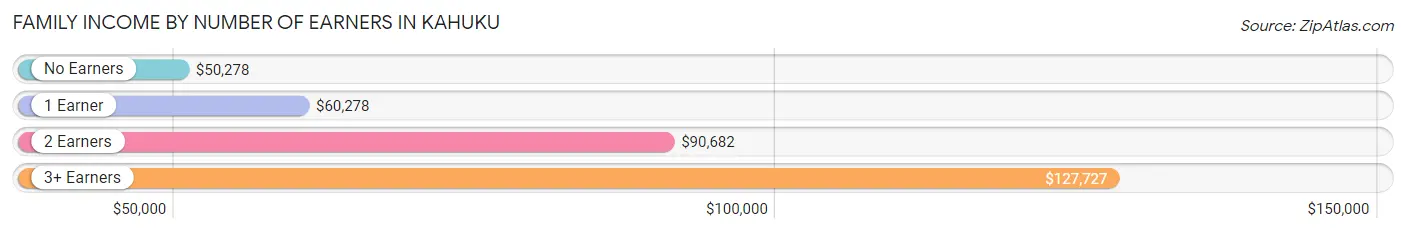
Family Income by Number of Earners in Kahuku
The median family income in Kahuku is $90,227, with families comprising 3+ earners (142) having the highest median family income of $127,727, while families with no earners (34) have the lowest median family income of $50,278, accounting for 32.0% and 7.7% of families, respectively.
| Number of Earners | # Families | Median Income |
| No Earners | 34 (7.7%) | $50,278 |
| 1 Earner | 62 (14.0%) | $60,278 |
| 2 Earners | 206 (46.4%) | $90,682 |
| 3+ Earners | 142 (32.0%) | $127,727 |
| Total | 444 (100.0%) | $90,227 |
Household Income in Kahuku
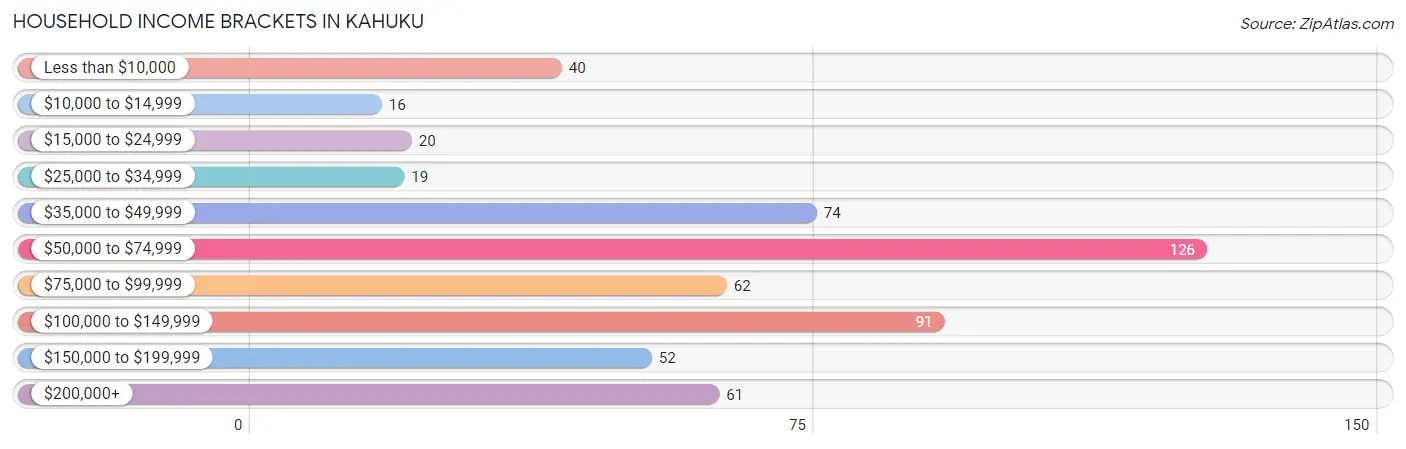
Household Income Brackets in Kahuku
With 126 households falling in the category, the $50,000 to $74,999 income range is the most frequent in Kahuku, accounting for 22.5% of all households. In contrast, only 16 households (2.9%) fall into the $10,000 to $14,999 income bracket, making it the least populous group.
| Income Bracket | # Households | % Households |
| Less than $10,000 | 40 | 7.1% |
| $10,000 to $14,999 | 16 | 2.9% |
| $15,000 to $24,999 | 20 | 3.6% |
| $25,000 to $34,999 | 19 | 3.4% |
| $35,000 to $49,999 | 74 | 13.2% |
| $50,000 to $74,999 | 126 | 22.5% |
| $75,000 to $99,999 | 62 | 11.1% |
| $100,000 to $149,999 | 91 | 16.2% |
| $150,000 to $199,999 | 52 | 9.3% |
| $200,000+ | 61 | 10.9% |
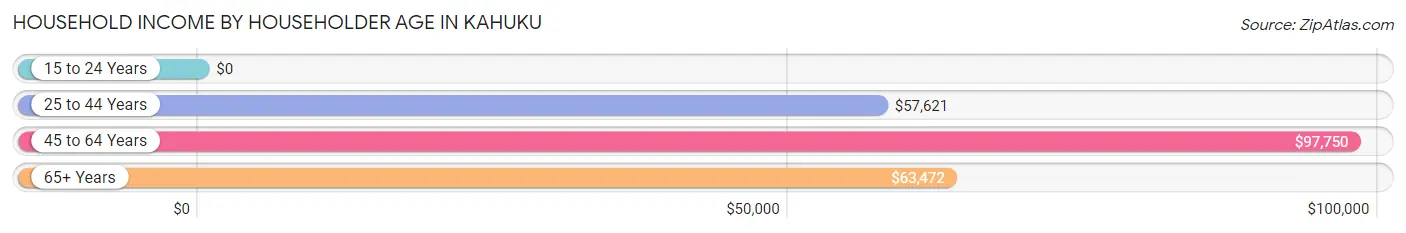
Household Income by Householder Age in Kahuku
The median household income in Kahuku is $71,758, with the highest median household income of $97,750 found in the 45 to 64 years age bracket for the primary householder. A total of 243 households (43.3%) fall into this category.
| Income Bracket | # Households | Median Income |
| 15 to 24 Years | 0 (0.0%) | $0 |
| 25 to 44 Years | 161 (28.7%) | $57,621 |
| 45 to 64 Years | 243 (43.3%) | $97,750 |
| 65+ Years | 157 (28.0%) | $63,472 |
| Total | 561 (100.0%) | $71,758 |
Poverty in Kahuku
Income Below Poverty by Sex and Age in Kahuku
With 5.4% poverty level for males and 12.3% for females among the residents of Kahuku, 5 year old males and under 5 year old females are the most vulnerable to poverty, with 3 males (42.9%) and 69 females (34.8%) in their respective age groups living below the poverty level.
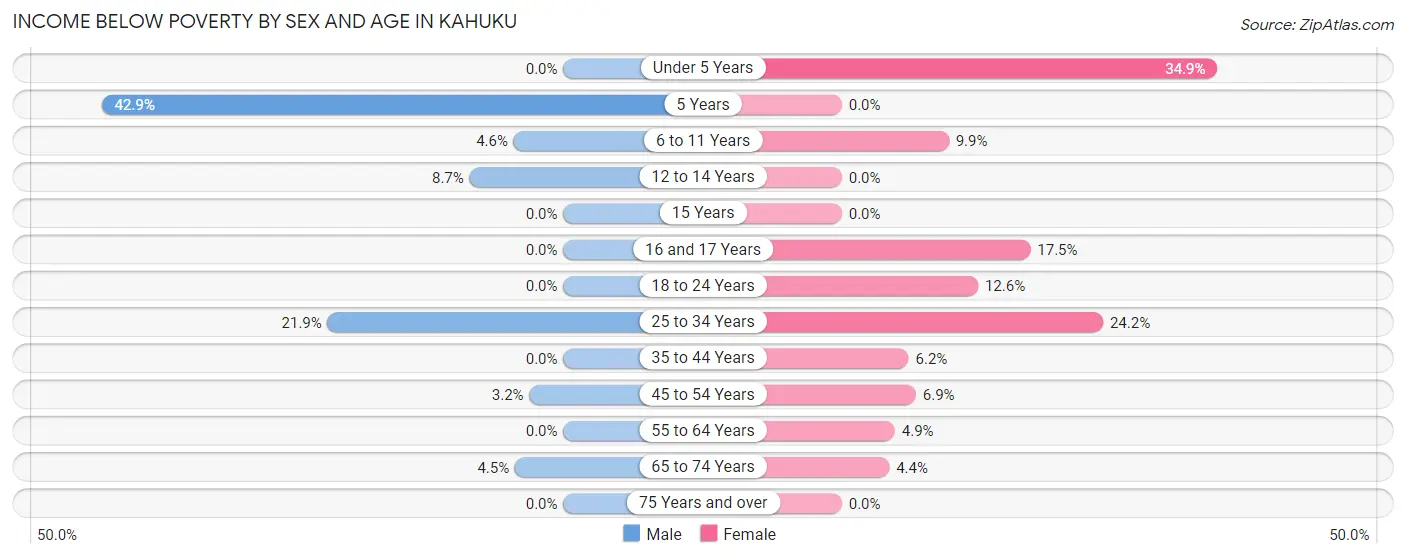
| Age Bracket | Male | Female |
| Under 5 Years | 0 (0.0%) | 69 (34.8%) |
| 5 Years | 3 (42.9%) | 0 (0.0%) |
| 6 to 11 Years | 4 (4.6%) | 12 (9.9%) |
| 12 to 14 Years | 4 (8.7%) | 0 (0.0%) |
| 15 Years | 0 (0.0%) | 0 (0.0%) |
| 16 and 17 Years | 0 (0.0%) | 7 (17.5%) |
| 18 to 24 Years | 0 (0.0%) | 11 (12.6%) |
| 25 to 34 Years | 35 (21.9%) | 32 (24.2%) |
| 35 to 44 Years | 0 (0.0%) | 8 (6.2%) |
| 45 to 54 Years | 4 (3.2%) | 9 (6.9%) |
| 55 to 64 Years | 0 (0.0%) | 6 (4.9%) |
| 65 to 74 Years | 3 (4.5%) | 4 (4.4%) |
| 75 Years and over | 0 (0.0%) | 0 (0.0%) |
| Total | 53 (5.4%) | 158 (12.3%) |
Income Above Poverty by Sex and Age in Kahuku
According to the poverty statistics in Kahuku, males aged under 5 years and females aged 5 years are the age groups that are most secure financially, with 100.0% of males and 100.0% of females in these age groups living above the poverty line.
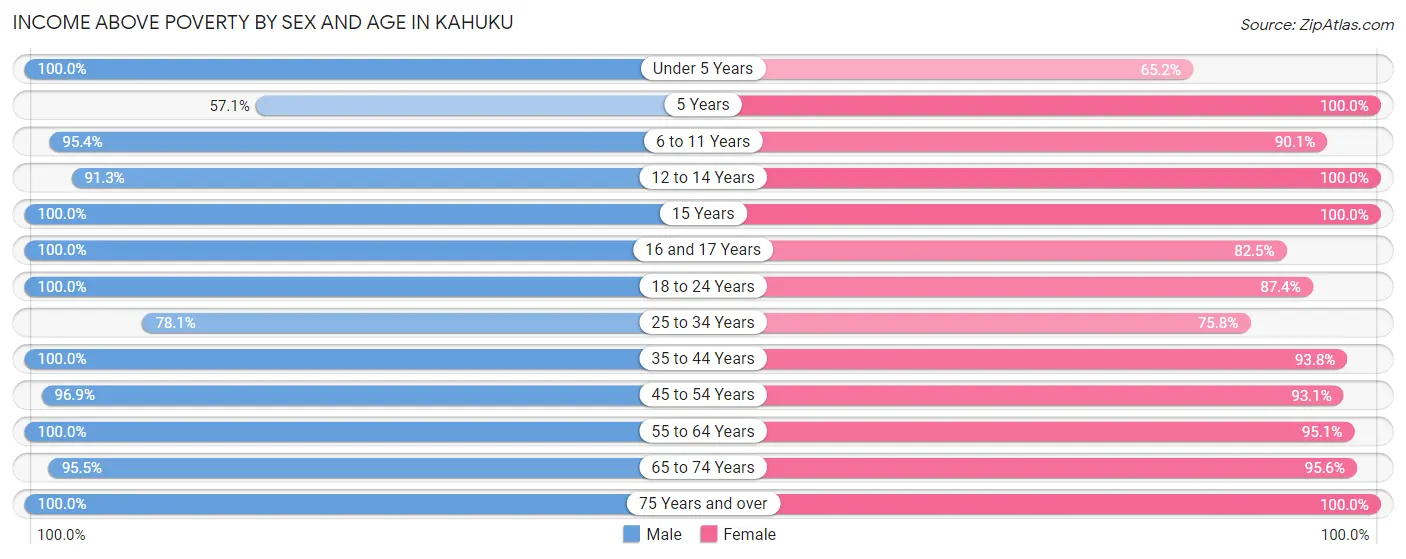
| Age Bracket | Male | Female |
| Under 5 Years | 102 (100.0%) | 129 (65.1%) |
| 5 Years | 4 (57.1%) | 37 (100.0%) |
| 6 to 11 Years | 83 (95.4%) | 109 (90.1%) |
| 12 to 14 Years | 42 (91.3%) | 100 (100.0%) |
| 15 Years | 11 (100.0%) | 32 (100.0%) |
| 16 and 17 Years | 32 (100.0%) | 33 (82.5%) |
| 18 to 24 Years | 129 (100.0%) | 76 (87.4%) |
| 25 to 34 Years | 125 (78.1%) | 100 (75.8%) |
| 35 to 44 Years | 96 (100.0%) | 121 (93.8%) |
| 45 to 54 Years | 123 (96.9%) | 122 (93.1%) |
| 55 to 64 Years | 72 (100.0%) | 116 (95.1%) |
| 65 to 74 Years | 64 (95.5%) | 87 (95.6%) |
| 75 Years and over | 37 (100.0%) | 62 (100.0%) |
| Total | 920 (94.6%) | 1,124 (87.7%) |
Income Below Poverty Among Married-Couple Families in Kahuku
The poverty statistics for married-couple families in Kahuku show that 11.4% or 36 of the total 315 families live below the poverty line. Families with 1 or 2 children have the highest poverty rate of 20.1%, comprising of 32 families. On the other hand, families with no children have the lowest poverty rate of 0.0%, which includes 0 families.
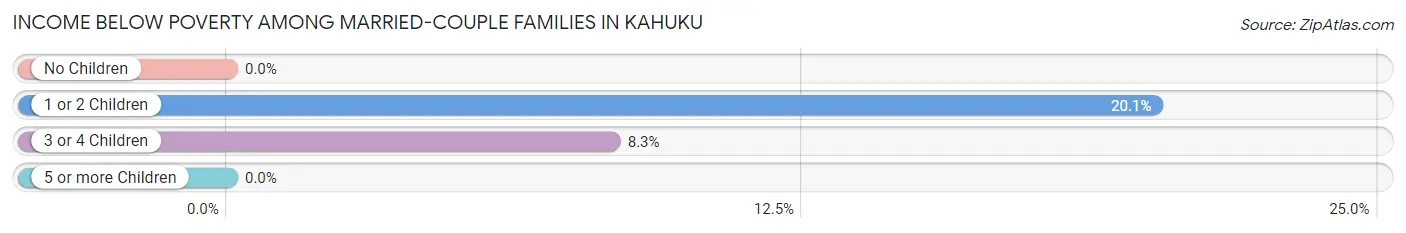
| Children | Above Poverty | Below Poverty |
| No Children | 104 (100.0%) | 0 (0.0%) |
| 1 or 2 Children | 127 (79.9%) | 32 (20.1%) |
| 3 or 4 Children | 44 (91.7%) | 4 (8.3%) |
| 5 or more Children | 4 (100.0%) | 0 (0.0%) |
| Total | 279 (88.6%) | 36 (11.4%) |
Income Below Poverty Among Single-Parent Households in Kahuku
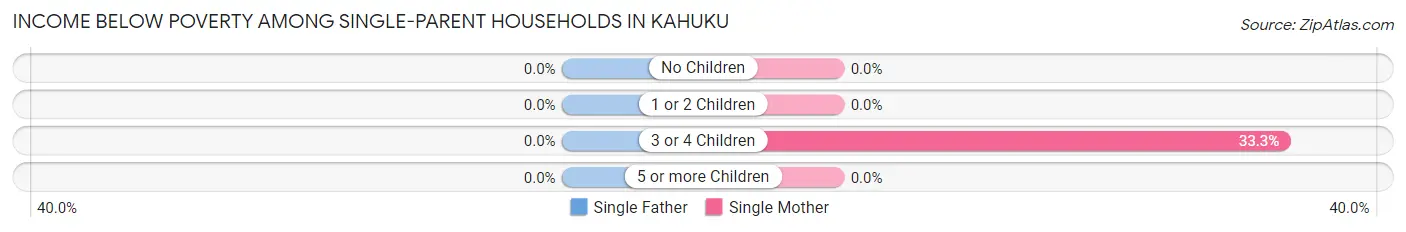
| Children | Single Father | Single Mother |
| No Children | 0 (0.0%) | 0 (0.0%) |
| 1 or 2 Children | 0 (0.0%) | 0 (0.0%) |
| 3 or 4 Children | 0 (0.0%) | 4 (33.3%) |
| 5 or more Children | 0 (0.0%) | 0 (0.0%) |
| Total | 0 (0.0%) | 4 (4.0%) |
Income Below Poverty Among Married-Couple vs Single-Parent Households in Kahuku
The poverty data for Kahuku shows that 36 of the married-couple family households (11.4%) and 4 of the single-parent households (3.1%) are living below the poverty level. Within the married-couple family households, those with 1 or 2 children have the highest poverty rate, with 32 households (20.1%) falling below the poverty line. Among the single-parent households, those with 3 or 4 children have the highest poverty rate, with 4 household (33.3%) living below poverty.
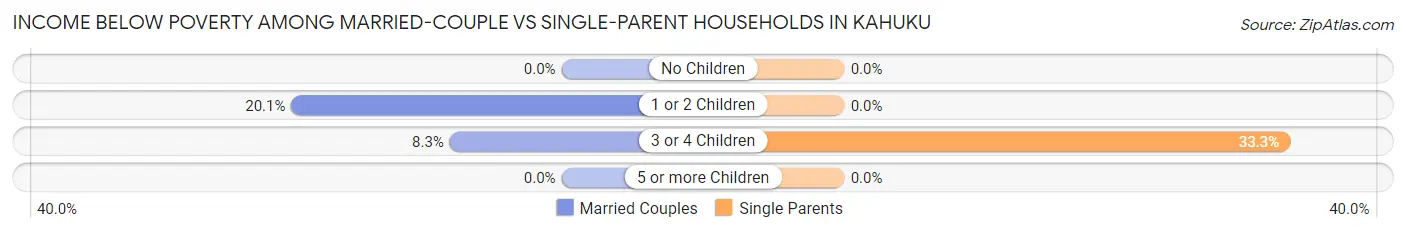
| Children | Married-Couple Families | Single-Parent Households |
| No Children | 0 (0.0%) | 0 (0.0%) |
| 1 or 2 Children | 32 (20.1%) | 0 (0.0%) |
| 3 or 4 Children | 4 (8.3%) | 4 (33.3%) |
| 5 or more Children | 0 (0.0%) | 0 (0.0%) |
| Total | 36 (11.4%) | 4 (3.1%) |
Race in Kahuku
The most populous races in Kahuku are Two or more Races (906 | 39.8%), Hawaiian / Pacific (632 | 27.8%), and Asian (351 | 15.4%).
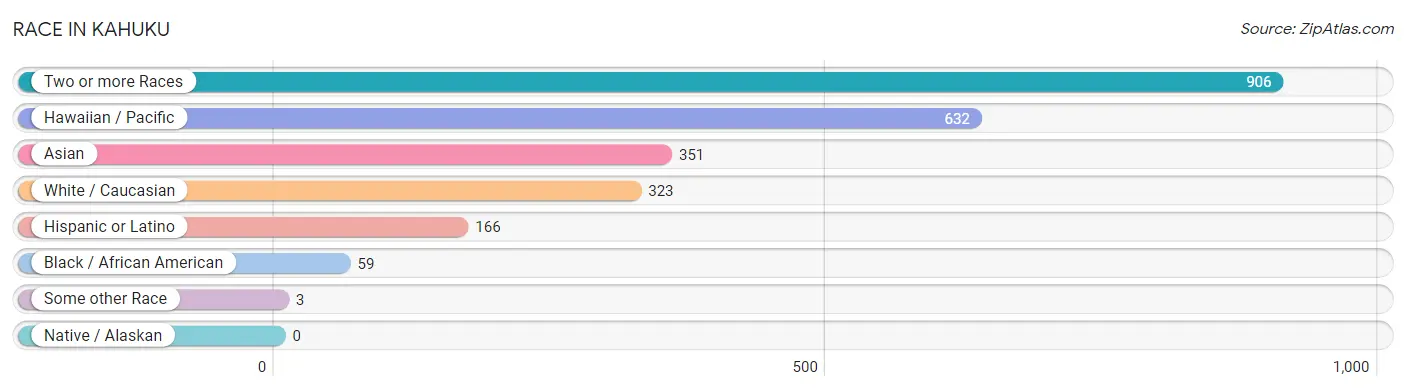
| Race | # Population | % Population |
| Asian | 351 | 15.4% |
| Black / African American | 59 | 2.6% |
| Hawaiian / Pacific | 632 | 27.8% |
| Hispanic or Latino | 166 | 7.3% |
| Native / Alaskan | 0 | 0.0% |
| White / Caucasian | 323 | 14.2% |
| Two or more Races | 906 | 39.8% |
| Some other Race | 3 | 0.1% |
| Total | 2,274 | 100.0% |
Ancestry in Kahuku
The most populous ancestries reported in Kahuku are Native Hawaiian (956 | 42.0%), Korean (753 | 33.1%), Samoan (462 | 20.3%), Indian (Asian) (344 | 15.1%), and Tongan (238 | 10.5%), together accounting for 121.1% of all Kahuku residents.
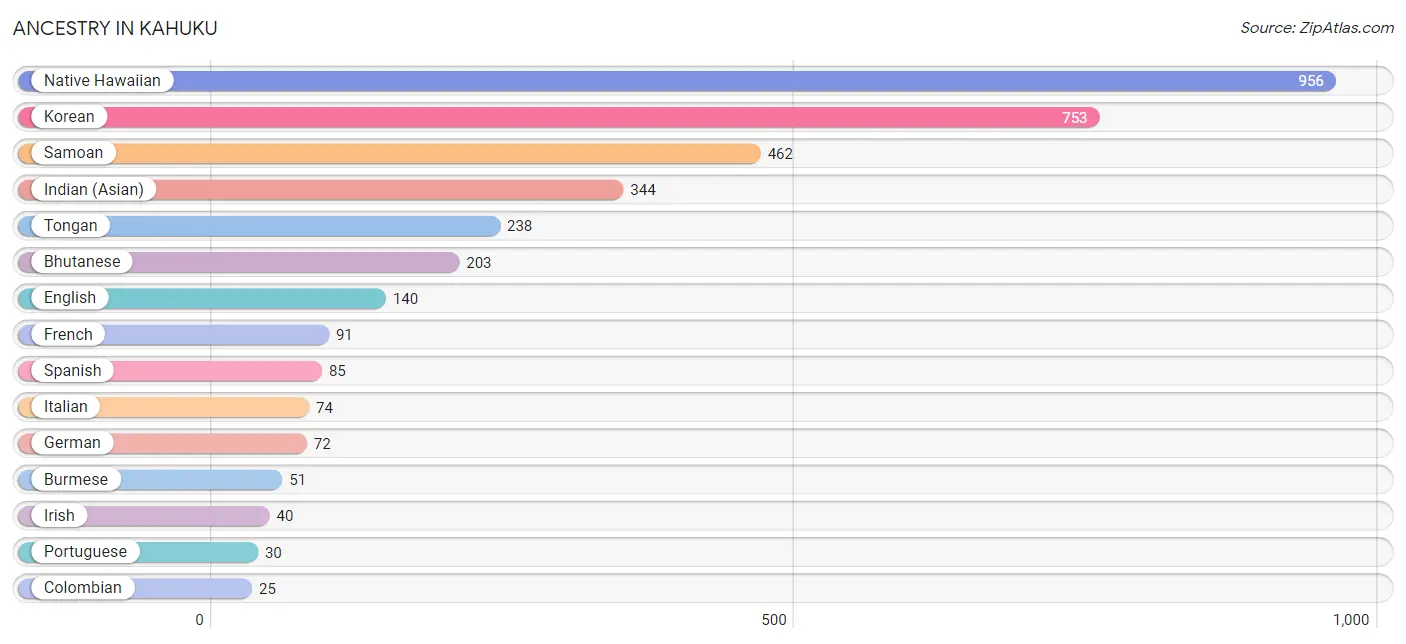
| Ancestry | # Population | % Population |
| American | 3 | 0.1% |
| Bhutanese | 203 | 8.9% |
| British | 3 | 0.1% |
| Burmese | 51 | 2.2% |
| Colombian | 25 | 1.1% |
| English | 140 | 6.2% |
| European | 9 | 0.4% |
| Fijian | 9 | 0.4% |
| French | 91 | 4.0% |
| French American Indian | 5 | 0.2% |
| German | 72 | 3.2% |
| Icelander | 10 | 0.4% |
| Indian (Asian) | 344 | 15.1% |
| Irish | 40 | 1.8% |
| Italian | 74 | 3.3% |
| Korean | 753 | 33.1% |
| Mexican | 18 | 0.8% |
| Native Hawaiian | 956 | 42.0% |
| Portuguese | 30 | 1.3% |
| Puerto Rican | 17 | 0.7% |
| Samoan | 462 | 20.3% |
| Scotch-Irish | 14 | 0.6% |
| Scottish | 2 | 0.1% |
| South American | 25 | 1.1% |
| Spanish | 85 | 3.7% |
| Spanish American | 13 | 0.6% |
| Sri Lankan | 3 | 0.1% |
| Swedish | 25 | 1.1% |
| Tongan | 238 | 10.5% |
| Welsh | 10 | 0.4% | View All 30 Rows |
Immigrants in Kahuku
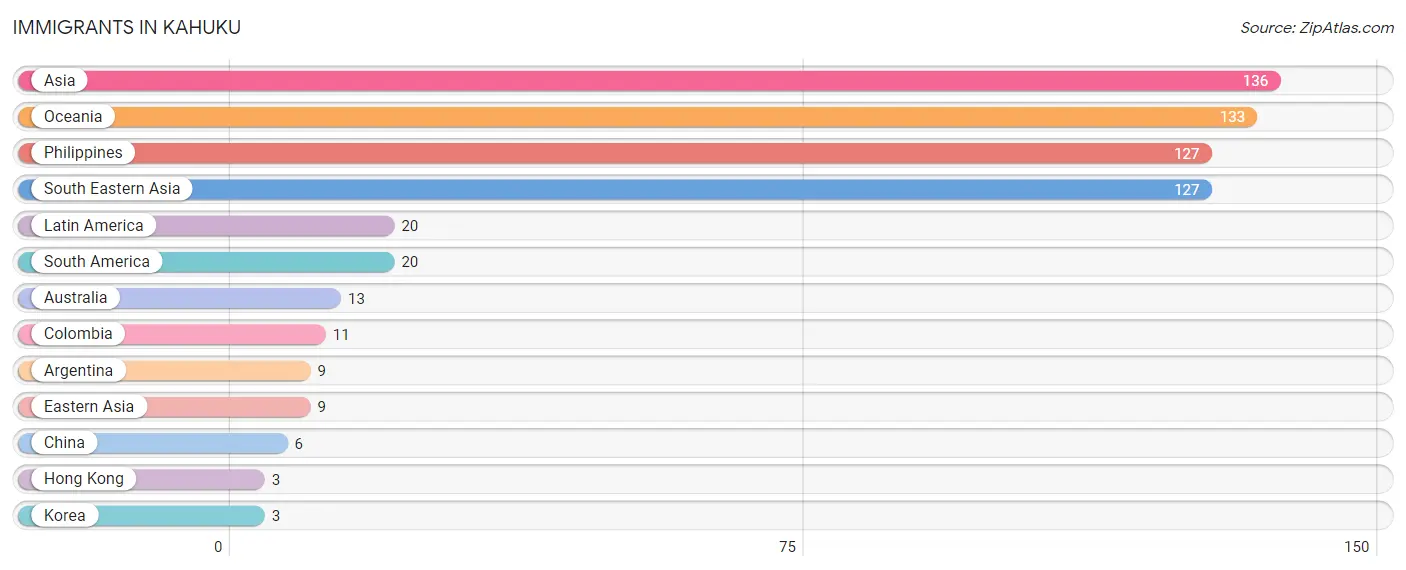
The most numerous immigrant groups reported in Kahuku came from Asia (136 | 6.0%), Oceania (133 | 5.9%), Philippines (127 | 5.6%), South Eastern Asia (127 | 5.6%), and Latin America (20 | 0.9%), together accounting for 23.9% of all Kahuku residents.
| Immigration Origin | # Population | % Population |
| Argentina | 9 | 0.4% |
| Asia | 136 | 6.0% |
| Australia | 13 | 0.6% |
| China | 6 | 0.3% |
| Colombia | 11 | 0.5% |
| Eastern Asia | 9 | 0.4% |
| Hong Kong | 3 | 0.1% |
| Korea | 3 | 0.1% |
| Latin America | 20 | 0.9% |
| Oceania | 133 | 5.9% |
| Philippines | 127 | 5.6% |
| South America | 20 | 0.9% |
| South Eastern Asia | 127 | 5.6% | View All 13 Rows |
Sex and Age in Kahuku
Sex and Age in Kahuku
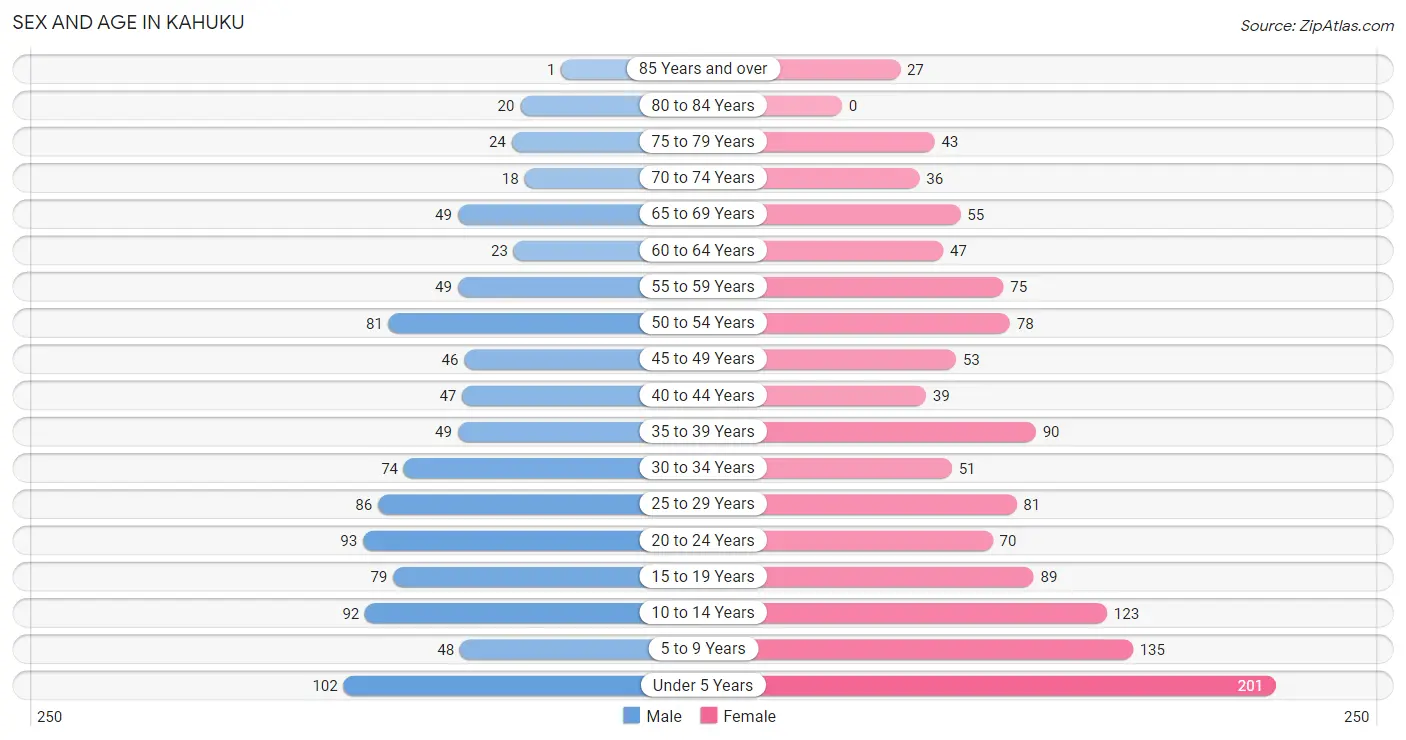
The most populous age groups in Kahuku are Under 5 Years (102 | 10.4%) for men and Under 5 Years (201 | 15.5%) for women.
| Age Bracket | Male | Female |
| Under 5 Years | 102 (10.4%) | 201 (15.5%) |
| 5 to 9 Years | 48 (4.9%) | 135 (10.4%) |
| 10 to 14 Years | 92 (9.4%) | 123 (9.5%) |
| 15 to 19 Years | 79 (8.1%) | 89 (6.9%) |
| 20 to 24 Years | 93 (9.5%) | 70 (5.4%) |
| 25 to 29 Years | 86 (8.8%) | 81 (6.3%) |
| 30 to 34 Years | 74 (7.5%) | 51 (3.9%) |
| 35 to 39 Years | 49 (5.0%) | 90 (7.0%) |
| 40 to 44 Years | 47 (4.8%) | 39 (3.0%) |
| 45 to 49 Years | 46 (4.7%) | 53 (4.1%) |
| 50 to 54 Years | 81 (8.3%) | 78 (6.0%) |
| 55 to 59 Years | 49 (5.0%) | 75 (5.8%) |
| 60 to 64 Years | 23 (2.3%) | 47 (3.6%) |
| 65 to 69 Years | 49 (5.0%) | 55 (4.3%) |
| 70 to 74 Years | 18 (1.8%) | 36 (2.8%) |
| 75 to 79 Years | 24 (2.5%) | 43 (3.3%) |
| 80 to 84 Years | 20 (2.0%) | 0 (0.0%) |
| 85 Years and over | 1 (0.1%) | 27 (2.1%) |
| Total | 981 (100.0%) | 1,293 (100.0%) |
Families and Households in Kahuku
Median Family Size in Kahuku
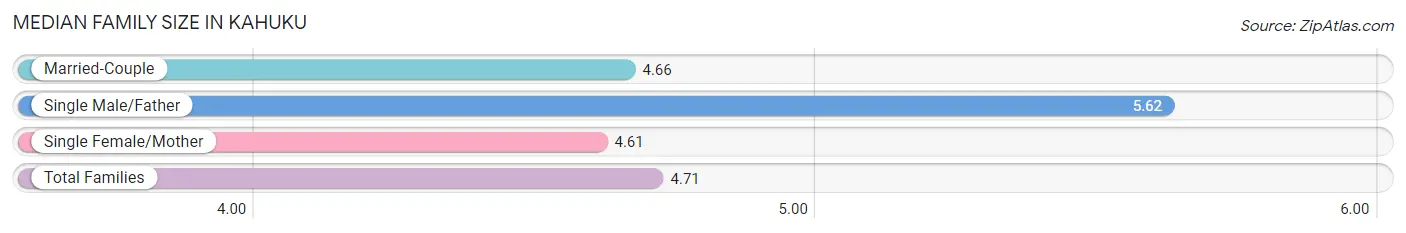
The median family size in Kahuku is 4.71 persons per family, with single male/father families (29 | 6.5%) accounting for the largest median family size of 5.62 persons per family. On the other hand, single female/mother families (100 | 22.5%) represent the smallest median family size with 4.61 persons per family.
| Family Type | # Families | Family Size |
| Married-Couple | 315 (71.0%) | 4.66 |
| Single Male/Father | 29 (6.5%) | 5.62 |
| Single Female/Mother | 100 (22.5%) | 4.61 |
| Total Families | 444 (100.0%) | 4.71 |
Median Household Size in Kahuku
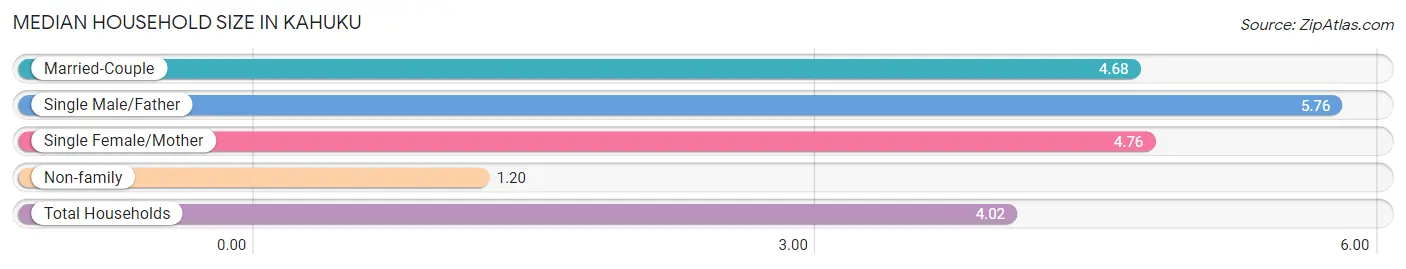
The median household size in Kahuku is 4.02 persons per household, with single male/father households (29 | 5.2%) accounting for the largest median household size of 5.76 persons per household. non-family households (117 | 20.9%) represent the smallest median household size with 1.20 persons per household.
| Household Type | # Households | Household Size |
| Married-Couple | 315 (56.1%) | 4.68 |
| Single Male/Father | 29 (5.2%) | 5.76 |
| Single Female/Mother | 100 (17.8%) | 4.76 |
| Non-family | 117 (20.9%) | 1.20 |
| Total Households | 561 (100.0%) | 4.02 |
Household Size by Marriage Status in Kahuku
Out of a total of 561 households in Kahuku, 444 (79.1%) are family households, while 117 (20.9%) are nonfamily households. The most numerous type of family households are 4-person households, comprising 143, and the most common type of nonfamily households are 1-person households, comprising 100.
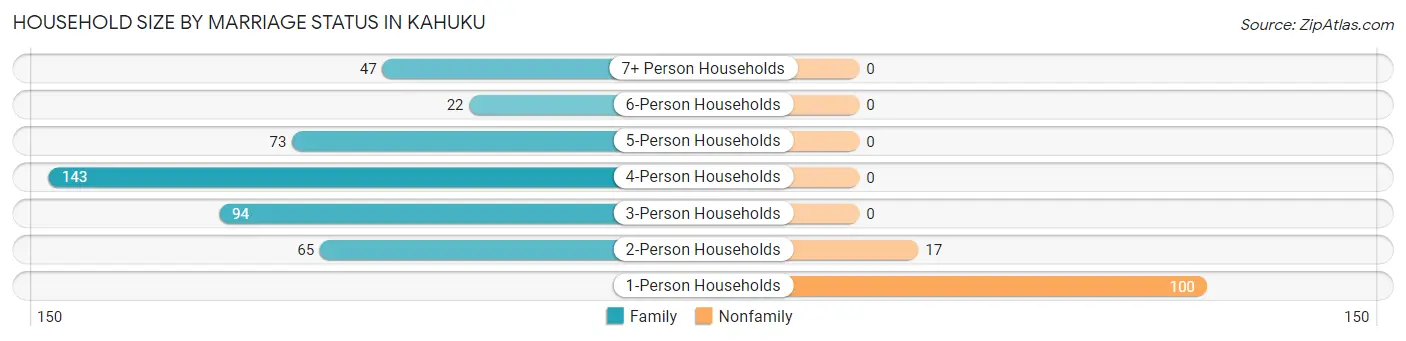
| Household Size | Family Households | Nonfamily Households |
| 1-Person Households | - | 100 (17.8%) |
| 2-Person Households | 65 (11.6%) | 17 (3.0%) |
| 3-Person Households | 94 (16.8%) | 0 (0.0%) |
| 4-Person Households | 143 (25.5%) | 0 (0.0%) |
| 5-Person Households | 73 (13.0%) | 0 (0.0%) |
| 6-Person Households | 22 (3.9%) | 0 (0.0%) |
| 7+ Person Households | 47 (8.4%) | 0 (0.0%) |
| Total | 444 (79.1%) | 117 (20.9%) |
Female Fertility in Kahuku
Fertility by Age in Kahuku
Average fertility rate in Kahuku is 80.0 births per 1,000 women. Women in the age bracket of 20 to 34 years have the highest fertility rate with 114.0 births per 1,000 women. Women in the age bracket of 20 to 34 years acount for 56.1% of all women with births.
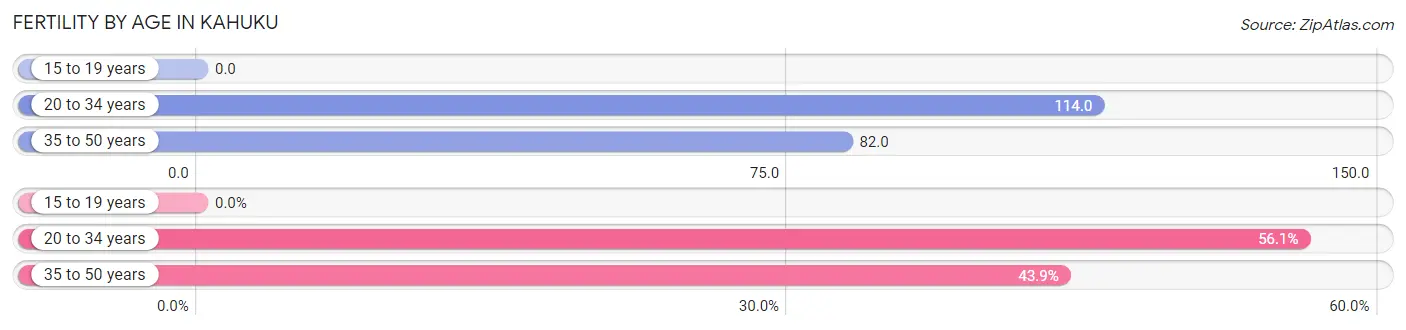
| Age Bracket | Women with Births | Births / 1,000 Women |
| 15 to 19 years | 0 (0.0%) | 0.0 |
| 20 to 34 years | 23 (56.1%) | 114.0 |
| 35 to 50 years | 18 (43.9%) | 82.0 |
| Total | 41 (100.0%) | 80.0 |
Fertility by Age by Marriage Status in Kahuku
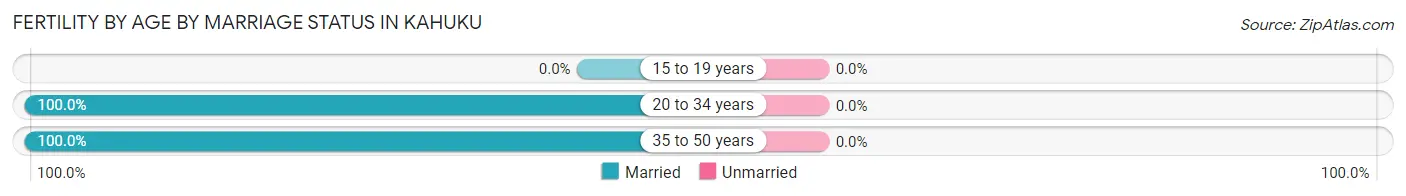
| Age Bracket | Married | Unmarried |
| 15 to 19 years | 0 (0.0%) | 0 (0.0%) |
| 20 to 34 years | 23 (100.0%) | 0 (0.0%) |
| 35 to 50 years | 18 (100.0%) | 0 (0.0%) |
| Total | 41 (100.0%) | 0 (0.0%) |
Fertility by Education in Kahuku
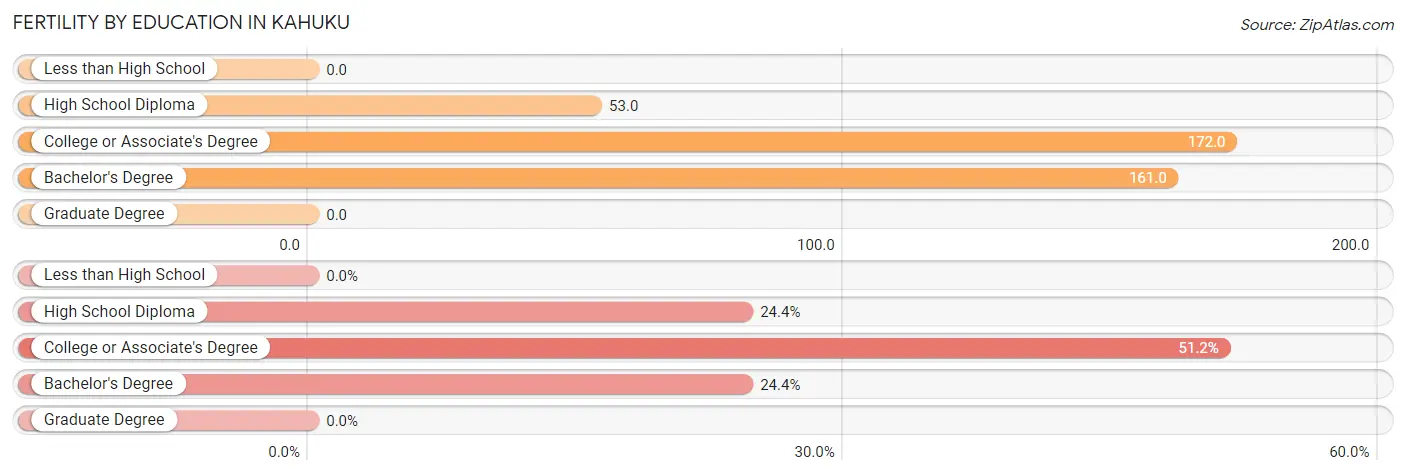
| Educational Attainment | Women with Births | Births / 1,000 Women |
| Less than High School | 0 (0.0%) | 0.0 |
| High School Diploma | 10 (24.4%) | 53.0 |
| College or Associate's Degree | 21 (51.2%) | 172.0 |
| Bachelor's Degree | 10 (24.4%) | 161.0 |
| Graduate Degree | 0 (0.0%) | 0.0 |
| Total | 41 (100.0%) | 80.0 |
Fertility by Education by Marriage Status in Kahuku
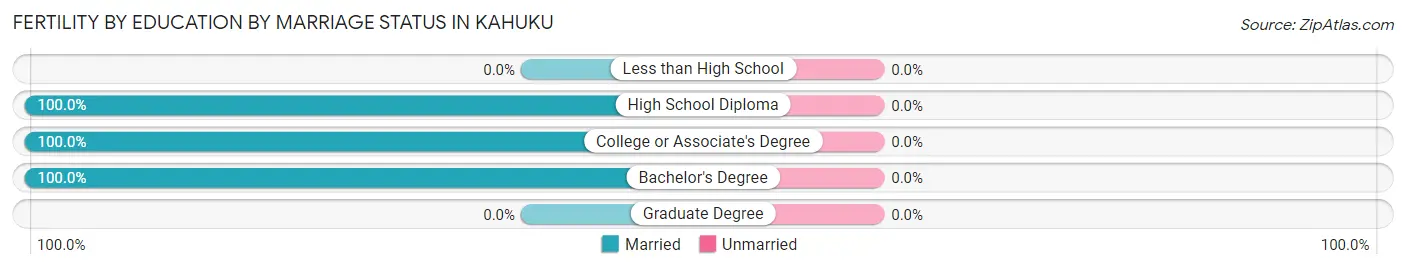
| Educational Attainment | Married | Unmarried |
| Less than High School | 0 (0.0%) | 0 (0.0%) |
| High School Diploma | 10 (100.0%) | 0 (0.0%) |
| College or Associate's Degree | 21 (100.0%) | 0 (0.0%) |
| Bachelor's Degree | 10 (100.0%) | 0 (0.0%) |
| Graduate Degree | 0 (0.0%) | 0 (0.0%) |
| Total | 41 (100.0%) | 0 (0.0%) |
Employment Characteristics in Kahuku
Employment by Class of Employer in Kahuku
Among the 879 employed individuals in Kahuku, private company employees (482 | 54.8%), not-for-profit organizations (142 | 16.2%), and state government employees (119 | 13.5%) make up the most common classes of employment.
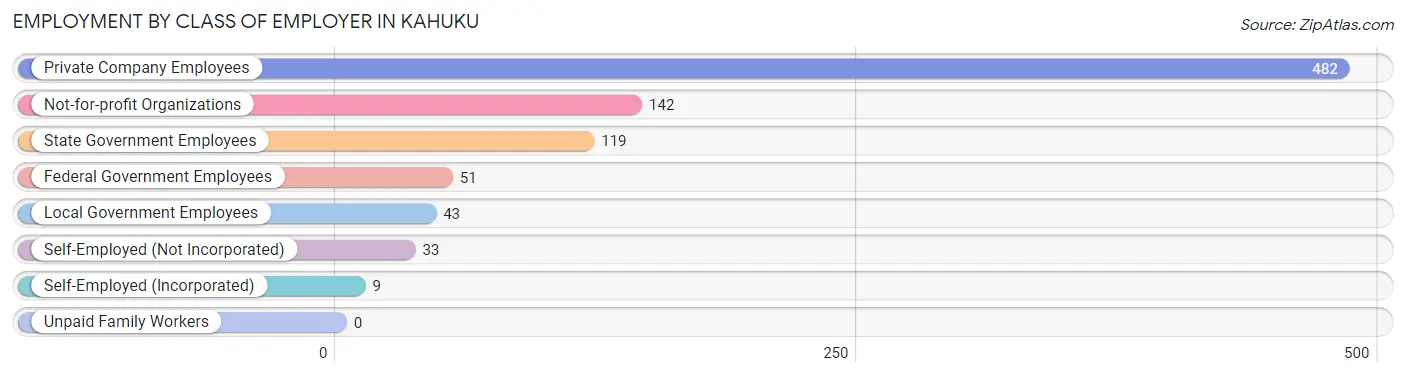
| Employer Class | # Employees | % Employees |
| Private Company Employees | 482 | 54.8% |
| Self-Employed (Incorporated) | 9 | 1.0% |
| Self-Employed (Not Incorporated) | 33 | 3.7% |
| Not-for-profit Organizations | 142 | 16.2% |
| Local Government Employees | 43 | 4.9% |
| State Government Employees | 119 | 13.5% |
| Federal Government Employees | 51 | 5.8% |
| Unpaid Family Workers | 0 | 0.0% |
| Total | 879 | 100.0% |
Employment Status by Age in Kahuku
According to the labor force statistics for Kahuku, out of the total population over 16 years of age (1,530), 66.1% or 1,011 individuals are in the labor force, with 12.2% or 123 of them unemployed. The age group with the highest labor force participation rate is 55 to 59 years, with 86.3% or 107 individuals in the labor force. Within the labor force, the 60 to 64 years age range has the highest percentage of unemployed individuals, with 31.0% or 9 of them being unemployed.
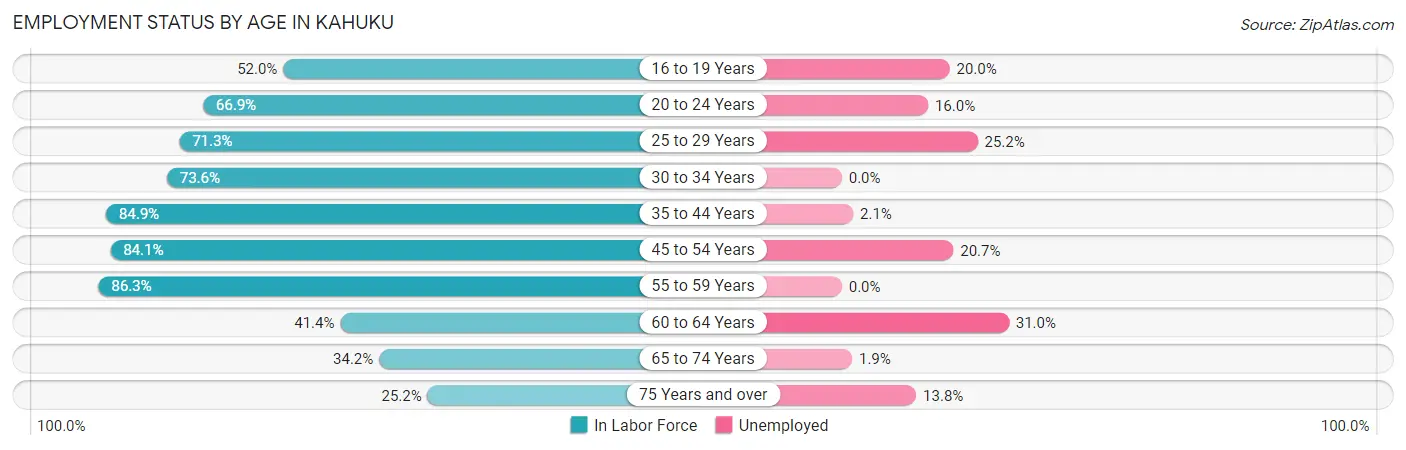
| Age Bracket | In Labor Force | Unemployed |
| 16 to 19 Years | 65 (52.0%) | 13 (20.0%) |
| 20 to 24 Years | 109 (66.9%) | 17 (16.0%) |
| 25 to 29 Years | 119 (71.3%) | 30 (25.2%) |
| 30 to 34 Years | 92 (73.6%) | 0 (0.0%) |
| 35 to 44 Years | 191 (84.9%) | 4 (2.1%) |
| 45 to 54 Years | 217 (84.1%) | 45 (20.7%) |
| 55 to 59 Years | 107 (86.3%) | 0 (0.0%) |
| 60 to 64 Years | 29 (41.4%) | 9 (31.0%) |
| 65 to 74 Years | 54 (34.2%) | 1 (1.9%) |
| 75 Years and over | 29 (25.2%) | 4 (13.8%) |
| Total | 1,011 (66.1%) | 123 (12.2%) |
Employment Status by Educational Attainment in Kahuku
According to labor force statistics for Kahuku, 77.9% of individuals (755) out of the total population between 25 and 64 years of age (969) are in the labor force, with 11.7% or 88 of them being unemployed. The group with the highest labor force participation rate are those with the educational attainment of bachelor's degree or higher, with 94.4% or 236 individuals in the labor force. Within the labor force, individuals with high school diploma education have the highest percentage of unemployment, with 22.4% or 58 of them being unemployed.
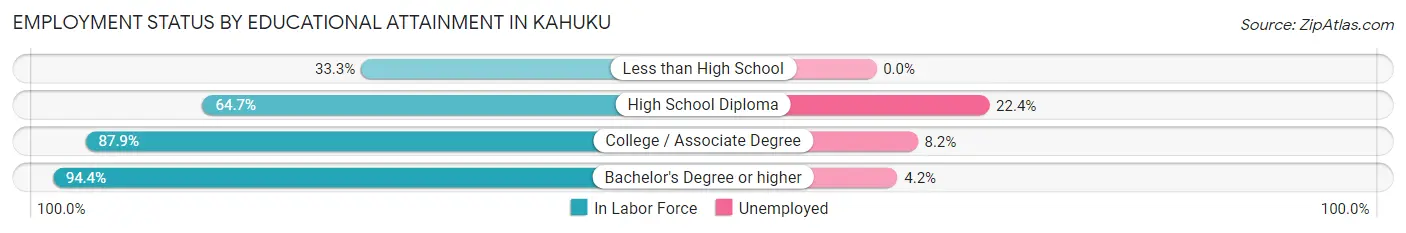
| Educational Attainment | In Labor Force | Unemployed |
| Less than High School | 12 (33.3%) | 0 (0.0%) |
| High School Diploma | 260 (64.7%) | 90 (22.4%) |
| College / Associate Degree | 247 (87.9%) | 23 (8.2%) |
| Bachelor's Degree or higher | 236 (94.4%) | 10 (4.2%) |
| Total | 755 (77.9%) | 113 (11.7%) |
Employment Occupations by Sex in Kahuku
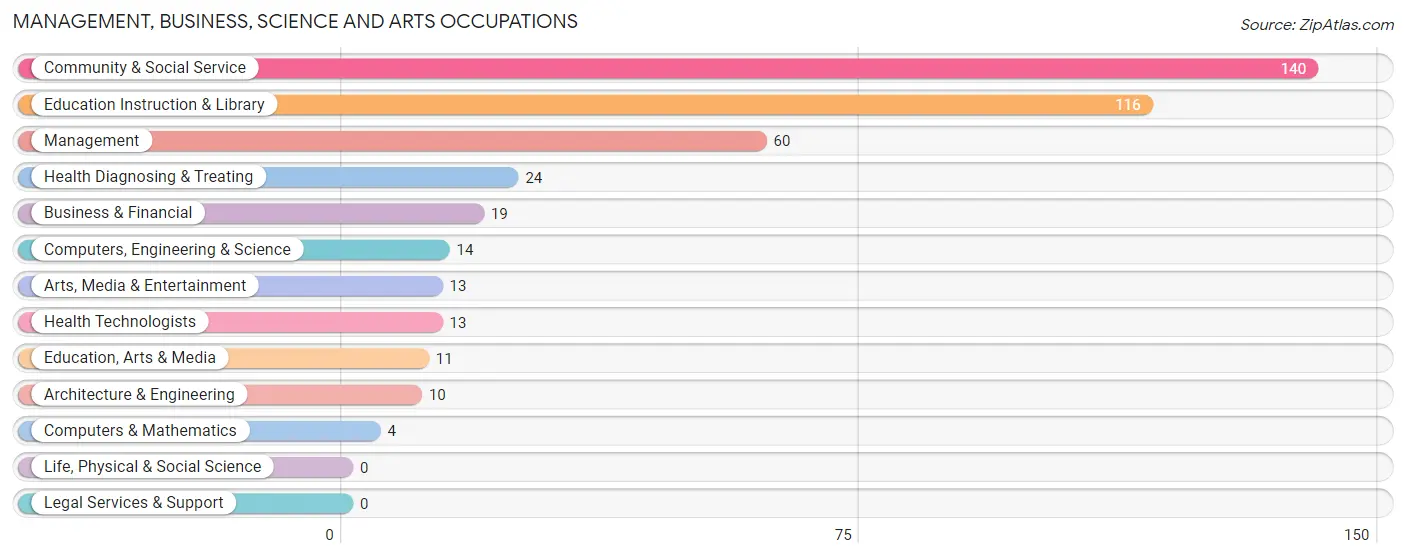
Management, Business, Science and Arts Occupations
The most common Management, Business, Science and Arts occupations in Kahuku are Community & Social Service (140 | 16.0%), Education Instruction & Library (116 | 13.2%), Management (60 | 6.8%), Health Diagnosing & Treating (24 | 2.7%), and Business & Financial (19 | 2.2%).
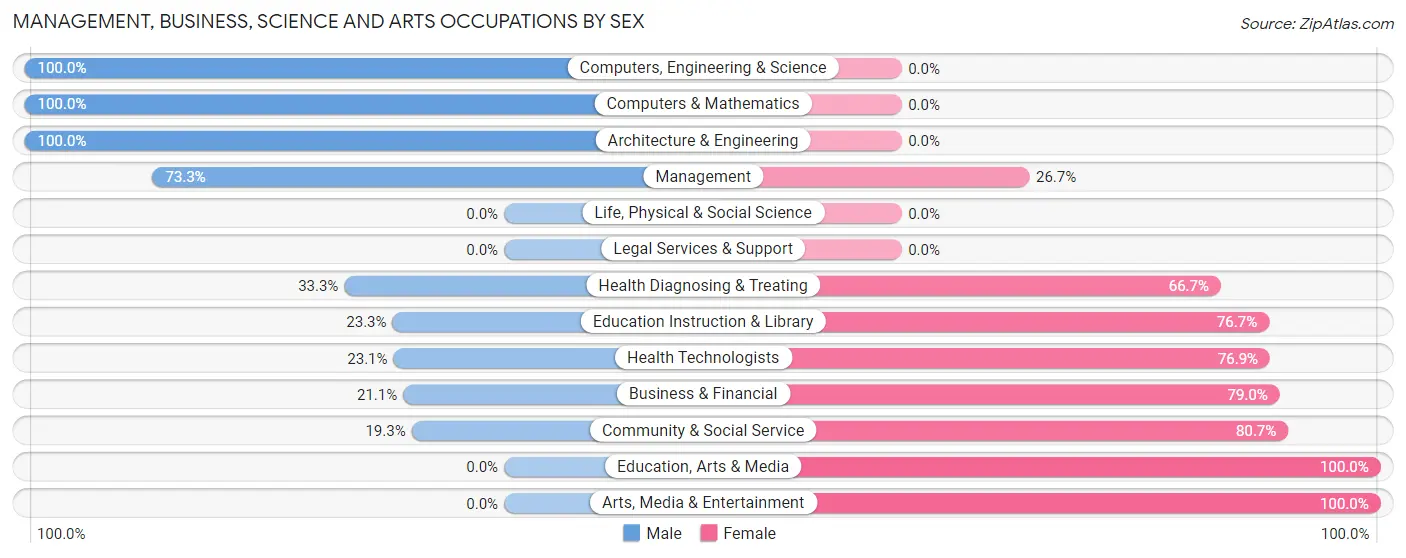
Management, Business, Science and Arts Occupations by Sex
Within the Management, Business, Science and Arts occupations in Kahuku, the most male-oriented occupations are Computers, Engineering & Science (100.0%), Computers & Mathematics (100.0%), and Architecture & Engineering (100.0%), while the most female-oriented occupations are Education, Arts & Media (100.0%), Arts, Media & Entertainment (100.0%), and Community & Social Service (80.7%).
| Occupation | Male | Female |
| Management | 44 (73.3%) | 16 (26.7%) |
| Business & Financial | 4 (21.0%) | 15 (78.9%) |
| Computers, Engineering & Science | 14 (100.0%) | 0 (0.0%) |
| Computers & Mathematics | 4 (100.0%) | 0 (0.0%) |
| Architecture & Engineering | 10 (100.0%) | 0 (0.0%) |
| Life, Physical & Social Science | 0 (0.0%) | 0 (0.0%) |
| Community & Social Service | 27 (19.3%) | 113 (80.7%) |
| Education, Arts & Media | 0 (0.0%) | 11 (100.0%) |
| Legal Services & Support | 0 (0.0%) | 0 (0.0%) |
| Education Instruction & Library | 27 (23.3%) | 89 (76.7%) |
| Arts, Media & Entertainment | 0 (0.0%) | 13 (100.0%) |
| Health Diagnosing & Treating | 8 (33.3%) | 16 (66.7%) |
| Health Technologists | 3 (23.1%) | 10 (76.9%) |
| Total (Category) | 97 (37.7%) | 160 (62.3%) |
| Total (Overall) | 443 (50.5%) | 435 (49.5%) |
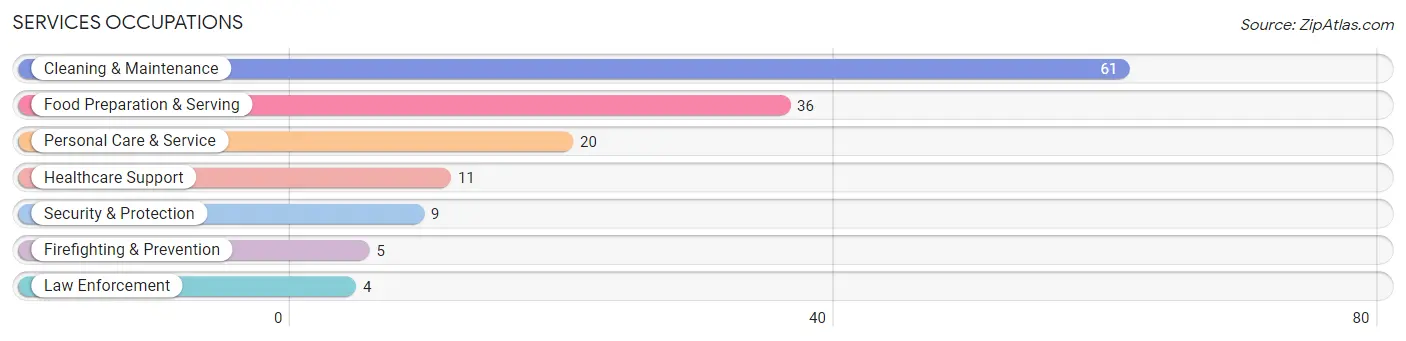
Services Occupations
The most common Services occupations in Kahuku are Cleaning & Maintenance (61 | 7.0%), Food Preparation & Serving (36 | 4.1%), Personal Care & Service (20 | 2.3%), Healthcare Support (11 | 1.3%), and Security & Protection (9 | 1.0%).
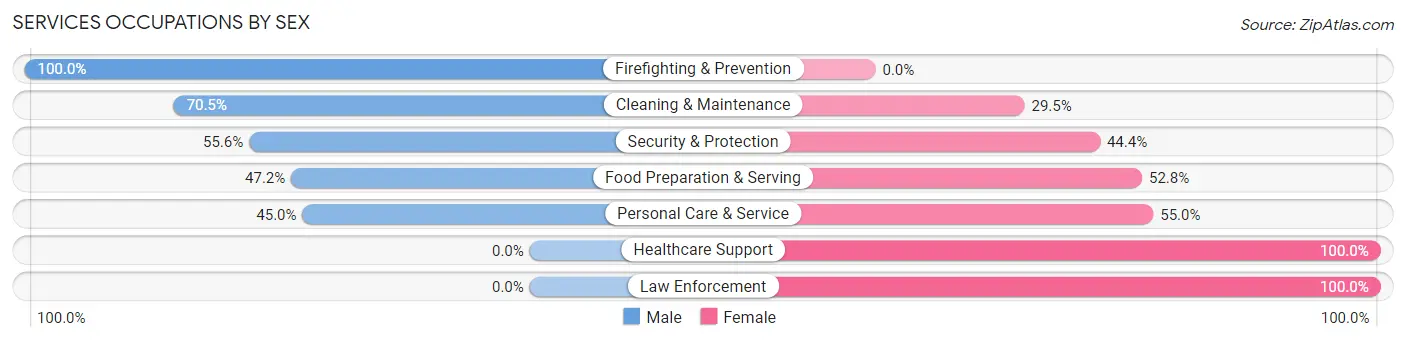
Services Occupations by Sex
Within the Services occupations in Kahuku, the most male-oriented occupations are Firefighting & Prevention (100.0%), Cleaning & Maintenance (70.5%), and Security & Protection (55.6%), while the most female-oriented occupations are Healthcare Support (100.0%), Law Enforcement (100.0%), and Personal Care & Service (55.0%).
| Occupation | Male | Female |
| Healthcare Support | 0 (0.0%) | 11 (100.0%) |
| Security & Protection | 5 (55.6%) | 4 (44.4%) |
| Firefighting & Prevention | 5 (100.0%) | 0 (0.0%) |
| Law Enforcement | 0 (0.0%) | 4 (100.0%) |
| Food Preparation & Serving | 17 (47.2%) | 19 (52.8%) |
| Cleaning & Maintenance | 43 (70.5%) | 18 (29.5%) |
| Personal Care & Service | 9 (45.0%) | 11 (55.0%) |
| Total (Category) | 74 (54.0%) | 63 (46.0%) |
| Total (Overall) | 443 (50.5%) | 435 (49.5%) |
Sales and Office Occupations
The most common Sales and Office occupations in Kahuku are Sales & Related (130 | 14.8%), and Office & Administration (105 | 12.0%).
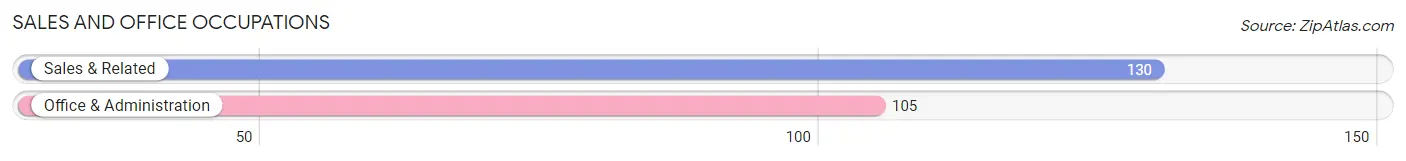
Sales and Office Occupations by Sex
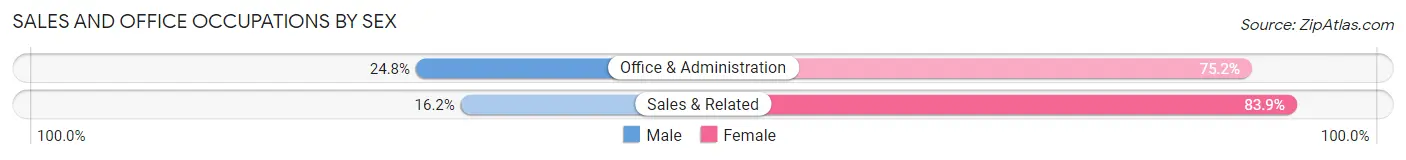
| Occupation | Male | Female |
| Sales & Related | 21 (16.2%) | 109 (83.9%) |
| Office & Administration | 26 (24.8%) | 79 (75.2%) |
| Total (Category) | 47 (20.0%) | 188 (80.0%) |
| Total (Overall) | 443 (50.5%) | 435 (49.5%) |
Natural Resources, Construction and Maintenance Occupations
The most common Natural Resources, Construction and Maintenance occupations in Kahuku are Construction & Extraction (160 | 18.2%), and Installation, Maintenance & Repair (19 | 2.2%).
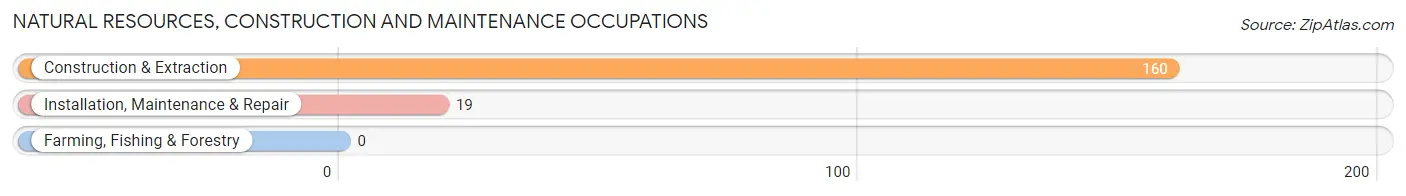
Natural Resources, Construction and Maintenance Occupations by Sex
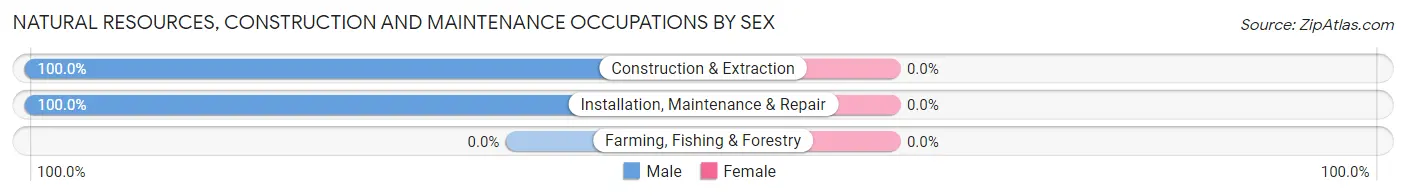
| Occupation | Male | Female |
| Farming, Fishing & Forestry | 0 (0.0%) | 0 (0.0%) |
| Construction & Extraction | 160 (100.0%) | 0 (0.0%) |
| Installation, Maintenance & Repair | 19 (100.0%) | 0 (0.0%) |
| Total (Category) | 179 (100.0%) | 0 (0.0%) |
| Total (Overall) | 443 (50.5%) | 435 (49.5%) |
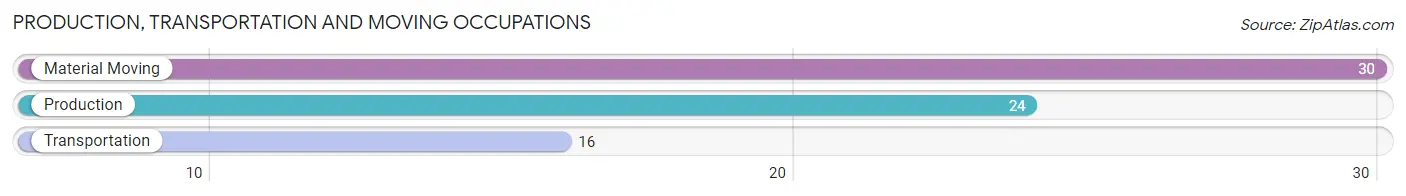
Production, Transportation and Moving Occupations
The most common Production, Transportation and Moving occupations in Kahuku are Material Moving (30 | 3.4%), Production (24 | 2.7%), and Transportation (16 | 1.8%).
Production, Transportation and Moving Occupations by Sex
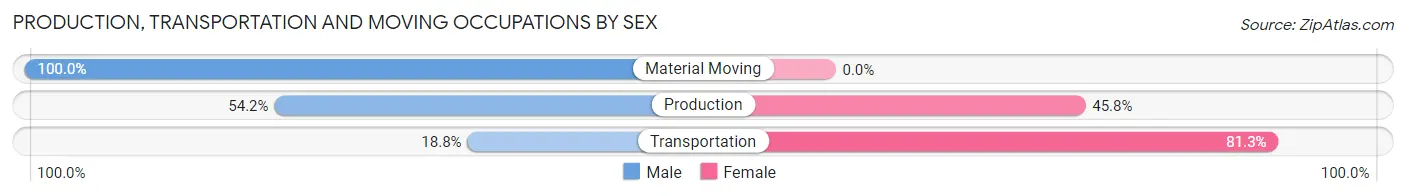
| Occupation | Male | Female |
| Production | 13 (54.2%) | 11 (45.8%) |
| Transportation | 3 (18.8%) | 13 (81.2%) |
| Material Moving | 30 (100.0%) | 0 (0.0%) |
| Total (Category) | 46 (65.7%) | 24 (34.3%) |
| Total (Overall) | 443 (50.5%) | 435 (49.5%) |
Employment Industries by Sex in Kahuku
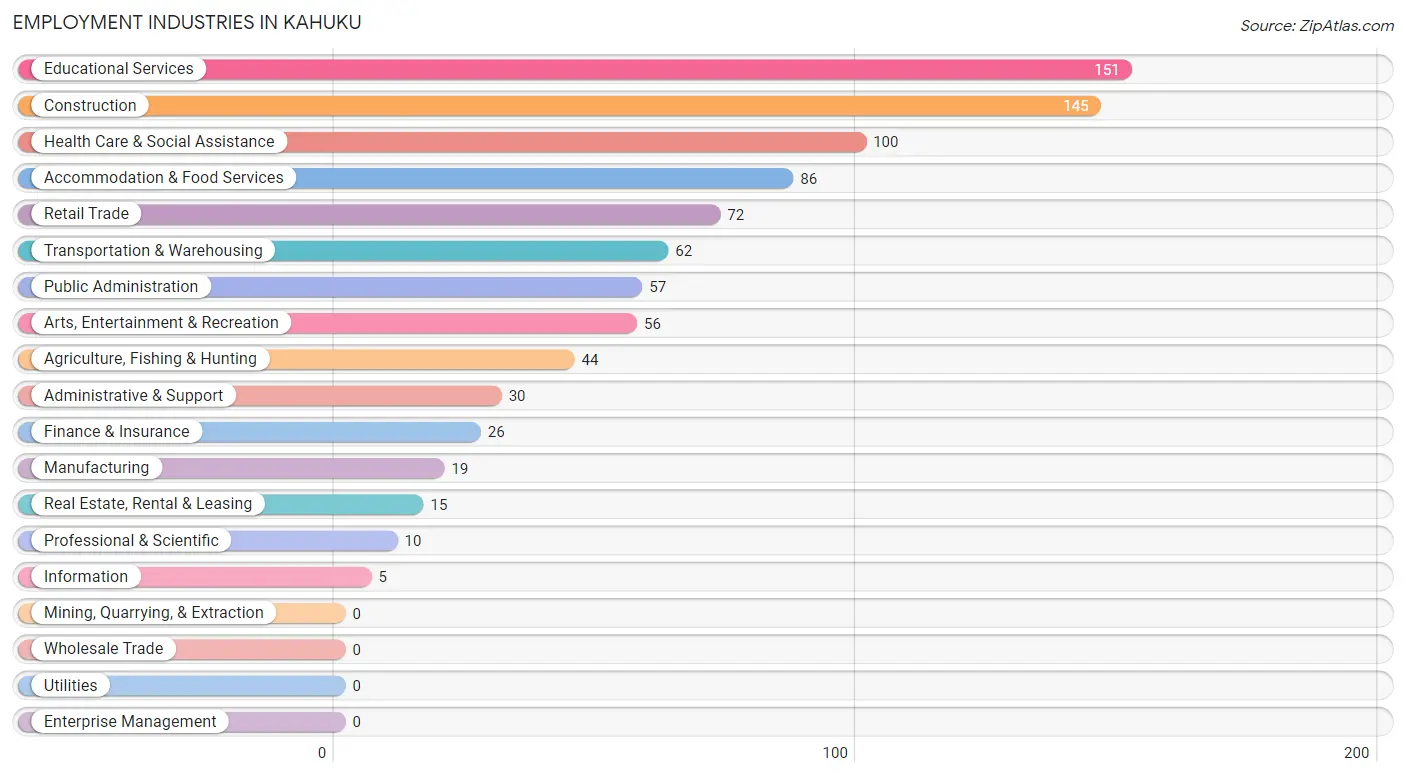
Employment Industries in Kahuku
The major employment industries in Kahuku include Educational Services (151 | 17.2%), Construction (145 | 16.5%), Health Care & Social Assistance (100 | 11.4%), Accommodation & Food Services (86 | 9.8%), and Retail Trade (72 | 8.2%).
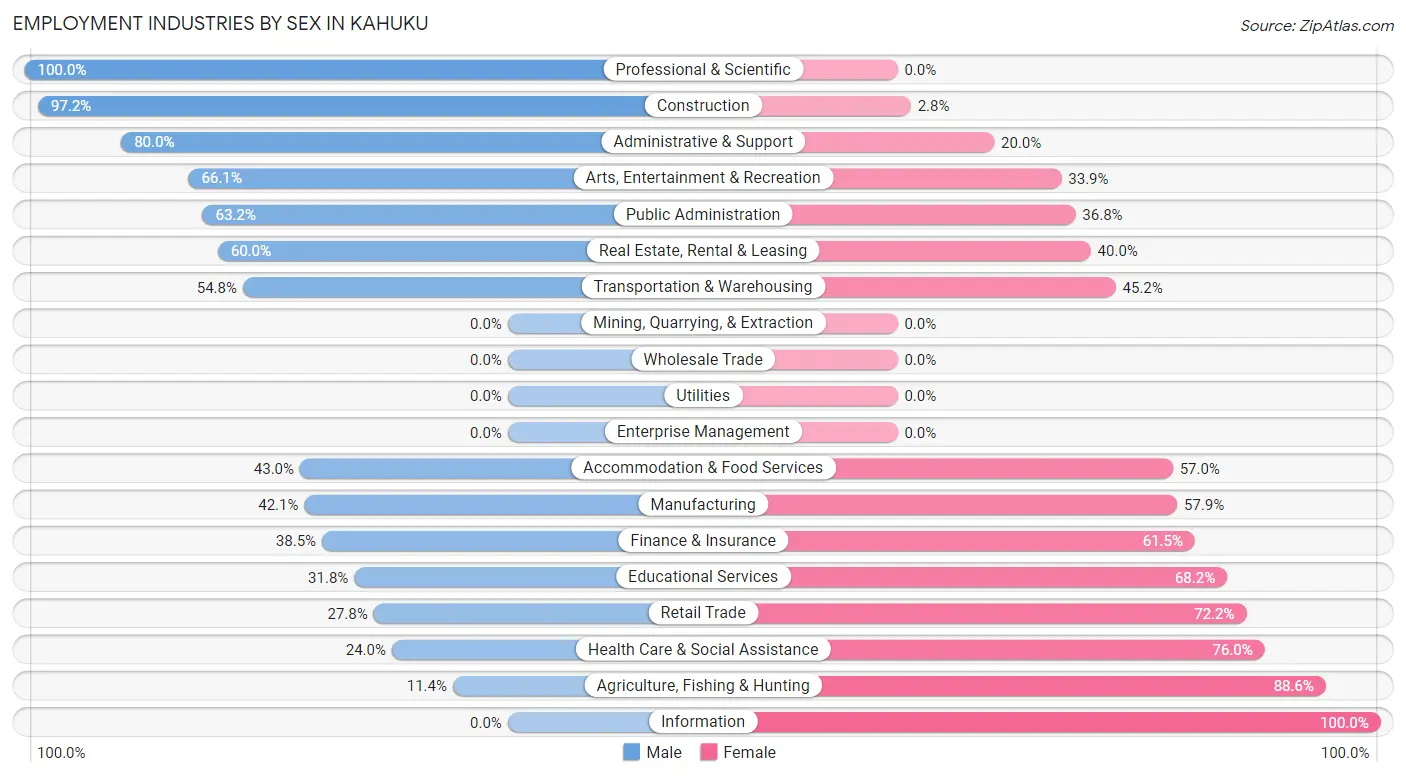
Employment Industries by Sex in Kahuku
The Kahuku industries that see more men than women are Professional & Scientific (100.0%), Construction (97.2%), and Administrative & Support (80.0%), whereas the industries that tend to have a higher number of women are Information (100.0%), Agriculture, Fishing & Hunting (88.6%), and Health Care & Social Assistance (76.0%).
| Industry | Male | Female |
| Agriculture, Fishing & Hunting | 5 (11.4%) | 39 (88.6%) |
| Mining, Quarrying, & Extraction | 0 (0.0%) | 0 (0.0%) |
| Construction | 141 (97.2%) | 4 (2.8%) |
| Manufacturing | 8 (42.1%) | 11 (57.9%) |
| Wholesale Trade | 0 (0.0%) | 0 (0.0%) |
| Retail Trade | 20 (27.8%) | 52 (72.2%) |
| Transportation & Warehousing | 34 (54.8%) | 28 (45.2%) |
| Utilities | 0 (0.0%) | 0 (0.0%) |
| Information | 0 (0.0%) | 5 (100.0%) |
| Finance & Insurance | 10 (38.5%) | 16 (61.5%) |
| Real Estate, Rental & Leasing | 9 (60.0%) | 6 (40.0%) |
| Professional & Scientific | 10 (100.0%) | 0 (0.0%) |
| Enterprise Management | 0 (0.0%) | 0 (0.0%) |
| Administrative & Support | 24 (80.0%) | 6 (20.0%) |
| Educational Services | 48 (31.8%) | 103 (68.2%) |
| Health Care & Social Assistance | 24 (24.0%) | 76 (76.0%) |
| Arts, Entertainment & Recreation | 37 (66.1%) | 19 (33.9%) |
| Accommodation & Food Services | 37 (43.0%) | 49 (57.0%) |
| Public Administration | 36 (63.2%) | 21 (36.8%) |
| Total | 443 (50.5%) | 435 (49.5%) |
Education in Kahuku
School Enrollment in Kahuku
The most common levels of schooling among the 591 students in Kahuku are elementary school (163 | 27.6%), high school (147 | 24.9%), and middle school (128 | 21.7%).
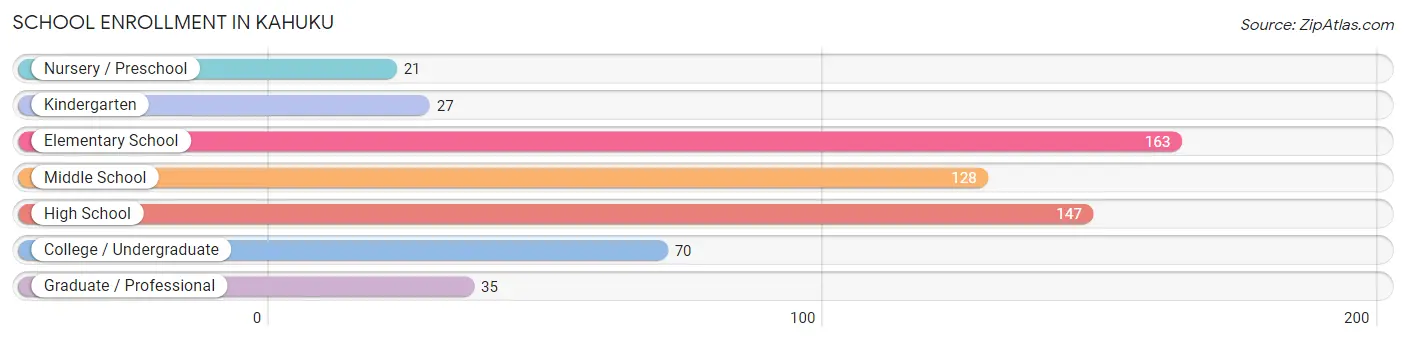
| School Level | # Students | % Students |
| Nursery / Preschool | 21 | 3.5% |
| Kindergarten | 27 | 4.6% |
| Elementary School | 163 | 27.6% |
| Middle School | 128 | 21.7% |
| High School | 147 | 24.9% |
| College / Undergraduate | 70 | 11.8% |
| Graduate / Professional | 35 | 5.9% |
| Total | 591 | 100.0% |
School Enrollment by Age by Funding Source in Kahuku
Out of a total of 591 students who are enrolled in schools in Kahuku, 78 (13.2%) attend a private institution, while the remaining 513 (86.8%) are enrolled in public schools. The age group of 3 to 4 year olds has the highest likelihood of being enrolled in private schools, with 4 (100.0% in the age bracket) enrolled. Conversely, the age group of 25 to 34 year olds has the lowest likelihood of being enrolled in a private school, with 7 (100.0% in the age bracket) attending a public institution.
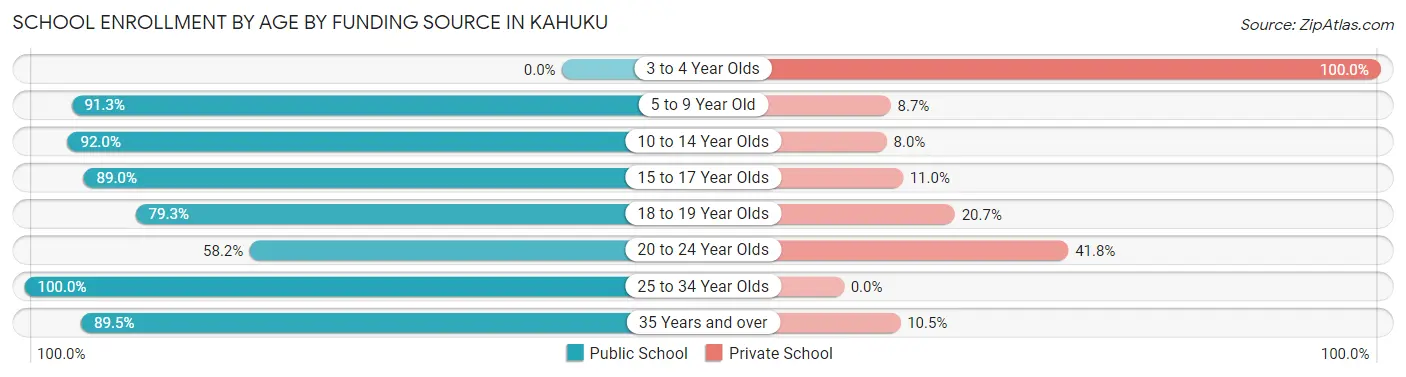
| Age Bracket | Public School | Private School |
| 3 to 4 Year Olds | 0 (0.0%) | 4 (100.0%) |
| 5 to 9 Year Old | 167 (91.3%) | 16 (8.7%) |
| 10 to 14 Year Olds | 161 (92.0%) | 14 (8.0%) |
| 15 to 17 Year Olds | 89 (89.0%) | 11 (11.0%) |
| 18 to 19 Year Olds | 23 (79.3%) | 6 (20.7%) |
| 20 to 24 Year Olds | 32 (58.2%) | 23 (41.8%) |
| 25 to 34 Year Olds | 7 (100.0%) | 0 (0.0%) |
| 35 Years and over | 34 (89.5%) | 4 (10.5%) |
| Total | 513 (86.8%) | 78 (13.2%) |
Educational Attainment by Field of Study in Kahuku
Education (102 | 27.4%), business (54 | 14.5%), arts & humanities (43 | 11.5%), social sciences (40 | 10.7%), and psychology (28 | 7.5%) are the most common fields of study among 373 individuals in Kahuku who have obtained a bachelor's degree or higher.
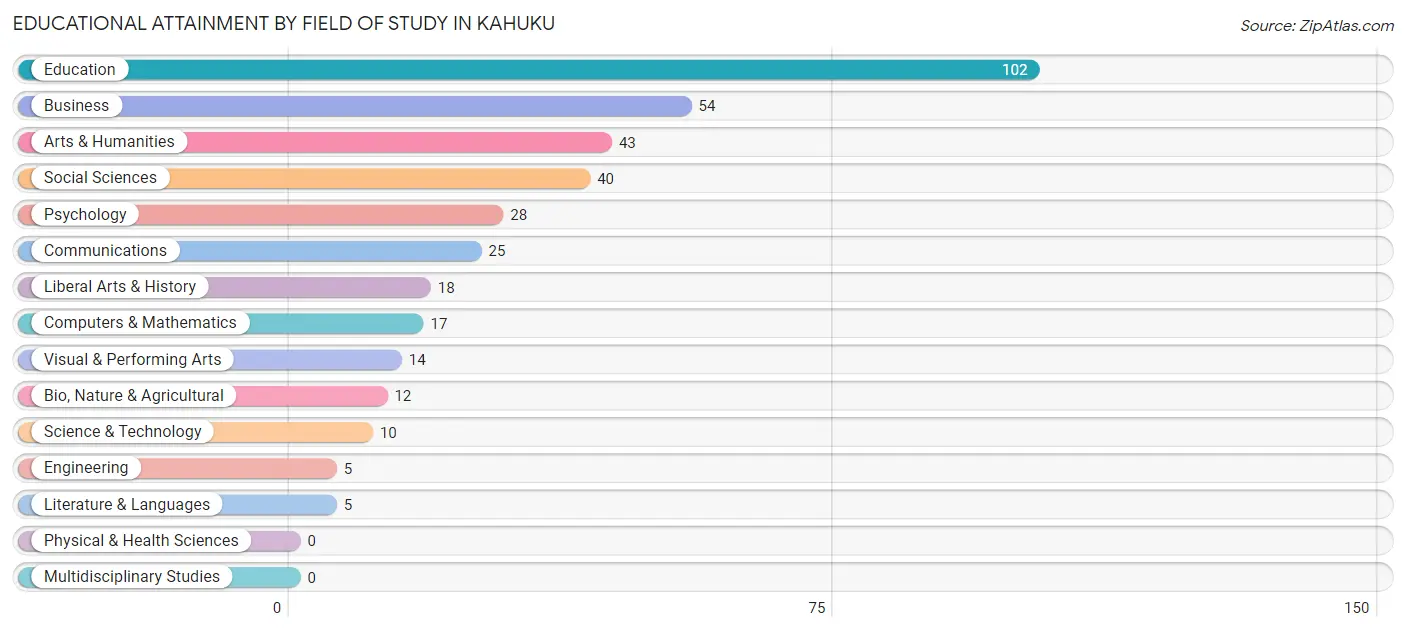
| Field of Study | # Graduates | % Graduates |
| Computers & Mathematics | 17 | 4.6% |
| Bio, Nature & Agricultural | 12 | 3.2% |
| Physical & Health Sciences | 0 | 0.0% |
| Psychology | 28 | 7.5% |
| Social Sciences | 40 | 10.7% |
| Engineering | 5 | 1.3% |
| Multidisciplinary Studies | 0 | 0.0% |
| Science & Technology | 10 | 2.7% |
| Business | 54 | 14.5% |
| Education | 102 | 27.4% |
| Literature & Languages | 5 | 1.3% |
| Liberal Arts & History | 18 | 4.8% |
| Visual & Performing Arts | 14 | 3.7% |
| Communications | 25 | 6.7% |
| Arts & Humanities | 43 | 11.5% |
| Total | 373 | 100.0% |
Transportation & Commute in Kahuku
Vehicle Availability by Sex in Kahuku
The most prevalent vehicle ownership categories in Kahuku are males with 3 vehicles (164, accounting for 36.9%) and females with 3 vehicles (155, making up 37.7%).
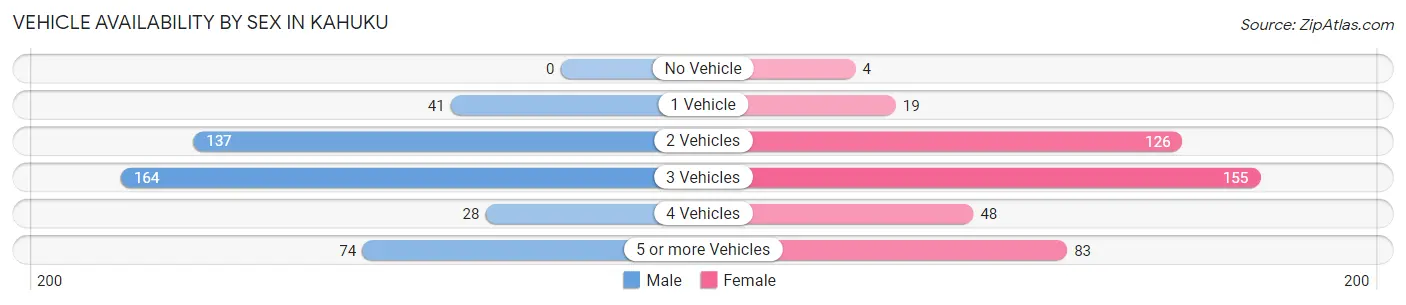
| Vehicles Available | Male | Female |
| No Vehicle | 0 (0.0%) | 4 (0.9%) |
| 1 Vehicle | 41 (9.2%) | 19 (4.4%) |
| 2 Vehicles | 137 (30.9%) | 126 (29.0%) |
| 3 Vehicles | 164 (36.9%) | 155 (35.6%) |
| 4 Vehicles | 28 (6.3%) | 48 (11.0%) |
| 5 or more Vehicles | 74 (16.7%) | 83 (19.1%) |
| Total | 444 (100.0%) | 435 (100.0%) |
Commute Time in Kahuku
The most frequently occuring commute durations in Kahuku are 60 to 89 minutes (206 commuters, 25.5%), 5 to 9 minutes (187 commuters, 23.1%), and 10 to 14 minutes (142 commuters, 17.5%).
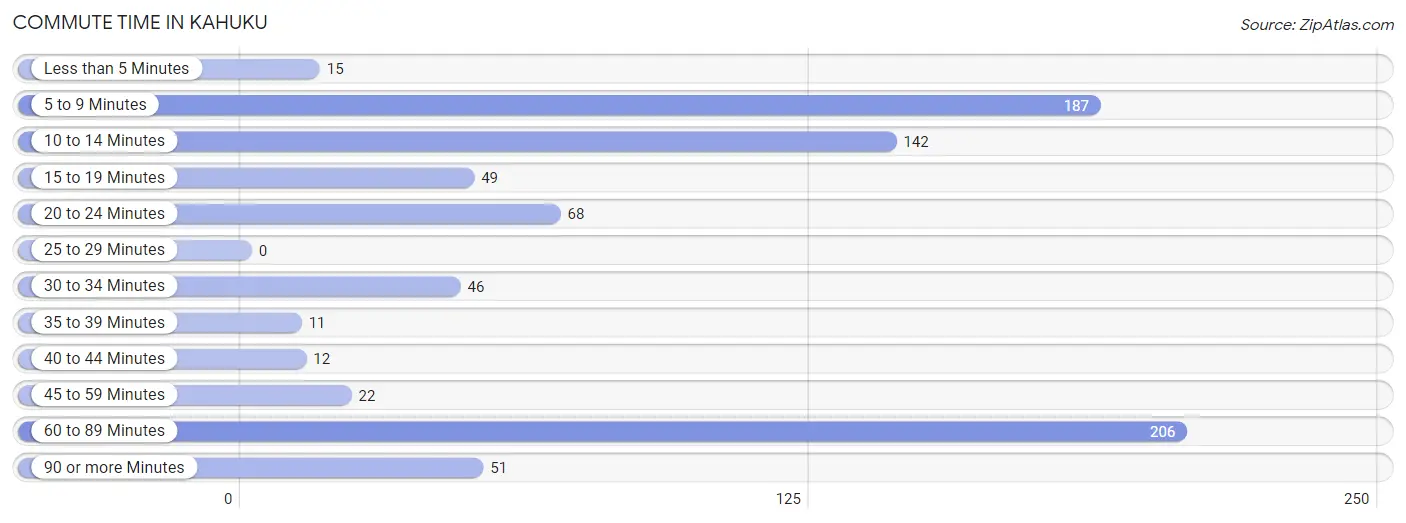
| Commute Time | # Commuters | % Commuters |
| Less than 5 Minutes | 15 | 1.8% |
| 5 to 9 Minutes | 187 | 23.1% |
| 10 to 14 Minutes | 142 | 17.5% |
| 15 to 19 Minutes | 49 | 6.1% |
| 20 to 24 Minutes | 68 | 8.4% |
| 25 to 29 Minutes | 0 | 0.0% |
| 30 to 34 Minutes | 46 | 5.7% |
| 35 to 39 Minutes | 11 | 1.4% |
| 40 to 44 Minutes | 12 | 1.5% |
| 45 to 59 Minutes | 22 | 2.7% |
| 60 to 89 Minutes | 206 | 25.5% |
| 90 or more Minutes | 51 | 6.3% |
Commute Time by Sex in Kahuku
The most common commute times in Kahuku are 60 to 89 minutes (157 commuters, 39.0%) for males and 5 to 9 minutes (90 commuters, 22.2%) for females.
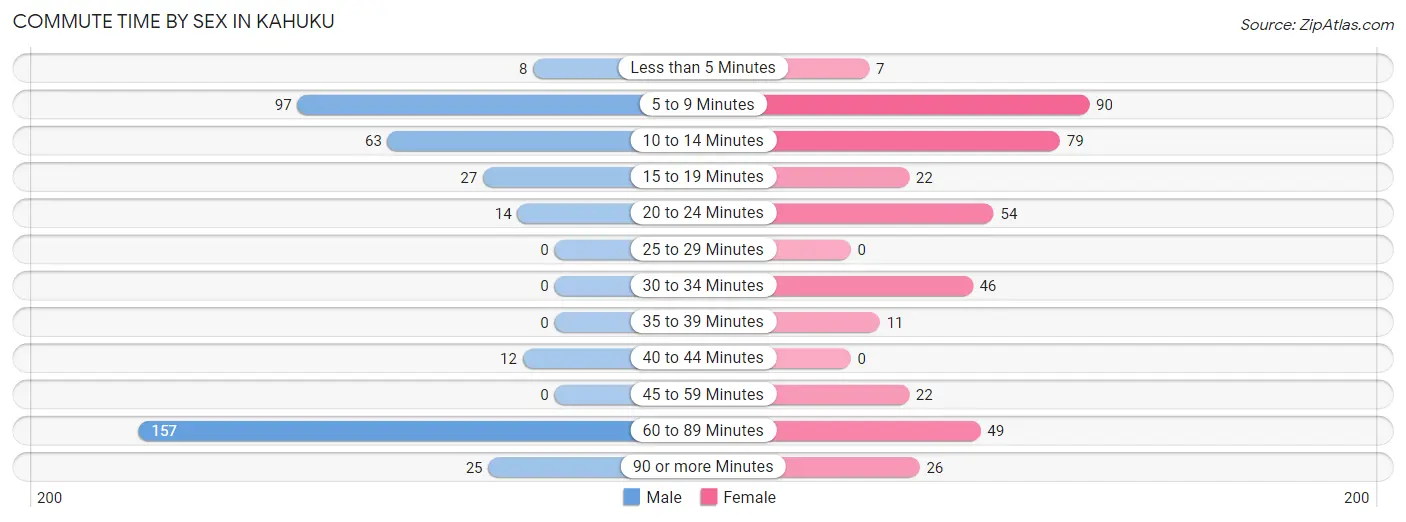
| Commute Time | Male | Female |
| Less than 5 Minutes | 8 (2.0%) | 7 (1.7%) |
| 5 to 9 Minutes | 97 (24.1%) | 90 (22.2%) |
| 10 to 14 Minutes | 63 (15.6%) | 79 (19.5%) |
| 15 to 19 Minutes | 27 (6.7%) | 22 (5.4%) |
| 20 to 24 Minutes | 14 (3.5%) | 54 (13.3%) |
| 25 to 29 Minutes | 0 (0.0%) | 0 (0.0%) |
| 30 to 34 Minutes | 0 (0.0%) | 46 (11.3%) |
| 35 to 39 Minutes | 0 (0.0%) | 11 (2.7%) |
| 40 to 44 Minutes | 12 (3.0%) | 0 (0.0%) |
| 45 to 59 Minutes | 0 (0.0%) | 22 (5.4%) |
| 60 to 89 Minutes | 157 (39.0%) | 49 (12.1%) |
| 90 or more Minutes | 25 (6.2%) | 26 (6.4%) |
Time of Departure to Work by Sex in Kahuku
The most frequent times of departure to work in Kahuku are 12:00 AM to 4:59 AM (73, 18.1%) for males and 6:30 AM to 6:59 AM (57, 14.0%) for females.
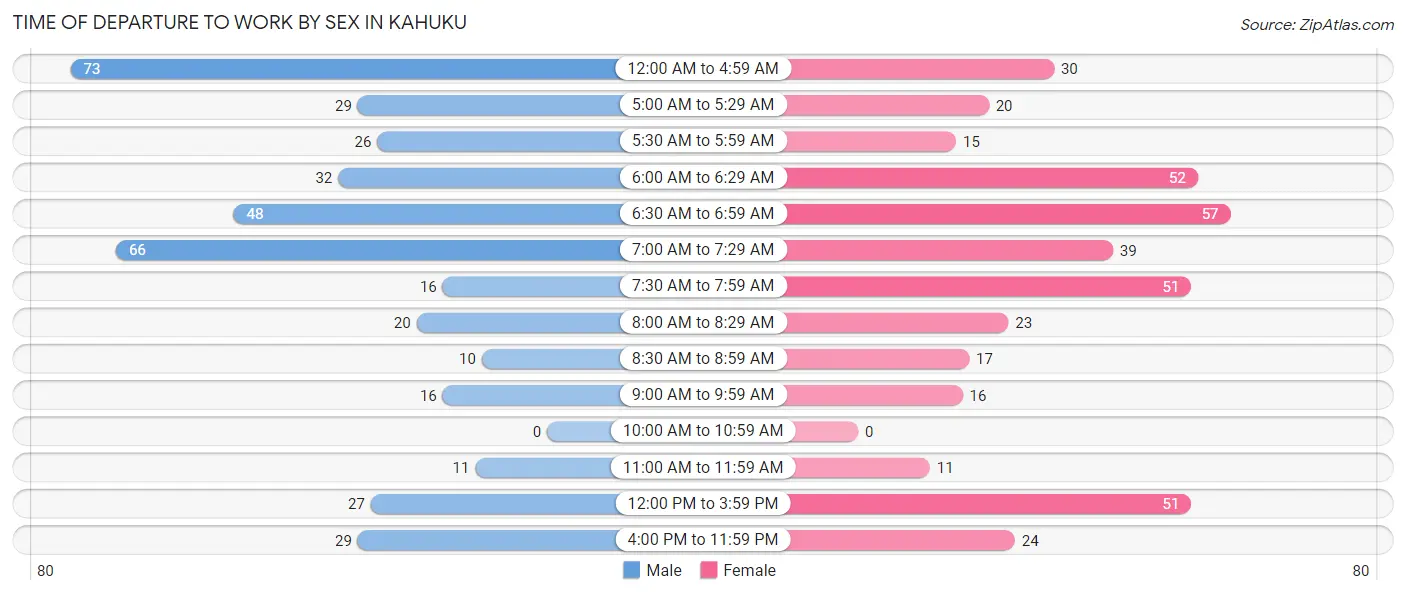
| Time of Departure | Male | Female |
| 12:00 AM to 4:59 AM | 73 (18.1%) | 30 (7.4%) |
| 5:00 AM to 5:29 AM | 29 (7.2%) | 20 (4.9%) |
| 5:30 AM to 5:59 AM | 26 (6.5%) | 15 (3.7%) |
| 6:00 AM to 6:29 AM | 32 (7.9%) | 52 (12.8%) |
| 6:30 AM to 6:59 AM | 48 (11.9%) | 57 (14.0%) |
| 7:00 AM to 7:29 AM | 66 (16.4%) | 39 (9.6%) |
| 7:30 AM to 7:59 AM | 16 (4.0%) | 51 (12.6%) |
| 8:00 AM to 8:29 AM | 20 (5.0%) | 23 (5.7%) |
| 8:30 AM to 8:59 AM | 10 (2.5%) | 17 (4.2%) |
| 9:00 AM to 9:59 AM | 16 (4.0%) | 16 (3.9%) |
| 10:00 AM to 10:59 AM | 0 (0.0%) | 0 (0.0%) |
| 11:00 AM to 11:59 AM | 11 (2.7%) | 11 (2.7%) |
| 12:00 PM to 3:59 PM | 27 (6.7%) | 51 (12.6%) |
| 4:00 PM to 11:59 PM | 29 (7.2%) | 24 (5.9%) |
| Total | 403 (100.0%) | 406 (100.0%) |
Housing Occupancy in Kahuku
Occupancy by Ownership in Kahuku
Of the total 561 dwellings in Kahuku, owner-occupied units account for 312 (55.6%), while renter-occupied units make up 249 (44.4%).
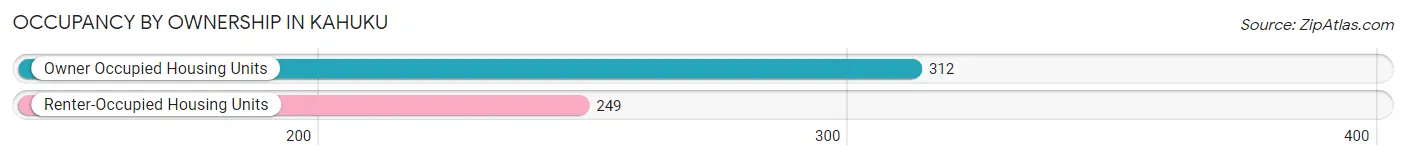
| Occupancy | # Housing Units | % Housing Units |
| Owner Occupied Housing Units | 312 | 55.6% |
| Renter-Occupied Housing Units | 249 | 44.4% |
| Total Occupied Housing Units | 561 | 100.0% |
Occupancy by Household Size in Kahuku
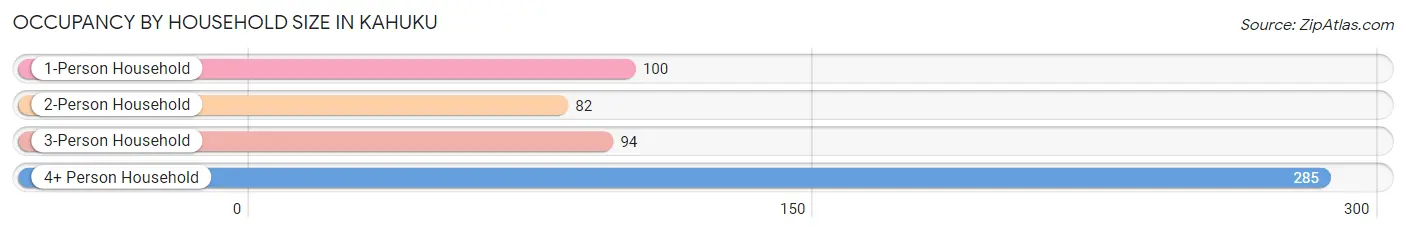
| Household Size | # Housing Units | % Housing Units |
| 1-Person Household | 100 | 17.8% |
| 2-Person Household | 82 | 14.6% |
| 3-Person Household | 94 | 16.8% |
| 4+ Person Household | 285 | 50.8% |
| Total Housing Units | 561 | 100.0% |
Occupancy by Ownership by Household Size in Kahuku
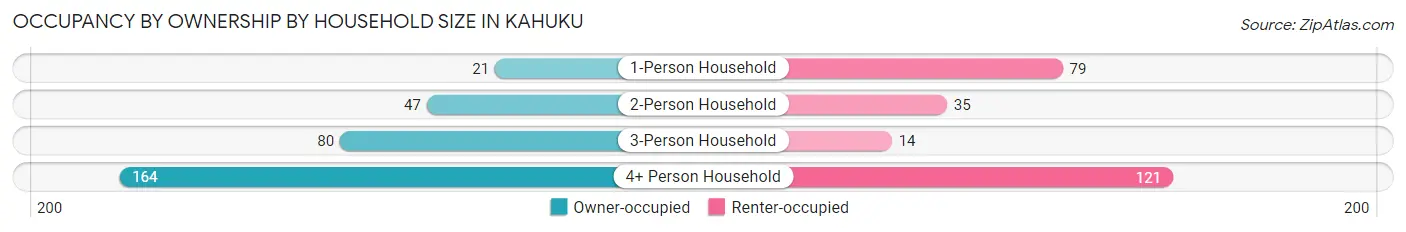
| Household Size | Owner-occupied | Renter-occupied |
| 1-Person Household | 21 (21.0%) | 79 (79.0%) |
| 2-Person Household | 47 (57.3%) | 35 (42.7%) |
| 3-Person Household | 80 (85.1%) | 14 (14.9%) |
| 4+ Person Household | 164 (57.5%) | 121 (42.5%) |
| Total Housing Units | 312 (55.6%) | 249 (44.4%) |
Occupancy by Educational Attainment in Kahuku
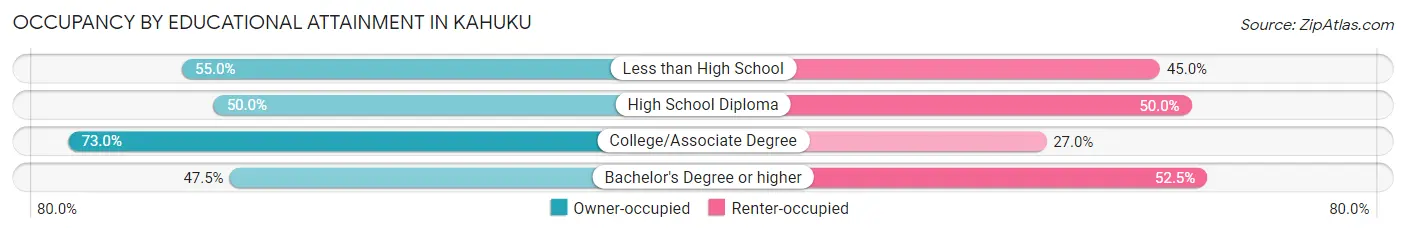
| Household Size | Owner-occupied | Renter-occupied |
| Less than High School | 11 (55.0%) | 9 (45.0%) |
| High School Diploma | 104 (50.0%) | 104 (50.0%) |
| College/Associate Degree | 111 (73.0%) | 41 (27.0%) |
| Bachelor's Degree or higher | 86 (47.5%) | 95 (52.5%) |
Occupancy by Age of Householder in Kahuku
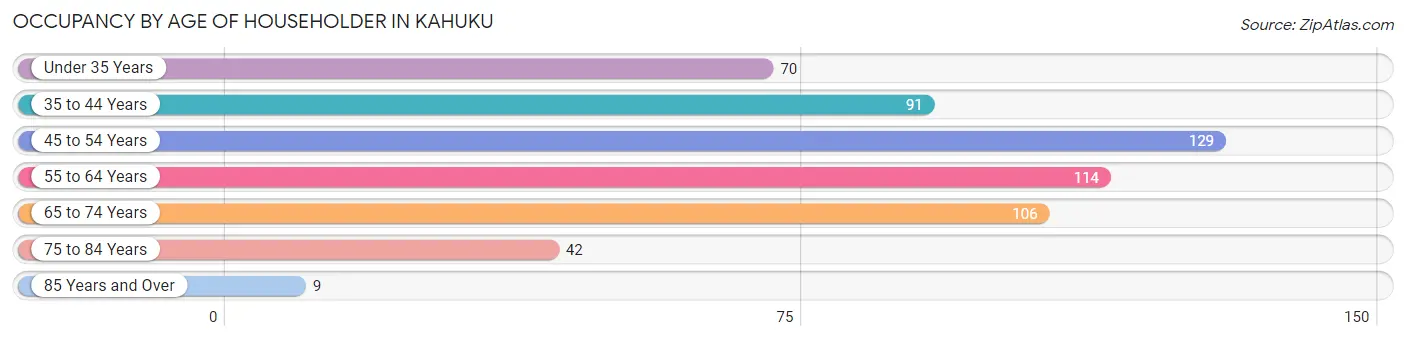
| Age Bracket | # Households | % Households |
| Under 35 Years | 70 | 12.5% |
| 35 to 44 Years | 91 | 16.2% |
| 45 to 54 Years | 129 | 23.0% |
| 55 to 64 Years | 114 | 20.3% |
| 65 to 74 Years | 106 | 18.9% |
| 75 to 84 Years | 42 | 7.5% |
| 85 Years and Over | 9 | 1.6% |
| Total | 561 | 100.0% |
Housing Finances in Kahuku
Median Income by Occupancy in Kahuku
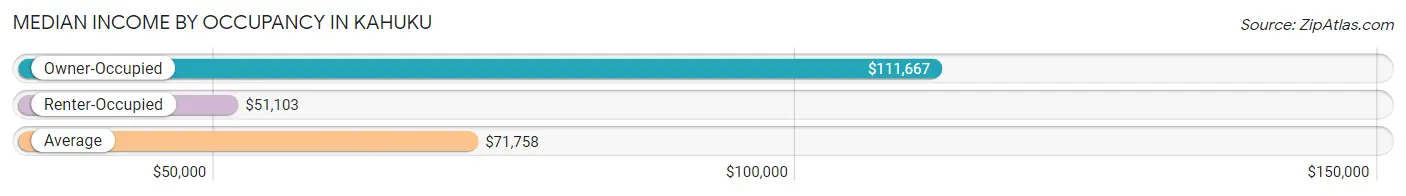
| Occupancy Type | # Households | Median Income |
| Owner-Occupied | 312 (55.6%) | $111,667 |
| Renter-Occupied | 249 (44.4%) | $51,103 |
| Average | 561 (100.0%) | $71,758 |
Occupancy by Householder Income Bracket in Kahuku
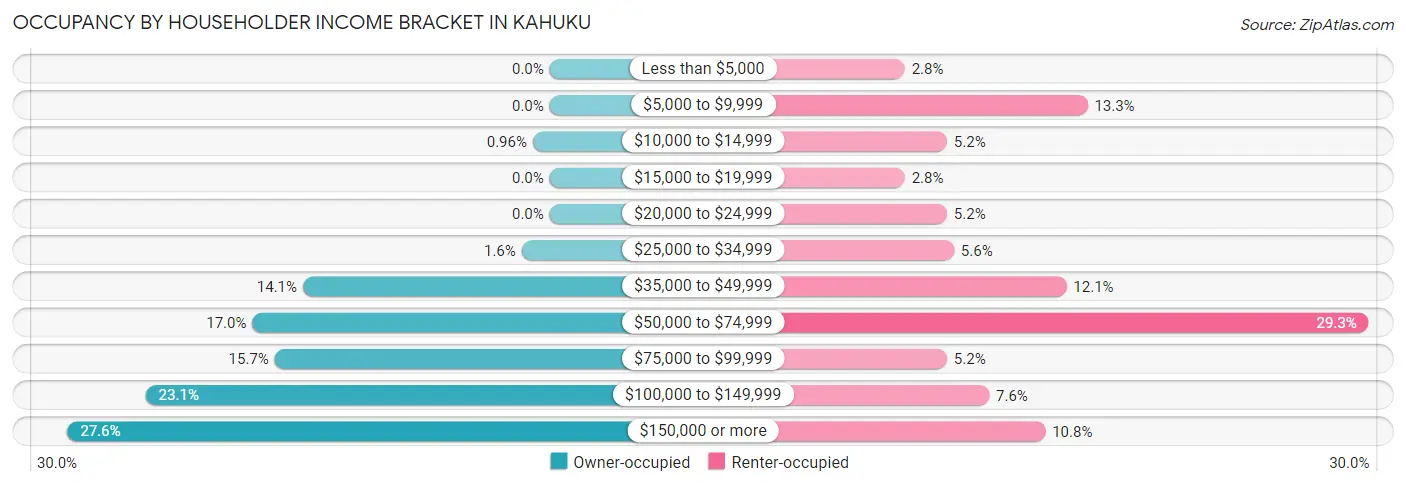
| Income Bracket | Owner-occupied | Renter-occupied |
| Less than $5,000 | 0 (0.0%) | 7 (2.8%) |
| $5,000 to $9,999 | 0 (0.0%) | 33 (13.3%) |
| $10,000 to $14,999 | 3 (1.0%) | 13 (5.2%) |
| $15,000 to $19,999 | 0 (0.0%) | 7 (2.8%) |
| $20,000 to $24,999 | 0 (0.0%) | 13 (5.2%) |
| $25,000 to $34,999 | 5 (1.6%) | 14 (5.6%) |
| $35,000 to $49,999 | 44 (14.1%) | 30 (12.0%) |
| $50,000 to $74,999 | 53 (17.0%) | 73 (29.3%) |
| $75,000 to $99,999 | 49 (15.7%) | 13 (5.2%) |
| $100,000 to $149,999 | 72 (23.1%) | 19 (7.6%) |
| $150,000 or more | 86 (27.6%) | 27 (10.8%) |
| Total | 312 (100.0%) | 249 (100.0%) |
Monthly Housing Cost Tiers in Kahuku
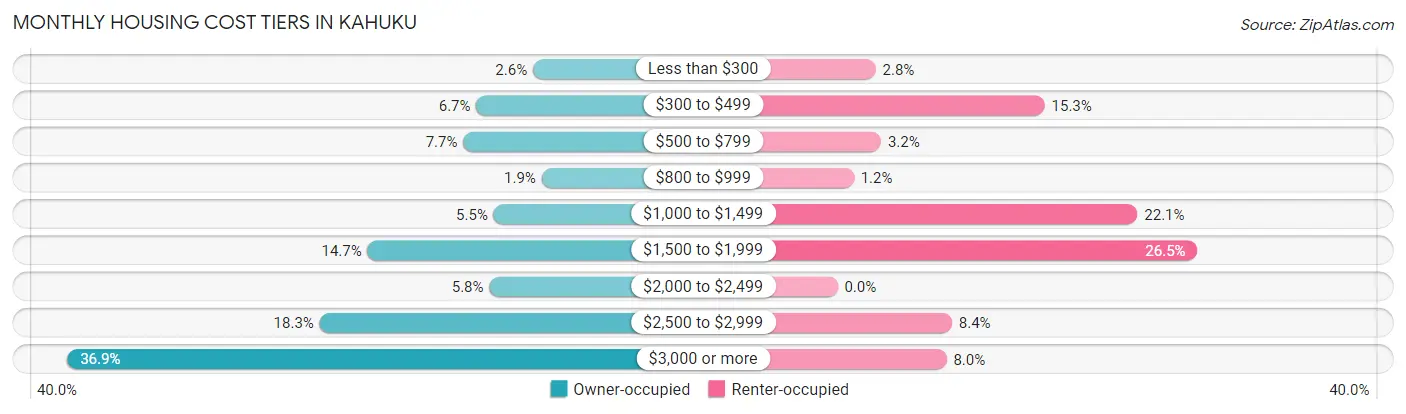
| Monthly Cost | Owner-occupied | Renter-occupied |
| Less than $300 | 8 (2.6%) | 7 (2.8%) |
| $300 to $499 | 21 (6.7%) | 38 (15.3%) |
| $500 to $799 | 24 (7.7%) | 8 (3.2%) |
| $800 to $999 | 6 (1.9%) | 3 (1.2%) |
| $1,000 to $1,499 | 17 (5.4%) | 55 (22.1%) |
| $1,500 to $1,999 | 46 (14.7%) | 66 (26.5%) |
| $2,000 to $2,499 | 18 (5.8%) | 0 (0.0%) |
| $2,500 to $2,999 | 57 (18.3%) | 21 (8.4%) |
| $3,000 or more | 115 (36.9%) | 20 (8.0%) |
| Total | 312 (100.0%) | 249 (100.0%) |
Physical Housing Characteristics in Kahuku
Housing Structures in Kahuku
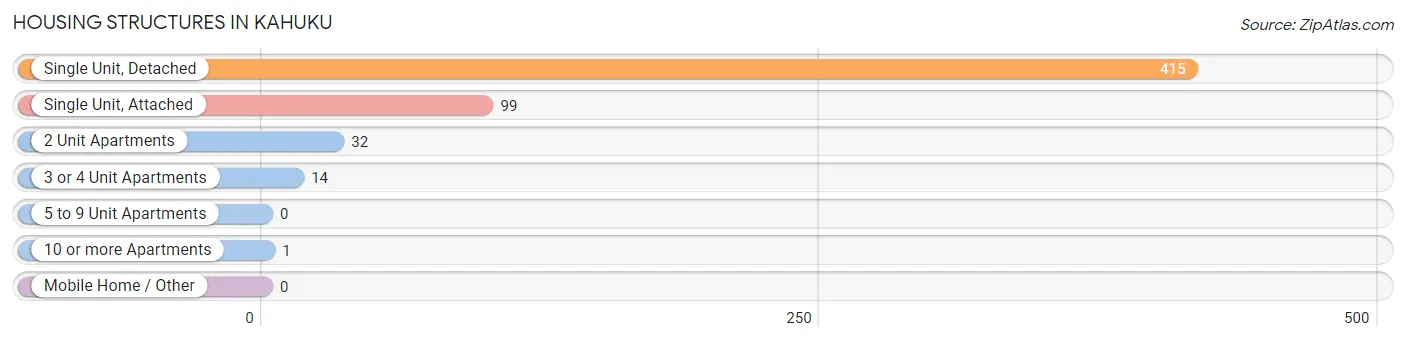
| Structure Type | # Housing Units | % Housing Units |
| Single Unit, Detached | 415 | 74.0% |
| Single Unit, Attached | 99 | 17.6% |
| 2 Unit Apartments | 32 | 5.7% |
| 3 or 4 Unit Apartments | 14 | 2.5% |
| 5 to 9 Unit Apartments | 0 | 0.0% |
| 10 or more Apartments | 1 | 0.2% |
| Mobile Home / Other | 0 | 0.0% |
| Total | 561 | 100.0% |
Housing Structures by Occupancy in Kahuku
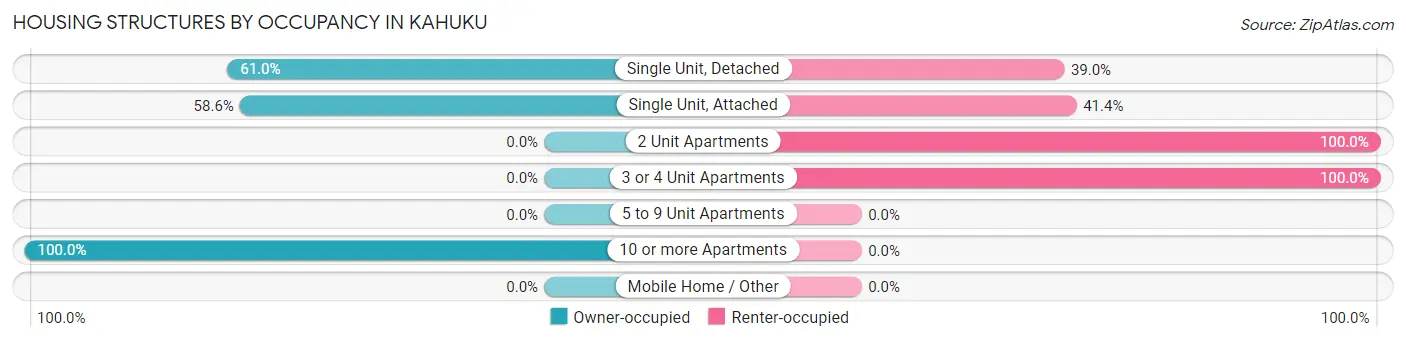
| Structure Type | Owner-occupied | Renter-occupied |
| Single Unit, Detached | 253 (61.0%) | 162 (39.0%) |
| Single Unit, Attached | 58 (58.6%) | 41 (41.4%) |
| 2 Unit Apartments | 0 (0.0%) | 32 (100.0%) |
| 3 or 4 Unit Apartments | 0 (0.0%) | 14 (100.0%) |
| 5 to 9 Unit Apartments | 0 (0.0%) | 0 (0.0%) |
| 10 or more Apartments | 1 (100.0%) | 0 (0.0%) |
| Mobile Home / Other | 0 (0.0%) | 0 (0.0%) |
| Total | 312 (55.6%) | 249 (44.4%) |
Housing Structures by Number of Rooms in Kahuku
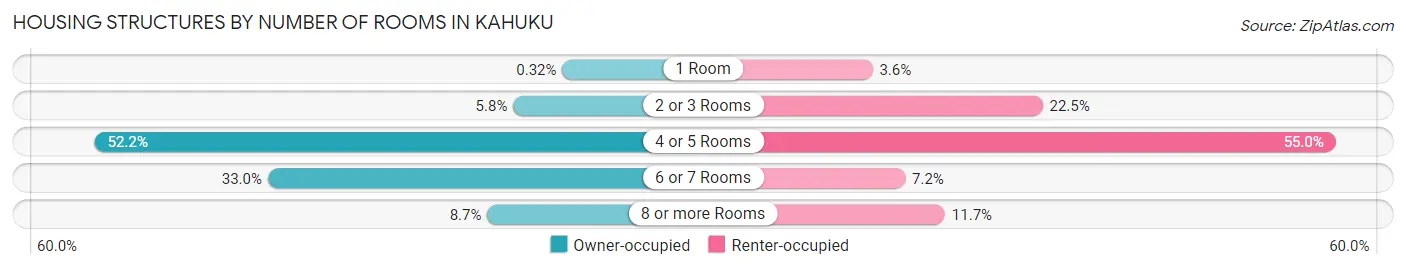
| Number of Rooms | Owner-occupied | Renter-occupied |
| 1 Room | 1 (0.3%) | 9 (3.6%) |
| 2 or 3 Rooms | 18 (5.8%) | 56 (22.5%) |
| 4 or 5 Rooms | 163 (52.2%) | 137 (55.0%) |
| 6 or 7 Rooms | 103 (33.0%) | 18 (7.2%) |
| 8 or more Rooms | 27 (8.6%) | 29 (11.7%) |
| Total | 312 (100.0%) | 249 (100.0%) |
Housing Structure by Heating Type in Kahuku
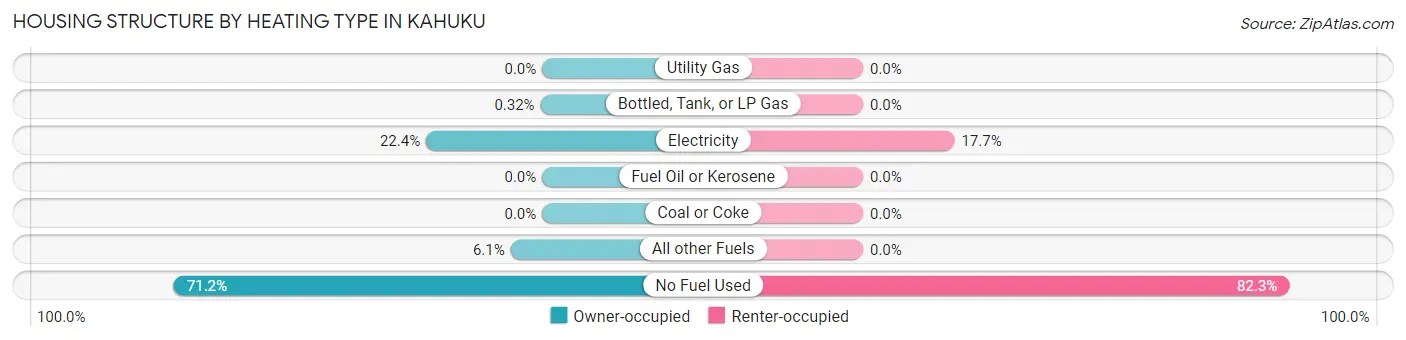
| Heating Type | Owner-occupied | Renter-occupied |
| Utility Gas | 0 (0.0%) | 0 (0.0%) |
| Bottled, Tank, or LP Gas | 1 (0.3%) | 0 (0.0%) |
| Electricity | 70 (22.4%) | 44 (17.7%) |
| Fuel Oil or Kerosene | 0 (0.0%) | 0 (0.0%) |
| Coal or Coke | 0 (0.0%) | 0 (0.0%) |
| All other Fuels | 19 (6.1%) | 0 (0.0%) |
| No Fuel Used | 222 (71.2%) | 205 (82.3%) |
| Total | 312 (100.0%) | 249 (100.0%) |
Household Vehicle Usage in Kahuku
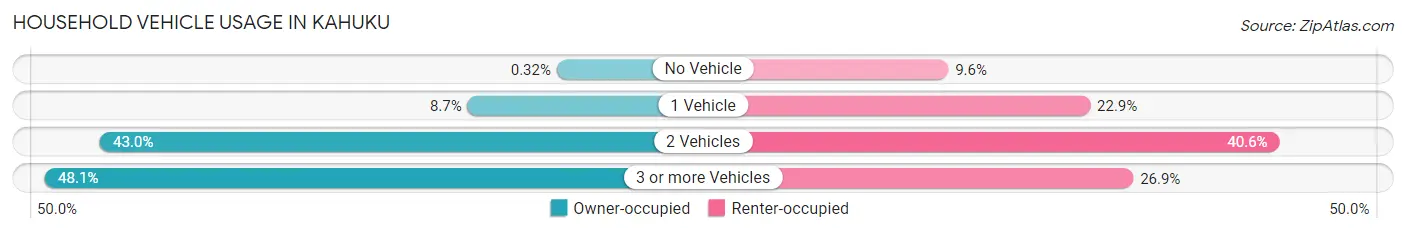
| Vehicles per Household | Owner-occupied | Renter-occupied |
| No Vehicle | 1 (0.3%) | 24 (9.6%) |
| 1 Vehicle | 27 (8.6%) | 57 (22.9%) |
| 2 Vehicles | 134 (42.9%) | 101 (40.6%) |
| 3 or more Vehicles | 150 (48.1%) | 67 (26.9%) |
| Total | 312 (100.0%) | 249 (100.0%) |
Real Estate & Mortgages in Kahuku
Real Estate and Mortgage Overview in Kahuku
| Characteristic | Without Mortgage | With Mortgage |
| Housing Units | 59 | 253 |
| Median Property Value | $699,300 | $674,400 |
| Median Household Income | $92,917 | $73 |
| Monthly Housing Costs | $517 | $115 |
| Real Estate Taxes | $2,330 | $4 |
Property Value by Mortgage Status in Kahuku
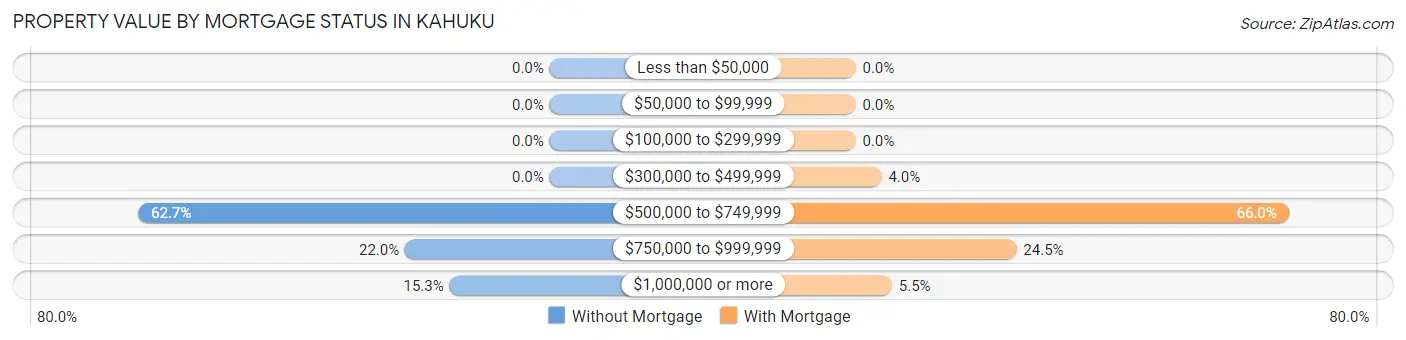
| Property Value | Without Mortgage | With Mortgage |
| Less than $50,000 | 0 (0.0%) | 0 (0.0%) |
| $50,000 to $99,999 | 0 (0.0%) | 0 (0.0%) |
| $100,000 to $299,999 | 0 (0.0%) | 0 (0.0%) |
| $300,000 to $499,999 | 0 (0.0%) | 10 (4.0%) |
| $500,000 to $749,999 | 37 (62.7%) | 167 (66.0%) |
| $750,000 to $999,999 | 13 (22.0%) | 62 (24.5%) |
| $1,000,000 or more | 9 (15.2%) | 14 (5.5%) |
| Total | 59 (100.0%) | 253 (100.0%) |
Household Income by Mortgage Status in Kahuku
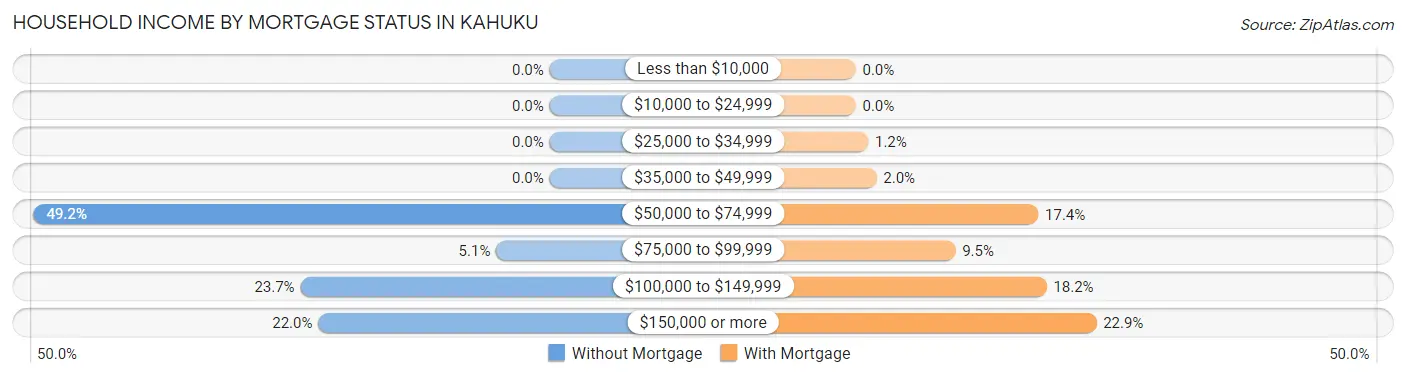
| Household Income | Without Mortgage | With Mortgage |
| Less than $10,000 | 0 (0.0%) | 0 (0.0%) |
| $10,000 to $24,999 | 0 (0.0%) | 0 (0.0%) |
| $25,000 to $34,999 | 0 (0.0%) | 3 (1.2%) |
| $35,000 to $49,999 | 0 (0.0%) | 5 (2.0%) |
| $50,000 to $74,999 | 29 (49.1%) | 44 (17.4%) |
| $75,000 to $99,999 | 3 (5.1%) | 24 (9.5%) |
| $100,000 to $149,999 | 14 (23.7%) | 46 (18.2%) |
| $150,000 or more | 13 (22.0%) | 58 (22.9%) |
| Total | 59 (100.0%) | 253 (100.0%) |
Property Value to Household Income Ratio in Kahuku
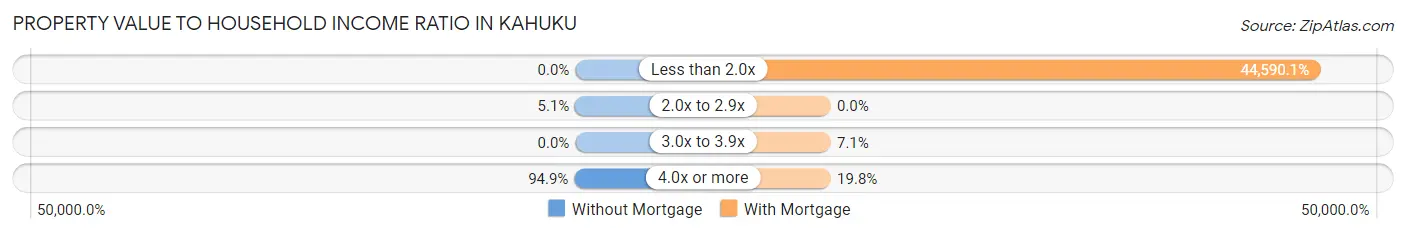
| Value-to-Income Ratio | Without Mortgage | With Mortgage |
| Less than 2.0x | 0 (0.0%) | 112,813 (44,590.1%) |
| 2.0x to 2.9x | 3 (5.1%) | 0 (0.0%) |
| 3.0x to 3.9x | 0 (0.0%) | 18 (7.1%) |
| 4.0x or more | 56 (94.9%) | 50 (19.8%) |
| Total | 59 (100.0%) | 253 (100.0%) |
Real Estate Taxes by Mortgage Status in Kahuku
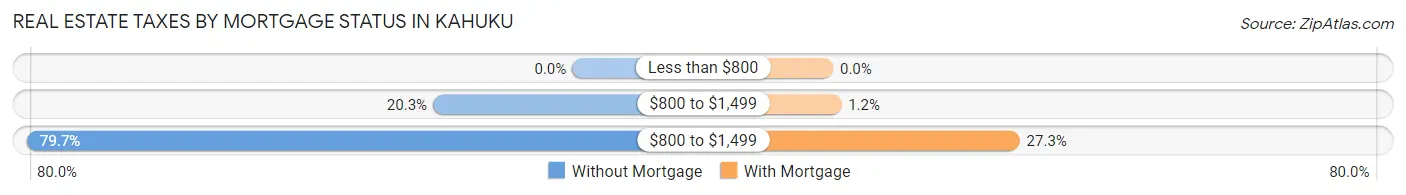
| Property Taxes | Without Mortgage | With Mortgage |
| Less than $800 | 0 (0.0%) | 0 (0.0%) |
| $800 to $1,499 | 12 (20.3%) | 3 (1.2%) |
| $800 to $1,499 | 47 (79.7%) | 69 (27.3%) |
| Total | 59 (100.0%) | 253 (100.0%) |
Health & Disability in Kahuku
Health Insurance Coverage by Age in Kahuku
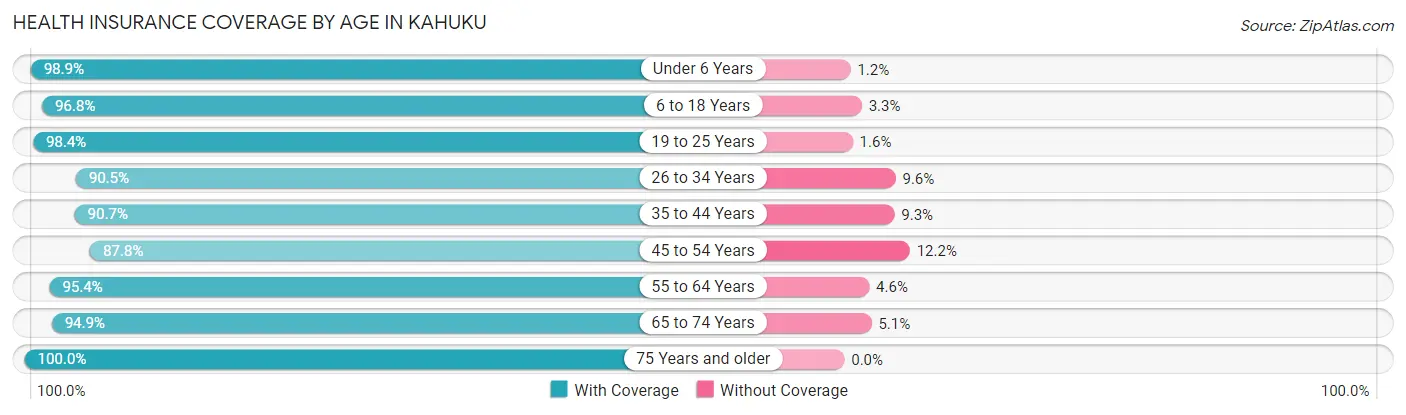
| Age Bracket | With Coverage | Without Coverage |
| Under 6 Years | 343 (98.9%) | 4 (1.1%) |
| 6 to 18 Years | 476 (96.8%) | 16 (3.3%) |
| 19 to 25 Years | 253 (98.4%) | 4 (1.6%) |
| 26 to 34 Years | 199 (90.4%) | 21 (9.6%) |
| 35 to 44 Years | 204 (90.7%) | 21 (9.3%) |
| 45 to 54 Years | 223 (87.8%) | 31 (12.2%) |
| 55 to 64 Years | 185 (95.4%) | 9 (4.6%) |
| 65 to 74 Years | 150 (94.9%) | 8 (5.1%) |
| 75 Years and older | 99 (100.0%) | 0 (0.0%) |
| Total | 2,132 (94.9%) | 114 (5.1%) |
Health Insurance Coverage by Citizenship Status in Kahuku
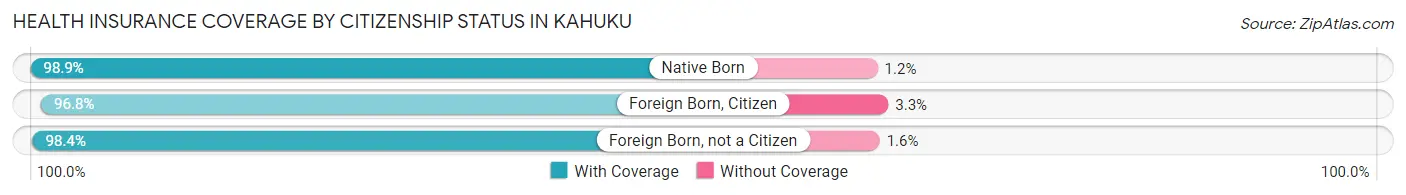
| Citizenship Status | With Coverage | Without Coverage |
| Native Born | 343 (98.9%) | 4 (1.1%) |
| Foreign Born, Citizen | 476 (96.8%) | 16 (3.3%) |
| Foreign Born, not a Citizen | 253 (98.4%) | 4 (1.6%) |
Health Insurance Coverage by Household Income in Kahuku
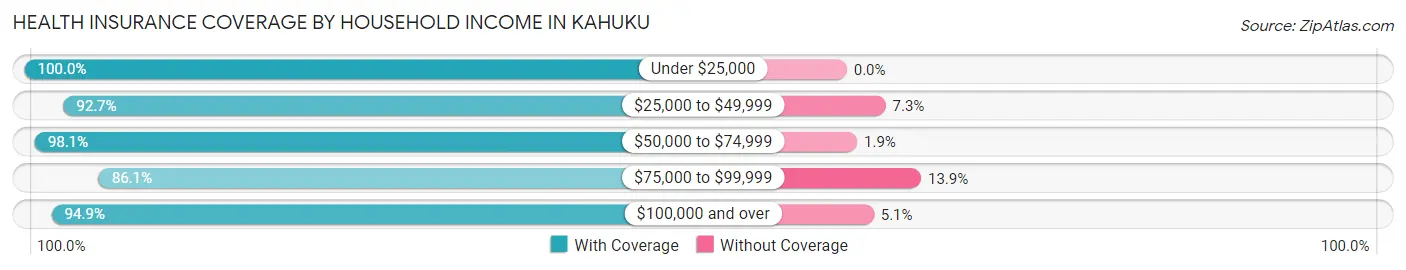
| Household Income | With Coverage | Without Coverage |
| Under $25,000 | 196 (100.0%) | 0 (0.0%) |
| $25,000 to $49,999 | 255 (92.7%) | 20 (7.3%) |
| $50,000 to $74,999 | 508 (98.1%) | 10 (1.9%) |
| $75,000 to $99,999 | 198 (86.1%) | 32 (13.9%) |
| $100,000 and over | 975 (94.9%) | 52 (5.1%) |
Public vs Private Health Insurance Coverage by Age in Kahuku
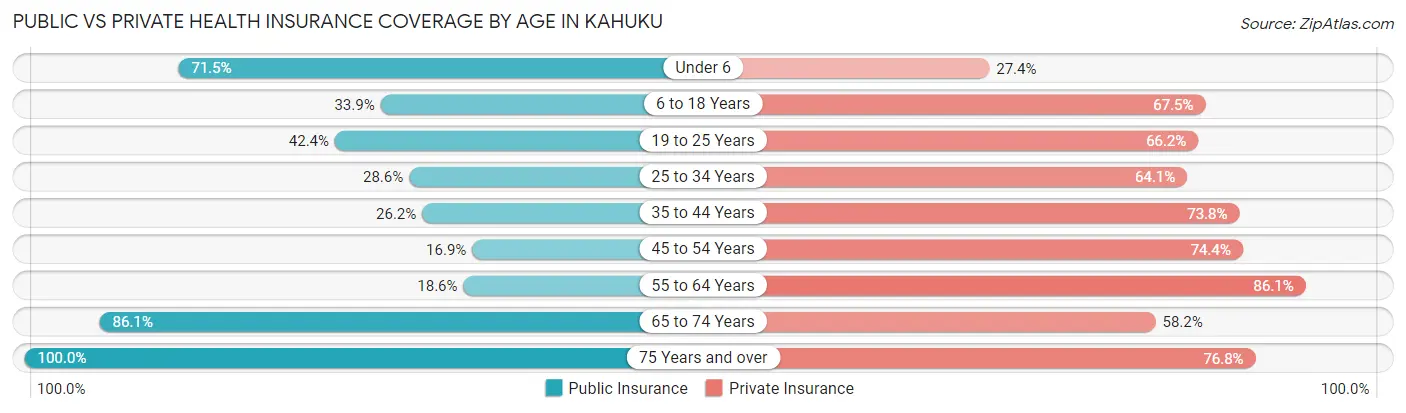
| Age Bracket | Public Insurance | Private Insurance |
| Under 6 | 248 (71.5%) | 95 (27.4%) |
| 6 to 18 Years | 167 (33.9%) | 332 (67.5%) |
| 19 to 25 Years | 109 (42.4%) | 170 (66.1%) |
| 25 to 34 Years | 63 (28.6%) | 141 (64.1%) |
| 35 to 44 Years | 59 (26.2%) | 166 (73.8%) |
| 45 to 54 Years | 43 (16.9%) | 189 (74.4%) |
| 55 to 64 Years | 36 (18.6%) | 167 (86.1%) |
| 65 to 74 Years | 136 (86.1%) | 92 (58.2%) |
| 75 Years and over | 99 (100.0%) | 76 (76.8%) |
| Total | 960 (42.7%) | 1,428 (63.6%) |
Disability Status by Sex by Age in Kahuku
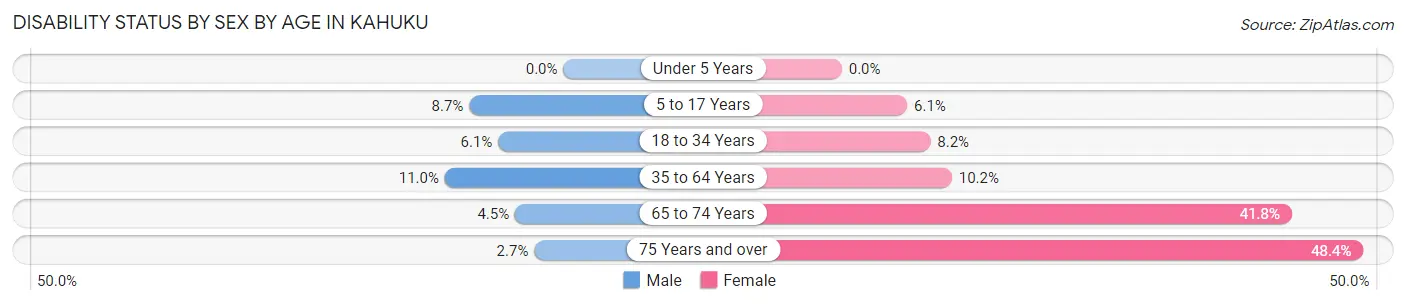
| Age Bracket | Male | Female |
| Under 5 Years | 0 (0.0%) | 0 (0.0%) |
| 5 to 17 Years | 16 (8.7%) | 20 (6.1%) |
| 18 to 34 Years | 17 (6.0%) | 18 (8.2%) |
| 35 to 64 Years | 32 (11.0%) | 39 (10.2%) |
| 65 to 74 Years | 3 (4.5%) | 38 (41.8%) |
| 75 Years and over | 1 (2.7%) | 30 (48.4%) |
Disability Class by Sex by Age in Kahuku
Disability Class: Hearing Difficulty
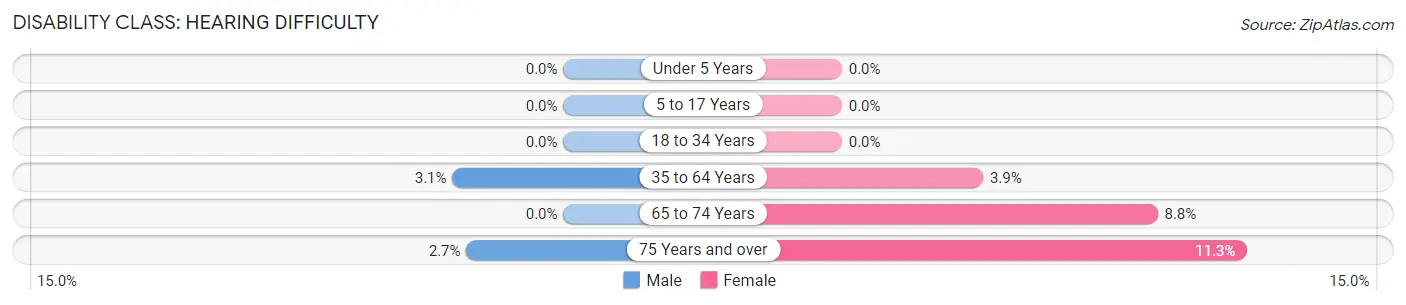
| Age Bracket | Male | Female |
| Under 5 Years | 0 (0.0%) | 0 (0.0%) |
| 5 to 17 Years | 0 (0.0%) | 0 (0.0%) |
| 18 to 34 Years | 0 (0.0%) | 0 (0.0%) |
| 35 to 64 Years | 9 (3.1%) | 15 (3.9%) |
| 65 to 74 Years | 0 (0.0%) | 8 (8.8%) |
| 75 Years and over | 1 (2.7%) | 7 (11.3%) |
Disability Class: Vision Difficulty
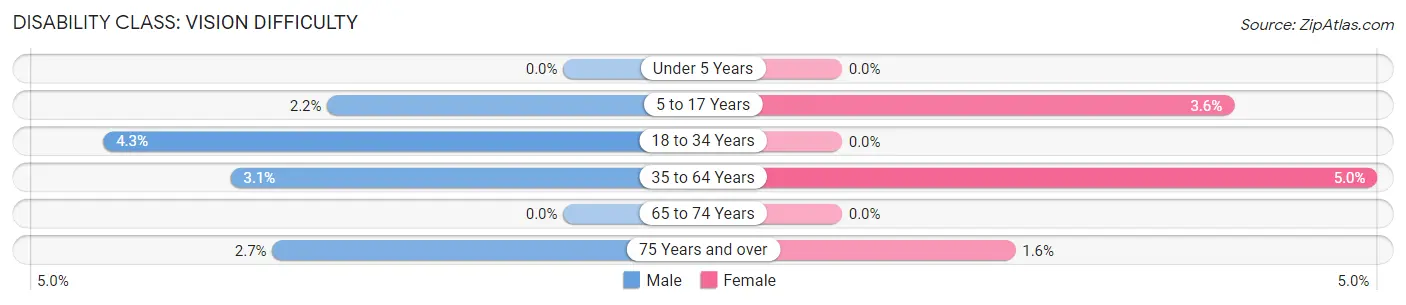
| Age Bracket | Male | Female |
| Under 5 Years | 0 (0.0%) | 0 (0.0%) |
| 5 to 17 Years | 4 (2.2%) | 12 (3.6%) |
| 18 to 34 Years | 12 (4.3%) | 0 (0.0%) |
| 35 to 64 Years | 9 (3.1%) | 19 (5.0%) |
| 65 to 74 Years | 0 (0.0%) | 0 (0.0%) |
| 75 Years and over | 1 (2.7%) | 1 (1.6%) |
Disability Class: Cognitive Difficulty
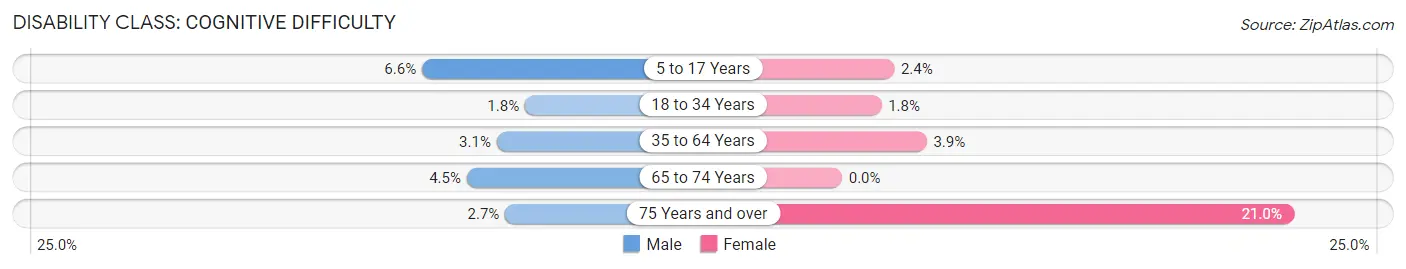
| Age Bracket | Male | Female |
| 5 to 17 Years | 12 (6.6%) | 8 (2.4%) |
| 18 to 34 Years | 5 (1.8%) | 4 (1.8%) |
| 35 to 64 Years | 9 (3.1%) | 15 (3.9%) |
| 65 to 74 Years | 3 (4.5%) | 0 (0.0%) |
| 75 Years and over | 1 (2.7%) | 13 (21.0%) |
Disability Class: Ambulatory Difficulty
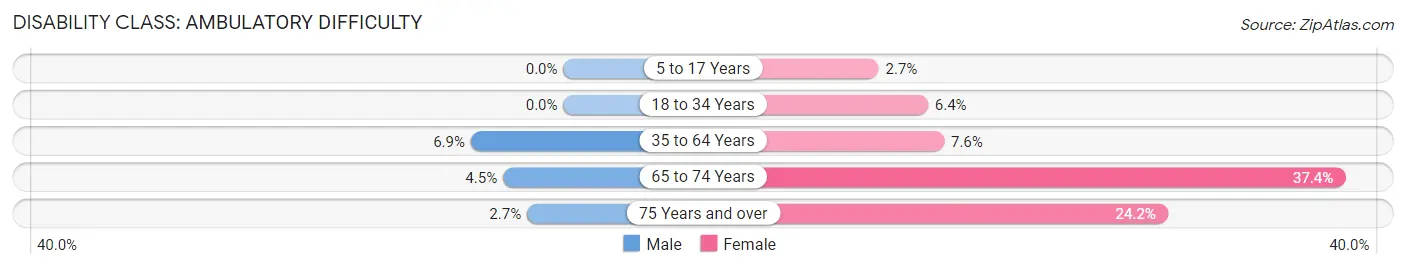
| Age Bracket | Male | Female |
| 5 to 17 Years | 0 (0.0%) | 9 (2.7%) |
| 18 to 34 Years | 0 (0.0%) | 14 (6.4%) |
| 35 to 64 Years | 20 (6.9%) | 29 (7.6%) |
| 65 to 74 Years | 3 (4.5%) | 34 (37.4%) |
| 75 Years and over | 1 (2.7%) | 15 (24.2%) |
Disability Class: Self-Care Difficulty
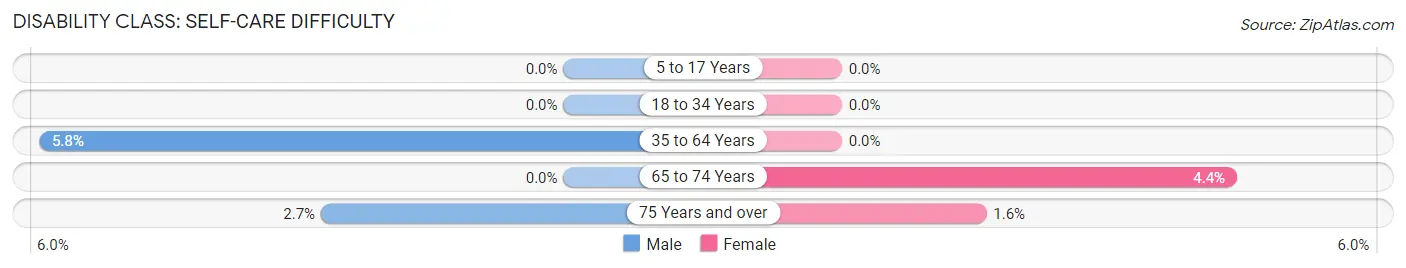
| Age Bracket | Male | Female |
| 5 to 17 Years | 0 (0.0%) | 0 (0.0%) |
| 18 to 34 Years | 0 (0.0%) | 0 (0.0%) |
| 35 to 64 Years | 17 (5.8%) | 0 (0.0%) |
| 65 to 74 Years | 0 (0.0%) | 4 (4.4%) |
| 75 Years and over | 1 (2.7%) | 1 (1.6%) |
Technology Access in Kahuku
Computing Device Access in Kahuku
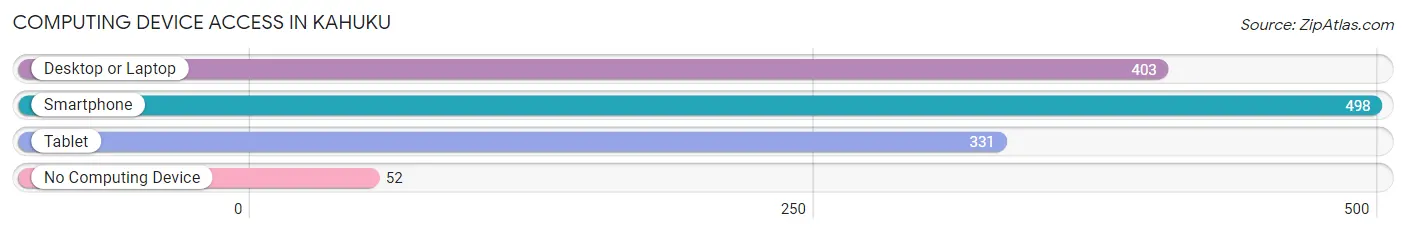
| Device Type | # Households | % Households |
| Desktop or Laptop | 403 | 71.8% |
| Smartphone | 498 | 88.8% |
| Tablet | 331 | 59.0% |
| No Computing Device | 52 | 9.3% |
| Total | 561 | 100.0% |
Internet Access in Kahuku
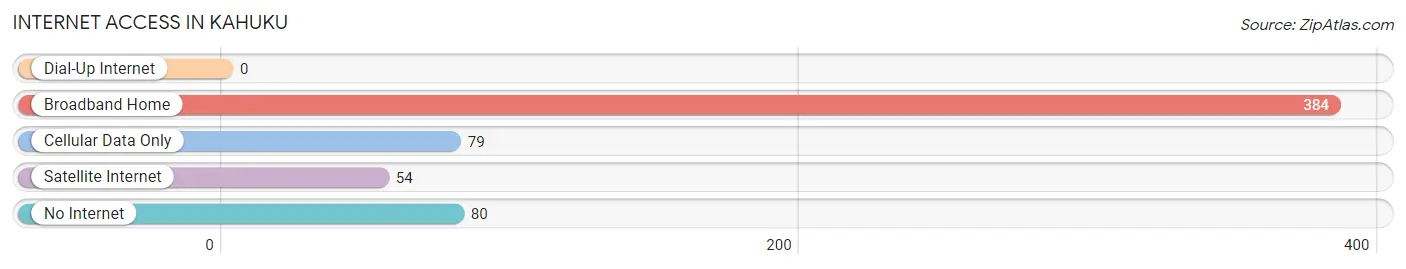
| Internet Type | # Households | % Households |
| Dial-Up Internet | 0 | 0.0% |
| Broadband Home | 384 | 68.4% |
| Cellular Data Only | 79 | 14.1% |
| Satellite Internet | 54 | 9.6% |
| No Internet | 80 | 14.3% |
| Total | 561 | 100.0% |
Kahuku Summary
Kahuku is a small town located on the northern shore of Oahu, Hawaii. It is part of the Honolulu metropolitan area and is located in the Ko’olauloa District of the island. The town is known for its beautiful beaches, lush tropical forests, and its unique culture.
History
Kahuku has a long and rich history that dates back to the early 1800s. The area was originally inhabited by the native Hawaiians, who called the area “Kahuku”, which means “the place of the turtle”. The area was used for fishing and farming, and the native Hawaiians built a number of heiau (temples) in the area.
In the late 1800s, the area was opened up to foreign settlers, and the town of Kahuku was established in 1892. The town was named after the nearby Kahuku Point, which was named after the native Hawaiian word for “turtle”. The town quickly grew and became a popular destination for tourists and locals alike.
In the early 1900s, the town was home to a number of sugar plantations, which provided employment for many of the locals. The town also became a popular destination for surfers, and the nearby beaches were often crowded with surfers from all over the world.
In the late 1900s, the town began to decline as the sugar industry declined and the population began to move away. However, in recent years, the town has seen a resurgence in popularity as tourists and locals alike have rediscovered the beauty of the area.
Geography
Kahuku is located on the northern shore of Oahu, Hawaii. The town is situated on the Ko’olauloa District of the island, and is bordered by the towns of Laie to the east and Waialua to the west. The town is located on the northernmost point of the island, and is surrounded by the Pacific Ocean to the north and the Waianae Mountains to the south.
The town is home to a number of beaches, including the popular Turtle Bay Beach, which is known for its excellent surfing conditions. The town is also home to a number of parks, including the Kahuku State Park, which is home to a variety of native Hawaiian plants and animals.
Economy
Kahuku’s economy is largely based on tourism and agriculture. The town is home to a number of resorts and hotels, which attract tourists from all over the world. The town is also home to a number of farms, which produce a variety of fruits and vegetables.
The town is also home to a number of small businesses, including restaurants, shops, and art galleries. The town is also home to a number of manufacturing companies, which produce a variety of products, including clothing, furniture, and electronics.
Demographics
As of the 2010 census, the population of Kahuku was 4,521. The town is predominantly white, with a small percentage of Asian and Pacific Islander residents. The median age of the town’s residents is 37.7 years, and the median household income is $60,945.
Kahuku is a small town with a rich history and a unique culture. The town is home to a number of beautiful beaches, lush tropical forests, and a variety of businesses and attractions. The town is also home to a diverse population, which makes it a great place to live and visit.
Common Questions
What is Per Capita Income in Kahuku?
Per Capita income in Kahuku is $25,710.
What is the Median Family Income in Kahuku?
Median Family Income in Kahuku is $90,227.
What is the Median Household income in Kahuku?
Median Household Income in Kahuku is $71,758.
What is Income or Wage Gap in Kahuku?
Income or Wage Gap in Kahuku is 30.1%.
Women in Kahuku earn 69.9 cents for every dollar earned by a man.
What is Inequality or Gini Index in Kahuku?
Inequality or Gini Index in Kahuku is 0.41.
What is the Total Population of Kahuku?
Total Population of Kahuku is 2,274.
What is the Total Male Population of Kahuku?
Total Male Population of Kahuku is 981.
What is the Total Female Population of Kahuku?
Total Female Population of Kahuku is 1,293.
What is the Ratio of Males per 100 Females in Kahuku?
There are 75.87 Males per 100 Females in Kahuku.
What is the Ratio of Females per 100 Males in Kahuku?
There are 131.80 Females per 100 Males in Kahuku.
What is the Median Population Age in Kahuku?
Median Population Age in Kahuku is 26.9 Years.
What is the Average Family Size in Kahuku
Average Family Size in Kahuku is 4.7 People.
What is the Average Household Size in Kahuku
Average Household Size in Kahuku is 4.0 People.
How Large is the Labor Force in Kahuku?
There are 1,011 People in the Labor Forcein in Kahuku.
What is the Percentage of People in the Labor Force in Kahuku?
66.1% of People are in the Labor Force in Kahuku.
What is the Unemployment Rate in Kahuku?
Unemployment Rate in Kahuku is 12.2%.