Zip Codes with the Highest Percentage of Population Employed in Agriculture, Fishing & Hunting in Buford, GA
RELATED REPORTS & OPTIONS
Agriculture, Fishing & Hunting
Buford
Compare Zip Codes
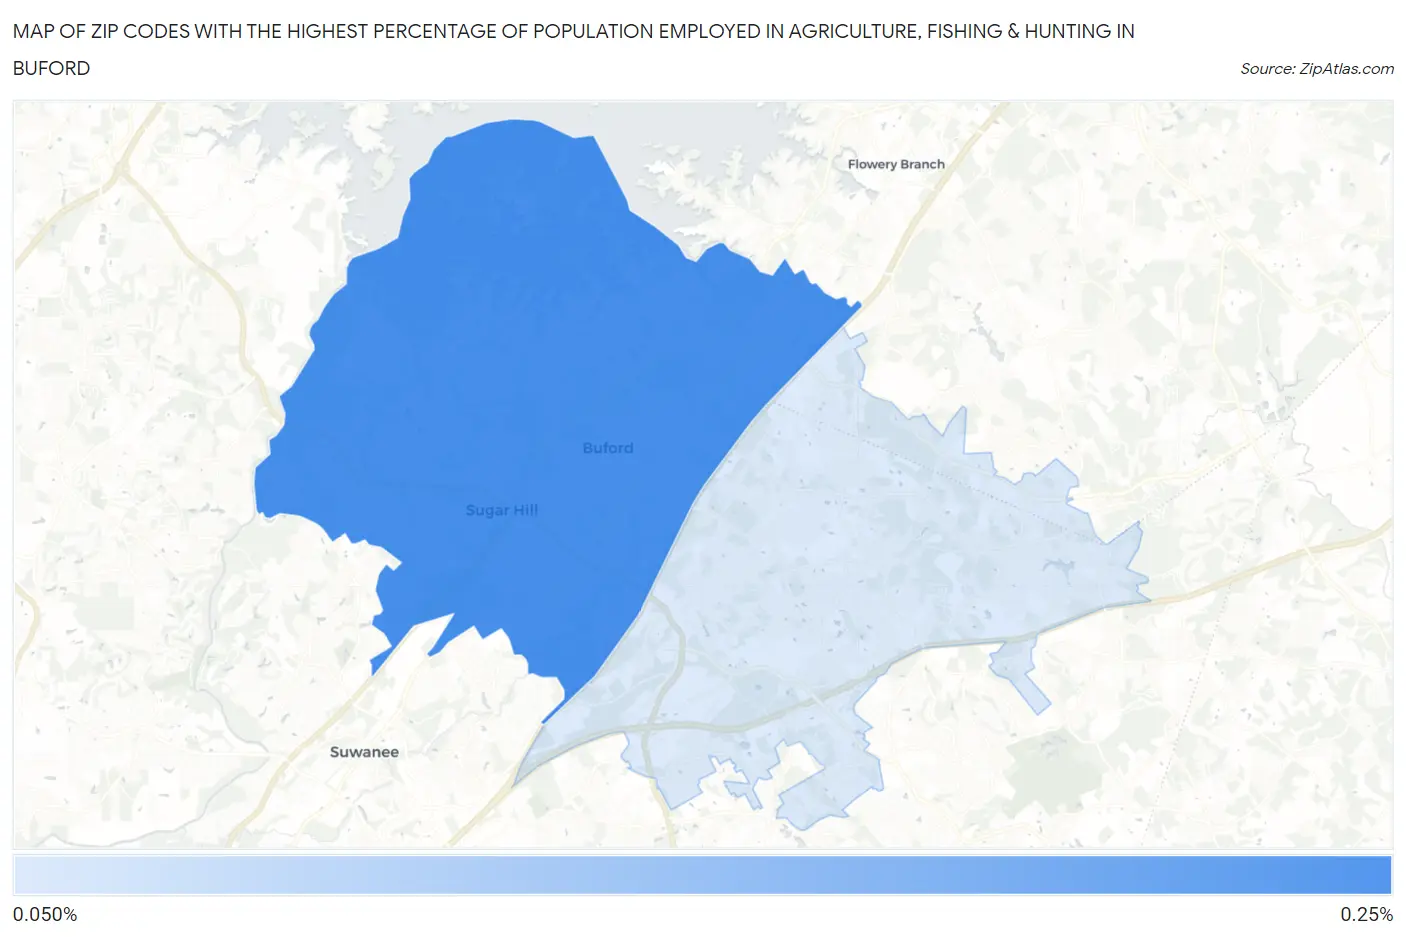
Map of Zip Codes with the Highest Percentage of Population Employed in Agriculture, Fishing & Hunting in Buford
0.0%
0.25%
Zip Codes with the Highest Percentage of Population Employed in Agriculture, Fishing & Hunting in Buford, GA
| Zip Code | % Employed | vs State | vs National | |
| 1. | 30518 | 0.24% | 0.91%(-0.671)#475 | 1.2%(-0.961)#21,896 |
| 2. | 30519 | 0.14% | 0.91%(-0.766)#511 | 1.2%(-1.06)#23,100 |
1
Common Questions
What are the Top Zip Codes with the Highest Percentage of Population Employed in Agriculture, Fishing & Hunting in Buford, GA?
Top Zip Codes with the Highest Percentage of Population Employed in Agriculture, Fishing & Hunting in Buford, GA are:
What zip code has the Highest Percentage of Population Employed in Agriculture, Fishing & Hunting in Buford, GA?
30518 has the Highest Percentage of Population Employed in Agriculture, Fishing & Hunting in Buford, GA with 0.24%.
What is the Percentage of Population Employed in Agriculture, Fishing & Hunting in Buford, GA?
Percentage of Population Employed in Agriculture, Fishing & Hunting in Buford is 0.15%.
What is the Percentage of Population Employed in Agriculture, Fishing & Hunting in Georgia?
Percentage of Population Employed in Agriculture, Fishing & Hunting in Georgia is 0.91%.
What is the Percentage of Population Employed in Agriculture, Fishing & Hunting in the United States?
Percentage of Population Employed in Agriculture, Fishing & Hunting in the United States is 1.2%.