Zip Codes with the Highest Percentage of Population Employed in Agriculture, Fishing & Hunting in Bainbridge, GA
RELATED REPORTS & OPTIONS
Agriculture, Fishing & Hunting
Bainbridge
Compare Zip Codes
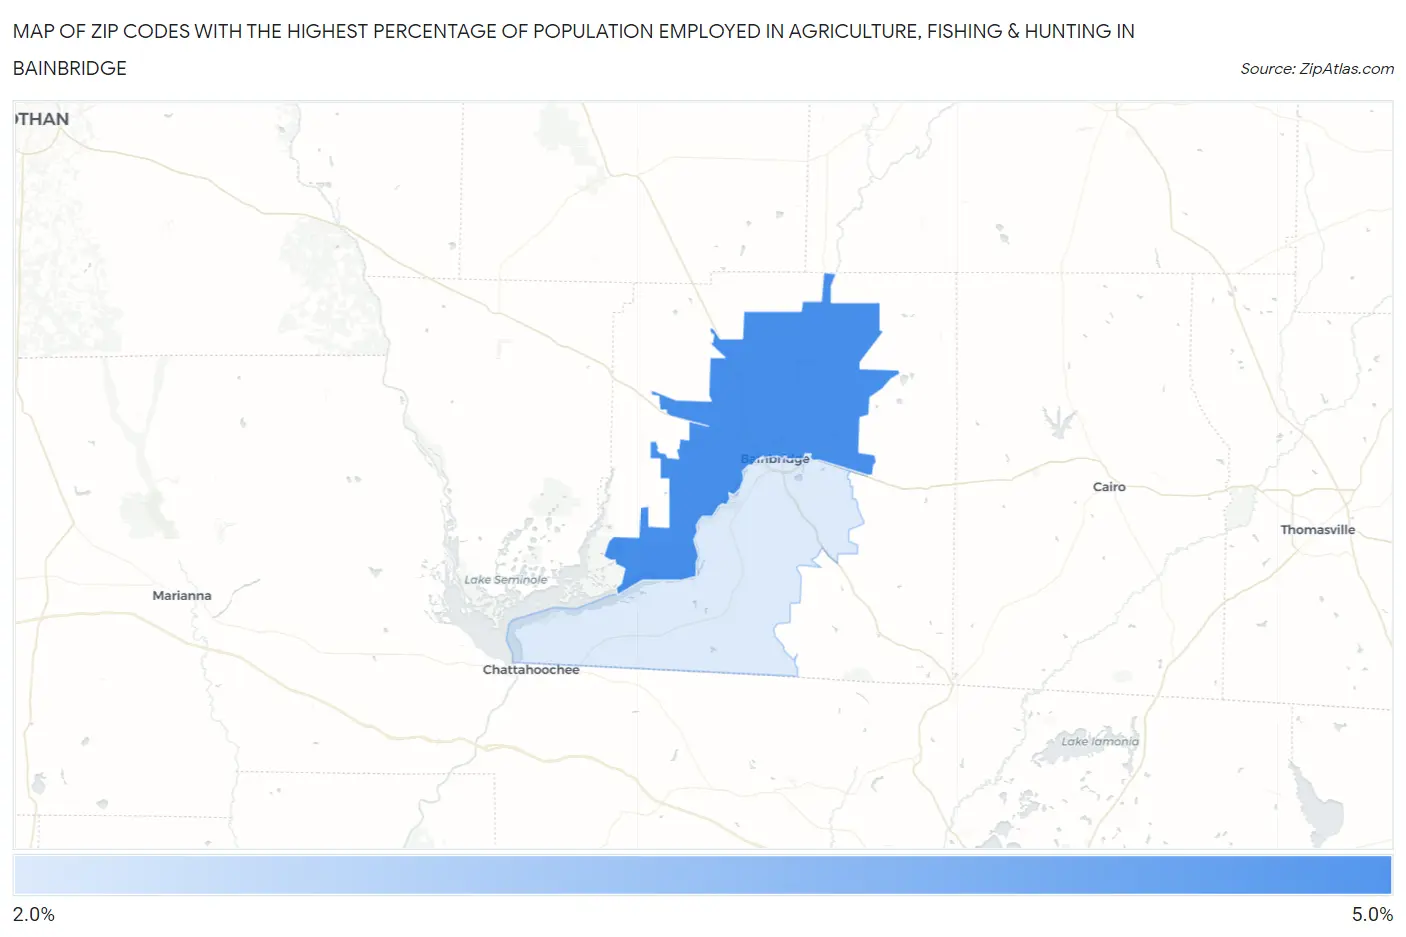
Map of Zip Codes with the Highest Percentage of Population Employed in Agriculture, Fishing & Hunting in Bainbridge
2.3%
4.8%
Zip Codes with the Highest Percentage of Population Employed in Agriculture, Fishing & Hunting in Bainbridge, GA
| Zip Code | % Employed | vs State | vs National | |
| 1. | 39817 | 4.8% | 0.91%(+3.93)#121 | 1.2%(+3.64)#8,025 |
| 2. | 39819 | 2.3% | 0.91%(+1.35)#239 | 1.2%(+1.06)#12,099 |
1
Common Questions
What are the Top Zip Codes with the Highest Percentage of Population Employed in Agriculture, Fishing & Hunting in Bainbridge, GA?
Top Zip Codes with the Highest Percentage of Population Employed in Agriculture, Fishing & Hunting in Bainbridge, GA are:
What zip code has the Highest Percentage of Population Employed in Agriculture, Fishing & Hunting in Bainbridge, GA?
39817 has the Highest Percentage of Population Employed in Agriculture, Fishing & Hunting in Bainbridge, GA with 4.8%.
What is the Percentage of Population Employed in Agriculture, Fishing & Hunting in Bainbridge, GA?
Percentage of Population Employed in Agriculture, Fishing & Hunting in Bainbridge is 2.6%.
What is the Percentage of Population Employed in Agriculture, Fishing & Hunting in Georgia?
Percentage of Population Employed in Agriculture, Fishing & Hunting in Georgia is 0.91%.
What is the Percentage of Population Employed in Agriculture, Fishing & Hunting in the United States?
Percentage of Population Employed in Agriculture, Fishing & Hunting in the United States is 1.2%.