Woodville, FL Map & Demographics
Woodville Map
Woodville Overview
$21,207
PER CAPITA INCOME
$51,793
AVG FAMILY INCOME
$40,313
AVG HOUSEHOLD INCOME
3.3%
WAGE / INCOME GAP [ % ]
96.7¢/ $1
WAGE / INCOME GAP [ $ ]
0.49
INEQUALITY / GINI INDEX
4,356
TOTAL POPULATION
2,082
MALE POPULATION
2,274
FEMALE POPULATION
91.56
MALES / 100 FEMALES
109.22
FEMALES / 100 MALES
39.1
MEDIAN AGE
3.3
AVG FAMILY SIZE
2.8
AVG HOUSEHOLD SIZE
1,847
LABOR FORCE [ PEOPLE ]
58.8%
PERCENT IN LABOR FORCE
6.3%
UNEMPLOYMENT RATE
Woodville Area Codes
Income in Woodville
Income Overview in Woodville
Per Capita Income in Woodville is $21,207, while median incomes of families and households are $51,793 and $40,313 respectively.
| Characteristic | Number | Measure |
| Per Capita Income | 4,356 | $21,207 |
| Median Family Income | 1,151 | $51,793 |
| Mean Family Income | 1,151 | $70,412 |
| Median Household Income | 1,542 | $40,313 |
| Mean Household Income | 1,542 | $61,803 |
| Income Deficit | 1,151 | $0 |
| Wage / Income Gap (%) | 4,356 | 3.26% |
| Wage / Income Gap ($) | 4,356 | 96.74¢ per $1 |
| Gini / Inequality Index | 4,356 | 0.49 |
Earnings by Sex in Woodville
Average Earnings in Woodville are $23,190, $22,976 for men and $23,750 for women, a difference of 3.3%.
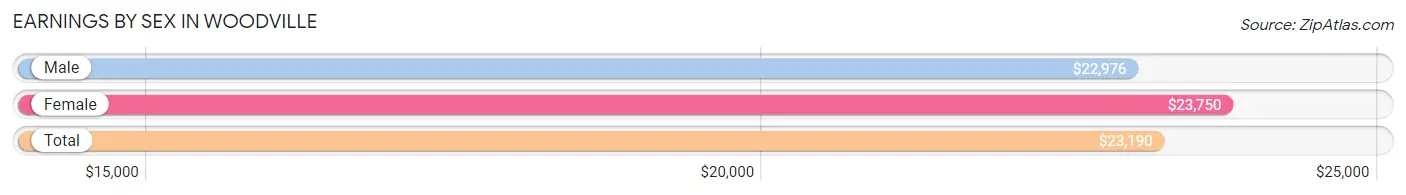
| Sex | Number | Average Earnings |
| Male | 944 (50.0%) | $22,976 |
| Female | 942 (49.9%) | $23,750 |
| Total | 1,886 (100.0%) | $23,190 |
Earnings by Sex by Income Bracket in Woodville
The most common earnings brackets in Woodville are $2,500 to $4,999 for men (107 | 11.3%) and $12,500 to $14,999 for women (211 | 22.4%).
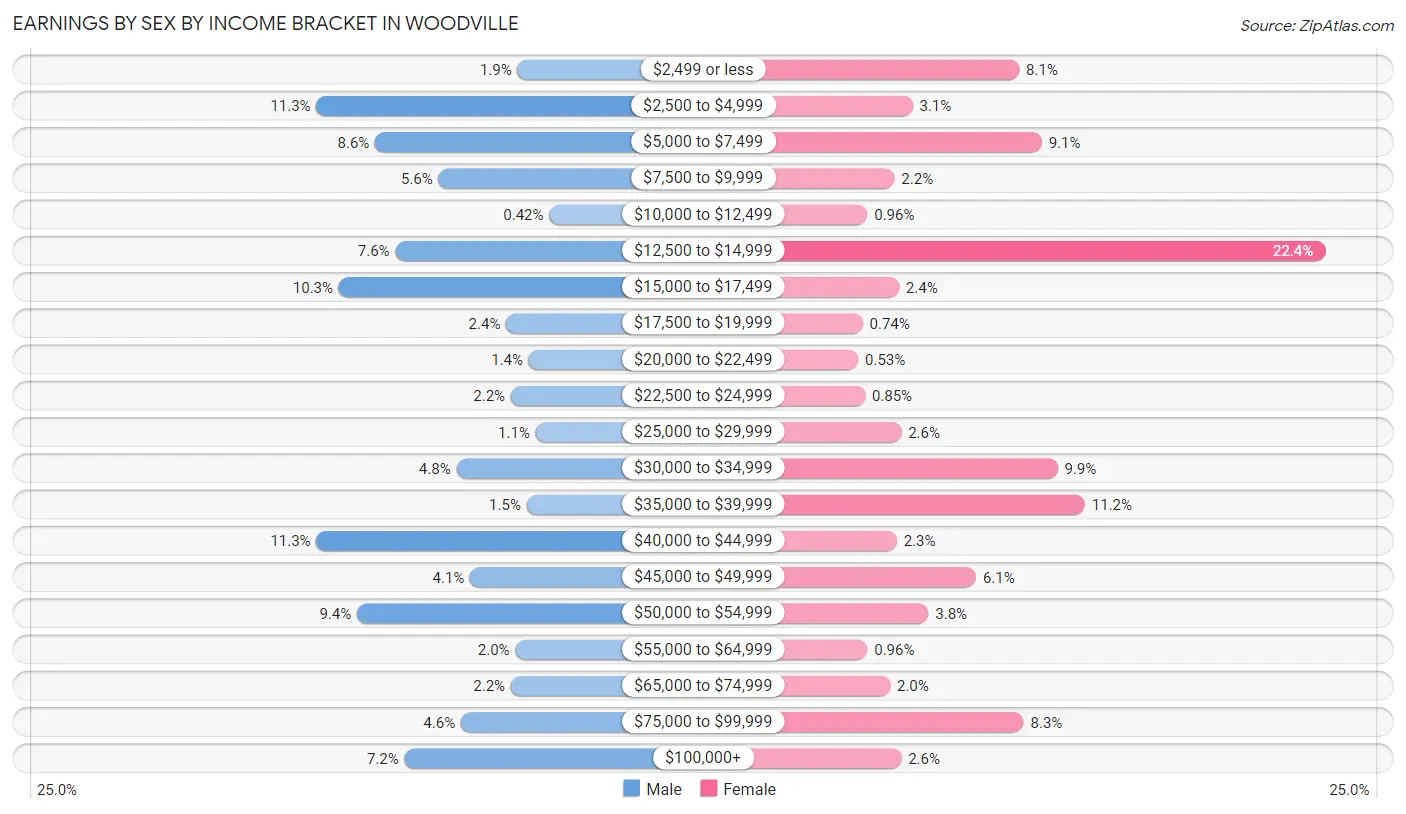
| Income | Male | Female |
| $2,499 or less | 18 (1.9%) | 76 (8.1%) |
| $2,500 to $4,999 | 107 (11.3%) | 29 (3.1%) |
| $5,000 to $7,499 | 81 (8.6%) | 86 (9.1%) |
| $7,500 to $9,999 | 53 (5.6%) | 21 (2.2%) |
| $10,000 to $12,499 | 4 (0.4%) | 9 (1.0%) |
| $12,500 to $14,999 | 72 (7.6%) | 211 (22.4%) |
| $15,000 to $17,499 | 97 (10.3%) | 23 (2.4%) |
| $17,500 to $19,999 | 23 (2.4%) | 7 (0.7%) |
| $20,000 to $22,499 | 13 (1.4%) | 5 (0.5%) |
| $22,500 to $24,999 | 21 (2.2%) | 8 (0.9%) |
| $25,000 to $29,999 | 10 (1.1%) | 24 (2.5%) |
| $30,000 to $34,999 | 45 (4.8%) | 93 (9.9%) |
| $35,000 to $39,999 | 14 (1.5%) | 105 (11.2%) |
| $40,000 to $44,999 | 107 (11.3%) | 22 (2.3%) |
| $45,000 to $49,999 | 39 (4.1%) | 57 (6.0%) |
| $50,000 to $54,999 | 89 (9.4%) | 36 (3.8%) |
| $55,000 to $64,999 | 19 (2.0%) | 9 (1.0%) |
| $65,000 to $74,999 | 21 (2.2%) | 19 (2.0%) |
| $75,000 to $99,999 | 43 (4.6%) | 78 (8.3%) |
| $100,000+ | 68 (7.2%) | 24 (2.5%) |
| Total | 944 (100.0%) | 942 (100.0%) |
Earnings by Sex by Educational Attainment in Woodville
Average earnings in Woodville are $37,768 for men and $34,758 for women, a difference of 8.0%. Men with an educational attainment of bachelor's degree enjoy the highest average annual earnings of $51,360, while those with less than high school education earn the least with $16,556. Women with an educational attainment of graduate degree earn the most with the average annual earnings of $50,530, while those with college or associate's degree education have the smallest earnings of $37,741.
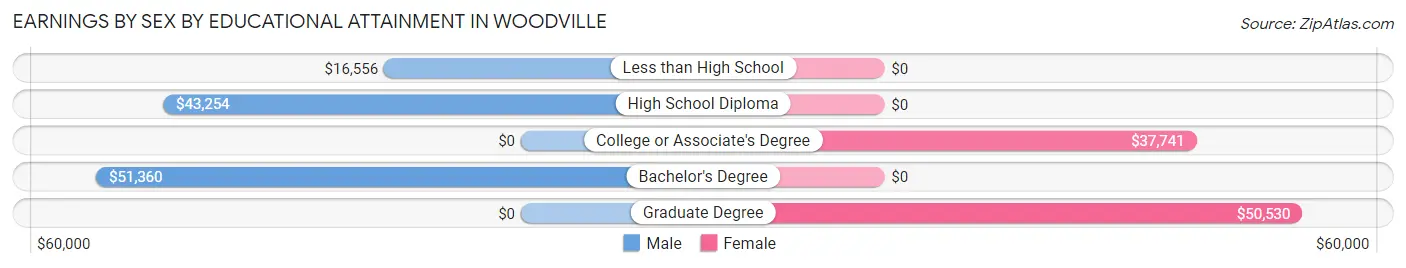
| Educational Attainment | Male Income | Female Income |
| Less than High School | $16,556 | $0 |
| High School Diploma | $43,254 | $0 |
| College or Associate's Degree | - | - |
| Bachelor's Degree | $51,360 | $0 |
| Graduate Degree | - | - |
| Total | $37,768 | $34,758 |
Family Income in Woodville
Family Income Brackets in Woodville
According to the Woodville family income data, there are 211 families falling into the $50,000 to $74,999 income range, which is the most common income bracket and makes up 18.3% of all families. Conversely, the $150,000 to $199,999 income bracket is the least frequent group with only 21 families (1.8%) belonging to this category.
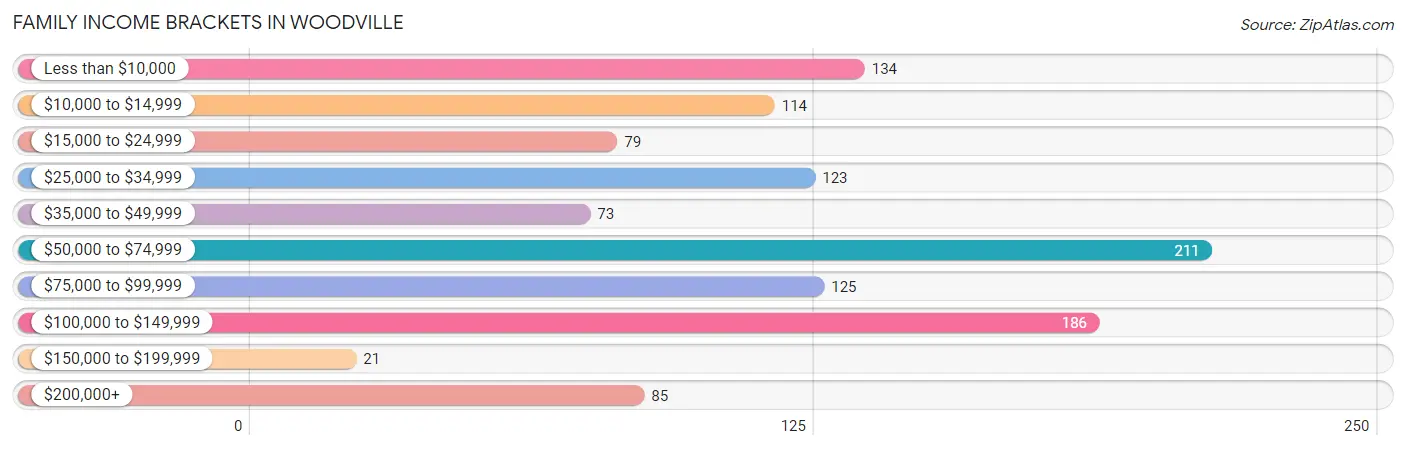
| Income Bracket | # Families | % Families |
| Less than $10,000 | 134 | 11.6% |
| $10,000 to $14,999 | 114 | 9.9% |
| $15,000 to $24,999 | 79 | 6.9% |
| $25,000 to $34,999 | 123 | 10.7% |
| $35,000 to $49,999 | 73 | 6.3% |
| $50,000 to $74,999 | 211 | 18.3% |
| $75,000 to $99,999 | 125 | 10.9% |
| $100,000 to $149,999 | 186 | 16.2% |
| $150,000 to $199,999 | 21 | 1.8% |
| $200,000+ | 85 | 7.4% |
Family Income by Famaliy Size in Woodville
5-person families (130 | 11.3%) account for the highest median family income in Woodville with $250,001 per family, while 5-person families (130 | 11.3%) have the highest median income of $50,000 per family member.
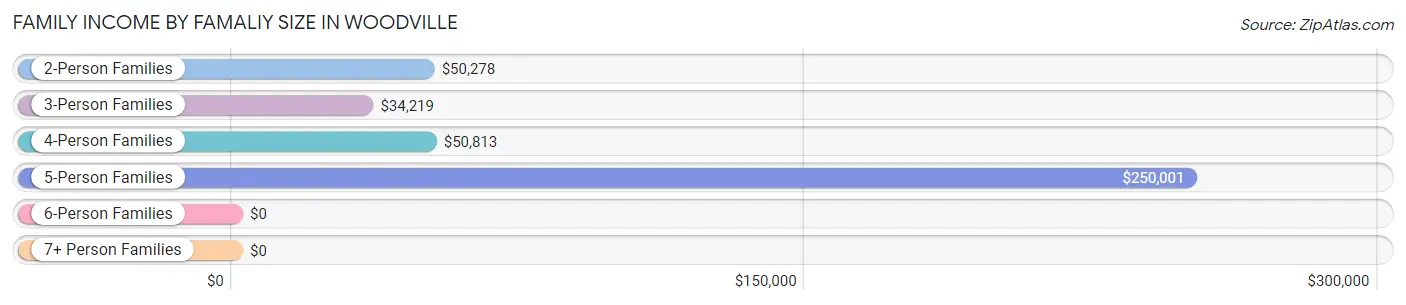
| Income Bracket | # Families | Median Income |
| 2-Person Families | 474 (41.2%) | $50,278 |
| 3-Person Families | 333 (28.9%) | $34,219 |
| 4-Person Families | 168 (14.6%) | $50,813 |
| 5-Person Families | 130 (11.3%) | $250,001 |
| 6-Person Families | 46 (4.0%) | $0 |
| 7+ Person Families | 0 (0.0%) | $0 |
| Total | 1,151 (100.0%) | $51,793 |
Family Income by Number of Earners in Woodville
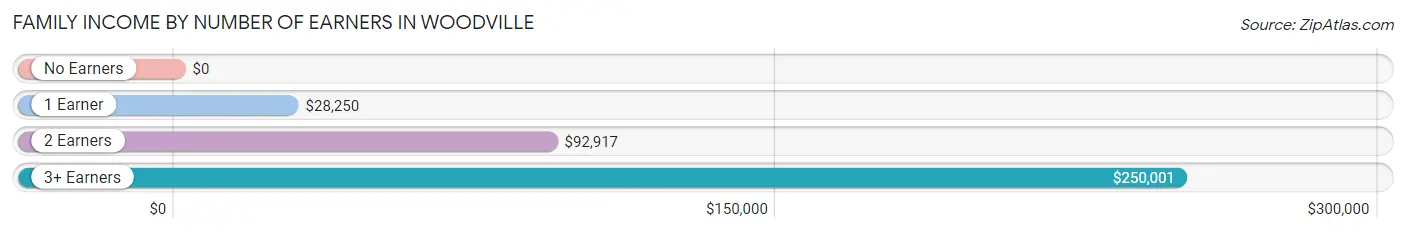
| Number of Earners | # Families | Median Income |
| No Earners | 304 (26.4%) | $0 |
| 1 Earner | 346 (30.1%) | $28,250 |
| 2 Earners | 355 (30.8%) | $92,917 |
| 3+ Earners | 146 (12.7%) | $250,001 |
| Total | 1,151 (100.0%) | $51,793 |
Household Income in Woodville
Household Income Brackets in Woodville
With 233 households falling in the category, the $25,000 to $34,999 income range is the most frequent in Woodville, accounting for 15.1% of all households. In contrast, only 22 households (1.4%) fall into the $150,000 to $199,999 income bracket, making it the least populous group.
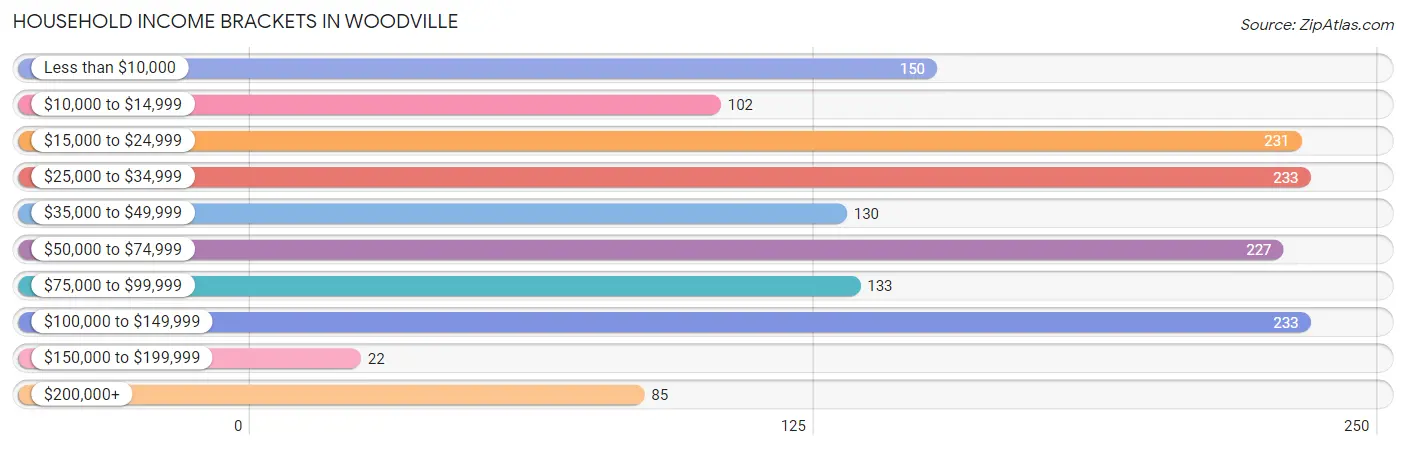
| Income Bracket | # Households | % Households |
| Less than $10,000 | 150 | 9.7% |
| $10,000 to $14,999 | 102 | 6.6% |
| $15,000 to $24,999 | 231 | 15.0% |
| $25,000 to $34,999 | 233 | 15.1% |
| $35,000 to $49,999 | 130 | 8.4% |
| $50,000 to $74,999 | 227 | 14.7% |
| $75,000 to $99,999 | 133 | 8.6% |
| $100,000 to $149,999 | 233 | 15.1% |
| $150,000 to $199,999 | 22 | 1.4% |
| $200,000+ | 85 | 5.5% |
Household Income by Householder Age in Woodville
The median household income in Woodville is $40,313, with the highest median household income of $53,422 found in the 45 to 64 years age bracket for the primary householder. A total of 721 households (46.8%) fall into this category. Meanwhile, the 15 to 24 years age bracket for the primary householder has the lowest median household income of $0, with 39 households (2.5%) in this group.
| Income Bracket | # Households | Median Income |
| 15 to 24 Years | 39 (2.5%) | $0 |
| 25 to 44 Years | 365 (23.7%) | $33,052 |
| 45 to 64 Years | 721 (46.8%) | $53,422 |
| 65+ Years | 417 (27.0%) | $37,944 |
| Total | 1,542 (100.0%) | $40,313 |
Poverty in Woodville
Income Below Poverty by Sex and Age in Woodville
With 20.2% poverty level for males and 25.3% for females among the residents of Woodville, 16 and 17 year old males and 25 to 34 year old females are the most vulnerable to poverty, with 19 males (76.0%) and 140 females (57.1%) in their respective age groups living below the poverty level.
| Age Bracket | Male | Female |
| Under 5 Years | 21 (35.6%) | 62 (27.3%) |
| 5 Years | 0 (0.0%) | 0 (0.0%) |
| 6 to 11 Years | 98 (70.5%) | 50 (40.0%) |
| 12 to 14 Years | 58 (35.8%) | 32 (30.8%) |
| 15 Years | 16 (8.1%) | 14 (12.3%) |
| 16 and 17 Years | 19 (76.0%) | 0 (0.0%) |
| 18 to 24 Years | 18 (11.5%) | 53 (17.8%) |
| 25 to 34 Years | 53 (33.5%) | 140 (57.1%) |
| 35 to 44 Years | 18 (10.6%) | 34 (22.1%) |
| 45 to 54 Years | 72 (19.1%) | 46 (13.9%) |
| 55 to 64 Years | 0 (0.0%) | 81 (25.4%) |
| 65 to 74 Years | 37 (19.3%) | 63 (25.3%) |
| 75 Years and over | 0 (0.0%) | 0 (0.0%) |
| Total | 410 (20.2%) | 575 (25.3%) |
Income Above Poverty by Sex and Age in Woodville
According to the poverty statistics in Woodville, males aged 5 years and females aged 5 years are the age groups that are most secure financially, with 100.0% of males and 100.0% of females in these age groups living above the poverty line.
| Age Bracket | Male | Female |
| Under 5 Years | 38 (64.4%) | 165 (72.7%) |
| 5 Years | 23 (100.0%) | 17 (100.0%) |
| 6 to 11 Years | 41 (29.5%) | 75 (60.0%) |
| 12 to 14 Years | 104 (64.2%) | 72 (69.2%) |
| 15 Years | 181 (91.9%) | 100 (87.7%) |
| 16 and 17 Years | 6 (24.0%) | 0 (0.0%) |
| 18 to 24 Years | 139 (88.5%) | 244 (82.2%) |
| 25 to 34 Years | 105 (66.5%) | 105 (42.9%) |
| 35 to 44 Years | 151 (89.3%) | 120 (77.9%) |
| 45 to 54 Years | 306 (80.9%) | 284 (86.1%) |
| 55 to 64 Years | 304 (100.0%) | 238 (74.6%) |
| 65 to 74 Years | 155 (80.7%) | 186 (74.7%) |
| 75 Years and over | 71 (100.0%) | 93 (100.0%) |
| Total | 1,624 (79.8%) | 1,699 (74.7%) |
Income Below Poverty Among Married-Couple Families in Woodville
The poverty statistics for married-couple families in Woodville show that 8.3% or 56 of the total 672 families live below the poverty line. Families with no children have the highest poverty rate of 14.2%, comprising of 56 families. On the other hand, families with 1 or 2 children have the lowest poverty rate of 0.0%, which includes 0 families.
| Children | Above Poverty | Below Poverty |
| No Children | 337 (85.8%) | 56 (14.2%) |
| 1 or 2 Children | 274 (100.0%) | 0 (0.0%) |
| 3 or 4 Children | 5 (100.0%) | 0 (0.0%) |
| 5 or more Children | 0 (0.0%) | 0 (0.0%) |
| Total | 616 (91.7%) | 56 (8.3%) |
Income Below Poverty Among Single-Parent Households in Woodville
According to the poverty data in Woodville, 86.7% or 26 single-father households and 54.3% or 244 single-mother households are living below the poverty line. Among single-father households, those with no children have the highest poverty rate, with 26 households (86.7%) experiencing poverty. Likewise, among single-mother households, those with 3 or 4 children have the highest poverty rate, with 30 households (100.0%) falling below the poverty line.
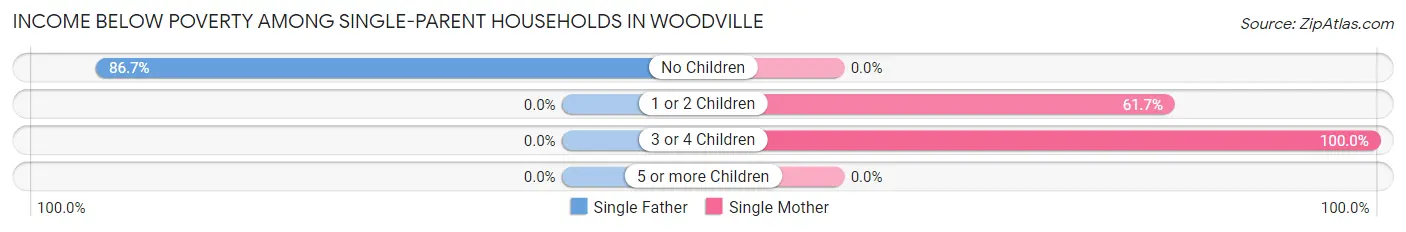
| Children | Single Father | Single Mother |
| No Children | 26 (86.7%) | 0 (0.0%) |
| 1 or 2 Children | 0 (0.0%) | 214 (61.7%) |
| 3 or 4 Children | 0 (0.0%) | 30 (100.0%) |
| 5 or more Children | 0 (0.0%) | 0 (0.0%) |
| Total | 26 (86.7%) | 244 (54.3%) |
Income Below Poverty Among Married-Couple vs Single-Parent Households in Woodville
The poverty data for Woodville shows that 56 of the married-couple family households (8.3%) and 270 of the single-parent households (56.4%) are living below the poverty level. Within the married-couple family households, those with no children have the highest poverty rate, with 56 households (14.2%) falling below the poverty line. Among the single-parent households, those with 3 or 4 children have the highest poverty rate, with 30 household (100.0%) living below poverty.
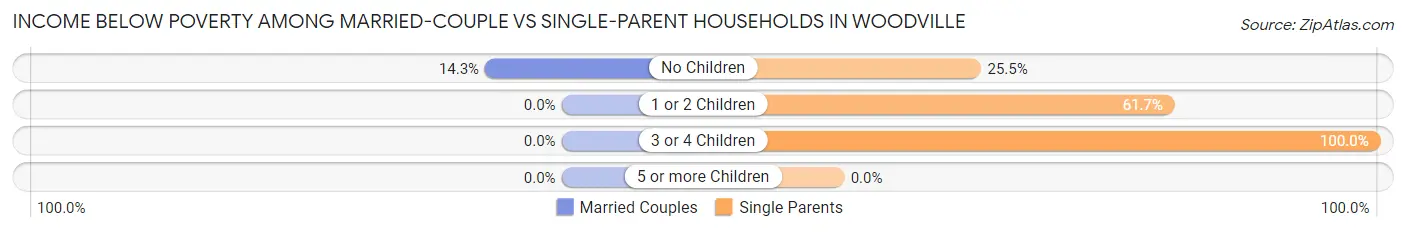
| Children | Married-Couple Families | Single-Parent Households |
| No Children | 56 (14.2%) | 26 (25.5%) |
| 1 or 2 Children | 0 (0.0%) | 214 (61.7%) |
| 3 or 4 Children | 0 (0.0%) | 30 (100.0%) |
| 5 or more Children | 0 (0.0%) | 0 (0.0%) |
| Total | 56 (8.3%) | 270 (56.4%) |
Race in Woodville
The most populous races in Woodville are White / Caucasian (2,979 | 68.4%), Black / African American (1,125 | 25.8%), and Hispanic or Latino (222 | 5.1%).
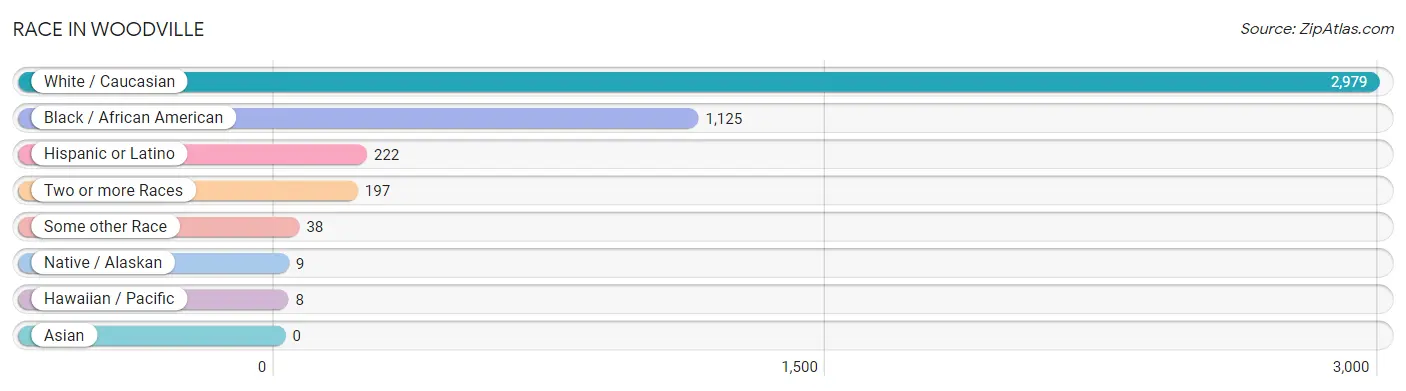
| Race | # Population | % Population |
| Asian | 0 | 0.0% |
| Black / African American | 1,125 | 25.8% |
| Hawaiian / Pacific | 8 | 0.2% |
| Hispanic or Latino | 222 | 5.1% |
| Native / Alaskan | 9 | 0.2% |
| White / Caucasian | 2,979 | 68.4% |
| Two or more Races | 197 | 4.5% |
| Some other Race | 38 | 0.9% |
| Total | 4,356 | 100.0% |
Ancestry in Woodville
The most populous ancestries reported in Woodville are Irish (423 | 9.7%), American (355 | 8.2%), German (333 | 7.6%), Cuban (131 | 3.0%), and European (106 | 2.4%), together accounting for 30.9% of all Woodville residents.
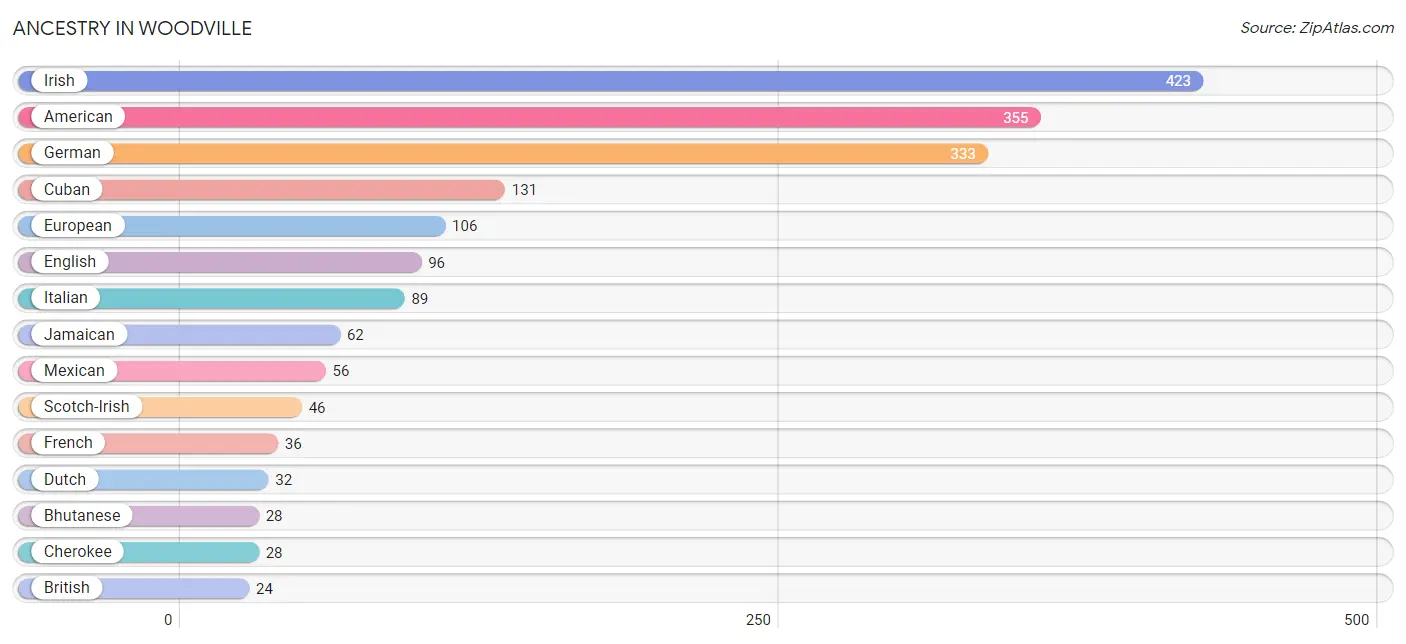
| Ancestry | # Population | % Population |
| African | 10 | 0.2% |
| American | 355 | 8.2% |
| Bhutanese | 28 | 0.6% |
| British | 24 | 0.5% |
| Central American | 8 | 0.2% |
| Cherokee | 28 | 0.6% |
| Creek | 9 | 0.2% |
| Cuban | 131 | 3.0% |
| Dutch | 32 | 0.7% |
| English | 96 | 2.2% |
| European | 106 | 2.4% |
| French | 36 | 0.8% |
| German | 333 | 7.6% |
| Guamanian / Chamorro | 8 | 0.2% |
| Irish | 423 | 9.7% |
| Italian | 89 | 2.0% |
| Jamaican | 62 | 1.4% |
| Lithuanian | 9 | 0.2% |
| Mexican | 56 | 1.3% |
| Native Hawaiian | 8 | 0.2% |
| Panamanian | 8 | 0.2% |
| Puerto Rican | 17 | 0.4% |
| Scotch-Irish | 46 | 1.1% |
| Scottish | 5 | 0.1% |
| Spanish | 10 | 0.2% |
| Subsaharan African | 10 | 0.2% |
| Swedish | 8 | 0.2% |
| Ukrainian | 9 | 0.2% |
| Welsh | 16 | 0.4% | View All 29 Rows |
Immigrants in Woodville
The most numerous immigrant groups reported in Woodville came from Caribbean (28 | 0.6%), Jamaica (28 | 0.6%), and Latin America (28 | 0.6%), together accounting for 1.9% of all Woodville residents.
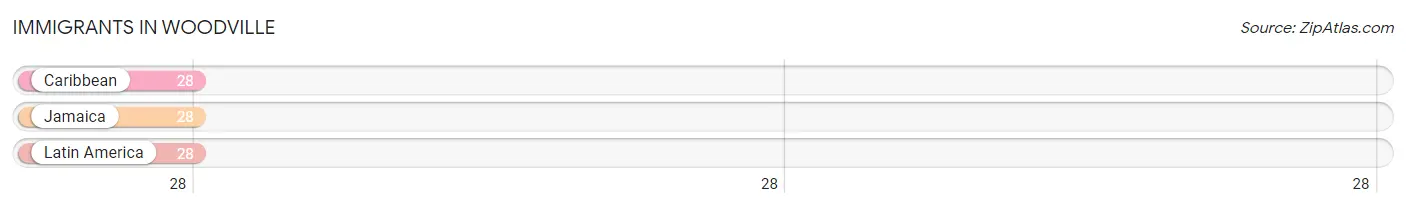
| Immigration Origin | # Population | % Population |
| Caribbean | 28 | 0.6% |
| Jamaica | 28 | 0.6% |
| Latin America | 28 | 0.6% | View All 3 Rows |
Sex and Age in Woodville
Sex and Age in Woodville
The most populous age groups in Woodville are 10 to 14 Years (261 | 12.5%) for men and 20 to 24 Years (265 | 11.7%) for women.
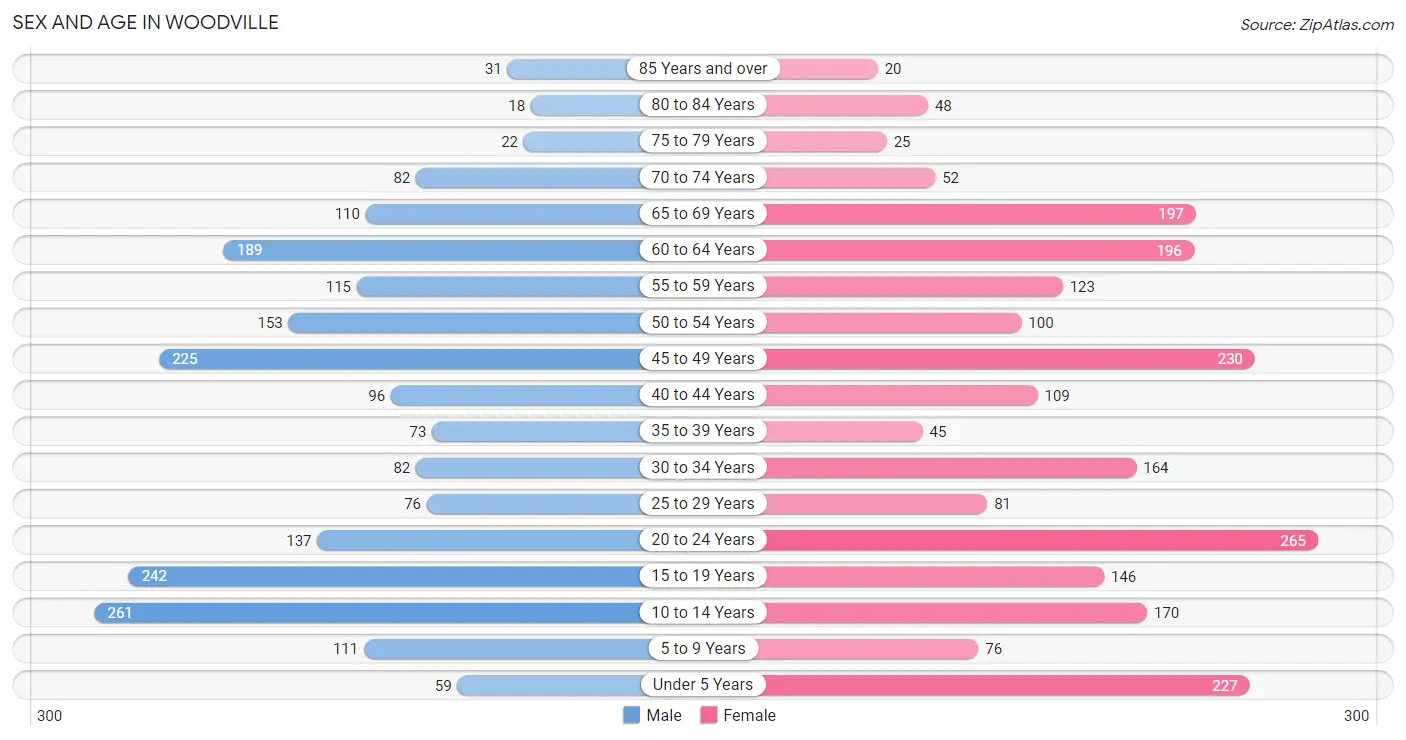
| Age Bracket | Male | Female |
| Under 5 Years | 59 (2.8%) | 227 (10.0%) |
| 5 to 9 Years | 111 (5.3%) | 76 (3.3%) |
| 10 to 14 Years | 261 (12.5%) | 170 (7.5%) |
| 15 to 19 Years | 242 (11.6%) | 146 (6.4%) |
| 20 to 24 Years | 137 (6.6%) | 265 (11.7%) |
| 25 to 29 Years | 76 (3.6%) | 81 (3.6%) |
| 30 to 34 Years | 82 (3.9%) | 164 (7.2%) |
| 35 to 39 Years | 73 (3.5%) | 45 (2.0%) |
| 40 to 44 Years | 96 (4.6%) | 109 (4.8%) |
| 45 to 49 Years | 225 (10.8%) | 230 (10.1%) |
| 50 to 54 Years | 153 (7.3%) | 100 (4.4%) |
| 55 to 59 Years | 115 (5.5%) | 123 (5.4%) |
| 60 to 64 Years | 189 (9.1%) | 196 (8.6%) |
| 65 to 69 Years | 110 (5.3%) | 197 (8.7%) |
| 70 to 74 Years | 82 (3.9%) | 52 (2.3%) |
| 75 to 79 Years | 22 (1.1%) | 25 (1.1%) |
| 80 to 84 Years | 18 (0.9%) | 48 (2.1%) |
| 85 Years and over | 31 (1.5%) | 20 (0.9%) |
| Total | 2,082 (100.0%) | 2,274 (100.0%) |
Families and Households in Woodville
Median Family Size in Woodville
The median family size in Woodville is 3.30 persons per family, with married-couple families (672 | 58.4%) accounting for the largest median family size of 3.42 persons per family. On the other hand, single male/father families (30 | 2.6%) represent the smallest median family size with 2.03 persons per family.
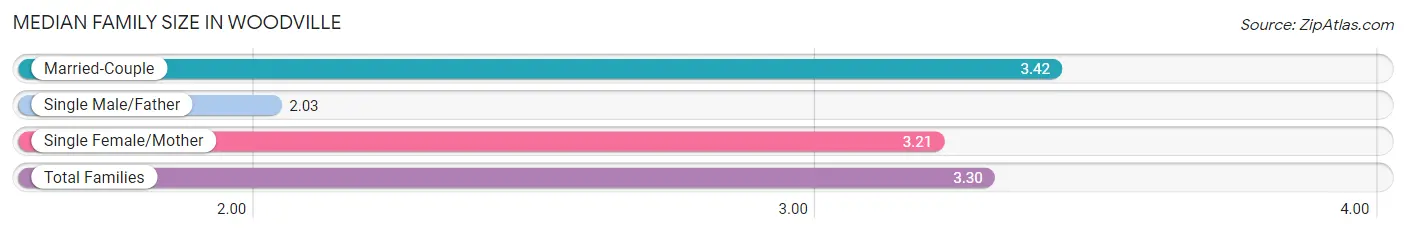
| Family Type | # Families | Family Size |
| Married-Couple | 672 (58.4%) | 3.42 |
| Single Male/Father | 30 (2.6%) | 2.03 |
| Single Female/Mother | 449 (39.0%) | 3.21 |
| Total Families | 1,151 (100.0%) | 3.30 |
Median Household Size in Woodville
The median household size in Woodville is 2.82 persons per household, with single female/mother households (449 | 29.1%) accounting for the largest median household size of 3.44 persons per household. non-family households (391 | 25.4%) represent the smallest median household size with 1.14 persons per household.
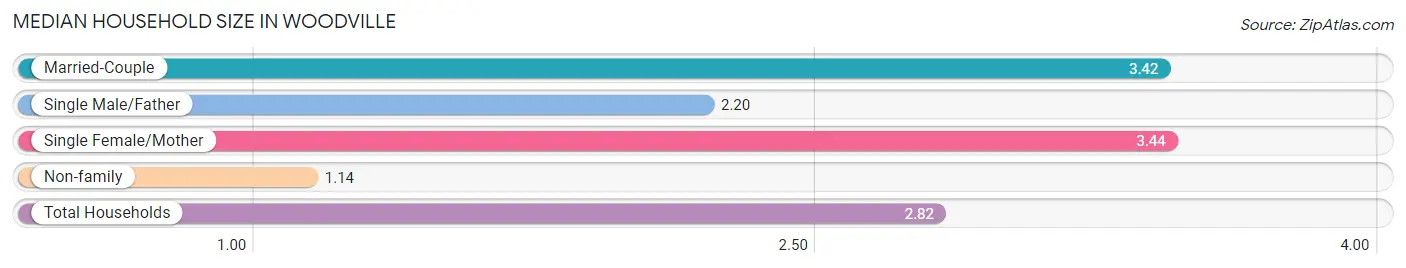
| Household Type | # Households | Household Size |
| Married-Couple | 672 (43.6%) | 3.42 |
| Single Male/Father | 30 (1.9%) | 2.20 |
| Single Female/Mother | 449 (29.1%) | 3.44 |
| Non-family | 391 (25.4%) | 1.14 |
| Total Households | 1,542 (100.0%) | 2.82 |
Household Size by Marriage Status in Woodville
Out of a total of 1,542 households in Woodville, 1,151 (74.6%) are family households, while 391 (25.4%) are nonfamily households. The most numerous type of family households are 2-person households, comprising 418, and the most common type of nonfamily households are 1-person households, comprising 342.
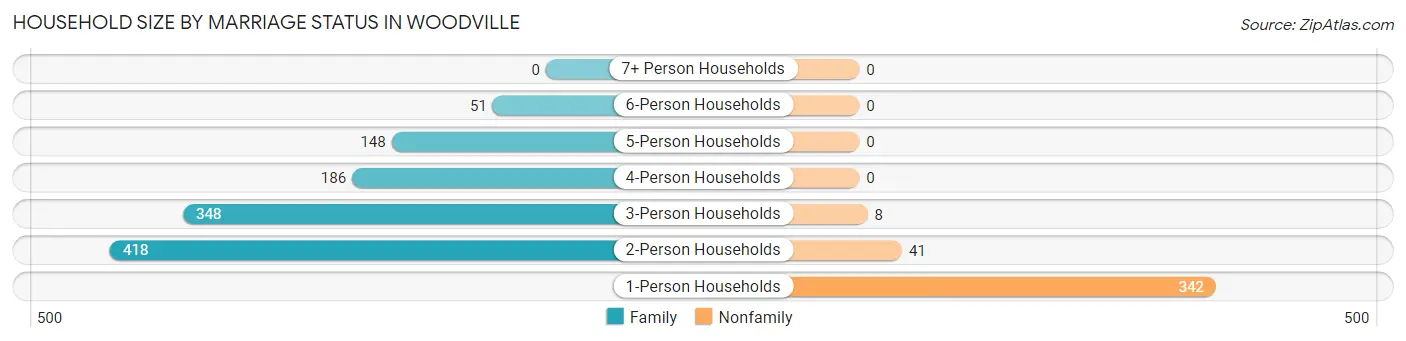
| Household Size | Family Households | Nonfamily Households |
| 1-Person Households | - | 342 (22.2%) |
| 2-Person Households | 418 (27.1%) | 41 (2.7%) |
| 3-Person Households | 348 (22.6%) | 8 (0.5%) |
| 4-Person Households | 186 (12.1%) | 0 (0.0%) |
| 5-Person Households | 148 (9.6%) | 0 (0.0%) |
| 6-Person Households | 51 (3.3%) | 0 (0.0%) |
| 7+ Person Households | 0 (0.0%) | 0 (0.0%) |
| Total | 1,151 (74.6%) | 391 (25.4%) |
Female Fertility in Woodville
Fertility by Age in Woodville
Average fertility rate in Woodville is 17.0 births per 1,000 women. Women in the age bracket of 20 to 34 years have the highest fertility rate with 35.0 births per 1,000 women. Women in the age bracket of 20 to 34 years acount for 100.0% of all women with births.
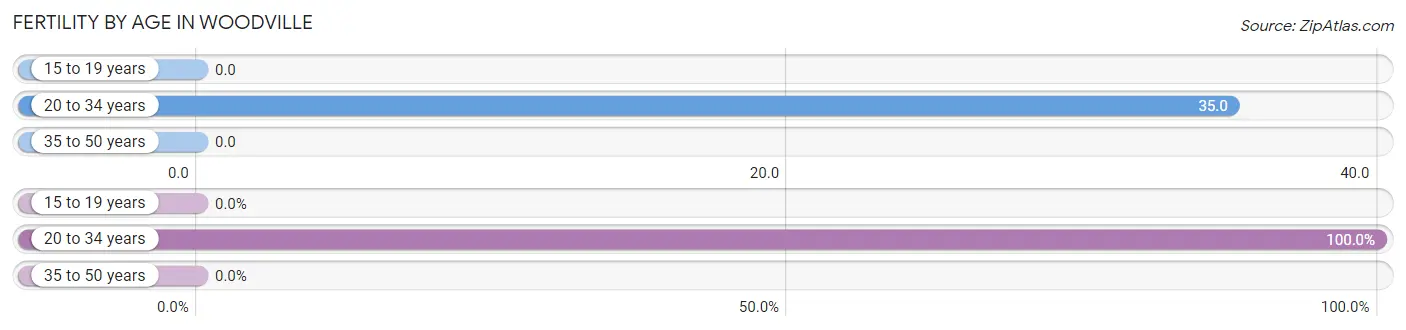
| Age Bracket | Women with Births | Births / 1,000 Women |
| 15 to 19 years | 0 (0.0%) | 0.0 |
| 20 to 34 years | 18 (100.0%) | 35.0 |
| 35 to 50 years | 0 (0.0%) | 0.0 |
| Total | 18 (100.0%) | 17.0 |
Fertility by Age by Marriage Status in Woodville
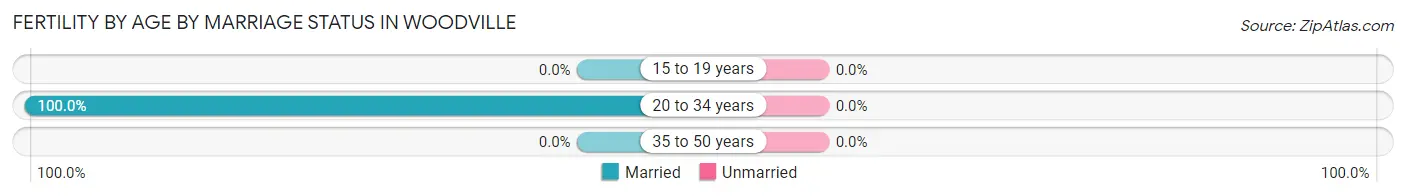
| Age Bracket | Married | Unmarried |
| 15 to 19 years | 0 (0.0%) | 0 (0.0%) |
| 20 to 34 years | 18 (100.0%) | 0 (0.0%) |
| 35 to 50 years | 0 (0.0%) | 0 (0.0%) |
| Total | 18 (100.0%) | 0 (0.0%) |
Fertility by Education in Woodville
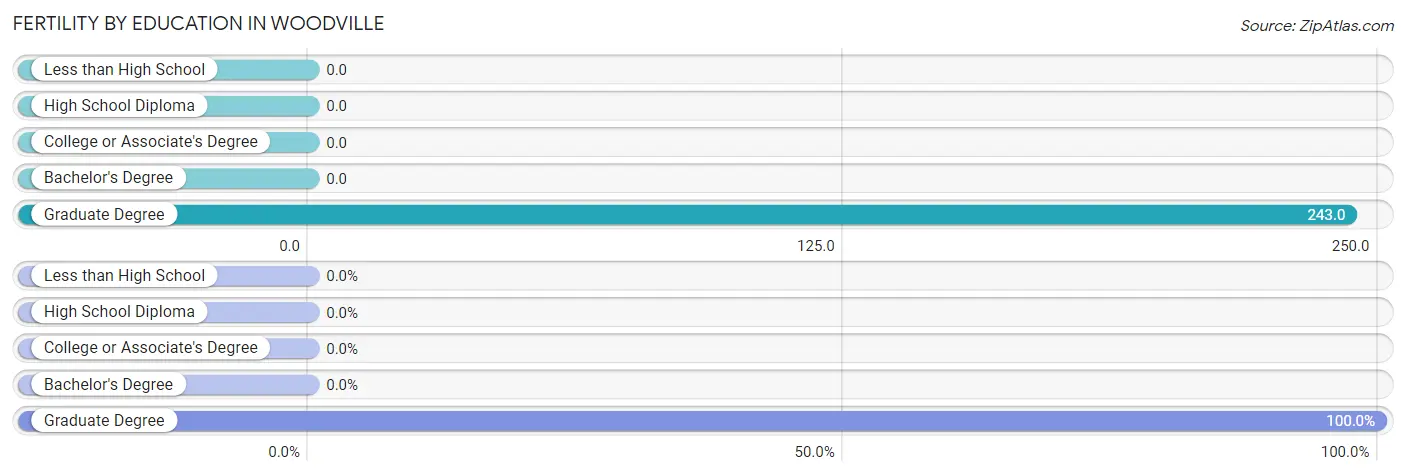
| Educational Attainment | Women with Births | Births / 1,000 Women |
| Less than High School | 0 (0.0%) | 0.0 |
| High School Diploma | 0 (0.0%) | 0.0 |
| College or Associate's Degree | 0 (0.0%) | 0.0 |
| Bachelor's Degree | 0 (0.0%) | 0.0 |
| Graduate Degree | 18 (100.0%) | 243.0 |
| Total | 18 (100.0%) | 17.0 |
Fertility by Education by Marriage Status in Woodville
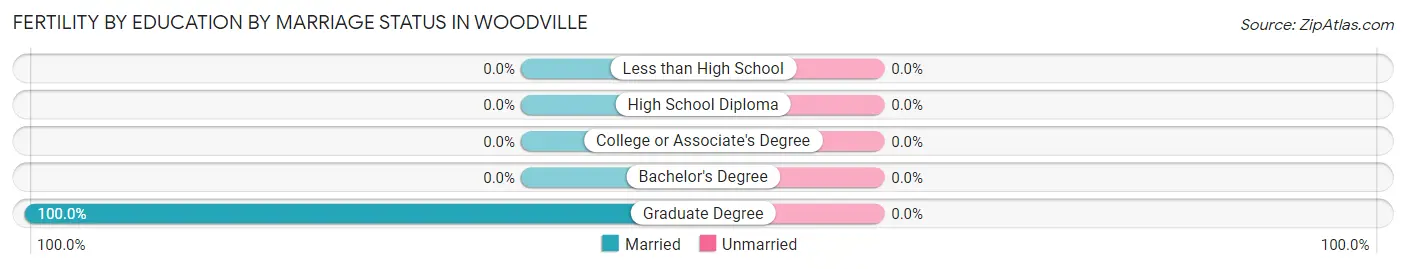
| Educational Attainment | Married | Unmarried |
| Less than High School | 0 (0.0%) | 0 (0.0%) |
| High School Diploma | 0 (0.0%) | 0 (0.0%) |
| College or Associate's Degree | 0 (0.0%) | 0 (0.0%) |
| Bachelor's Degree | 0 (0.0%) | 0 (0.0%) |
| Graduate Degree | 18 (100.0%) | 0 (0.0%) |
| Total | 18 (100.0%) | 0 (0.0%) |
Employment Characteristics in Woodville
Employment by Class of Employer in Woodville
Among the 1,732 employed individuals in Woodville, private company employees (1,241 | 71.7%), state government employees (205 | 11.8%), and local government employees (133 | 7.7%) make up the most common classes of employment.
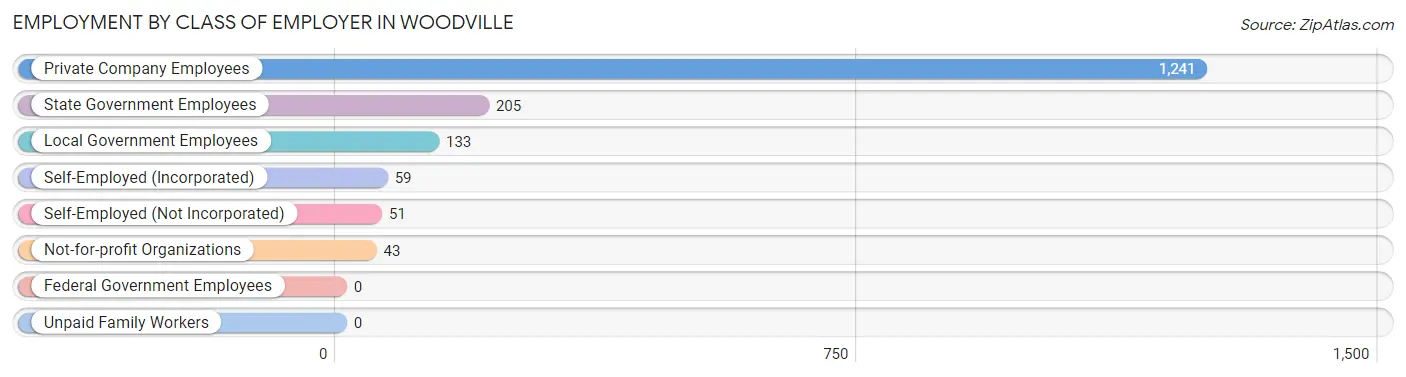
| Employer Class | # Employees | % Employees |
| Private Company Employees | 1,241 | 71.7% |
| Self-Employed (Incorporated) | 59 | 3.4% |
| Self-Employed (Not Incorporated) | 51 | 2.9% |
| Not-for-profit Organizations | 43 | 2.5% |
| Local Government Employees | 133 | 7.7% |
| State Government Employees | 205 | 11.8% |
| Federal Government Employees | 0 | 0.0% |
| Unpaid Family Workers | 0 | 0.0% |
| Total | 1,732 | 100.0% |
Employment Status by Age in Woodville
According to the labor force statistics for Woodville, out of the total population over 16 years of age (3,141), 58.8% or 1,847 individuals are in the labor force, with 6.3% or 116 of them unemployed. The age group with the highest labor force participation rate is 30 to 34 years, with 100.0% or 246 individuals in the labor force. Within the labor force, the 16 to 19 years age range has the highest percentage of unemployed individuals, with 40.0% or 16 of them being unemployed.
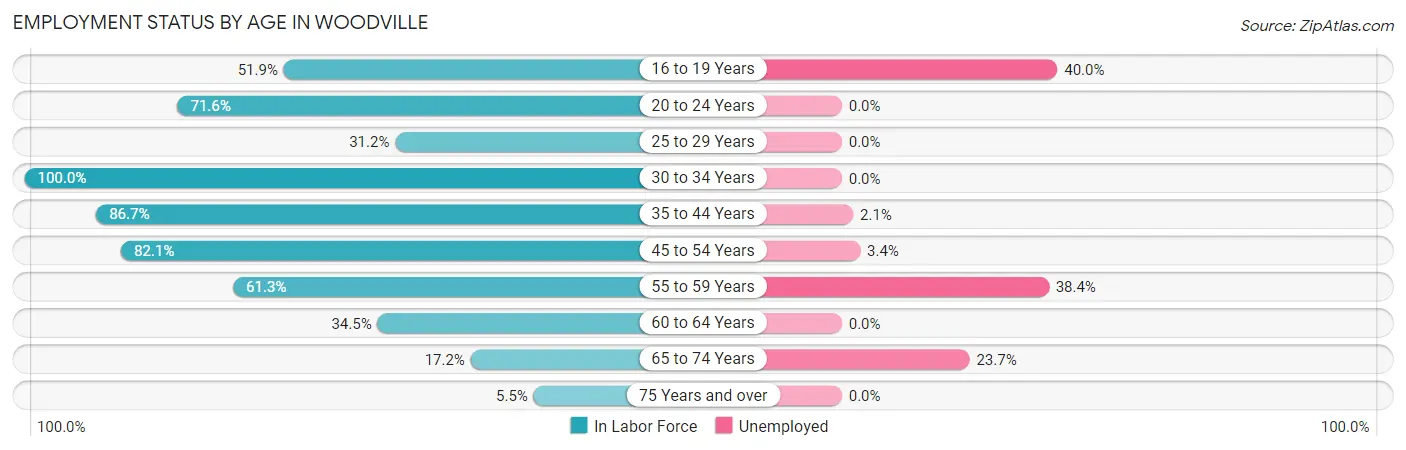
| Age Bracket | In Labor Force | Unemployed |
| 16 to 19 Years | 40 (51.9%) | 16 (40.0%) |
| 20 to 24 Years | 288 (71.6%) | 0 (0.0%) |
| 25 to 29 Years | 49 (31.2%) | 0 (0.0%) |
| 30 to 34 Years | 246 (100.0%) | 0 (0.0%) |
| 35 to 44 Years | 280 (86.7%) | 6 (2.1%) |
| 45 to 54 Years | 581 (82.1%) | 20 (3.4%) |
| 55 to 59 Years | 146 (61.3%) | 56 (38.4%) |
| 60 to 64 Years | 133 (34.5%) | 0 (0.0%) |
| 65 to 74 Years | 76 (17.2%) | 18 (23.7%) |
| 75 Years and over | 9 (5.5%) | 0 (0.0%) |
| Total | 1,847 (58.8%) | 116 (6.3%) |
Employment Status by Educational Attainment in Woodville
According to labor force statistics for Woodville, 69.8% of individuals (1,436) out of the total population between 25 and 64 years of age (2,057) are in the labor force, with 5.7% or 82 of them being unemployed. The group with the highest labor force participation rate are those with the educational attainment of bachelor's degree or higher, with 90.4% or 500 individuals in the labor force. Within the labor force, individuals with less than high school education have the highest percentage of unemployment, with 18.9% or 20 of them being unemployed.
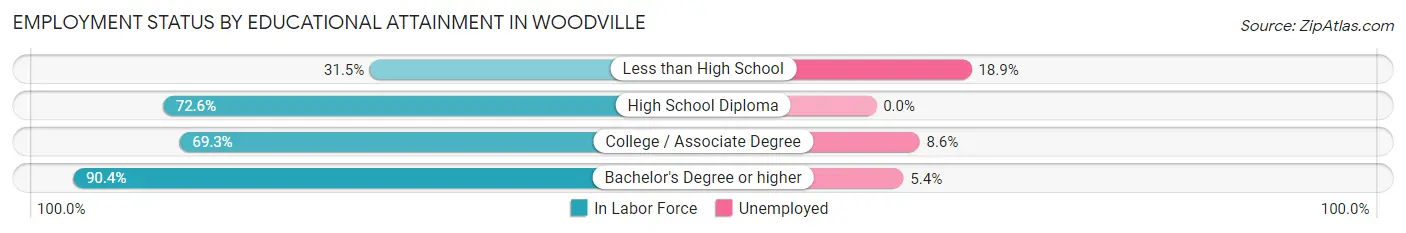
| Educational Attainment | In Labor Force | Unemployed |
| Less than High School | 106 (31.5%) | 64 (18.9%) |
| High School Diploma | 422 (72.6%) | 0 (0.0%) |
| College / Associate Degree | 407 (69.3%) | 50 (8.6%) |
| Bachelor's Degree or higher | 500 (90.4%) | 30 (5.4%) |
| Total | 1,436 (69.8%) | 117 (5.7%) |
Employment Occupations by Sex in Woodville
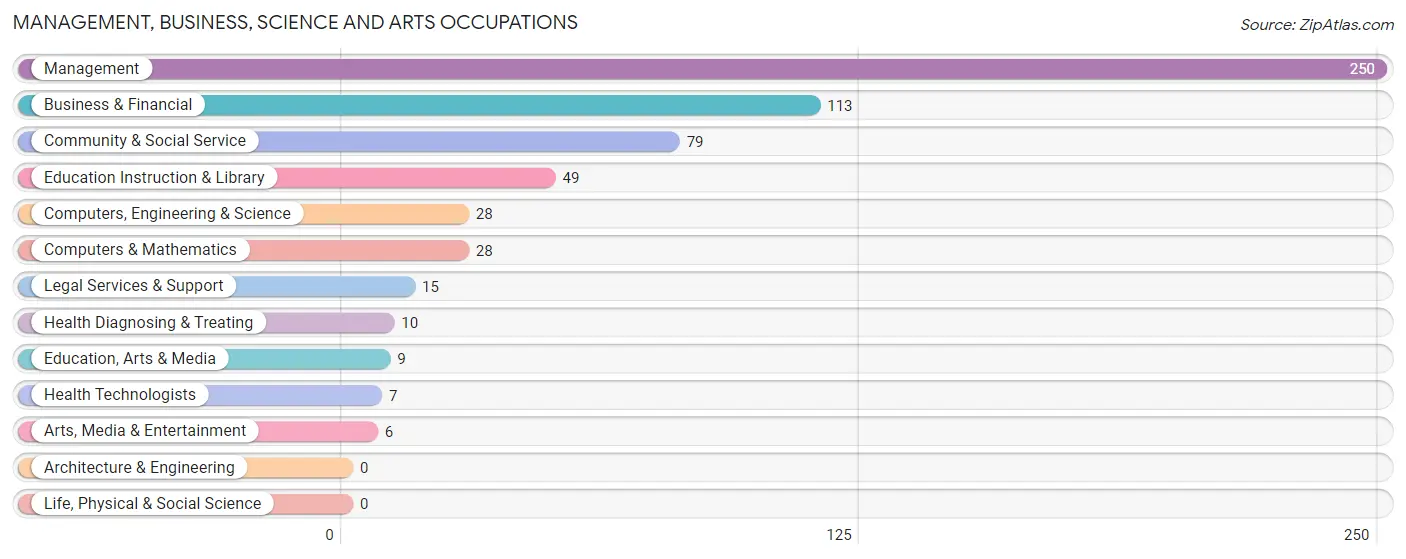
Management, Business, Science and Arts Occupations
The most common Management, Business, Science and Arts occupations in Woodville are Management (250 | 14.4%), Business & Financial (113 | 6.5%), Community & Social Service (79 | 4.6%), Education Instruction & Library (49 | 2.8%), and Computers, Engineering & Science (28 | 1.6%).
Management, Business, Science and Arts Occupations by Sex
Within the Management, Business, Science and Arts occupations in Woodville, the most male-oriented occupations are Arts, Media & Entertainment (100.0%), Management (41.2%), and Education Instruction & Library (32.7%), while the most female-oriented occupations are Education, Arts & Media (100.0%), Legal Services & Support (100.0%), and Health Diagnosing & Treating (100.0%).
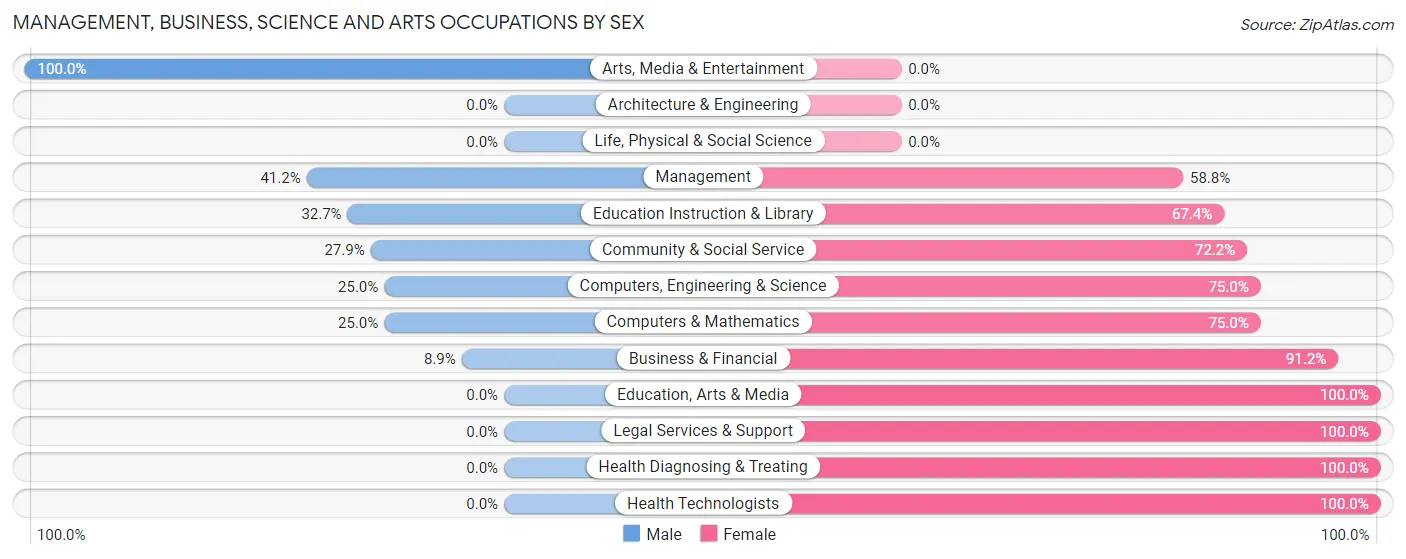
| Occupation | Male | Female |
| Management | 103 (41.2%) | 147 (58.8%) |
| Business & Financial | 10 (8.8%) | 103 (91.1%) |
| Computers, Engineering & Science | 7 (25.0%) | 21 (75.0%) |
| Computers & Mathematics | 7 (25.0%) | 21 (75.0%) |
| Architecture & Engineering | 0 (0.0%) | 0 (0.0%) |
| Life, Physical & Social Science | 0 (0.0%) | 0 (0.0%) |
| Community & Social Service | 22 (27.9%) | 57 (72.2%) |
| Education, Arts & Media | 0 (0.0%) | 9 (100.0%) |
| Legal Services & Support | 0 (0.0%) | 15 (100.0%) |
| Education Instruction & Library | 16 (32.7%) | 33 (67.3%) |
| Arts, Media & Entertainment | 6 (100.0%) | 0 (0.0%) |
| Health Diagnosing & Treating | 0 (0.0%) | 10 (100.0%) |
| Health Technologists | 0 (0.0%) | 7 (100.0%) |
| Total (Category) | 142 (29.6%) | 338 (70.4%) |
| Total (Overall) | 912 (52.7%) | 820 (47.3%) |
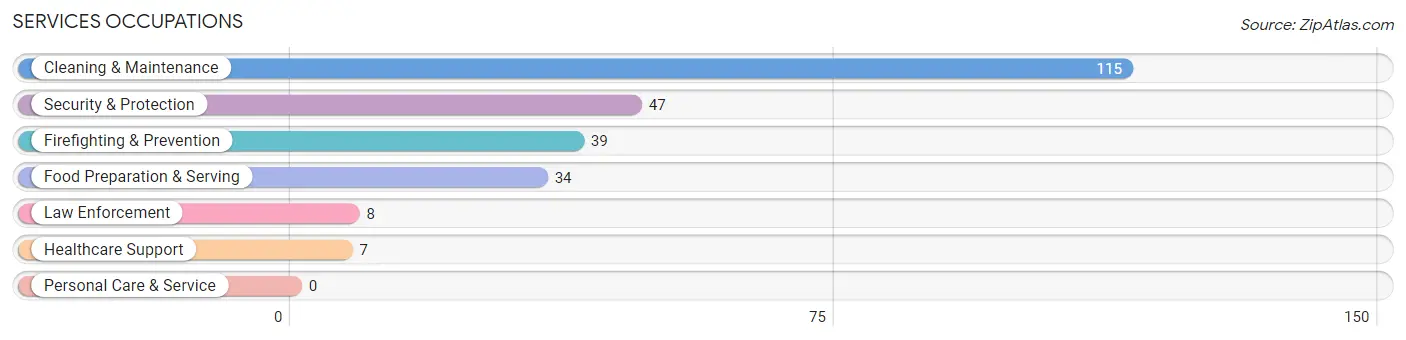
Services Occupations
The most common Services occupations in Woodville are Cleaning & Maintenance (115 | 6.6%), Security & Protection (47 | 2.7%), Firefighting & Prevention (39 | 2.2%), Food Preparation & Serving (34 | 2.0%), and Law Enforcement (8 | 0.5%).
Services Occupations by Sex
Within the Services occupations in Woodville, the most male-oriented occupations are Law Enforcement (100.0%), Security & Protection (85.1%), and Firefighting & Prevention (82.1%), while the most female-oriented occupations are Healthcare Support (100.0%), Food Preparation & Serving (88.2%), and Cleaning & Maintenance (80.9%).
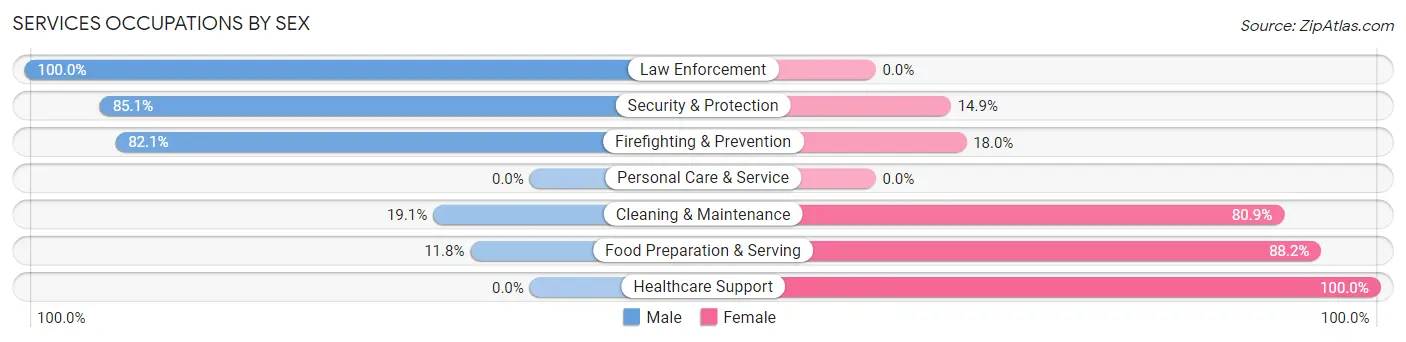
| Occupation | Male | Female |
| Healthcare Support | 0 (0.0%) | 7 (100.0%) |
| Security & Protection | 40 (85.1%) | 7 (14.9%) |
| Firefighting & Prevention | 32 (82.1%) | 7 (17.9%) |
| Law Enforcement | 8 (100.0%) | 0 (0.0%) |
| Food Preparation & Serving | 4 (11.8%) | 30 (88.2%) |
| Cleaning & Maintenance | 22 (19.1%) | 93 (80.9%) |
| Personal Care & Service | 0 (0.0%) | 0 (0.0%) |
| Total (Category) | 66 (32.5%) | 137 (67.5%) |
| Total (Overall) | 912 (52.7%) | 820 (47.3%) |
Sales and Office Occupations
The most common Sales and Office occupations in Woodville are Sales & Related (216 | 12.5%), and Office & Administration (134 | 7.7%).

Sales and Office Occupations by Sex
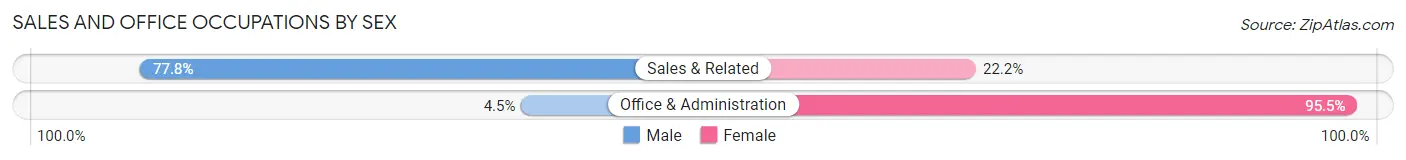
| Occupation | Male | Female |
| Sales & Related | 168 (77.8%) | 48 (22.2%) |
| Office & Administration | 6 (4.5%) | 128 (95.5%) |
| Total (Category) | 174 (49.7%) | 176 (50.3%) |
| Total (Overall) | 912 (52.7%) | 820 (47.3%) |
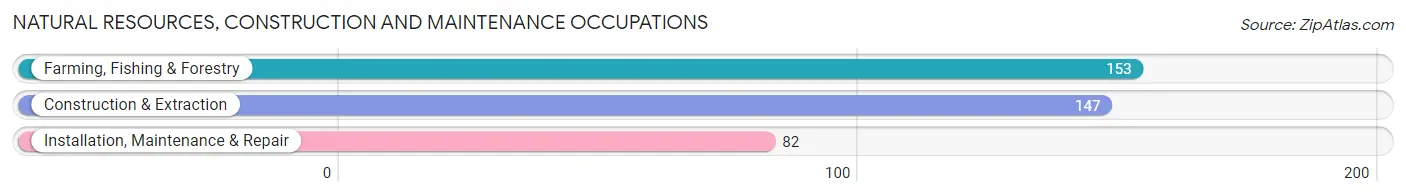
Natural Resources, Construction and Maintenance Occupations
The most common Natural Resources, Construction and Maintenance occupations in Woodville are Farming, Fishing & Forestry (153 | 8.8%), Construction & Extraction (147 | 8.5%), and Installation, Maintenance & Repair (82 | 4.7%).
Natural Resources, Construction and Maintenance Occupations by Sex
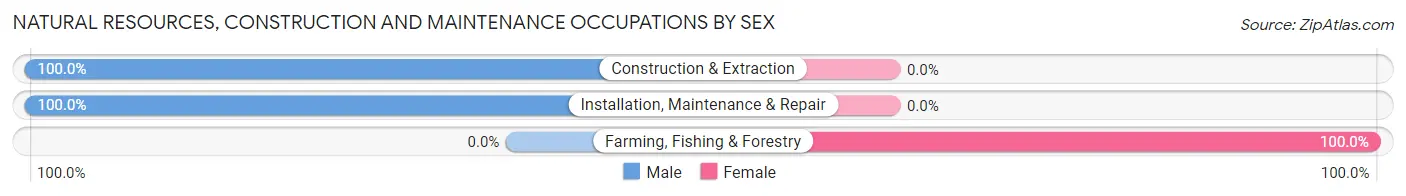
| Occupation | Male | Female |
| Farming, Fishing & Forestry | 0 (0.0%) | 153 (100.0%) |
| Construction & Extraction | 147 (100.0%) | 0 (0.0%) |
| Installation, Maintenance & Repair | 82 (100.0%) | 0 (0.0%) |
| Total (Category) | 229 (60.0%) | 153 (40.1%) |
| Total (Overall) | 912 (52.7%) | 820 (47.3%) |
Production, Transportation and Moving Occupations
The most common Production, Transportation and Moving occupations in Woodville are Material Moving (178 | 10.3%), Production (78 | 4.5%), and Transportation (61 | 3.5%).
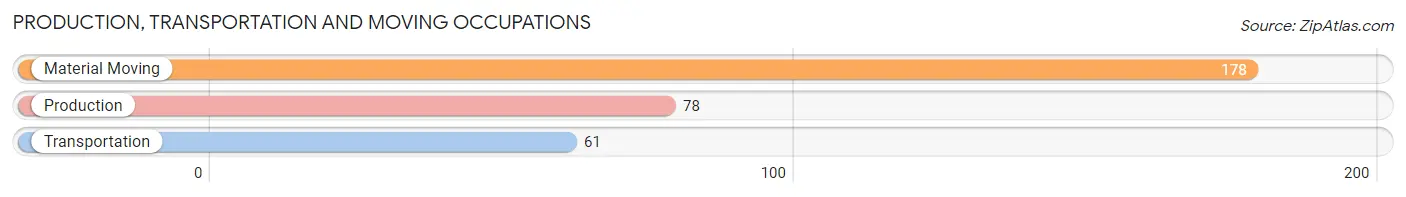
Production, Transportation and Moving Occupations by Sex
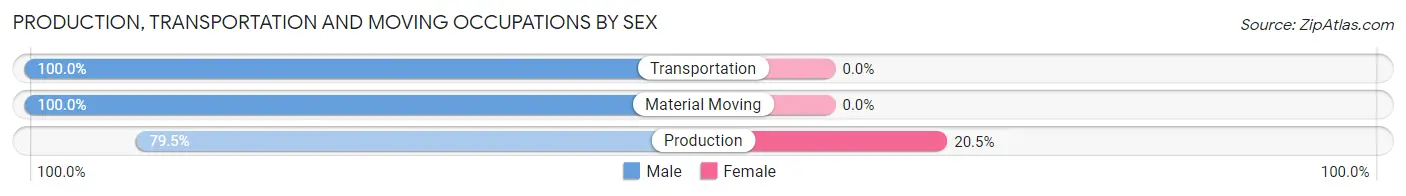
| Occupation | Male | Female |
| Production | 62 (79.5%) | 16 (20.5%) |
| Transportation | 61 (100.0%) | 0 (0.0%) |
| Material Moving | 178 (100.0%) | 0 (0.0%) |
| Total (Category) | 301 (95.0%) | 16 (5.1%) |
| Total (Overall) | 912 (52.7%) | 820 (47.3%) |
Employment Industries by Sex in Woodville
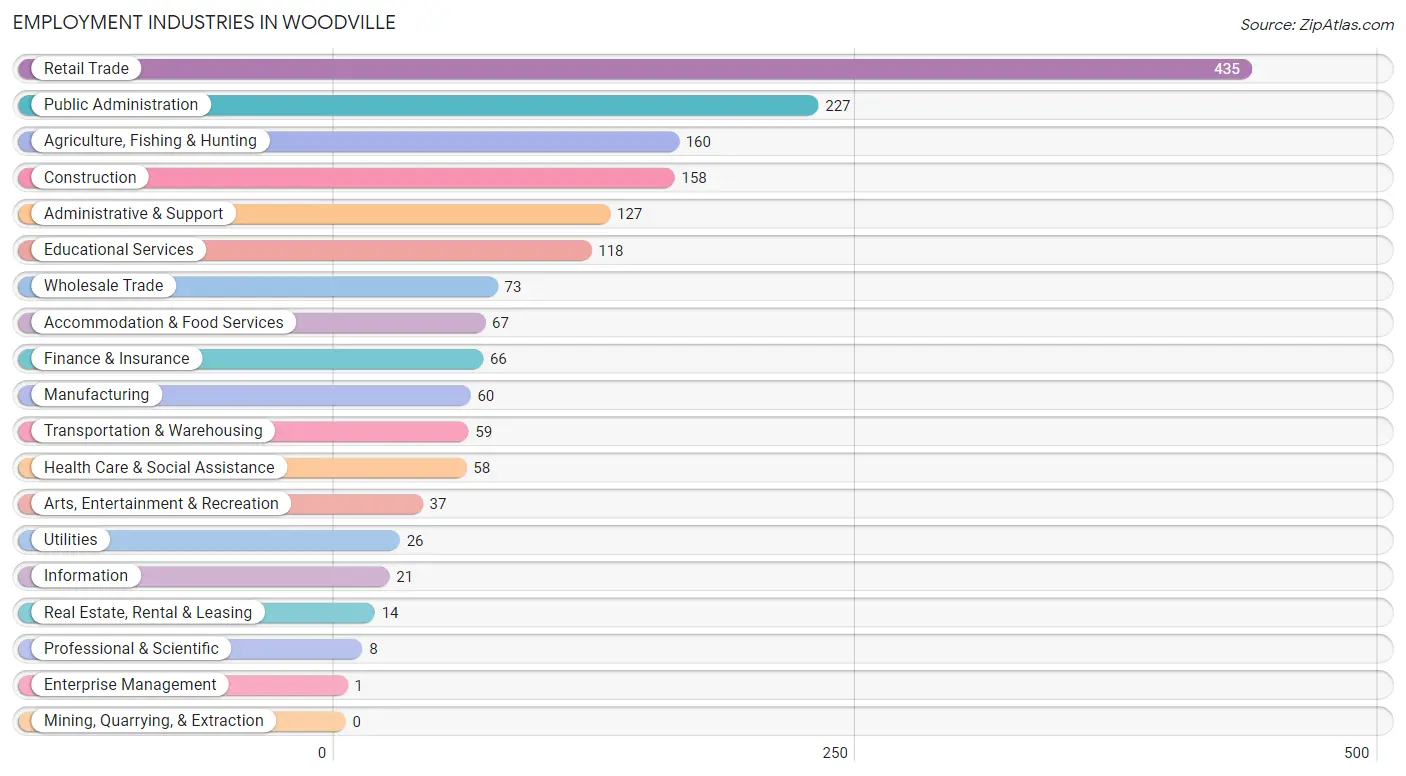
Employment Industries in Woodville
The major employment industries in Woodville include Retail Trade (435 | 25.1%), Public Administration (227 | 13.1%), Agriculture, Fishing & Hunting (160 | 9.2%), Construction (158 | 9.1%), and Administrative & Support (127 | 7.3%).
Employment Industries by Sex in Woodville
The Woodville industries that see more men than women are Wholesale Trade (100.0%), Transportation & Warehousing (100.0%), and Utilities (100.0%), whereas the industries that tend to have a higher number of women are Finance & Insurance (100.0%), Real Estate, Rental & Leasing (100.0%), and Enterprise Management (100.0%).
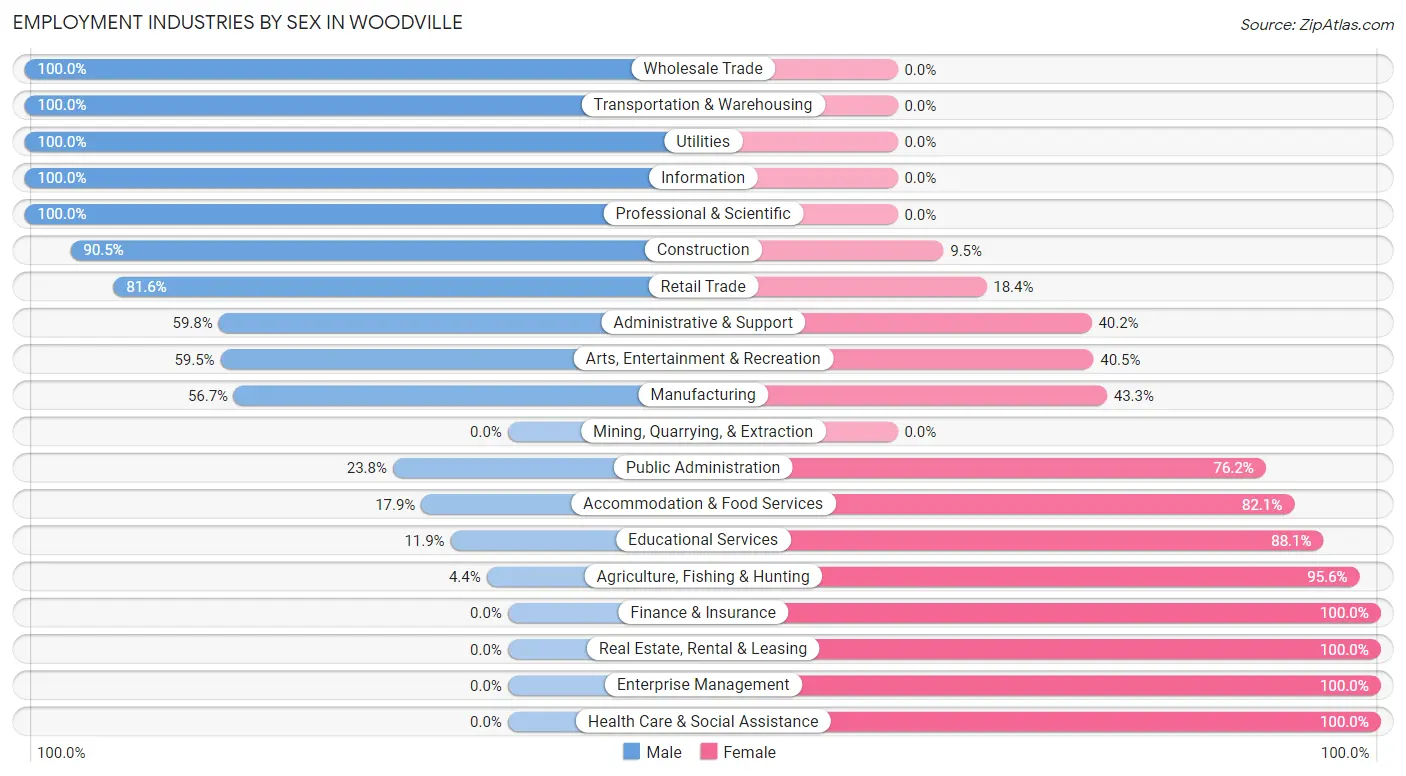
| Industry | Male | Female |
| Agriculture, Fishing & Hunting | 7 (4.4%) | 153 (95.6%) |
| Mining, Quarrying, & Extraction | 0 (0.0%) | 0 (0.0%) |
| Construction | 143 (90.5%) | 15 (9.5%) |
| Manufacturing | 34 (56.7%) | 26 (43.3%) |
| Wholesale Trade | 73 (100.0%) | 0 (0.0%) |
| Retail Trade | 355 (81.6%) | 80 (18.4%) |
| Transportation & Warehousing | 59 (100.0%) | 0 (0.0%) |
| Utilities | 26 (100.0%) | 0 (0.0%) |
| Information | 21 (100.0%) | 0 (0.0%) |
| Finance & Insurance | 0 (0.0%) | 66 (100.0%) |
| Real Estate, Rental & Leasing | 0 (0.0%) | 14 (100.0%) |
| Professional & Scientific | 8 (100.0%) | 0 (0.0%) |
| Enterprise Management | 0 (0.0%) | 1 (100.0%) |
| Administrative & Support | 76 (59.8%) | 51 (40.2%) |
| Educational Services | 14 (11.9%) | 104 (88.1%) |
| Health Care & Social Assistance | 0 (0.0%) | 58 (100.0%) |
| Arts, Entertainment & Recreation | 22 (59.5%) | 15 (40.5%) |
| Accommodation & Food Services | 12 (17.9%) | 55 (82.1%) |
| Public Administration | 54 (23.8%) | 173 (76.2%) |
| Total | 912 (52.7%) | 820 (47.3%) |
Education in Woodville
School Enrollment in Woodville
The most common levels of schooling among the 1,404 students in Woodville are college / undergraduate (418 | 29.8%), middle school (326 | 23.2%), and high school (326 | 23.2%).
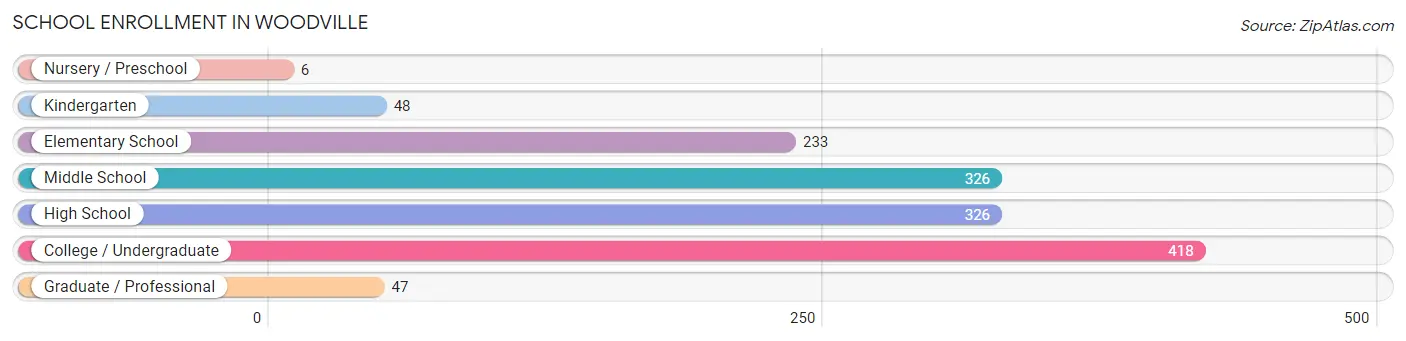
| School Level | # Students | % Students |
| Nursery / Preschool | 6 | 0.4% |
| Kindergarten | 48 | 3.4% |
| Elementary School | 233 | 16.6% |
| Middle School | 326 | 23.2% |
| High School | 326 | 23.2% |
| College / Undergraduate | 418 | 29.8% |
| Graduate / Professional | 47 | 3.4% |
| Total | 1,404 | 100.0% |
School Enrollment by Age by Funding Source in Woodville
Out of a total of 1,404 students who are enrolled in schools in Woodville, 239 (17.0%) attend a private institution, while the remaining 1,165 (83.0%) are enrolled in public schools. The age group of 35 years and over has the highest likelihood of being enrolled in private schools, with 41 (38.7% in the age bracket) enrolled. Conversely, the age group of 3 to 4 year olds has the lowest likelihood of being enrolled in a private school, with 6 (100.0% in the age bracket) attending a public institution.
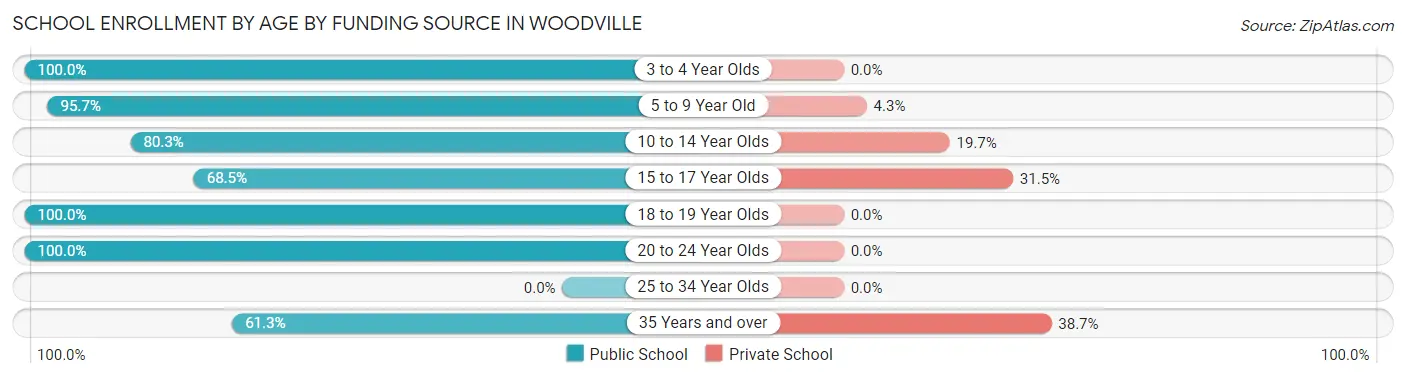
| Age Bracket | Public School | Private School |
| 3 to 4 Year Olds | 6 (100.0%) | 0 (0.0%) |
| 5 to 9 Year Old | 179 (95.7%) | 8 (4.3%) |
| 10 to 14 Year Olds | 346 (80.3%) | 85 (19.7%) |
| 15 to 17 Year Olds | 226 (68.5%) | 104 (31.5%) |
| 18 to 19 Year Olds | 18 (100.0%) | 0 (0.0%) |
| 20 to 24 Year Olds | 326 (100.0%) | 0 (0.0%) |
| 25 to 34 Year Olds | 0 (0.0%) | 0 (0.0%) |
| 35 Years and over | 65 (61.3%) | 41 (38.7%) |
| Total | 1,165 (83.0%) | 239 (17.0%) |
Educational Attainment by Field of Study in Woodville
Social sciences (148 | 20.9%), business (144 | 20.3%), arts & humanities (95 | 13.4%), liberal arts & history (71 | 10.0%), and psychology (55 | 7.8%) are the most common fields of study among 709 individuals in Woodville who have obtained a bachelor's degree or higher.
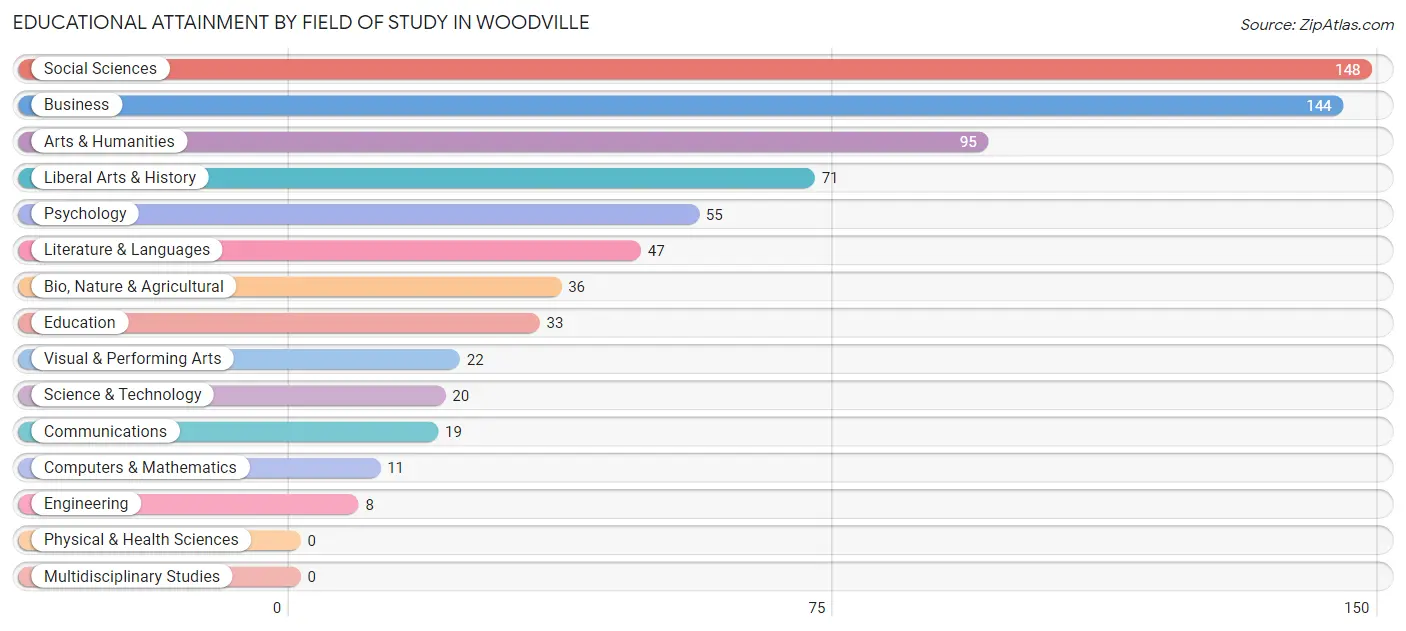
| Field of Study | # Graduates | % Graduates |
| Computers & Mathematics | 11 | 1.5% |
| Bio, Nature & Agricultural | 36 | 5.1% |
| Physical & Health Sciences | 0 | 0.0% |
| Psychology | 55 | 7.8% |
| Social Sciences | 148 | 20.9% |
| Engineering | 8 | 1.1% |
| Multidisciplinary Studies | 0 | 0.0% |
| Science & Technology | 20 | 2.8% |
| Business | 144 | 20.3% |
| Education | 33 | 4.6% |
| Literature & Languages | 47 | 6.6% |
| Liberal Arts & History | 71 | 10.0% |
| Visual & Performing Arts | 22 | 3.1% |
| Communications | 19 | 2.7% |
| Arts & Humanities | 95 | 13.4% |
| Total | 709 | 100.0% |
Transportation & Commute in Woodville
Vehicle Availability by Sex in Woodville
The most prevalent vehicle ownership categories in Woodville are males with 3 vehicles (454, accounting for 49.8%) and females with 3 vehicles (185, making up 55.4%).
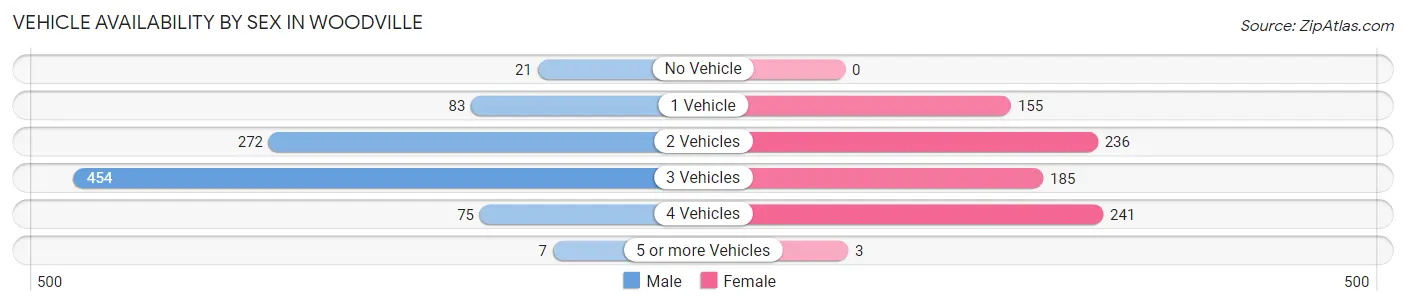
| Vehicles Available | Male | Female |
| No Vehicle | 21 (2.3%) | 0 (0.0%) |
| 1 Vehicle | 83 (9.1%) | 155 (18.9%) |
| 2 Vehicles | 272 (29.8%) | 236 (28.8%) |
| 3 Vehicles | 454 (49.8%) | 185 (22.6%) |
| 4 Vehicles | 75 (8.2%) | 241 (29.4%) |
| 5 or more Vehicles | 7 (0.8%) | 3 (0.4%) |
| Total | 912 (100.0%) | 820 (100.0%) |
Commute Time in Woodville
The most frequently occuring commute durations in Woodville are 20 to 24 minutes (472 commuters, 28.8%), 15 to 19 minutes (333 commuters, 20.3%), and 30 to 34 minutes (221 commuters, 13.5%).
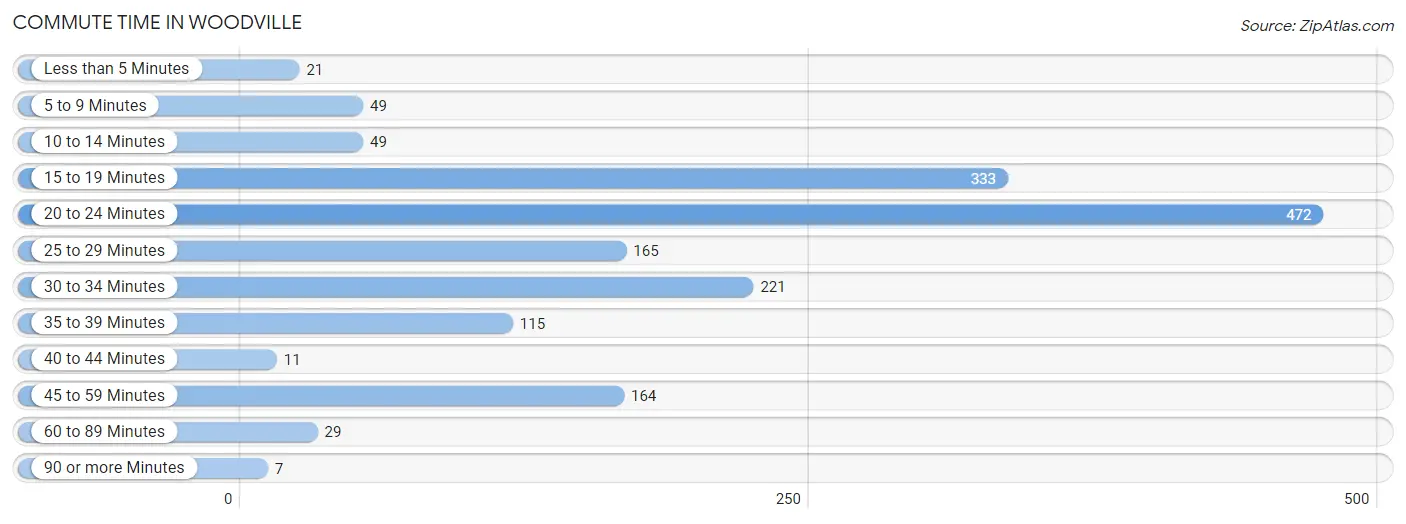
| Commute Time | # Commuters | % Commuters |
| Less than 5 Minutes | 21 | 1.3% |
| 5 to 9 Minutes | 49 | 3.0% |
| 10 to 14 Minutes | 49 | 3.0% |
| 15 to 19 Minutes | 333 | 20.3% |
| 20 to 24 Minutes | 472 | 28.8% |
| 25 to 29 Minutes | 165 | 10.1% |
| 30 to 34 Minutes | 221 | 13.5% |
| 35 to 39 Minutes | 115 | 7.0% |
| 40 to 44 Minutes | 11 | 0.7% |
| 45 to 59 Minutes | 164 | 10.0% |
| 60 to 89 Minutes | 29 | 1.8% |
| 90 or more Minutes | 7 | 0.4% |
Commute Time by Sex in Woodville
The most common commute times in Woodville are 15 to 19 minutes (223 commuters, 25.2%) for males and 20 to 24 minutes (327 commuters, 43.5%) for females.
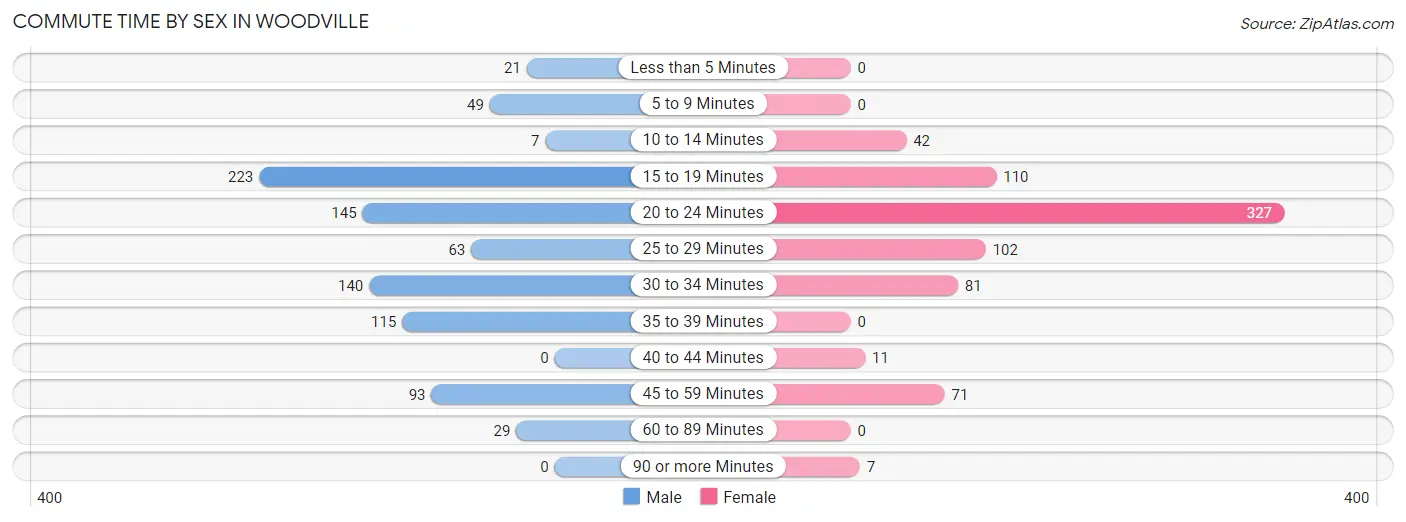
| Commute Time | Male | Female |
| Less than 5 Minutes | 21 (2.4%) | 0 (0.0%) |
| 5 to 9 Minutes | 49 (5.5%) | 0 (0.0%) |
| 10 to 14 Minutes | 7 (0.8%) | 42 (5.6%) |
| 15 to 19 Minutes | 223 (25.2%) | 110 (14.6%) |
| 20 to 24 Minutes | 145 (16.4%) | 327 (43.5%) |
| 25 to 29 Minutes | 63 (7.1%) | 102 (13.6%) |
| 30 to 34 Minutes | 140 (15.8%) | 81 (10.8%) |
| 35 to 39 Minutes | 115 (13.0%) | 0 (0.0%) |
| 40 to 44 Minutes | 0 (0.0%) | 11 (1.5%) |
| 45 to 59 Minutes | 93 (10.5%) | 71 (9.5%) |
| 60 to 89 Minutes | 29 (3.3%) | 0 (0.0%) |
| 90 or more Minutes | 0 (0.0%) | 7 (0.9%) |
Time of Departure to Work by Sex in Woodville
The most frequent times of departure to work in Woodville are 7:30 AM to 7:59 AM (216, 24.4%) for males and 8:00 AM to 8:29 AM (358, 47.7%) for females.
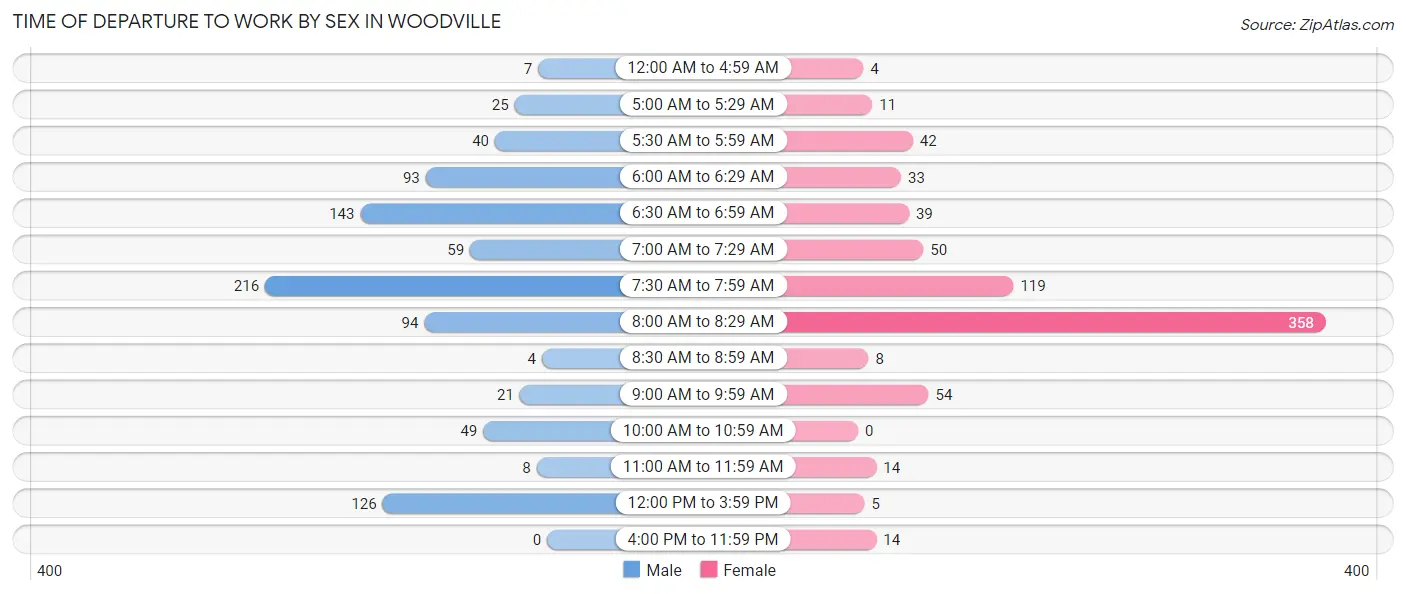
| Time of Departure | Male | Female |
| 12:00 AM to 4:59 AM | 7 (0.8%) | 4 (0.5%) |
| 5:00 AM to 5:29 AM | 25 (2.8%) | 11 (1.5%) |
| 5:30 AM to 5:59 AM | 40 (4.5%) | 42 (5.6%) |
| 6:00 AM to 6:29 AM | 93 (10.5%) | 33 (4.4%) |
| 6:30 AM to 6:59 AM | 143 (16.2%) | 39 (5.2%) |
| 7:00 AM to 7:29 AM | 59 (6.7%) | 50 (6.7%) |
| 7:30 AM to 7:59 AM | 216 (24.4%) | 119 (15.9%) |
| 8:00 AM to 8:29 AM | 94 (10.6%) | 358 (47.7%) |
| 8:30 AM to 8:59 AM | 4 (0.4%) | 8 (1.1%) |
| 9:00 AM to 9:59 AM | 21 (2.4%) | 54 (7.2%) |
| 10:00 AM to 10:59 AM | 49 (5.5%) | 0 (0.0%) |
| 11:00 AM to 11:59 AM | 8 (0.9%) | 14 (1.9%) |
| 12:00 PM to 3:59 PM | 126 (14.2%) | 5 (0.7%) |
| 4:00 PM to 11:59 PM | 0 (0.0%) | 14 (1.9%) |
| Total | 885 (100.0%) | 751 (100.0%) |
Housing Occupancy in Woodville
Occupancy by Ownership in Woodville
Of the total 1,542 dwellings in Woodville, owner-occupied units account for 1,103 (71.5%), while renter-occupied units make up 439 (28.5%).
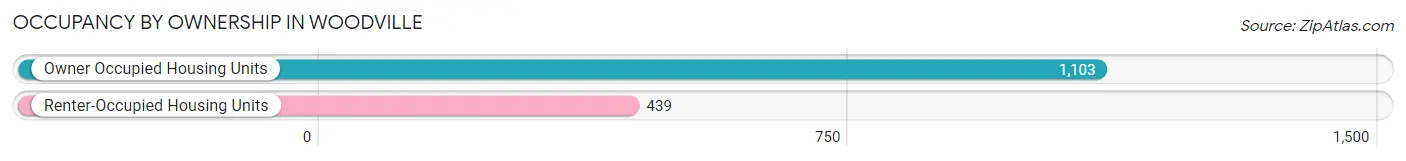
| Occupancy | # Housing Units | % Housing Units |
| Owner Occupied Housing Units | 1,103 | 71.5% |
| Renter-Occupied Housing Units | 439 | 28.5% |
| Total Occupied Housing Units | 1,542 | 100.0% |
Occupancy by Household Size in Woodville
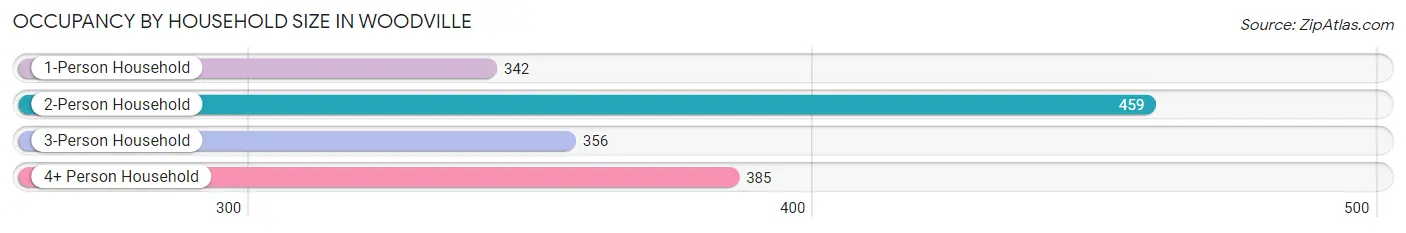
| Household Size | # Housing Units | % Housing Units |
| 1-Person Household | 342 | 22.2% |
| 2-Person Household | 459 | 29.8% |
| 3-Person Household | 356 | 23.1% |
| 4+ Person Household | 385 | 25.0% |
| Total Housing Units | 1,542 | 100.0% |
Occupancy by Ownership by Household Size in Woodville
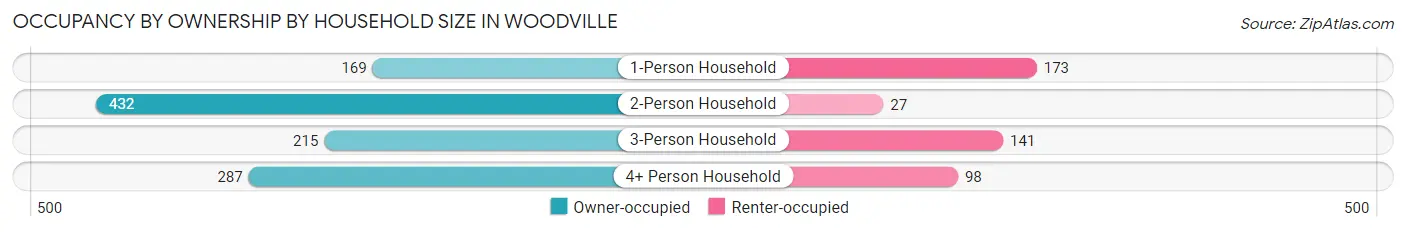
| Household Size | Owner-occupied | Renter-occupied |
| 1-Person Household | 169 (49.4%) | 173 (50.6%) |
| 2-Person Household | 432 (94.1%) | 27 (5.9%) |
| 3-Person Household | 215 (60.4%) | 141 (39.6%) |
| 4+ Person Household | 287 (74.6%) | 98 (25.5%) |
| Total Housing Units | 1,103 (71.5%) | 439 (28.5%) |
Occupancy by Educational Attainment in Woodville
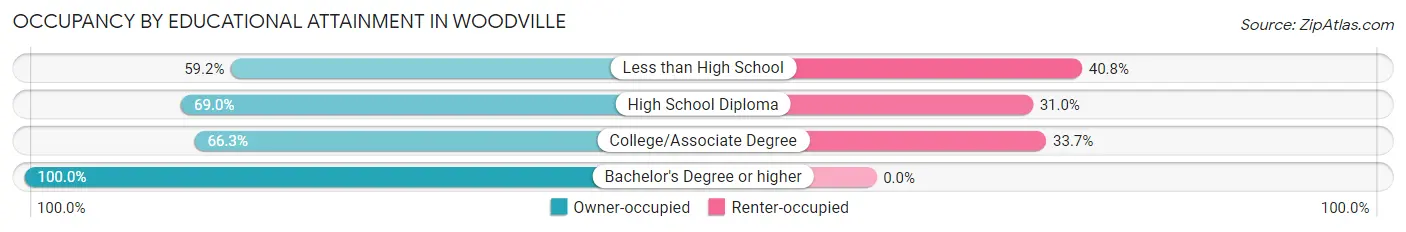
| Household Size | Owner-occupied | Renter-occupied |
| Less than High School | 138 (59.2%) | 95 (40.8%) |
| High School Diploma | 340 (69.0%) | 153 (31.0%) |
| College/Associate Degree | 376 (66.3%) | 191 (33.7%) |
| Bachelor's Degree or higher | 249 (100.0%) | 0 (0.0%) |
Occupancy by Age of Householder in Woodville
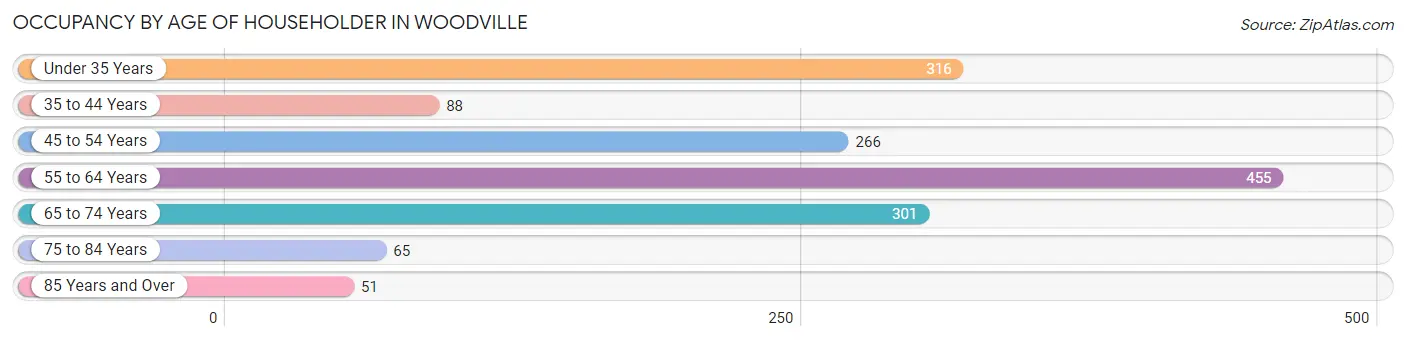
| Age Bracket | # Households | % Households |
| Under 35 Years | 316 | 20.5% |
| 35 to 44 Years | 88 | 5.7% |
| 45 to 54 Years | 266 | 17.2% |
| 55 to 64 Years | 455 | 29.5% |
| 65 to 74 Years | 301 | 19.5% |
| 75 to 84 Years | 65 | 4.2% |
| 85 Years and Over | 51 | 3.3% |
| Total | 1,542 | 100.0% |
Housing Finances in Woodville
Median Income by Occupancy in Woodville
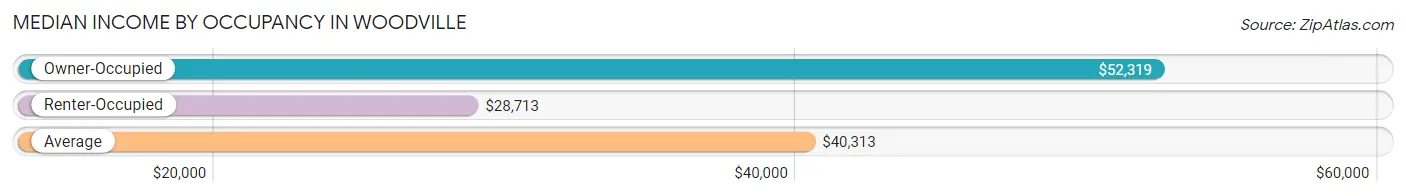
| Occupancy Type | # Households | Median Income |
| Owner-Occupied | 1,103 (71.5%) | $52,319 |
| Renter-Occupied | 439 (28.5%) | $28,713 |
| Average | 1,542 (100.0%) | $40,313 |
Occupancy by Householder Income Bracket in Woodville
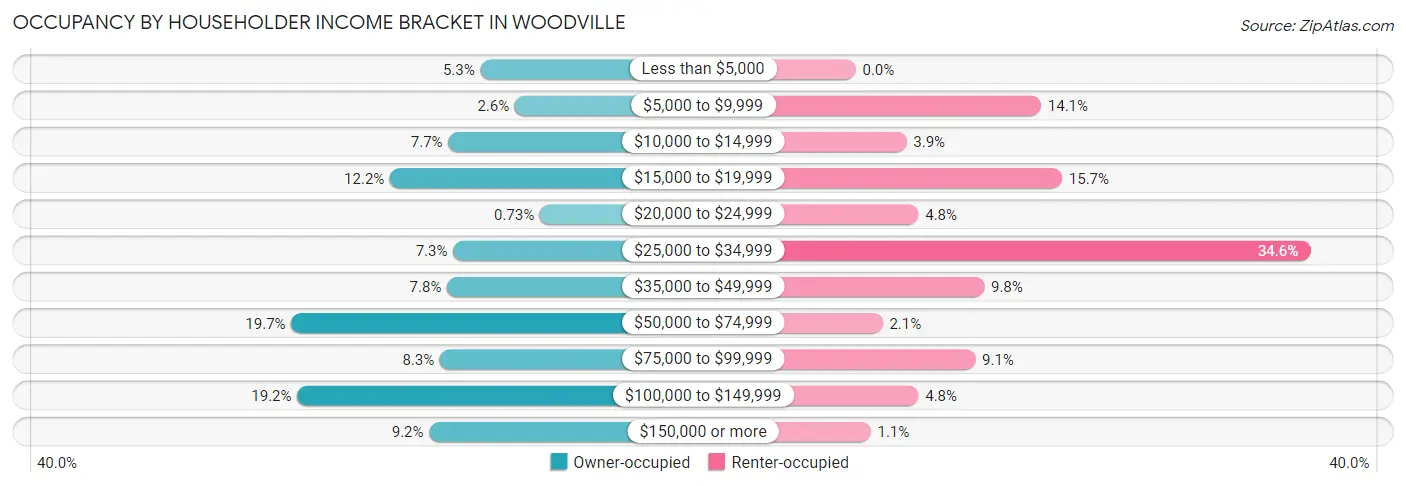
| Income Bracket | Owner-occupied | Renter-occupied |
| Less than $5,000 | 58 (5.3%) | 0 (0.0%) |
| $5,000 to $9,999 | 29 (2.6%) | 62 (14.1%) |
| $10,000 to $14,999 | 85 (7.7%) | 17 (3.9%) |
| $15,000 to $19,999 | 134 (12.1%) | 69 (15.7%) |
| $20,000 to $24,999 | 8 (0.7%) | 21 (4.8%) |
| $25,000 to $34,999 | 81 (7.3%) | 152 (34.6%) |
| $35,000 to $49,999 | 86 (7.8%) | 43 (9.8%) |
| $50,000 to $74,999 | 217 (19.7%) | 9 (2.1%) |
| $75,000 to $99,999 | 92 (8.3%) | 40 (9.1%) |
| $100,000 to $149,999 | 212 (19.2%) | 21 (4.8%) |
| $150,000 or more | 101 (9.2%) | 5 (1.1%) |
| Total | 1,103 (100.0%) | 439 (100.0%) |
Monthly Housing Cost Tiers in Woodville
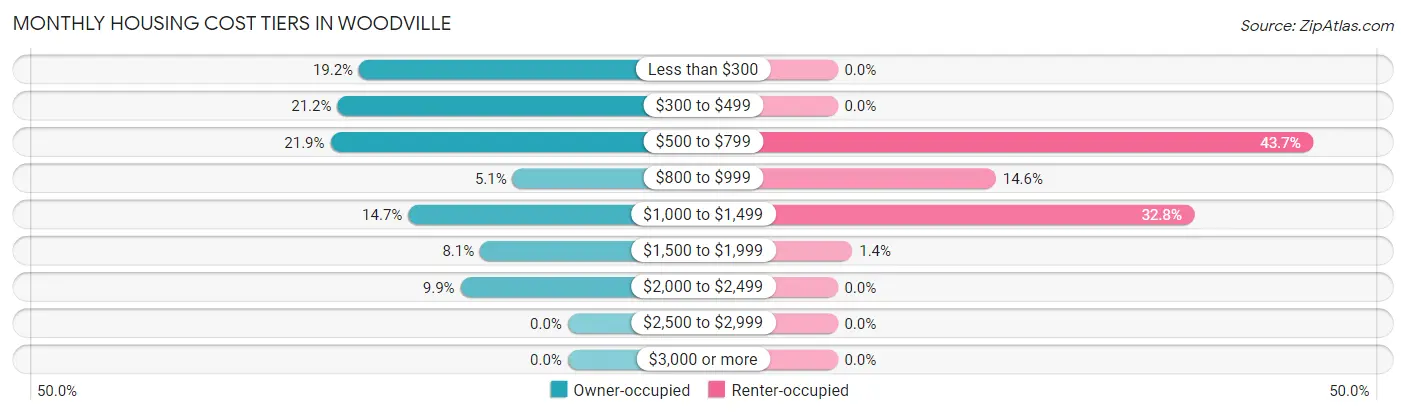
| Monthly Cost | Owner-occupied | Renter-occupied |
| Less than $300 | 212 (19.2%) | 0 (0.0%) |
| $300 to $499 | 234 (21.2%) | 0 (0.0%) |
| $500 to $799 | 241 (21.8%) | 192 (43.7%) |
| $800 to $999 | 56 (5.1%) | 64 (14.6%) |
| $1,000 to $1,499 | 162 (14.7%) | 144 (32.8%) |
| $1,500 to $1,999 | 89 (8.1%) | 6 (1.4%) |
| $2,000 to $2,499 | 109 (9.9%) | 0 (0.0%) |
| $2,500 to $2,999 | 0 (0.0%) | 0 (0.0%) |
| $3,000 or more | 0 (0.0%) | 0 (0.0%) |
| Total | 1,103 (100.0%) | 439 (100.0%) |
Physical Housing Characteristics in Woodville
Housing Structures in Woodville
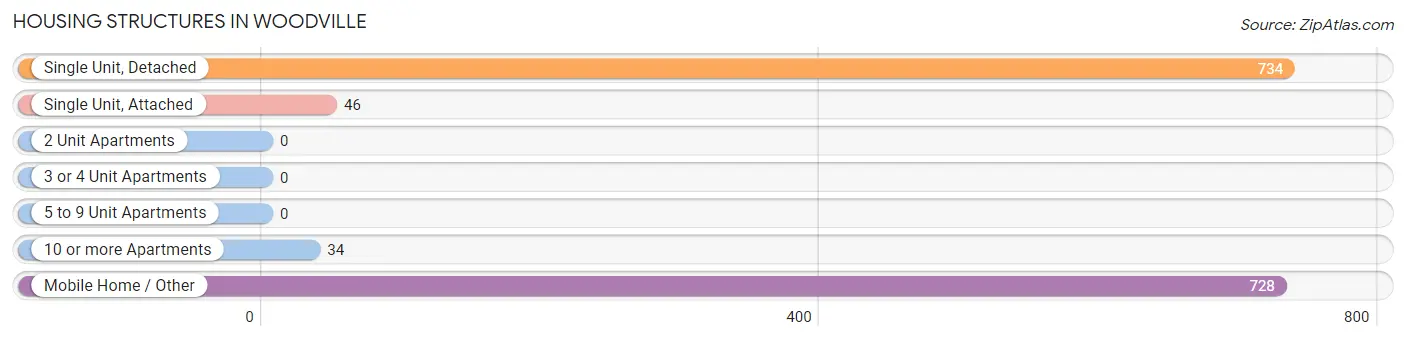
| Structure Type | # Housing Units | % Housing Units |
| Single Unit, Detached | 734 | 47.6% |
| Single Unit, Attached | 46 | 3.0% |
| 2 Unit Apartments | 0 | 0.0% |
| 3 or 4 Unit Apartments | 0 | 0.0% |
| 5 to 9 Unit Apartments | 0 | 0.0% |
| 10 or more Apartments | 34 | 2.2% |
| Mobile Home / Other | 728 | 47.2% |
| Total | 1,542 | 100.0% |
Housing Structures by Occupancy in Woodville
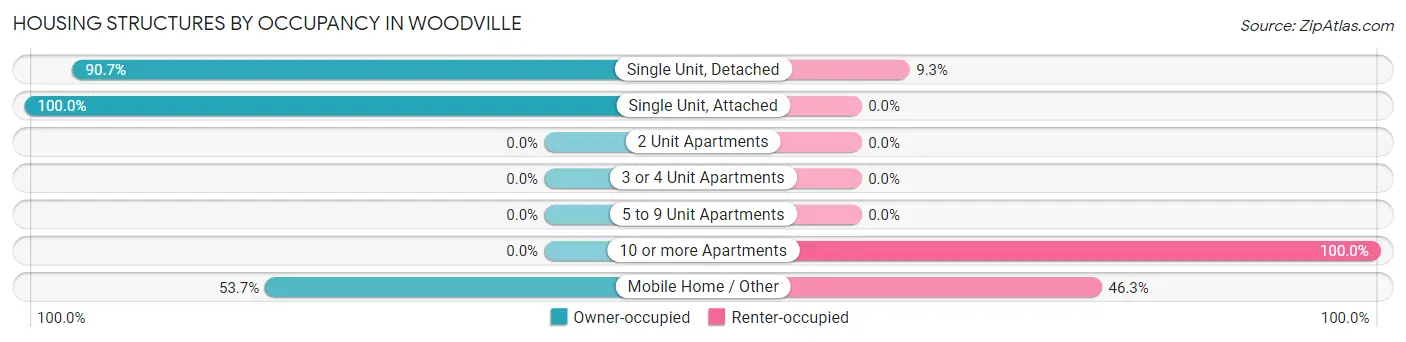
| Structure Type | Owner-occupied | Renter-occupied |
| Single Unit, Detached | 666 (90.7%) | 68 (9.3%) |
| Single Unit, Attached | 46 (100.0%) | 0 (0.0%) |
| 2 Unit Apartments | 0 (0.0%) | 0 (0.0%) |
| 3 or 4 Unit Apartments | 0 (0.0%) | 0 (0.0%) |
| 5 to 9 Unit Apartments | 0 (0.0%) | 0 (0.0%) |
| 10 or more Apartments | 0 (0.0%) | 34 (100.0%) |
| Mobile Home / Other | 391 (53.7%) | 337 (46.3%) |
| Total | 1,103 (71.5%) | 439 (28.5%) |
Housing Structures by Number of Rooms in Woodville
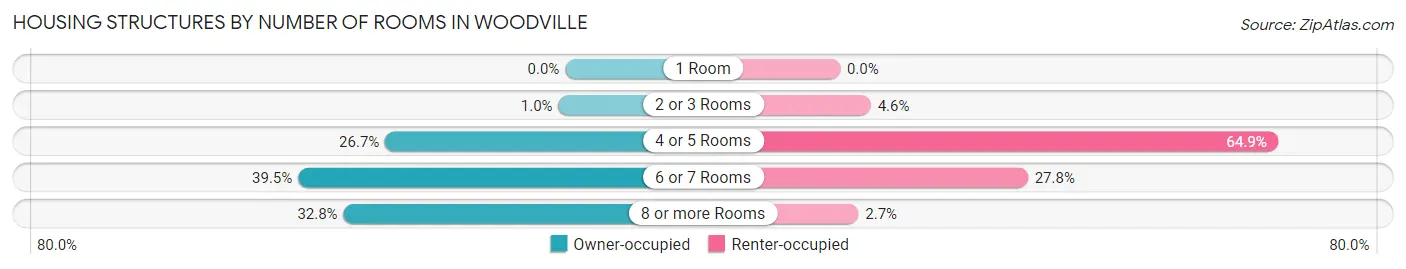
| Number of Rooms | Owner-occupied | Renter-occupied |
| 1 Room | 0 (0.0%) | 0 (0.0%) |
| 2 or 3 Rooms | 11 (1.0%) | 20 (4.6%) |
| 4 or 5 Rooms | 294 (26.7%) | 285 (64.9%) |
| 6 or 7 Rooms | 436 (39.5%) | 122 (27.8%) |
| 8 or more Rooms | 362 (32.8%) | 12 (2.7%) |
| Total | 1,103 (100.0%) | 439 (100.0%) |
Housing Structure by Heating Type in Woodville
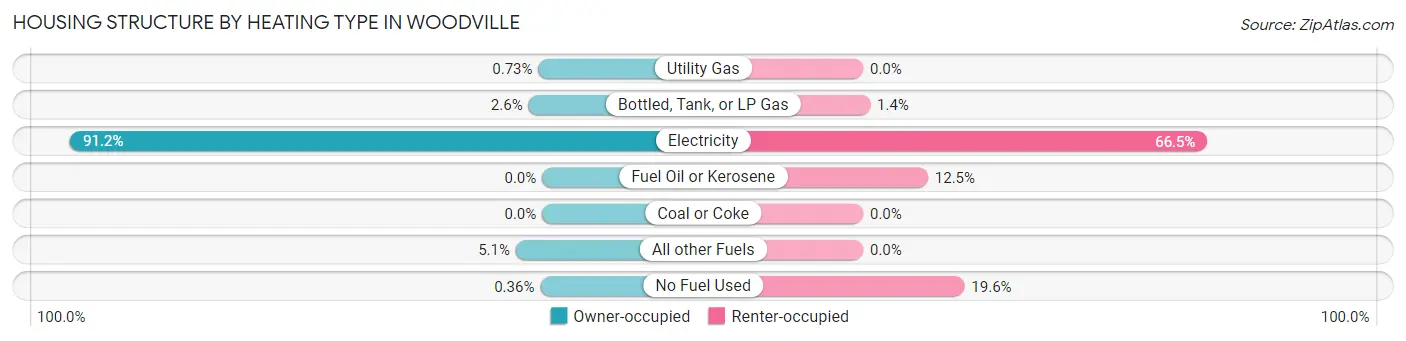
| Heating Type | Owner-occupied | Renter-occupied |
| Utility Gas | 8 (0.7%) | 0 (0.0%) |
| Bottled, Tank, or LP Gas | 29 (2.6%) | 6 (1.4%) |
| Electricity | 1,006 (91.2%) | 292 (66.5%) |
| Fuel Oil or Kerosene | 0 (0.0%) | 55 (12.5%) |
| Coal or Coke | 0 (0.0%) | 0 (0.0%) |
| All other Fuels | 56 (5.1%) | 0 (0.0%) |
| No Fuel Used | 4 (0.4%) | 86 (19.6%) |
| Total | 1,103 (100.0%) | 439 (100.0%) |
Household Vehicle Usage in Woodville
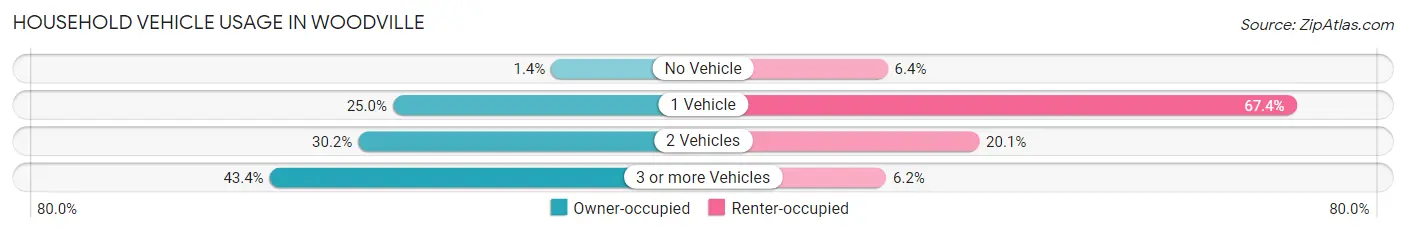
| Vehicles per Household | Owner-occupied | Renter-occupied |
| No Vehicle | 15 (1.4%) | 28 (6.4%) |
| 1 Vehicle | 276 (25.0%) | 296 (67.4%) |
| 2 Vehicles | 333 (30.2%) | 88 (20.1%) |
| 3 or more Vehicles | 479 (43.4%) | 27 (6.1%) |
| Total | 1,103 (100.0%) | 439 (100.0%) |
Real Estate & Mortgages in Woodville
Real Estate and Mortgage Overview in Woodville
| Characteristic | Without Mortgage | With Mortgage |
| Housing Units | 604 | 499 |
| Median Property Value | $106,000 | $176,700 |
| Median Household Income | $51,081 | $85 |
| Monthly Housing Costs | $329 | $0 |
| Real Estate Taxes | $1,038 | $68 |
Property Value by Mortgage Status in Woodville
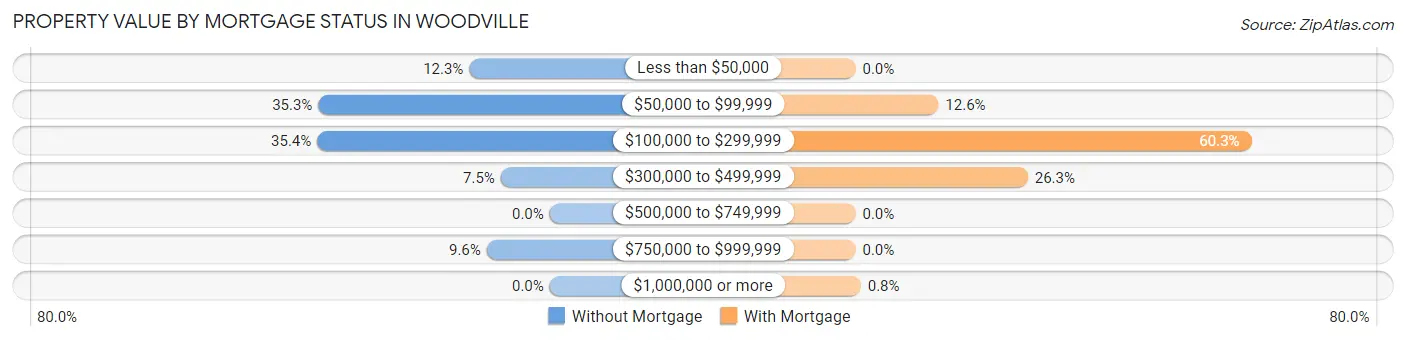
| Property Value | Without Mortgage | With Mortgage |
| Less than $50,000 | 74 (12.2%) | 0 (0.0%) |
| $50,000 to $99,999 | 213 (35.3%) | 63 (12.6%) |
| $100,000 to $299,999 | 214 (35.4%) | 301 (60.3%) |
| $300,000 to $499,999 | 45 (7.4%) | 131 (26.3%) |
| $500,000 to $749,999 | 0 (0.0%) | 0 (0.0%) |
| $750,000 to $999,999 | 58 (9.6%) | 0 (0.0%) |
| $1,000,000 or more | 0 (0.0%) | 4 (0.8%) |
| Total | 604 (100.0%) | 499 (100.0%) |
Household Income by Mortgage Status in Woodville
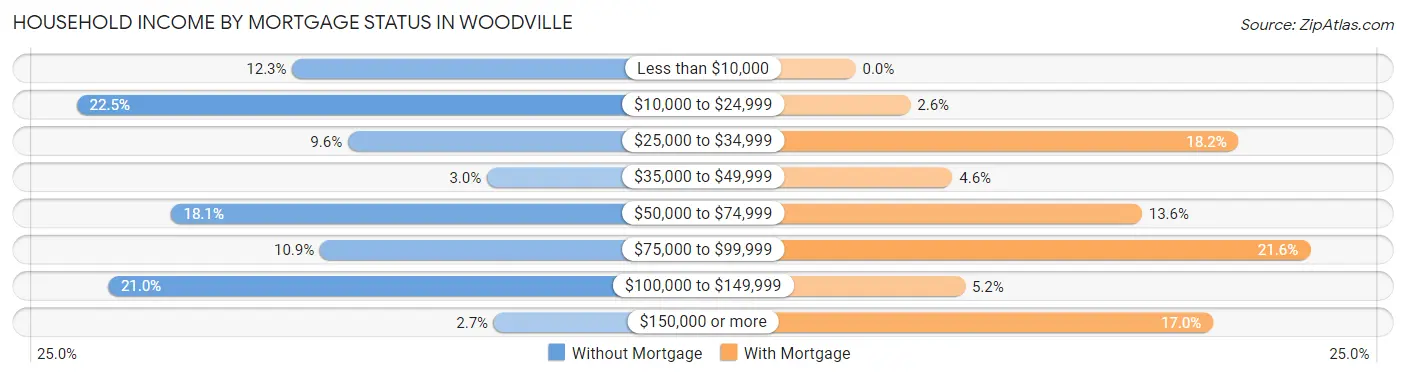
| Household Income | Without Mortgage | With Mortgage |
| Less than $10,000 | 74 (12.2%) | 0 (0.0%) |
| $10,000 to $24,999 | 136 (22.5%) | 13 (2.6%) |
| $25,000 to $34,999 | 58 (9.6%) | 91 (18.2%) |
| $35,000 to $49,999 | 18 (3.0%) | 23 (4.6%) |
| $50,000 to $74,999 | 109 (18.0%) | 68 (13.6%) |
| $75,000 to $99,999 | 66 (10.9%) | 108 (21.6%) |
| $100,000 to $149,999 | 127 (21.0%) | 26 (5.2%) |
| $150,000 or more | 16 (2.6%) | 85 (17.0%) |
| Total | 604 (100.0%) | 499 (100.0%) |
Property Value to Household Income Ratio in Woodville
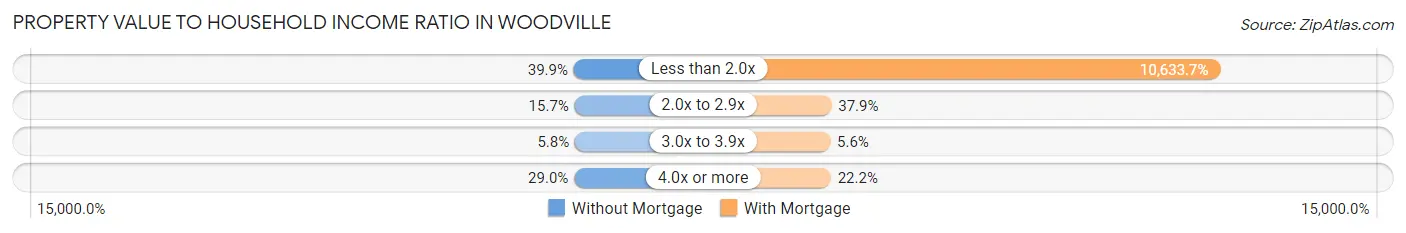
| Value-to-Income Ratio | Without Mortgage | With Mortgage |
| Less than 2.0x | 241 (39.9%) | 53,062 (10,633.7%) |
| 2.0x to 2.9x | 95 (15.7%) | 189 (37.9%) |
| 3.0x to 3.9x | 35 (5.8%) | 28 (5.6%) |
| 4.0x or more | 175 (29.0%) | 111 (22.2%) |
| Total | 604 (100.0%) | 499 (100.0%) |
Real Estate Taxes by Mortgage Status in Woodville
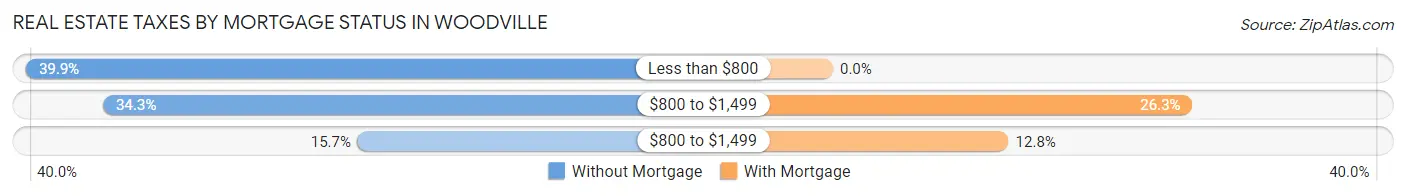
| Property Taxes | Without Mortgage | With Mortgage |
| Less than $800 | 241 (39.9%) | 0 (0.0%) |
| $800 to $1,499 | 207 (34.3%) | 131 (26.3%) |
| $800 to $1,499 | 95 (15.7%) | 64 (12.8%) |
| Total | 604 (100.0%) | 499 (100.0%) |
Health & Disability in Woodville
Health Insurance Coverage by Age in Woodville
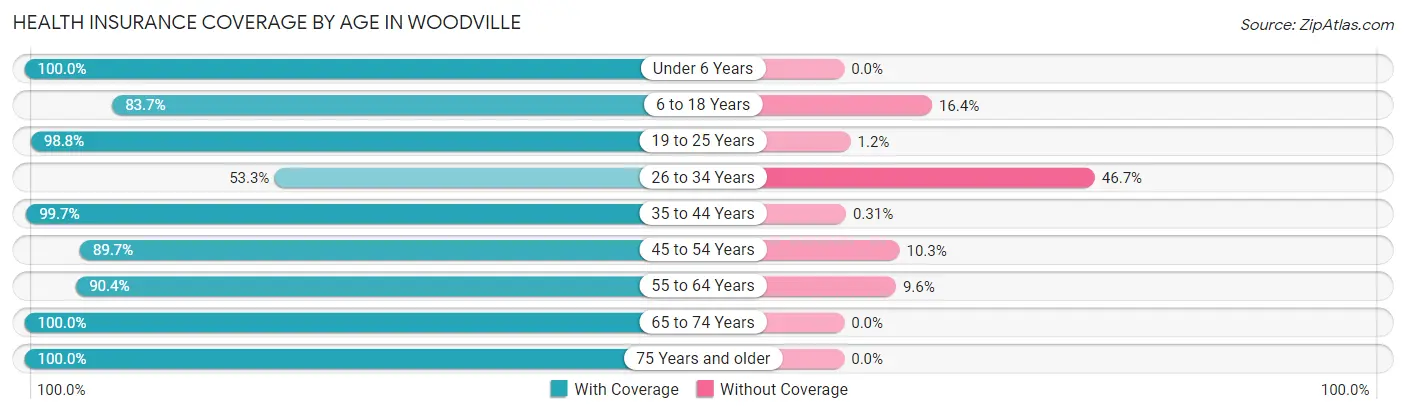
| Age Bracket | With Coverage | Without Coverage |
| Under 6 Years | 326 (100.0%) | 0 (0.0%) |
| 6 to 18 Years | 793 (83.7%) | 155 (16.4%) |
| 19 to 25 Years | 420 (98.8%) | 5 (1.2%) |
| 26 to 34 Years | 212 (53.3%) | 186 (46.7%) |
| 35 to 44 Years | 322 (99.7%) | 1 (0.3%) |
| 45 to 54 Years | 635 (89.7%) | 73 (10.3%) |
| 55 to 64 Years | 563 (90.4%) | 60 (9.6%) |
| 65 to 74 Years | 441 (100.0%) | 0 (0.0%) |
| 75 Years and older | 164 (100.0%) | 0 (0.0%) |
| Total | 3,876 (89.0%) | 480 (11.0%) |
Health Insurance Coverage by Citizenship Status in Woodville
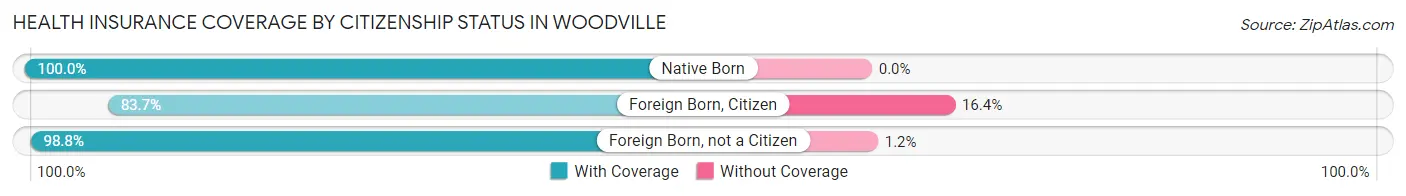
| Citizenship Status | With Coverage | Without Coverage |
| Native Born | 326 (100.0%) | 0 (0.0%) |
| Foreign Born, Citizen | 793 (83.7%) | 155 (16.4%) |
| Foreign Born, not a Citizen | 420 (98.8%) | 5 (1.2%) |
Health Insurance Coverage by Household Income in Woodville
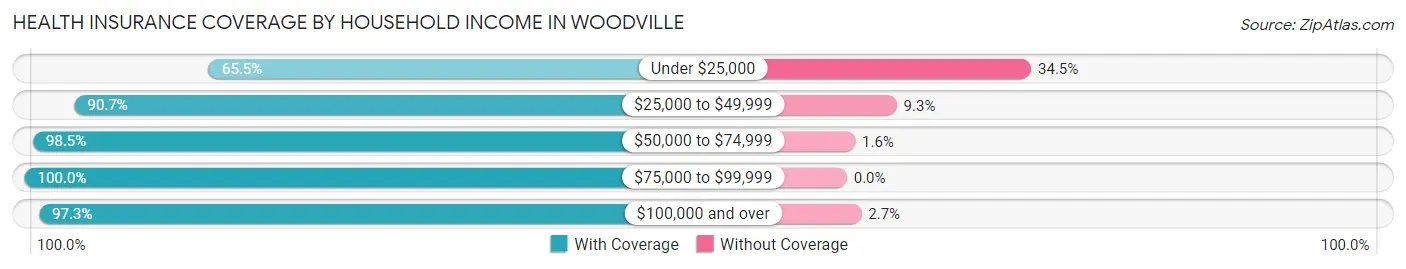
| Household Income | With Coverage | Without Coverage |
| Under $25,000 | 677 (65.5%) | 357 (34.5%) |
| $25,000 to $49,999 | 709 (90.7%) | 73 (9.3%) |
| $50,000 to $74,999 | 760 (98.5%) | 12 (1.5%) |
| $75,000 to $99,999 | 372 (100.0%) | 0 (0.0%) |
| $100,000 and over | 1,358 (97.3%) | 38 (2.7%) |
Public vs Private Health Insurance Coverage by Age in Woodville
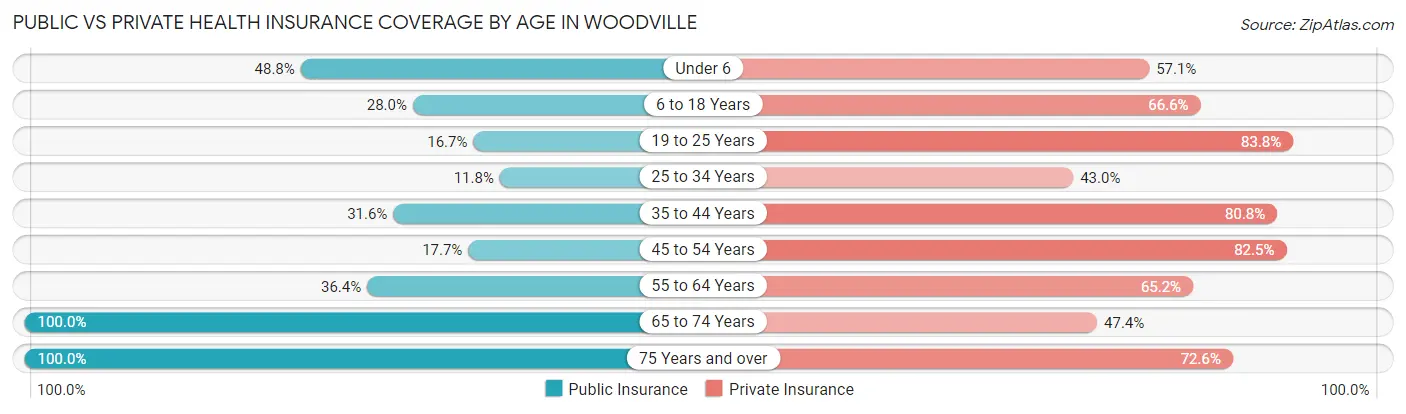
| Age Bracket | Public Insurance | Private Insurance |
| Under 6 | 159 (48.8%) | 186 (57.1%) |
| 6 to 18 Years | 265 (28.0%) | 631 (66.6%) |
| 19 to 25 Years | 71 (16.7%) | 356 (83.8%) |
| 25 to 34 Years | 47 (11.8%) | 171 (43.0%) |
| 35 to 44 Years | 102 (31.6%) | 261 (80.8%) |
| 45 to 54 Years | 125 (17.7%) | 584 (82.5%) |
| 55 to 64 Years | 227 (36.4%) | 406 (65.2%) |
| 65 to 74 Years | 441 (100.0%) | 209 (47.4%) |
| 75 Years and over | 164 (100.0%) | 119 (72.6%) |
| Total | 1,601 (36.7%) | 2,923 (67.1%) |
Disability Status by Sex by Age in Woodville
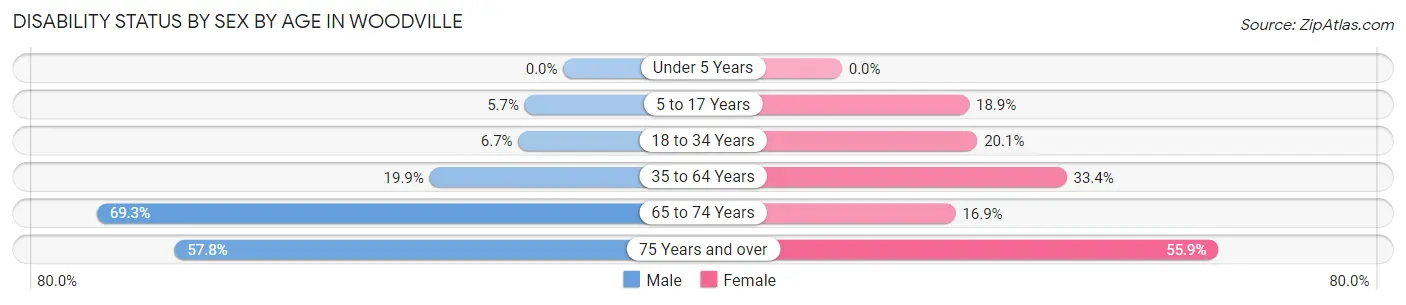
| Age Bracket | Male | Female |
| Under 5 Years | 0 (0.0%) | 0 (0.0%) |
| 5 to 17 Years | 34 (5.7%) | 68 (18.9%) |
| 18 to 34 Years | 21 (6.7%) | 109 (20.1%) |
| 35 to 64 Years | 169 (19.9%) | 268 (33.4%) |
| 65 to 74 Years | 133 (69.3%) | 42 (16.9%) |
| 75 Years and over | 41 (57.8%) | 52 (55.9%) |
Disability Class by Sex by Age in Woodville
Disability Class: Hearing Difficulty
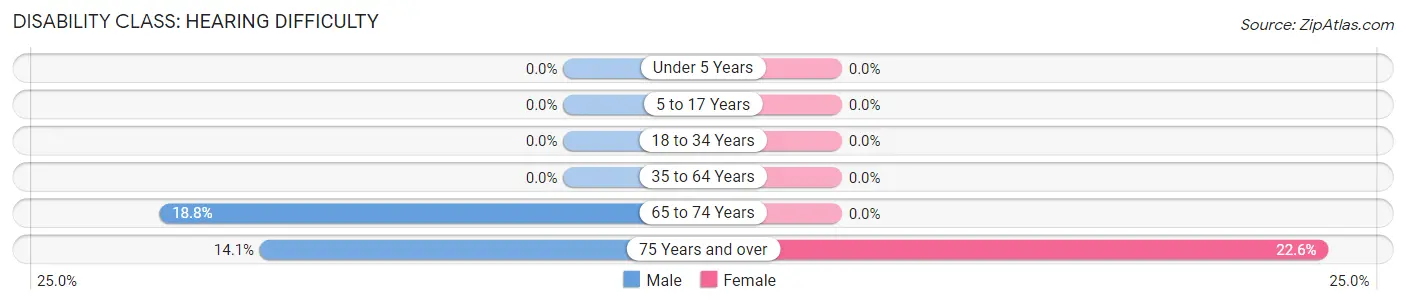
| Age Bracket | Male | Female |
| Under 5 Years | 0 (0.0%) | 0 (0.0%) |
| 5 to 17 Years | 0 (0.0%) | 0 (0.0%) |
| 18 to 34 Years | 0 (0.0%) | 0 (0.0%) |
| 35 to 64 Years | 0 (0.0%) | 0 (0.0%) |
| 65 to 74 Years | 36 (18.8%) | 0 (0.0%) |
| 75 Years and over | 10 (14.1%) | 21 (22.6%) |
Disability Class: Vision Difficulty
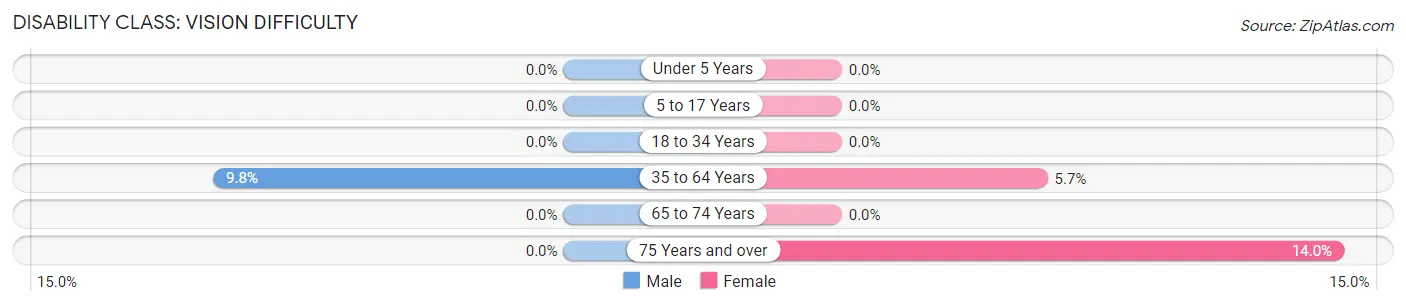
| Age Bracket | Male | Female |
| Under 5 Years | 0 (0.0%) | 0 (0.0%) |
| 5 to 17 Years | 0 (0.0%) | 0 (0.0%) |
| 18 to 34 Years | 0 (0.0%) | 0 (0.0%) |
| 35 to 64 Years | 83 (9.8%) | 46 (5.7%) |
| 65 to 74 Years | 0 (0.0%) | 0 (0.0%) |
| 75 Years and over | 0 (0.0%) | 13 (14.0%) |
Disability Class: Cognitive Difficulty
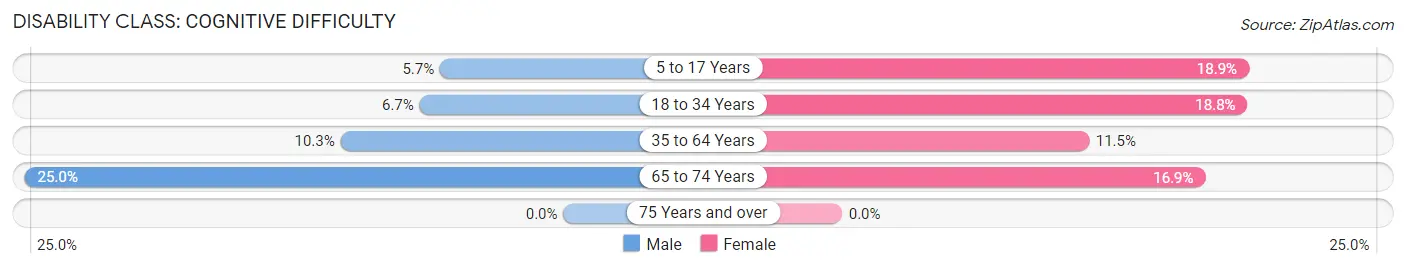
| Age Bracket | Male | Female |
| 5 to 17 Years | 34 (5.7%) | 68 (18.9%) |
| 18 to 34 Years | 21 (6.7%) | 102 (18.8%) |
| 35 to 64 Years | 88 (10.3%) | 92 (11.5%) |
| 65 to 74 Years | 48 (25.0%) | 42 (16.9%) |
| 75 Years and over | 0 (0.0%) | 0 (0.0%) |
Disability Class: Ambulatory Difficulty
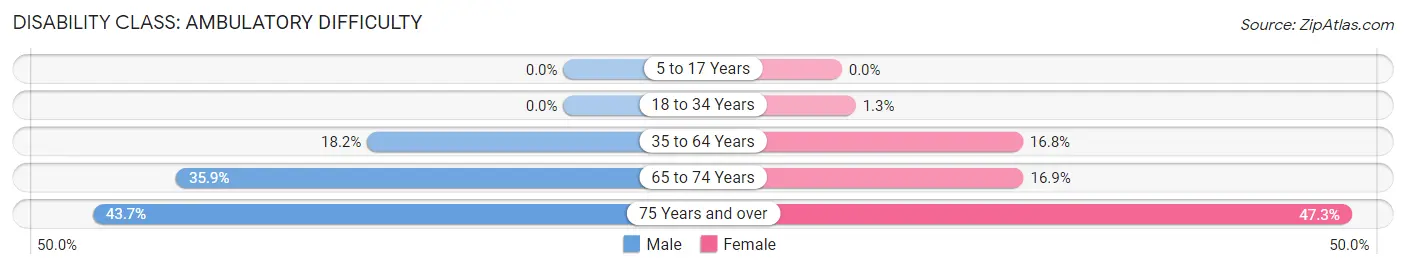
| Age Bracket | Male | Female |
| 5 to 17 Years | 0 (0.0%) | 0 (0.0%) |
| 18 to 34 Years | 0 (0.0%) | 7 (1.3%) |
| 35 to 64 Years | 155 (18.2%) | 135 (16.8%) |
| 65 to 74 Years | 69 (35.9%) | 42 (16.9%) |
| 75 Years and over | 31 (43.7%) | 44 (47.3%) |
Disability Class: Self-Care Difficulty
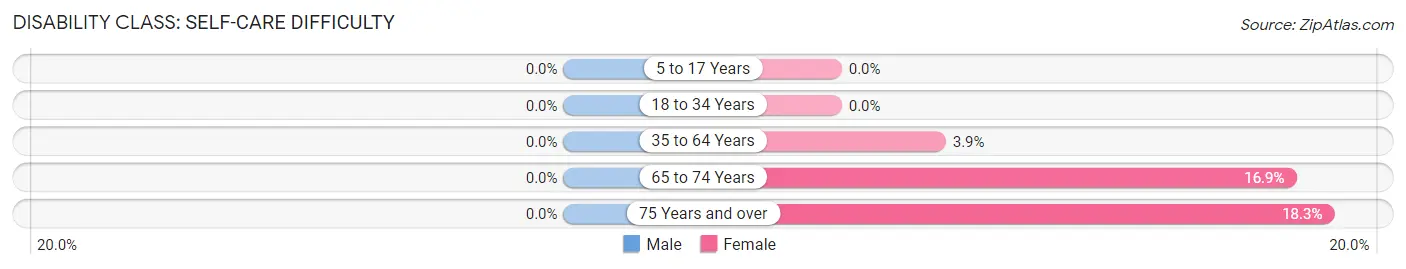
| Age Bracket | Male | Female |
| 5 to 17 Years | 0 (0.0%) | 0 (0.0%) |
| 18 to 34 Years | 0 (0.0%) | 0 (0.0%) |
| 35 to 64 Years | 0 (0.0%) | 31 (3.9%) |
| 65 to 74 Years | 0 (0.0%) | 42 (16.9%) |
| 75 Years and over | 0 (0.0%) | 17 (18.3%) |
Technology Access in Woodville
Computing Device Access in Woodville
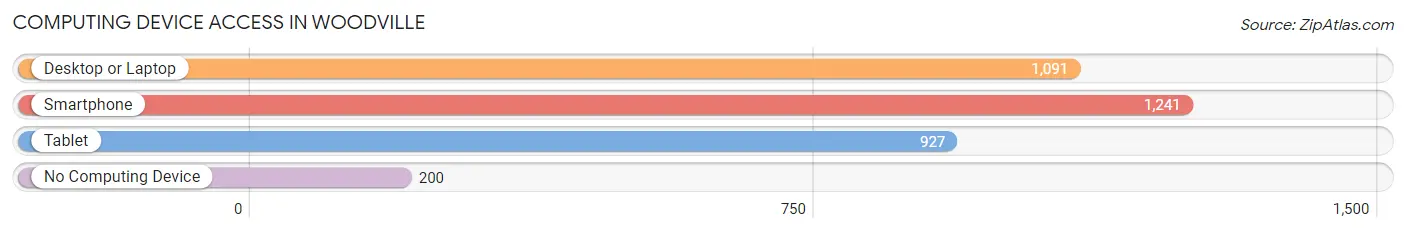
| Device Type | # Households | % Households |
| Desktop or Laptop | 1,091 | 70.8% |
| Smartphone | 1,241 | 80.5% |
| Tablet | 927 | 60.1% |
| No Computing Device | 200 | 13.0% |
| Total | 1,542 | 100.0% |
Internet Access in Woodville
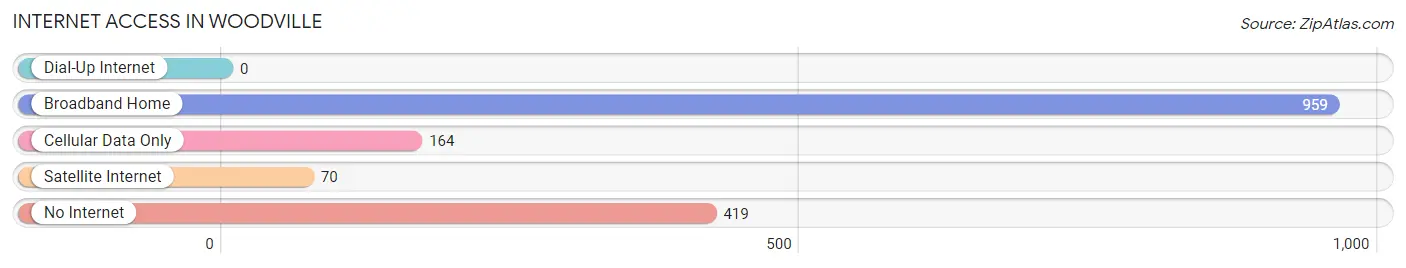
| Internet Type | # Households | % Households |
| Dial-Up Internet | 0 | 0.0% |
| Broadband Home | 959 | 62.2% |
| Cellular Data Only | 164 | 10.6% |
| Satellite Internet | 70 | 4.5% |
| No Internet | 419 | 27.2% |
| Total | 1,542 | 100.0% |
Woodville Summary
Woodville is a small unincorporated community located in Leon County, Florida. It is situated in the northwest corner of the county, approximately 10 miles north of the state capital, Tallahassee. The population of Woodville was estimated to be 1,845 in 2019.
History
Woodville was first settled in the early 1800s by settlers from Georgia and South Carolina. The town was named after the local timber industry, which was the main source of income for the early settlers. The timber industry was so important to the town that the local post office was named “Woodville” in 1837.
In the late 1800s, the town began to grow and develop. The first school was built in 1885 and the first church was built in 1887. The town also had a general store, a blacksmith shop, and a sawmill.
In the early 1900s, the timber industry began to decline and the town began to focus on other industries. The first bank was established in 1910 and the first telephone service was established in 1911.
Geography
Woodville is located in the northwest corner of Leon County, Florida. It is situated on the banks of the Ochlockonee River, which is a tributary of the Apalachicola River. The town is surrounded by forests and wetlands, and is home to a variety of wildlife.
The climate in Woodville is humid subtropical, with hot, humid summers and mild winters. The average temperature in the summer is around 90°F and the average temperature in the winter is around 50°F.
Economy
The economy of Woodville is largely based on agriculture and forestry. The town is home to several farms, which produce a variety of crops, including corn, soybeans, and cotton. The timber industry is also an important part of the local economy, with several sawmills located in the area.
In addition to agriculture and forestry, Woodville is home to several small businesses, including restaurants, convenience stores, and auto repair shops. The town also has a few small manufacturing companies, which produce a variety of products, including furniture and clothing.
Demographics
The population of Woodville was estimated to be 1,845 in 2019. The racial makeup of the town is 87.3% White, 8.2% African American, 0.7% Native American, 0.4% Asian, and 3.4% from other races. The median household income in Woodville is $41,944, and the median age is 38.
Woodville is a small, rural community with a strong sense of community and a commitment to preserving its history and culture. The town is home to several churches, a library, and a museum, which are all dedicated to preserving the town’s history and culture. The town also hosts several annual events, including a Fourth of July parade and a Christmas parade.
Common Questions
What is Per Capita Income in Woodville?
Per Capita income in Woodville is $21,207.
What is the Median Family Income in Woodville?
Median Family Income in Woodville is $51,793.
What is the Median Household income in Woodville?
Median Household Income in Woodville is $40,313.
What is Income or Wage Gap in Woodville?
Income or Wage Gap in Woodville is 3.3%.
Women in Woodville earn 96.7 cents for every dollar earned by a man.
What is Inequality or Gini Index in Woodville?
Inequality or Gini Index in Woodville is 0.49.
What is the Total Population of Woodville?
Total Population of Woodville is 4,356.
What is the Total Male Population of Woodville?
Total Male Population of Woodville is 2,082.
What is the Total Female Population of Woodville?
Total Female Population of Woodville is 2,274.
What is the Ratio of Males per 100 Females in Woodville?
There are 91.56 Males per 100 Females in Woodville.
What is the Ratio of Females per 100 Males in Woodville?
There are 109.22 Females per 100 Males in Woodville.
What is the Median Population Age in Woodville?
Median Population Age in Woodville is 39.1 Years.
What is the Average Family Size in Woodville
Average Family Size in Woodville is 3.3 People.
What is the Average Household Size in Woodville
Average Household Size in Woodville is 2.8 People.
How Large is the Labor Force in Woodville?
There are 1,847 People in the Labor Forcein in Woodville.
What is the Percentage of People in the Labor Force in Woodville?
58.8% of People are in the Labor Force in Woodville.
What is the Unemployment Rate in Woodville?
Unemployment Rate in Woodville is 6.3%.