Winter Springs, FL Map & Demographics
Winter Springs Map
Winter Springs Overview
$44,712
PER CAPITA INCOME
$98,972
AVG FAMILY INCOME
$83,732
AVG HOUSEHOLD INCOME
14.1%
WAGE / INCOME GAP [ % ]
85.9¢/ $1
WAGE / INCOME GAP [ $ ]
$9,160
FAMILY INCOME DEFICIT
0.42
INEQUALITY / GINI INDEX
38,205
TOTAL POPULATION
18,958
MALE POPULATION
19,247
FEMALE POPULATION
98.50
MALES / 100 FEMALES
101.52
FEMALES / 100 MALES
43.1
MEDIAN AGE
2.9
AVG FAMILY SIZE
2.4
AVG HOUSEHOLD SIZE
21,614
LABOR FORCE [ PEOPLE ]
67.4%
PERCENT IN LABOR FORCE
4.2%
UNEMPLOYMENT RATE
Winter Springs Zip Codes
Winter Springs Area Codes
Income in Winter Springs
Income Overview in Winter Springs
Per Capita Income in Winter Springs is $44,712, while median incomes of families and households are $98,972 and $83,732 respectively.
| Characteristic | Number | Measure |
| Per Capita Income | 38,205 | $44,712 |
| Median Family Income | 10,462 | $98,972 |
| Mean Family Income | 10,462 | $124,721 |
| Median Household Income | 15,925 | $83,732 |
| Mean Household Income | 15,925 | $105,871 |
| Income Deficit | 10,462 | $9,160 |
| Wage / Income Gap (%) | 38,205 | 14.14% |
| Wage / Income Gap ($) | 38,205 | 85.86¢ per $1 |
| Gini / Inequality Index | 38,205 | 0.42 |
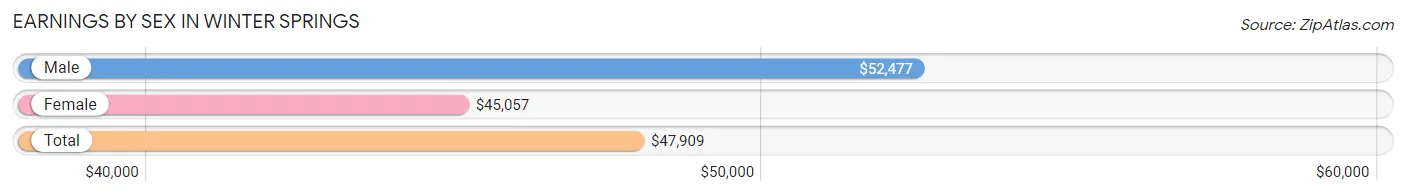
Earnings by Sex in Winter Springs
Average Earnings in Winter Springs are $47,909, $52,477 for men and $45,057 for women, a difference of 14.1%.
| Sex | Number | Average Earnings |
| Male | 12,072 (55.4%) | $52,477 |
| Female | 9,722 (44.6%) | $45,057 |
| Total | 21,794 (100.0%) | $47,909 |
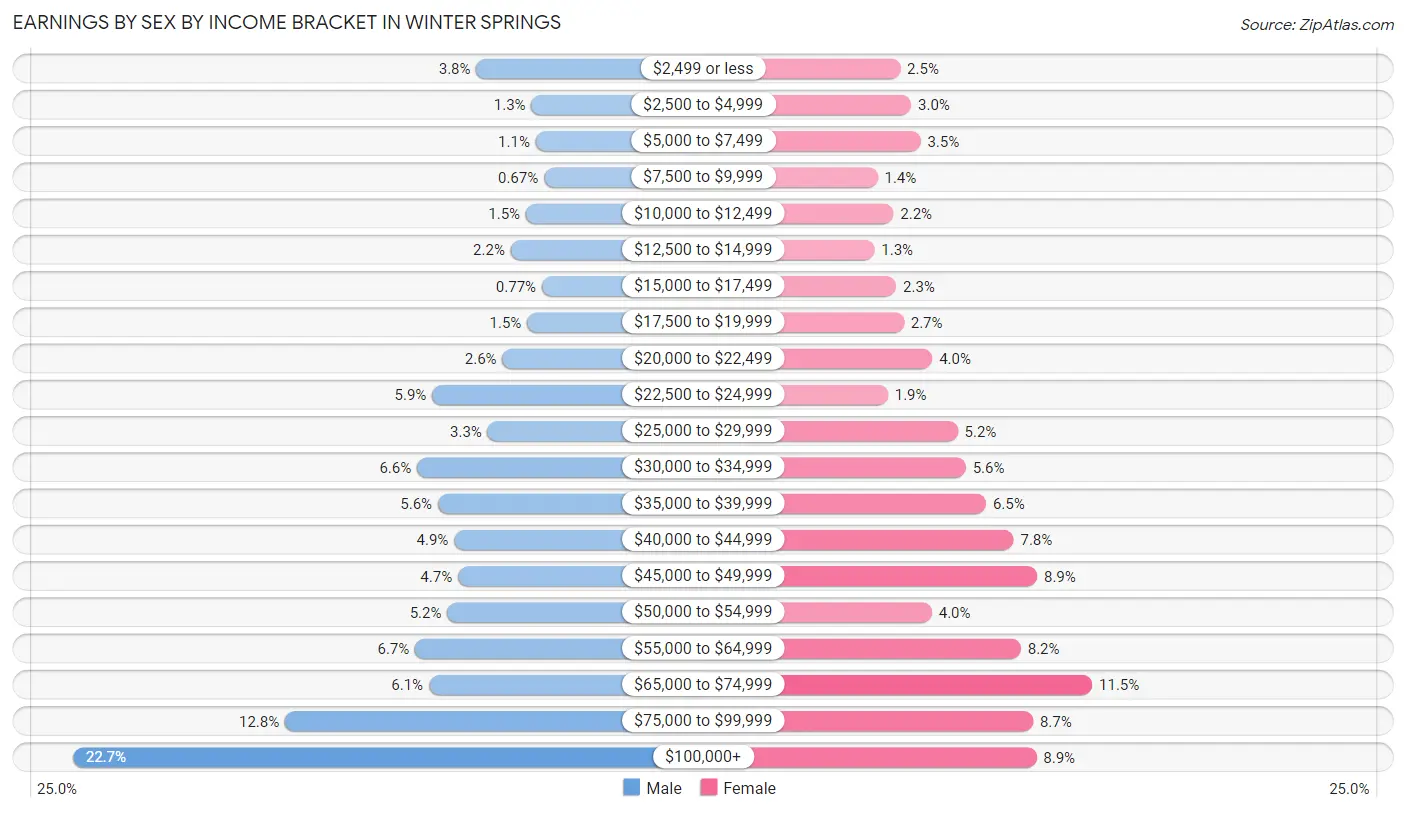
Earnings by Sex by Income Bracket in Winter Springs
The most common earnings brackets in Winter Springs are $100,000+ for men (2,745 | 22.7%) and $65,000 to $74,999 for women (1,117 | 11.5%).
| Income | Male | Female |
| $2,499 or less | 464 (3.8%) | 243 (2.5%) |
| $2,500 to $4,999 | 152 (1.3%) | 293 (3.0%) |
| $5,000 to $7,499 | 128 (1.1%) | 335 (3.5%) |
| $7,500 to $9,999 | 81 (0.7%) | 140 (1.4%) |
| $10,000 to $12,499 | 184 (1.5%) | 212 (2.2%) |
| $12,500 to $14,999 | 269 (2.2%) | 125 (1.3%) |
| $15,000 to $17,499 | 93 (0.8%) | 225 (2.3%) |
| $17,500 to $19,999 | 176 (1.5%) | 260 (2.7%) |
| $20,000 to $22,499 | 316 (2.6%) | 389 (4.0%) |
| $22,500 to $24,999 | 714 (5.9%) | 187 (1.9%) |
| $25,000 to $29,999 | 399 (3.3%) | 505 (5.2%) |
| $30,000 to $34,999 | 799 (6.6%) | 542 (5.6%) |
| $35,000 to $39,999 | 681 (5.6%) | 634 (6.5%) |
| $40,000 to $44,999 | 589 (4.9%) | 759 (7.8%) |
| $45,000 to $49,999 | 567 (4.7%) | 866 (8.9%) |
| $50,000 to $54,999 | 628 (5.2%) | 387 (4.0%) |
| $55,000 to $64,999 | 810 (6.7%) | 792 (8.2%) |
| $65,000 to $74,999 | 732 (6.1%) | 1,117 (11.5%) |
| $75,000 to $99,999 | 1,545 (12.8%) | 848 (8.7%) |
| $100,000+ | 2,745 (22.7%) | 863 (8.9%) |
| Total | 12,072 (100.0%) | 9,722 (100.0%) |
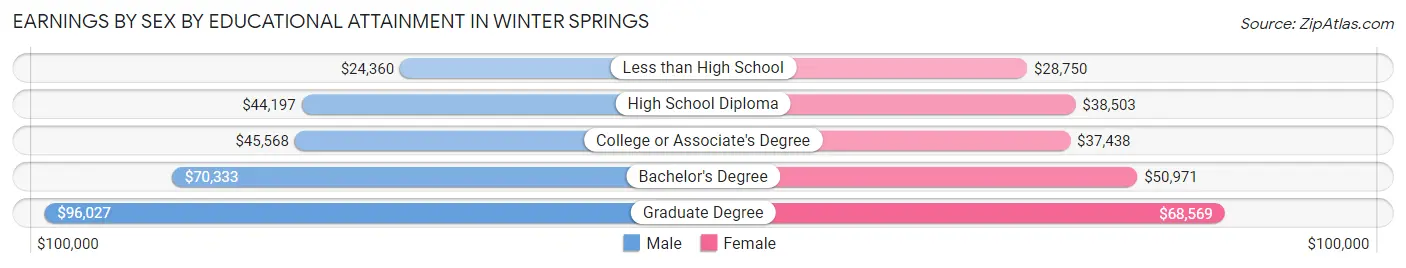
Earnings by Sex by Educational Attainment in Winter Springs
Average earnings in Winter Springs are $56,628 for men and $46,643 for women, a difference of 17.6%. Men with an educational attainment of graduate degree enjoy the highest average annual earnings of $96,027, while those with less than high school education earn the least with $24,360. Women with an educational attainment of graduate degree earn the most with the average annual earnings of $68,569, while those with less than high school education have the smallest earnings of $28,750.
| Educational Attainment | Male Income | Female Income |
| Less than High School | $24,360 | $28,750 |
| High School Diploma | $44,197 | $38,503 |
| College or Associate's Degree | $45,568 | $37,438 |
| Bachelor's Degree | $70,333 | $50,971 |
| Graduate Degree | $96,027 | $68,569 |
| Total | $56,628 | $46,643 |
Family Income in Winter Springs
Family Income Brackets in Winter Springs
According to the Winter Springs family income data, there are 2,040 families falling into the $100,000 to $149,999 income range, which is the most common income bracket and makes up 19.5% of all families. Conversely, the $10,000 to $14,999 income bracket is the least frequent group with only 199 families (1.9%) belonging to this category.
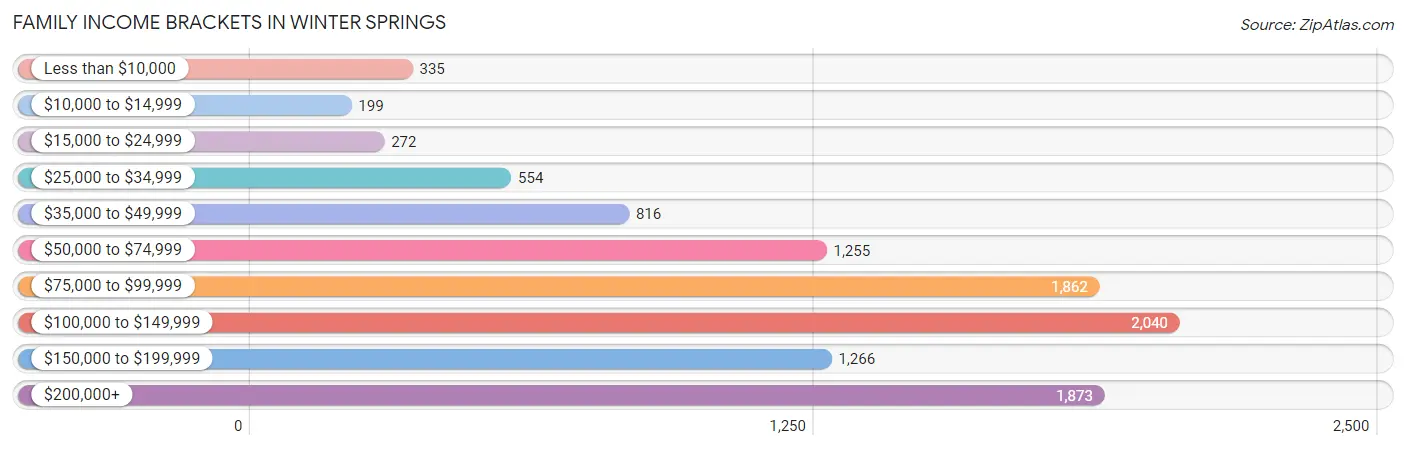
| Income Bracket | # Families | % Families |
| Less than $10,000 | 335 | 3.2% |
| $10,000 to $14,999 | 199 | 1.9% |
| $15,000 to $24,999 | 272 | 2.6% |
| $25,000 to $34,999 | 554 | 5.3% |
| $35,000 to $49,999 | 816 | 7.8% |
| $50,000 to $74,999 | 1,255 | 12.0% |
| $75,000 to $99,999 | 1,862 | 17.8% |
| $100,000 to $149,999 | 2,040 | 19.5% |
| $150,000 to $199,999 | 1,266 | 12.1% |
| $200,000+ | 1,873 | 17.9% |
Family Income by Famaliy Size in Winter Springs
4-person families (1,829 | 17.5%) account for the highest median family income in Winter Springs with $172,824 per family, while 4-person families (1,829 | 17.5%) have the highest median income of $43,206 per family member.
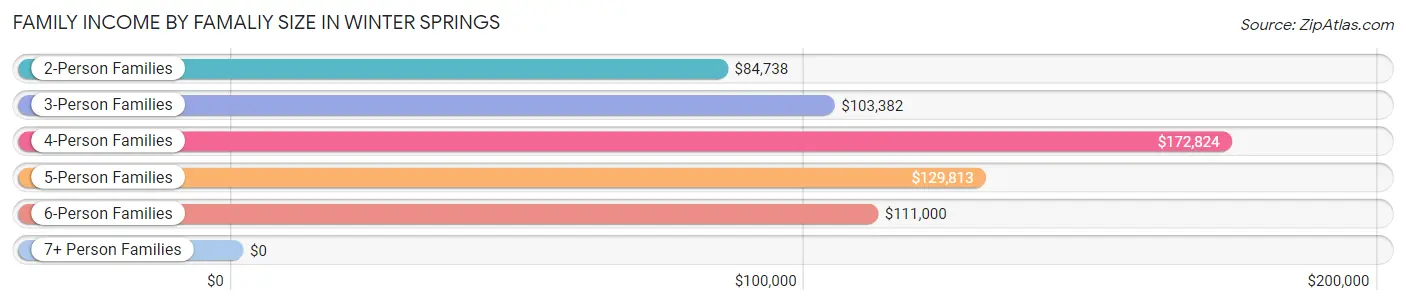
| Income Bracket | # Families | Median Income |
| 2-Person Families | 5,557 (53.1%) | $84,738 |
| 3-Person Families | 2,028 (19.4%) | $103,382 |
| 4-Person Families | 1,829 (17.5%) | $172,824 |
| 5-Person Families | 841 (8.0%) | $129,813 |
| 6-Person Families | 172 (1.6%) | $111,000 |
| 7+ Person Families | 35 (0.3%) | $0 |
| Total | 10,462 (100.0%) | $98,972 |
Family Income by Number of Earners in Winter Springs
The median family income in Winter Springs is $98,972, with families comprising 3+ earners (1,046) having the highest median family income of $213,824, while families with no earners (1,649) have the lowest median family income of $44,975, accounting for 10.0% and 15.8% of families, respectively.
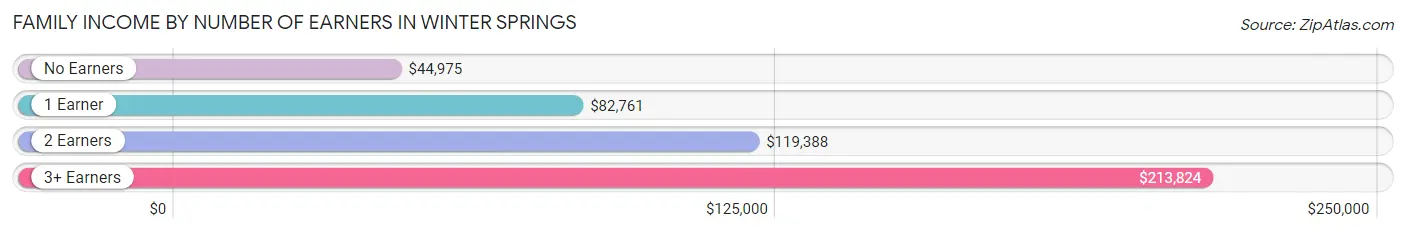
| Number of Earners | # Families | Median Income |
| No Earners | 1,649 (15.8%) | $44,975 |
| 1 Earner | 3,076 (29.4%) | $82,761 |
| 2 Earners | 4,691 (44.8%) | $119,388 |
| 3+ Earners | 1,046 (10.0%) | $213,824 |
| Total | 10,462 (100.0%) | $98,972 |
Household Income in Winter Springs
Household Income Brackets in Winter Springs
With 3,042 households falling in the category, the $75,000 to $99,999 income range is the most frequent in Winter Springs, accounting for 19.1% of all households. In contrast, only 207 households (1.3%) fall into the $10,000 to $14,999 income bracket, making it the least populous group.
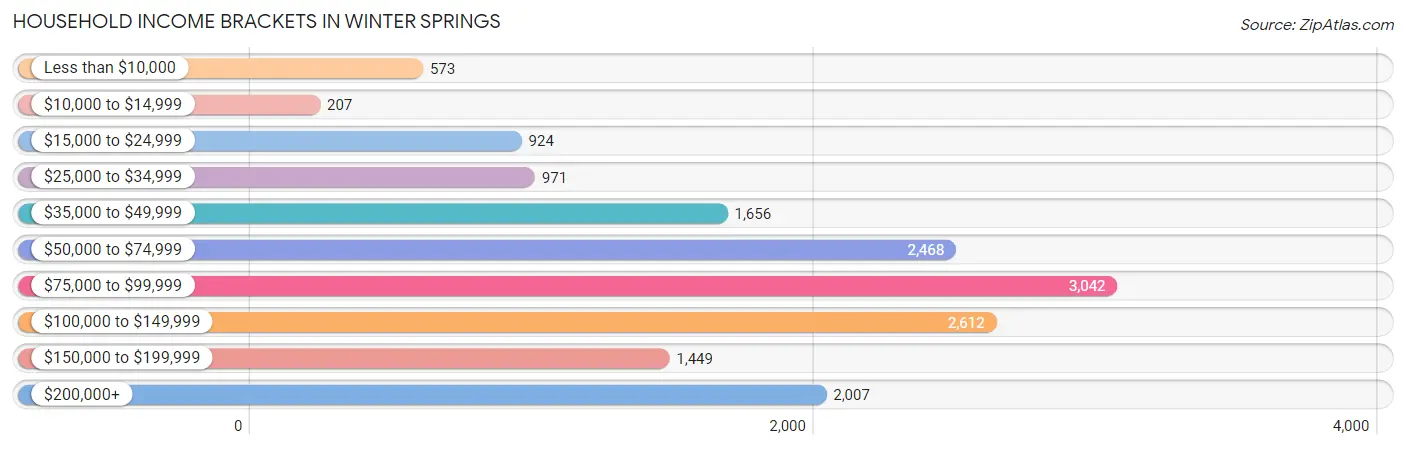
| Income Bracket | # Households | % Households |
| Less than $10,000 | 573 | 3.6% |
| $10,000 to $14,999 | 207 | 1.3% |
| $15,000 to $24,999 | 924 | 5.8% |
| $25,000 to $34,999 | 971 | 6.1% |
| $35,000 to $49,999 | 1,656 | 10.4% |
| $50,000 to $74,999 | 2,468 | 15.5% |
| $75,000 to $99,999 | 3,042 | 19.1% |
| $100,000 to $149,999 | 2,612 | 16.4% |
| $150,000 to $199,999 | 1,449 | 9.1% |
| $200,000+ | 2,007 | 12.6% |
Household Income by Householder Age in Winter Springs
The median household income in Winter Springs is $83,732, with the highest median household income of $98,542 found in the 45 to 64 years age bracket for the primary householder. A total of 5,863 households (36.8%) fall into this category. Meanwhile, the 65+ years age bracket for the primary householder has the lowest median household income of $52,979, with 4,753 households (29.8%) in this group.
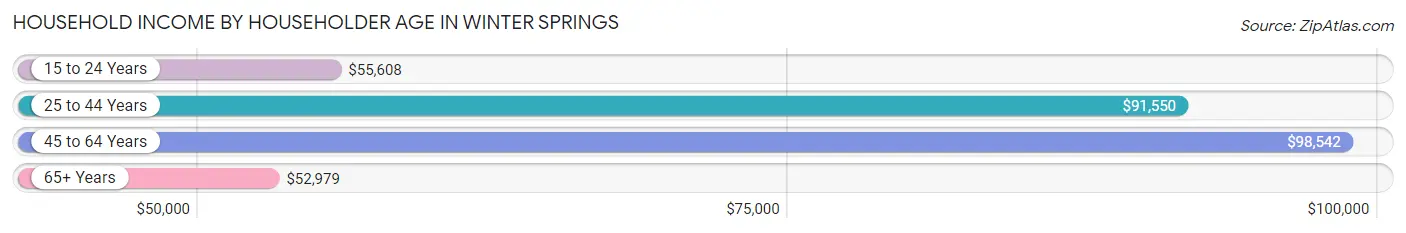
| Income Bracket | # Households | Median Income |
| 15 to 24 Years | 438 (2.8%) | $55,608 |
| 25 to 44 Years | 4,871 (30.6%) | $91,550 |
| 45 to 64 Years | 5,863 (36.8%) | $98,542 |
| 65+ Years | 4,753 (29.8%) | $52,979 |
| Total | 15,925 (100.0%) | $83,732 |
Poverty in Winter Springs
Income Below Poverty by Sex and Age in Winter Springs
With 6.7% poverty level for males and 9.9% for females among the residents of Winter Springs, 75 year old and over males and 75 year old and over females are the most vulnerable to poverty, with 323 males (21.7%) and 467 females (26.2%) in their respective age groups living below the poverty level.
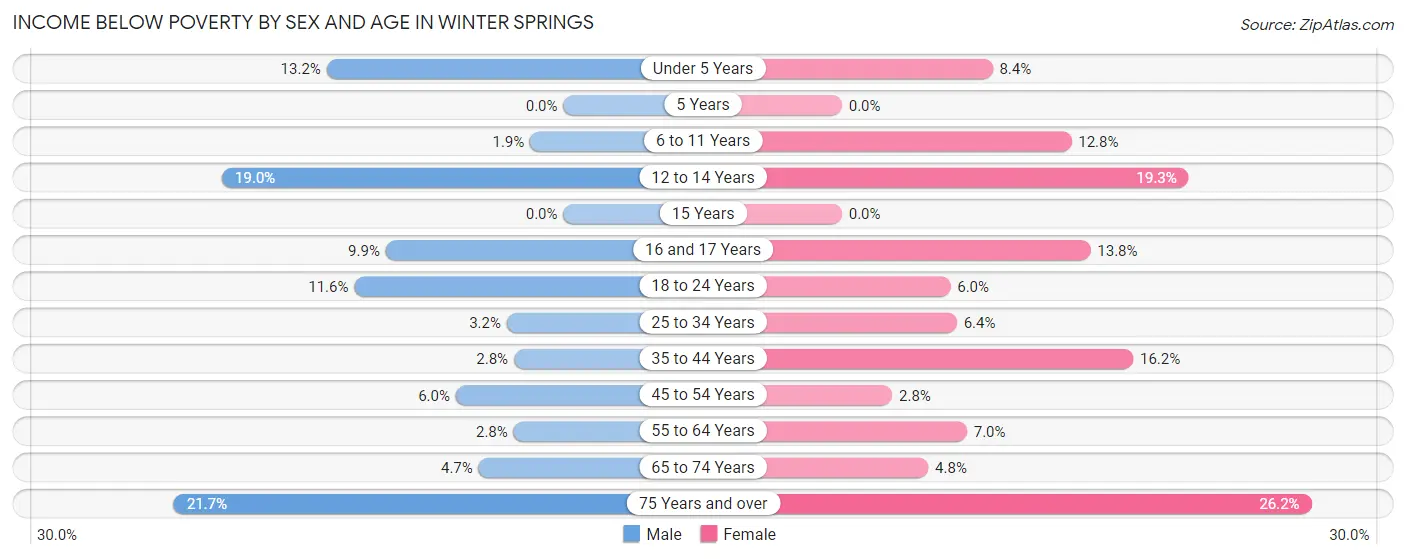
| Age Bracket | Male | Female |
| Under 5 Years | 75 (13.2%) | 75 (8.4%) |
| 5 Years | 0 (0.0%) | 0 (0.0%) |
| 6 to 11 Years | 21 (1.8%) | 205 (12.8%) |
| 12 to 14 Years | 131 (19.0%) | 95 (19.3%) |
| 15 Years | 0 (0.0%) | 0 (0.0%) |
| 16 and 17 Years | 36 (9.9%) | 79 (13.8%) |
| 18 to 24 Years | 192 (11.6%) | 61 (6.0%) |
| 25 to 34 Years | 85 (3.2%) | 145 (6.4%) |
| 35 to 44 Years | 83 (2.8%) | 365 (16.2%) |
| 45 to 54 Years | 146 (6.0%) | 66 (2.8%) |
| 55 to 64 Years | 65 (2.8%) | 227 (7.0%) |
| 65 to 74 Years | 101 (4.7%) | 116 (4.8%) |
| 75 Years and over | 323 (21.7%) | 467 (26.2%) |
| Total | 1,258 (6.7%) | 1,901 (9.9%) |
Income Above Poverty by Sex and Age in Winter Springs
According to the poverty statistics in Winter Springs, males aged 5 years and females aged 5 years are the age groups that are most secure financially, with 100.0% of males and 100.0% of females in these age groups living above the poverty line.
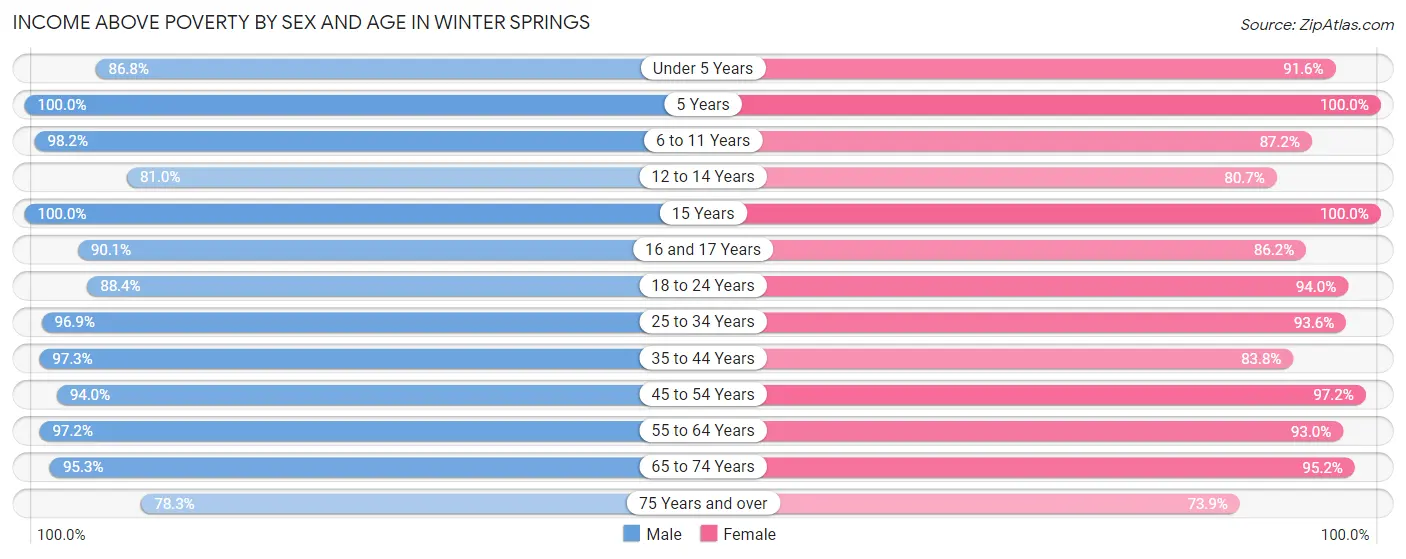
| Age Bracket | Male | Female |
| Under 5 Years | 494 (86.8%) | 819 (91.6%) |
| 5 Years | 151 (100.0%) | 248 (100.0%) |
| 6 to 11 Years | 1,112 (98.2%) | 1,399 (87.2%) |
| 12 to 14 Years | 558 (81.0%) | 397 (80.7%) |
| 15 Years | 248 (100.0%) | 87 (100.0%) |
| 16 and 17 Years | 328 (90.1%) | 492 (86.2%) |
| 18 to 24 Years | 1,457 (88.4%) | 949 (94.0%) |
| 25 to 34 Years | 2,613 (96.9%) | 2,122 (93.6%) |
| 35 to 44 Years | 2,935 (97.3%) | 1,885 (83.8%) |
| 45 to 54 Years | 2,290 (94.0%) | 2,294 (97.2%) |
| 55 to 64 Years | 2,280 (97.2%) | 3,036 (93.0%) |
| 65 to 74 Years | 2,038 (95.3%) | 2,297 (95.2%) |
| 75 Years and over | 1,166 (78.3%) | 1,319 (73.9%) |
| Total | 17,670 (93.3%) | 17,344 (90.1%) |
Income Below Poverty Among Married-Couple Families in Winter Springs
The poverty statistics for married-couple families in Winter Springs show that 6.2% or 499 of the total 8,057 families live below the poverty line. Families with 3 or 4 children have the highest poverty rate of 11.0%, comprising of 62 families. On the other hand, families with 1 or 2 children have the lowest poverty rate of 3.3%, which includes 68 families.
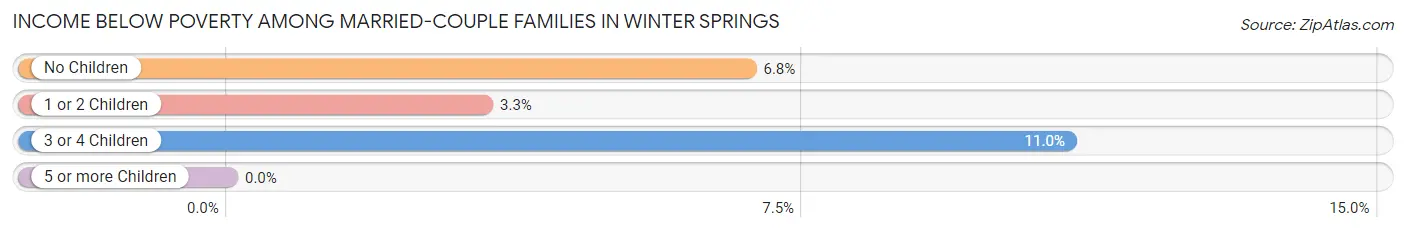
| Children | Above Poverty | Below Poverty |
| No Children | 5,081 (93.2%) | 369 (6.8%) |
| 1 or 2 Children | 1,973 (96.7%) | 68 (3.3%) |
| 3 or 4 Children | 504 (89.0%) | 62 (11.0%) |
| 5 or more Children | 0 (0.0%) | 0 (0.0%) |
| Total | 7,558 (93.8%) | 499 (6.2%) |
Income Below Poverty Among Single-Parent Households in Winter Springs
According to the poverty data in Winter Springs, 11.3% or 97 single-father households and 14.3% or 221 single-mother households are living below the poverty line. Among single-father households, those with 3 or 4 children have the highest poverty rate, with 51 households (100.0%) experiencing poverty. Likewise, among single-mother households, those with 1 or 2 children have the highest poverty rate, with 197 households (30.4%) falling below the poverty line.
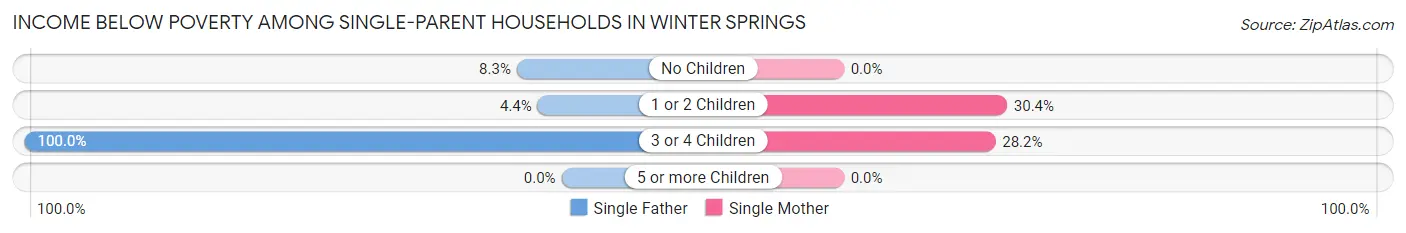
| Children | Single Father | Single Mother |
| No Children | 24 (8.3%) | 0 (0.0%) |
| 1 or 2 Children | 22 (4.4%) | 197 (30.4%) |
| 3 or 4 Children | 51 (100.0%) | 24 (28.2%) |
| 5 or more Children | 0 (0.0%) | 0 (0.0%) |
| Total | 97 (11.3%) | 221 (14.3%) |
Income Below Poverty Among Married-Couple vs Single-Parent Households in Winter Springs
The poverty data for Winter Springs shows that 499 of the married-couple family households (6.2%) and 318 of the single-parent households (13.2%) are living below the poverty level. Within the married-couple family households, those with 3 or 4 children have the highest poverty rate, with 62 households (11.0%) falling below the poverty line. Among the single-parent households, those with 3 or 4 children have the highest poverty rate, with 75 household (55.1%) living below poverty.
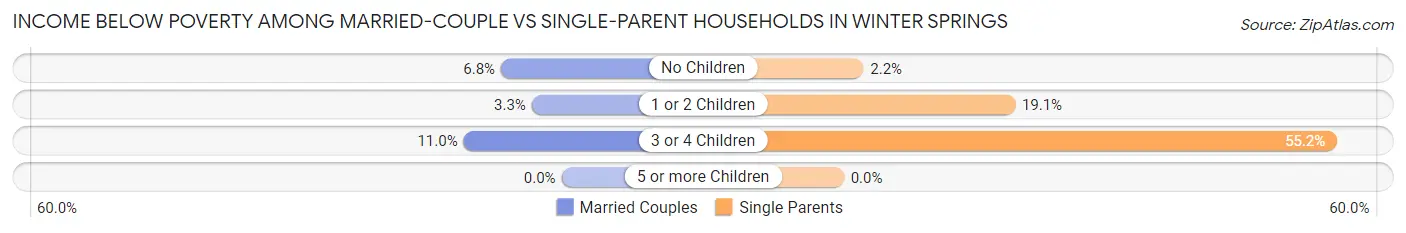
| Children | Married-Couple Families | Single-Parent Households |
| No Children | 369 (6.8%) | 24 (2.2%) |
| 1 or 2 Children | 68 (3.3%) | 219 (19.1%) |
| 3 or 4 Children | 62 (11.0%) | 75 (55.1%) |
| 5 or more Children | 0 (0.0%) | 0 (0.0%) |
| Total | 499 (6.2%) | 318 (13.2%) |
Race in Winter Springs
The most populous races in Winter Springs are White / Caucasian (28,570 | 74.8%), Hispanic or Latino (7,769 | 20.3%), and Two or more Races (3,329 | 8.7%).
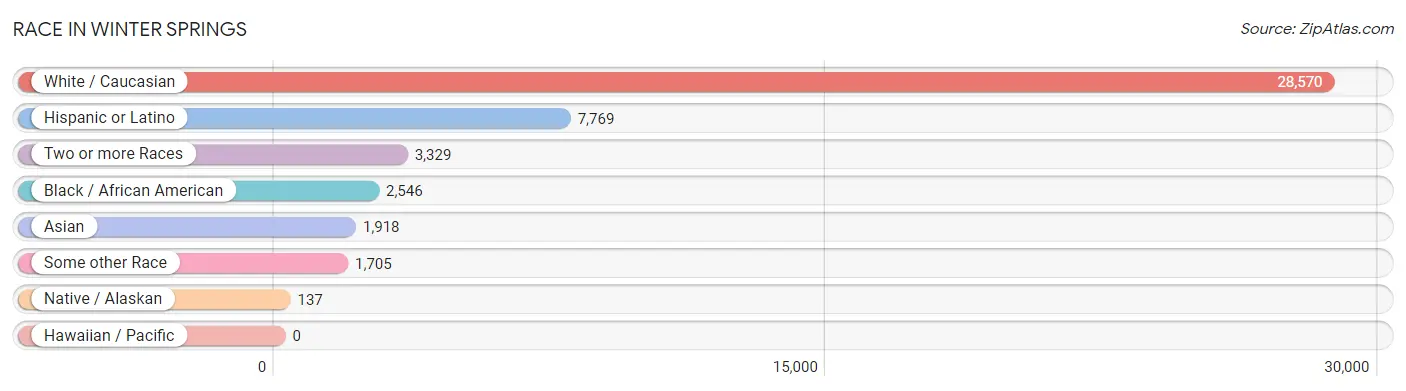
| Race | # Population | % Population |
| Asian | 1,918 | 5.0% |
| Black / African American | 2,546 | 6.7% |
| Hawaiian / Pacific | 0 | 0.0% |
| Hispanic or Latino | 7,769 | 20.3% |
| Native / Alaskan | 137 | 0.4% |
| White / Caucasian | 28,570 | 74.8% |
| Two or more Races | 3,329 | 8.7% |
| Some other Race | 1,705 | 4.5% |
| Total | 38,205 | 100.0% |
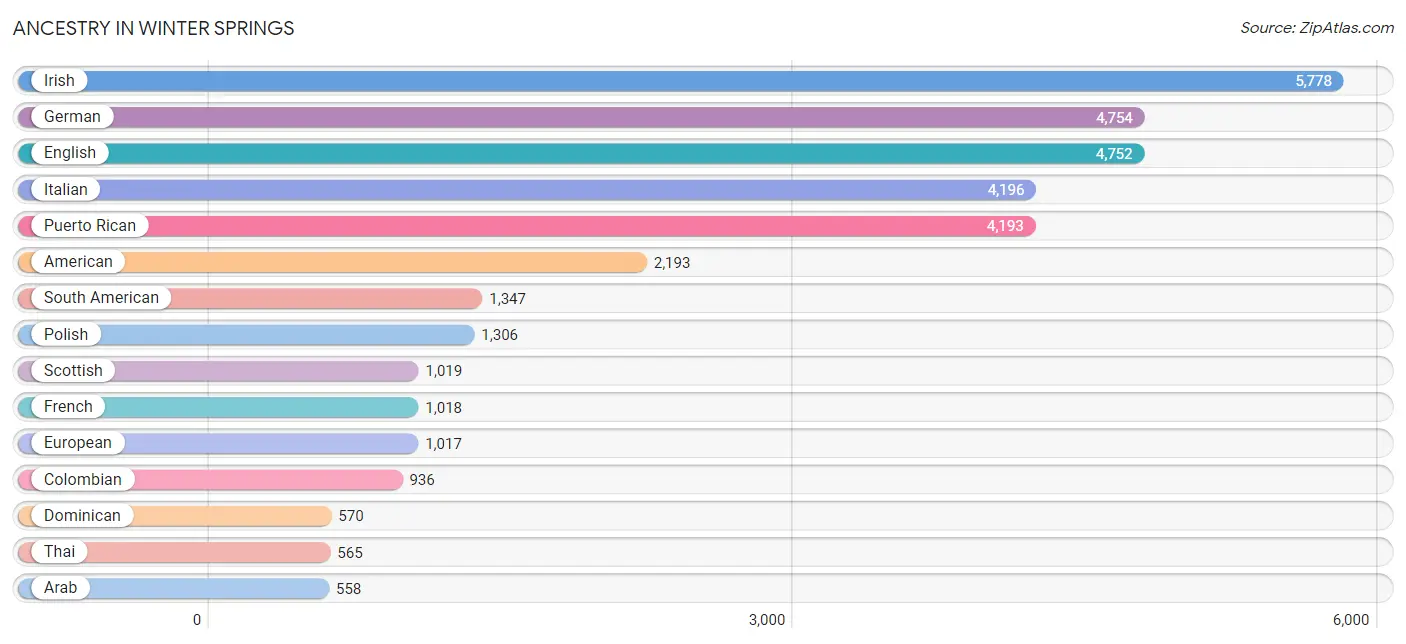
Ancestry in Winter Springs
The most populous ancestries reported in Winter Springs are Irish (5,778 | 15.1%), German (4,754 | 12.4%), English (4,752 | 12.4%), Italian (4,196 | 11.0%), and Puerto Rican (4,193 | 11.0%), together accounting for 62.0% of all Winter Springs residents.
| Ancestry | # Population | % Population |
| African | 88 | 0.2% |
| American | 2,193 | 5.7% |
| Arab | 558 | 1.5% |
| Argentinean | 33 | 0.1% |
| Australian | 14 | 0.0% |
| Austrian | 147 | 0.4% |
| Barbadian | 64 | 0.2% |
| Basque | 32 | 0.1% |
| Belgian | 14 | 0.0% |
| Belizean | 20 | 0.1% |
| Bhutanese | 136 | 0.4% |
| Brazilian | 258 | 0.7% |
| British | 508 | 1.3% |
| Bulgarian | 56 | 0.2% |
| Burmese | 228 | 0.6% |
| Cajun | 11 | 0.0% |
| Canadian | 94 | 0.3% |
| Celtic | 31 | 0.1% |
| Central American | 316 | 0.8% |
| Central American Indian | 114 | 0.3% |
| Cherokee | 23 | 0.1% |
| Chilean | 9 | 0.0% |
| Chippewa | 12 | 0.0% |
| Choctaw | 21 | 0.1% |
| Colombian | 936 | 2.5% |
| Creek | 38 | 0.1% |
| Cuban | 400 | 1.1% |
| Czech | 138 | 0.4% |
| Czechoslovakian | 31 | 0.1% |
| Danish | 57 | 0.2% |
| Dominican | 570 | 1.5% |
| Dutch | 356 | 0.9% |
| Eastern European | 160 | 0.4% |
| Ecuadorian | 224 | 0.6% |
| Egyptian | 266 | 0.7% |
| English | 4,752 | 12.4% |
| European | 1,017 | 2.7% |
| Filipino | 71 | 0.2% |
| Finnish | 61 | 0.2% |
| French | 1,018 | 2.7% |
| French American Indian | 18 | 0.1% |
| French Canadian | 163 | 0.4% |
| German | 4,754 | 12.4% |
| Greek | 152 | 0.4% |
| Guatemalan | 8 | 0.0% |
| Guyanese | 33 | 0.1% |
| Haitian | 204 | 0.5% |
| Honduran | 20 | 0.1% |
| Hungarian | 266 | 0.7% |
| Indian (Asian) | 243 | 0.6% |
| Iranian | 121 | 0.3% |
| Irish | 5,778 | 15.1% |
| Iroquois | 18 | 0.1% |
| Italian | 4,196 | 11.0% |
| Jamaican | 276 | 0.7% |
| Korean | 439 | 1.1% |
| Lebanese | 228 | 0.6% |
| Lithuanian | 29 | 0.1% |
| Malaysian | 82 | 0.2% |
| Mexican | 550 | 1.4% |
| Native Hawaiian | 23 | 0.1% |
| Nicaraguan | 98 | 0.3% |
| Northern European | 65 | 0.2% |
| Norwegian | 185 | 0.5% |
| Pakistani | 92 | 0.2% |
| Palestinian | 15 | 0.0% |
| Panamanian | 75 | 0.2% |
| Pennsylvania German | 34 | 0.1% |
| Peruvian | 7 | 0.0% |
| Polish | 1,306 | 3.4% |
| Portuguese | 338 | 0.9% |
| Puerto Rican | 4,193 | 11.0% |
| Romanian | 42 | 0.1% |
| Russian | 441 | 1.1% |
| Salvadoran | 115 | 0.3% |
| Scandinavian | 53 | 0.1% |
| Scotch-Irish | 557 | 1.5% |
| Scottish | 1,019 | 2.7% |
| Serbian | 19 | 0.1% |
| Slavic | 17 | 0.0% |
| Slovak | 55 | 0.1% |
| Slovene | 109 | 0.3% |
| South American | 1,347 | 3.5% |
| Spaniard | 59 | 0.2% |
| Spanish | 107 | 0.3% |
| Sri Lankan | 394 | 1.0% |
| Subsaharan African | 121 | 0.3% |
| Swedish | 494 | 1.3% |
| Thai | 565 | 1.5% |
| Trinidadian and Tobagonian | 20 | 0.1% |
| Ukrainian | 119 | 0.3% |
| Venezuelan | 138 | 0.4% |
| Vietnamese | 111 | 0.3% |
| Welsh | 188 | 0.5% |
| West Indian | 8 | 0.0% |
| Yugoslavian | 8 | 0.0% | View All 96 Rows |
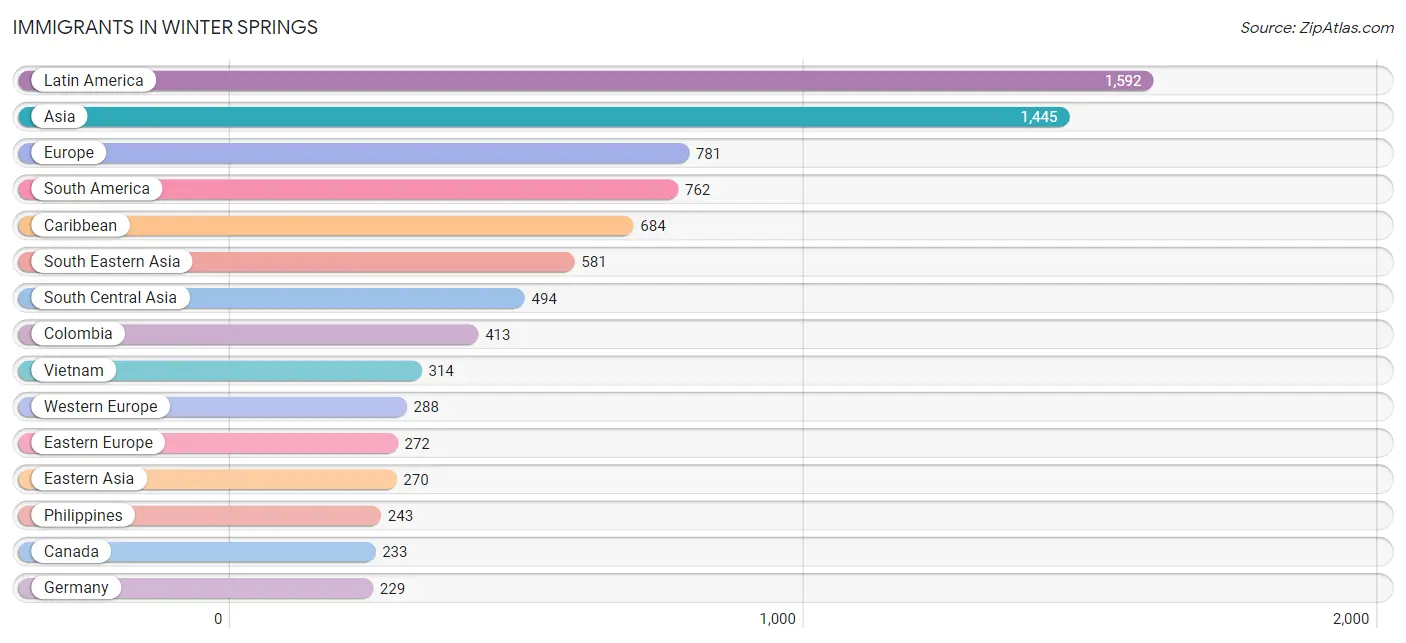
Immigrants in Winter Springs
The most numerous immigrant groups reported in Winter Springs came from Latin America (1,592 | 4.2%), Asia (1,445 | 3.8%), Europe (781 | 2.0%), South America (762 | 2.0%), and Caribbean (684 | 1.8%), together accounting for 13.8% of all Winter Springs residents.
| Immigration Origin | # Population | % Population |
| Africa | 193 | 0.5% |
| Argentina | 18 | 0.1% |
| Asia | 1,445 | 3.8% |
| Bangladesh | 150 | 0.4% |
| Bosnia and Herzegovina | 26 | 0.1% |
| Brazil | 83 | 0.2% |
| Bulgaria | 21 | 0.1% |
| Canada | 233 | 0.6% |
| Caribbean | 684 | 1.8% |
| Central America | 146 | 0.4% |
| China | 206 | 0.5% |
| Colombia | 413 | 1.1% |
| Cuba | 195 | 0.5% |
| Dominican Republic | 152 | 0.4% |
| Eastern Africa | 125 | 0.3% |
| Eastern Asia | 270 | 0.7% |
| Eastern Europe | 272 | 0.7% |
| Ecuador | 133 | 0.4% |
| Egypt | 36 | 0.1% |
| El Salvador | 62 | 0.2% |
| England | 40 | 0.1% |
| Europe | 781 | 2.0% |
| France | 32 | 0.1% |
| Germany | 229 | 0.6% |
| Guatemala | 8 | 0.0% |
| Guyana | 37 | 0.1% |
| Haiti | 184 | 0.5% |
| Honduras | 20 | 0.1% |
| Hungary | 35 | 0.1% |
| India | 212 | 0.5% |
| Iran | 83 | 0.2% |
| Ireland | 46 | 0.1% |
| Israel | 24 | 0.1% |
| Italy | 18 | 0.1% |
| Jamaica | 91 | 0.2% |
| Japan | 20 | 0.1% |
| Kazakhstan | 32 | 0.1% |
| Kenya | 17 | 0.0% |
| Korea | 44 | 0.1% |
| Laos | 24 | 0.1% |
| Latin America | 1,592 | 4.2% |
| Lebanon | 44 | 0.1% |
| Mexico | 30 | 0.1% |
| Northern Africa | 36 | 0.1% |
| Northern Europe | 203 | 0.5% |
| Panama | 26 | 0.1% |
| Philippines | 243 | 0.6% |
| Poland | 56 | 0.2% |
| Russia | 67 | 0.2% |
| Saudi Arabia | 15 | 0.0% |
| South Africa | 32 | 0.1% |
| South America | 762 | 2.0% |
| South Central Asia | 494 | 1.3% |
| South Eastern Asia | 581 | 1.5% |
| Southern Europe | 18 | 0.1% |
| Sweden | 55 | 0.1% |
| Switzerland | 27 | 0.1% |
| Syria | 17 | 0.0% |
| Taiwan | 79 | 0.2% |
| Trinidad and Tobago | 62 | 0.2% |
| Uganda | 20 | 0.1% |
| Venezuela | 78 | 0.2% |
| Vietnam | 314 | 0.8% |
| Western Asia | 100 | 0.3% |
| Western Europe | 288 | 0.7% | View All 65 Rows |
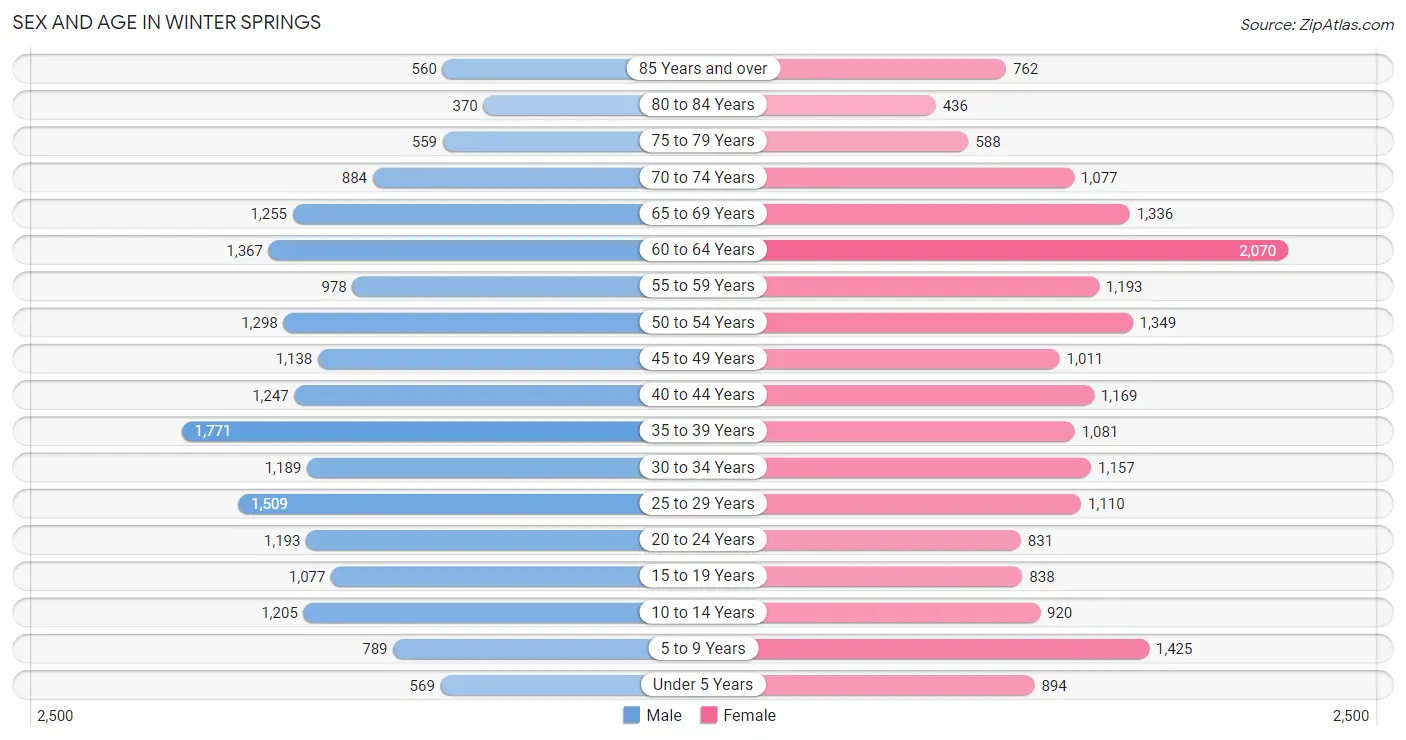
Sex and Age in Winter Springs
Sex and Age in Winter Springs
The most populous age groups in Winter Springs are 35 to 39 Years (1,771 | 9.3%) for men and 60 to 64 Years (2,070 | 10.7%) for women.
| Age Bracket | Male | Female |
| Under 5 Years | 569 (3.0%) | 894 (4.6%) |
| 5 to 9 Years | 789 (4.2%) | 1,425 (7.4%) |
| 10 to 14 Years | 1,205 (6.4%) | 920 (4.8%) |
| 15 to 19 Years | 1,077 (5.7%) | 838 (4.3%) |
| 20 to 24 Years | 1,193 (6.3%) | 831 (4.3%) |
| 25 to 29 Years | 1,509 (8.0%) | 1,110 (5.8%) |
| 30 to 34 Years | 1,189 (6.3%) | 1,157 (6.0%) |
| 35 to 39 Years | 1,771 (9.3%) | 1,081 (5.6%) |
| 40 to 44 Years | 1,247 (6.6%) | 1,169 (6.1%) |
| 45 to 49 Years | 1,138 (6.0%) | 1,011 (5.2%) |
| 50 to 54 Years | 1,298 (6.9%) | 1,349 (7.0%) |
| 55 to 59 Years | 978 (5.2%) | 1,193 (6.2%) |
| 60 to 64 Years | 1,367 (7.2%) | 2,070 (10.7%) |
| 65 to 69 Years | 1,255 (6.6%) | 1,336 (6.9%) |
| 70 to 74 Years | 884 (4.7%) | 1,077 (5.6%) |
| 75 to 79 Years | 559 (2.9%) | 588 (3.1%) |
| 80 to 84 Years | 370 (1.9%) | 436 (2.3%) |
| 85 Years and over | 560 (2.9%) | 762 (4.0%) |
| Total | 18,958 (100.0%) | 19,247 (100.0%) |
Families and Households in Winter Springs
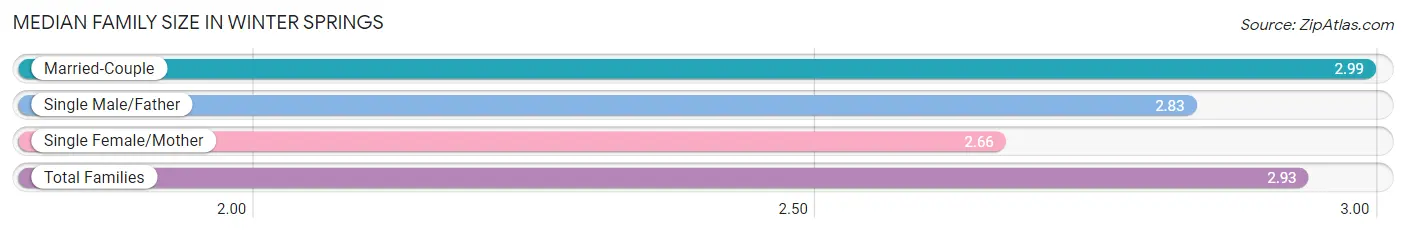
Median Family Size in Winter Springs
The median family size in Winter Springs is 2.93 persons per family, with married-couple families (8,057 | 77.0%) accounting for the largest median family size of 2.99 persons per family. On the other hand, single female/mother families (1,545 | 14.8%) represent the smallest median family size with 2.66 persons per family.
| Family Type | # Families | Family Size |
| Married-Couple | 8,057 (77.0%) | 2.99 |
| Single Male/Father | 860 (8.2%) | 2.83 |
| Single Female/Mother | 1,545 (14.8%) | 2.66 |
| Total Families | 10,462 (100.0%) | 2.93 |
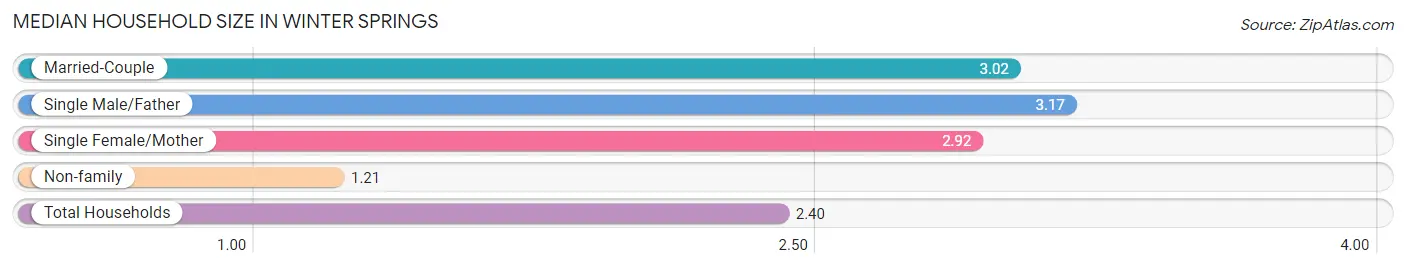
Median Household Size in Winter Springs
The median household size in Winter Springs is 2.40 persons per household, with single male/father households (860 | 5.4%) accounting for the largest median household size of 3.17 persons per household. non-family households (5,463 | 34.3%) represent the smallest median household size with 1.21 persons per household.
| Household Type | # Households | Household Size |
| Married-Couple | 8,057 (50.6%) | 3.02 |
| Single Male/Father | 860 (5.4%) | 3.17 |
| Single Female/Mother | 1,545 (9.7%) | 2.92 |
| Non-family | 5,463 (34.3%) | 1.21 |
| Total Households | 15,925 (100.0%) | 2.40 |
Household Size by Marriage Status in Winter Springs
Out of a total of 15,925 households in Winter Springs, 10,462 (65.7%) are family households, while 5,463 (34.3%) are nonfamily households. The most numerous type of family households are 2-person households, comprising 5,174, and the most common type of nonfamily households are 1-person households, comprising 4,376.
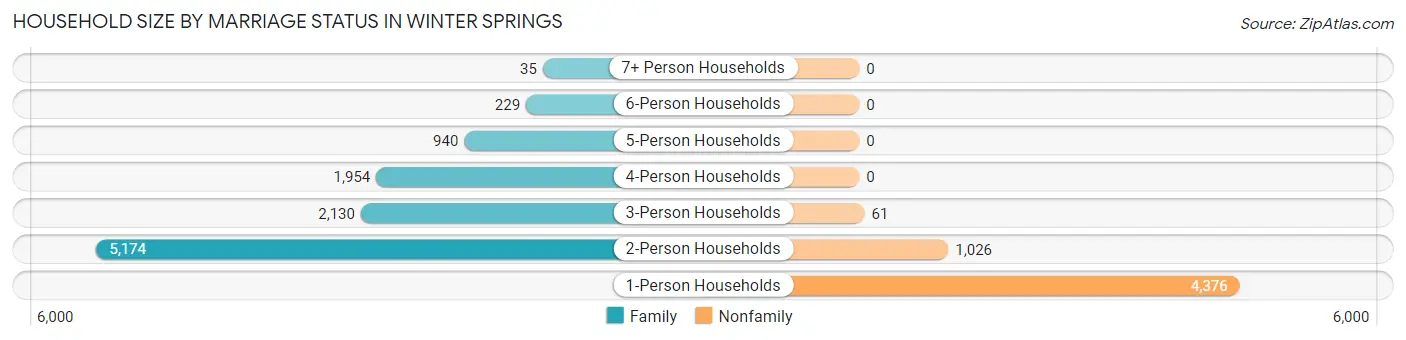
| Household Size | Family Households | Nonfamily Households |
| 1-Person Households | - | 4,376 (27.5%) |
| 2-Person Households | 5,174 (32.5%) | 1,026 (6.4%) |
| 3-Person Households | 2,130 (13.4%) | 61 (0.4%) |
| 4-Person Households | 1,954 (12.3%) | 0 (0.0%) |
| 5-Person Households | 940 (5.9%) | 0 (0.0%) |
| 6-Person Households | 229 (1.4%) | 0 (0.0%) |
| 7+ Person Households | 35 (0.2%) | 0 (0.0%) |
| Total | 10,462 (65.7%) | 5,463 (34.3%) |
Female Fertility in Winter Springs
Fertility by Age in Winter Springs
Average fertility rate in Winter Springs is 31.0 births per 1,000 women. Women in the age bracket of 20 to 34 years have the highest fertility rate with 61.0 births per 1,000 women. Women in the age bracket of 20 to 34 years acount for 81.8% of all women with births.
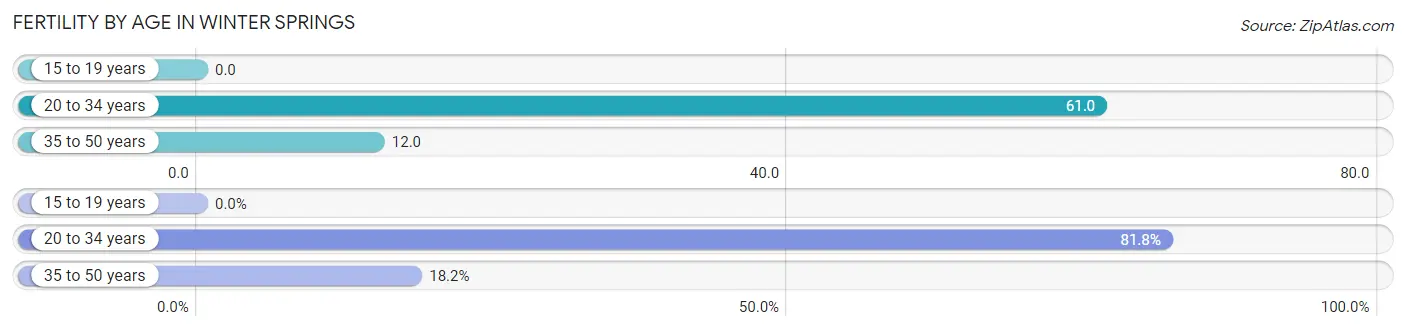
| Age Bracket | Women with Births | Births / 1,000 Women |
| 15 to 19 years | 0 (0.0%) | 0.0 |
| 20 to 34 years | 189 (81.8%) | 61.0 |
| 35 to 50 years | 42 (18.2%) | 12.0 |
| Total | 231 (100.0%) | 31.0 |
Fertility by Age by Marriage Status in Winter Springs
68.8% of women with births (231) in Winter Springs are married. The highest percentage of unmarried women with births falls into 20 to 34 years age bracket with 38.1% of them unmarried at the time of birth, while the lowest percentage of unmarried women with births belong to 35 to 50 years age bracket with 0.0% of them unmarried.
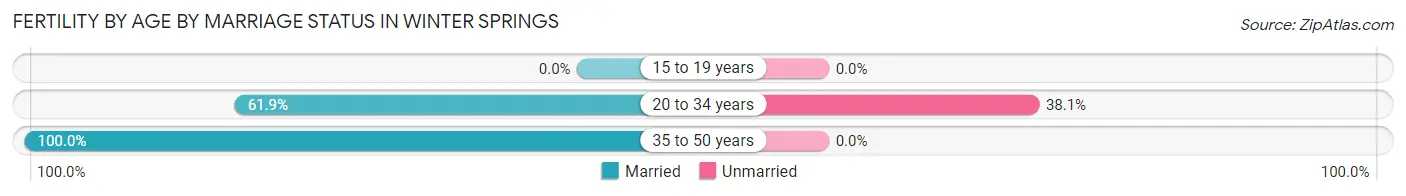
| Age Bracket | Married | Unmarried |
| 15 to 19 years | 0 (0.0%) | 0 (0.0%) |
| 20 to 34 years | 117 (61.9%) | 72 (38.1%) |
| 35 to 50 years | 42 (100.0%) | 0 (0.0%) |
| Total | 159 (68.8%) | 72 (31.2%) |
Fertility by Education in Winter Springs
Average fertility rate in Winter Springs is 31.0 births per 1,000 women. Women with the education attainment of high school diploma have the highest fertility rate of 80.0 births per 1,000 women, while women with the education attainment of less than high school have the lowest fertility at 4.0 births per 1,000 women. Women with the education attainment of high school diploma represent 28.6% of all women with births.
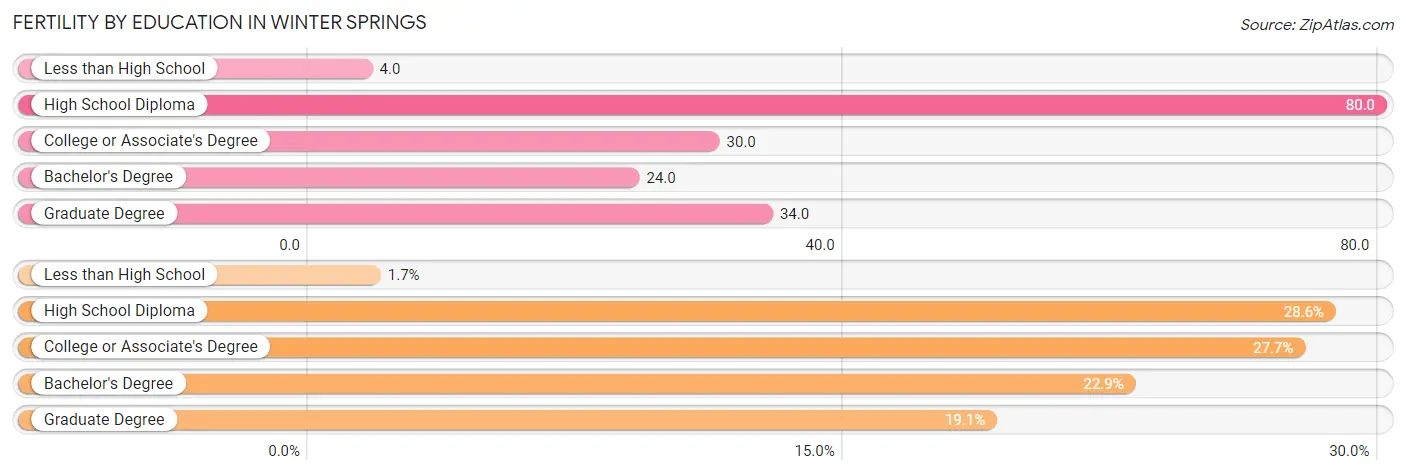
| Educational Attainment | Women with Births | Births / 1,000 Women |
| Less than High School | 4 (1.7%) | 4.0 |
| High School Diploma | 66 (28.6%) | 80.0 |
| College or Associate's Degree | 64 (27.7%) | 30.0 |
| Bachelor's Degree | 53 (22.9%) | 24.0 |
| Graduate Degree | 44 (19.1%) | 34.0 |
| Total | 231 (100.0%) | 31.0 |
Fertility by Education by Marriage Status in Winter Springs
31.2% of women with births in Winter Springs are unmarried. Women with the educational attainment of bachelor's degree are most likely to be married with 100.0% of them married at childbirth, while women with the educational attainment of high school diploma are least likely to be married with 66.7% of them unmarried at childbirth.
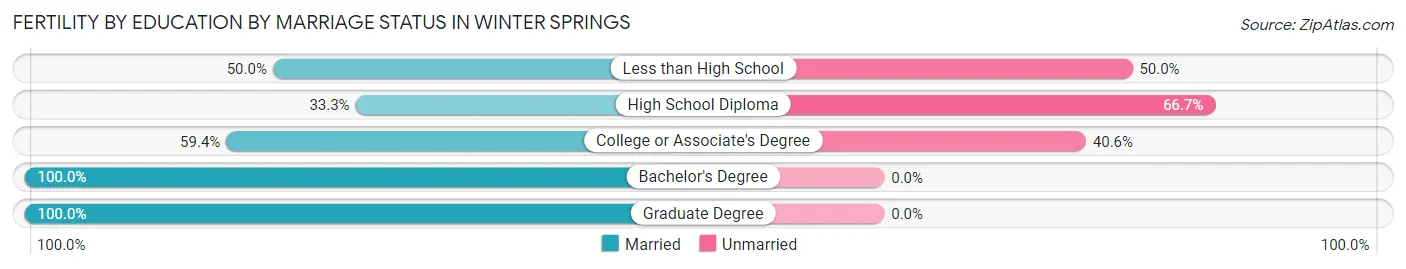
| Educational Attainment | Married | Unmarried |
| Less than High School | 2 (50.0%) | 2 (50.0%) |
| High School Diploma | 22 (33.3%) | 44 (66.7%) |
| College or Associate's Degree | 38 (59.4%) | 26 (40.6%) |
| Bachelor's Degree | 53 (100.0%) | 0 (0.0%) |
| Graduate Degree | 44 (100.0%) | 0 (0.0%) |
| Total | 159 (68.8%) | 72 (31.2%) |
Employment Characteristics in Winter Springs
Employment by Class of Employer in Winter Springs
Among the 20,106 employed individuals in Winter Springs, private company employees (13,139 | 65.3%), not-for-profit organizations (1,816 | 9.0%), and local government employees (1,249 | 6.2%) make up the most common classes of employment.
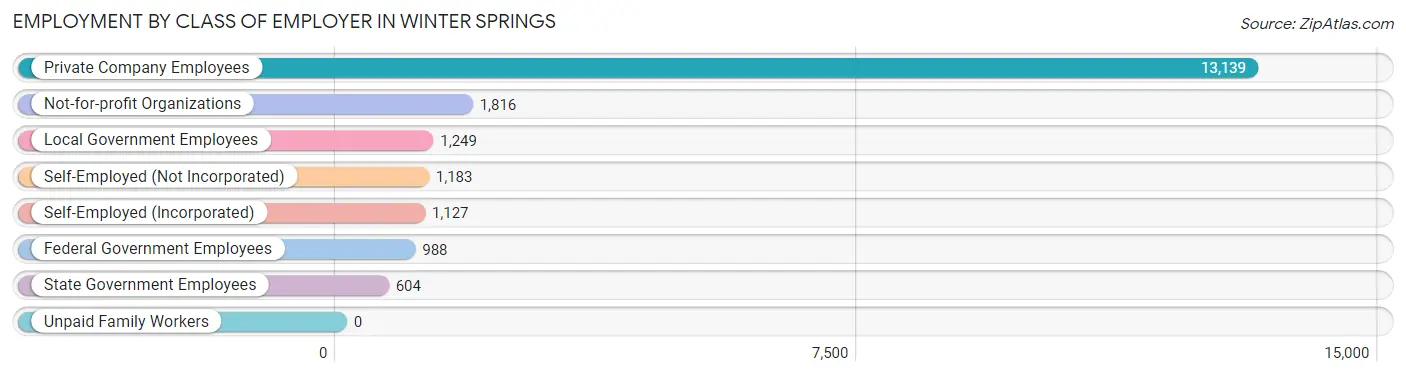
| Employer Class | # Employees | % Employees |
| Private Company Employees | 13,139 | 65.3% |
| Self-Employed (Incorporated) | 1,127 | 5.6% |
| Self-Employed (Not Incorporated) | 1,183 | 5.9% |
| Not-for-profit Organizations | 1,816 | 9.0% |
| Local Government Employees | 1,249 | 6.2% |
| State Government Employees | 604 | 3.0% |
| Federal Government Employees | 988 | 4.9% |
| Unpaid Family Workers | 0 | 0.0% |
| Total | 20,106 | 100.0% |
Employment Status by Age in Winter Springs
According to the labor force statistics for Winter Springs, out of the total population over 16 years of age (32,068), 67.4% or 21,614 individuals are in the labor force, with 4.2% or 908 of them unemployed. The age group with the highest labor force participation rate is 30 to 34 years, with 93.4% or 2,191 individuals in the labor force. Within the labor force, the 20 to 24 years age range has the highest percentage of unemployed individuals, with 21.8% or 352 of them being unemployed.
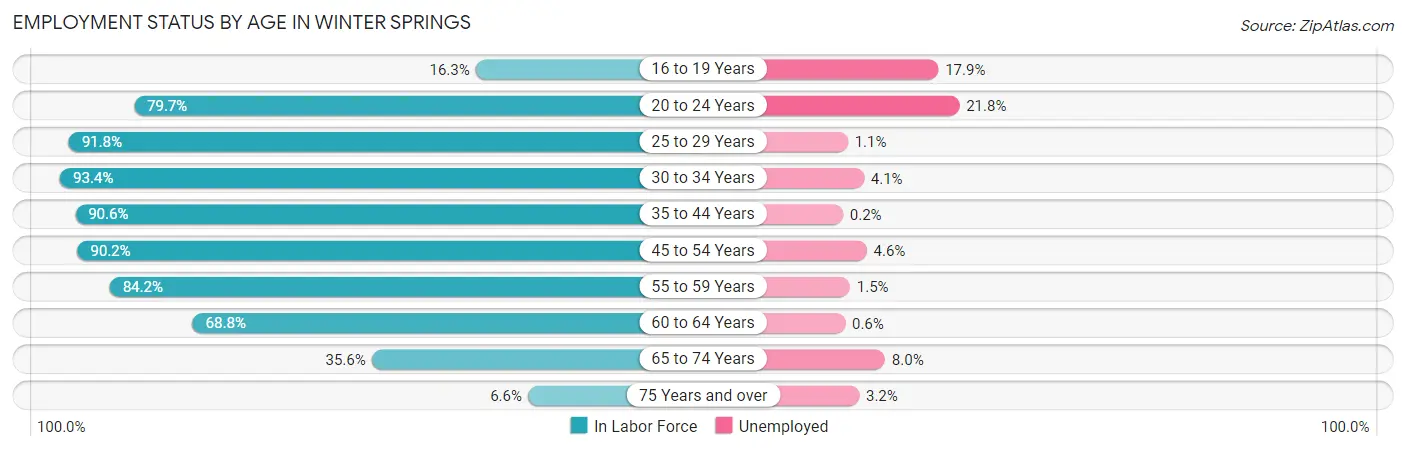
| Age Bracket | In Labor Force | Unemployed |
| 16 to 19 Years | 258 (16.3%) | 46 (17.9%) |
| 20 to 24 Years | 1,613 (79.7%) | 352 (21.8%) |
| 25 to 29 Years | 2,404 (91.8%) | 26 (1.1%) |
| 30 to 34 Years | 2,191 (93.4%) | 90 (4.1%) |
| 35 to 44 Years | 4,773 (90.6%) | 10 (0.2%) |
| 45 to 54 Years | 4,326 (90.2%) | 199 (4.6%) |
| 55 to 59 Years | 1,828 (84.2%) | 27 (1.5%) |
| 60 to 64 Years | 2,365 (68.8%) | 14 (0.6%) |
| 65 to 74 Years | 1,621 (35.6%) | 130 (8.0%) |
| 75 Years and over | 216 (6.6%) | 7 (3.2%) |
| Total | 21,614 (67.4%) | 908 (4.2%) |
Employment Status by Educational Attainment in Winter Springs
According to labor force statistics for Winter Springs, 86.7% of individuals (17,892) out of the total population between 25 and 64 years of age (20,637) are in the labor force, with 2.0% or 358 of them being unemployed. The group with the highest labor force participation rate are those with the educational attainment of bachelor's degree or higher, with 90.8% or 10,246 individuals in the labor force. Within the labor force, individuals with less than high school education have the highest percentage of unemployment, with 5.7% or 34 of them being unemployed.
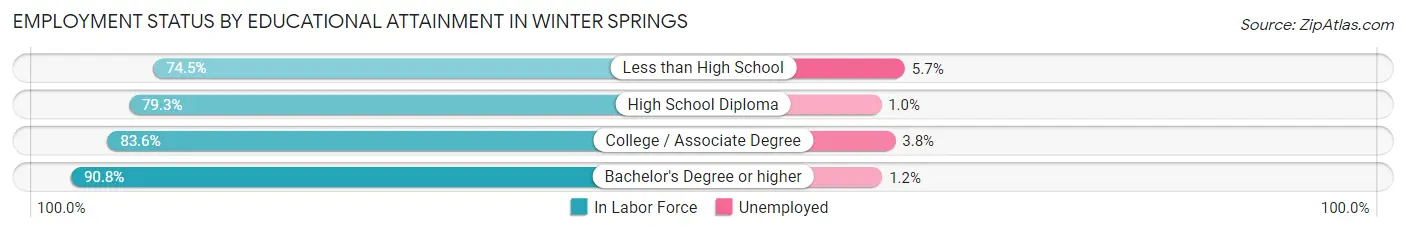
| Educational Attainment | In Labor Force | Unemployed |
| Less than High School | 598 (74.5%) | 46 (5.7%) |
| High School Diploma | 1,962 (79.3%) | 25 (1.0%) |
| College / Associate Degree | 5,080 (83.6%) | 231 (3.8%) |
| Bachelor's Degree or higher | 10,246 (90.8%) | 135 (1.2%) |
| Total | 17,892 (86.7%) | 413 (2.0%) |
Employment Occupations by Sex in Winter Springs
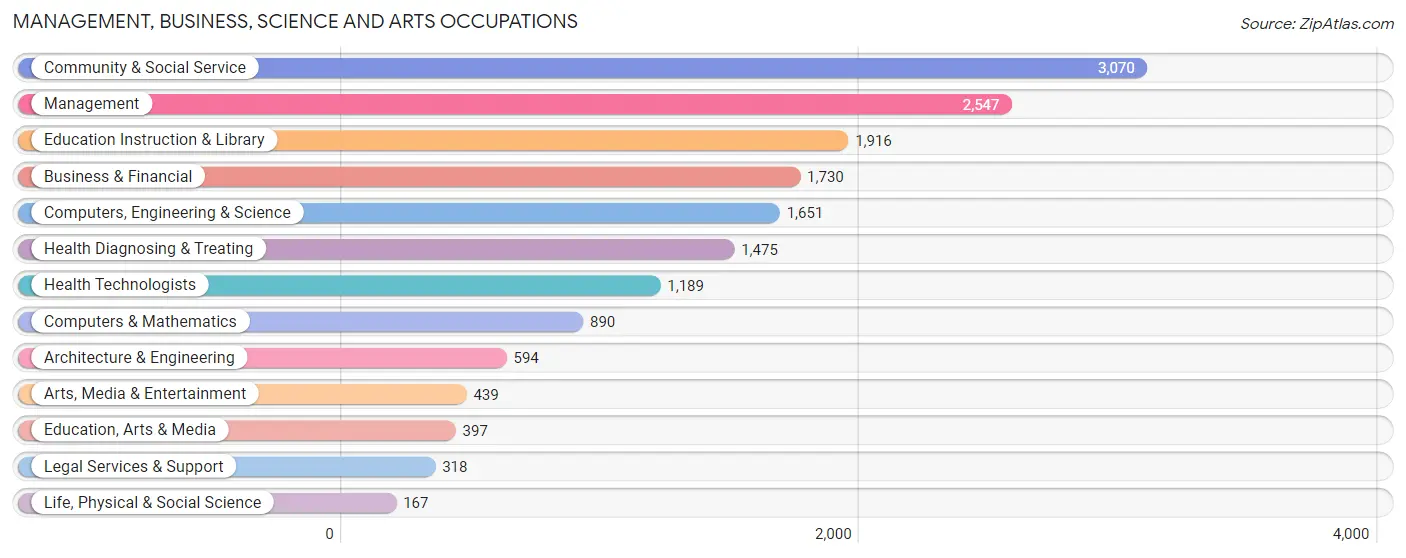
Management, Business, Science and Arts Occupations
The most common Management, Business, Science and Arts occupations in Winter Springs are Community & Social Service (3,070 | 14.9%), Management (2,547 | 12.3%), Education Instruction & Library (1,916 | 9.3%), Business & Financial (1,730 | 8.4%), and Computers, Engineering & Science (1,651 | 8.0%).
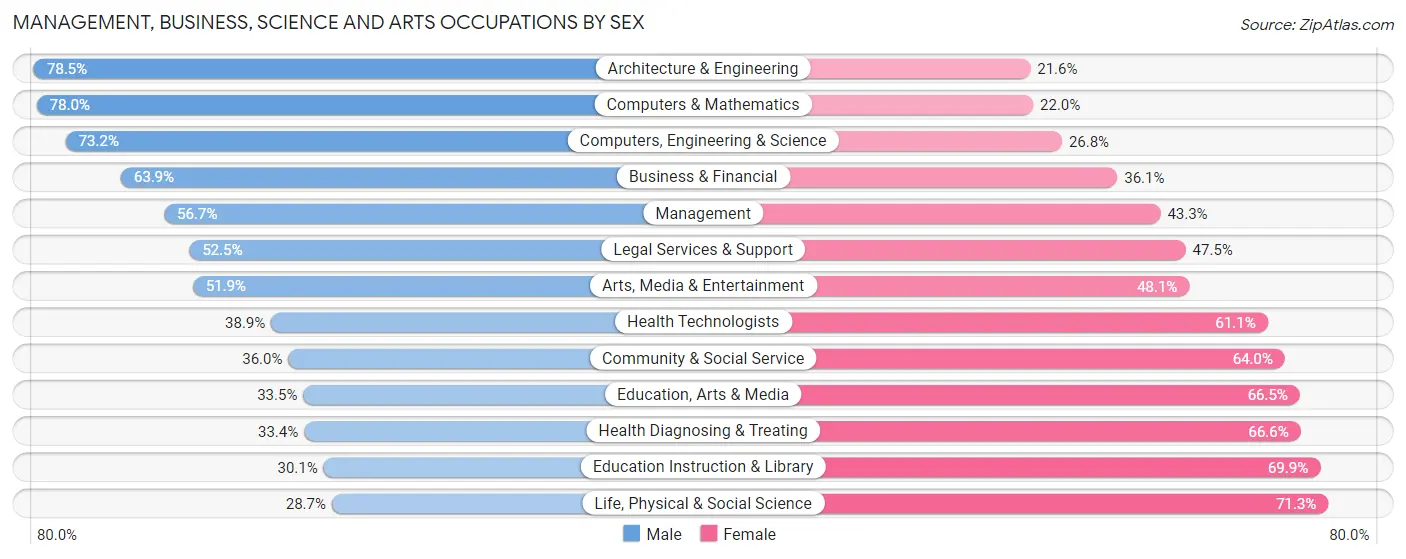
Management, Business, Science and Arts Occupations by Sex
Within the Management, Business, Science and Arts occupations in Winter Springs, the most male-oriented occupations are Architecture & Engineering (78.4%), Computers & Mathematics (78.0%), and Computers, Engineering & Science (73.2%), while the most female-oriented occupations are Life, Physical & Social Science (71.3%), Education Instruction & Library (69.9%), and Health Diagnosing & Treating (66.6%).
| Occupation | Male | Female |
| Management | 1,445 (56.7%) | 1,102 (43.3%) |
| Business & Financial | 1,106 (63.9%) | 624 (36.1%) |
| Computers, Engineering & Science | 1,208 (73.2%) | 443 (26.8%) |
| Computers & Mathematics | 694 (78.0%) | 196 (22.0%) |
| Architecture & Engineering | 466 (78.4%) | 128 (21.5%) |
| Life, Physical & Social Science | 48 (28.7%) | 119 (71.3%) |
| Community & Social Service | 1,105 (36.0%) | 1,965 (64.0%) |
| Education, Arts & Media | 133 (33.5%) | 264 (66.5%) |
| Legal Services & Support | 167 (52.5%) | 151 (47.5%) |
| Education Instruction & Library | 577 (30.1%) | 1,339 (69.9%) |
| Arts, Media & Entertainment | 228 (51.9%) | 211 (48.1%) |
| Health Diagnosing & Treating | 492 (33.4%) | 983 (66.6%) |
| Health Technologists | 462 (38.9%) | 727 (61.1%) |
| Total (Category) | 5,356 (51.1%) | 5,117 (48.9%) |
| Total (Overall) | 11,400 (55.2%) | 9,248 (44.8%) |
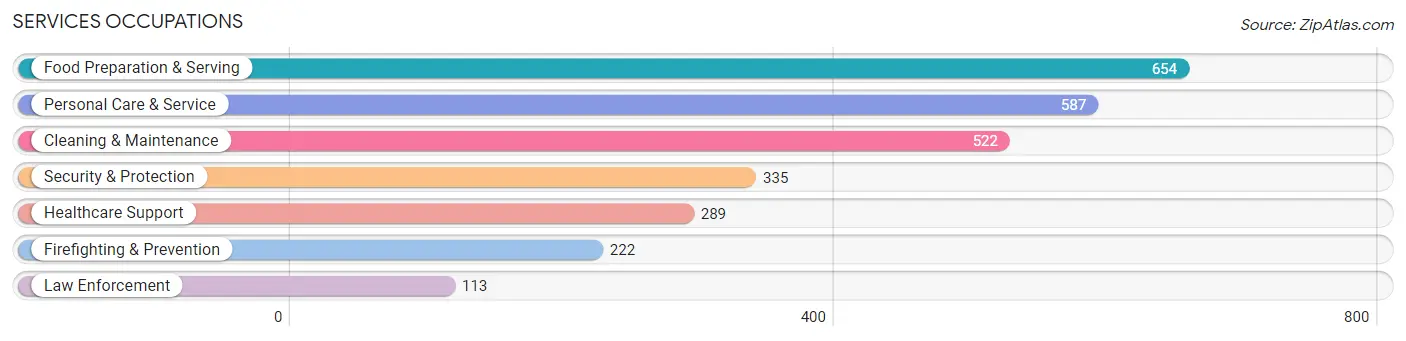
Services Occupations
The most common Services occupations in Winter Springs are Food Preparation & Serving (654 | 3.2%), Personal Care & Service (587 | 2.8%), Cleaning & Maintenance (522 | 2.5%), Security & Protection (335 | 1.6%), and Healthcare Support (289 | 1.4%).
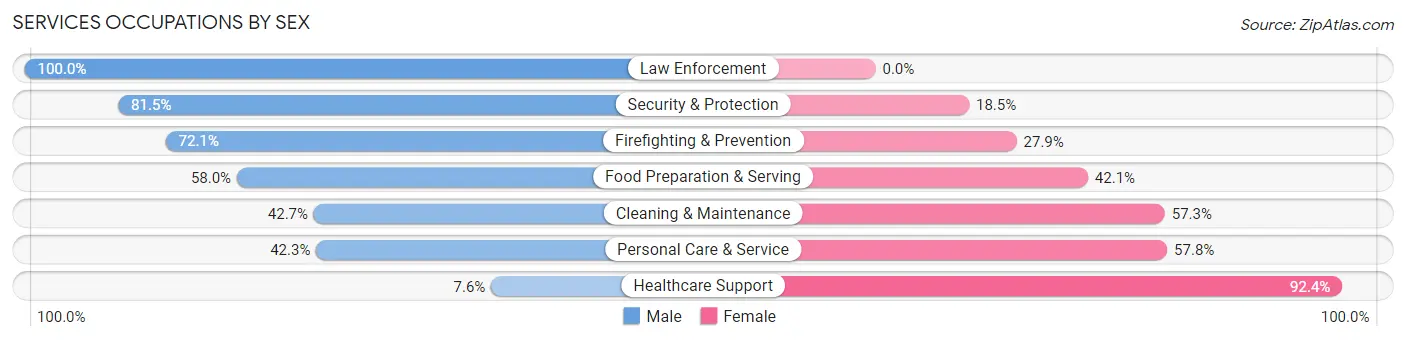
Services Occupations by Sex
Within the Services occupations in Winter Springs, the most male-oriented occupations are Law Enforcement (100.0%), Security & Protection (81.5%), and Firefighting & Prevention (72.1%), while the most female-oriented occupations are Healthcare Support (92.4%), Personal Care & Service (57.8%), and Cleaning & Maintenance (57.3%).
| Occupation | Male | Female |
| Healthcare Support | 22 (7.6%) | 267 (92.4%) |
| Security & Protection | 273 (81.5%) | 62 (18.5%) |
| Firefighting & Prevention | 160 (72.1%) | 62 (27.9%) |
| Law Enforcement | 113 (100.0%) | 0 (0.0%) |
| Food Preparation & Serving | 379 (58.0%) | 275 (42.0%) |
| Cleaning & Maintenance | 223 (42.7%) | 299 (57.3%) |
| Personal Care & Service | 248 (42.2%) | 339 (57.8%) |
| Total (Category) | 1,145 (48.0%) | 1,242 (52.0%) |
| Total (Overall) | 11,400 (55.2%) | 9,248 (44.8%) |
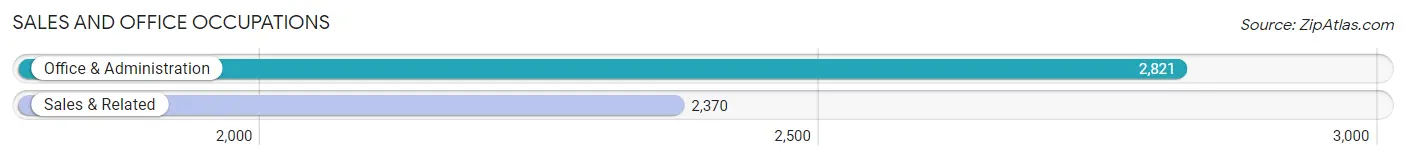
Sales and Office Occupations
The most common Sales and Office occupations in Winter Springs are Office & Administration (2,821 | 13.7%), and Sales & Related (2,370 | 11.5%).
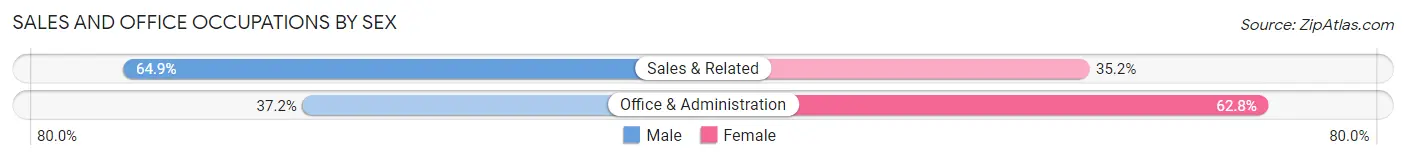
Sales and Office Occupations by Sex
| Occupation | Male | Female |
| Sales & Related | 1,537 (64.8%) | 833 (35.1%) |
| Office & Administration | 1,050 (37.2%) | 1,771 (62.8%) |
| Total (Category) | 2,587 (49.8%) | 2,604 (50.2%) |
| Total (Overall) | 11,400 (55.2%) | 9,248 (44.8%) |
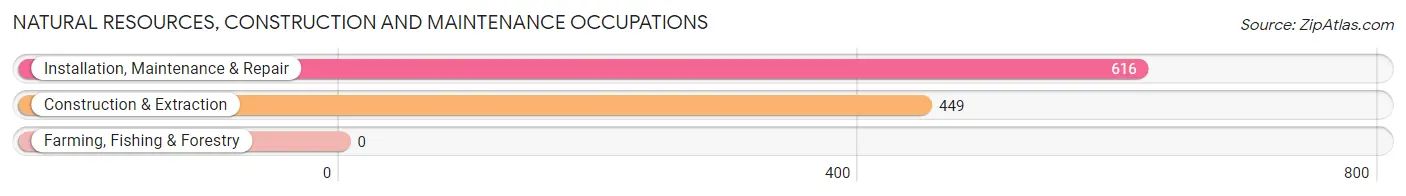
Natural Resources, Construction and Maintenance Occupations
The most common Natural Resources, Construction and Maintenance occupations in Winter Springs are Installation, Maintenance & Repair (616 | 3.0%), and Construction & Extraction (449 | 2.2%).
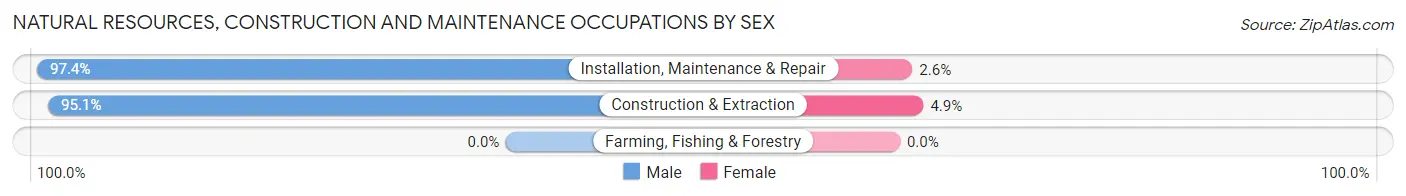
Natural Resources, Construction and Maintenance Occupations by Sex
| Occupation | Male | Female |
| Farming, Fishing & Forestry | 0 (0.0%) | 0 (0.0%) |
| Construction & Extraction | 427 (95.1%) | 22 (4.9%) |
| Installation, Maintenance & Repair | 600 (97.4%) | 16 (2.6%) |
| Total (Category) | 1,027 (96.4%) | 38 (3.6%) |
| Total (Overall) | 11,400 (55.2%) | 9,248 (44.8%) |
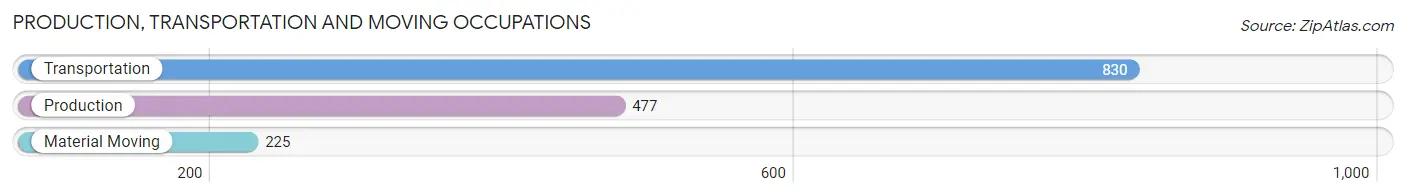
Production, Transportation and Moving Occupations
The most common Production, Transportation and Moving occupations in Winter Springs are Transportation (830 | 4.0%), Production (477 | 2.3%), and Material Moving (225 | 1.1%).
Production, Transportation and Moving Occupations by Sex
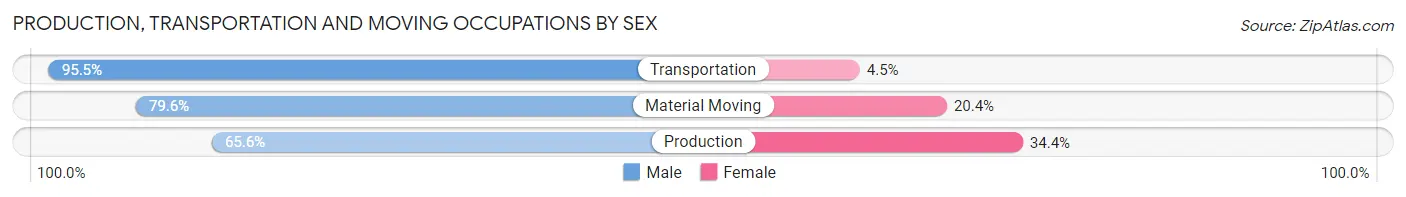
| Occupation | Male | Female |
| Production | 313 (65.6%) | 164 (34.4%) |
| Transportation | 793 (95.5%) | 37 (4.5%) |
| Material Moving | 179 (79.6%) | 46 (20.4%) |
| Total (Category) | 1,285 (83.9%) | 247 (16.1%) |
| Total (Overall) | 11,400 (55.2%) | 9,248 (44.8%) |
Employment Industries by Sex in Winter Springs
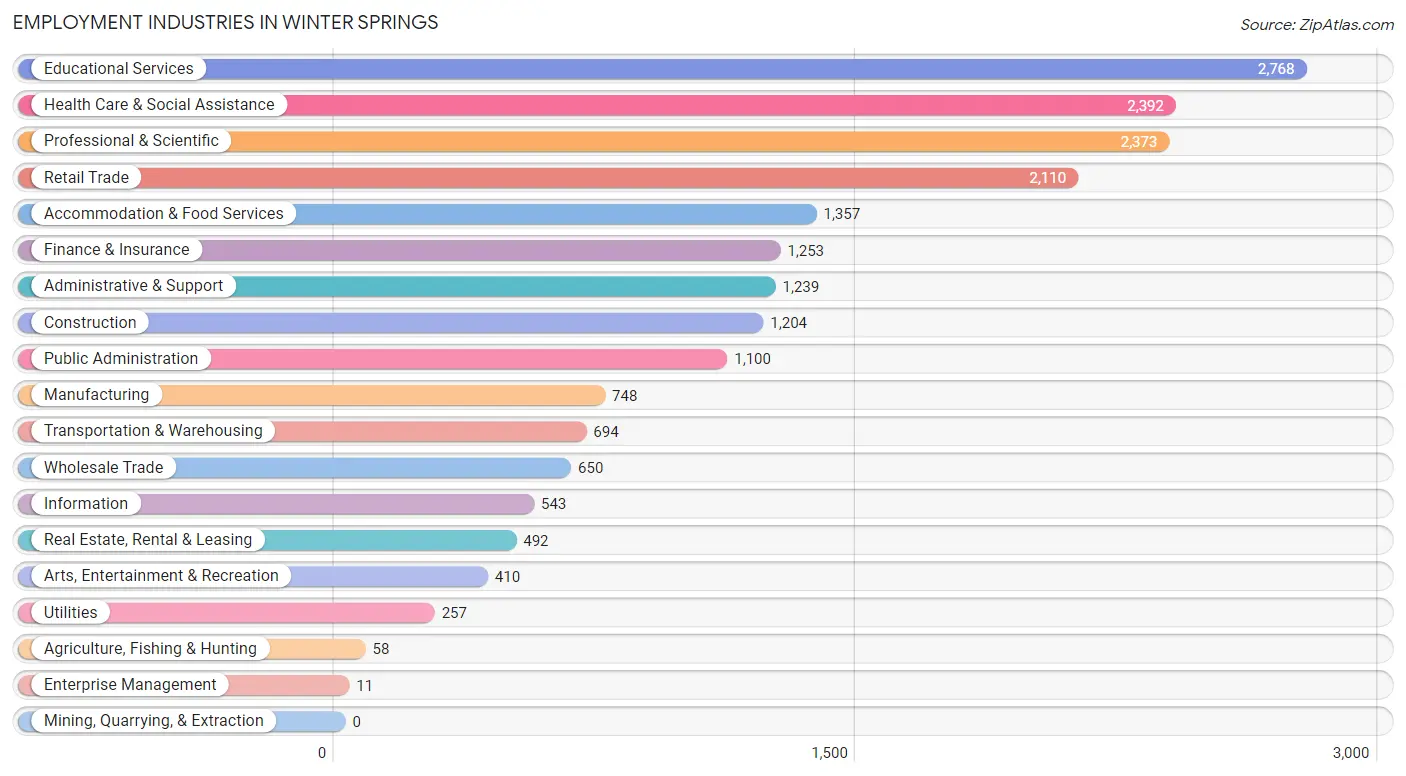
Employment Industries in Winter Springs
The major employment industries in Winter Springs include Educational Services (2,768 | 13.4%), Health Care & Social Assistance (2,392 | 11.6%), Professional & Scientific (2,373 | 11.5%), Retail Trade (2,110 | 10.2%), and Accommodation & Food Services (1,357 | 6.6%).
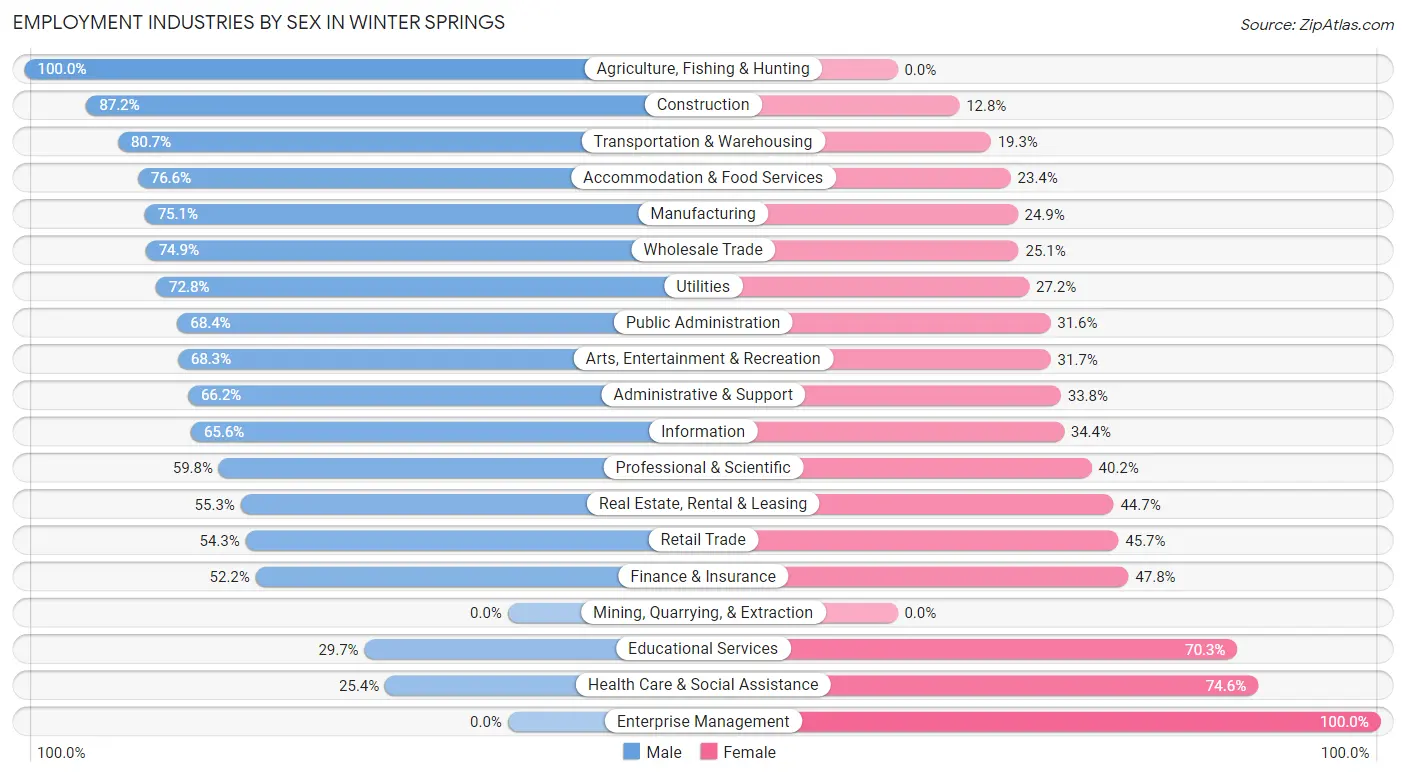
Employment Industries by Sex in Winter Springs
The Winter Springs industries that see more men than women are Agriculture, Fishing & Hunting (100.0%), Construction (87.2%), and Transportation & Warehousing (80.7%), whereas the industries that tend to have a higher number of women are Enterprise Management (100.0%), Health Care & Social Assistance (74.6%), and Educational Services (70.3%).
| Industry | Male | Female |
| Agriculture, Fishing & Hunting | 58 (100.0%) | 0 (0.0%) |
| Mining, Quarrying, & Extraction | 0 (0.0%) | 0 (0.0%) |
| Construction | 1,050 (87.2%) | 154 (12.8%) |
| Manufacturing | 562 (75.1%) | 186 (24.9%) |
| Wholesale Trade | 487 (74.9%) | 163 (25.1%) |
| Retail Trade | 1,145 (54.3%) | 965 (45.7%) |
| Transportation & Warehousing | 560 (80.7%) | 134 (19.3%) |
| Utilities | 187 (72.8%) | 70 (27.2%) |
| Information | 356 (65.6%) | 187 (34.4%) |
| Finance & Insurance | 654 (52.2%) | 599 (47.8%) |
| Real Estate, Rental & Leasing | 272 (55.3%) | 220 (44.7%) |
| Professional & Scientific | 1,419 (59.8%) | 954 (40.2%) |
| Enterprise Management | 0 (0.0%) | 11 (100.0%) |
| Administrative & Support | 820 (66.2%) | 419 (33.8%) |
| Educational Services | 821 (29.7%) | 1,947 (70.3%) |
| Health Care & Social Assistance | 607 (25.4%) | 1,785 (74.6%) |
| Arts, Entertainment & Recreation | 280 (68.3%) | 130 (31.7%) |
| Accommodation & Food Services | 1,039 (76.6%) | 318 (23.4%) |
| Public Administration | 752 (68.4%) | 348 (31.6%) |
| Total | 11,400 (55.2%) | 9,248 (44.8%) |
Education in Winter Springs
School Enrollment in Winter Springs
The most common levels of schooling among the 8,507 students in Winter Springs are high school (1,739 | 20.4%), college / undergraduate (1,691 | 19.9%), and middle school (1,650 | 19.4%).
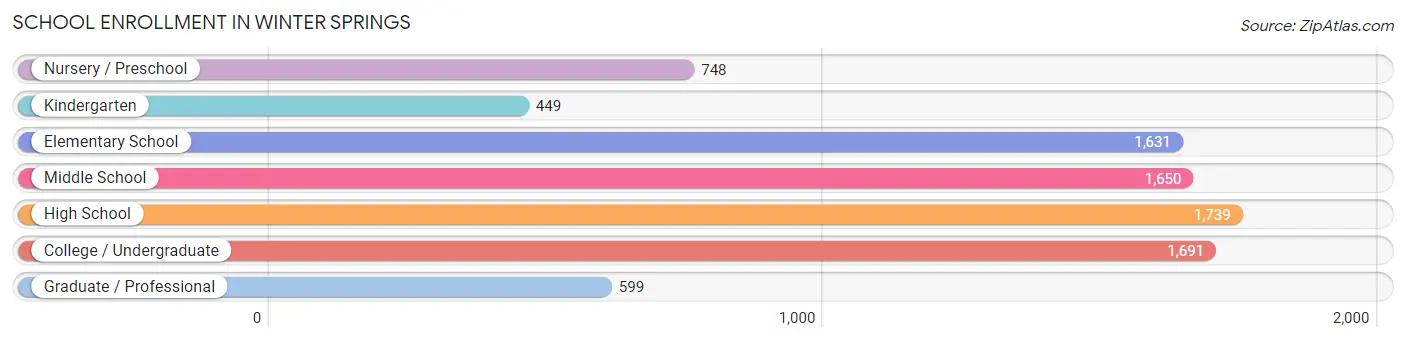
| School Level | # Students | % Students |
| Nursery / Preschool | 748 | 8.8% |
| Kindergarten | 449 | 5.3% |
| Elementary School | 1,631 | 19.2% |
| Middle School | 1,650 | 19.4% |
| High School | 1,739 | 20.4% |
| College / Undergraduate | 1,691 | 19.9% |
| Graduate / Professional | 599 | 7.0% |
| Total | 8,507 | 100.0% |
School Enrollment by Age by Funding Source in Winter Springs
Out of a total of 8,507 students who are enrolled in schools in Winter Springs, 1,718 (20.2%) attend a private institution, while the remaining 6,789 (79.8%) are enrolled in public schools. The age group of 3 to 4 year olds has the highest likelihood of being enrolled in private schools, with 267 (49.9% in the age bracket) enrolled. Conversely, the age group of 15 to 17 year olds has the lowest likelihood of being enrolled in a private school, with 1,120 (91.0% in the age bracket) attending a public institution.
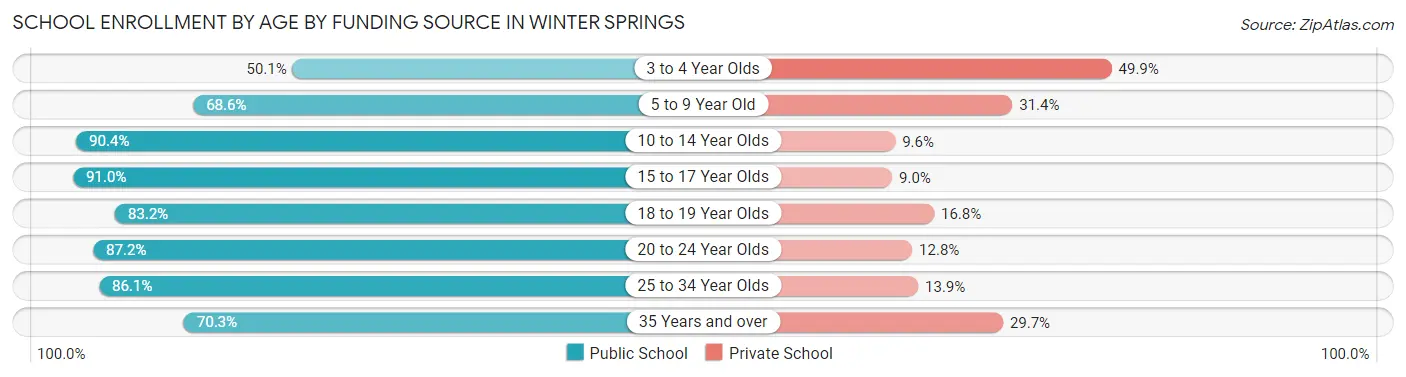
| Age Bracket | Public School | Private School |
| 3 to 4 Year Olds | 268 (50.1%) | 267 (49.9%) |
| 5 to 9 Year Old | 1,461 (68.6%) | 669 (31.4%) |
| 10 to 14 Year Olds | 1,818 (90.4%) | 193 (9.6%) |
| 15 to 17 Year Olds | 1,120 (91.0%) | 111 (9.0%) |
| 18 to 19 Year Olds | 430 (83.2%) | 87 (16.8%) |
| 20 to 24 Year Olds | 704 (87.2%) | 103 (12.8%) |
| 25 to 34 Year Olds | 472 (86.1%) | 76 (13.9%) |
| 35 Years and over | 512 (70.3%) | 216 (29.7%) |
| Total | 6,789 (79.8%) | 1,718 (20.2%) |
Educational Attainment by Field of Study in Winter Springs
Business (3,414 | 23.4%), education (1,850 | 12.7%), science & technology (1,324 | 9.1%), engineering (1,193 | 8.2%), and arts & humanities (1,100 | 7.5%) are the most common fields of study among 14,608 individuals in Winter Springs who have obtained a bachelor's degree or higher.
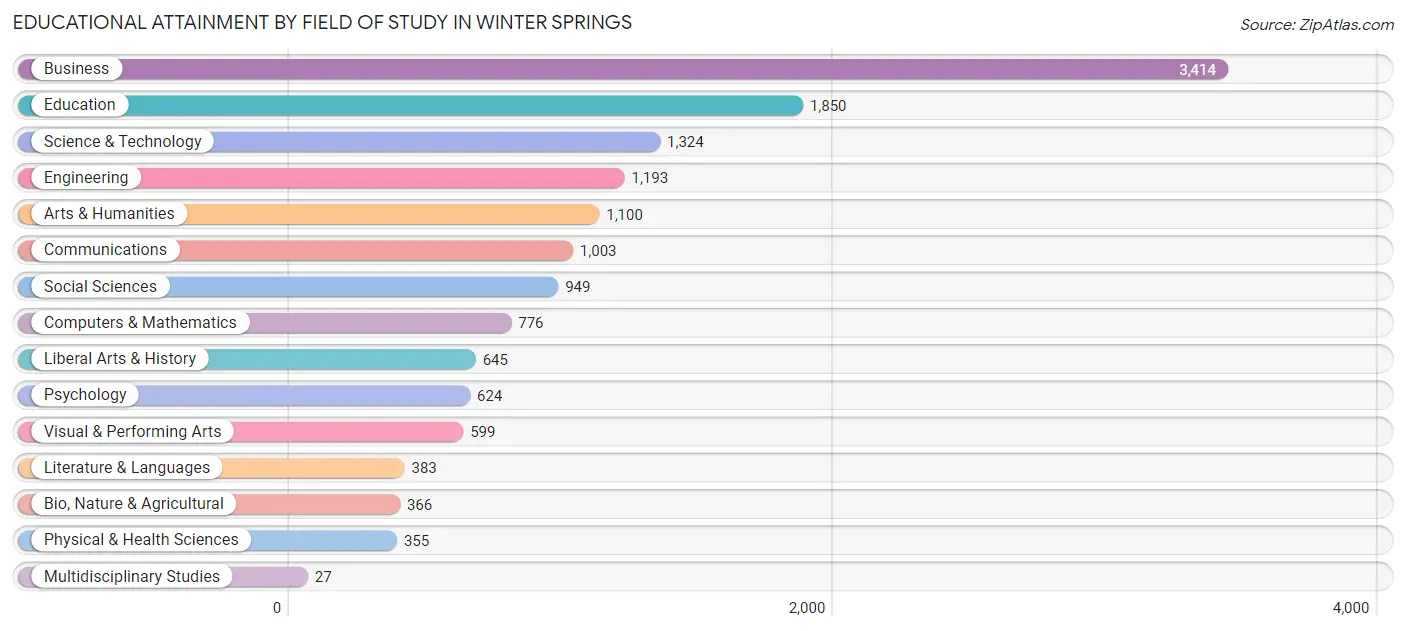
| Field of Study | # Graduates | % Graduates |
| Computers & Mathematics | 776 | 5.3% |
| Bio, Nature & Agricultural | 366 | 2.5% |
| Physical & Health Sciences | 355 | 2.4% |
| Psychology | 624 | 4.3% |
| Social Sciences | 949 | 6.5% |
| Engineering | 1,193 | 8.2% |
| Multidisciplinary Studies | 27 | 0.2% |
| Science & Technology | 1,324 | 9.1% |
| Business | 3,414 | 23.4% |
| Education | 1,850 | 12.7% |
| Literature & Languages | 383 | 2.6% |
| Liberal Arts & History | 645 | 4.4% |
| Visual & Performing Arts | 599 | 4.1% |
| Communications | 1,003 | 6.9% |
| Arts & Humanities | 1,100 | 7.5% |
| Total | 14,608 | 100.0% |
Transportation & Commute in Winter Springs
Vehicle Availability by Sex in Winter Springs
The most prevalent vehicle ownership categories in Winter Springs are males with 2 vehicles (5,375, accounting for 47.8%) and females with 2 vehicles (4,403, making up 60.7%).
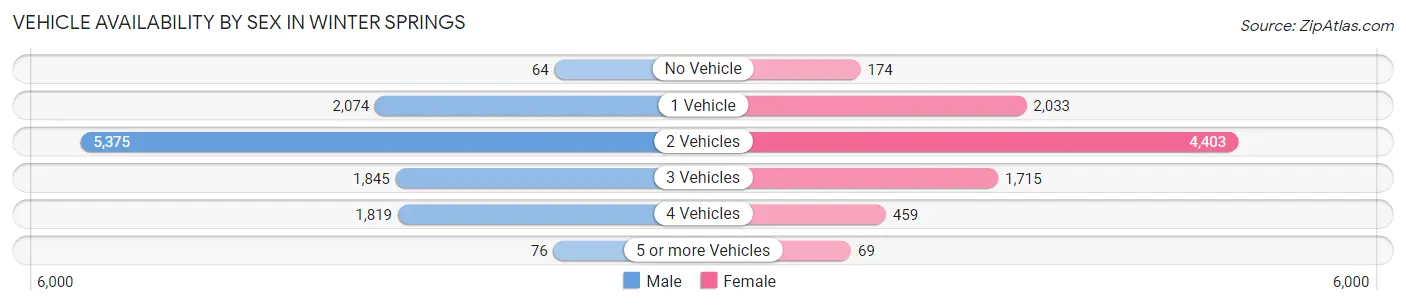
| Vehicles Available | Male | Female |
| No Vehicle | 64 (0.6%) | 174 (2.0%) |
| 1 Vehicle | 2,074 (18.4%) | 2,033 (23.0%) |
| 2 Vehicles | 5,375 (47.8%) | 4,403 (49.7%) |
| 3 Vehicles | 1,845 (16.4%) | 1,715 (19.4%) |
| 4 Vehicles | 1,819 (16.2%) | 459 (5.2%) |
| 5 or more Vehicles | 76 (0.7%) | 69 (0.8%) |
| Total | 11,253 (100.0%) | 8,853 (100.0%) |
Commute Time in Winter Springs
The most frequently occuring commute durations in Winter Springs are 30 to 34 minutes (2,965 commuters, 17.6%), 20 to 24 minutes (2,376 commuters, 14.1%), and 15 to 19 minutes (2,275 commuters, 13.5%).
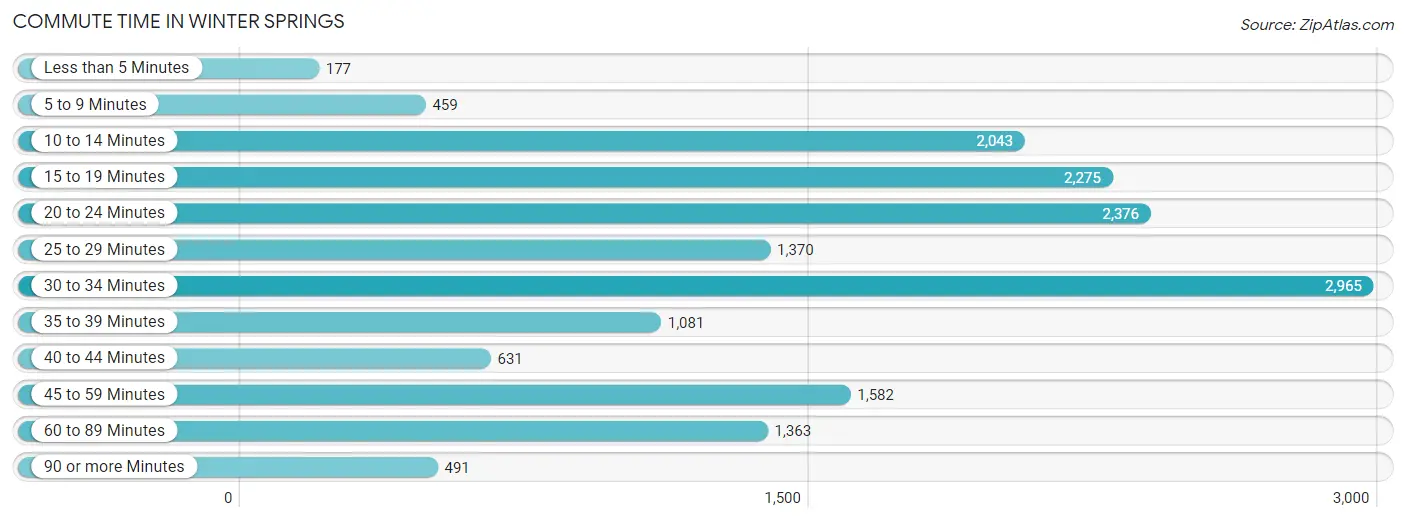
| Commute Time | # Commuters | % Commuters |
| Less than 5 Minutes | 177 | 1.1% |
| 5 to 9 Minutes | 459 | 2.7% |
| 10 to 14 Minutes | 2,043 | 12.1% |
| 15 to 19 Minutes | 2,275 | 13.5% |
| 20 to 24 Minutes | 2,376 | 14.1% |
| 25 to 29 Minutes | 1,370 | 8.2% |
| 30 to 34 Minutes | 2,965 | 17.6% |
| 35 to 39 Minutes | 1,081 | 6.4% |
| 40 to 44 Minutes | 631 | 3.7% |
| 45 to 59 Minutes | 1,582 | 9.4% |
| 60 to 89 Minutes | 1,363 | 8.1% |
| 90 or more Minutes | 491 | 2.9% |
Commute Time by Sex in Winter Springs
The most common commute times in Winter Springs are 30 to 34 minutes (1,408 commuters, 14.9%) for males and 30 to 34 minutes (1,557 commuters, 21.2%) for females.
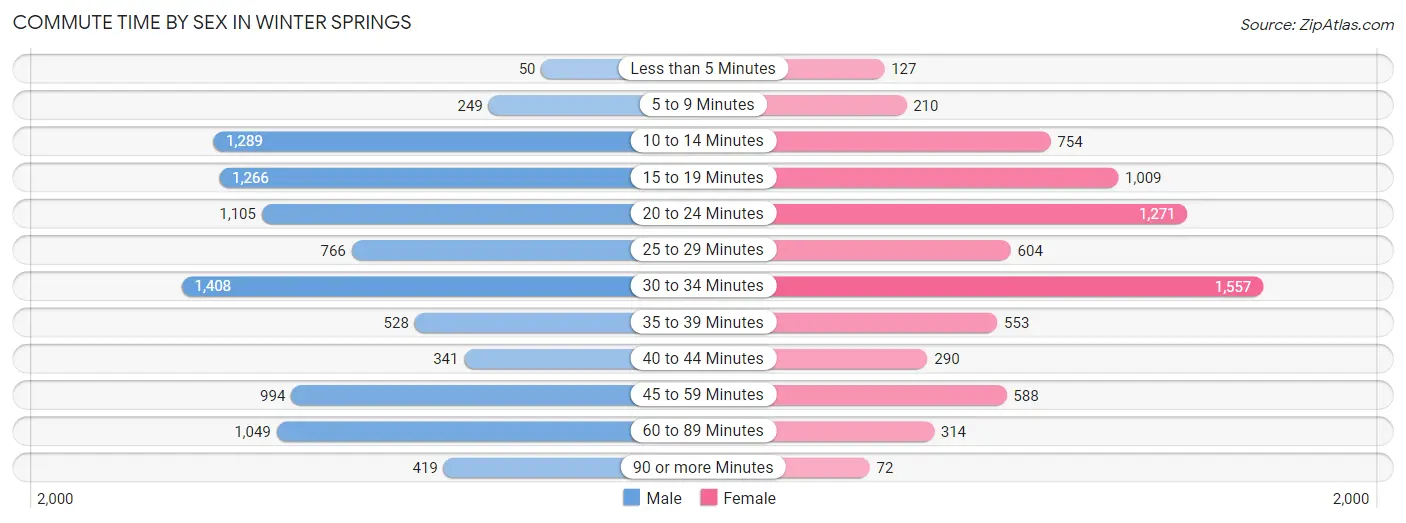
| Commute Time | Male | Female |
| Less than 5 Minutes | 50 (0.5%) | 127 (1.7%) |
| 5 to 9 Minutes | 249 (2.6%) | 210 (2.9%) |
| 10 to 14 Minutes | 1,289 (13.6%) | 754 (10.3%) |
| 15 to 19 Minutes | 1,266 (13.4%) | 1,009 (13.7%) |
| 20 to 24 Minutes | 1,105 (11.7%) | 1,271 (17.3%) |
| 25 to 29 Minutes | 766 (8.1%) | 604 (8.2%) |
| 30 to 34 Minutes | 1,408 (14.9%) | 1,557 (21.2%) |
| 35 to 39 Minutes | 528 (5.6%) | 553 (7.5%) |
| 40 to 44 Minutes | 341 (3.6%) | 290 (4.0%) |
| 45 to 59 Minutes | 994 (10.5%) | 588 (8.0%) |
| 60 to 89 Minutes | 1,049 (11.1%) | 314 (4.3%) |
| 90 or more Minutes | 419 (4.4%) | 72 (1.0%) |
Time of Departure to Work by Sex in Winter Springs
The most frequent times of departure to work in Winter Springs are 8:00 AM to 8:29 AM (1,375, 14.5%) for males and 7:00 AM to 7:29 AM (1,078, 14.7%) for females.
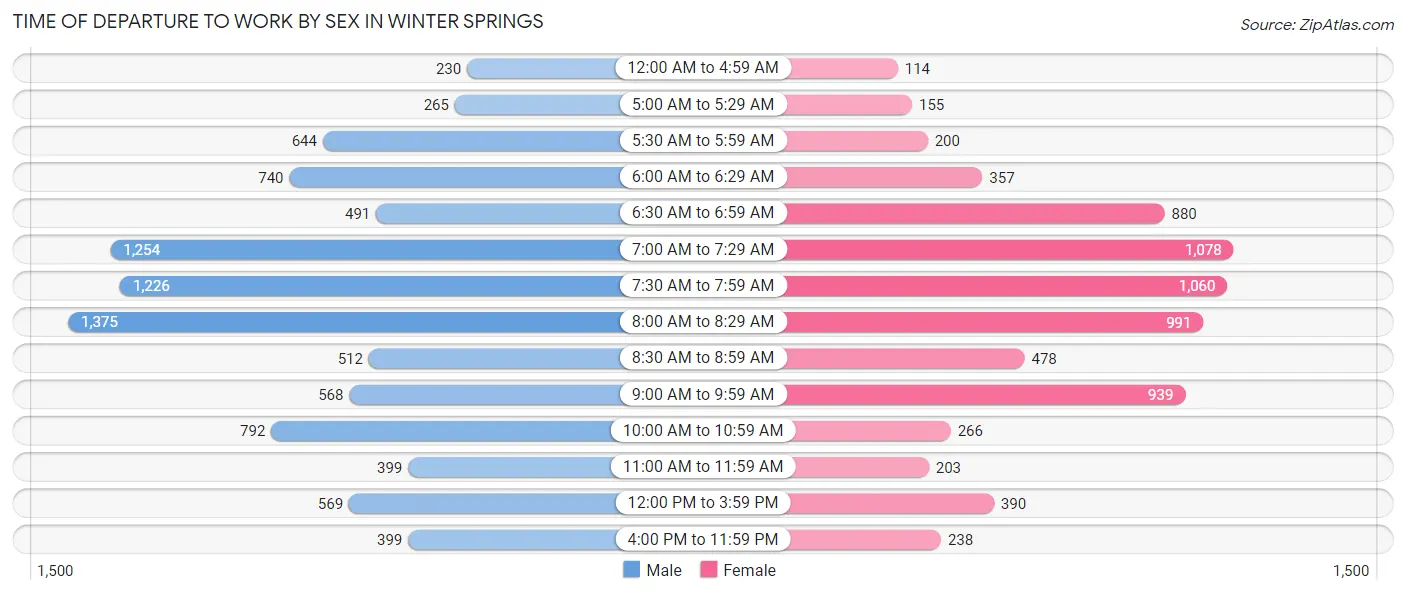
| Time of Departure | Male | Female |
| 12:00 AM to 4:59 AM | 230 (2.4%) | 114 (1.5%) |
| 5:00 AM to 5:29 AM | 265 (2.8%) | 155 (2.1%) |
| 5:30 AM to 5:59 AM | 644 (6.8%) | 200 (2.7%) |
| 6:00 AM to 6:29 AM | 740 (7.8%) | 357 (4.9%) |
| 6:30 AM to 6:59 AM | 491 (5.2%) | 880 (12.0%) |
| 7:00 AM to 7:29 AM | 1,254 (13.3%) | 1,078 (14.7%) |
| 7:30 AM to 7:59 AM | 1,226 (13.0%) | 1,060 (14.4%) |
| 8:00 AM to 8:29 AM | 1,375 (14.5%) | 991 (13.5%) |
| 8:30 AM to 8:59 AM | 512 (5.4%) | 478 (6.5%) |
| 9:00 AM to 9:59 AM | 568 (6.0%) | 939 (12.8%) |
| 10:00 AM to 10:59 AM | 792 (8.4%) | 266 (3.6%) |
| 11:00 AM to 11:59 AM | 399 (4.2%) | 203 (2.8%) |
| 12:00 PM to 3:59 PM | 569 (6.0%) | 390 (5.3%) |
| 4:00 PM to 11:59 PM | 399 (4.2%) | 238 (3.2%) |
| Total | 9,464 (100.0%) | 7,349 (100.0%) |
Housing Occupancy in Winter Springs
Occupancy by Ownership in Winter Springs
Of the total 15,925 dwellings in Winter Springs, owner-occupied units account for 11,774 (73.9%), while renter-occupied units make up 4,151 (26.1%).
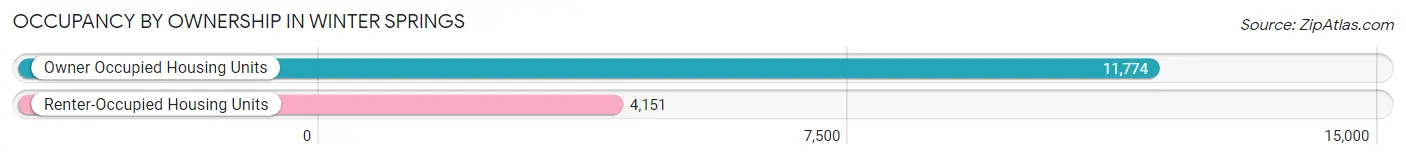
| Occupancy | # Housing Units | % Housing Units |
| Owner Occupied Housing Units | 11,774 | 73.9% |
| Renter-Occupied Housing Units | 4,151 | 26.1% |
| Total Occupied Housing Units | 15,925 | 100.0% |
Occupancy by Household Size in Winter Springs
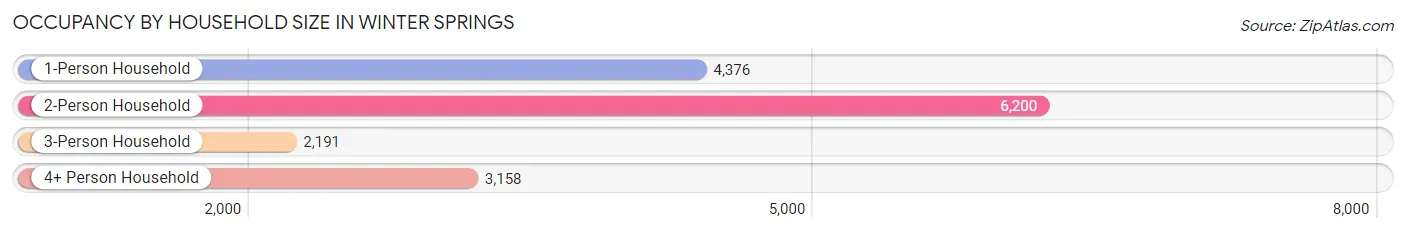
| Household Size | # Housing Units | % Housing Units |
| 1-Person Household | 4,376 | 27.5% |
| 2-Person Household | 6,200 | 38.9% |
| 3-Person Household | 2,191 | 13.8% |
| 4+ Person Household | 3,158 | 19.8% |
| Total Housing Units | 15,925 | 100.0% |
Occupancy by Ownership by Household Size in Winter Springs
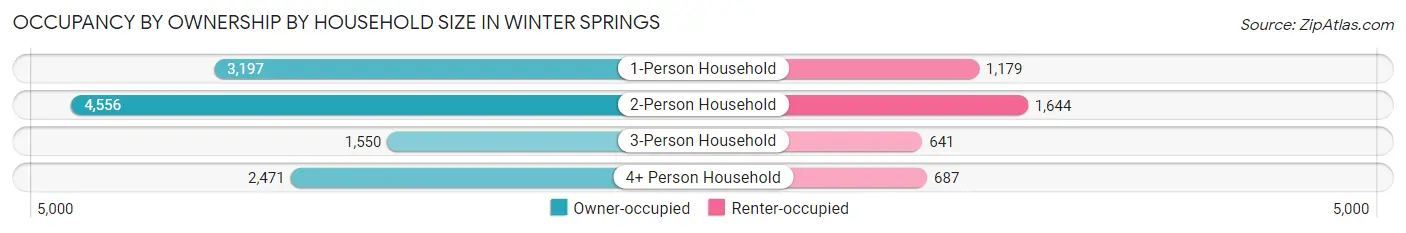
| Household Size | Owner-occupied | Renter-occupied |
| 1-Person Household | 3,197 (73.1%) | 1,179 (26.9%) |
| 2-Person Household | 4,556 (73.5%) | 1,644 (26.5%) |
| 3-Person Household | 1,550 (70.7%) | 641 (29.3%) |
| 4+ Person Household | 2,471 (78.2%) | 687 (21.7%) |
| Total Housing Units | 11,774 (73.9%) | 4,151 (26.1%) |
Occupancy by Educational Attainment in Winter Springs
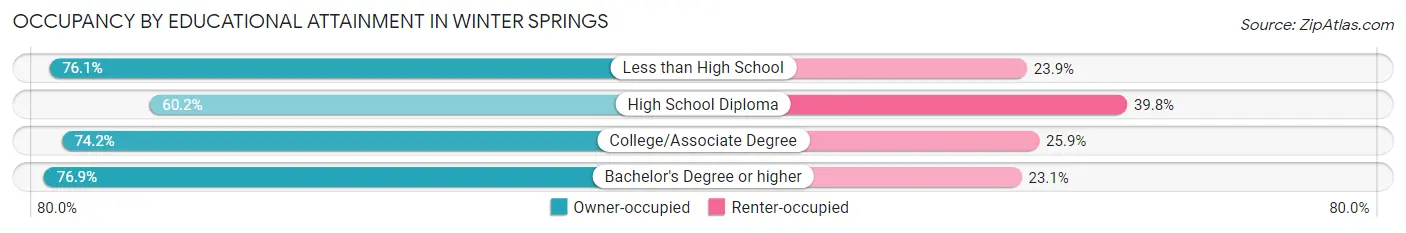
| Household Size | Owner-occupied | Renter-occupied |
| Less than High School | 417 (76.1%) | 131 (23.9%) |
| High School Diploma | 1,184 (60.2%) | 782 (39.8%) |
| College/Associate Degree | 3,872 (74.2%) | 1,350 (25.9%) |
| Bachelor's Degree or higher | 6,301 (76.9%) | 1,888 (23.1%) |
Occupancy by Age of Householder in Winter Springs
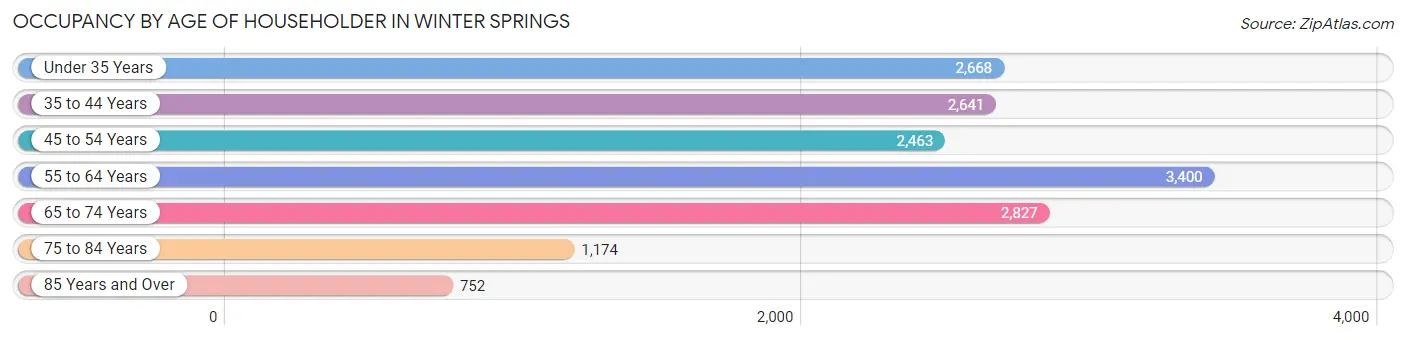
| Age Bracket | # Households | % Households |
| Under 35 Years | 2,668 | 16.8% |
| 35 to 44 Years | 2,641 | 16.6% |
| 45 to 54 Years | 2,463 | 15.5% |
| 55 to 64 Years | 3,400 | 21.3% |
| 65 to 74 Years | 2,827 | 17.7% |
| 75 to 84 Years | 1,174 | 7.4% |
| 85 Years and Over | 752 | 4.7% |
| Total | 15,925 | 100.0% |
Housing Finances in Winter Springs
Median Income by Occupancy in Winter Springs
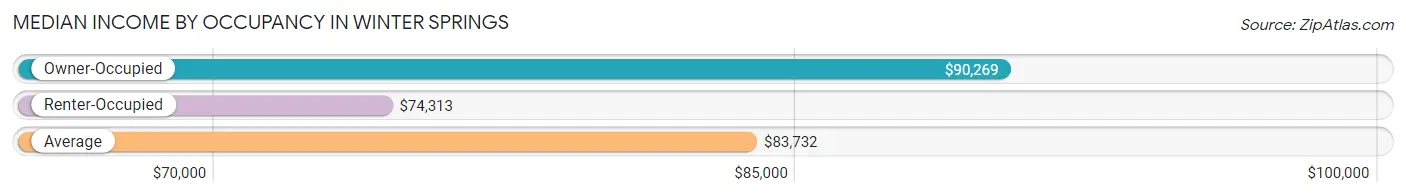
| Occupancy Type | # Households | Median Income |
| Owner-Occupied | 11,774 (73.9%) | $90,269 |
| Renter-Occupied | 4,151 (26.1%) | $74,313 |
| Average | 15,925 (100.0%) | $83,732 |
Occupancy by Householder Income Bracket in Winter Springs
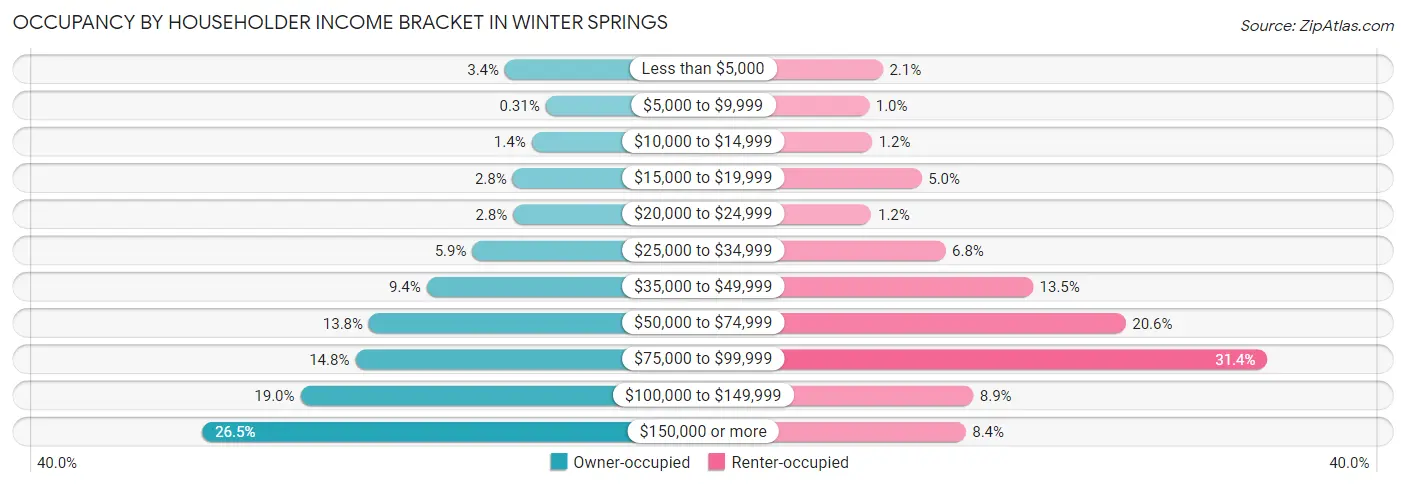
| Income Bracket | Owner-occupied | Renter-occupied |
| Less than $5,000 | 402 (3.4%) | 85 (2.1%) |
| $5,000 to $9,999 | 37 (0.3%) | 42 (1.0%) |
| $10,000 to $14,999 | 163 (1.4%) | 51 (1.2%) |
| $15,000 to $19,999 | 332 (2.8%) | 208 (5.0%) |
| $20,000 to $24,999 | 327 (2.8%) | 49 (1.2%) |
| $25,000 to $34,999 | 693 (5.9%) | 283 (6.8%) |
| $35,000 to $49,999 | 1,103 (9.4%) | 560 (13.5%) |
| $50,000 to $74,999 | 1,621 (13.8%) | 853 (20.5%) |
| $75,000 to $99,999 | 1,744 (14.8%) | 1,302 (31.4%) |
| $100,000 to $149,999 | 2,236 (19.0%) | 371 (8.9%) |
| $150,000 or more | 3,116 (26.5%) | 347 (8.4%) |
| Total | 11,774 (100.0%) | 4,151 (100.0%) |
Monthly Housing Cost Tiers in Winter Springs
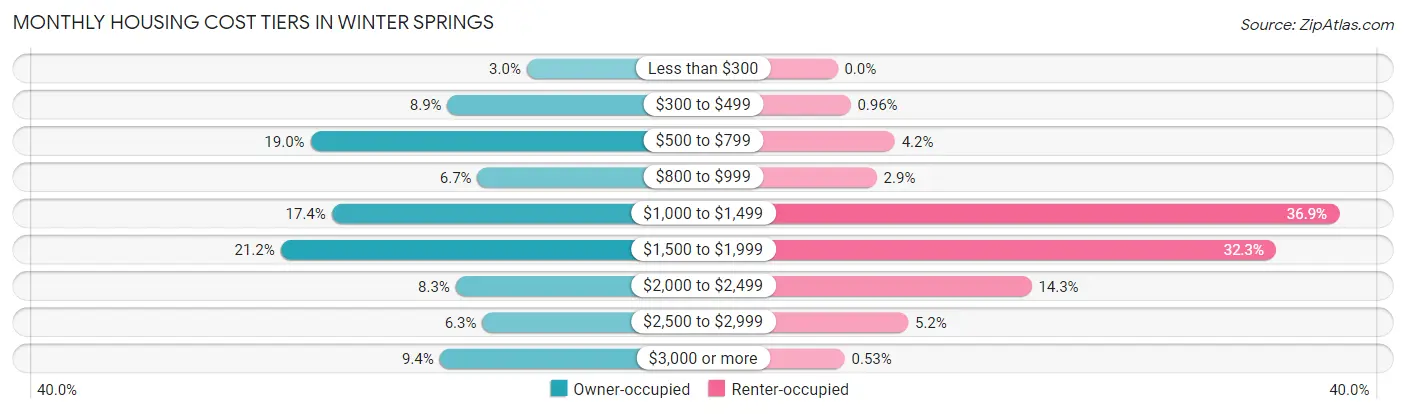
| Monthly Cost | Owner-occupied | Renter-occupied |
| Less than $300 | 356 (3.0%) | 0 (0.0%) |
| $300 to $499 | 1,043 (8.9%) | 40 (1.0%) |
| $500 to $799 | 2,231 (19.0%) | 175 (4.2%) |
| $800 to $999 | 783 (6.7%) | 120 (2.9%) |
| $1,000 to $1,499 | 2,048 (17.4%) | 1,533 (36.9%) |
| $1,500 to $1,999 | 2,490 (21.1%) | 1,340 (32.3%) |
| $2,000 to $2,499 | 971 (8.3%) | 593 (14.3%) |
| $2,500 to $2,999 | 740 (6.3%) | 216 (5.2%) |
| $3,000 or more | 1,112 (9.4%) | 22 (0.5%) |
| Total | 11,774 (100.0%) | 4,151 (100.0%) |
Physical Housing Characteristics in Winter Springs
Housing Structures in Winter Springs
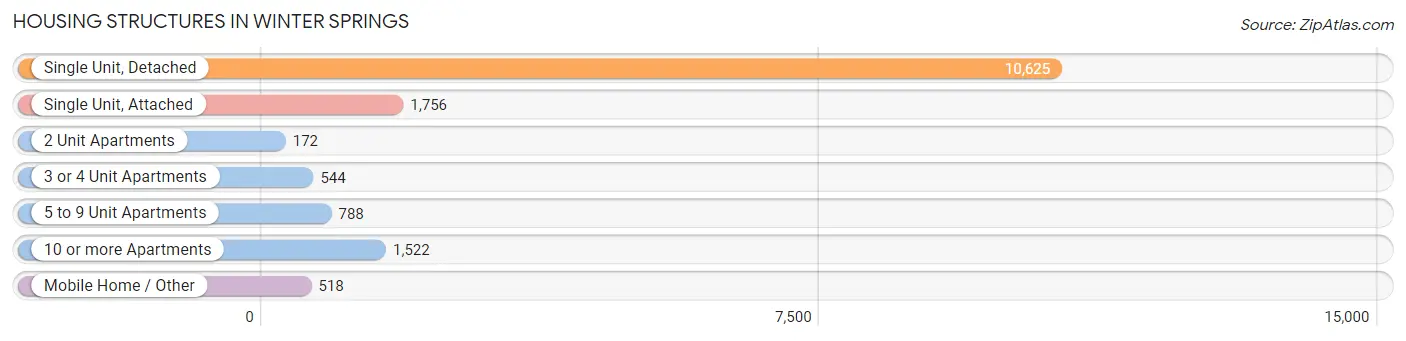
| Structure Type | # Housing Units | % Housing Units |
| Single Unit, Detached | 10,625 | 66.7% |
| Single Unit, Attached | 1,756 | 11.0% |
| 2 Unit Apartments | 172 | 1.1% |
| 3 or 4 Unit Apartments | 544 | 3.4% |
| 5 to 9 Unit Apartments | 788 | 5.0% |
| 10 or more Apartments | 1,522 | 9.6% |
| Mobile Home / Other | 518 | 3.3% |
| Total | 15,925 | 100.0% |
Housing Structures by Occupancy in Winter Springs
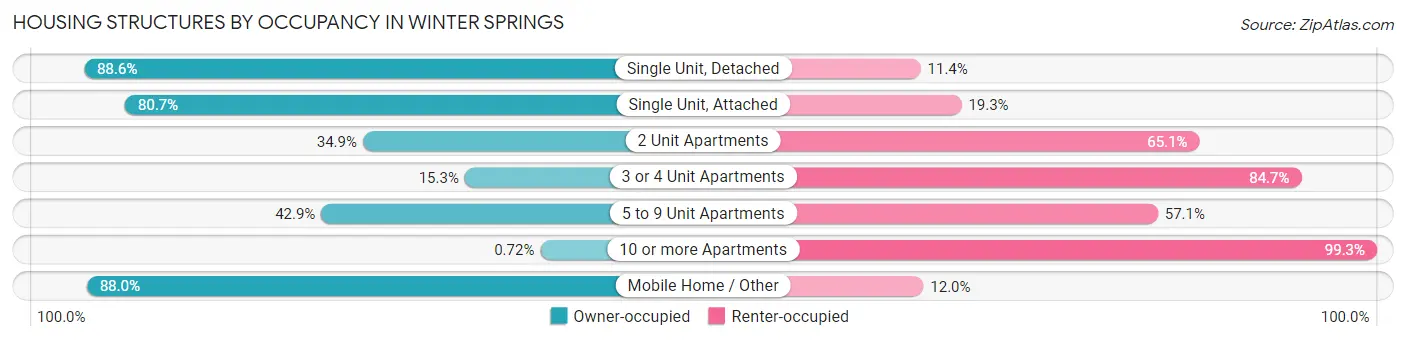
| Structure Type | Owner-occupied | Renter-occupied |
| Single Unit, Detached | 9,409 (88.6%) | 1,216 (11.4%) |
| Single Unit, Attached | 1,417 (80.7%) | 339 (19.3%) |
| 2 Unit Apartments | 60 (34.9%) | 112 (65.1%) |
| 3 or 4 Unit Apartments | 83 (15.3%) | 461 (84.7%) |
| 5 to 9 Unit Apartments | 338 (42.9%) | 450 (57.1%) |
| 10 or more Apartments | 11 (0.7%) | 1,511 (99.3%) |
| Mobile Home / Other | 456 (88.0%) | 62 (12.0%) |
| Total | 11,774 (73.9%) | 4,151 (26.1%) |
Housing Structures by Number of Rooms in Winter Springs
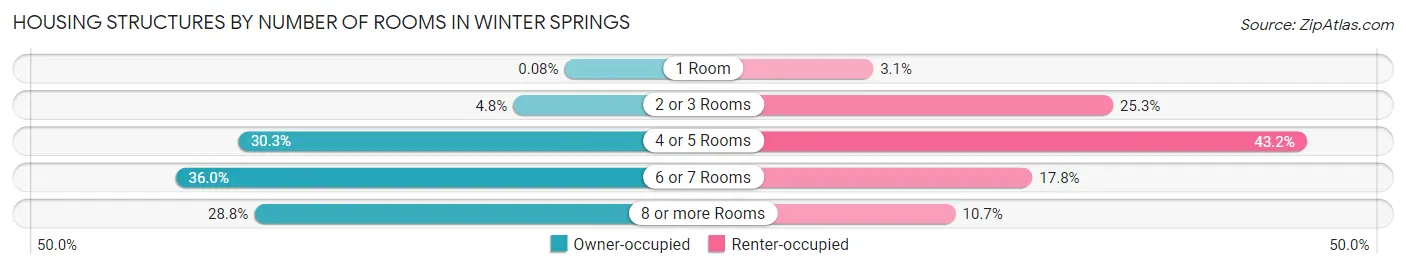
| Number of Rooms | Owner-occupied | Renter-occupied |
| 1 Room | 9 (0.1%) | 128 (3.1%) |
| 2 or 3 Rooms | 567 (4.8%) | 1,049 (25.3%) |
| 4 or 5 Rooms | 3,566 (30.3%) | 1,791 (43.1%) |
| 6 or 7 Rooms | 4,243 (36.0%) | 739 (17.8%) |
| 8 or more Rooms | 3,389 (28.8%) | 444 (10.7%) |
| Total | 11,774 (100.0%) | 4,151 (100.0%) |
Housing Structure by Heating Type in Winter Springs
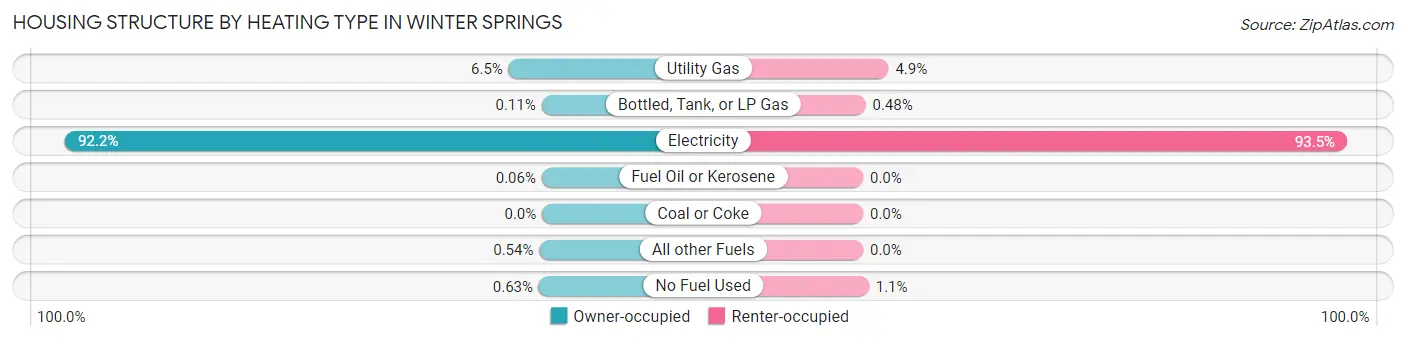
| Heating Type | Owner-occupied | Renter-occupied |
| Utility Gas | 761 (6.5%) | 204 (4.9%) |
| Bottled, Tank, or LP Gas | 13 (0.1%) | 20 (0.5%) |
| Electricity | 10,855 (92.2%) | 3,881 (93.5%) |
| Fuel Oil or Kerosene | 7 (0.1%) | 0 (0.0%) |
| Coal or Coke | 0 (0.0%) | 0 (0.0%) |
| All other Fuels | 64 (0.5%) | 0 (0.0%) |
| No Fuel Used | 74 (0.6%) | 46 (1.1%) |
| Total | 11,774 (100.0%) | 4,151 (100.0%) |
Household Vehicle Usage in Winter Springs
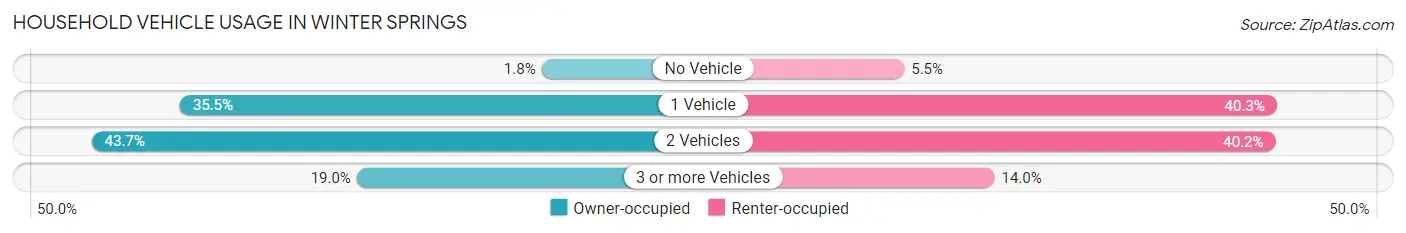
| Vehicles per Household | Owner-occupied | Renter-occupied |
| No Vehicle | 206 (1.8%) | 230 (5.5%) |
| 1 Vehicle | 4,181 (35.5%) | 1,673 (40.3%) |
| 2 Vehicles | 5,150 (43.7%) | 1,668 (40.2%) |
| 3 or more Vehicles | 2,237 (19.0%) | 580 (14.0%) |
| Total | 11,774 (100.0%) | 4,151 (100.0%) |
Real Estate & Mortgages in Winter Springs
Real Estate and Mortgage Overview in Winter Springs
| Characteristic | Without Mortgage | With Mortgage |
| Housing Units | 3,913 | 7,861 |
| Median Property Value | $293,500 | $328,300 |
| Median Household Income | $78,458 | $2,327 |
| Monthly Housing Costs | $587 | $1,112 |
| Real Estate Taxes | $2,331 | $318 |
Property Value by Mortgage Status in Winter Springs
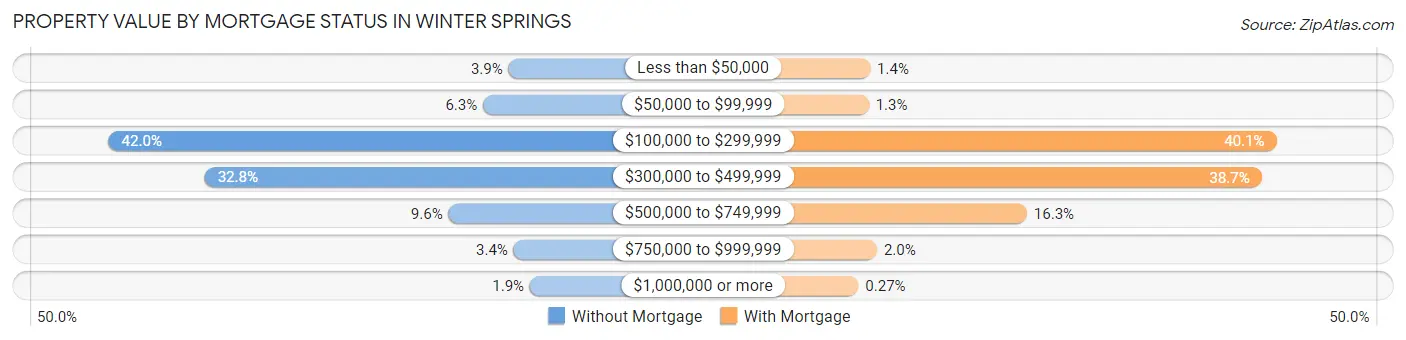
| Property Value | Without Mortgage | With Mortgage |
| Less than $50,000 | 153 (3.9%) | 109 (1.4%) |
| $50,000 to $99,999 | 248 (6.3%) | 98 (1.3%) |
| $100,000 to $299,999 | 1,643 (42.0%) | 3,151 (40.1%) |
| $300,000 to $499,999 | 1,285 (32.8%) | 3,039 (38.7%) |
| $500,000 to $749,999 | 377 (9.6%) | 1,283 (16.3%) |
| $750,000 to $999,999 | 134 (3.4%) | 160 (2.0%) |
| $1,000,000 or more | 73 (1.9%) | 21 (0.3%) |
| Total | 3,913 (100.0%) | 7,861 (100.0%) |
Household Income by Mortgage Status in Winter Springs
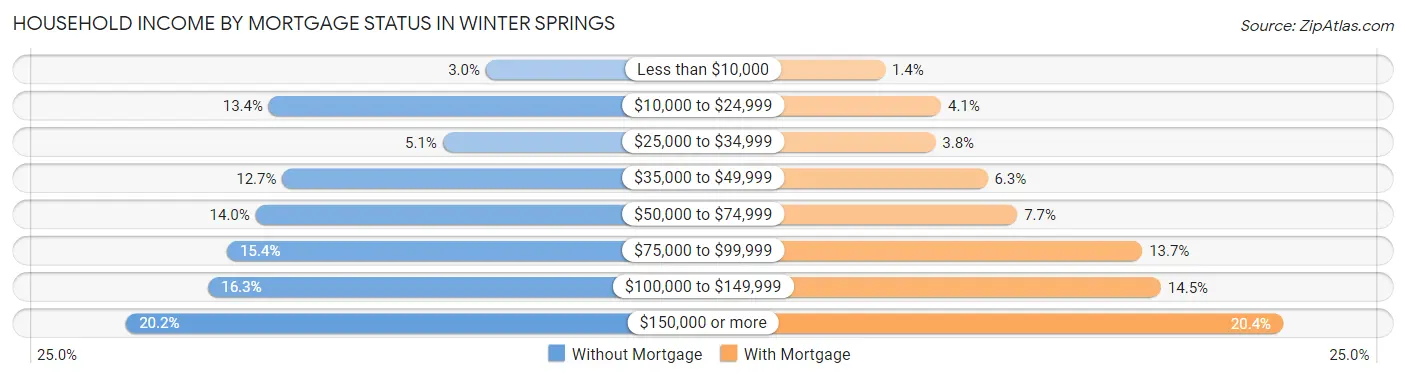
| Household Income | Without Mortgage | With Mortgage |
| Less than $10,000 | 119 (3.0%) | 110 (1.4%) |
| $10,000 to $24,999 | 523 (13.4%) | 320 (4.1%) |
| $25,000 to $34,999 | 199 (5.1%) | 299 (3.8%) |
| $35,000 to $49,999 | 498 (12.7%) | 494 (6.3%) |
| $50,000 to $74,999 | 548 (14.0%) | 605 (7.7%) |
| $75,000 to $99,999 | 601 (15.4%) | 1,073 (13.7%) |
| $100,000 to $149,999 | 636 (16.3%) | 1,143 (14.5%) |
| $150,000 or more | 789 (20.2%) | 1,600 (20.3%) |
| Total | 3,913 (100.0%) | 7,861 (100.0%) |
Property Value to Household Income Ratio in Winter Springs
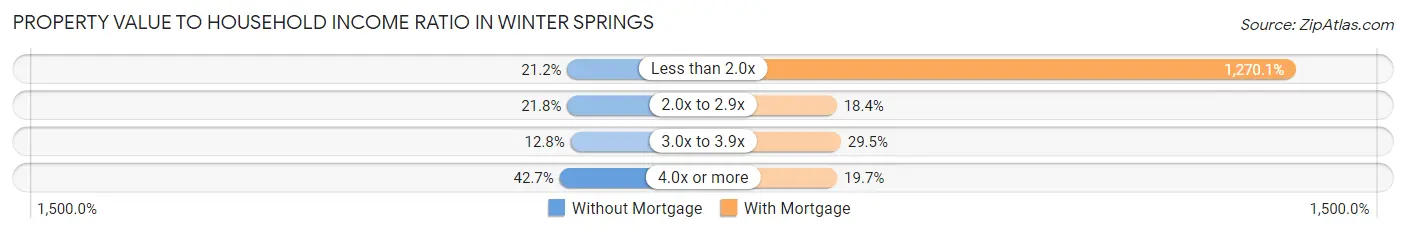
| Value-to-Income Ratio | Without Mortgage | With Mortgage |
| Less than 2.0x | 831 (21.2%) | 99,841 (1,270.1%) |
| 2.0x to 2.9x | 852 (21.8%) | 1,449 (18.4%) |
| 3.0x to 3.9x | 501 (12.8%) | 2,322 (29.5%) |
| 4.0x or more | 1,670 (42.7%) | 1,545 (19.7%) |
| Total | 3,913 (100.0%) | 7,861 (100.0%) |
Real Estate Taxes by Mortgage Status in Winter Springs
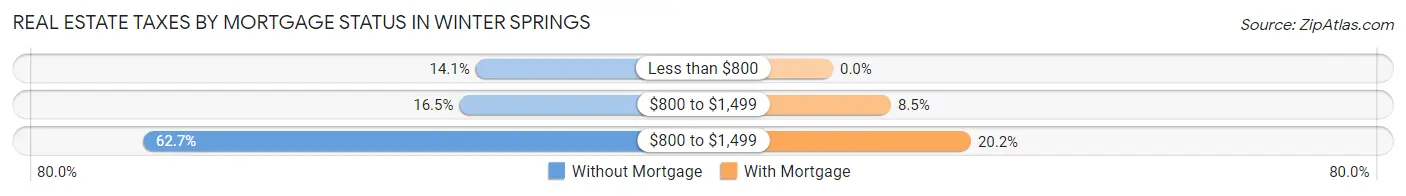
| Property Taxes | Without Mortgage | With Mortgage |
| Less than $800 | 552 (14.1%) | 0 (0.0%) |
| $800 to $1,499 | 645 (16.5%) | 665 (8.5%) |
| $800 to $1,499 | 2,454 (62.7%) | 1,584 (20.2%) |
| Total | 3,913 (100.0%) | 7,861 (100.0%) |
Health & Disability in Winter Springs
Health Insurance Coverage by Age in Winter Springs
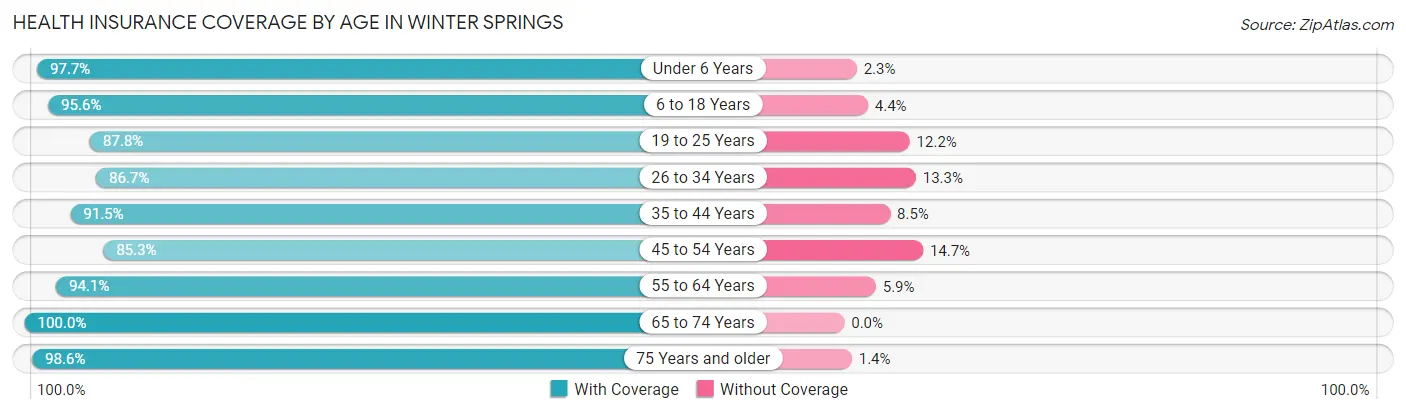
| Age Bracket | With Coverage | Without Coverage |
| Under 6 Years | 1,819 (97.7%) | 43 (2.3%) |
| 6 to 18 Years | 5,332 (95.6%) | 245 (4.4%) |
| 19 to 25 Years | 2,478 (87.8%) | 344 (12.2%) |
| 26 to 34 Years | 3,829 (86.7%) | 589 (13.3%) |
| 35 to 44 Years | 4,795 (91.5%) | 448 (8.5%) |
| 45 to 54 Years | 4,082 (85.3%) | 702 (14.7%) |
| 55 to 64 Years | 5,279 (94.1%) | 329 (5.9%) |
| 65 to 74 Years | 4,552 (100.0%) | 0 (0.0%) |
| 75 Years and older | 3,229 (98.6%) | 46 (1.4%) |
| Total | 35,395 (92.8%) | 2,746 (7.2%) |
Health Insurance Coverage by Citizenship Status in Winter Springs
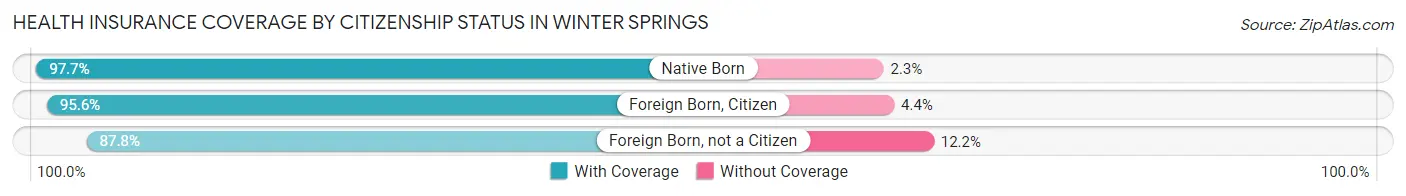
| Citizenship Status | With Coverage | Without Coverage |
| Native Born | 1,819 (97.7%) | 43 (2.3%) |
| Foreign Born, Citizen | 5,332 (95.6%) | 245 (4.4%) |
| Foreign Born, not a Citizen | 2,478 (87.8%) | 344 (12.2%) |
Health Insurance Coverage by Household Income in Winter Springs
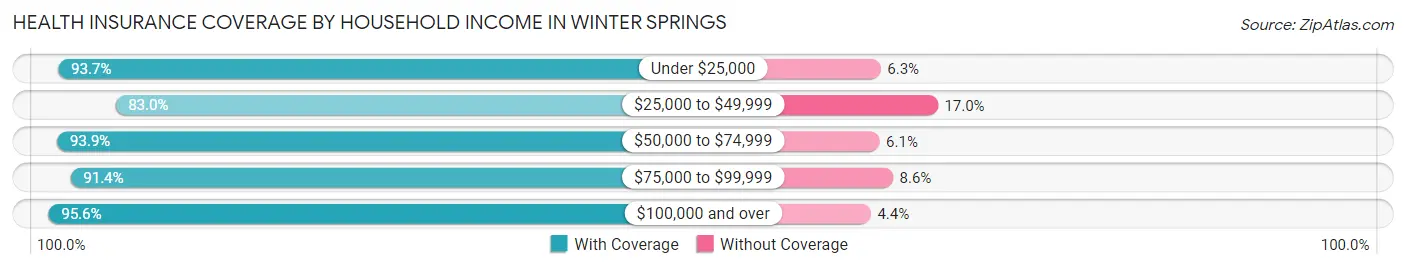
| Household Income | With Coverage | Without Coverage |
| Under $25,000 | 2,486 (93.7%) | 167 (6.3%) |
| $25,000 to $49,999 | 4,186 (83.0%) | 856 (17.0%) |
| $50,000 to $74,999 | 4,281 (93.9%) | 276 (6.1%) |
| $75,000 to $99,999 | 6,551 (91.4%) | 615 (8.6%) |
| $100,000 and over | 17,891 (95.6%) | 832 (4.4%) |
Public vs Private Health Insurance Coverage by Age in Winter Springs
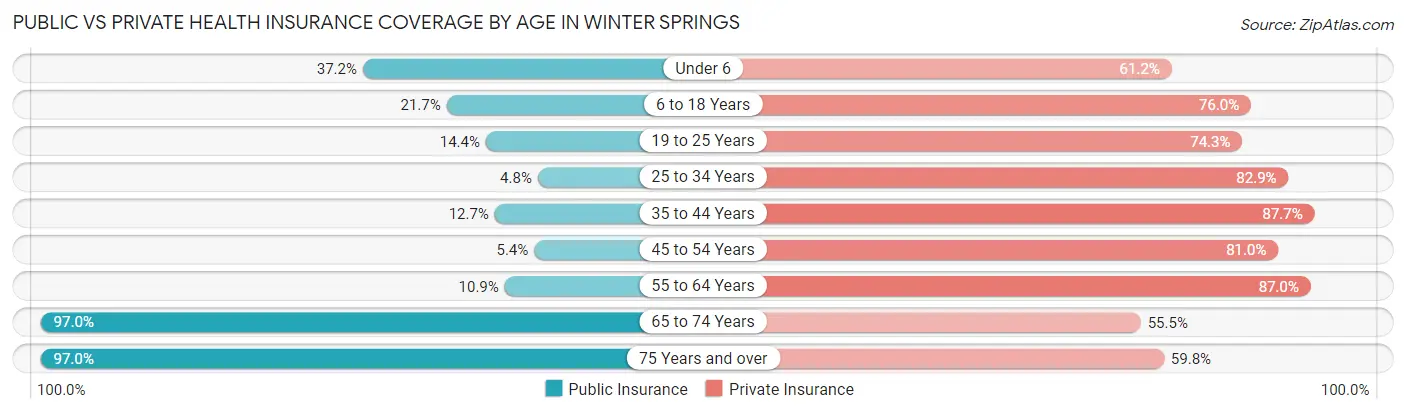
| Age Bracket | Public Insurance | Private Insurance |
| Under 6 | 693 (37.2%) | 1,140 (61.2%) |
| 6 to 18 Years | 1,209 (21.7%) | 4,237 (76.0%) |
| 19 to 25 Years | 406 (14.4%) | 2,098 (74.3%) |
| 25 to 34 Years | 210 (4.8%) | 3,662 (82.9%) |
| 35 to 44 Years | 668 (12.7%) | 4,600 (87.7%) |
| 45 to 54 Years | 260 (5.4%) | 3,875 (81.0%) |
| 55 to 64 Years | 611 (10.9%) | 4,881 (87.0%) |
| 65 to 74 Years | 4,416 (97.0%) | 2,526 (55.5%) |
| 75 Years and over | 3,178 (97.0%) | 1,958 (59.8%) |
| Total | 11,651 (30.5%) | 28,977 (76.0%) |
Disability Status by Sex by Age in Winter Springs
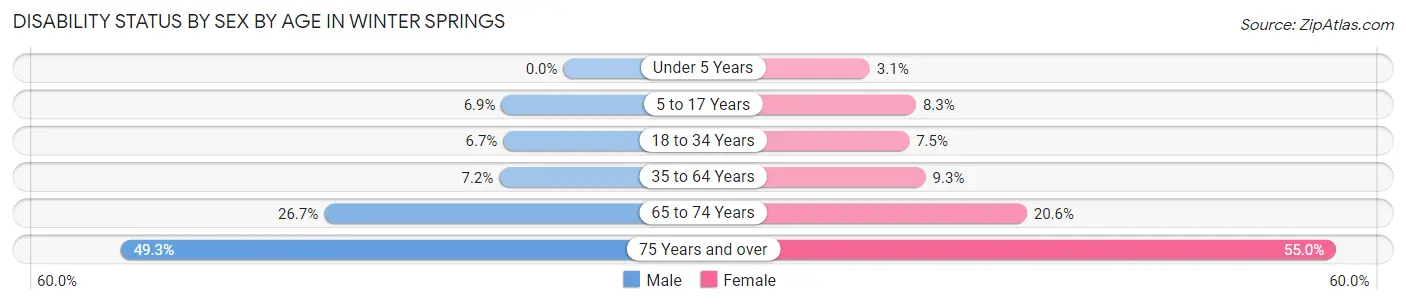
| Age Bracket | Male | Female |
| Under 5 Years | 0 (0.0%) | 28 (3.1%) |
| 5 to 17 Years | 180 (6.9%) | 248 (8.3%) |
| 18 to 34 Years | 290 (6.7%) | 246 (7.5%) |
| 35 to 64 Years | 557 (7.1%) | 733 (9.3%) |
| 65 to 74 Years | 570 (26.7%) | 497 (20.6%) |
| 75 Years and over | 734 (49.3%) | 983 (55.0%) |
Disability Class by Sex by Age in Winter Springs
Disability Class: Hearing Difficulty
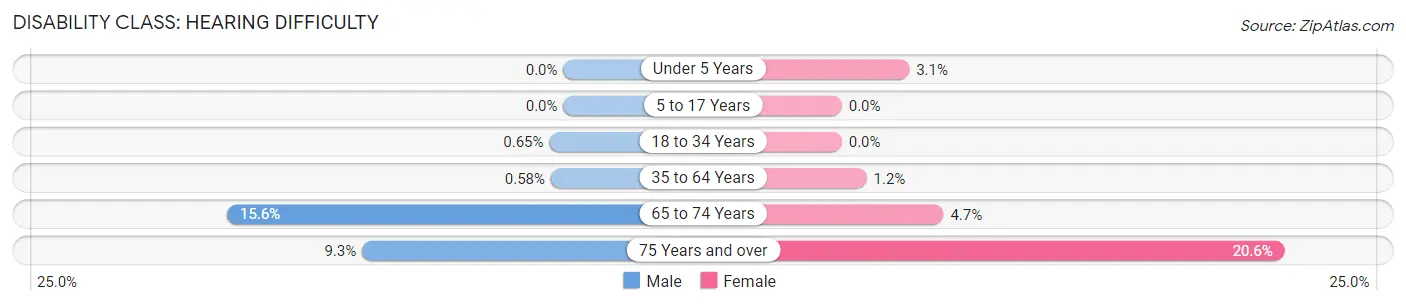
| Age Bracket | Male | Female |
| Under 5 Years | 0 (0.0%) | 28 (3.1%) |
| 5 to 17 Years | 0 (0.0%) | 0 (0.0%) |
| 18 to 34 Years | 28 (0.6%) | 0 (0.0%) |
| 35 to 64 Years | 45 (0.6%) | 90 (1.1%) |
| 65 to 74 Years | 334 (15.6%) | 114 (4.7%) |
| 75 Years and over | 139 (9.3%) | 367 (20.5%) |
Disability Class: Vision Difficulty
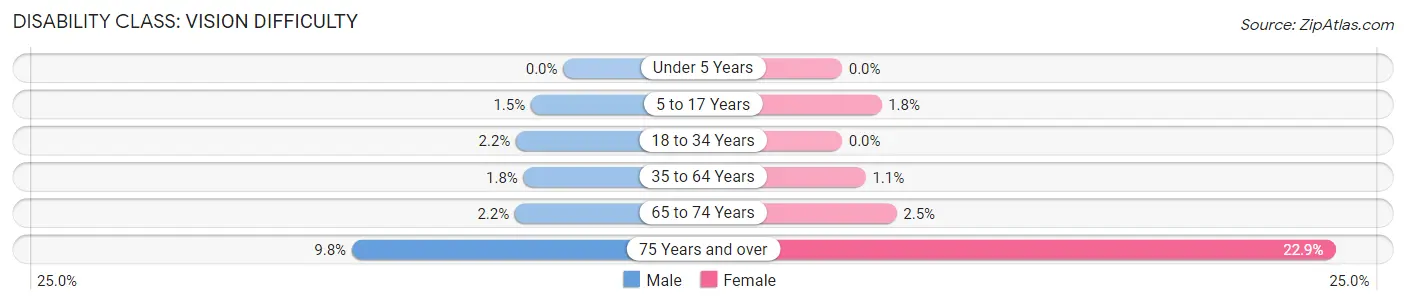
| Age Bracket | Male | Female |
| Under 5 Years | 0 (0.0%) | 0 (0.0%) |
| 5 to 17 Years | 39 (1.5%) | 55 (1.8%) |
| 18 to 34 Years | 95 (2.2%) | 0 (0.0%) |
| 35 to 64 Years | 143 (1.8%) | 86 (1.1%) |
| 65 to 74 Years | 48 (2.2%) | 61 (2.5%) |
| 75 Years and over | 146 (9.8%) | 409 (22.9%) |
Disability Class: Cognitive Difficulty
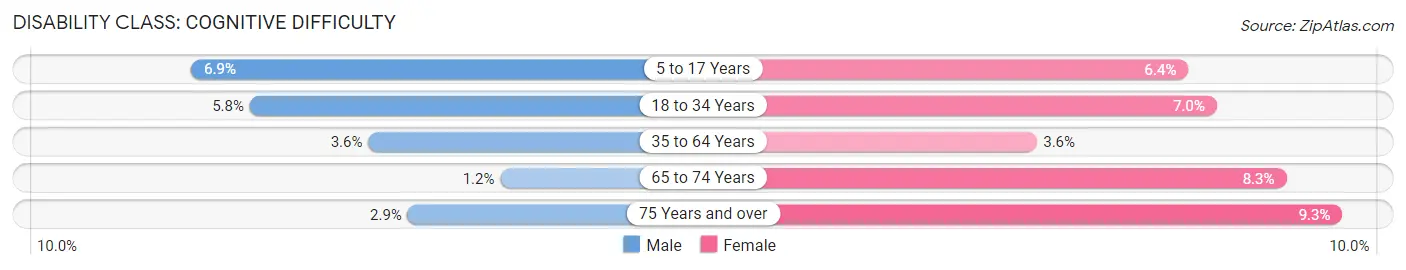
| Age Bracket | Male | Female |
| 5 to 17 Years | 180 (6.9%) | 193 (6.4%) |
| 18 to 34 Years | 252 (5.8%) | 228 (7.0%) |
| 35 to 64 Years | 282 (3.6%) | 283 (3.6%) |
| 65 to 74 Years | 25 (1.2%) | 199 (8.3%) |
| 75 Years and over | 43 (2.9%) | 166 (9.3%) |
Disability Class: Ambulatory Difficulty
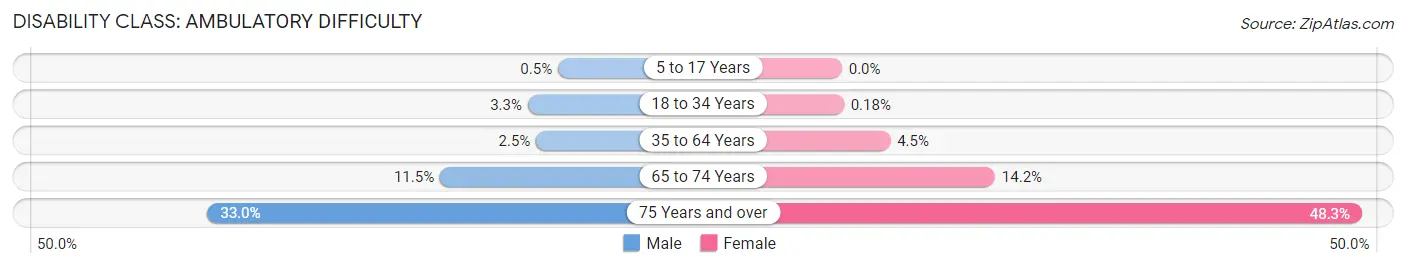
| Age Bracket | Male | Female |
| 5 to 17 Years | 13 (0.5%) | 0 (0.0%) |
| 18 to 34 Years | 143 (3.3%) | 6 (0.2%) |
| 35 to 64 Years | 196 (2.5%) | 352 (4.5%) |
| 65 to 74 Years | 245 (11.5%) | 343 (14.2%) |
| 75 Years and over | 492 (33.0%) | 862 (48.3%) |
Disability Class: Self-Care Difficulty
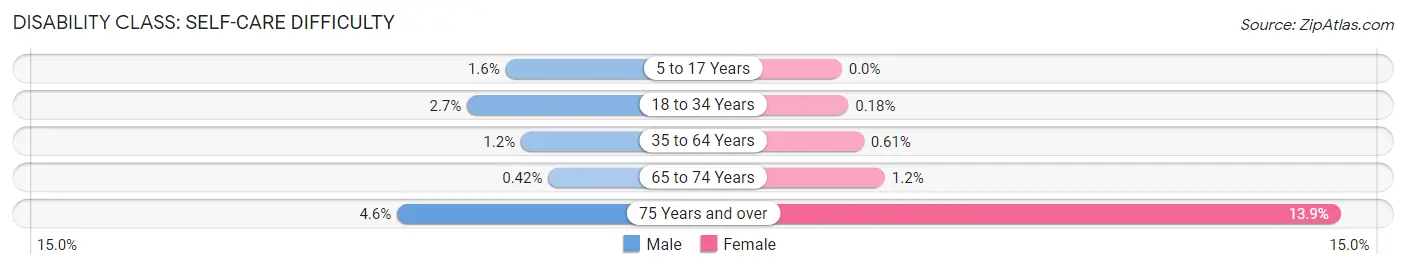
| Age Bracket | Male | Female |
| 5 to 17 Years | 42 (1.6%) | 0 (0.0%) |
| 18 to 34 Years | 116 (2.7%) | 6 (0.2%) |
| 35 to 64 Years | 92 (1.2%) | 48 (0.6%) |
| 65 to 74 Years | 9 (0.4%) | 29 (1.2%) |
| 75 Years and over | 69 (4.6%) | 248 (13.9%) |
Technology Access in Winter Springs
Computing Device Access in Winter Springs
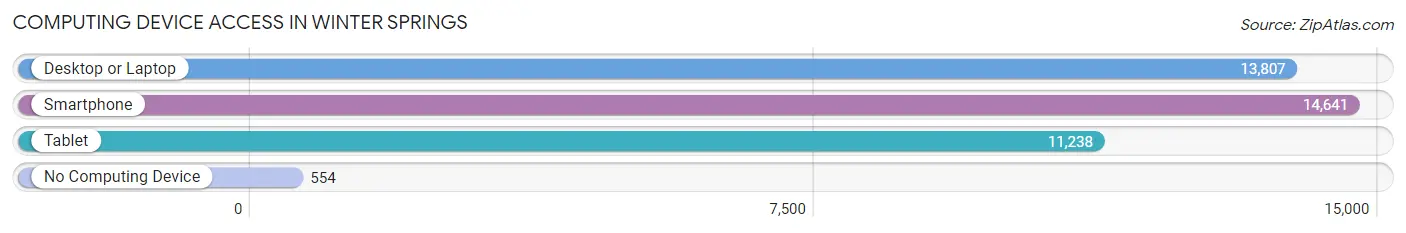
| Device Type | # Households | % Households |
| Desktop or Laptop | 13,807 | 86.7% |
| Smartphone | 14,641 | 91.9% |
| Tablet | 11,238 | 70.6% |
| No Computing Device | 554 | 3.5% |
| Total | 15,925 | 100.0% |
Internet Access in Winter Springs
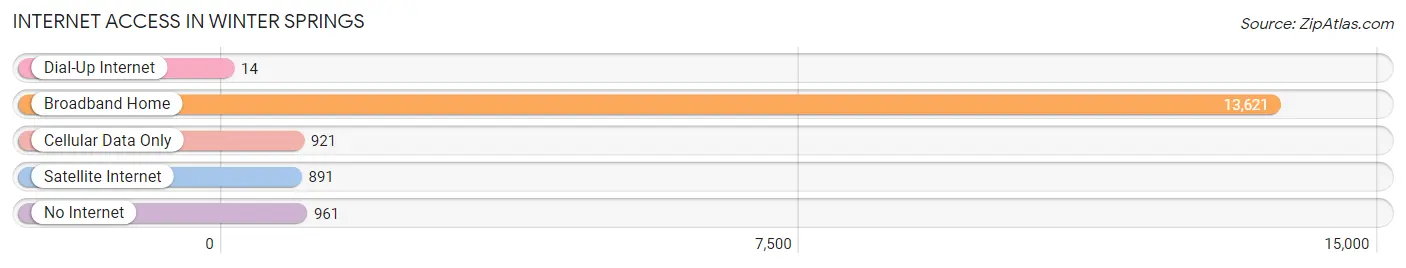
| Internet Type | # Households | % Households |
| Dial-Up Internet | 14 | 0.1% |
| Broadband Home | 13,621 | 85.5% |
| Cellular Data Only | 921 | 5.8% |
| Satellite Internet | 891 | 5.6% |
| No Internet | 961 | 6.0% |
| Total | 15,925 | 100.0% |
Winter Springs Summary
History
Winter Springs, Florida is a city located in Seminole County, Florida. It is part of the Orlando-Kissimmee-Sanford Metropolitan Statistical Area. The city was founded in 1959 and incorporated in 1963. It was originally known as North Orlando, but the name was changed to Winter Springs in 1975.
The area that is now Winter Springs was originally inhabited by the Timucua Indians. The first European settlers arrived in the area in the late 1800s. The area was mostly rural until the 1950s, when the population began to grow rapidly. The city was officially incorporated in 1963 and the population continued to grow throughout the 1960s and 1970s.
The city has experienced significant growth in recent years, with the population increasing from just over 10,000 in 2000 to over 33,000 in 2020. The city has become a popular destination for families and retirees, and is home to several parks, golf courses, and other recreational facilities.
Geography
Winter Springs is located in central Florida, in Seminole County. It is situated about 20 miles north of Orlando and about 40 miles east of Tampa. The city covers an area of approximately 16 square miles and is bordered by Oviedo to the north, Casselberry to the east, Longwood to the south, and Sanford to the west.
The city is located in a flat, low-lying area, with an elevation of just over 100 feet above sea level. The terrain is mostly flat, with some rolling hills in the northern part of the city. The city is located in a humid subtropical climate zone, with hot, humid summers and mild winters.
Economy
Winter Springs is a rapidly growing city, with a strong economy. The city is home to several large employers, including the University of Central Florida, AdventHealth, and Lockheed Martin. The city also has a thriving tourism industry, with several popular attractions, such as the Central Florida Zoo and the Central Florida Railroad Museum.
The city has a strong retail sector, with several shopping centers and malls, including the Winter Springs Town Center and the Oviedo Mall. The city also has a vibrant arts and culture scene, with several galleries, museums, and theaters.
Demographics
As of the 2020 census, the population of Winter Springs was 33,541. The population is predominantly white (77.3%), with smaller percentages of African Americans (10.2%), Hispanics (7.2%), and Asians (3.2%). The median household income is $68,845, and the median home value is $239,400.
The city is home to several educational institutions, including the University of Central Florida, Seminole State College, and Rollins College. The city also has several public schools, including Winter Springs High School and Indian Trails Middle School.
Conclusion
Winter Springs, Florida is a rapidly growing city located in Seminole County. The city was founded in 1959 and has experienced significant growth in recent years. The city has a strong economy, with several large employers and a thriving tourism industry. The population is predominantly white, with smaller percentages of African Americans, Hispanics, and Asians. The city is home to several educational institutions and public schools, as well as several parks, golf courses, and other recreational facilities.
Common Questions
What is Per Capita Income in Winter Springs?
Per Capita income in Winter Springs is $44,712.
What is the Median Family Income in Winter Springs?
Median Family Income in Winter Springs is $98,972.
What is the Median Household income in Winter Springs?
Median Household Income in Winter Springs is $83,732.
What is Income or Wage Gap in Winter Springs?
Income or Wage Gap in Winter Springs is 14.1%.
Women in Winter Springs earn 85.9 cents for every dollar earned by a man.
What is Family Income Deficit in Winter Springs?
Family Income Deficit in Winter Springs is $9,160.
Families that are below poverty line in Winter Springs earn $9,160 less on average than the poverty threshold level.
What is Inequality or Gini Index in Winter Springs?
Inequality or Gini Index in Winter Springs is 0.42.
What is the Total Population of Winter Springs?
Total Population of Winter Springs is 38,205.
What is the Total Male Population of Winter Springs?
Total Male Population of Winter Springs is 18,958.
What is the Total Female Population of Winter Springs?
Total Female Population of Winter Springs is 19,247.
What is the Ratio of Males per 100 Females in Winter Springs?
There are 98.50 Males per 100 Females in Winter Springs.
What is the Ratio of Females per 100 Males in Winter Springs?
There are 101.52 Females per 100 Males in Winter Springs.
What is the Median Population Age in Winter Springs?
Median Population Age in Winter Springs is 43.1 Years.
What is the Average Family Size in Winter Springs
Average Family Size in Winter Springs is 2.9 People.
What is the Average Household Size in Winter Springs
Average Household Size in Winter Springs is 2.4 People.
How Large is the Labor Force in Winter Springs?
There are 21,614 People in the Labor Forcein in Winter Springs.
What is the Percentage of People in the Labor Force in Winter Springs?
67.4% of People are in the Labor Force in Winter Springs.
What is the Unemployment Rate in Winter Springs?
Unemployment Rate in Winter Springs is 4.2%.