Wimauma, FL Map & Demographics
Wimauma Map
Wimauma Overview
$21,420
PER CAPITA INCOME
$55,704
AVG FAMILY INCOME
$56,321
AVG HOUSEHOLD INCOME
41.3%
WAGE / INCOME GAP [ % ]
58.7¢/ $1
WAGE / INCOME GAP [ $ ]
0.41
INEQUALITY / GINI INDEX
12,439
TOTAL POPULATION
6,157
MALE POPULATION
6,282
FEMALE POPULATION
98.01
MALES / 100 FEMALES
102.03
FEMALES / 100 MALES
25.1
MEDIAN AGE
4.0
AVG FAMILY SIZE
4.1
AVG HOUSEHOLD SIZE
4,747
LABOR FORCE [ PEOPLE ]
61.8%
PERCENT IN LABOR FORCE
2.8%
UNEMPLOYMENT RATE
Wimauma Zip Codes
Wimauma Area Codes
Income in Wimauma
Income Overview in Wimauma
Per Capita Income in Wimauma is $21,420, while median incomes of families and households are $55,704 and $56,321 respectively.
| Characteristic | Number | Measure |
| Per Capita Income | 12,439 | $21,420 |
| Median Family Income | 2,846 | $55,704 |
| Mean Family Income | 2,846 | $85,538 |
| Median Household Income | 3,033 | $56,321 |
| Mean Household Income | 3,033 | $87,936 |
| Income Deficit | 2,846 | $0 |
| Wage / Income Gap (%) | 12,439 | 41.27% |
| Wage / Income Gap ($) | 12,439 | 58.73¢ per $1 |
| Gini / Inequality Index | 12,439 | 0.41 |
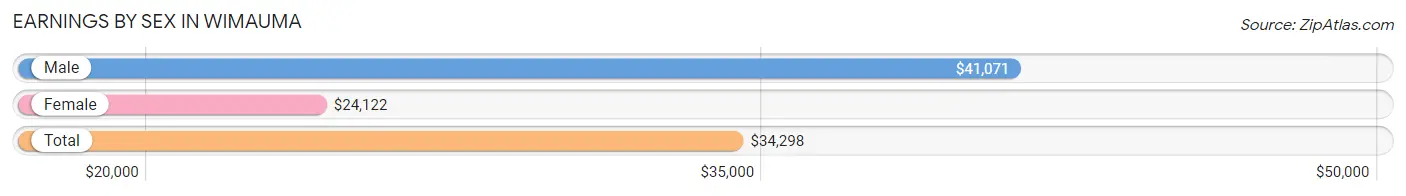
Earnings by Sex in Wimauma
Average Earnings in Wimauma are $34,298, $41,071 for men and $24,122 for women, a difference of 41.3%.
| Sex | Number | Average Earnings |
| Male | 2,858 (58.1%) | $41,071 |
| Female | 2,060 (41.9%) | $24,122 |
| Total | 4,918 (100.0%) | $34,298 |
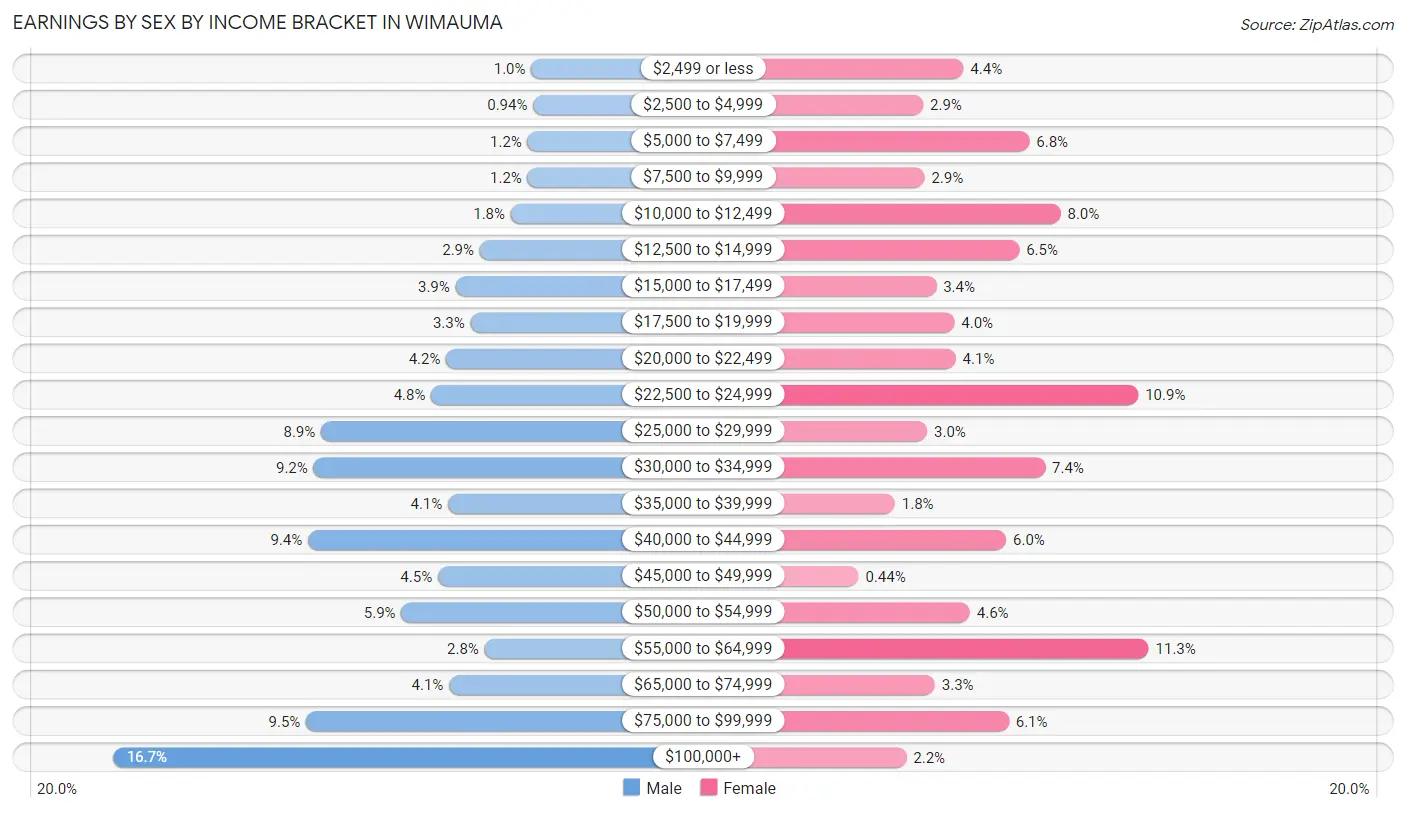
Earnings by Sex by Income Bracket in Wimauma
The most common earnings brackets in Wimauma are $100,000+ for men (476 | 16.7%) and $55,000 to $64,999 for women (233 | 11.3%).
| Income | Male | Female |
| $2,499 or less | 29 (1.0%) | 90 (4.4%) |
| $2,500 to $4,999 | 27 (0.9%) | 59 (2.9%) |
| $5,000 to $7,499 | 33 (1.1%) | 141 (6.8%) |
| $7,500 to $9,999 | 33 (1.1%) | 60 (2.9%) |
| $10,000 to $12,499 | 51 (1.8%) | 165 (8.0%) |
| $12,500 to $14,999 | 84 (2.9%) | 133 (6.5%) |
| $15,000 to $17,499 | 110 (3.8%) | 69 (3.4%) |
| $17,500 to $19,999 | 94 (3.3%) | 83 (4.0%) |
| $20,000 to $22,499 | 120 (4.2%) | 84 (4.1%) |
| $22,500 to $24,999 | 136 (4.8%) | 225 (10.9%) |
| $25,000 to $29,999 | 254 (8.9%) | 62 (3.0%) |
| $30,000 to $34,999 | 262 (9.2%) | 153 (7.4%) |
| $35,000 to $39,999 | 118 (4.1%) | 37 (1.8%) |
| $40,000 to $44,999 | 268 (9.4%) | 123 (6.0%) |
| $45,000 to $49,999 | 129 (4.5%) | 9 (0.4%) |
| $50,000 to $54,999 | 168 (5.9%) | 95 (4.6%) |
| $55,000 to $64,999 | 79 (2.8%) | 233 (11.3%) |
| $65,000 to $74,999 | 117 (4.1%) | 68 (3.3%) |
| $75,000 to $99,999 | 270 (9.5%) | 125 (6.1%) |
| $100,000+ | 476 (16.7%) | 46 (2.2%) |
| Total | 2,858 (100.0%) | 2,060 (100.0%) |
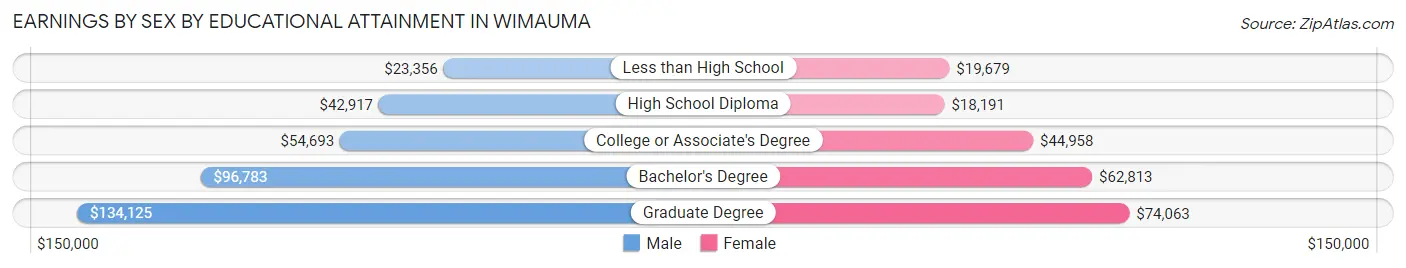
Earnings by Sex by Educational Attainment in Wimauma
Average earnings in Wimauma are $44,695 for men and $30,065 for women, a difference of 32.7%. Men with an educational attainment of graduate degree enjoy the highest average annual earnings of $134,125, while those with less than high school education earn the least with $23,356. Women with an educational attainment of graduate degree earn the most with the average annual earnings of $74,063, while those with high school diploma education have the smallest earnings of $18,191.
| Educational Attainment | Male Income | Female Income |
| Less than High School | $23,356 | $19,679 |
| High School Diploma | $42,917 | $18,191 |
| College or Associate's Degree | $54,693 | $44,958 |
| Bachelor's Degree | $96,783 | $62,813 |
| Graduate Degree | $134,125 | $74,063 |
| Total | $44,695 | $30,065 |
Family Income in Wimauma
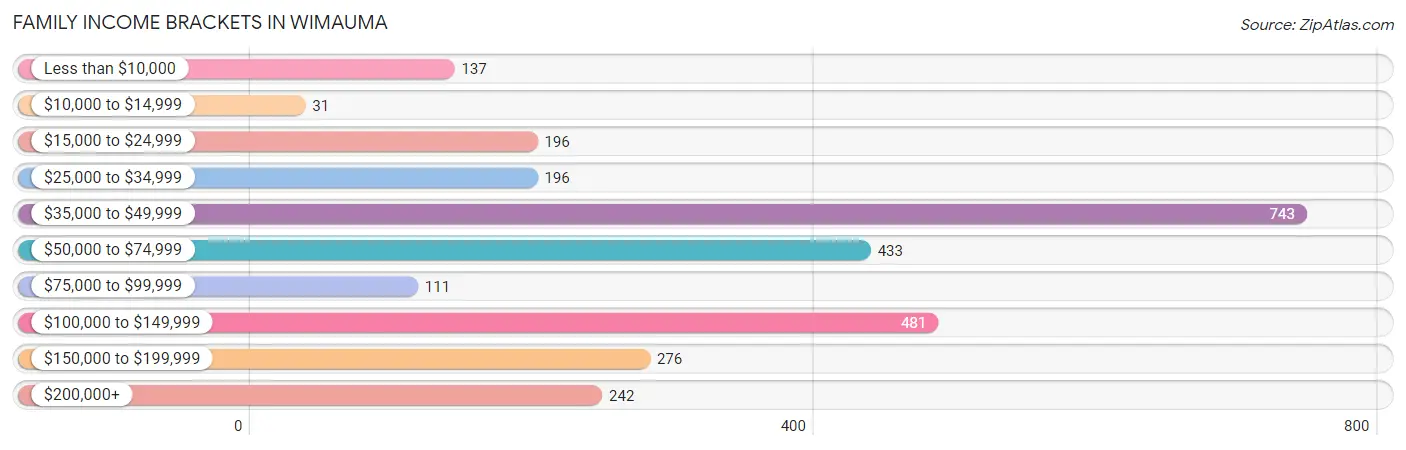
Family Income Brackets in Wimauma
According to the Wimauma family income data, there are 743 families falling into the $35,000 to $49,999 income range, which is the most common income bracket and makes up 26.1% of all families. Conversely, the $10,000 to $14,999 income bracket is the least frequent group with only 31 families (1.1%) belonging to this category.
| Income Bracket | # Families | % Families |
| Less than $10,000 | 137 | 4.8% |
| $10,000 to $14,999 | 31 | 1.1% |
| $15,000 to $24,999 | 196 | 6.9% |
| $25,000 to $34,999 | 196 | 6.9% |
| $35,000 to $49,999 | 743 | 26.1% |
| $50,000 to $74,999 | 433 | 15.2% |
| $75,000 to $99,999 | 111 | 3.9% |
| $100,000 to $149,999 | 481 | 16.9% |
| $150,000 to $199,999 | 276 | 9.7% |
| $200,000+ | 242 | 8.5% |
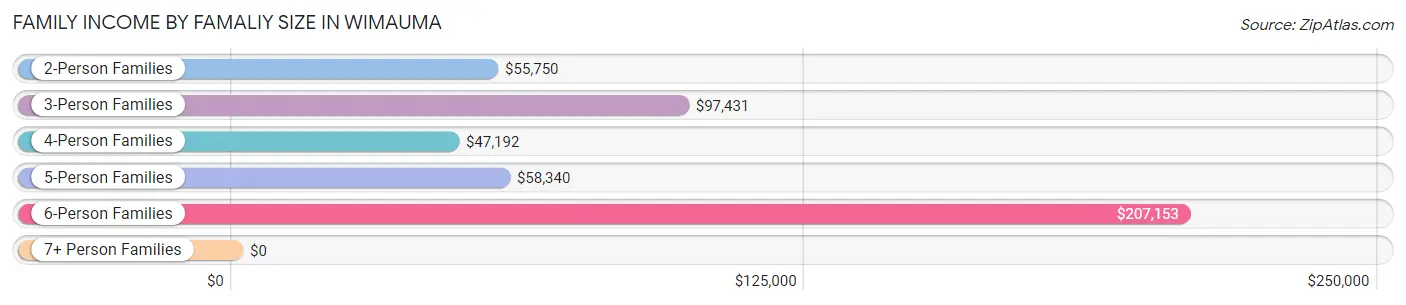
Family Income by Famaliy Size in Wimauma
6-person families (111 | 3.9%) account for the highest median family income in Wimauma with $207,153 per family, while 6-person families (111 | 3.9%) have the highest median income of $34,526 per family member.
| Income Bracket | # Families | Median Income |
| 2-Person Families | 579 (20.3%) | $55,750 |
| 3-Person Families | 393 (13.8%) | $97,431 |
| 4-Person Families | 716 (25.2%) | $47,192 |
| 5-Person Families | 537 (18.9%) | $58,340 |
| 6-Person Families | 111 (3.9%) | $207,153 |
| 7+ Person Families | 510 (17.9%) | $0 |
| Total | 2,846 (100.0%) | $55,704 |
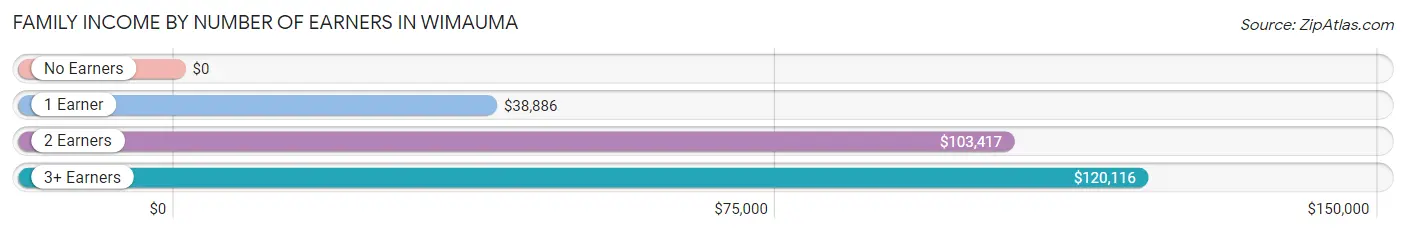
Family Income by Number of Earners in Wimauma
| Number of Earners | # Families | Median Income |
| No Earners | 186 (6.5%) | $0 |
| 1 Earner | 1,069 (37.6%) | $38,886 |
| 2 Earners | 1,173 (41.2%) | $103,417 |
| 3+ Earners | 418 (14.7%) | $120,116 |
| Total | 2,846 (100.0%) | $55,704 |
Household Income in Wimauma
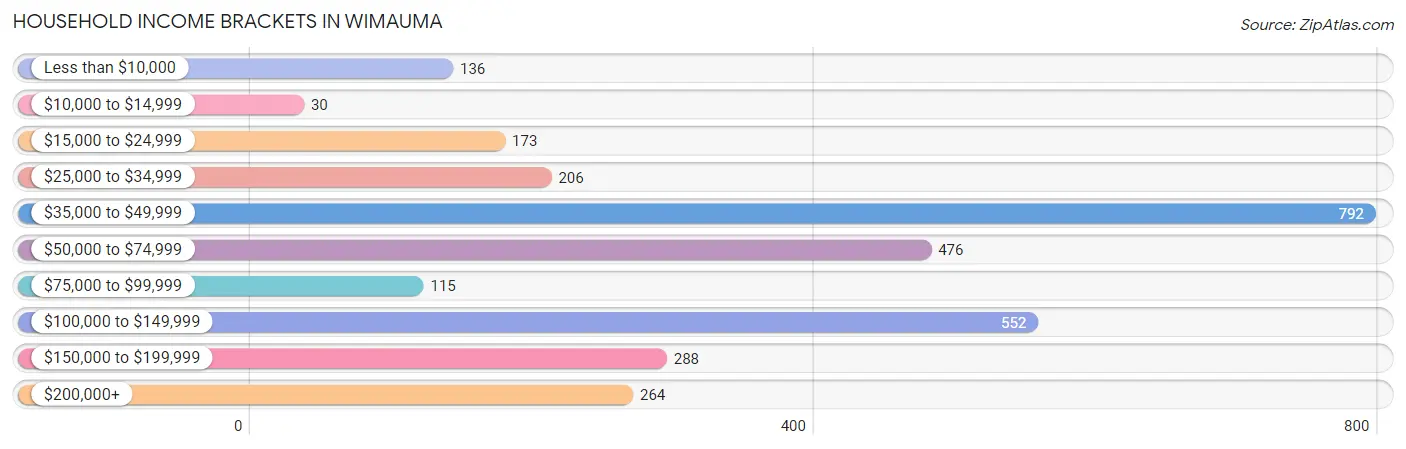
Household Income Brackets in Wimauma
With 792 households falling in the category, the $35,000 to $49,999 income range is the most frequent in Wimauma, accounting for 26.1% of all households. In contrast, only 30 households (1.0%) fall into the $10,000 to $14,999 income bracket, making it the least populous group.
| Income Bracket | # Households | % Households |
| Less than $10,000 | 136 | 4.5% |
| $10,000 to $14,999 | 30 | 1.0% |
| $15,000 to $24,999 | 173 | 5.7% |
| $25,000 to $34,999 | 206 | 6.8% |
| $35,000 to $49,999 | 792 | 26.1% |
| $50,000 to $74,999 | 476 | 15.7% |
| $75,000 to $99,999 | 115 | 3.8% |
| $100,000 to $149,999 | 552 | 18.2% |
| $150,000 to $199,999 | 288 | 9.5% |
| $200,000+ | 264 | 8.7% |
Household Income by Householder Age in Wimauma
The median household income in Wimauma is $56,321, with the highest median household income of $100,469 found in the 45 to 64 years age bracket for the primary householder. A total of 701 households (23.1%) fall into this category. Meanwhile, the 65+ years age bracket for the primary householder has the lowest median household income of $46,714, with 529 households (17.4%) in this group.
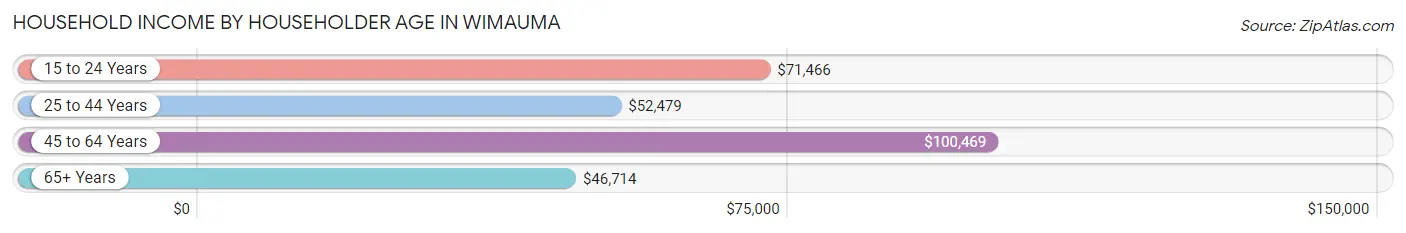
| Income Bracket | # Households | Median Income |
| 15 to 24 Years | 68 (2.2%) | $71,466 |
| 25 to 44 Years | 1,735 (57.2%) | $52,479 |
| 45 to 64 Years | 701 (23.1%) | $100,469 |
| 65+ Years | 529 (17.4%) | $46,714 |
| Total | 3,033 (100.0%) | $56,321 |
Poverty in Wimauma
Income Below Poverty by Sex and Age in Wimauma
With 31.4% poverty level for males and 27.6% for females among the residents of Wimauma, 16 and 17 year old males and 15 year old females are the most vulnerable to poverty, with 357 males (88.4%) and 202 females (100.0%) in their respective age groups living below the poverty level.
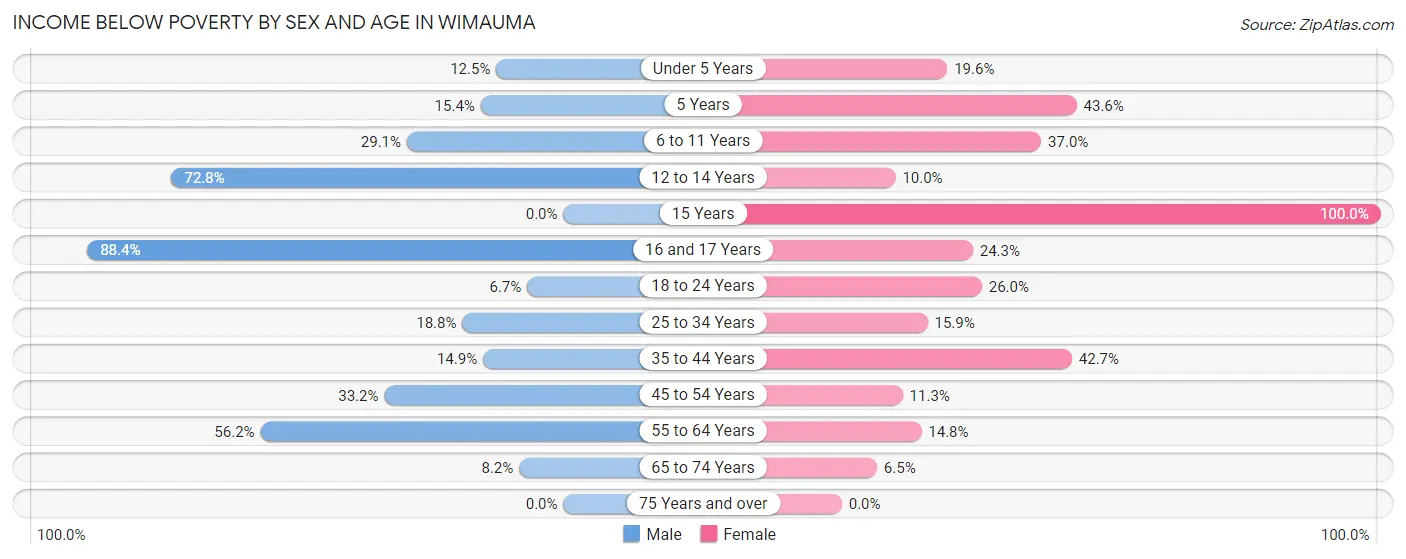
| Age Bracket | Male | Female |
| Under 5 Years | 78 (12.5%) | 100 (19.6%) |
| 5 Years | 31 (15.3%) | 85 (43.6%) |
| 6 to 11 Years | 201 (29.0%) | 447 (37.0%) |
| 12 to 14 Years | 510 (72.8%) | 24 (10.0%) |
| 15 Years | 0 (0.0%) | 202 (100.0%) |
| 16 and 17 Years | 357 (88.4%) | 18 (24.3%) |
| 18 to 24 Years | 30 (6.7%) | 131 (26.0%) |
| 25 to 34 Years | 136 (18.8%) | 142 (15.9%) |
| 35 to 44 Years | 114 (14.9%) | 471 (42.7%) |
| 45 to 54 Years | 246 (33.2%) | 40 (11.3%) |
| 55 to 64 Years | 185 (56.2%) | 52 (14.8%) |
| 65 to 74 Years | 17 (8.2%) | 15 (6.5%) |
| 75 Years and over | 0 (0.0%) | 0 (0.0%) |
| Total | 1,905 (31.4%) | 1,727 (27.6%) |
Income Above Poverty by Sex and Age in Wimauma
According to the poverty statistics in Wimauma, males aged 15 years and females aged 75 years and over are the age groups that are most secure financially, with 100.0% of males and 100.0% of females in these age groups living above the poverty line.
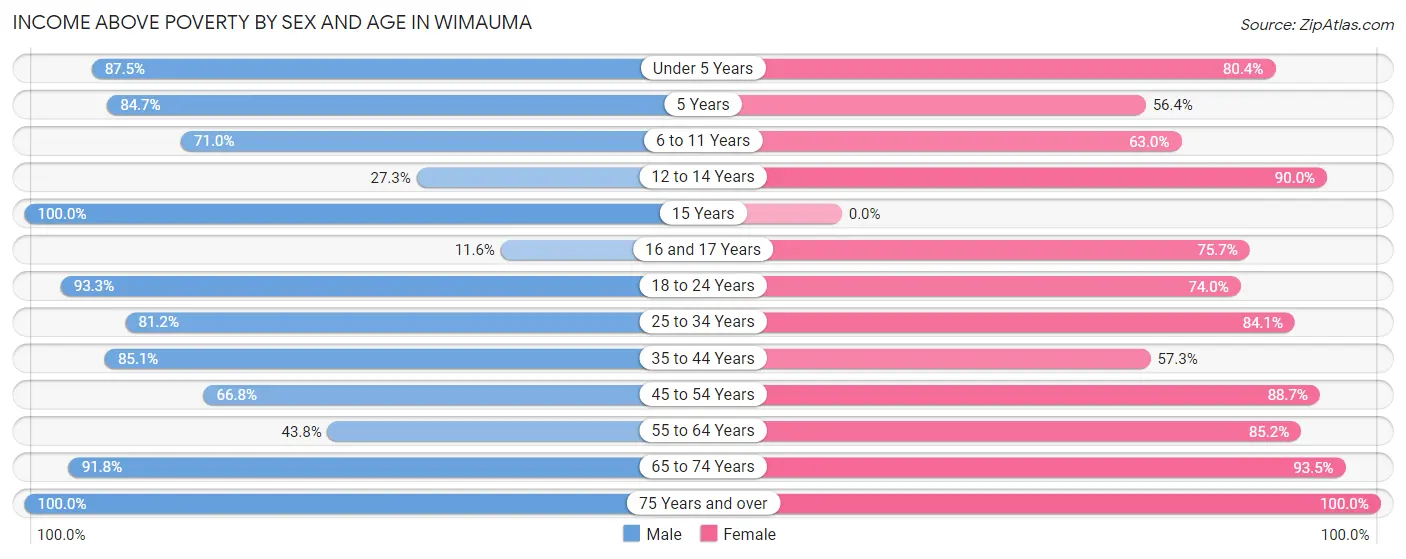
| Age Bracket | Male | Female |
| Under 5 Years | 548 (87.5%) | 411 (80.4%) |
| 5 Years | 171 (84.7%) | 110 (56.4%) |
| 6 to 11 Years | 491 (71.0%) | 761 (63.0%) |
| 12 to 14 Years | 191 (27.3%) | 217 (90.0%) |
| 15 Years | 84 (100.0%) | 0 (0.0%) |
| 16 and 17 Years | 47 (11.6%) | 56 (75.7%) |
| 18 to 24 Years | 416 (93.3%) | 373 (74.0%) |
| 25 to 34 Years | 589 (81.2%) | 750 (84.1%) |
| 35 to 44 Years | 650 (85.1%) | 632 (57.3%) |
| 45 to 54 Years | 494 (66.8%) | 314 (88.7%) |
| 55 to 64 Years | 144 (43.8%) | 300 (85.2%) |
| 65 to 74 Years | 190 (91.8%) | 215 (93.5%) |
| 75 Years and over | 141 (100.0%) | 398 (100.0%) |
| Total | 4,156 (68.6%) | 4,537 (72.4%) |
Income Below Poverty Among Married-Couple Families in Wimauma
The poverty statistics for married-couple families in Wimauma show that 22.8% or 503 of the total 2,202 families live below the poverty line. Families with 5 or more children have the highest poverty rate of 93.7%, comprising of 313 families. On the other hand, families with no children have the lowest poverty rate of 5.0%, which includes 41 families.
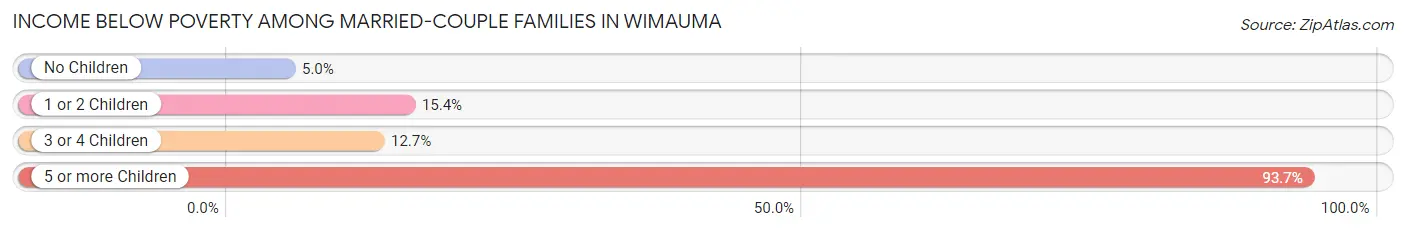
| Children | Above Poverty | Below Poverty |
| No Children | 785 (95.0%) | 41 (5.0%) |
| 1 or 2 Children | 522 (84.6%) | 95 (15.4%) |
| 3 or 4 Children | 371 (87.3%) | 54 (12.7%) |
| 5 or more Children | 21 (6.3%) | 313 (93.7%) |
| Total | 1,699 (77.2%) | 503 (22.8%) |
Income Below Poverty Among Single-Parent Households in Wimauma
According to the poverty data in Wimauma, 12.0% or 20 single-father households and 35.4% or 169 single-mother households are living below the poverty line. Among single-father households, those with 3 or 4 children have the highest poverty rate, with 20 households (100.0%) experiencing poverty. Likewise, among single-mother households, those with 3 or 4 children have the highest poverty rate, with 51 households (100.0%) falling below the poverty line.
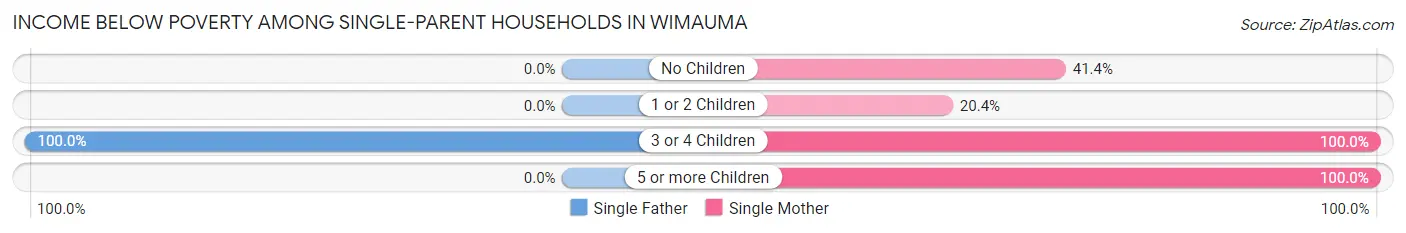
| Children | Single Father | Single Mother |
| No Children | 0 (0.0%) | 24 (41.4%) |
| 1 or 2 Children | 0 (0.0%) | 70 (20.3%) |
| 3 or 4 Children | 20 (100.0%) | 51 (100.0%) |
| 5 or more Children | 0 (0.0%) | 24 (100.0%) |
| Total | 20 (12.0%) | 169 (35.4%) |
Income Below Poverty Among Married-Couple vs Single-Parent Households in Wimauma
The poverty data for Wimauma shows that 503 of the married-couple family households (22.8%) and 189 of the single-parent households (29.3%) are living below the poverty level. Within the married-couple family households, those with 5 or more children have the highest poverty rate, with 313 households (93.7%) falling below the poverty line. Among the single-parent households, those with 3 or 4 children have the highest poverty rate, with 71 household (100.0%) living below poverty.
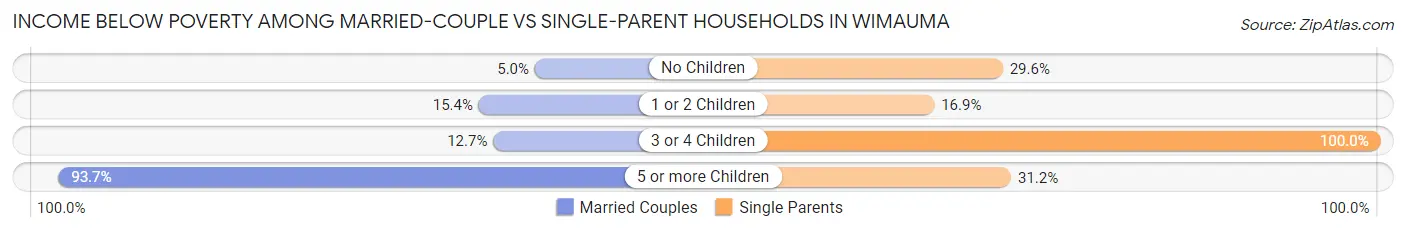
| Children | Married-Couple Families | Single-Parent Households |
| No Children | 41 (5.0%) | 24 (29.6%) |
| 1 or 2 Children | 95 (15.4%) | 70 (16.9%) |
| 3 or 4 Children | 54 (12.7%) | 71 (100.0%) |
| 5 or more Children | 313 (93.7%) | 24 (31.2%) |
| Total | 503 (22.8%) | 189 (29.3%) |
Race in Wimauma
The most populous races in Wimauma are Hispanic or Latino (6,280 | 50.5%), White / Caucasian (4,332 | 34.8%), and Some other Race (3,757 | 30.2%).
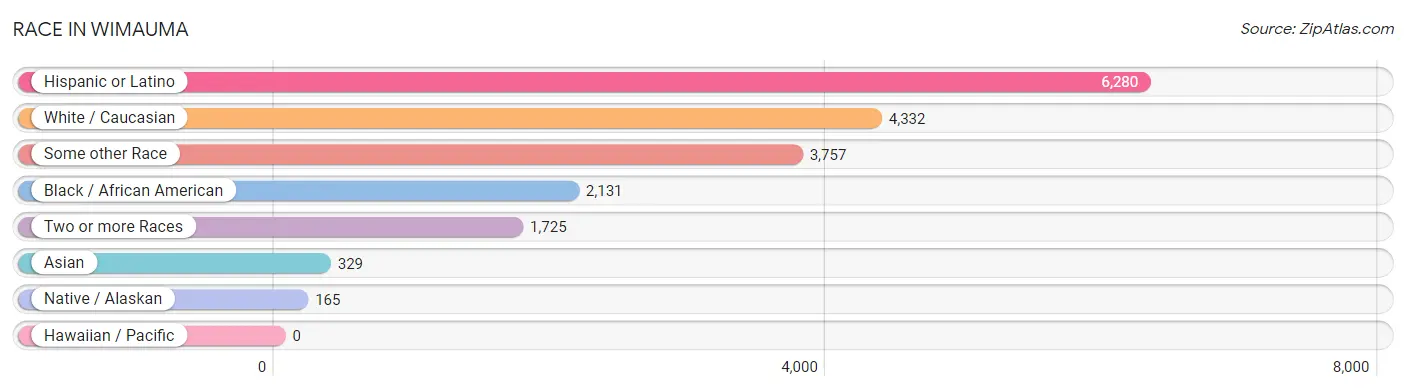
| Race | # Population | % Population |
| Asian | 329 | 2.6% |
| Black / African American | 2,131 | 17.1% |
| Hawaiian / Pacific | 0 | 0.0% |
| Hispanic or Latino | 6,280 | 50.5% |
| Native / Alaskan | 165 | 1.3% |
| White / Caucasian | 4,332 | 34.8% |
| Two or more Races | 1,725 | 13.9% |
| Some other Race | 3,757 | 30.2% |
| Total | 12,439 | 100.0% |
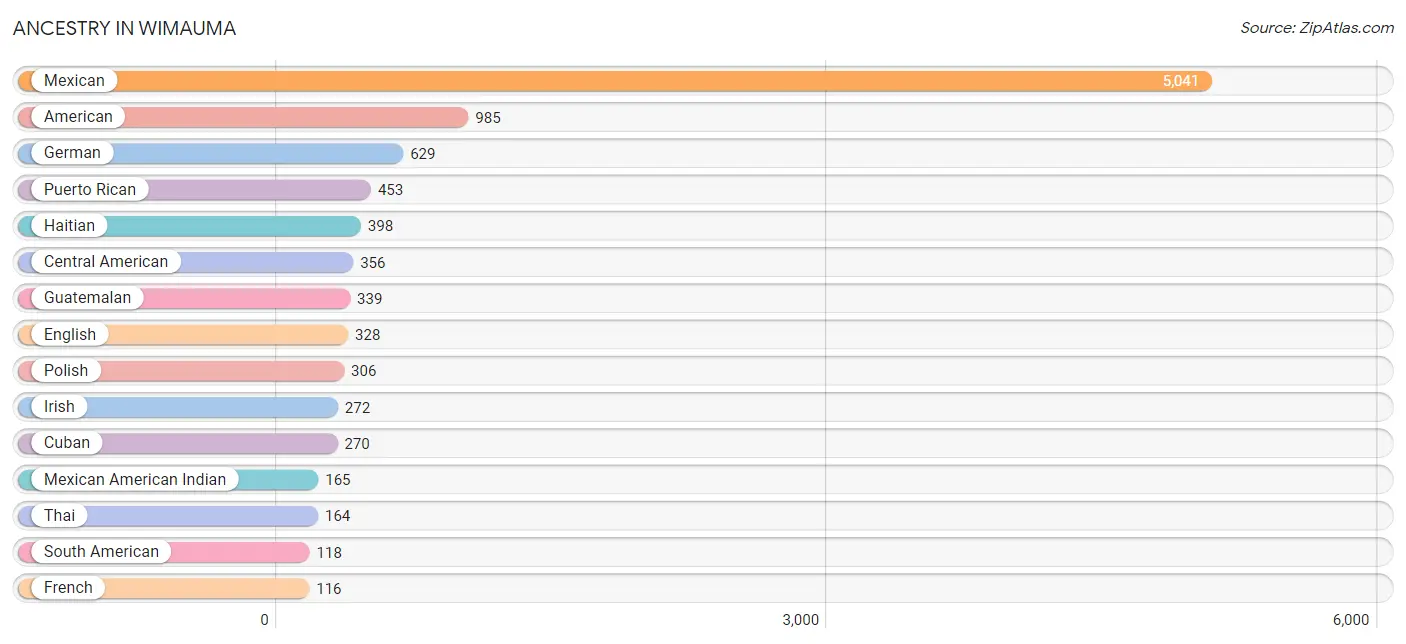
Ancestry in Wimauma
The most populous ancestries reported in Wimauma are Mexican (5,041 | 40.5%), American (985 | 7.9%), German (629 | 5.1%), Puerto Rican (453 | 3.6%), and Haitian (398 | 3.2%), together accounting for 60.4% of all Wimauma residents.
| Ancestry | # Population | % Population |
| American | 985 | 7.9% |
| Argentinean | 18 | 0.1% |
| Austrian | 12 | 0.1% |
| Bhutanese | 51 | 0.4% |
| Burmese | 21 | 0.2% |
| Central American | 356 | 2.9% |
| Cherokee | 95 | 0.8% |
| Cuban | 270 | 2.2% |
| Danish | 25 | 0.2% |
| Dominican | 21 | 0.2% |
| English | 328 | 2.6% |
| European | 68 | 0.5% |
| French | 116 | 0.9% |
| German | 629 | 5.1% |
| Guatemalan | 339 | 2.7% |
| Guyanese | 55 | 0.4% |
| Haitian | 398 | 3.2% |
| Honduran | 17 | 0.1% |
| Indian (Asian) | 35 | 0.3% |
| Irish | 272 | 2.2% |
| Italian | 103 | 0.8% |
| Jamaican | 45 | 0.4% |
| Korean | 27 | 0.2% |
| Mexican | 5,041 | 40.5% |
| Mexican American Indian | 165 | 1.3% |
| Norwegian | 18 | 0.1% |
| Polish | 306 | 2.5% |
| Portuguese | 17 | 0.1% |
| Puerto Rican | 453 | 3.6% |
| Russian | 21 | 0.2% |
| Scotch-Irish | 36 | 0.3% |
| Scottish | 51 | 0.4% |
| South American | 118 | 0.9% |
| Spaniard | 21 | 0.2% |
| Sri Lankan | 31 | 0.3% |
| Swedish | 16 | 0.1% |
| Swiss | 51 | 0.4% |
| Thai | 164 | 1.3% |
| Trinidadian and Tobagonian | 45 | 0.4% |
| Venezuelan | 100 | 0.8% |
| Welsh | 3 | 0.0% | View All 41 Rows |
Immigrants in Wimauma
The most numerous immigrant groups reported in Wimauma came from Latin America (2,748 | 22.1%), Central America (1,894 | 15.2%), Mexico (1,700 | 13.7%), Caribbean (719 | 5.8%), and Cuba (508 | 4.1%), together accounting for 60.9% of all Wimauma residents.
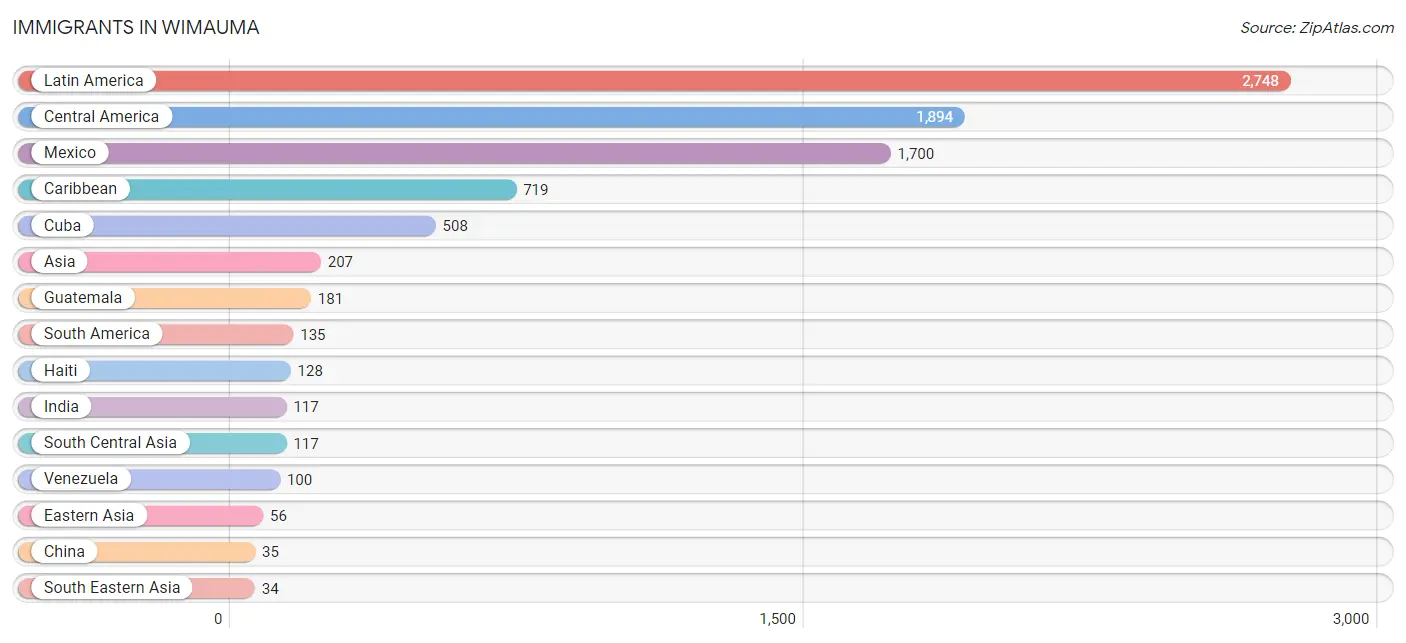
| Immigration Origin | # Population | % Population |
| Argentina | 18 | 0.1% |
| Asia | 207 | 1.7% |
| Caribbean | 719 | 5.8% |
| Central America | 1,894 | 15.2% |
| China | 35 | 0.3% |
| Costa Rica | 13 | 0.1% |
| Cuba | 508 | 4.1% |
| Eastern Asia | 56 | 0.4% |
| Guatemala | 181 | 1.5% |
| Guyana | 17 | 0.1% |
| Haiti | 128 | 1.0% |
| India | 117 | 0.9% |
| Korea | 21 | 0.2% |
| Latin America | 2,748 | 22.1% |
| Mexico | 1,700 | 13.7% |
| Oceania | 23 | 0.2% |
| Philippines | 19 | 0.2% |
| South America | 135 | 1.1% |
| South Central Asia | 117 | 0.9% |
| South Eastern Asia | 34 | 0.3% |
| Trinidad and Tobago | 22 | 0.2% |
| Venezuela | 100 | 0.8% |
| Vietnam | 15 | 0.1% | View All 23 Rows |
Sex and Age in Wimauma
Sex and Age in Wimauma
The most populous age groups in Wimauma are 10 to 14 Years (1,020 | 16.6%) for men and 5 to 9 Years (1,083 | 17.2%) for women.
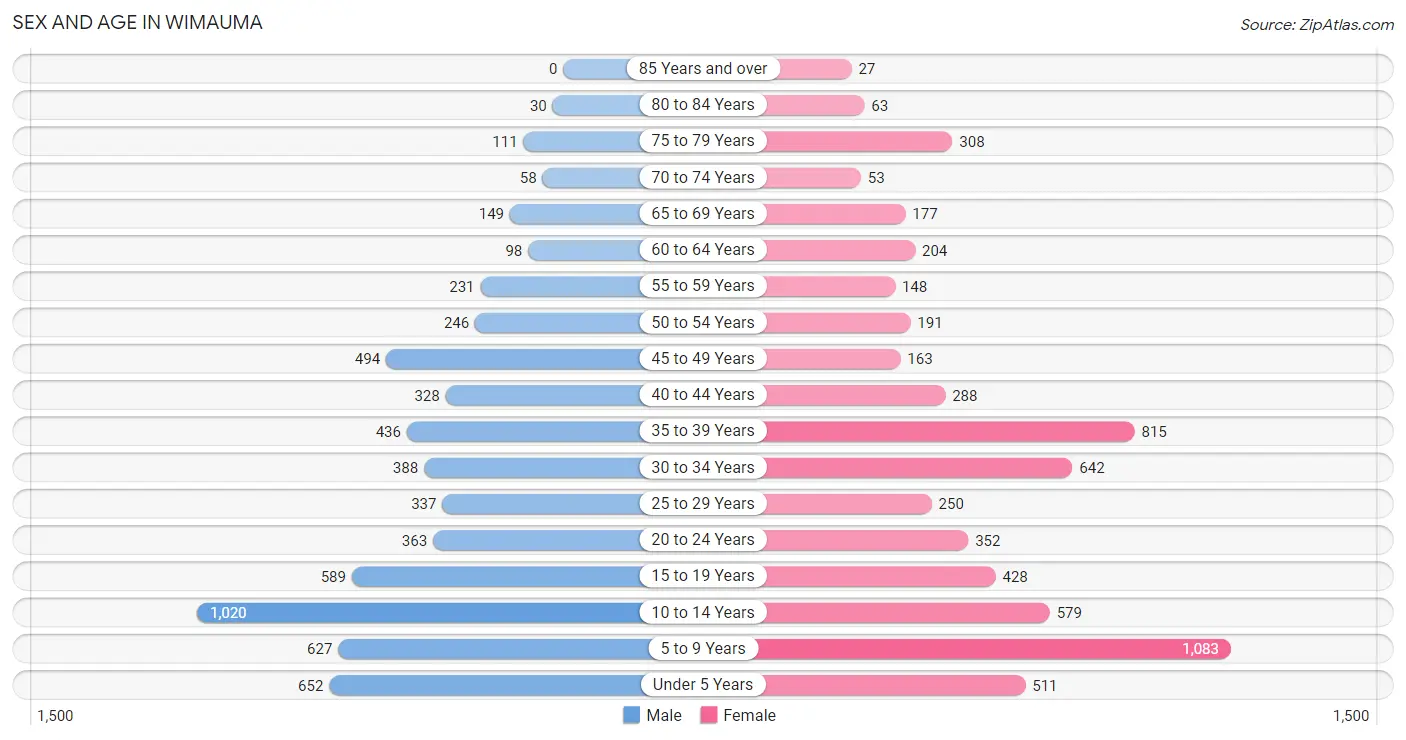
| Age Bracket | Male | Female |
| Under 5 Years | 652 (10.6%) | 511 (8.1%) |
| 5 to 9 Years | 627 (10.2%) | 1,083 (17.2%) |
| 10 to 14 Years | 1,020 (16.6%) | 579 (9.2%) |
| 15 to 19 Years | 589 (9.6%) | 428 (6.8%) |
| 20 to 24 Years | 363 (5.9%) | 352 (5.6%) |
| 25 to 29 Years | 337 (5.5%) | 250 (4.0%) |
| 30 to 34 Years | 388 (6.3%) | 642 (10.2%) |
| 35 to 39 Years | 436 (7.1%) | 815 (13.0%) |
| 40 to 44 Years | 328 (5.3%) | 288 (4.6%) |
| 45 to 49 Years | 494 (8.0%) | 163 (2.6%) |
| 50 to 54 Years | 246 (4.0%) | 191 (3.0%) |
| 55 to 59 Years | 231 (3.7%) | 148 (2.4%) |
| 60 to 64 Years | 98 (1.6%) | 204 (3.3%) |
| 65 to 69 Years | 149 (2.4%) | 177 (2.8%) |
| 70 to 74 Years | 58 (0.9%) | 53 (0.8%) |
| 75 to 79 Years | 111 (1.8%) | 308 (4.9%) |
| 80 to 84 Years | 30 (0.5%) | 63 (1.0%) |
| 85 Years and over | 0 (0.0%) | 27 (0.4%) |
| Total | 6,157 (100.0%) | 6,282 (100.0%) |
Families and Households in Wimauma
Median Family Size in Wimauma
The median family size in Wimauma is 4.03 persons per family, with single male/father families (167 | 5.9%) accounting for the largest median family size of 4.09 persons per family. On the other hand, married-couple families (2,202 | 77.4%) represent the smallest median family size with 4.02 persons per family.
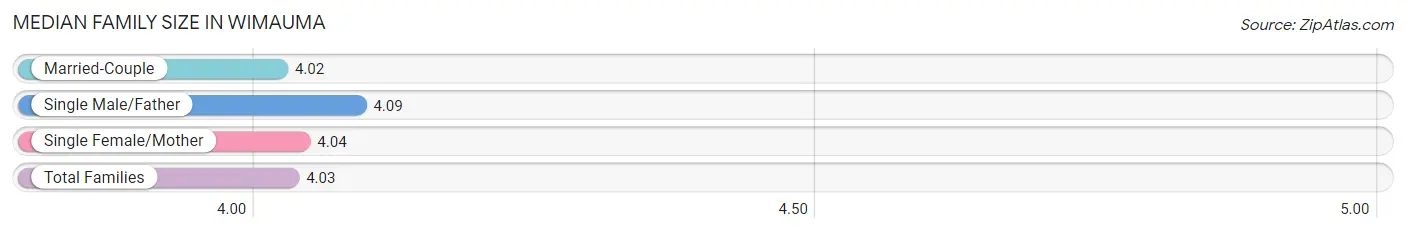
| Family Type | # Families | Family Size |
| Married-Couple | 2,202 (77.4%) | 4.02 |
| Single Male/Father | 167 (5.9%) | 4.09 |
| Single Female/Mother | 477 (16.8%) | 4.04 |
| Total Families | 2,846 (100.0%) | 4.03 |
Median Household Size in Wimauma
The median household size in Wimauma is 4.06 persons per household, with single male/father households (167 | 5.5%) accounting for the largest median household size of 4.93 persons per household. non-family households (187 | 6.2%) represent the smallest median household size with 1.52 persons per household.
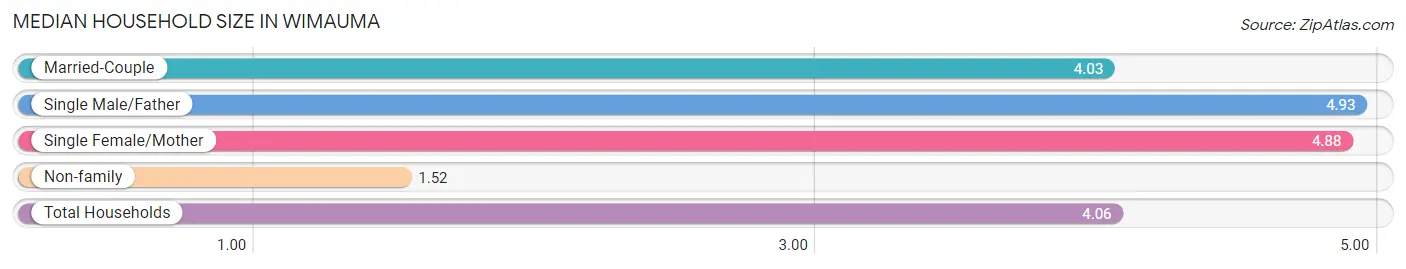
| Household Type | # Households | Household Size |
| Married-Couple | 2,202 (72.6%) | 4.03 |
| Single Male/Father | 167 (5.5%) | 4.93 |
| Single Female/Mother | 477 (15.7%) | 4.88 |
| Non-family | 187 (6.2%) | 1.52 |
| Total Households | 3,033 (100.0%) | 4.06 |
Household Size by Marriage Status in Wimauma
Out of a total of 3,033 households in Wimauma, 2,846 (93.8%) are family households, while 187 (6.2%) are nonfamily households. The most numerous type of family households are 4-person households, comprising 716, and the most common type of nonfamily households are 1-person households, comprising 112.
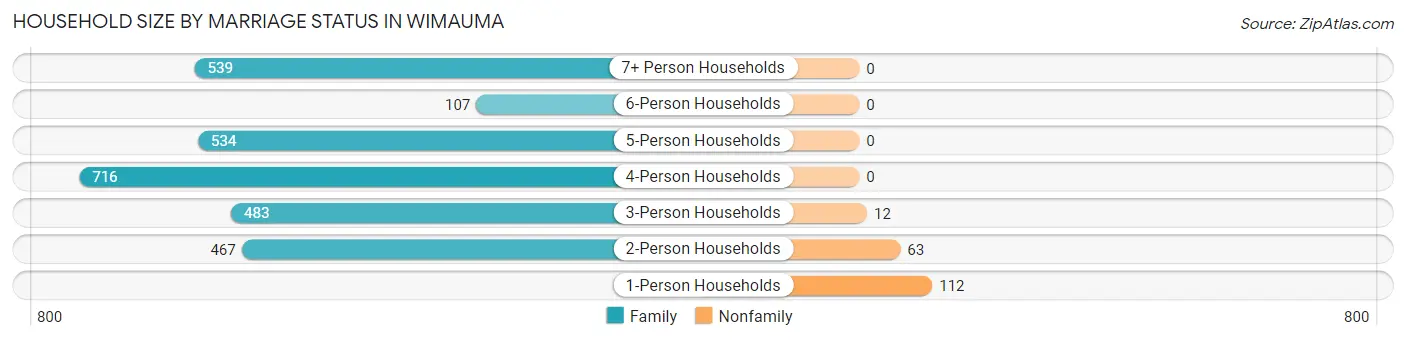
| Household Size | Family Households | Nonfamily Households |
| 1-Person Households | - | 112 (3.7%) |
| 2-Person Households | 467 (15.4%) | 63 (2.1%) |
| 3-Person Households | 483 (15.9%) | 12 (0.4%) |
| 4-Person Households | 716 (23.6%) | 0 (0.0%) |
| 5-Person Households | 534 (17.6%) | 0 (0.0%) |
| 6-Person Households | 107 (3.5%) | 0 (0.0%) |
| 7+ Person Households | 539 (17.8%) | 0 (0.0%) |
| Total | 2,846 (93.8%) | 187 (6.2%) |
Female Fertility in Wimauma
Fertility by Age in Wimauma
Average fertility rate in Wimauma is 64.0 births per 1,000 women. Women in the age bracket of 20 to 34 years have the highest fertility rate with 109.0 births per 1,000 women. Women in the age bracket of 20 to 34 years acount for 71.6% of all women with births.
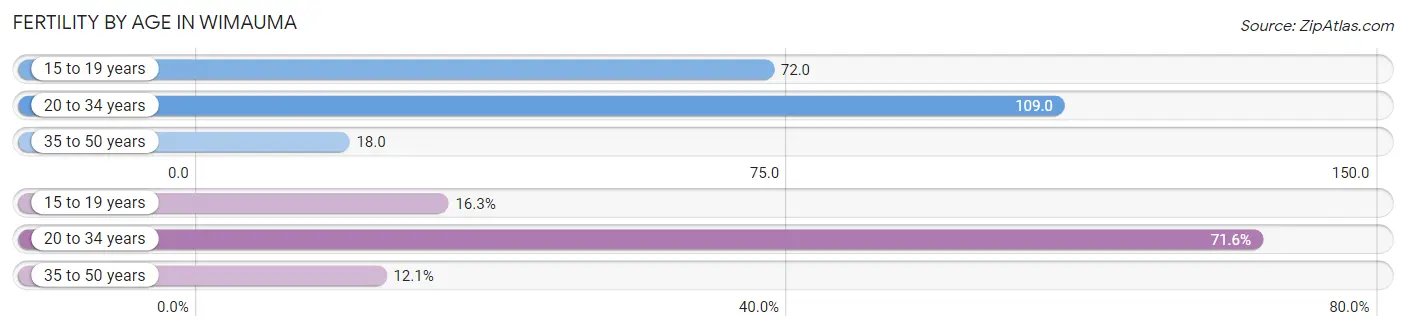
| Age Bracket | Women with Births | Births / 1,000 Women |
| 15 to 19 years | 31 (16.3%) | 72.0 |
| 20 to 34 years | 136 (71.6%) | 109.0 |
| 35 to 50 years | 23 (12.1%) | 18.0 |
| Total | 190 (100.0%) | 64.0 |
Fertility by Age by Marriage Status in Wimauma
41.6% of women with births (190) in Wimauma are married. The highest percentage of unmarried women with births falls into 20 to 34 years age bracket with 78.7% of them unmarried at the time of birth, while the lowest percentage of unmarried women with births belong to 35 to 50 years age bracket with 0.0% of them unmarried.
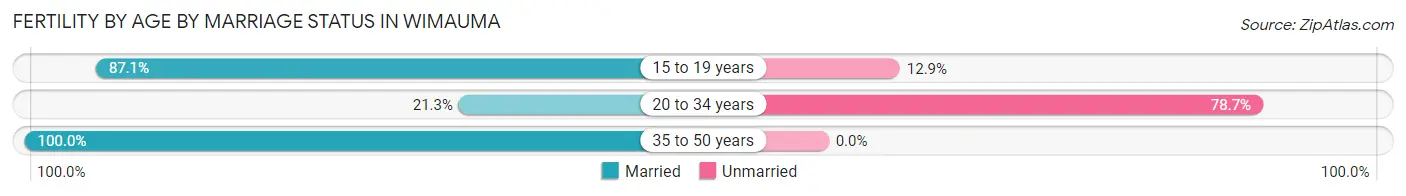
| Age Bracket | Married | Unmarried |
| 15 to 19 years | 27 (87.1%) | 4 (12.9%) |
| 20 to 34 years | 29 (21.3%) | 107 (78.7%) |
| 35 to 50 years | 23 (100.0%) | 0 (0.0%) |
| Total | 79 (41.6%) | 111 (58.4%) |
Fertility by Education in Wimauma
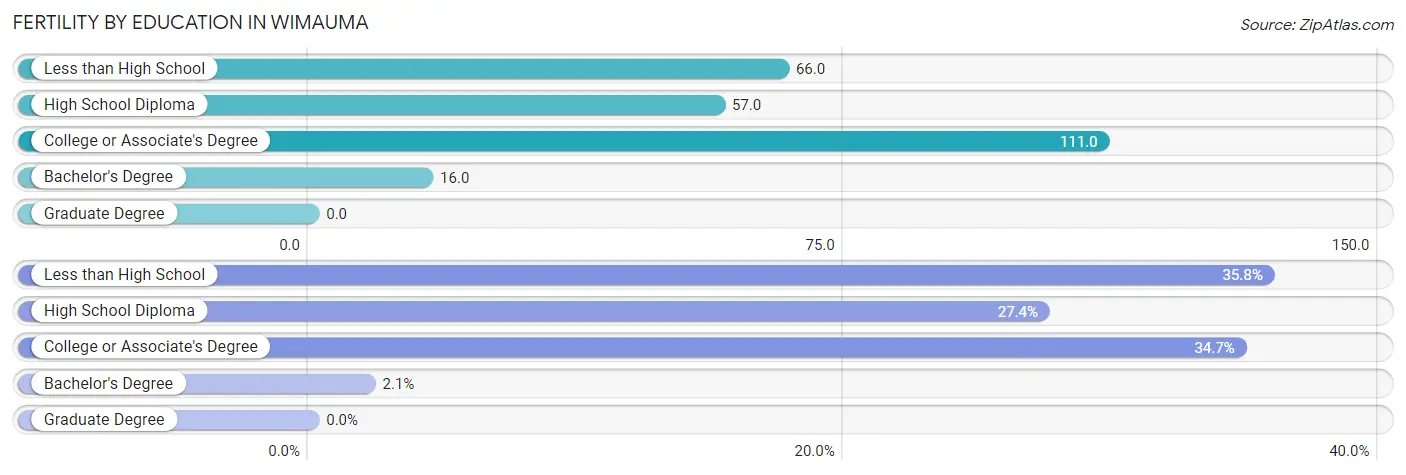
| Educational Attainment | Women with Births | Births / 1,000 Women |
| Less than High School | 68 (35.8%) | 66.0 |
| High School Diploma | 52 (27.4%) | 57.0 |
| College or Associate's Degree | 66 (34.7%) | 111.0 |
| Bachelor's Degree | 4 (2.1%) | 16.0 |
| Graduate Degree | 0 (0.0%) | 0.0 |
| Total | 190 (100.0%) | 64.0 |
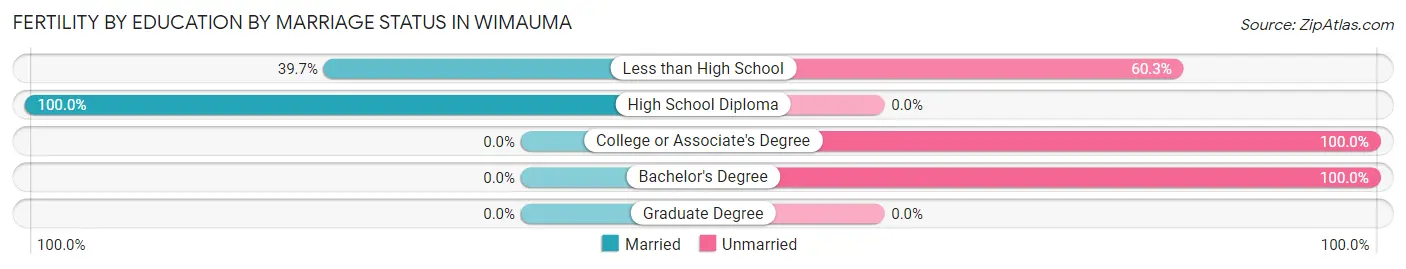
Fertility by Education by Marriage Status in Wimauma
58.4% of women with births in Wimauma are unmarried. Women with the educational attainment of high school diploma are most likely to be married with 100.0% of them married at childbirth, while women with the educational attainment of college or associate's degree are least likely to be married with 100.0% of them unmarried at childbirth.
| Educational Attainment | Married | Unmarried |
| Less than High School | 27 (39.7%) | 41 (60.3%) |
| High School Diploma | 52 (100.0%) | 0 (0.0%) |
| College or Associate's Degree | 0 (0.0%) | 66 (100.0%) |
| Bachelor's Degree | 0 (0.0%) | 4 (100.0%) |
| Graduate Degree | 0 (0.0%) | 0 (0.0%) |
| Total | 79 (41.6%) | 111 (58.4%) |
Employment Characteristics in Wimauma
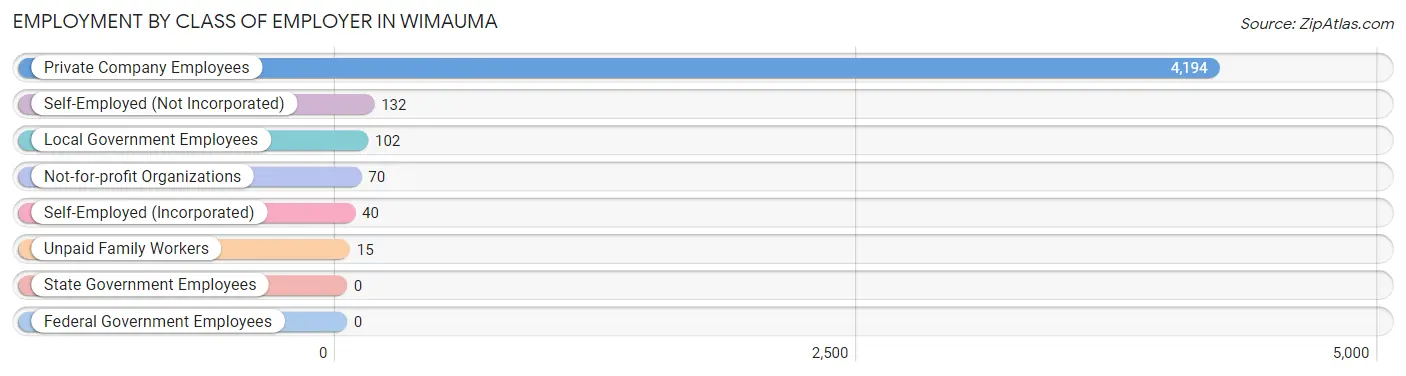
Employment by Class of Employer in Wimauma
Among the 4,553 employed individuals in Wimauma, private company employees (4,194 | 92.1%), self-employed (not incorporated) (132 | 2.9%), and local government employees (102 | 2.2%) make up the most common classes of employment.
| Employer Class | # Employees | % Employees |
| Private Company Employees | 4,194 | 92.1% |
| Self-Employed (Incorporated) | 40 | 0.9% |
| Self-Employed (Not Incorporated) | 132 | 2.9% |
| Not-for-profit Organizations | 70 | 1.5% |
| Local Government Employees | 102 | 2.2% |
| State Government Employees | 0 | 0.0% |
| Federal Government Employees | 0 | 0.0% |
| Unpaid Family Workers | 15 | 0.3% |
| Total | 4,553 | 100.0% |
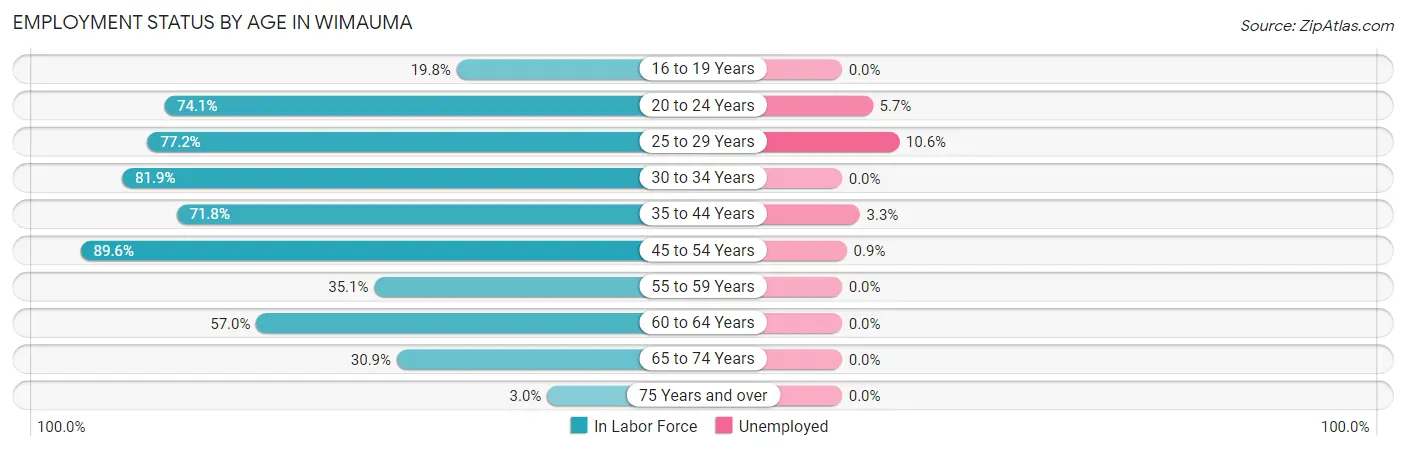
Employment Status by Age in Wimauma
According to the labor force statistics for Wimauma, out of the total population over 16 years of age (7,681), 61.8% or 4,747 individuals are in the labor force, with 2.8% or 133 of them unemployed. The age group with the highest labor force participation rate is 45 to 54 years, with 89.6% or 980 individuals in the labor force. Within the labor force, the 25 to 29 years age range has the highest percentage of unemployed individuals, with 10.6% or 48 of them being unemployed.
| Age Bracket | In Labor Force | Unemployed |
| 16 to 19 Years | 145 (19.8%) | 0 (0.0%) |
| 20 to 24 Years | 530 (74.1%) | 30 (5.7%) |
| 25 to 29 Years | 453 (77.2%) | 48 (10.6%) |
| 30 to 34 Years | 844 (81.9%) | 0 (0.0%) |
| 35 to 44 Years | 1,341 (71.8%) | 44 (3.3%) |
| 45 to 54 Years | 980 (89.6%) | 9 (0.9%) |
| 55 to 59 Years | 133 (35.1%) | 0 (0.0%) |
| 60 to 64 Years | 172 (57.0%) | 0 (0.0%) |
| 65 to 74 Years | 135 (30.9%) | 0 (0.0%) |
| 75 Years and over | 16 (3.0%) | 0 (0.0%) |
| Total | 4,747 (61.8%) | 133 (2.8%) |
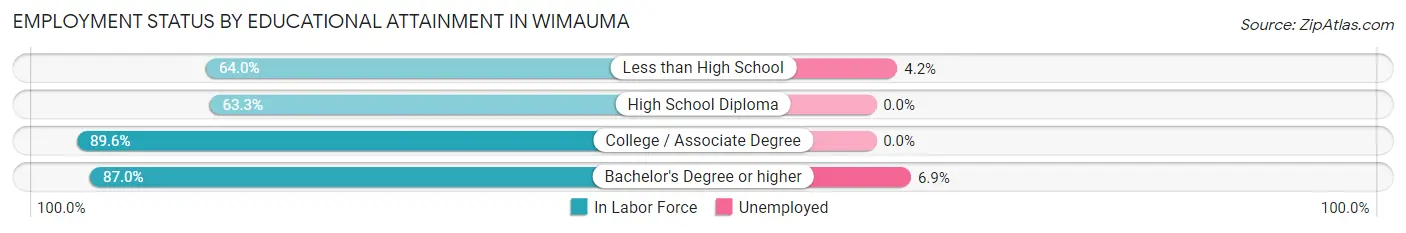
Employment Status by Educational Attainment in Wimauma
According to labor force statistics for Wimauma, 74.6% of individuals (3,923) out of the total population between 25 and 64 years of age (5,259) are in the labor force, with 2.6% or 102 of them being unemployed. The group with the highest labor force participation rate are those with the educational attainment of college / associate degree, with 89.6% or 1,177 individuals in the labor force. Within the labor force, individuals with bachelor's degree or higher education have the highest percentage of unemployment, with 6.9% or 60 of them being unemployed.
| Educational Attainment | In Labor Force | Unemployed |
| Less than High School | 970 (64.0%) | 64 (4.2%) |
| High School Diploma | 901 (63.3%) | 0 (0.0%) |
| College / Associate Degree | 1,177 (89.6%) | 0 (0.0%) |
| Bachelor's Degree or higher | 874 (87.0%) | 69 (6.9%) |
| Total | 3,923 (74.6%) | 137 (2.6%) |
Employment Occupations by Sex in Wimauma
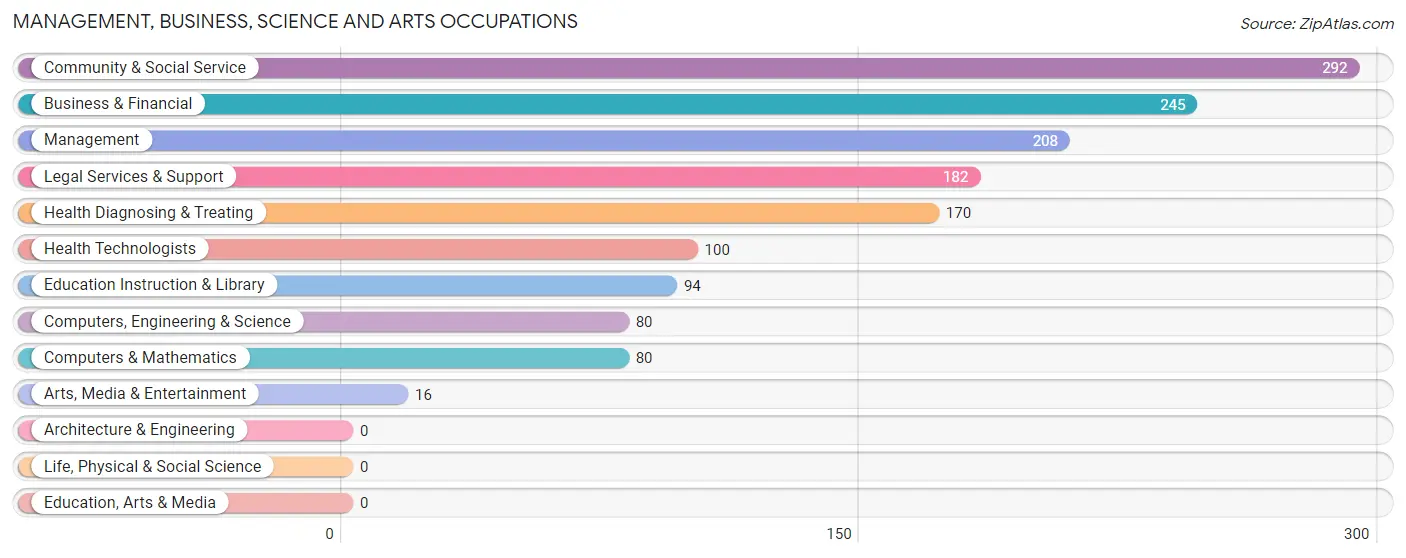
Management, Business, Science and Arts Occupations
The most common Management, Business, Science and Arts occupations in Wimauma are Community & Social Service (292 | 6.3%), Business & Financial (245 | 5.3%), Management (208 | 4.5%), Legal Services & Support (182 | 3.9%), and Health Diagnosing & Treating (170 | 3.7%).
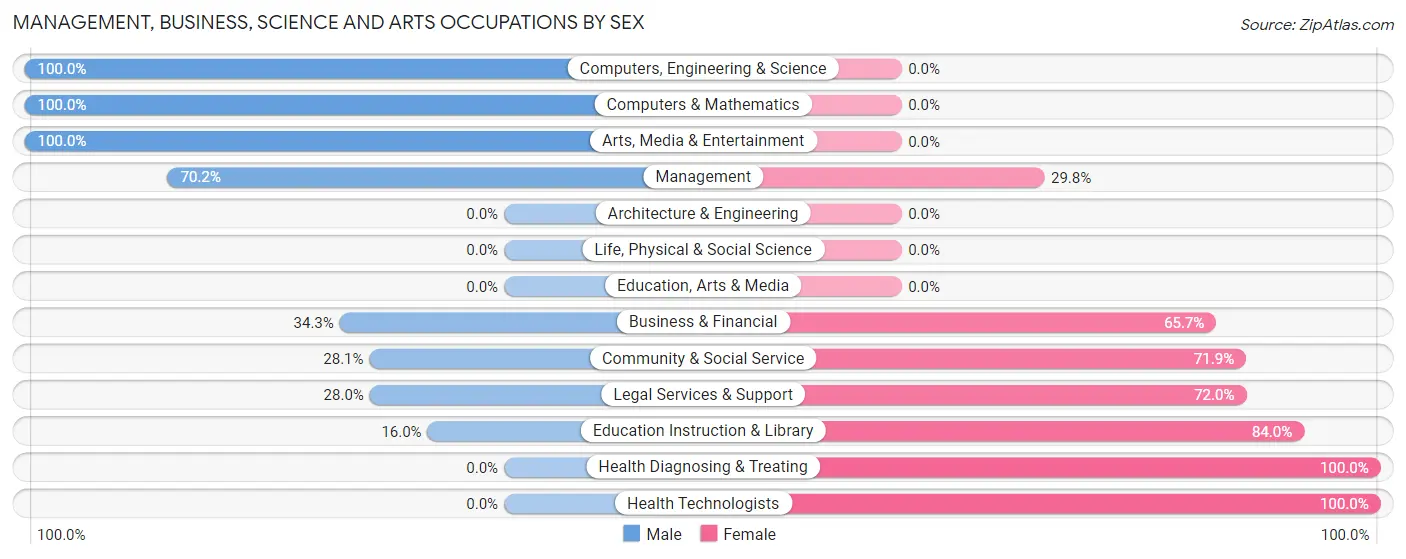
Management, Business, Science and Arts Occupations by Sex
Within the Management, Business, Science and Arts occupations in Wimauma, the most male-oriented occupations are Computers, Engineering & Science (100.0%), Computers & Mathematics (100.0%), and Arts, Media & Entertainment (100.0%), while the most female-oriented occupations are Health Diagnosing & Treating (100.0%), Health Technologists (100.0%), and Education Instruction & Library (84.0%).
| Occupation | Male | Female |
| Management | 146 (70.2%) | 62 (29.8%) |
| Business & Financial | 84 (34.3%) | 161 (65.7%) |
| Computers, Engineering & Science | 80 (100.0%) | 0 (0.0%) |
| Computers & Mathematics | 80 (100.0%) | 0 (0.0%) |
| Architecture & Engineering | 0 (0.0%) | 0 (0.0%) |
| Life, Physical & Social Science | 0 (0.0%) | 0 (0.0%) |
| Community & Social Service | 82 (28.1%) | 210 (71.9%) |
| Education, Arts & Media | 0 (0.0%) | 0 (0.0%) |
| Legal Services & Support | 51 (28.0%) | 131 (72.0%) |
| Education Instruction & Library | 15 (16.0%) | 79 (84.0%) |
| Arts, Media & Entertainment | 16 (100.0%) | 0 (0.0%) |
| Health Diagnosing & Treating | 0 (0.0%) | 170 (100.0%) |
| Health Technologists | 0 (0.0%) | 100 (100.0%) |
| Total (Category) | 392 (39.4%) | 603 (60.6%) |
| Total (Overall) | 2,701 (58.5%) | 1,916 (41.5%) |
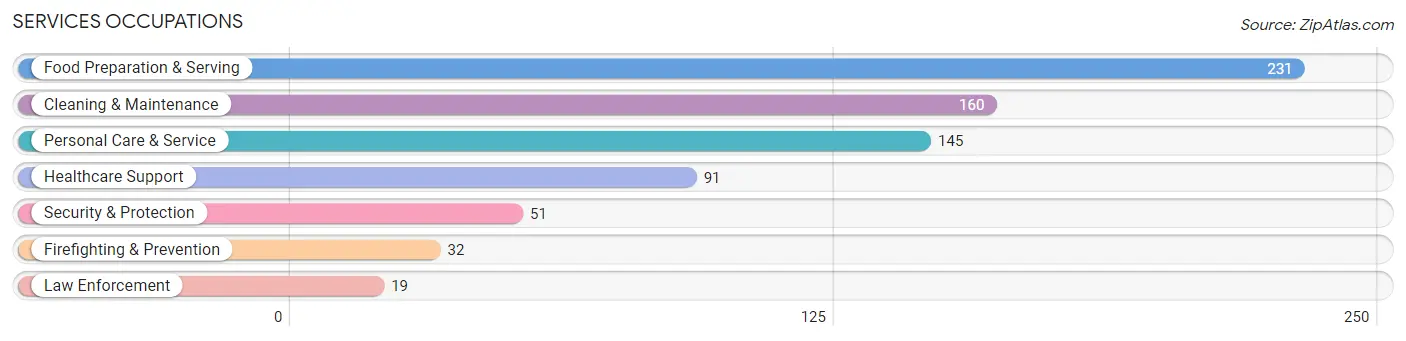
Services Occupations
The most common Services occupations in Wimauma are Food Preparation & Serving (231 | 5.0%), Cleaning & Maintenance (160 | 3.5%), Personal Care & Service (145 | 3.1%), Healthcare Support (91 | 2.0%), and Security & Protection (51 | 1.1%).
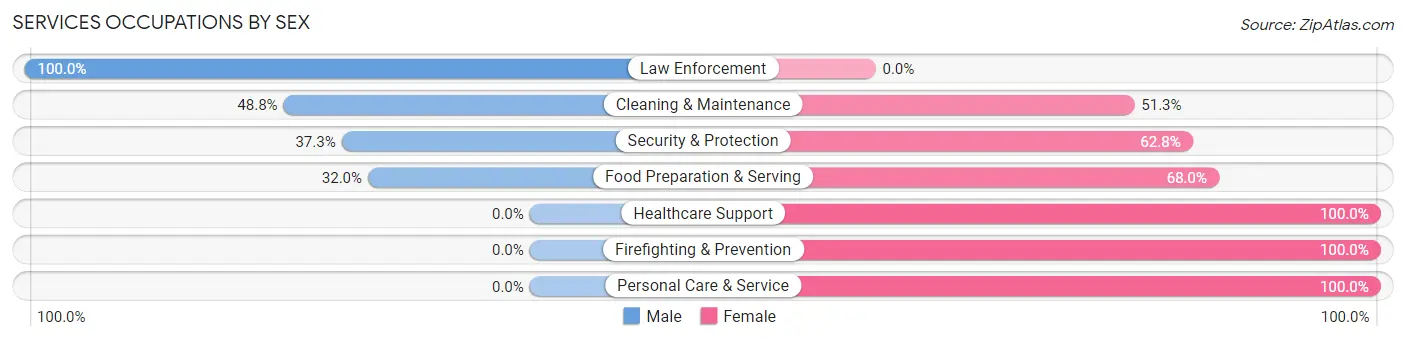
Services Occupations by Sex
Within the Services occupations in Wimauma, the most male-oriented occupations are Law Enforcement (100.0%), Cleaning & Maintenance (48.7%), and Security & Protection (37.2%), while the most female-oriented occupations are Healthcare Support (100.0%), Firefighting & Prevention (100.0%), and Personal Care & Service (100.0%).
| Occupation | Male | Female |
| Healthcare Support | 0 (0.0%) | 91 (100.0%) |
| Security & Protection | 19 (37.2%) | 32 (62.7%) |
| Firefighting & Prevention | 0 (0.0%) | 32 (100.0%) |
| Law Enforcement | 19 (100.0%) | 0 (0.0%) |
| Food Preparation & Serving | 74 (32.0%) | 157 (68.0%) |
| Cleaning & Maintenance | 78 (48.7%) | 82 (51.2%) |
| Personal Care & Service | 0 (0.0%) | 145 (100.0%) |
| Total (Category) | 171 (25.2%) | 507 (74.8%) |
| Total (Overall) | 2,701 (58.5%) | 1,916 (41.5%) |
Sales and Office Occupations
The most common Sales and Office occupations in Wimauma are Sales & Related (310 | 6.7%), and Office & Administration (253 | 5.5%).
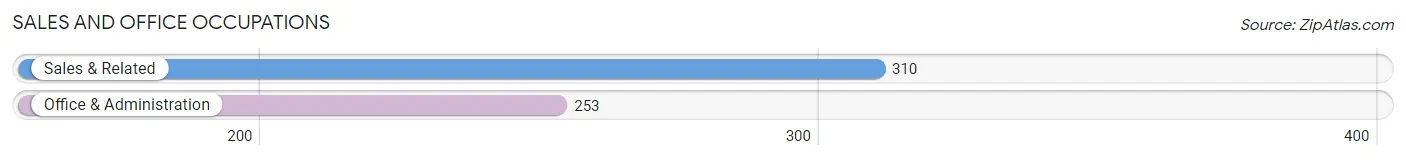
Sales and Office Occupations by Sex
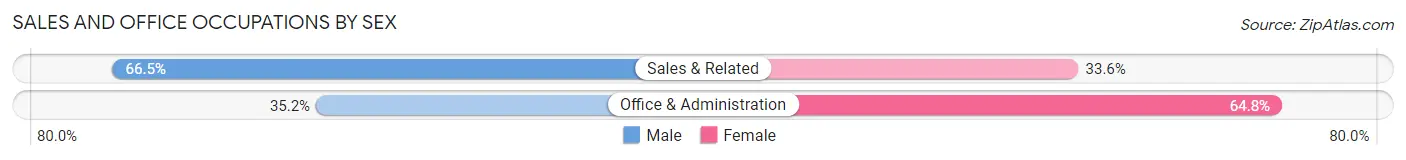
| Occupation | Male | Female |
| Sales & Related | 206 (66.4%) | 104 (33.6%) |
| Office & Administration | 89 (35.2%) | 164 (64.8%) |
| Total (Category) | 295 (52.4%) | 268 (47.6%) |
| Total (Overall) | 2,701 (58.5%) | 1,916 (41.5%) |
Natural Resources, Construction and Maintenance Occupations
The most common Natural Resources, Construction and Maintenance occupations in Wimauma are Farming, Fishing & Forestry (744 | 16.1%), Construction & Extraction (710 | 15.4%), and Installation, Maintenance & Repair (124 | 2.7%).
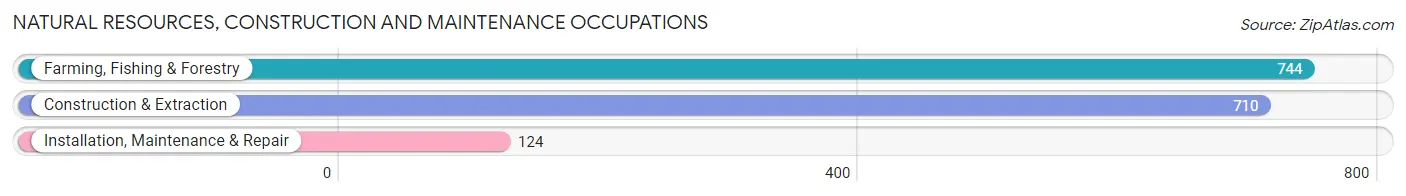
Natural Resources, Construction and Maintenance Occupations by Sex
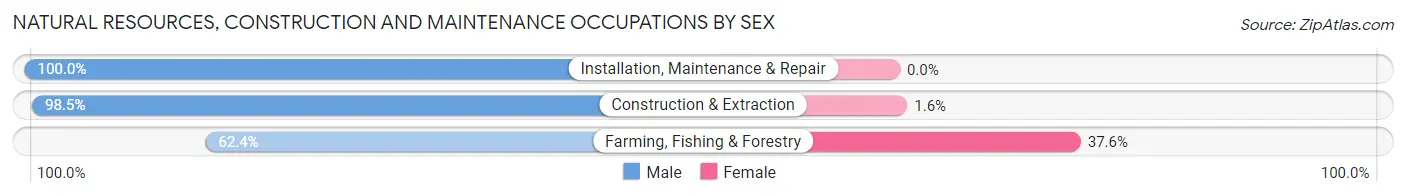
| Occupation | Male | Female |
| Farming, Fishing & Forestry | 464 (62.4%) | 280 (37.6%) |
| Construction & Extraction | 699 (98.5%) | 11 (1.5%) |
| Installation, Maintenance & Repair | 124 (100.0%) | 0 (0.0%) |
| Total (Category) | 1,287 (81.6%) | 291 (18.4%) |
| Total (Overall) | 2,701 (58.5%) | 1,916 (41.5%) |
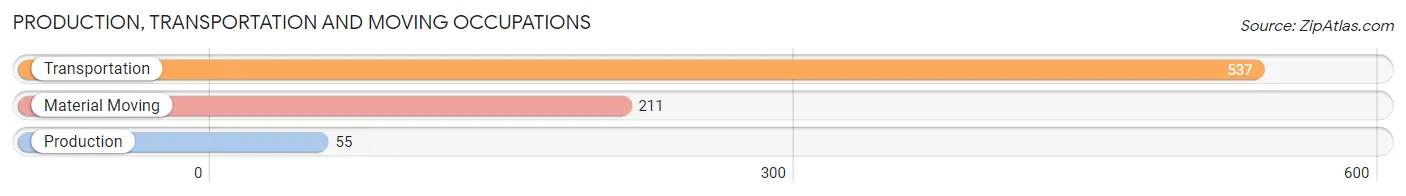
Production, Transportation and Moving Occupations
The most common Production, Transportation and Moving occupations in Wimauma are Transportation (537 | 11.6%), Material Moving (211 | 4.6%), and Production (55 | 1.2%).
Production, Transportation and Moving Occupations by Sex
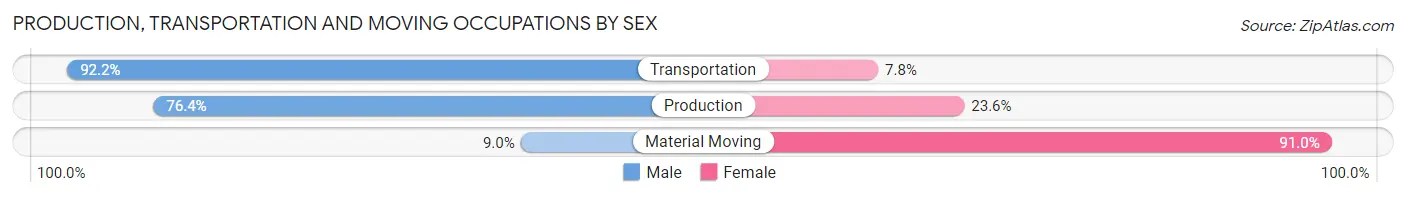
| Occupation | Male | Female |
| Production | 42 (76.4%) | 13 (23.6%) |
| Transportation | 495 (92.2%) | 42 (7.8%) |
| Material Moving | 19 (9.0%) | 192 (91.0%) |
| Total (Category) | 556 (69.2%) | 247 (30.8%) |
| Total (Overall) | 2,701 (58.5%) | 1,916 (41.5%) |
Employment Industries by Sex in Wimauma
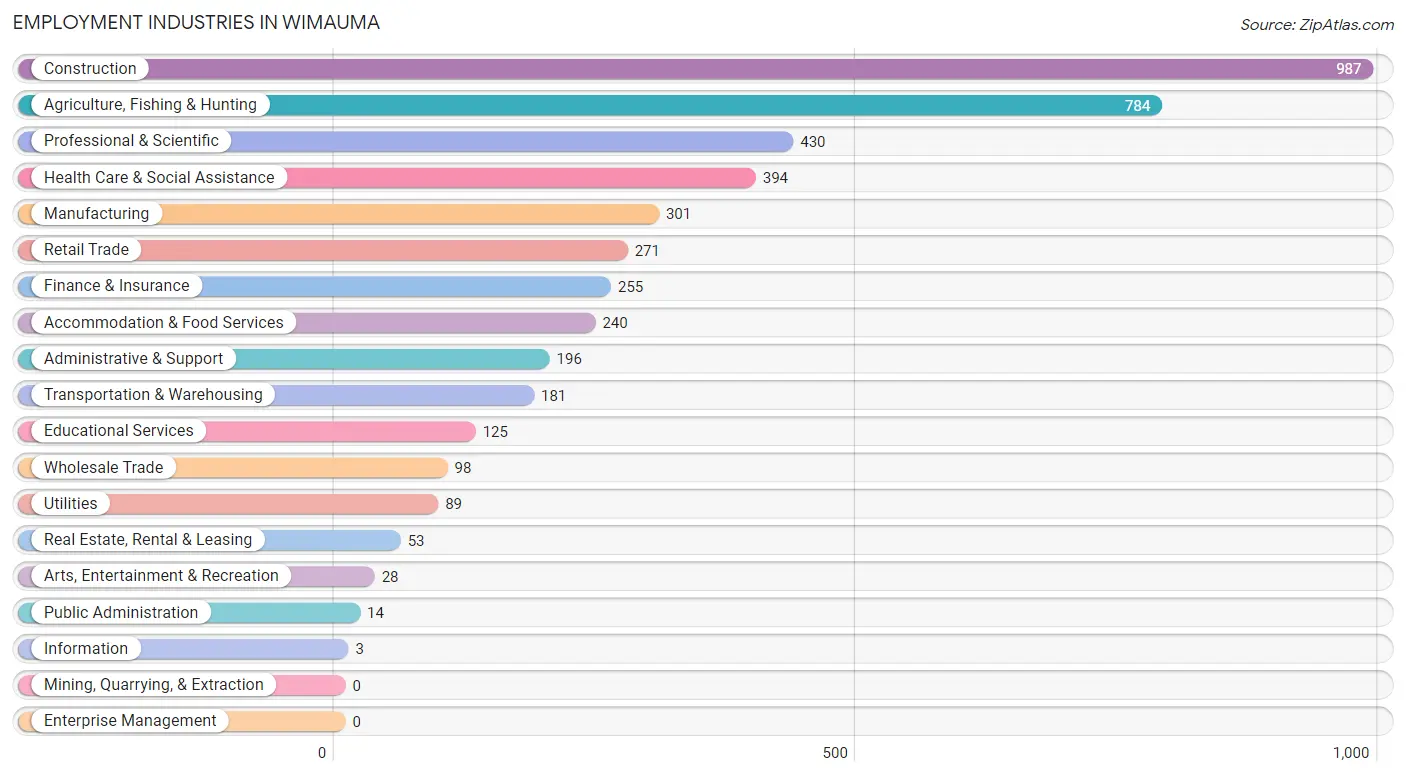
Employment Industries in Wimauma
The major employment industries in Wimauma include Construction (987 | 21.4%), Agriculture, Fishing & Hunting (784 | 17.0%), Professional & Scientific (430 | 9.3%), Health Care & Social Assistance (394 | 8.5%), and Manufacturing (301 | 6.5%).
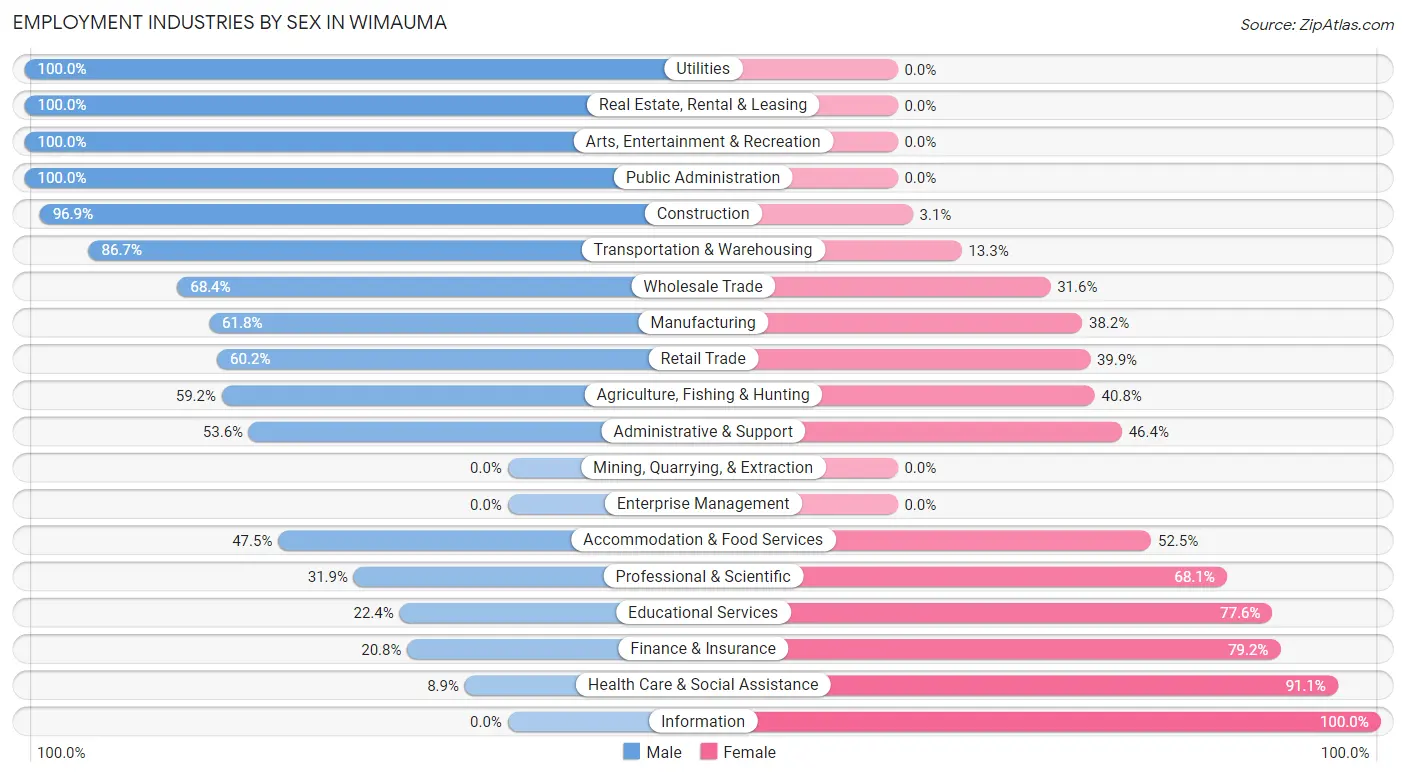
Employment Industries by Sex in Wimauma
The Wimauma industries that see more men than women are Utilities (100.0%), Real Estate, Rental & Leasing (100.0%), and Arts, Entertainment & Recreation (100.0%), whereas the industries that tend to have a higher number of women are Information (100.0%), Health Care & Social Assistance (91.1%), and Finance & Insurance (79.2%).
| Industry | Male | Female |
| Agriculture, Fishing & Hunting | 464 (59.2%) | 320 (40.8%) |
| Mining, Quarrying, & Extraction | 0 (0.0%) | 0 (0.0%) |
| Construction | 956 (96.9%) | 31 (3.1%) |
| Manufacturing | 186 (61.8%) | 115 (38.2%) |
| Wholesale Trade | 67 (68.4%) | 31 (31.6%) |
| Retail Trade | 163 (60.2%) | 108 (39.9%) |
| Transportation & Warehousing | 157 (86.7%) | 24 (13.3%) |
| Utilities | 89 (100.0%) | 0 (0.0%) |
| Information | 0 (0.0%) | 3 (100.0%) |
| Finance & Insurance | 53 (20.8%) | 202 (79.2%) |
| Real Estate, Rental & Leasing | 53 (100.0%) | 0 (0.0%) |
| Professional & Scientific | 137 (31.9%) | 293 (68.1%) |
| Enterprise Management | 0 (0.0%) | 0 (0.0%) |
| Administrative & Support | 105 (53.6%) | 91 (46.4%) |
| Educational Services | 28 (22.4%) | 97 (77.6%) |
| Health Care & Social Assistance | 35 (8.9%) | 359 (91.1%) |
| Arts, Entertainment & Recreation | 28 (100.0%) | 0 (0.0%) |
| Accommodation & Food Services | 114 (47.5%) | 126 (52.5%) |
| Public Administration | 14 (100.0%) | 0 (0.0%) |
| Total | 2,701 (58.5%) | 1,916 (41.5%) |
Education in Wimauma
School Enrollment in Wimauma
The most common levels of schooling among the 4,423 students in Wimauma are elementary school (1,431 | 32.4%), middle school (1,209 | 27.3%), and high school (1,007 | 22.8%).
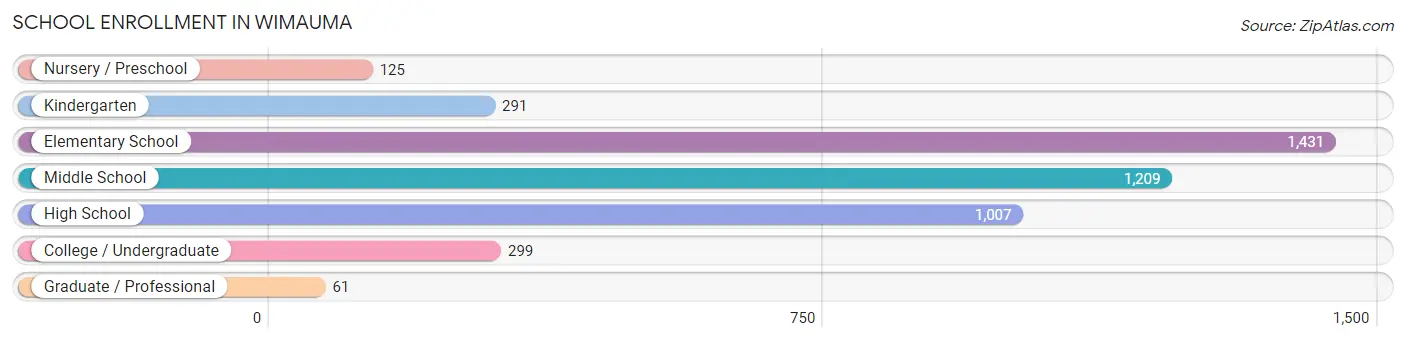
| School Level | # Students | % Students |
| Nursery / Preschool | 125 | 2.8% |
| Kindergarten | 291 | 6.6% |
| Elementary School | 1,431 | 32.4% |
| Middle School | 1,209 | 27.3% |
| High School | 1,007 | 22.8% |
| College / Undergraduate | 299 | 6.8% |
| Graduate / Professional | 61 | 1.4% |
| Total | 4,423 | 100.0% |
School Enrollment by Age by Funding Source in Wimauma
Out of a total of 4,423 students who are enrolled in schools in Wimauma, 217 (4.9%) attend a private institution, while the remaining 4,206 (95.1%) are enrolled in public schools. The age group of 35 years and over has the highest likelihood of being enrolled in private schools, with 8 (100.0% in the age bracket) enrolled. Conversely, the age group of 3 to 4 year olds has the lowest likelihood of being enrolled in a private school, with 39 (100.0% in the age bracket) attending a public institution.
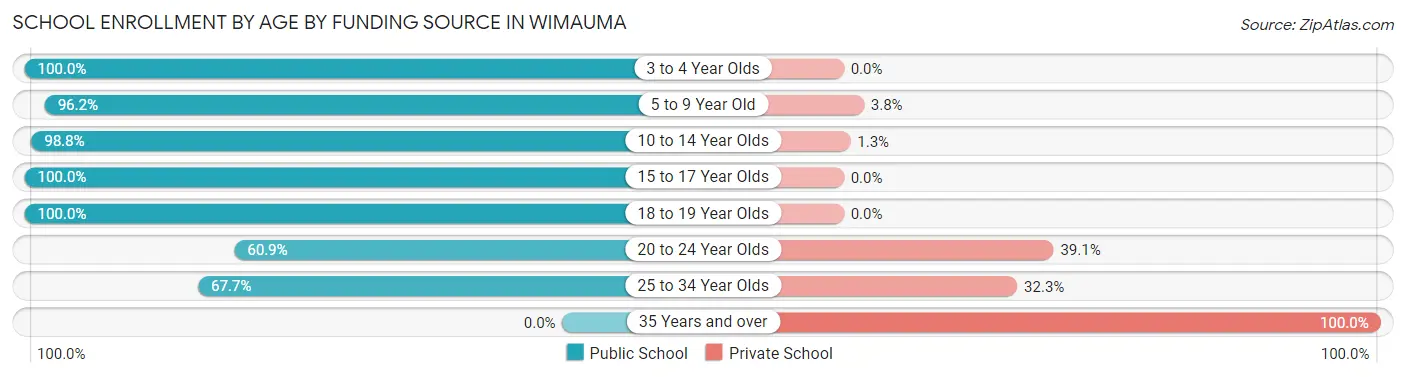
| Age Bracket | Public School | Private School |
| 3 to 4 Year Olds | 39 (100.0%) | 0 (0.0%) |
| 5 to 9 Year Old | 1,560 (96.2%) | 61 (3.8%) |
| 10 to 14 Year Olds | 1,579 (98.8%) | 20 (1.3%) |
| 15 to 17 Year Olds | 741 (100.0%) | 0 (0.0%) |
| 18 to 19 Year Olds | 34 (100.0%) | 0 (0.0%) |
| 20 to 24 Year Olds | 53 (60.9%) | 34 (39.1%) |
| 25 to 34 Year Olds | 199 (67.7%) | 95 (32.3%) |
| 35 Years and over | 0 (0.0%) | 8 (100.0%) |
| Total | 4,206 (95.1%) | 217 (4.9%) |
Educational Attainment by Field of Study in Wimauma
Business (288 | 26.2%), science & technology (183 | 16.7%), arts & humanities (107 | 9.7%), psychology (97 | 8.8%), and physical & health sciences (74 | 6.7%) are the most common fields of study among 1,098 individuals in Wimauma who have obtained a bachelor's degree or higher.
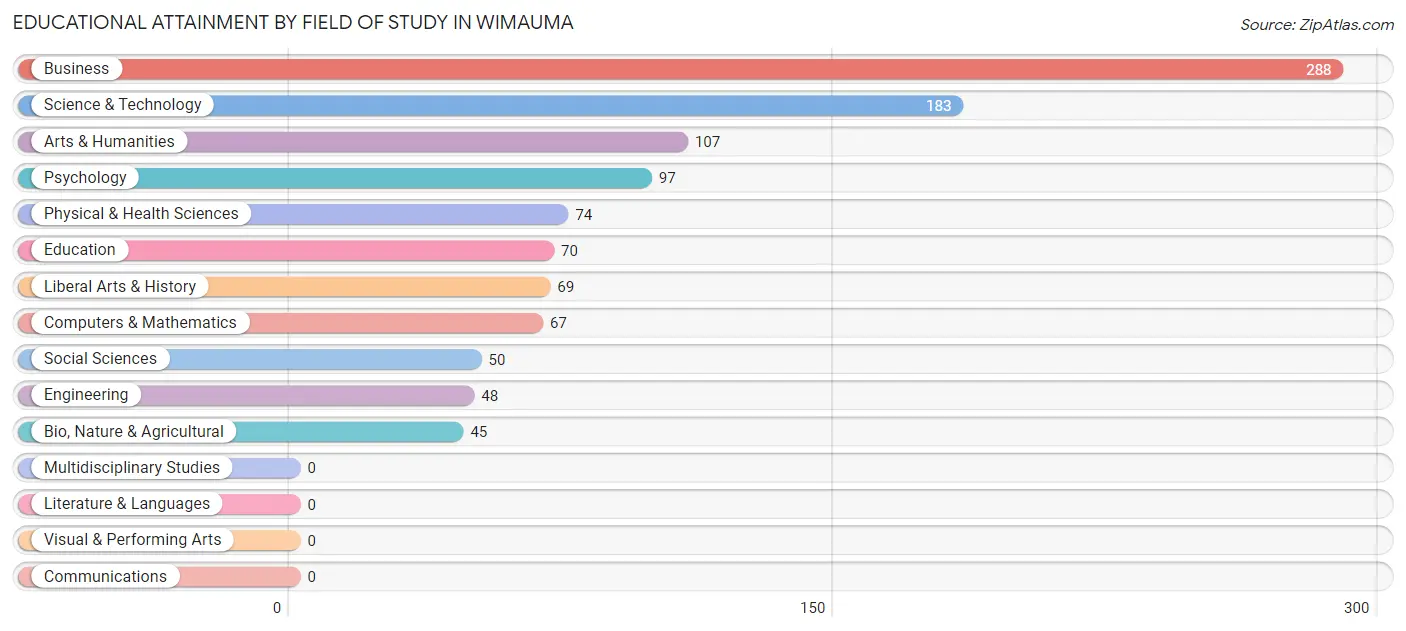
| Field of Study | # Graduates | % Graduates |
| Computers & Mathematics | 67 | 6.1% |
| Bio, Nature & Agricultural | 45 | 4.1% |
| Physical & Health Sciences | 74 | 6.7% |
| Psychology | 97 | 8.8% |
| Social Sciences | 50 | 4.5% |
| Engineering | 48 | 4.4% |
| Multidisciplinary Studies | 0 | 0.0% |
| Science & Technology | 183 | 16.7% |
| Business | 288 | 26.2% |
| Education | 70 | 6.4% |
| Literature & Languages | 0 | 0.0% |
| Liberal Arts & History | 69 | 6.3% |
| Visual & Performing Arts | 0 | 0.0% |
| Communications | 0 | 0.0% |
| Arts & Humanities | 107 | 9.7% |
| Total | 1,098 | 100.0% |
Transportation & Commute in Wimauma
Vehicle Availability by Sex in Wimauma
The most prevalent vehicle ownership categories in Wimauma are males with 2 vehicles (1,423, accounting for 54.8%) and females with 2 vehicles (713, making up 76.8%).
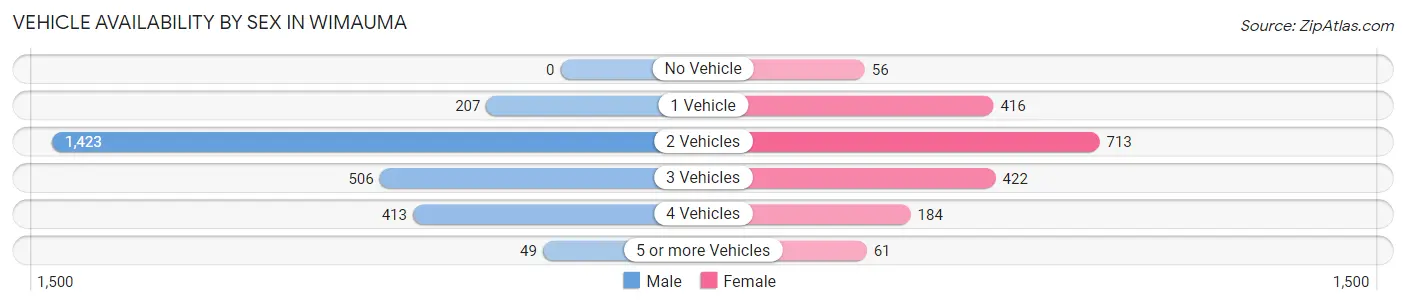
| Vehicles Available | Male | Female |
| No Vehicle | 0 (0.0%) | 56 (3.0%) |
| 1 Vehicle | 207 (8.0%) | 416 (22.5%) |
| 2 Vehicles | 1,423 (54.8%) | 713 (38.5%) |
| 3 Vehicles | 506 (19.5%) | 422 (22.8%) |
| 4 Vehicles | 413 (15.9%) | 184 (9.9%) |
| 5 or more Vehicles | 49 (1.9%) | 61 (3.3%) |
| Total | 2,598 (100.0%) | 1,852 (100.0%) |
Commute Time in Wimauma
The most frequently occuring commute durations in Wimauma are 10 to 14 minutes (636 commuters, 15.8%), 20 to 24 minutes (623 commuters, 15.4%), and 45 to 59 minutes (554 commuters, 13.7%).
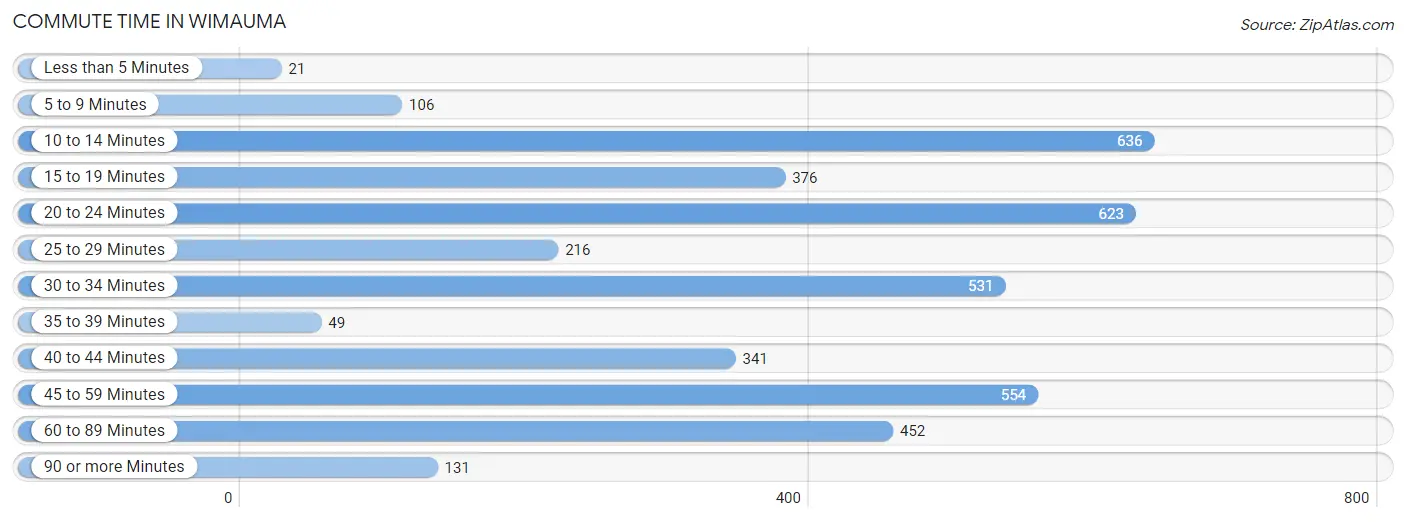
| Commute Time | # Commuters | % Commuters |
| Less than 5 Minutes | 21 | 0.5% |
| 5 to 9 Minutes | 106 | 2.6% |
| 10 to 14 Minutes | 636 | 15.8% |
| 15 to 19 Minutes | 376 | 9.3% |
| 20 to 24 Minutes | 623 | 15.4% |
| 25 to 29 Minutes | 216 | 5.3% |
| 30 to 34 Minutes | 531 | 13.2% |
| 35 to 39 Minutes | 49 | 1.2% |
| 40 to 44 Minutes | 341 | 8.5% |
| 45 to 59 Minutes | 554 | 13.7% |
| 60 to 89 Minutes | 452 | 11.2% |
| 90 or more Minutes | 131 | 3.3% |
Commute Time by Sex in Wimauma
The most common commute times in Wimauma are 10 to 14 minutes (447 commuters, 18.0%) for males and 20 to 24 minutes (259 commuters, 16.7%) for females.
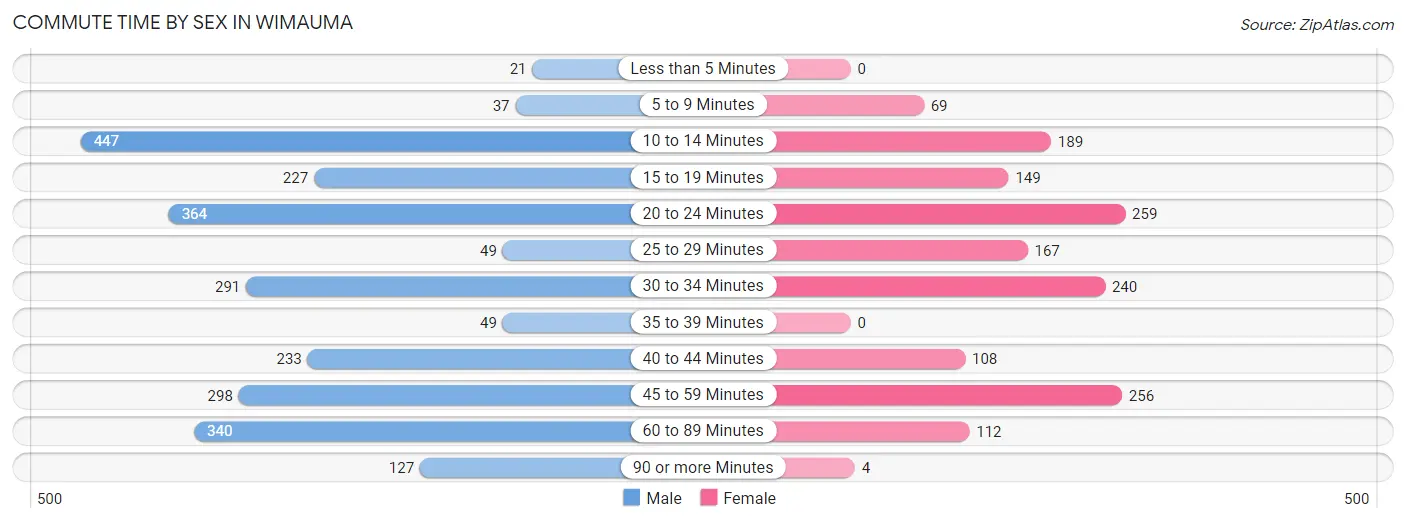
| Commute Time | Male | Female |
| Less than 5 Minutes | 21 (0.9%) | 0 (0.0%) |
| 5 to 9 Minutes | 37 (1.5%) | 69 (4.4%) |
| 10 to 14 Minutes | 447 (18.0%) | 189 (12.2%) |
| 15 to 19 Minutes | 227 (9.1%) | 149 (9.6%) |
| 20 to 24 Minutes | 364 (14.7%) | 259 (16.7%) |
| 25 to 29 Minutes | 49 (2.0%) | 167 (10.7%) |
| 30 to 34 Minutes | 291 (11.7%) | 240 (15.4%) |
| 35 to 39 Minutes | 49 (2.0%) | 0 (0.0%) |
| 40 to 44 Minutes | 233 (9.4%) | 108 (7.0%) |
| 45 to 59 Minutes | 298 (12.0%) | 256 (16.5%) |
| 60 to 89 Minutes | 340 (13.7%) | 112 (7.2%) |
| 90 or more Minutes | 127 (5.1%) | 4 (0.3%) |
Time of Departure to Work by Sex in Wimauma
The most frequent times of departure to work in Wimauma are 6:00 AM to 6:29 AM (512, 20.6%) for males and 7:00 AM to 7:29 AM (288, 18.5%) for females.
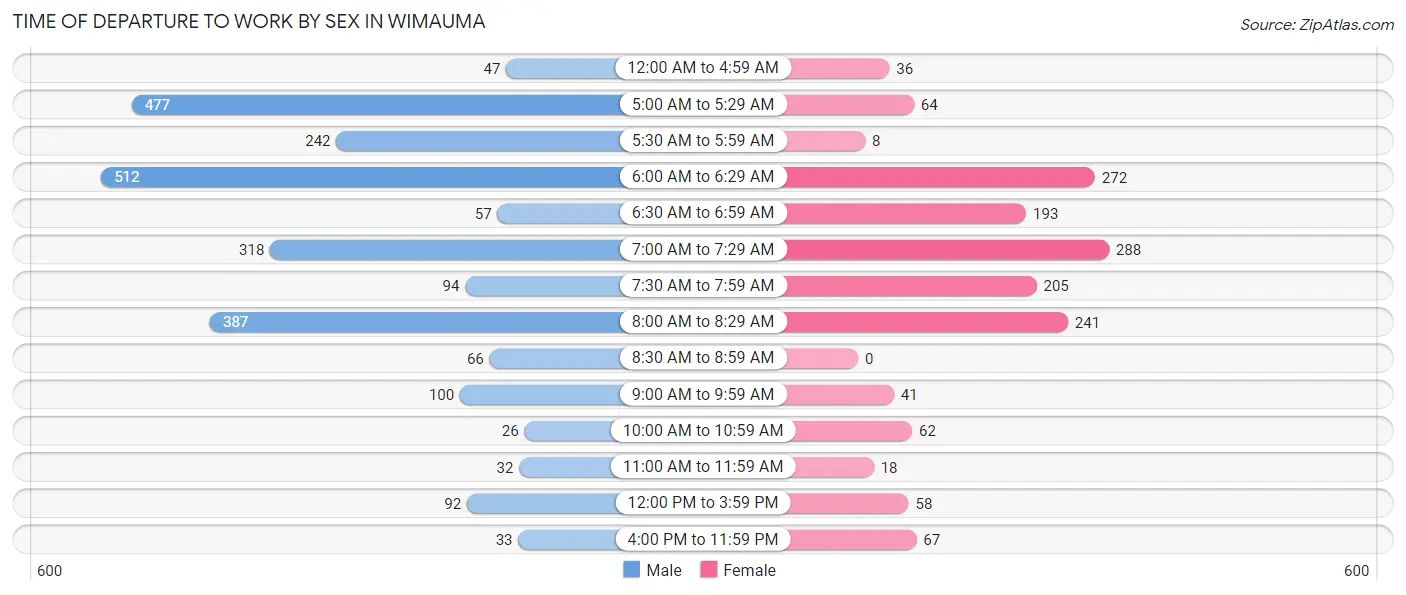
| Time of Departure | Male | Female |
| 12:00 AM to 4:59 AM | 47 (1.9%) | 36 (2.3%) |
| 5:00 AM to 5:29 AM | 477 (19.2%) | 64 (4.1%) |
| 5:30 AM to 5:59 AM | 242 (9.8%) | 8 (0.5%) |
| 6:00 AM to 6:29 AM | 512 (20.6%) | 272 (17.5%) |
| 6:30 AM to 6:59 AM | 57 (2.3%) | 193 (12.4%) |
| 7:00 AM to 7:29 AM | 318 (12.8%) | 288 (18.5%) |
| 7:30 AM to 7:59 AM | 94 (3.8%) | 205 (13.2%) |
| 8:00 AM to 8:29 AM | 387 (15.6%) | 241 (15.5%) |
| 8:30 AM to 8:59 AM | 66 (2.7%) | 0 (0.0%) |
| 9:00 AM to 9:59 AM | 100 (4.0%) | 41 (2.6%) |
| 10:00 AM to 10:59 AM | 26 (1.1%) | 62 (4.0%) |
| 11:00 AM to 11:59 AM | 32 (1.3%) | 18 (1.2%) |
| 12:00 PM to 3:59 PM | 92 (3.7%) | 58 (3.7%) |
| 4:00 PM to 11:59 PM | 33 (1.3%) | 67 (4.3%) |
| Total | 2,483 (100.0%) | 1,553 (100.0%) |
Housing Occupancy in Wimauma
Occupancy by Ownership in Wimauma
Of the total 3,033 dwellings in Wimauma, owner-occupied units account for 2,250 (74.2%), while renter-occupied units make up 783 (25.8%).
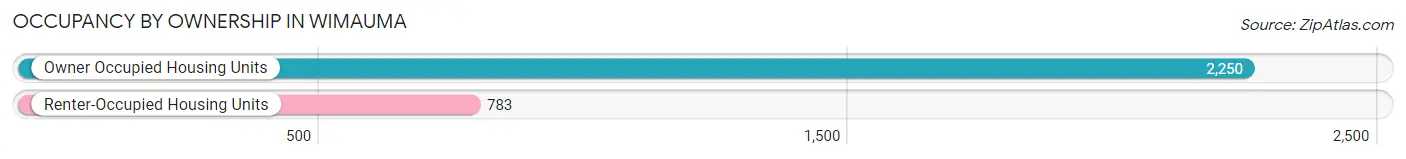
| Occupancy | # Housing Units | % Housing Units |
| Owner Occupied Housing Units | 2,250 | 74.2% |
| Renter-Occupied Housing Units | 783 | 25.8% |
| Total Occupied Housing Units | 3,033 | 100.0% |
Occupancy by Household Size in Wimauma
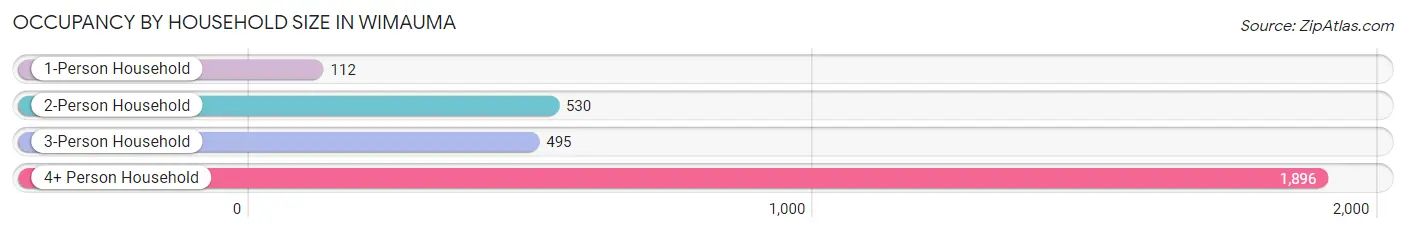
| Household Size | # Housing Units | % Housing Units |
| 1-Person Household | 112 | 3.7% |
| 2-Person Household | 530 | 17.5% |
| 3-Person Household | 495 | 16.3% |
| 4+ Person Household | 1,896 | 62.5% |
| Total Housing Units | 3,033 | 100.0% |
Occupancy by Ownership by Household Size in Wimauma
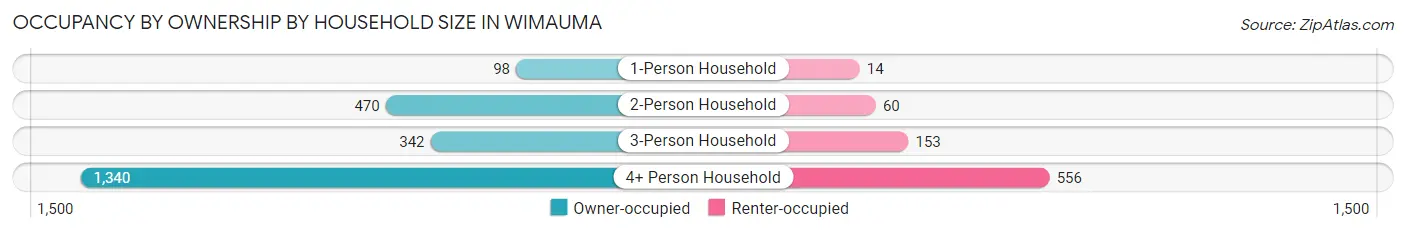
| Household Size | Owner-occupied | Renter-occupied |
| 1-Person Household | 98 (87.5%) | 14 (12.5%) |
| 2-Person Household | 470 (88.7%) | 60 (11.3%) |
| 3-Person Household | 342 (69.1%) | 153 (30.9%) |
| 4+ Person Household | 1,340 (70.7%) | 556 (29.3%) |
| Total Housing Units | 2,250 (74.2%) | 783 (25.8%) |
Occupancy by Educational Attainment in Wimauma
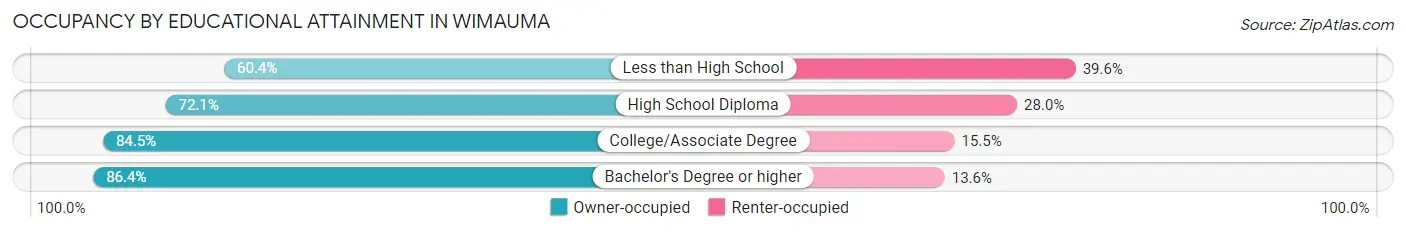
| Household Size | Owner-occupied | Renter-occupied |
| Less than High School | 547 (60.4%) | 358 (39.6%) |
| High School Diploma | 616 (72.1%) | 239 (28.0%) |
| College/Associate Degree | 560 (84.5%) | 103 (15.5%) |
| Bachelor's Degree or higher | 527 (86.4%) | 83 (13.6%) |
Occupancy by Age of Householder in Wimauma
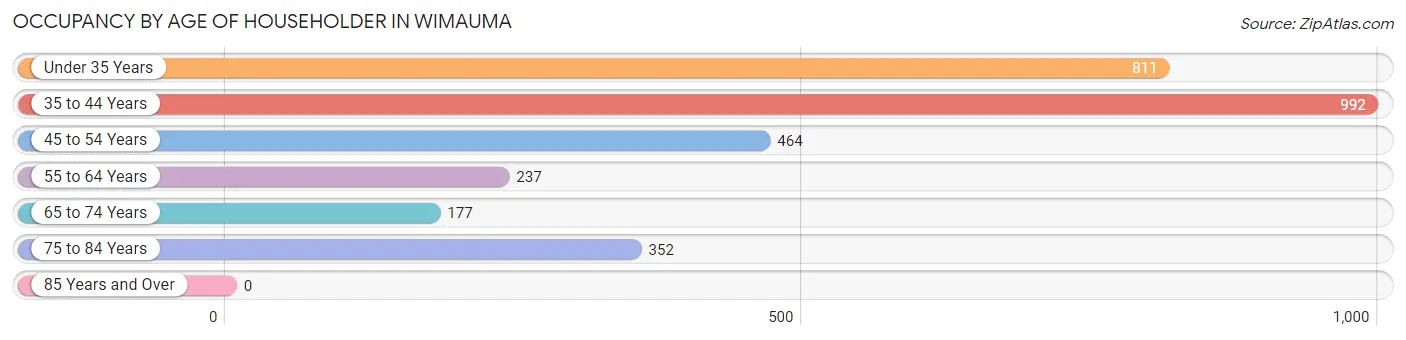
| Age Bracket | # Households | % Households |
| Under 35 Years | 811 | 26.7% |
| 35 to 44 Years | 992 | 32.7% |
| 45 to 54 Years | 464 | 15.3% |
| 55 to 64 Years | 237 | 7.8% |
| 65 to 74 Years | 177 | 5.8% |
| 75 to 84 Years | 352 | 11.6% |
| 85 Years and Over | 0 | 0.0% |
| Total | 3,033 | 100.0% |
Housing Finances in Wimauma
Median Income by Occupancy in Wimauma
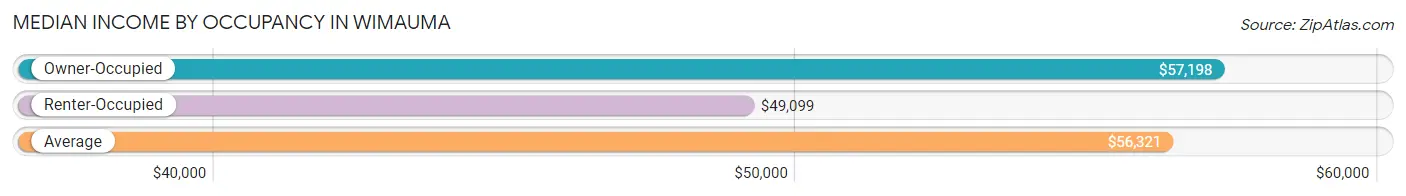
| Occupancy Type | # Households | Median Income |
| Owner-Occupied | 2,250 (74.2%) | $57,198 |
| Renter-Occupied | 783 (25.8%) | $49,099 |
| Average | 3,033 (100.0%) | $56,321 |
Occupancy by Householder Income Bracket in Wimauma
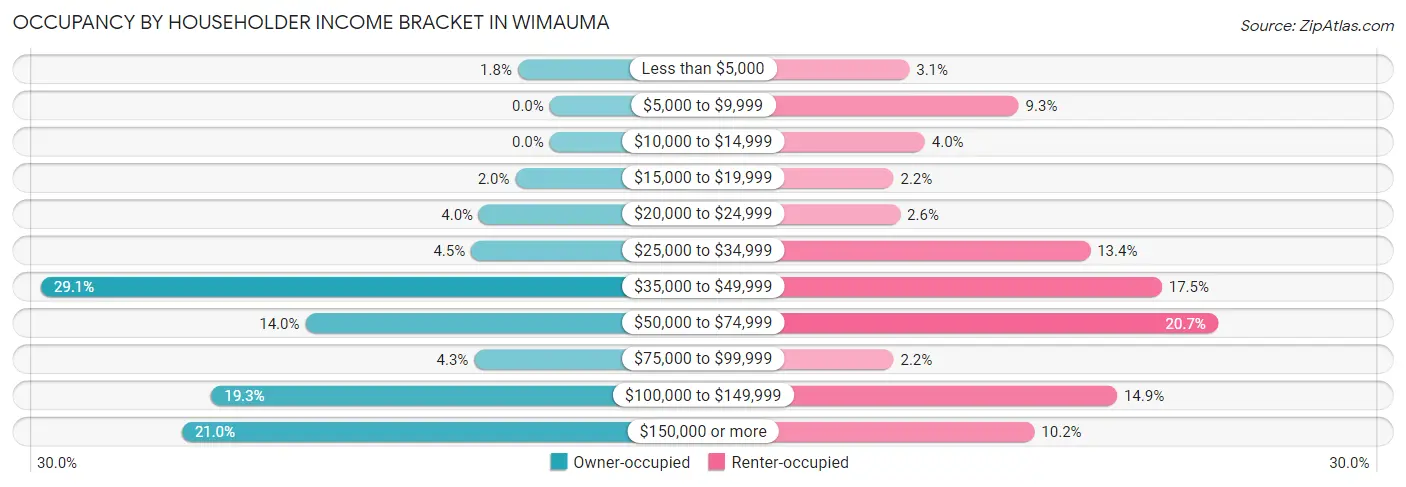
| Income Bracket | Owner-occupied | Renter-occupied |
| Less than $5,000 | 41 (1.8%) | 24 (3.1%) |
| $5,000 to $9,999 | 0 (0.0%) | 73 (9.3%) |
| $10,000 to $14,999 | 0 (0.0%) | 31 (4.0%) |
| $15,000 to $19,999 | 44 (2.0%) | 17 (2.2%) |
| $20,000 to $24,999 | 91 (4.0%) | 20 (2.5%) |
| $25,000 to $34,999 | 101 (4.5%) | 105 (13.4%) |
| $35,000 to $49,999 | 654 (29.1%) | 137 (17.5%) |
| $50,000 to $74,999 | 314 (14.0%) | 162 (20.7%) |
| $75,000 to $99,999 | 97 (4.3%) | 17 (2.2%) |
| $100,000 to $149,999 | 435 (19.3%) | 117 (14.9%) |
| $150,000 or more | 473 (21.0%) | 80 (10.2%) |
| Total | 2,250 (100.0%) | 783 (100.0%) |
Monthly Housing Cost Tiers in Wimauma
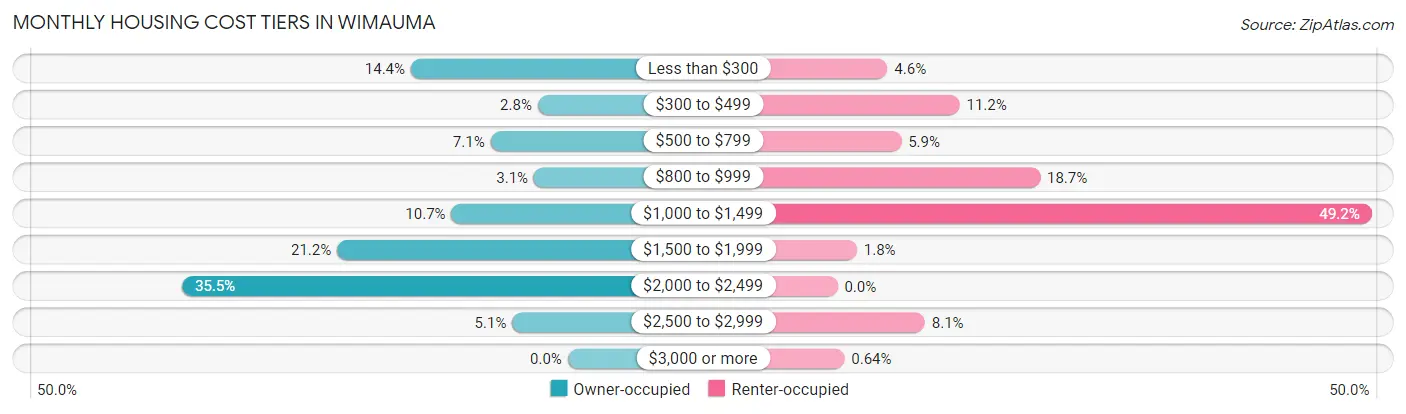
| Monthly Cost | Owner-occupied | Renter-occupied |
| Less than $300 | 325 (14.4%) | 36 (4.6%) |
| $300 to $499 | 62 (2.8%) | 88 (11.2%) |
| $500 to $799 | 160 (7.1%) | 46 (5.9%) |
| $800 to $999 | 70 (3.1%) | 146 (18.6%) |
| $1,000 to $1,499 | 241 (10.7%) | 385 (49.2%) |
| $1,500 to $1,999 | 478 (21.2%) | 14 (1.8%) |
| $2,000 to $2,499 | 799 (35.5%) | 0 (0.0%) |
| $2,500 to $2,999 | 115 (5.1%) | 63 (8.1%) |
| $3,000 or more | 0 (0.0%) | 5 (0.6%) |
| Total | 2,250 (100.0%) | 783 (100.0%) |
Physical Housing Characteristics in Wimauma
Housing Structures in Wimauma
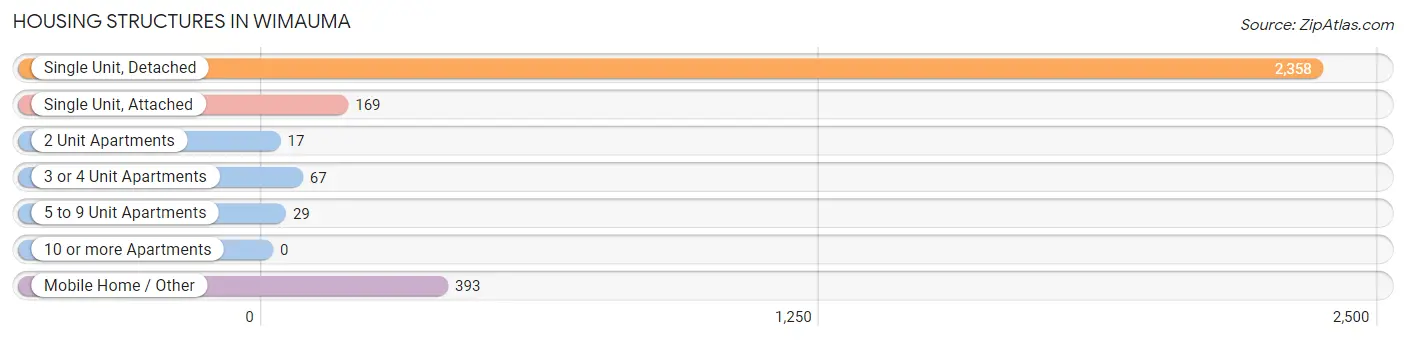
| Structure Type | # Housing Units | % Housing Units |
| Single Unit, Detached | 2,358 | 77.7% |
| Single Unit, Attached | 169 | 5.6% |
| 2 Unit Apartments | 17 | 0.6% |
| 3 or 4 Unit Apartments | 67 | 2.2% |
| 5 to 9 Unit Apartments | 29 | 1.0% |
| 10 or more Apartments | 0 | 0.0% |
| Mobile Home / Other | 393 | 13.0% |
| Total | 3,033 | 100.0% |
Housing Structures by Occupancy in Wimauma
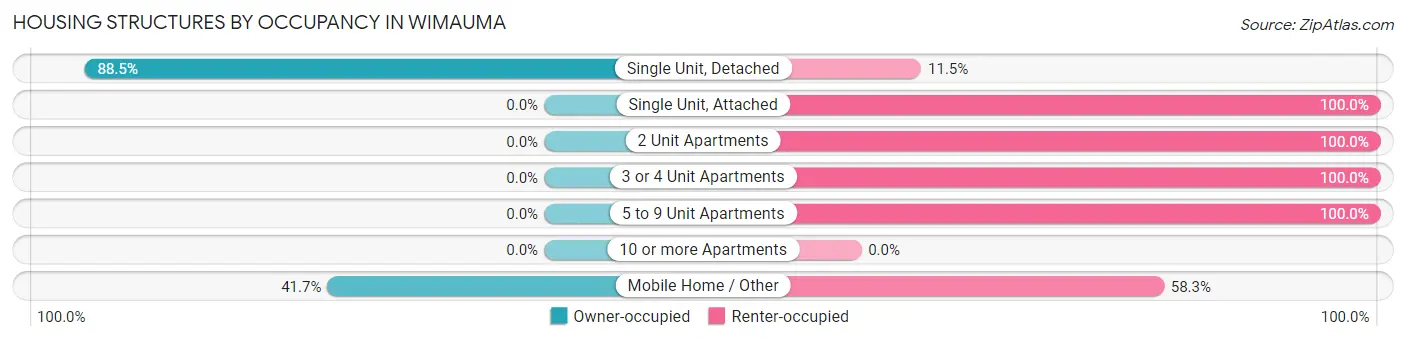
| Structure Type | Owner-occupied | Renter-occupied |
| Single Unit, Detached | 2,086 (88.5%) | 272 (11.5%) |
| Single Unit, Attached | 0 (0.0%) | 169 (100.0%) |
| 2 Unit Apartments | 0 (0.0%) | 17 (100.0%) |
| 3 or 4 Unit Apartments | 0 (0.0%) | 67 (100.0%) |
| 5 to 9 Unit Apartments | 0 (0.0%) | 29 (100.0%) |
| 10 or more Apartments | 0 (0.0%) | 0 (0.0%) |
| Mobile Home / Other | 164 (41.7%) | 229 (58.3%) |
| Total | 2,250 (74.2%) | 783 (25.8%) |
Housing Structures by Number of Rooms in Wimauma
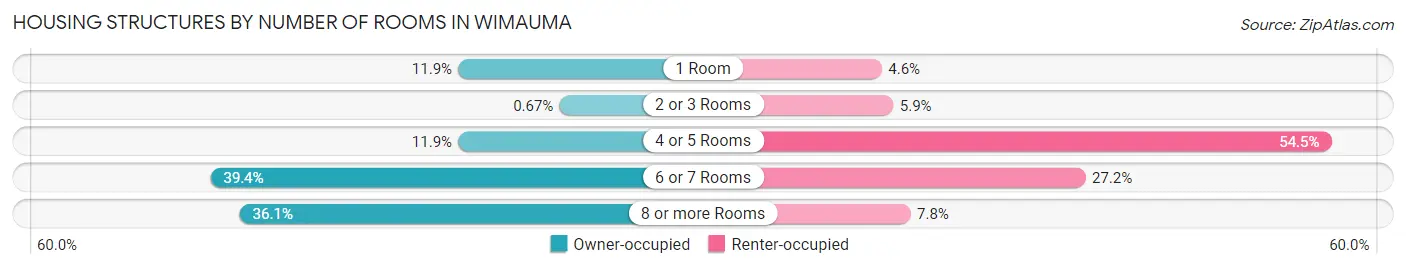
| Number of Rooms | Owner-occupied | Renter-occupied |
| 1 Room | 268 (11.9%) | 36 (4.6%) |
| 2 or 3 Rooms | 15 (0.7%) | 46 (5.9%) |
| 4 or 5 Rooms | 268 (11.9%) | 427 (54.5%) |
| 6 or 7 Rooms | 886 (39.4%) | 213 (27.2%) |
| 8 or more Rooms | 813 (36.1%) | 61 (7.8%) |
| Total | 2,250 (100.0%) | 783 (100.0%) |
Housing Structure by Heating Type in Wimauma
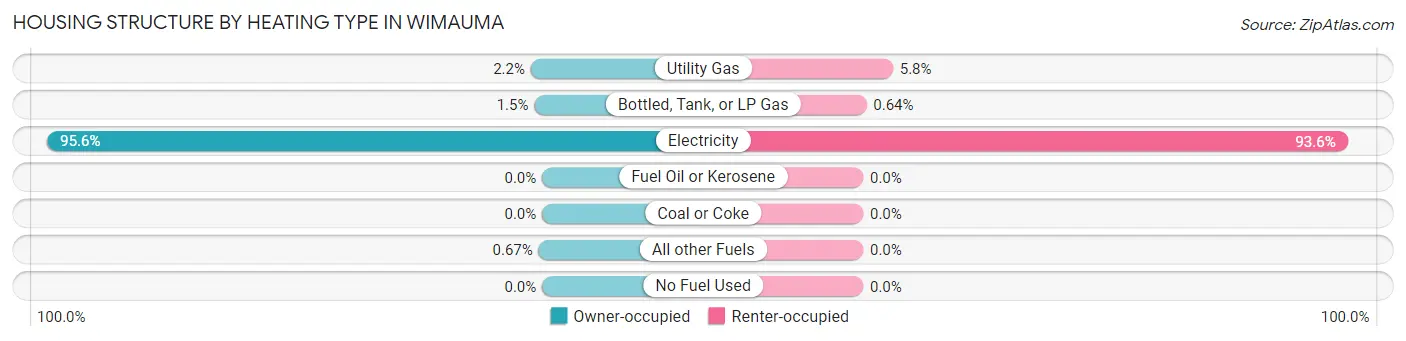
| Heating Type | Owner-occupied | Renter-occupied |
| Utility Gas | 49 (2.2%) | 45 (5.8%) |
| Bottled, Tank, or LP Gas | 34 (1.5%) | 5 (0.6%) |
| Electricity | 2,152 (95.6%) | 733 (93.6%) |
| Fuel Oil or Kerosene | 0 (0.0%) | 0 (0.0%) |
| Coal or Coke | 0 (0.0%) | 0 (0.0%) |
| All other Fuels | 15 (0.7%) | 0 (0.0%) |
| No Fuel Used | 0 (0.0%) | 0 (0.0%) |
| Total | 2,250 (100.0%) | 783 (100.0%) |
Household Vehicle Usage in Wimauma
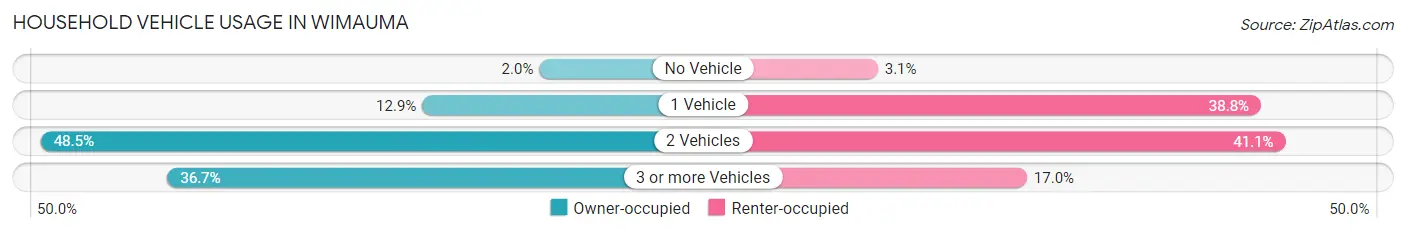
| Vehicles per Household | Owner-occupied | Renter-occupied |
| No Vehicle | 44 (2.0%) | 24 (3.1%) |
| 1 Vehicle | 290 (12.9%) | 304 (38.8%) |
| 2 Vehicles | 1,091 (48.5%) | 322 (41.1%) |
| 3 or more Vehicles | 825 (36.7%) | 133 (17.0%) |
| Total | 2,250 (100.0%) | 783 (100.0%) |
Real Estate & Mortgages in Wimauma
Real Estate and Mortgage Overview in Wimauma
| Characteristic | Without Mortgage | With Mortgage |
| Housing Units | 573 | 1,677 |
| Median Property Value | - | - |
| Median Household Income | $46,749 | $439 |
| Monthly Housing Costs | - | - |
| Real Estate Taxes | $1,341 | $96 |
Property Value by Mortgage Status in Wimauma
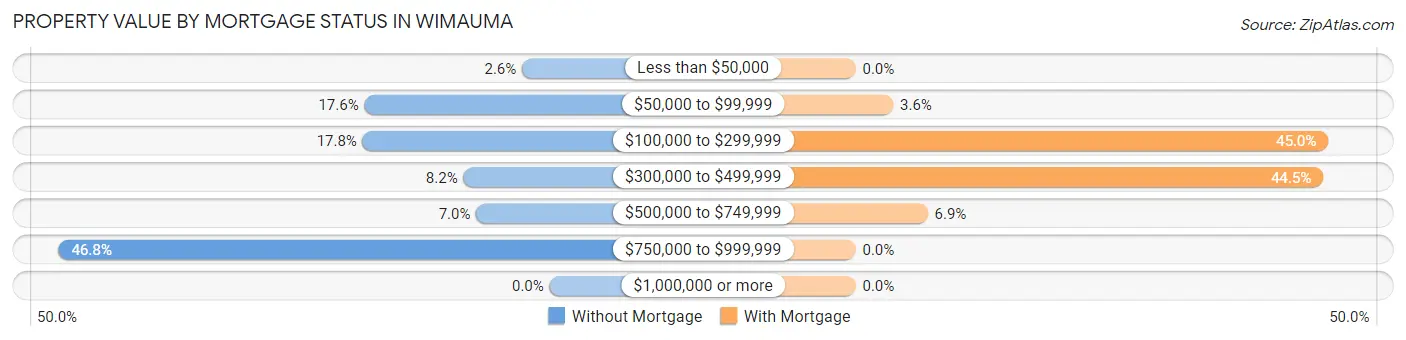
| Property Value | Without Mortgage | With Mortgage |
| Less than $50,000 | 15 (2.6%) | 0 (0.0%) |
| $50,000 to $99,999 | 101 (17.6%) | 60 (3.6%) |
| $100,000 to $299,999 | 102 (17.8%) | 755 (45.0%) |
| $300,000 to $499,999 | 47 (8.2%) | 747 (44.5%) |
| $500,000 to $749,999 | 40 (7.0%) | 115 (6.9%) |
| $750,000 to $999,999 | 268 (46.8%) | 0 (0.0%) |
| $1,000,000 or more | 0 (0.0%) | 0 (0.0%) |
| Total | 573 (100.0%) | 1,677 (100.0%) |
Household Income by Mortgage Status in Wimauma
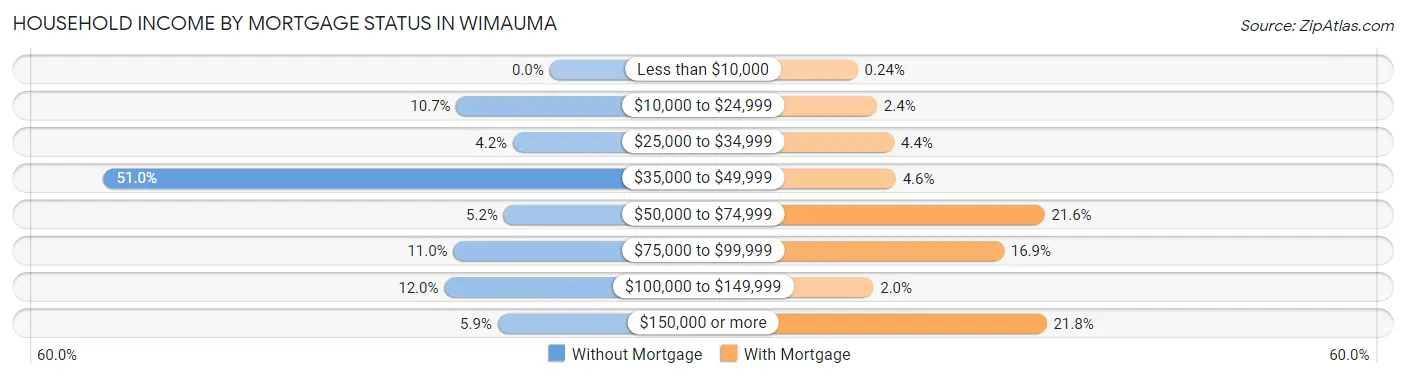
| Household Income | Without Mortgage | With Mortgage |
| Less than $10,000 | 0 (0.0%) | 4 (0.2%) |
| $10,000 to $24,999 | 61 (10.6%) | 41 (2.4%) |
| $25,000 to $34,999 | 24 (4.2%) | 74 (4.4%) |
| $35,000 to $49,999 | 292 (51.0%) | 77 (4.6%) |
| $50,000 to $74,999 | 30 (5.2%) | 362 (21.6%) |
| $75,000 to $99,999 | 63 (11.0%) | 284 (16.9%) |
| $100,000 to $149,999 | 69 (12.0%) | 34 (2.0%) |
| $150,000 or more | 34 (5.9%) | 366 (21.8%) |
| Total | 573 (100.0%) | 1,677 (100.0%) |
Property Value to Household Income Ratio in Wimauma
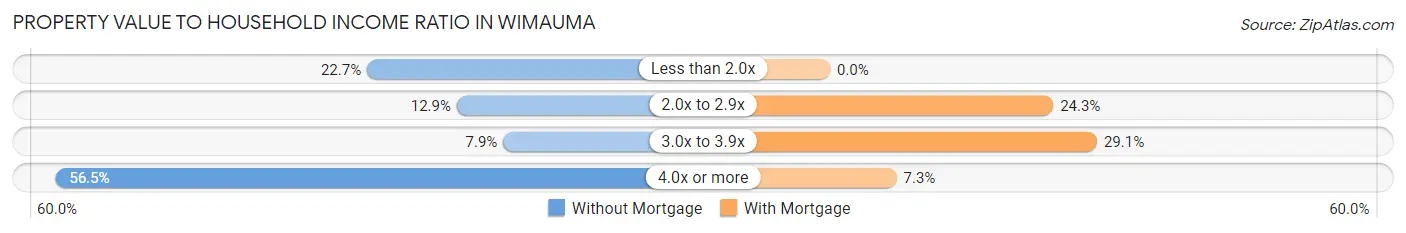
| Value-to-Income Ratio | Without Mortgage | With Mortgage |
| Less than 2.0x | 130 (22.7%) | 0 (0.0%) |
| 2.0x to 2.9x | 74 (12.9%) | 408 (24.3%) |
| 3.0x to 3.9x | 45 (7.9%) | 488 (29.1%) |
| 4.0x or more | 324 (56.5%) | 122 (7.3%) |
| Total | 573 (100.0%) | 1,677 (100.0%) |
Real Estate Taxes by Mortgage Status in Wimauma
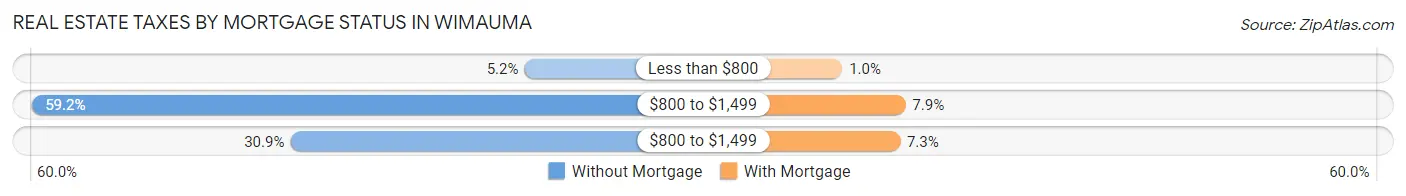
| Property Taxes | Without Mortgage | With Mortgage |
| Less than $800 | 30 (5.2%) | 17 (1.0%) |
| $800 to $1,499 | 339 (59.2%) | 133 (7.9%) |
| $800 to $1,499 | 177 (30.9%) | 123 (7.3%) |
| Total | 573 (100.0%) | 1,677 (100.0%) |
Health & Disability in Wimauma
Health Insurance Coverage by Age in Wimauma
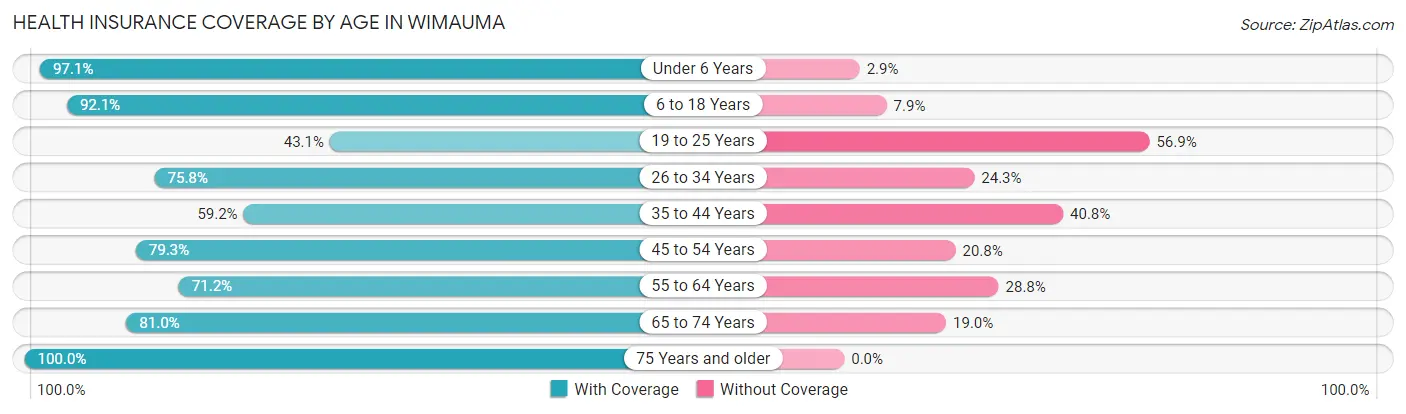
| Age Bracket | With Coverage | Without Coverage |
| Under 6 Years | 1,515 (97.1%) | 45 (2.9%) |
| 6 to 18 Years | 3,498 (92.1%) | 300 (7.9%) |
| 19 to 25 Years | 405 (43.1%) | 535 (56.9%) |
| 26 to 34 Years | 1,140 (75.7%) | 365 (24.2%) |
| 35 to 44 Years | 1,105 (59.2%) | 762 (40.8%) |
| 45 to 54 Years | 867 (79.2%) | 227 (20.7%) |
| 55 to 64 Years | 485 (71.2%) | 196 (28.8%) |
| 65 to 74 Years | 354 (81.0%) | 83 (19.0%) |
| 75 Years and older | 539 (100.0%) | 0 (0.0%) |
| Total | 9,908 (79.8%) | 2,513 (20.2%) |
Health Insurance Coverage by Citizenship Status in Wimauma
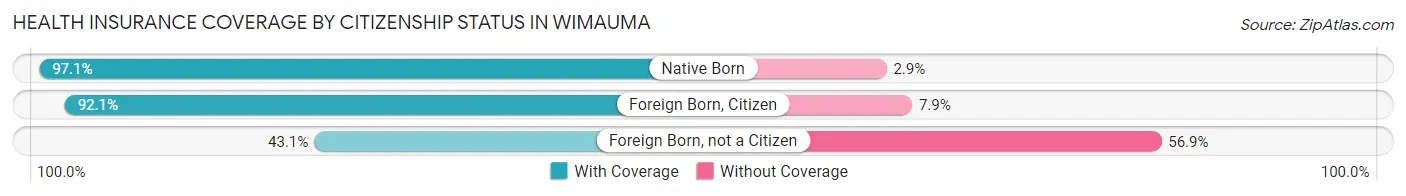
| Citizenship Status | With Coverage | Without Coverage |
| Native Born | 1,515 (97.1%) | 45 (2.9%) |
| Foreign Born, Citizen | 3,498 (92.1%) | 300 (7.9%) |
| Foreign Born, not a Citizen | 405 (43.1%) | 535 (56.9%) |
Health Insurance Coverage by Household Income in Wimauma
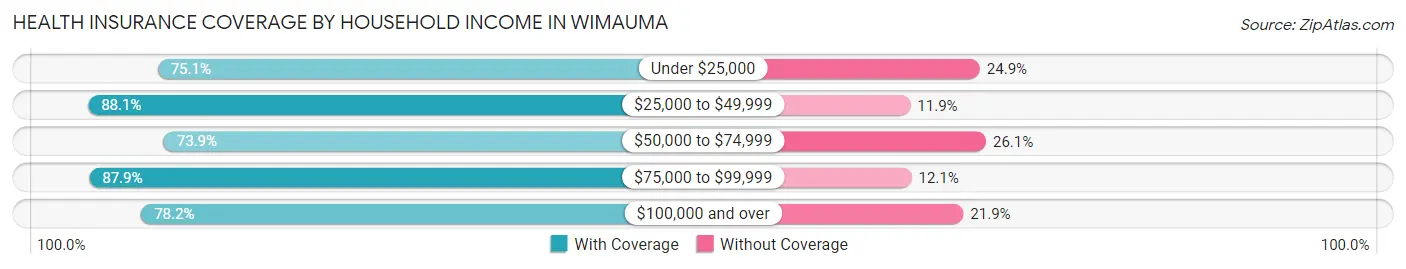
| Household Income | With Coverage | Without Coverage |
| Under $25,000 | 981 (75.1%) | 326 (24.9%) |
| $25,000 to $49,999 | 3,295 (88.1%) | 446 (11.9%) |
| $50,000 to $74,999 | 1,547 (73.9%) | 546 (26.1%) |
| $75,000 to $99,999 | 355 (87.9%) | 49 (12.1%) |
| $100,000 and over | 3,730 (78.1%) | 1,043 (21.8%) |
Public vs Private Health Insurance Coverage by Age in Wimauma
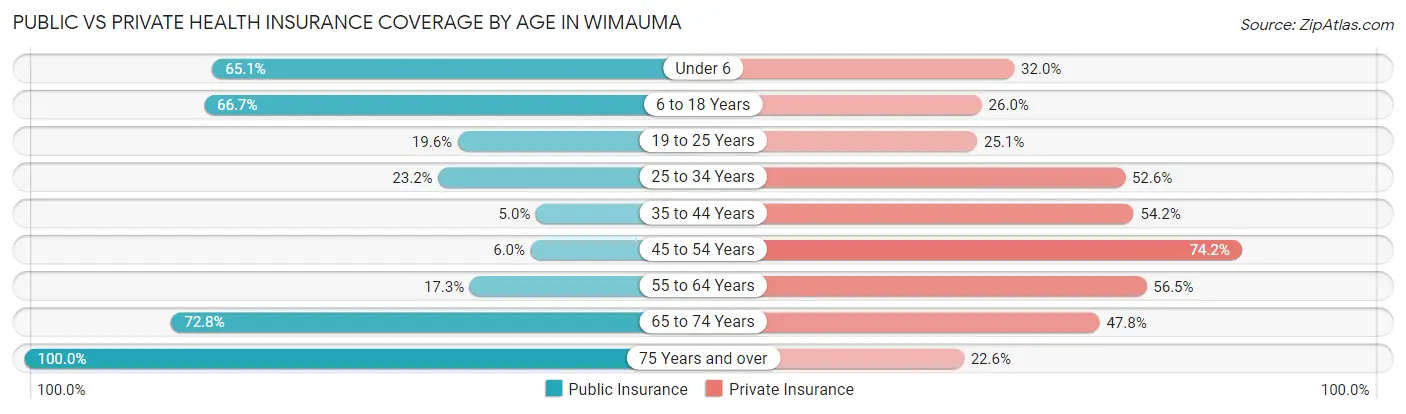
| Age Bracket | Public Insurance | Private Insurance |
| Under 6 | 1,016 (65.1%) | 499 (32.0%) |
| 6 to 18 Years | 2,532 (66.7%) | 986 (26.0%) |
| 19 to 25 Years | 184 (19.6%) | 236 (25.1%) |
| 25 to 34 Years | 349 (23.2%) | 791 (52.6%) |
| 35 to 44 Years | 94 (5.0%) | 1,011 (54.1%) |
| 45 to 54 Years | 66 (6.0%) | 812 (74.2%) |
| 55 to 64 Years | 118 (17.3%) | 385 (56.5%) |
| 65 to 74 Years | 318 (72.8%) | 209 (47.8%) |
| 75 Years and over | 539 (100.0%) | 122 (22.6%) |
| Total | 5,216 (42.0%) | 5,051 (40.7%) |
Disability Status by Sex by Age in Wimauma
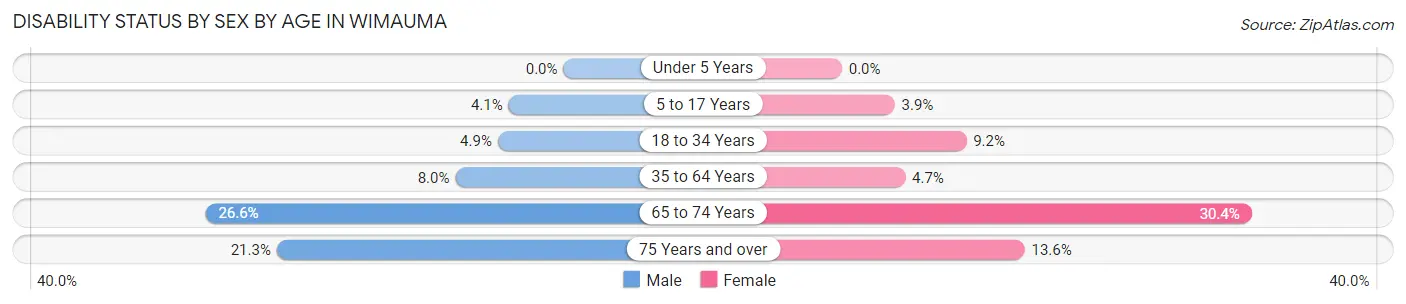
| Age Bracket | Male | Female |
| Under 5 Years | 0 (0.0%) | 0 (0.0%) |
| 5 to 17 Years | 87 (4.1%) | 76 (3.9%) |
| 18 to 34 Years | 57 (4.9%) | 129 (9.2%) |
| 35 to 64 Years | 147 (8.0%) | 85 (4.7%) |
| 65 to 74 Years | 55 (26.6%) | 70 (30.4%) |
| 75 Years and over | 30 (21.3%) | 54 (13.6%) |
Disability Class by Sex by Age in Wimauma
Disability Class: Hearing Difficulty
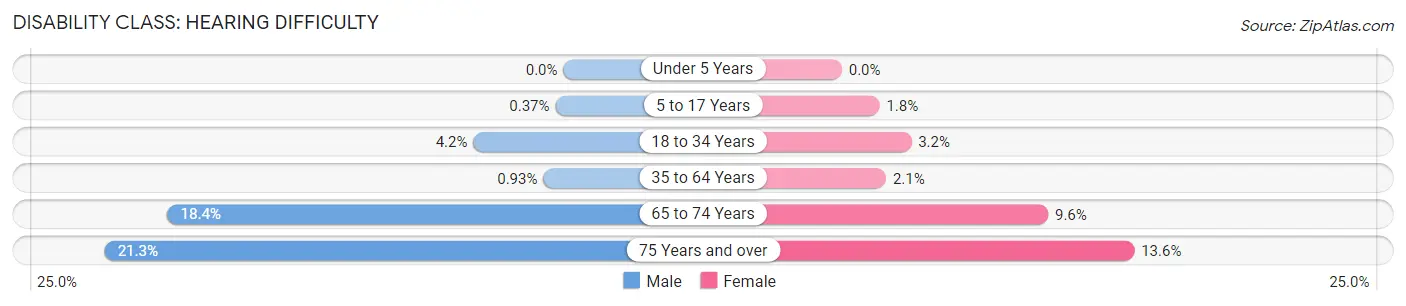
| Age Bracket | Male | Female |
| Under 5 Years | 0 (0.0%) | 0 (0.0%) |
| 5 to 17 Years | 8 (0.4%) | 34 (1.8%) |
| 18 to 34 Years | 49 (4.2%) | 45 (3.2%) |
| 35 to 64 Years | 17 (0.9%) | 37 (2.1%) |
| 65 to 74 Years | 38 (18.4%) | 22 (9.6%) |
| 75 Years and over | 30 (21.3%) | 54 (13.6%) |
Disability Class: Vision Difficulty
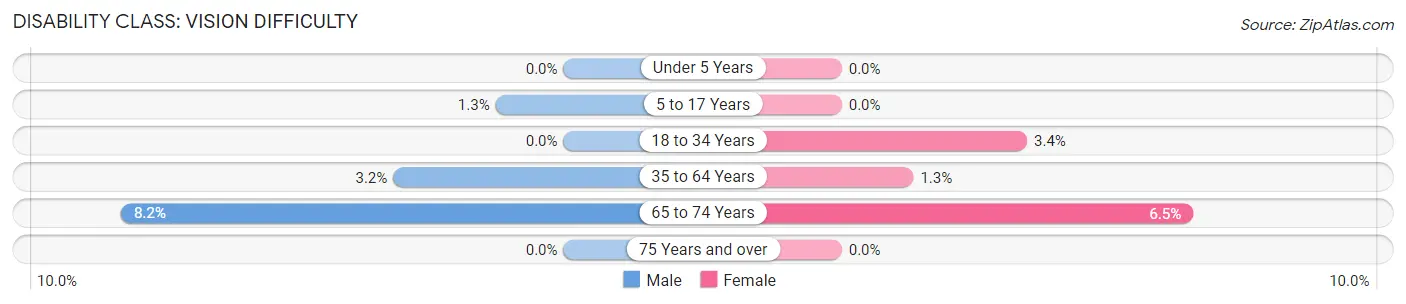
| Age Bracket | Male | Female |
| Under 5 Years | 0 (0.0%) | 0 (0.0%) |
| 5 to 17 Years | 27 (1.3%) | 0 (0.0%) |
| 18 to 34 Years | 0 (0.0%) | 48 (3.4%) |
| 35 to 64 Years | 58 (3.2%) | 24 (1.3%) |
| 65 to 74 Years | 17 (8.2%) | 15 (6.5%) |
| 75 Years and over | 0 (0.0%) | 0 (0.0%) |
Disability Class: Cognitive Difficulty
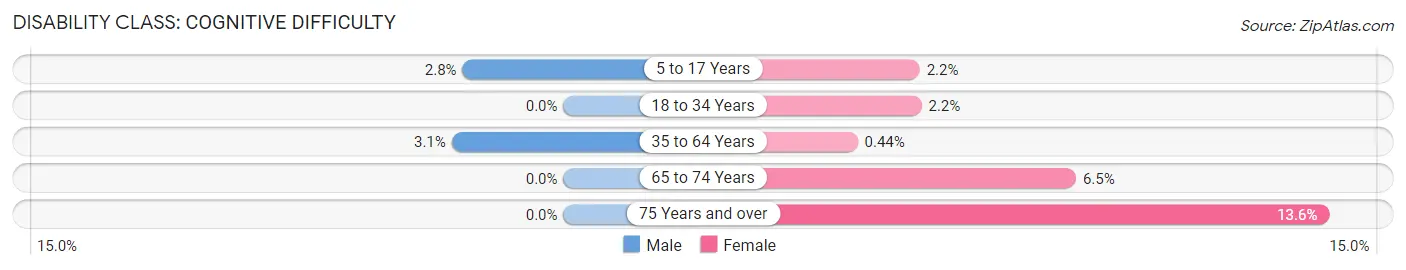
| Age Bracket | Male | Female |
| 5 to 17 Years | 60 (2.8%) | 42 (2.2%) |
| 18 to 34 Years | 0 (0.0%) | 31 (2.2%) |
| 35 to 64 Years | 57 (3.1%) | 8 (0.4%) |
| 65 to 74 Years | 0 (0.0%) | 15 (6.5%) |
| 75 Years and over | 0 (0.0%) | 54 (13.6%) |
Disability Class: Ambulatory Difficulty
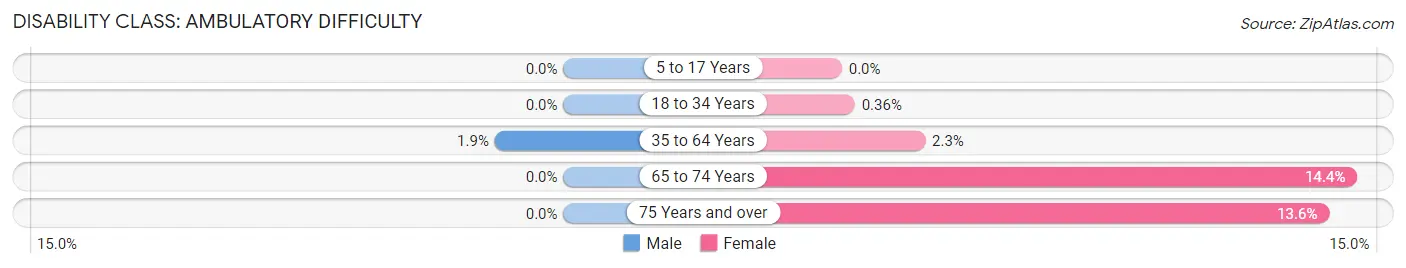
| Age Bracket | Male | Female |
| 5 to 17 Years | 0 (0.0%) | 0 (0.0%) |
| 18 to 34 Years | 0 (0.0%) | 5 (0.4%) |
| 35 to 64 Years | 35 (1.9%) | 42 (2.3%) |
| 65 to 74 Years | 0 (0.0%) | 33 (14.3%) |
| 75 Years and over | 0 (0.0%) | 54 (13.6%) |
Disability Class: Self-Care Difficulty
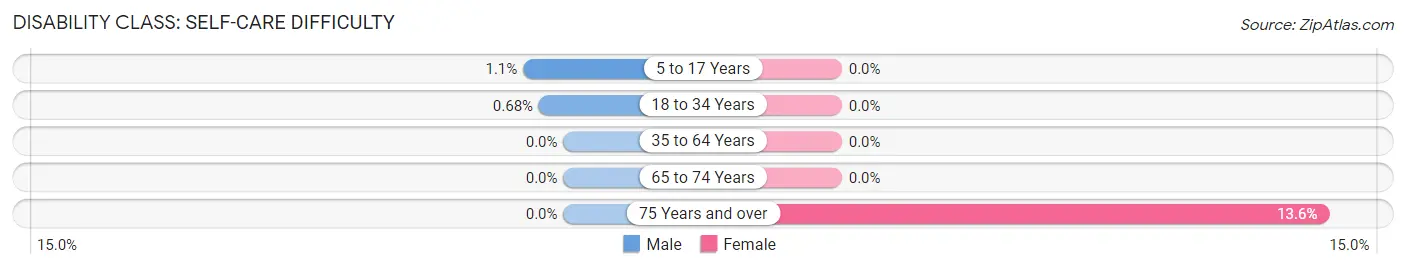
| Age Bracket | Male | Female |
| 5 to 17 Years | 24 (1.1%) | 0 (0.0%) |
| 18 to 34 Years | 8 (0.7%) | 0 (0.0%) |
| 35 to 64 Years | 0 (0.0%) | 0 (0.0%) |
| 65 to 74 Years | 0 (0.0%) | 0 (0.0%) |
| 75 Years and over | 0 (0.0%) | 54 (13.6%) |
Technology Access in Wimauma
Computing Device Access in Wimauma
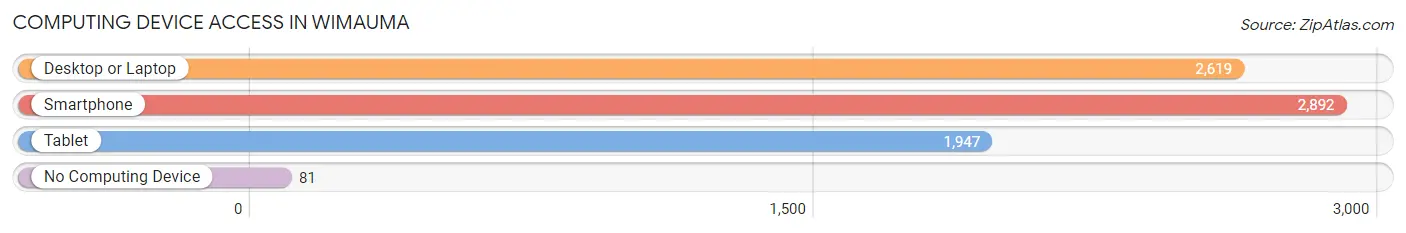
| Device Type | # Households | % Households |
| Desktop or Laptop | 2,619 | 86.4% |
| Smartphone | 2,892 | 95.4% |
| Tablet | 1,947 | 64.2% |
| No Computing Device | 81 | 2.7% |
| Total | 3,033 | 100.0% |
Internet Access in Wimauma
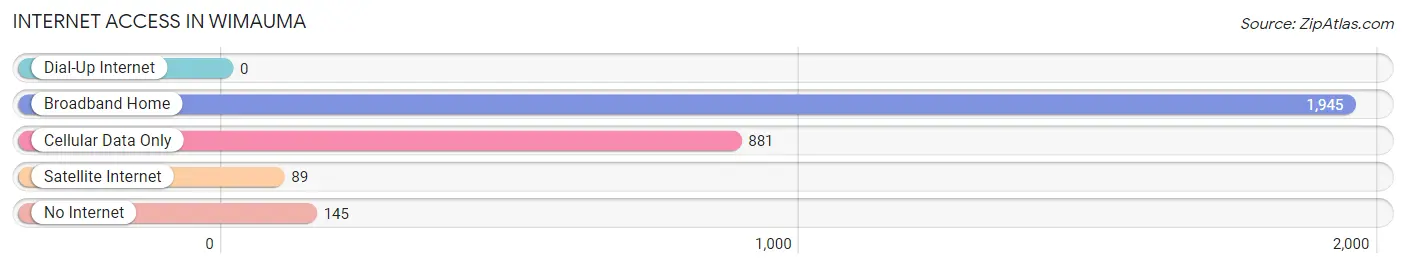
| Internet Type | # Households | % Households |
| Dial-Up Internet | 0 | 0.0% |
| Broadband Home | 1,945 | 64.1% |
| Cellular Data Only | 881 | 29.0% |
| Satellite Internet | 89 | 2.9% |
| No Internet | 145 | 4.8% |
| Total | 3,033 | 100.0% |
Wimauma Summary
Wimauma, Florida is a small unincorporated community located in Hillsborough County, Florida. It is located approximately 25 miles south of Tampa and is part of the Tampa-St. Petersburg-Clearwater Metropolitan Statistical Area. The population of Wimauma was 5,813 at the 2010 census.
History
The area that is now Wimauma was originally inhabited by the Tocobaga people, who were part of the larger Timucua tribe. The Tocobaga people lived in the area for centuries before the arrival of Europeans. The first Europeans to settle in the area were Spanish explorers in the late 1500s. The area was part of the Spanish colony of Florida until 1821, when it became part of the United States.
In the late 1800s, the area was settled by a group of settlers from the Midwest, who named the area Wimauma, which is derived from the Seminole word for “good water.” The settlers established a post office in 1887 and the town was officially incorporated in 1902.
Geography
Wimauma is located in Hillsborough County, Florida, approximately 25 miles south of Tampa. It is part of the Tampa-St. Petersburg-Clearwater Metropolitan Statistical Area. The town is situated on the northern shore of the Little Manatee River, which flows into Tampa Bay. The town is bordered by the towns of Sun City Center to the north, Ruskin to the east, and Apollo Beach to the south.
The town has a total area of 4.3 square miles, of which 4.2 square miles is land and 0.1 square miles is water. The terrain is mostly flat, with some rolling hills. The town is located in a humid subtropical climate zone, with hot, humid summers and mild winters.
Economy
The economy of Wimauma is largely based on agriculture and tourism. The town is home to several farms, which produce a variety of crops, including citrus fruits, tomatoes, and strawberries. The town is also home to several tourist attractions, including the Little Manatee River State Park, which offers camping, fishing, and other outdoor activities.
The town is also home to several businesses, including a grocery store, a hardware store, and a few restaurants. The town is also home to several churches, a library, and a post office.
Demographics
As of the 2010 census, the population of Wimauma was 5,813. The racial makeup of the town was 79.3% White, 11.2% African American, 0.7% Native American, 0.7% Asian, 0.1% Pacific Islander, 5.7% from other races, and 2.2% from two or more races. Hispanic or Latino of any race were 16.3% of the population.
The median income for a household in the town was $37,917, and the median income for a family was $45,938. The per capita income for the town was $17,945. About 16.3% of families and 19.2% of the population were below the poverty line, including 28.2% of those under age 18 and 8.2% of those age 65 or over.
Common Questions
What is Per Capita Income in Wimauma?
Per Capita income in Wimauma is $21,420.
What is the Median Family Income in Wimauma?
Median Family Income in Wimauma is $55,704.
What is the Median Household income in Wimauma?
Median Household Income in Wimauma is $56,321.
What is Income or Wage Gap in Wimauma?
Income or Wage Gap in Wimauma is 41.3%.
Women in Wimauma earn 58.7 cents for every dollar earned by a man.
What is Inequality or Gini Index in Wimauma?
Inequality or Gini Index in Wimauma is 0.41.
What is the Total Population of Wimauma?
Total Population of Wimauma is 12,439.
What is the Total Male Population of Wimauma?
Total Male Population of Wimauma is 6,157.
What is the Total Female Population of Wimauma?
Total Female Population of Wimauma is 6,282.
What is the Ratio of Males per 100 Females in Wimauma?
There are 98.01 Males per 100 Females in Wimauma.
What is the Ratio of Females per 100 Males in Wimauma?
There are 102.03 Females per 100 Males in Wimauma.
What is the Median Population Age in Wimauma?
Median Population Age in Wimauma is 25.1 Years.
What is the Average Family Size in Wimauma
Average Family Size in Wimauma is 4.0 People.
What is the Average Household Size in Wimauma
Average Household Size in Wimauma is 4.1 People.
How Large is the Labor Force in Wimauma?
There are 4,747 People in the Labor Forcein in Wimauma.
What is the Percentage of People in the Labor Force in Wimauma?
61.8% of People are in the Labor Force in Wimauma.
What is the Unemployment Rate in Wimauma?
Unemployment Rate in Wimauma is 2.8%.