Westville, FL Map & Demographics
Westville Map
Westville Overview
$30,200
PER CAPITA INCOME
$67,292
AVG FAMILY INCOME
$65,833
AVG HOUSEHOLD INCOME
38.4%
WAGE / INCOME GAP [ % ]
61.6¢/ $1
WAGE / INCOME GAP [ $ ]
0.38
INEQUALITY / GINI INDEX
268
TOTAL POPULATION
124
MALE POPULATION
144
FEMALE POPULATION
86.11
MALES / 100 FEMALES
116.13
FEMALES / 100 MALES
52.8
MEDIAN AGE
2.9
AVG FAMILY SIZE
2.2
AVG HOUSEHOLD SIZE
132
LABOR FORCE [ PEOPLE ]
56.7%
PERCENT IN LABOR FORCE
0.8%
UNEMPLOYMENT RATE
Westville Zip Codes
Westville Area Codes
Income in Westville
Income Overview in Westville
Per Capita Income in Westville is $30,200, while median incomes of families and households are $67,292 and $65,833 respectively.
| Characteristic | Number | Measure |
| Per Capita Income | 268 | $30,200 |
| Median Family Income | 74 | $67,292 |
| Mean Family Income | 74 | $73,374 |
| Median Household Income | 120 | $65,833 |
| Mean Household Income | 120 | $62,944 |
| Income Deficit | 74 | $0 |
| Wage / Income Gap (%) | 268 | 38.39% |
| Wage / Income Gap ($) | 268 | 61.61¢ per $1 |
| Gini / Inequality Index | 268 | 0.38 |
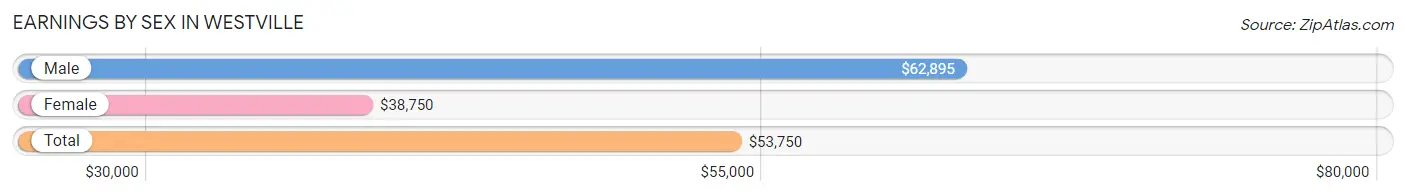
Earnings by Sex in Westville
Average Earnings in Westville are $53,750, $62,895 for men and $38,750 for women, a difference of 38.4%.
| Sex | Number | Average Earnings |
| Male | 80 (59.7%) | $62,895 |
| Female | 54 (40.3%) | $38,750 |
| Total | 134 (100.0%) | $53,750 |
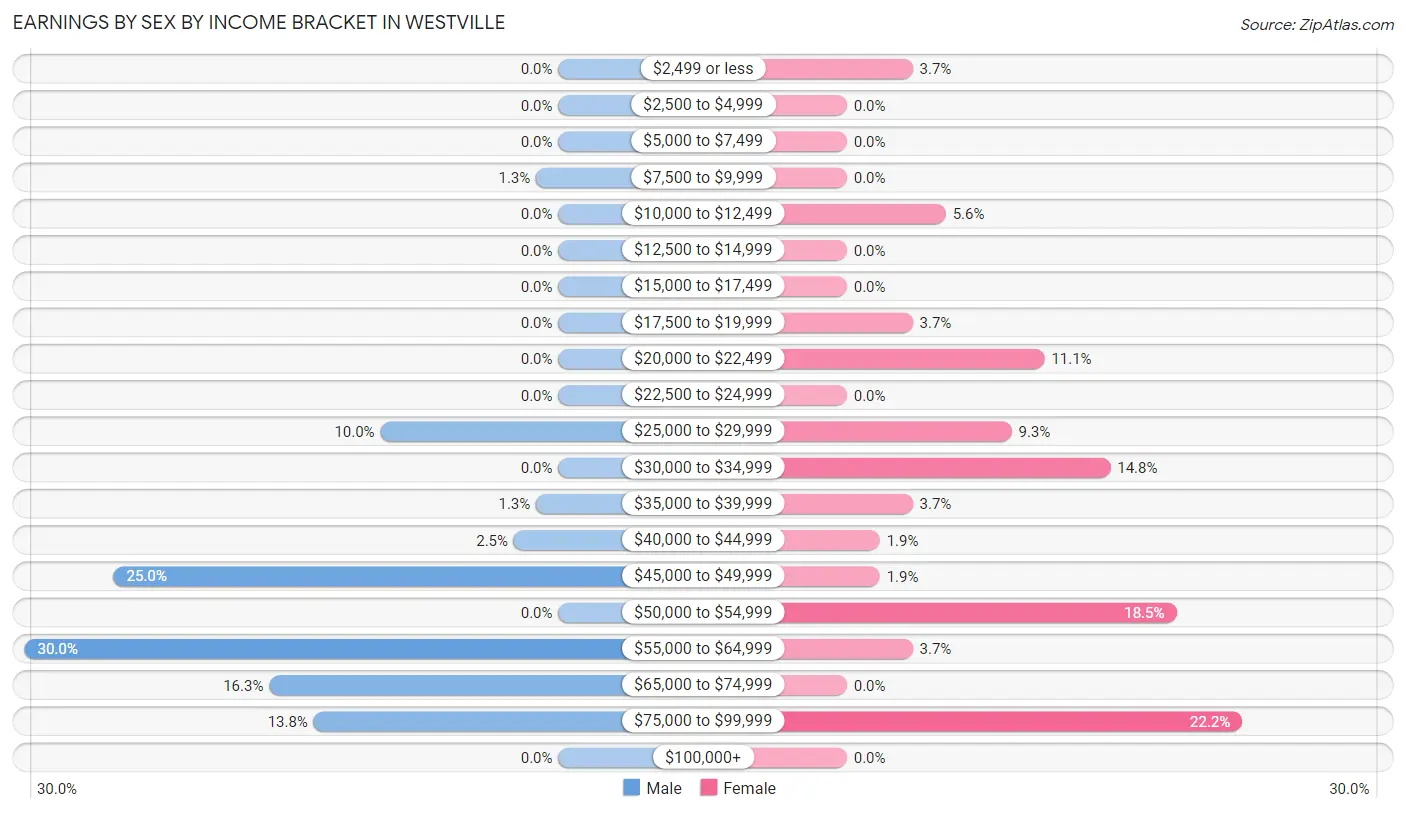
Earnings by Sex by Income Bracket in Westville
The most common earnings brackets in Westville are $55,000 to $64,999 for men (24 | 30.0%) and $75,000 to $99,999 for women (12 | 22.2%).
| Income | Male | Female |
| $2,499 or less | 0 (0.0%) | 2 (3.7%) |
| $2,500 to $4,999 | 0 (0.0%) | 0 (0.0%) |
| $5,000 to $7,499 | 0 (0.0%) | 0 (0.0%) |
| $7,500 to $9,999 | 1 (1.3%) | 0 (0.0%) |
| $10,000 to $12,499 | 0 (0.0%) | 3 (5.6%) |
| $12,500 to $14,999 | 0 (0.0%) | 0 (0.0%) |
| $15,000 to $17,499 | 0 (0.0%) | 0 (0.0%) |
| $17,500 to $19,999 | 0 (0.0%) | 2 (3.7%) |
| $20,000 to $22,499 | 0 (0.0%) | 6 (11.1%) |
| $22,500 to $24,999 | 0 (0.0%) | 0 (0.0%) |
| $25,000 to $29,999 | 8 (10.0%) | 5 (9.3%) |
| $30,000 to $34,999 | 0 (0.0%) | 8 (14.8%) |
| $35,000 to $39,999 | 1 (1.3%) | 2 (3.7%) |
| $40,000 to $44,999 | 2 (2.5%) | 1 (1.8%) |
| $45,000 to $49,999 | 20 (25.0%) | 1 (1.8%) |
| $50,000 to $54,999 | 0 (0.0%) | 10 (18.5%) |
| $55,000 to $64,999 | 24 (30.0%) | 2 (3.7%) |
| $65,000 to $74,999 | 13 (16.3%) | 0 (0.0%) |
| $75,000 to $99,999 | 11 (13.8%) | 12 (22.2%) |
| $100,000+ | 0 (0.0%) | 0 (0.0%) |
| Total | 80 (100.0%) | 54 (100.0%) |
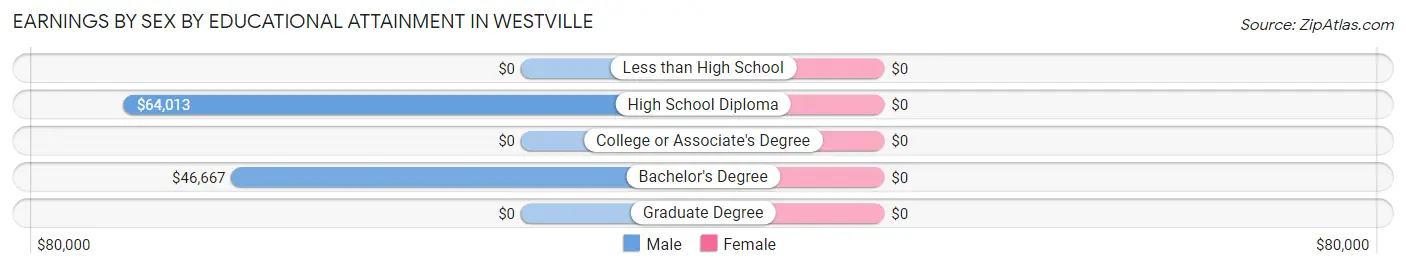
Earnings by Sex by Educational Attainment in Westville
| Educational Attainment | Male Income | Female Income |
| Less than High School | - | - |
| High School Diploma | $64,013 | $0 |
| College or Associate's Degree | - | - |
| Bachelor's Degree | $46,667 | $0 |
| Graduate Degree | - | - |
| Total | $63,421 | $41,250 |
Family Income in Westville
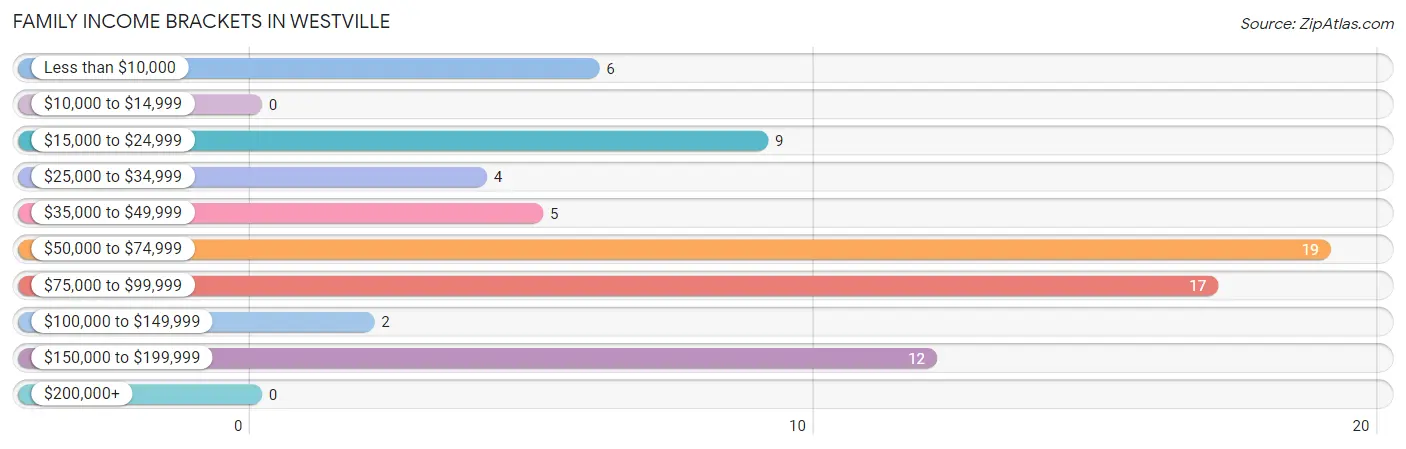
Family Income Brackets in Westville
According to the Westville family income data, there are 19 families falling into the $50,000 to $74,999 income range, which is the most common income bracket and makes up 25.7% of all families.
| Income Bracket | # Families | % Families |
| Less than $10,000 | 6 | 8.1% |
| $10,000 to $14,999 | 0 | 0.0% |
| $15,000 to $24,999 | 9 | 12.2% |
| $25,000 to $34,999 | 4 | 5.4% |
| $35,000 to $49,999 | 5 | 6.8% |
| $50,000 to $74,999 | 19 | 25.7% |
| $75,000 to $99,999 | 17 | 23.0% |
| $100,000 to $149,999 | 2 | 2.7% |
| $150,000 to $199,999 | 12 | 16.2% |
| $200,000+ | 0 | 0.0% |
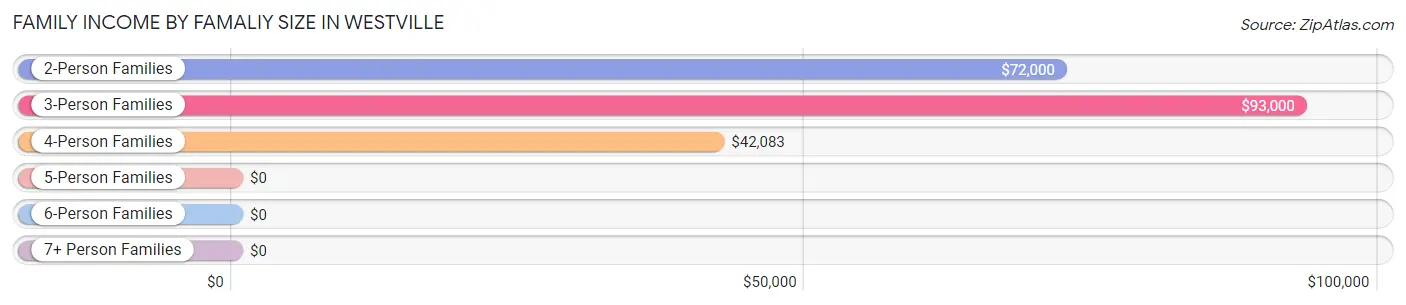
Family Income by Famaliy Size in Westville
3-person families (12 | 16.2%) account for the highest median family income in Westville with $93,000 per family, while 2-person families (44 | 59.5%) have the highest median income of $36,000 per family member.
| Income Bracket | # Families | Median Income |
| 2-Person Families | 44 (59.5%) | $72,000 |
| 3-Person Families | 12 (16.2%) | $93,000 |
| 4-Person Families | 5 (6.8%) | $42,083 |
| 5-Person Families | 10 (13.5%) | $0 |
| 6-Person Families | 3 (4.1%) | $0 |
| 7+ Person Families | 0 (0.0%) | $0 |
| Total | 74 (100.0%) | $67,292 |
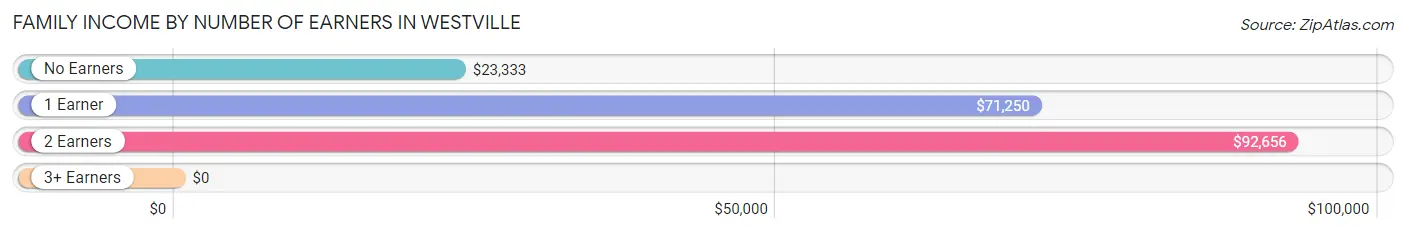
Family Income by Number of Earners in Westville
| Number of Earners | # Families | Median Income |
| No Earners | 22 (29.7%) | $23,333 |
| 1 Earner | 9 (12.2%) | $71,250 |
| 2 Earners | 43 (58.1%) | $92,656 |
| 3+ Earners | 0 (0.0%) | $0 |
| Total | 74 (100.0%) | $67,292 |
Household Income in Westville
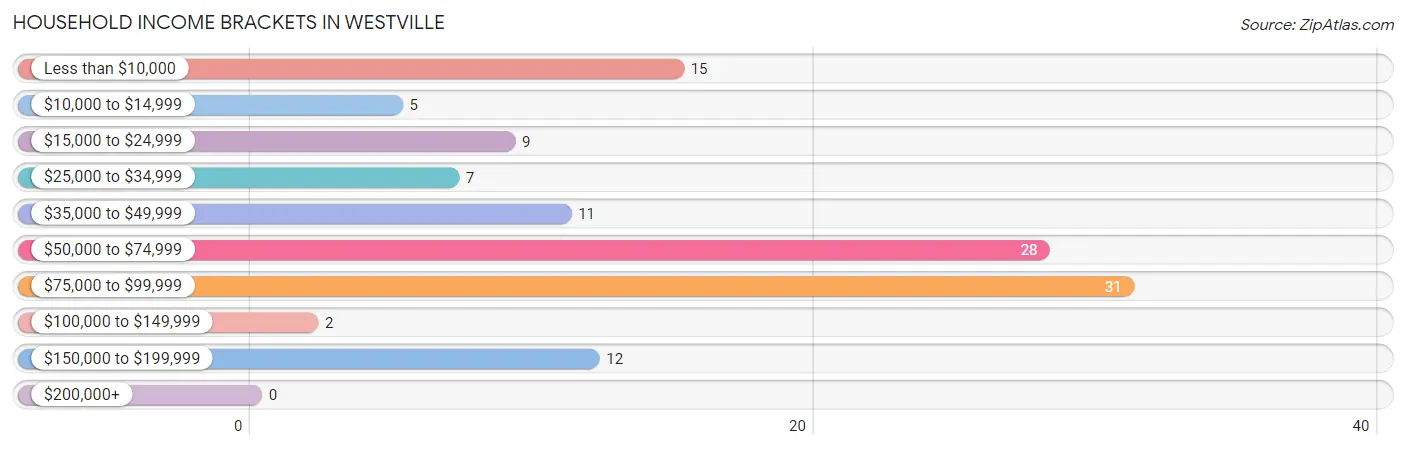
Household Income Brackets in Westville
With 31 households falling in the category, the $75,000 to $99,999 income range is the most frequent in Westville, accounting for 25.8% of all households.
| Income Bracket | # Households | % Households |
| Less than $10,000 | 15 | 12.5% |
| $10,000 to $14,999 | 5 | 4.2% |
| $15,000 to $24,999 | 9 | 7.5% |
| $25,000 to $34,999 | 7 | 5.8% |
| $35,000 to $49,999 | 11 | 9.2% |
| $50,000 to $74,999 | 28 | 23.3% |
| $75,000 to $99,999 | 31 | 25.8% |
| $100,000 to $149,999 | 2 | 1.7% |
| $150,000 to $199,999 | 12 | 10.0% |
| $200,000+ | 0 | 0.0% |
Household Income by Householder Age in Westville
The median household income in Westville is $65,833, with the highest median household income of $80,750 found in the 25 to 44 years age bracket for the primary householder. A total of 27 households (22.5%) fall into this category. Meanwhile, the 15 to 24 years age bracket for the primary householder has the lowest median household income of $0, with 4 households (3.3%) in this group.
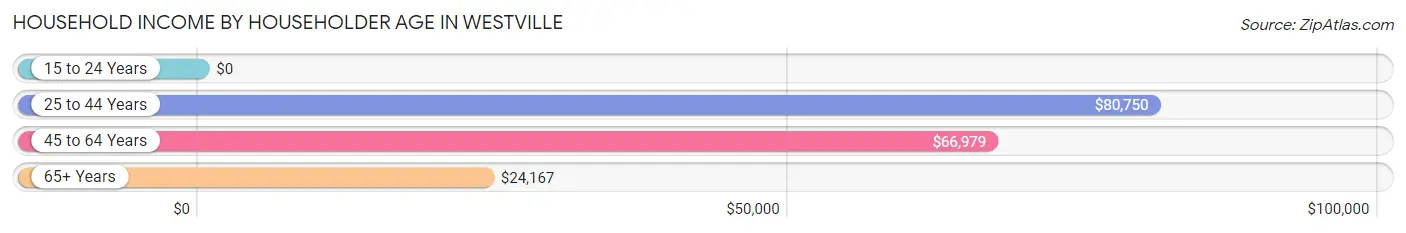
| Income Bracket | # Households | Median Income |
| 15 to 24 Years | 4 (3.3%) | $0 |
| 25 to 44 Years | 27 (22.5%) | $80,750 |
| 45 to 64 Years | 53 (44.2%) | $66,979 |
| 65+ Years | 36 (30.0%) | $24,167 |
| Total | 120 (100.0%) | $65,833 |
Poverty in Westville
Income Below Poverty by Sex and Age in Westville
With 12.1% poverty level for males and 11.0% for females among the residents of Westville, under 5 year old males and 18 to 24 year old females are the most vulnerable to poverty, with 3 males (50.0%) and 4 females (44.4%) in their respective age groups living below the poverty level.
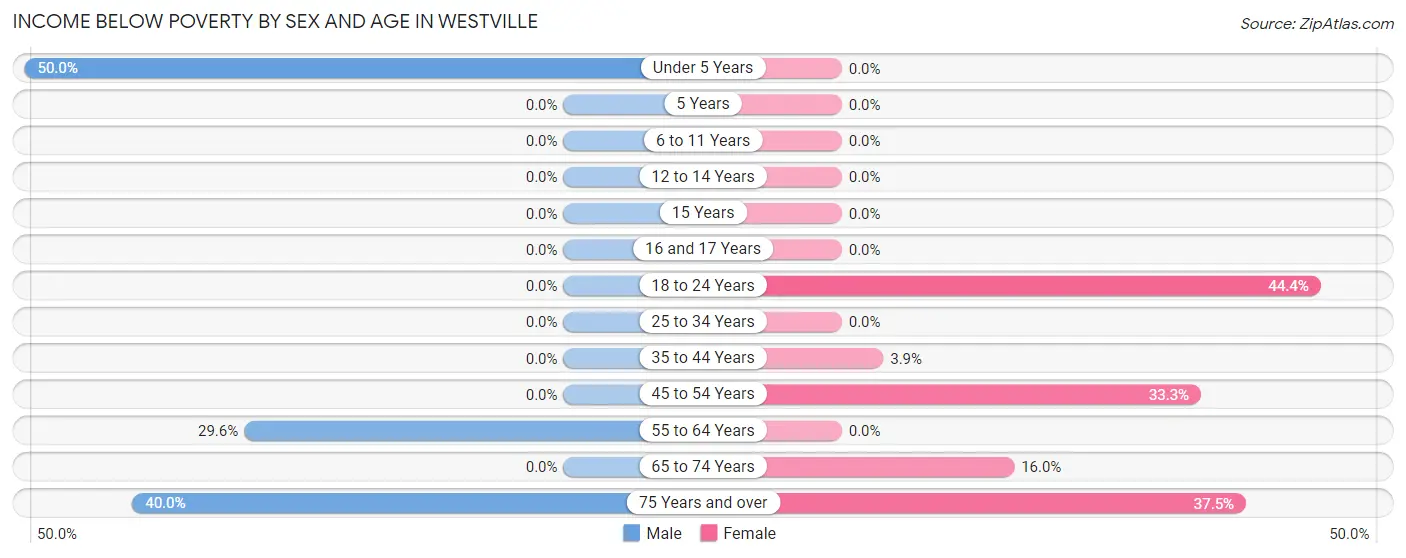
| Age Bracket | Male | Female |
| Under 5 Years | 3 (50.0%) | 0 (0.0%) |
| 5 Years | 0 (0.0%) | 0 (0.0%) |
| 6 to 11 Years | 0 (0.0%) | 0 (0.0%) |
| 12 to 14 Years | 0 (0.0%) | 0 (0.0%) |
| 15 Years | 0 (0.0%) | 0 (0.0%) |
| 16 and 17 Years | 0 (0.0%) | 0 (0.0%) |
| 18 to 24 Years | 0 (0.0%) | 4 (44.4%) |
| 25 to 34 Years | 0 (0.0%) | 0 (0.0%) |
| 35 to 44 Years | 0 (0.0%) | 1 (3.8%) |
| 45 to 54 Years | 0 (0.0%) | 3 (33.3%) |
| 55 to 64 Years | 8 (29.6%) | 0 (0.0%) |
| 65 to 74 Years | 0 (0.0%) | 4 (16.0%) |
| 75 Years and over | 4 (40.0%) | 3 (37.5%) |
| Total | 15 (12.1%) | 15 (11.0%) |
Income Above Poverty by Sex and Age in Westville
According to the poverty statistics in Westville, males aged 6 to 11 years and females aged 6 to 11 years are the age groups that are most secure financially, with 100.0% of males and 100.0% of females in these age groups living above the poverty line.
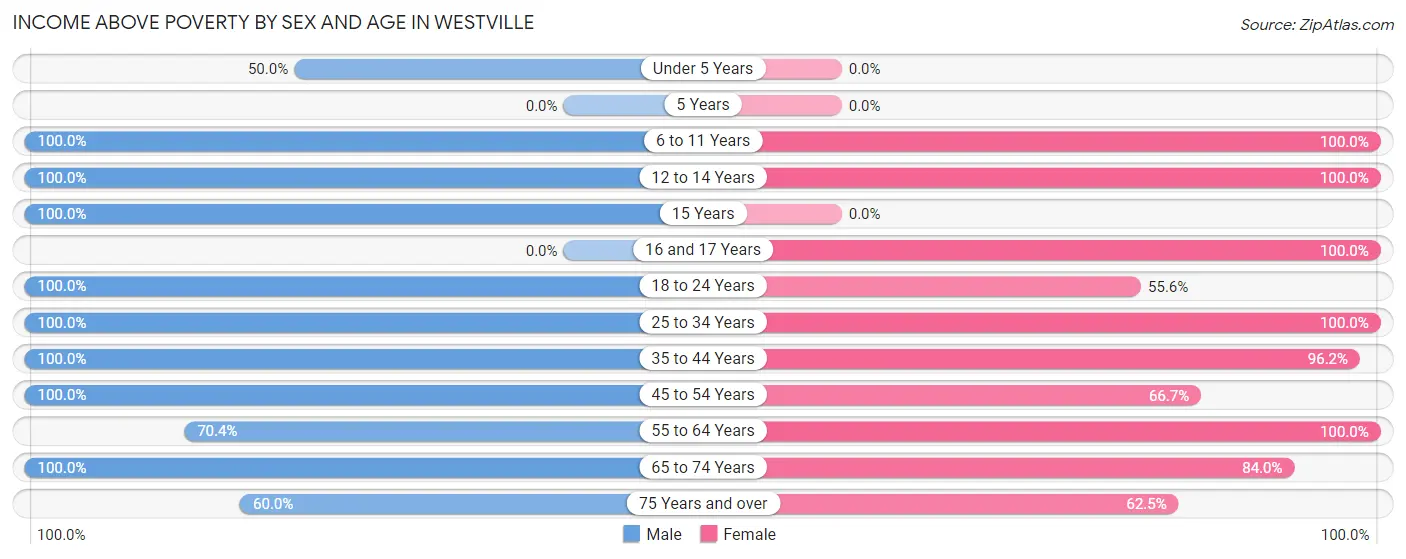
| Age Bracket | Male | Female |
| Under 5 Years | 3 (50.0%) | 0 (0.0%) |
| 5 Years | 0 (0.0%) | 0 (0.0%) |
| 6 to 11 Years | 5 (100.0%) | 2 (100.0%) |
| 12 to 14 Years | 3 (100.0%) | 11 (100.0%) |
| 15 Years | 1 (100.0%) | 0 (0.0%) |
| 16 and 17 Years | 0 (0.0%) | 12 (100.0%) |
| 18 to 24 Years | 8 (100.0%) | 5 (55.6%) |
| 25 to 34 Years | 5 (100.0%) | 3 (100.0%) |
| 35 to 44 Years | 12 (100.0%) | 25 (96.2%) |
| 45 to 54 Years | 35 (100.0%) | 6 (66.7%) |
| 55 to 64 Years | 19 (70.4%) | 32 (100.0%) |
| 65 to 74 Years | 12 (100.0%) | 21 (84.0%) |
| 75 Years and over | 6 (60.0%) | 5 (62.5%) |
| Total | 109 (87.9%) | 122 (89.0%) |
Income Below Poverty Among Married-Couple Families in Westville
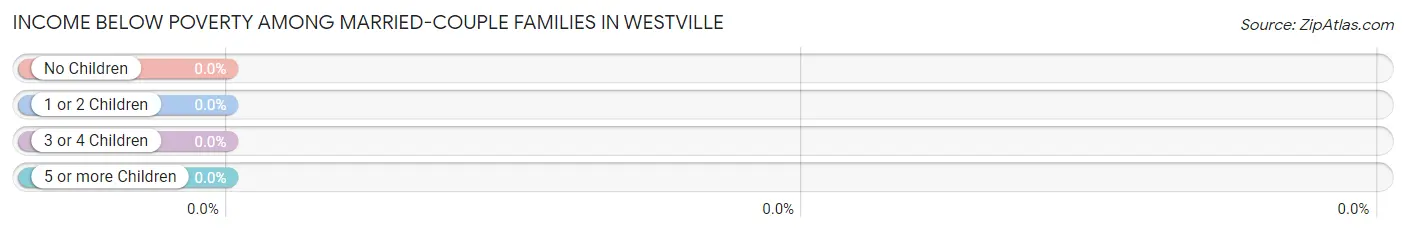
| Children | Above Poverty | Below Poverty |
| No Children | 36 (100.0%) | 0 (0.0%) |
| 1 or 2 Children | 22 (100.0%) | 0 (0.0%) |
| 3 or 4 Children | 3 (100.0%) | 0 (0.0%) |
| 5 or more Children | 0 (0.0%) | 0 (0.0%) |
| Total | 61 (100.0%) | 0 (0.0%) |
Income Below Poverty Among Single-Parent Households in Westville
According to the poverty data in Westville, 100.0% or 4 single-father households and 22.2% or 2 single-mother households are living below the poverty line. Among single-father households, those with no children have the highest poverty rate, with 4 households (100.0%) experiencing poverty. Likewise, among single-mother households, those with 1 or 2 children have the highest poverty rate, with 2 households (100.0%) falling below the poverty line.
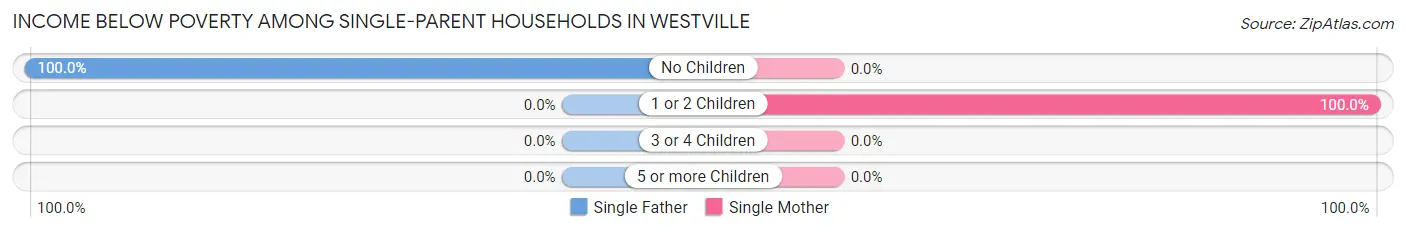
| Children | Single Father | Single Mother |
| No Children | 4 (100.0%) | 0 (0.0%) |
| 1 or 2 Children | 0 (0.0%) | 2 (100.0%) |
| 3 or 4 Children | 0 (0.0%) | 0 (0.0%) |
| 5 or more Children | 0 (0.0%) | 0 (0.0%) |
| Total | 4 (100.0%) | 2 (22.2%) |
Income Below Poverty Among Married-Couple vs Single-Parent Households in Westville
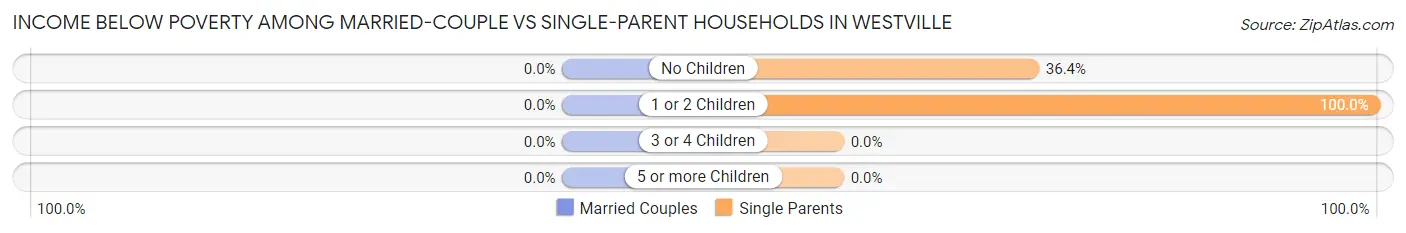
| Children | Married-Couple Families | Single-Parent Households |
| No Children | 0 (0.0%) | 4 (36.4%) |
| 1 or 2 Children | 0 (0.0%) | 2 (100.0%) |
| 3 or 4 Children | 0 (0.0%) | 0 (0.0%) |
| 5 or more Children | 0 (0.0%) | 0 (0.0%) |
| Total | 0 (0.0%) | 6 (46.2%) |
Race in Westville
The most populous races in Westville are White / Caucasian (264 | 98.5%), Two or more Races (2 | 0.7%), and Some other Race (2 | 0.7%).
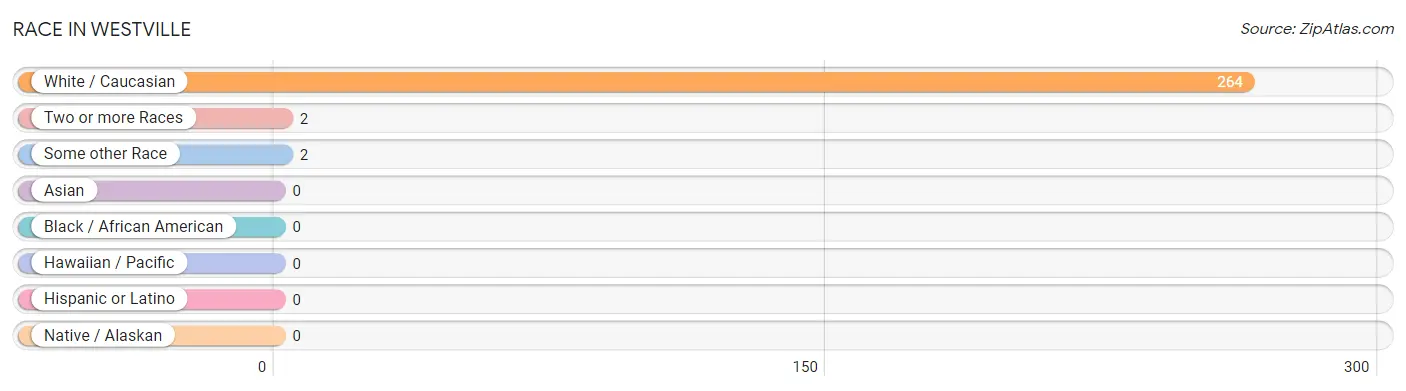
| Race | # Population | % Population |
| Asian | 0 | 0.0% |
| Black / African American | 0 | 0.0% |
| Hawaiian / Pacific | 0 | 0.0% |
| Hispanic or Latino | 0 | 0.0% |
| Native / Alaskan | 0 | 0.0% |
| White / Caucasian | 264 | 98.5% |
| Two or more Races | 2 | 0.7% |
| Some other Race | 2 | 0.7% |
| Total | 268 | 100.0% |
Ancestry in Westville
The most populous ancestries reported in Westville are American (146 | 54.5%), Irish (21 | 7.8%), English (16 | 6.0%), German (11 | 4.1%), and Scotch-Irish (8 | 3.0%), together accounting for 75.4% of all Westville residents.
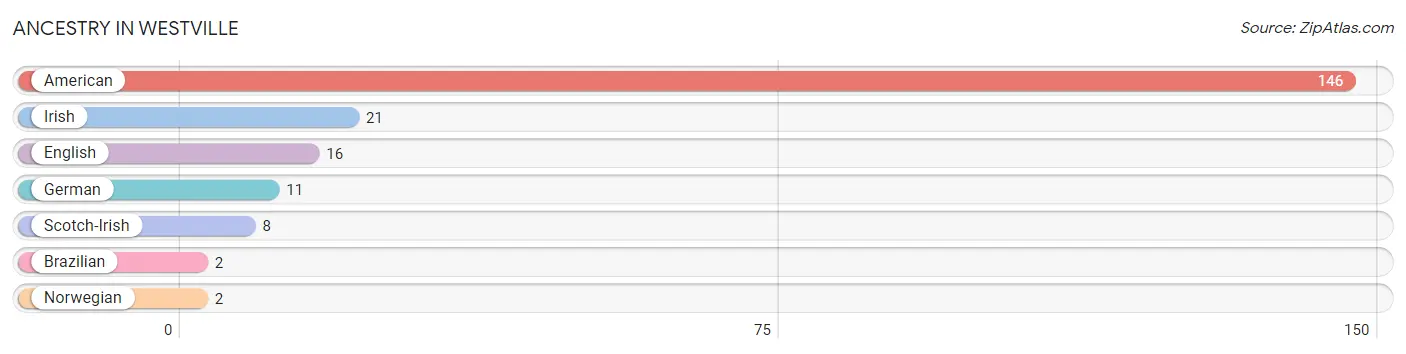
| Ancestry | # Population | % Population |
| American | 146 | 54.5% |
| Brazilian | 2 | 0.7% |
| English | 16 | 6.0% |
| German | 11 | 4.1% |
| Irish | 21 | 7.8% |
| Norwegian | 2 | 0.7% |
| Scotch-Irish | 8 | 3.0% | View All 7 Rows |
Immigrants in Westville
The most numerous immigrant groups reported in Westville came from Brazil (2 | 0.7%), Canada (2 | 0.7%), Latin America (2 | 0.7%), and South America (2 | 0.7%), together accounting for 3.0% of all Westville residents.
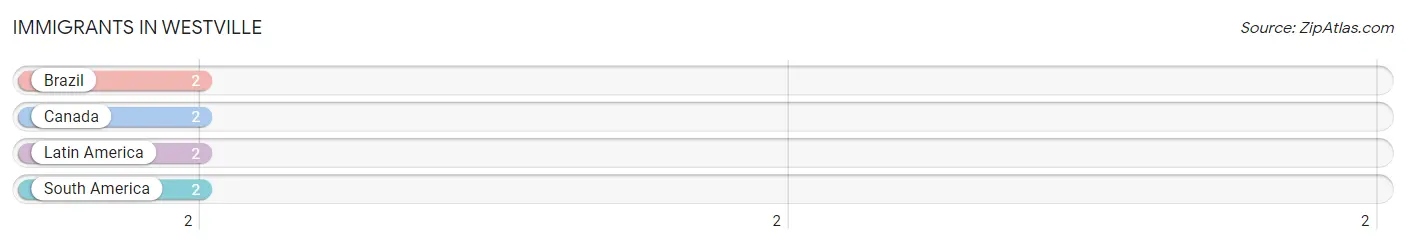
| Immigration Origin | # Population | % Population |
| Brazil | 2 | 0.7% |
| Canada | 2 | 0.7% |
| Latin America | 2 | 0.7% |
| South America | 2 | 0.7% | View All 4 Rows |
Sex and Age in Westville
Sex and Age in Westville
The most populous age groups in Westville are 50 to 54 Years (19 | 15.3%) for men and 65 to 69 Years (19 | 13.2%) for women.
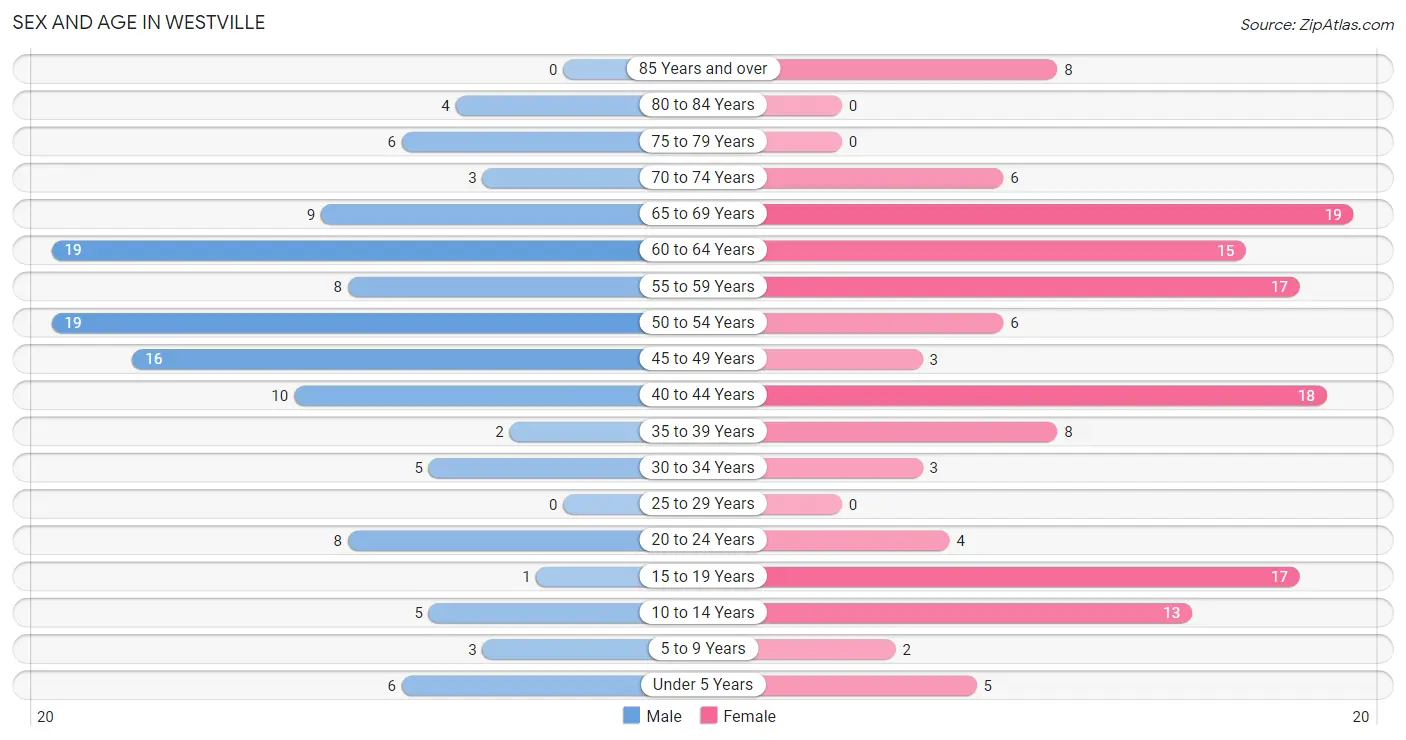
| Age Bracket | Male | Female |
| Under 5 Years | 6 (4.8%) | 5 (3.5%) |
| 5 to 9 Years | 3 (2.4%) | 2 (1.4%) |
| 10 to 14 Years | 5 (4.0%) | 13 (9.0%) |
| 15 to 19 Years | 1 (0.8%) | 17 (11.8%) |
| 20 to 24 Years | 8 (6.5%) | 4 (2.8%) |
| 25 to 29 Years | 0 (0.0%) | 0 (0.0%) |
| 30 to 34 Years | 5 (4.0%) | 3 (2.1%) |
| 35 to 39 Years | 2 (1.6%) | 8 (5.6%) |
| 40 to 44 Years | 10 (8.1%) | 18 (12.5%) |
| 45 to 49 Years | 16 (12.9%) | 3 (2.1%) |
| 50 to 54 Years | 19 (15.3%) | 6 (4.2%) |
| 55 to 59 Years | 8 (6.5%) | 17 (11.8%) |
| 60 to 64 Years | 19 (15.3%) | 15 (10.4%) |
| 65 to 69 Years | 9 (7.3%) | 19 (13.2%) |
| 70 to 74 Years | 3 (2.4%) | 6 (4.2%) |
| 75 to 79 Years | 6 (4.8%) | 0 (0.0%) |
| 80 to 84 Years | 4 (3.2%) | 0 (0.0%) |
| 85 Years and over | 0 (0.0%) | 8 (5.6%) |
| Total | 124 (100.0%) | 144 (100.0%) |
Families and Households in Westville
Median Family Size in Westville
The median family size in Westville is 2.85 persons per family, with married-couple families (61 | 82.4%) accounting for the largest median family size of 2.9 persons per family. On the other hand, single male/father families (4 | 5.4%) represent the smallest median family size with 2.25 persons per family.
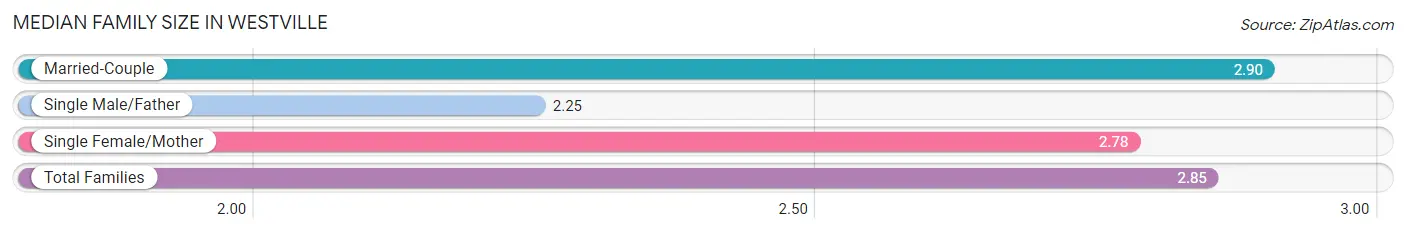
| Family Type | # Families | Family Size |
| Married-Couple | 61 (82.4%) | 2.90 |
| Single Male/Father | 4 (5.4%) | 2.25 |
| Single Female/Mother | 9 (12.2%) | 2.78 |
| Total Families | 74 (100.0%) | 2.85 |
Median Household Size in Westville
The median household size in Westville is 2.23 persons per household, with married-couple households (61 | 50.8%) accounting for the largest median household size of 2.9 persons per household. non-family households (46 | 38.3%) represent the smallest median household size with 1.24 persons per household.
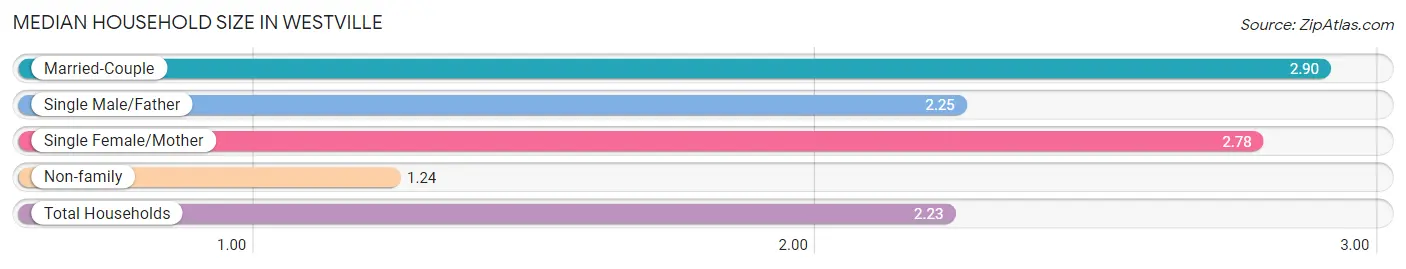
| Household Type | # Households | Household Size |
| Married-Couple | 61 (50.8%) | 2.90 |
| Single Male/Father | 4 (3.3%) | 2.25 |
| Single Female/Mother | 9 (7.5%) | 2.78 |
| Non-family | 46 (38.3%) | 1.24 |
| Total Households | 120 (100.0%) | 2.23 |
Household Size by Marriage Status in Westville
Out of a total of 120 households in Westville, 74 (61.7%) are family households, while 46 (38.3%) are nonfamily households. The most numerous type of family households are 2-person households, comprising 44, and the most common type of nonfamily households are 1-person households, comprising 38.
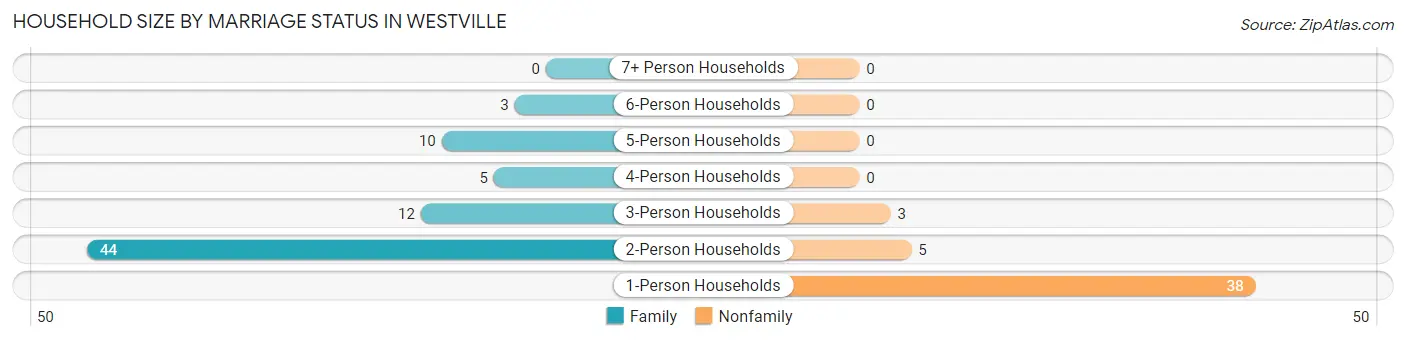
| Household Size | Family Households | Nonfamily Households |
| 1-Person Households | - | 38 (31.7%) |
| 2-Person Households | 44 (36.7%) | 5 (4.2%) |
| 3-Person Households | 12 (10.0%) | 3 (2.5%) |
| 4-Person Households | 5 (4.2%) | 0 (0.0%) |
| 5-Person Households | 10 (8.3%) | 0 (0.0%) |
| 6-Person Households | 3 (2.5%) | 0 (0.0%) |
| 7+ Person Households | 0 (0.0%) | 0 (0.0%) |
| Total | 74 (61.7%) | 46 (38.3%) |
Female Fertility in Westville
Fertility by Age in Westville
Average fertility rate in Westville is 37.0 births per 1,000 women. Women in the age bracket of 20 to 34 years have the highest fertility rate with 286.0 births per 1,000 women. Women in the age bracket of 20 to 34 years acount for 100.0% of all women with births.
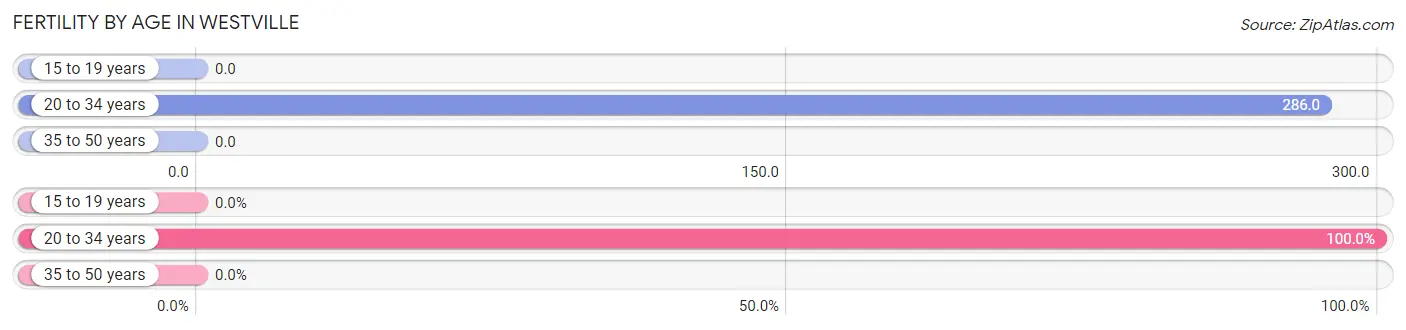
| Age Bracket | Women with Births | Births / 1,000 Women |
| 15 to 19 years | 0 (0.0%) | 0.0 |
| 20 to 34 years | 2 (100.0%) | 286.0 |
| 35 to 50 years | 0 (0.0%) | 0.0 |
| Total | 2 (100.0%) | 37.0 |
Fertility by Age by Marriage Status in Westville
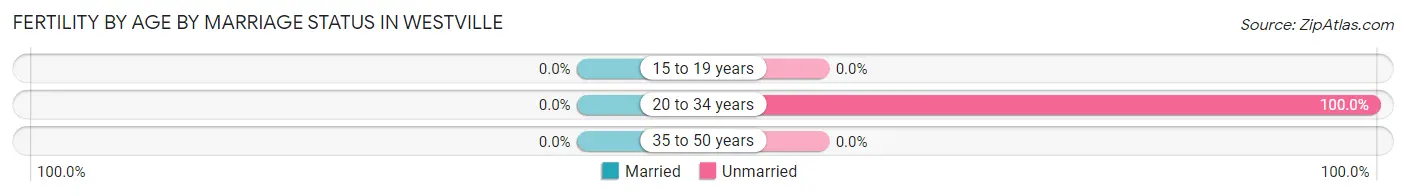
| Age Bracket | Married | Unmarried |
| 15 to 19 years | 0 (0.0%) | 0 (0.0%) |
| 20 to 34 years | 0 (0.0%) | 2 (100.0%) |
| 35 to 50 years | 0 (0.0%) | 0 (0.0%) |
| Total | 0 (0.0%) | 2 (100.0%) |
Fertility by Education in Westville
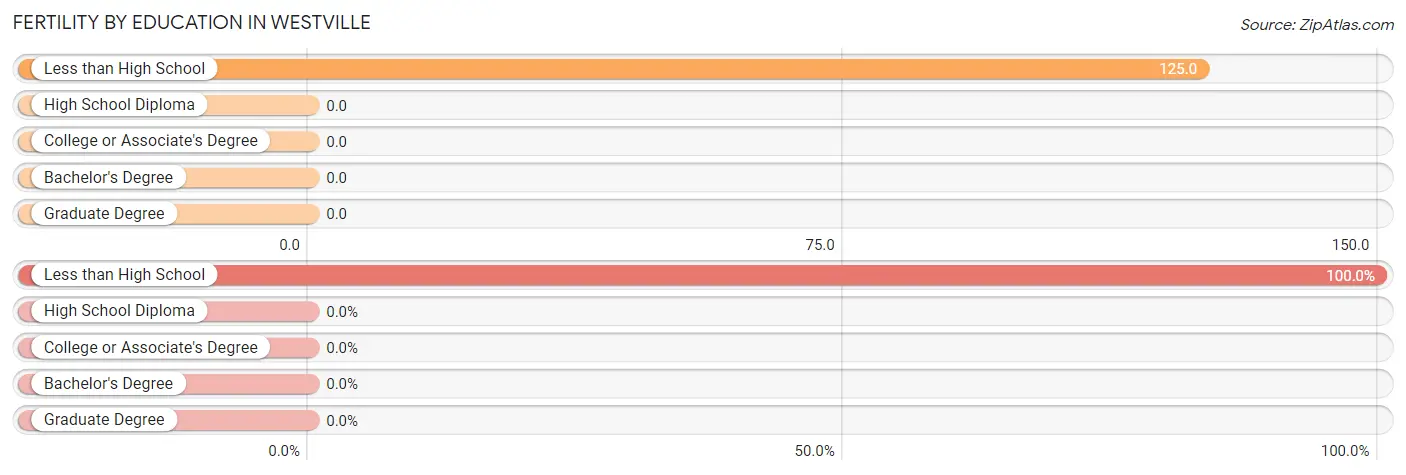
| Educational Attainment | Women with Births | Births / 1,000 Women |
| Less than High School | 2 (100.0%) | 125.0 |
| High School Diploma | 0 (0.0%) | 0.0 |
| College or Associate's Degree | 0 (0.0%) | 0.0 |
| Bachelor's Degree | 0 (0.0%) | 0.0 |
| Graduate Degree | 0 (0.0%) | 0.0 |
| Total | 2 (100.0%) | 37.0 |
Fertility by Education by Marriage Status in Westville
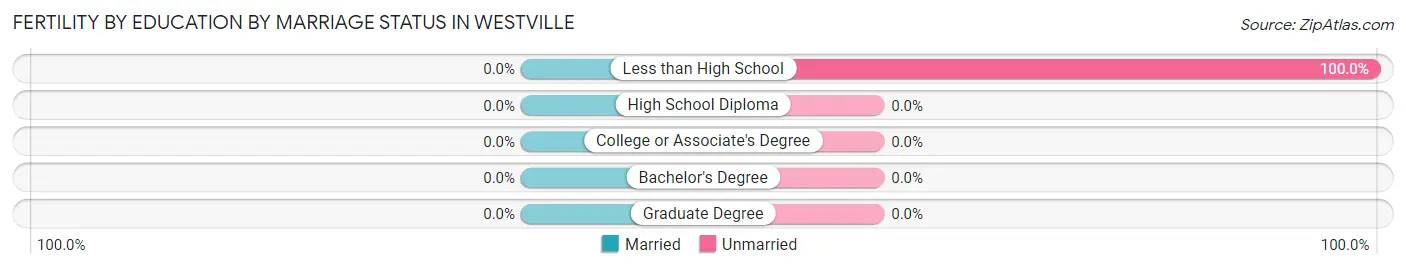
| Educational Attainment | Married | Unmarried |
| Less than High School | 0 (0.0%) | 2 (100.0%) |
| High School Diploma | 0 (0.0%) | 0 (0.0%) |
| College or Associate's Degree | 0 (0.0%) | 0 (0.0%) |
| Bachelor's Degree | 0 (0.0%) | 0 (0.0%) |
| Graduate Degree | 0 (0.0%) | 0 (0.0%) |
| Total | 0 (0.0%) | 2 (100.0%) |
Employment Characteristics in Westville
Employment by Class of Employer in Westville
Among the 131 employed individuals in Westville, private company employees (64 | 48.8%), state government employees (24 | 18.3%), and not-for-profit organizations (19 | 14.5%) make up the most common classes of employment.
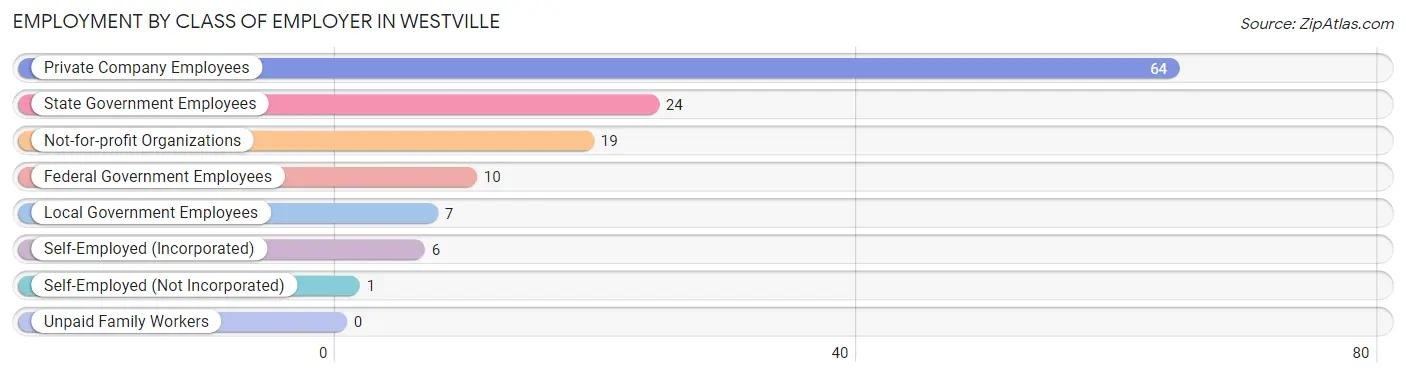
| Employer Class | # Employees | % Employees |
| Private Company Employees | 64 | 48.8% |
| Self-Employed (Incorporated) | 6 | 4.6% |
| Self-Employed (Not Incorporated) | 1 | 0.8% |
| Not-for-profit Organizations | 19 | 14.5% |
| Local Government Employees | 7 | 5.3% |
| State Government Employees | 24 | 18.3% |
| Federal Government Employees | 10 | 7.6% |
| Unpaid Family Workers | 0 | 0.0% |
| Total | 131 | 100.0% |
Employment Status by Age in Westville
According to the labor force statistics for Westville, out of the total population over 16 years of age (233), 56.7% or 132 individuals are in the labor force, with 0.8% or 1 of them unemployed. The age group with the highest labor force participation rate is 30 to 34 years, with 100.0% or 8 individuals in the labor force. Within the labor force, the 16 to 19 years age range has the highest percentage of unemployed individuals, with 100.0% or 1 of them being unemployed.
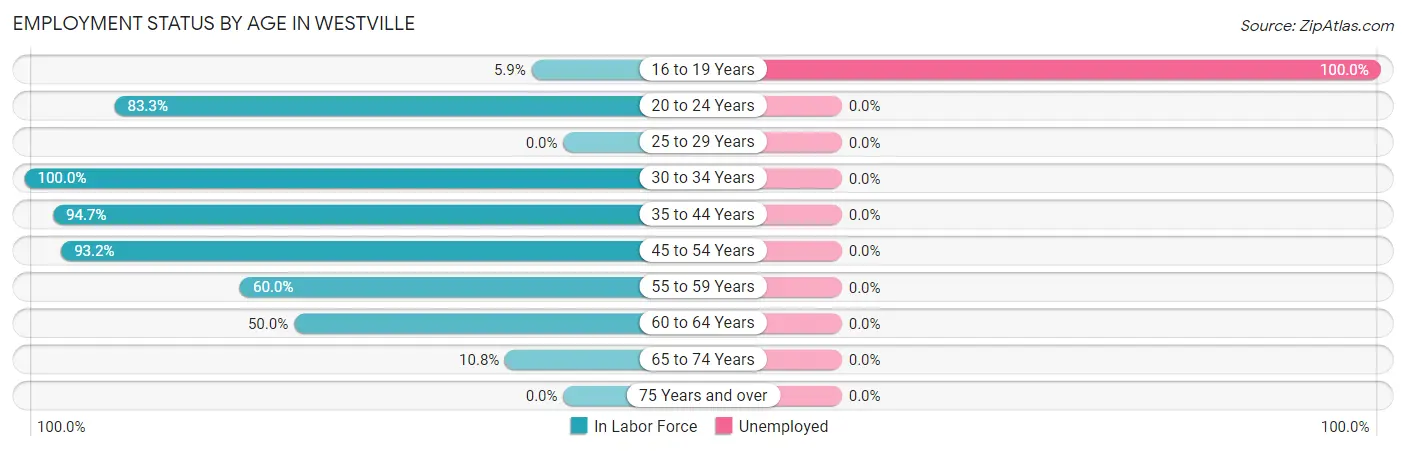
| Age Bracket | In Labor Force | Unemployed |
| 16 to 19 Years | 1 (5.9%) | 1 (100.0%) |
| 20 to 24 Years | 10 (83.3%) | 0 (0.0%) |
| 25 to 29 Years | 0 (0.0%) | 0 (0.0%) |
| 30 to 34 Years | 8 (100.0%) | 0 (0.0%) |
| 35 to 44 Years | 36 (94.7%) | 0 (0.0%) |
| 45 to 54 Years | 41 (93.2%) | 0 (0.0%) |
| 55 to 59 Years | 15 (60.0%) | 0 (0.0%) |
| 60 to 64 Years | 17 (50.0%) | 0 (0.0%) |
| 65 to 74 Years | 4 (10.8%) | 0 (0.0%) |
| 75 Years and over | 0 (0.0%) | 0 (0.0%) |
| Total | 132 (56.7%) | 1 (0.8%) |
Employment Status by Educational Attainment in Westville
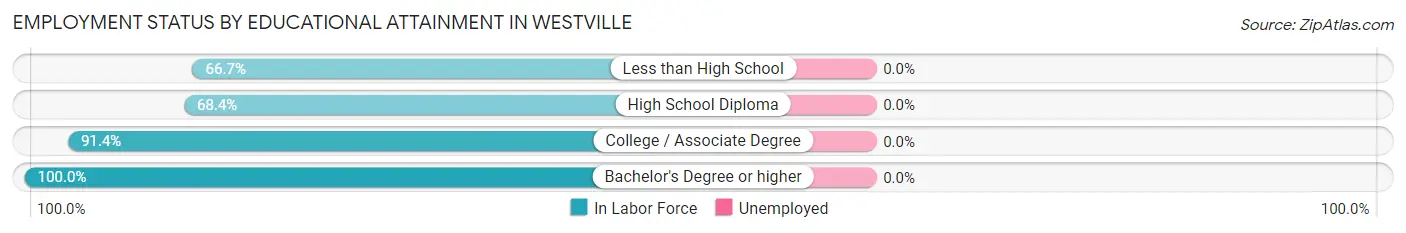
| Educational Attainment | In Labor Force | Unemployed |
| Less than High School | 8 (66.7%) | 0 (0.0%) |
| High School Diploma | 54 (68.4%) | 0 (0.0%) |
| College / Associate Degree | 32 (91.4%) | 0 (0.0%) |
| Bachelor's Degree or higher | 23 (100.0%) | 0 (0.0%) |
| Total | 117 (78.5%) | 0 (0.0%) |
Employment Occupations by Sex in Westville
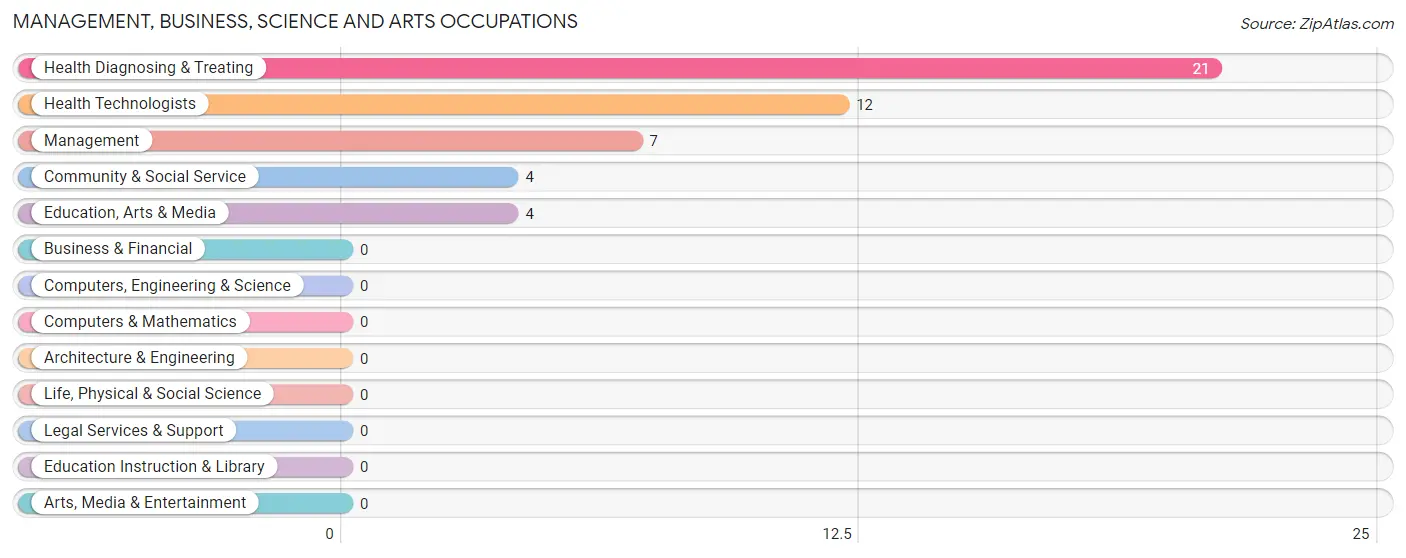
Management, Business, Science and Arts Occupations
The most common Management, Business, Science and Arts occupations in Westville are Health Diagnosing & Treating (21 | 16.0%), Health Technologists (12 | 9.2%), Management (7 | 5.3%), Community & Social Service (4 | 3.0%), and Education, Arts & Media (4 | 3.0%).
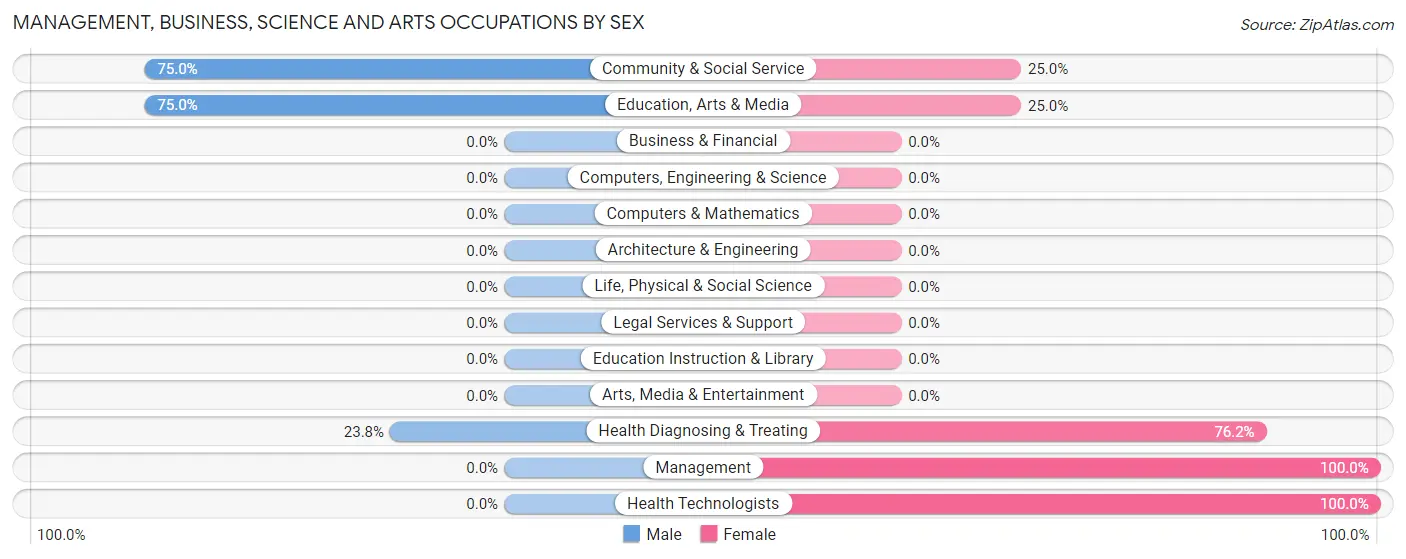
Management, Business, Science and Arts Occupations by Sex
Within the Management, Business, Science and Arts occupations in Westville, the most male-oriented occupations are Community & Social Service (75.0%), Education, Arts & Media (75.0%), and Health Diagnosing & Treating (23.8%), while the most female-oriented occupations are Management (100.0%), Health Technologists (100.0%), and Health Diagnosing & Treating (76.2%).
| Occupation | Male | Female |
| Management | 0 (0.0%) | 7 (100.0%) |
| Business & Financial | 0 (0.0%) | 0 (0.0%) |
| Computers, Engineering & Science | 0 (0.0%) | 0 (0.0%) |
| Computers & Mathematics | 0 (0.0%) | 0 (0.0%) |
| Architecture & Engineering | 0 (0.0%) | 0 (0.0%) |
| Life, Physical & Social Science | 0 (0.0%) | 0 (0.0%) |
| Community & Social Service | 3 (75.0%) | 1 (25.0%) |
| Education, Arts & Media | 3 (75.0%) | 1 (25.0%) |
| Legal Services & Support | 0 (0.0%) | 0 (0.0%) |
| Education Instruction & Library | 0 (0.0%) | 0 (0.0%) |
| Arts, Media & Entertainment | 0 (0.0%) | 0 (0.0%) |
| Health Diagnosing & Treating | 5 (23.8%) | 16 (76.2%) |
| Health Technologists | 0 (0.0%) | 12 (100.0%) |
| Total (Category) | 8 (25.0%) | 24 (75.0%) |
| Total (Overall) | 79 (60.3%) | 52 (39.7%) |
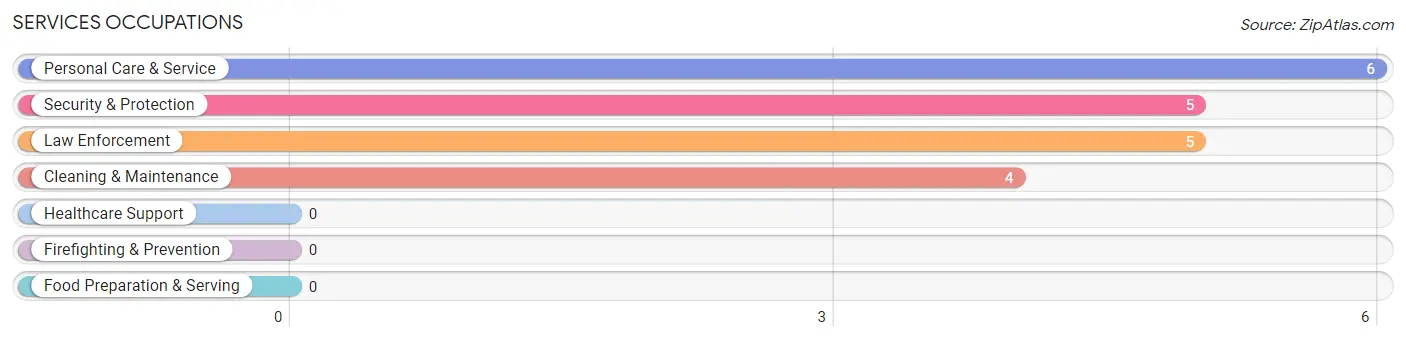
Services Occupations
The most common Services occupations in Westville are Personal Care & Service (6 | 4.6%), Security & Protection (5 | 3.8%), Law Enforcement (5 | 3.8%), and Cleaning & Maintenance (4 | 3.0%).
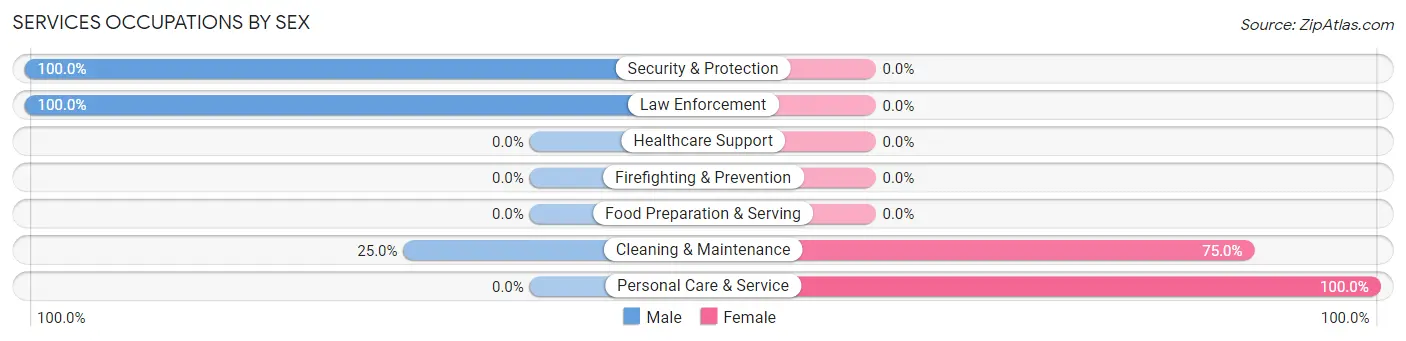
Services Occupations by Sex
Within the Services occupations in Westville, the most male-oriented occupations are Security & Protection (100.0%), Law Enforcement (100.0%), and Cleaning & Maintenance (25.0%), while the most female-oriented occupations are Personal Care & Service (100.0%), and Cleaning & Maintenance (75.0%).
| Occupation | Male | Female |
| Healthcare Support | 0 (0.0%) | 0 (0.0%) |
| Security & Protection | 5 (100.0%) | 0 (0.0%) |
| Firefighting & Prevention | 0 (0.0%) | 0 (0.0%) |
| Law Enforcement | 5 (100.0%) | 0 (0.0%) |
| Food Preparation & Serving | 0 (0.0%) | 0 (0.0%) |
| Cleaning & Maintenance | 1 (25.0%) | 3 (75.0%) |
| Personal Care & Service | 0 (0.0%) | 6 (100.0%) |
| Total (Category) | 6 (40.0%) | 9 (60.0%) |
| Total (Overall) | 79 (60.3%) | 52 (39.7%) |
Sales and Office Occupations
The most common Sales and Office occupations in Westville are Office & Administration (14 | 10.7%), and Sales & Related (7 | 5.3%).

Sales and Office Occupations by Sex

| Occupation | Male | Female |
| Sales & Related | 2 (28.6%) | 5 (71.4%) |
| Office & Administration | 0 (0.0%) | 14 (100.0%) |
| Total (Category) | 2 (9.5%) | 19 (90.5%) |
| Total (Overall) | 79 (60.3%) | 52 (39.7%) |
Natural Resources, Construction and Maintenance Occupations
The most common Natural Resources, Construction and Maintenance occupations in Westville are Construction & Extraction (36 | 27.5%), Installation, Maintenance & Repair (17 | 13.0%), and Farming, Fishing & Forestry (2 | 1.5%).
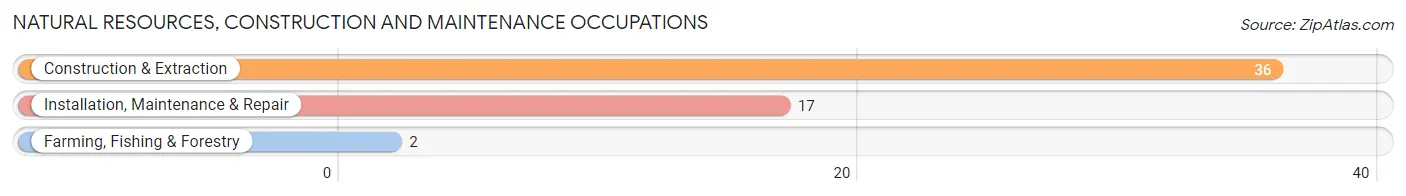
Natural Resources, Construction and Maintenance Occupations by Sex

| Occupation | Male | Female |
| Farming, Fishing & Forestry | 2 (100.0%) | 0 (0.0%) |
| Construction & Extraction | 36 (100.0%) | 0 (0.0%) |
| Installation, Maintenance & Repair | 17 (100.0%) | 0 (0.0%) |
| Total (Category) | 55 (100.0%) | 0 (0.0%) |
| Total (Overall) | 79 (60.3%) | 52 (39.7%) |
Production, Transportation and Moving Occupations
The most common Production, Transportation and Moving occupations in Westville are Production (4 | 3.0%), and Transportation (4 | 3.0%).
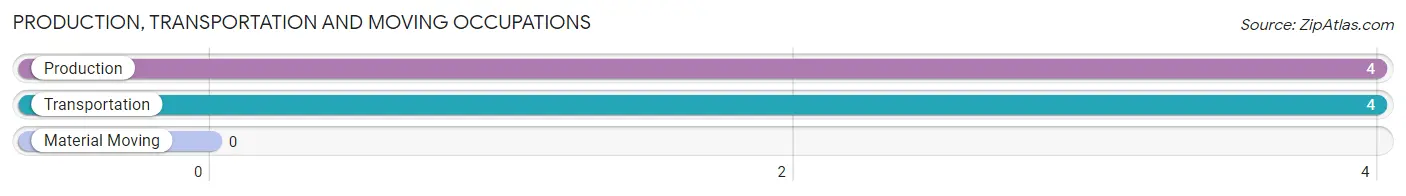
Production, Transportation and Moving Occupations by Sex
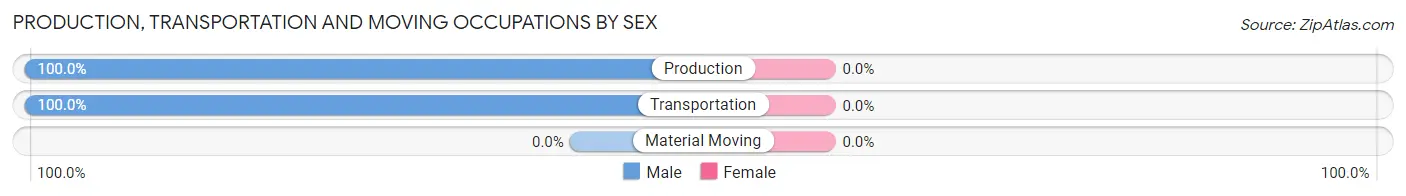
| Occupation | Male | Female |
| Production | 4 (100.0%) | 0 (0.0%) |
| Transportation | 4 (100.0%) | 0 (0.0%) |
| Material Moving | 0 (0.0%) | 0 (0.0%) |
| Total (Category) | 8 (100.0%) | 0 (0.0%) |
| Total (Overall) | 79 (60.3%) | 52 (39.7%) |
Employment Industries by Sex in Westville
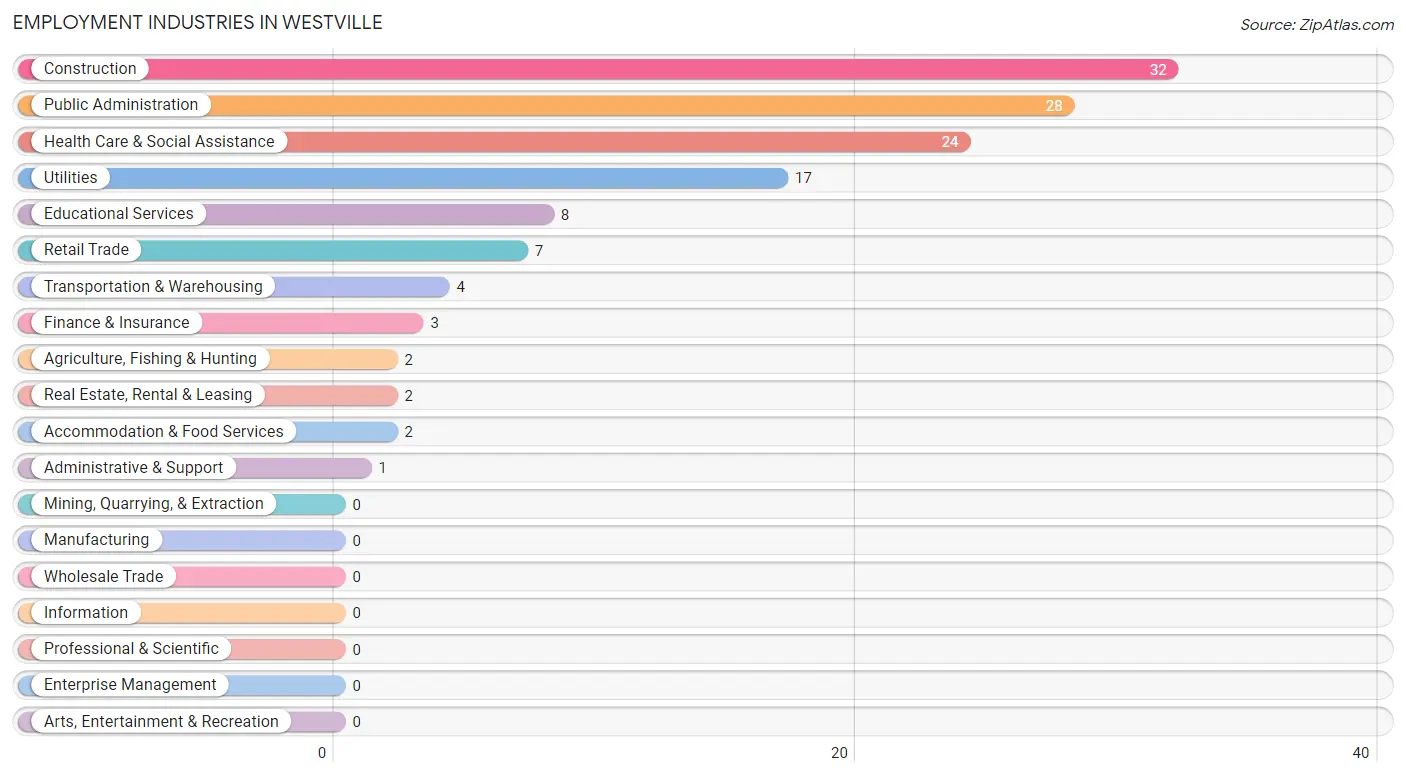
Employment Industries in Westville
The major employment industries in Westville include Construction (32 | 24.4%), Public Administration (28 | 21.4%), Health Care & Social Assistance (24 | 18.3%), Utilities (17 | 13.0%), and Educational Services (8 | 6.1%).
Employment Industries by Sex in Westville
The Westville industries that see more men than women are Agriculture, Fishing & Hunting (100.0%), Transportation & Warehousing (100.0%), and Utilities (100.0%), whereas the industries that tend to have a higher number of women are Finance & Insurance (100.0%), Real Estate, Rental & Leasing (100.0%), and Educational Services (100.0%).
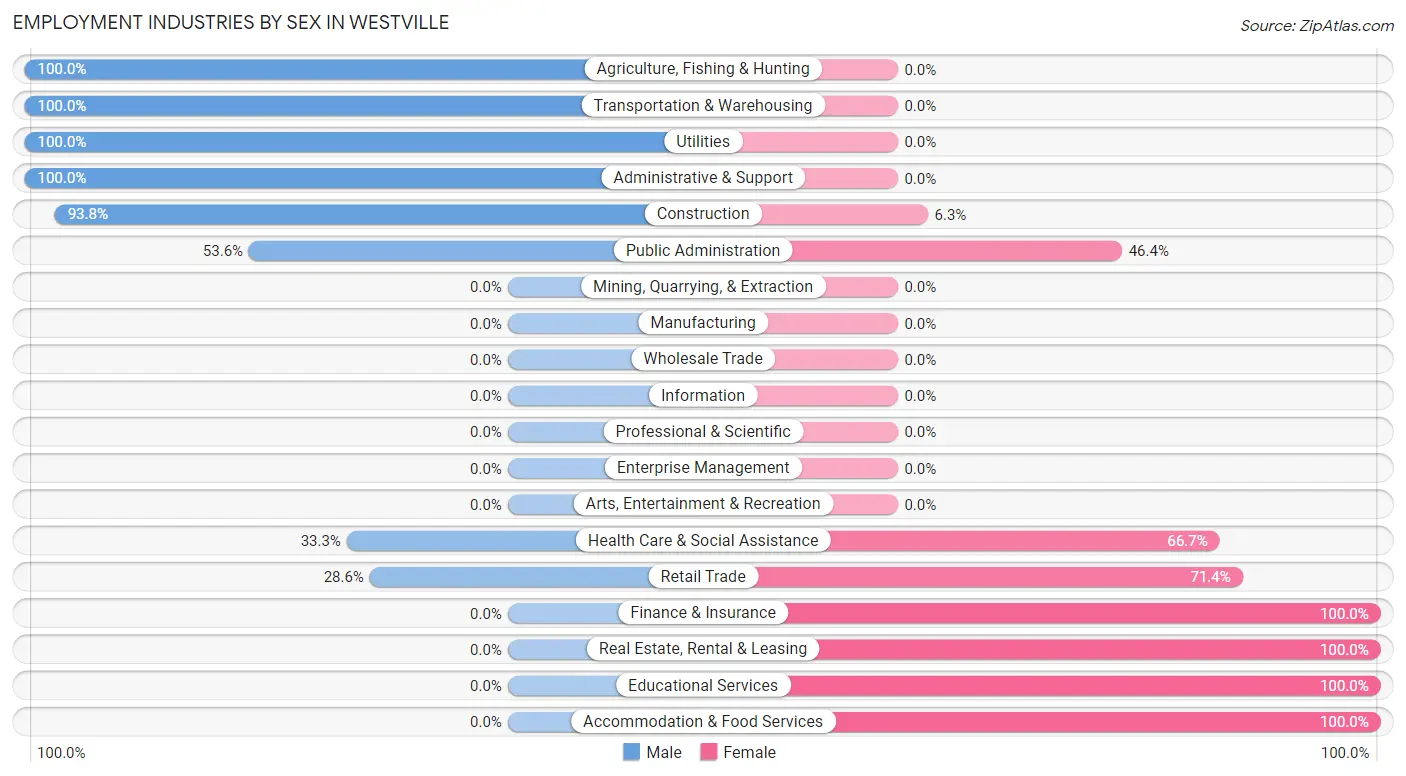
| Industry | Male | Female |
| Agriculture, Fishing & Hunting | 2 (100.0%) | 0 (0.0%) |
| Mining, Quarrying, & Extraction | 0 (0.0%) | 0 (0.0%) |
| Construction | 30 (93.8%) | 2 (6.2%) |
| Manufacturing | 0 (0.0%) | 0 (0.0%) |
| Wholesale Trade | 0 (0.0%) | 0 (0.0%) |
| Retail Trade | 2 (28.6%) | 5 (71.4%) |
| Transportation & Warehousing | 4 (100.0%) | 0 (0.0%) |
| Utilities | 17 (100.0%) | 0 (0.0%) |
| Information | 0 (0.0%) | 0 (0.0%) |
| Finance & Insurance | 0 (0.0%) | 3 (100.0%) |
| Real Estate, Rental & Leasing | 0 (0.0%) | 2 (100.0%) |
| Professional & Scientific | 0 (0.0%) | 0 (0.0%) |
| Enterprise Management | 0 (0.0%) | 0 (0.0%) |
| Administrative & Support | 1 (100.0%) | 0 (0.0%) |
| Educational Services | 0 (0.0%) | 8 (100.0%) |
| Health Care & Social Assistance | 8 (33.3%) | 16 (66.7%) |
| Arts, Entertainment & Recreation | 0 (0.0%) | 0 (0.0%) |
| Accommodation & Food Services | 0 (0.0%) | 2 (100.0%) |
| Public Administration | 15 (53.6%) | 13 (46.4%) |
| Total | 79 (60.3%) | 52 (39.7%) |
Education in Westville
School Enrollment in Westville
The most common levels of schooling among the 31 students in Westville are middle school (14 | 45.2%), high school (7 | 22.6%), and college / undergraduate (5 | 16.1%).
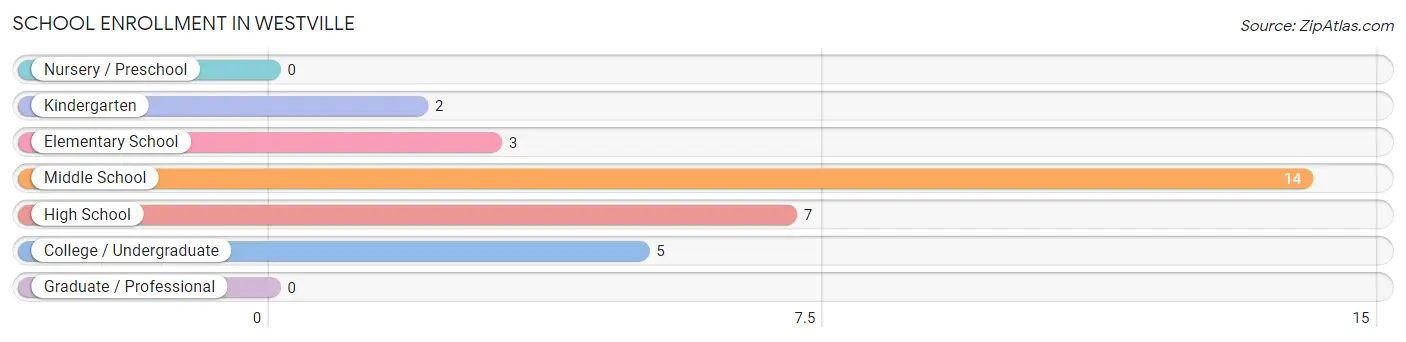
| School Level | # Students | % Students |
| Nursery / Preschool | 0 | 0.0% |
| Kindergarten | 2 | 6.5% |
| Elementary School | 3 | 9.7% |
| Middle School | 14 | 45.2% |
| High School | 7 | 22.6% |
| College / Undergraduate | 5 | 16.1% |
| Graduate / Professional | 0 | 0.0% |
| Total | 31 | 100.0% |
School Enrollment by Age by Funding Source in Westville
Out of a total of 31 students who are enrolled in schools in Westville, 4 (12.9%) attend a private institution, while the remaining 27 (87.1%) are enrolled in public schools. The age group of 10 to 14 year olds has the highest likelihood of being enrolled in private schools, with 4 (28.6% in the age bracket) enrolled. Conversely, the age group of 5 to 9 year old has the lowest likelihood of being enrolled in a private school, with 5 (100.0% in the age bracket) attending a public institution.
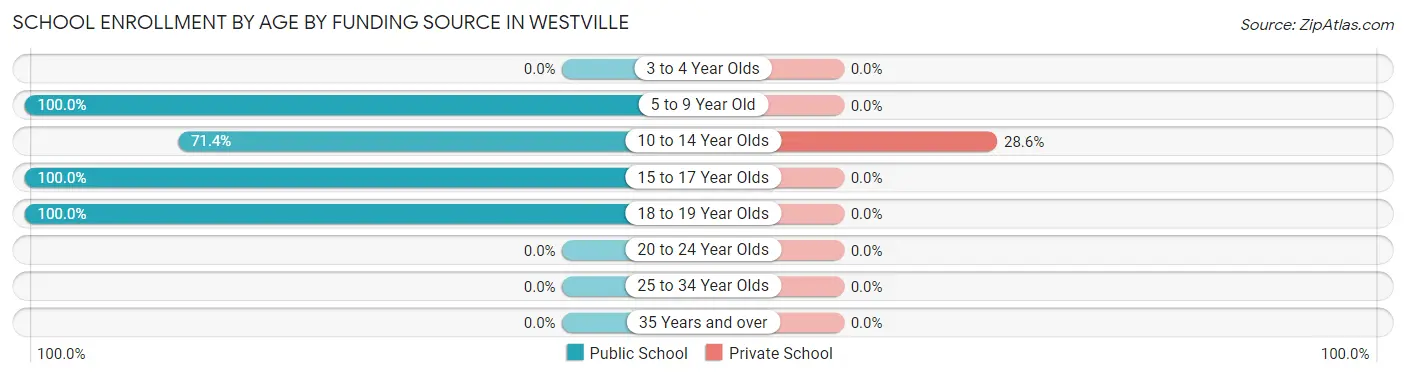
| Age Bracket | Public School | Private School |
| 3 to 4 Year Olds | 0 (0.0%) | 0 (0.0%) |
| 5 to 9 Year Old | 5 (100.0%) | 0 (0.0%) |
| 10 to 14 Year Olds | 10 (71.4%) | 4 (28.6%) |
| 15 to 17 Year Olds | 7 (100.0%) | 0 (0.0%) |
| 18 to 19 Year Olds | 5 (100.0%) | 0 (0.0%) |
| 20 to 24 Year Olds | 0 (0.0%) | 0 (0.0%) |
| 25 to 34 Year Olds | 0 (0.0%) | 0 (0.0%) |
| 35 Years and over | 0 (0.0%) | 0 (0.0%) |
| Total | 27 (87.1%) | 4 (12.9%) |
Educational Attainment by Field of Study in Westville
Engineering (10 | 35.7%), science & technology (5 | 17.9%), psychology (4 | 14.3%), arts & humanities (4 | 14.3%), and business (3 | 10.7%) are the most common fields of study among 28 individuals in Westville who have obtained a bachelor's degree or higher.
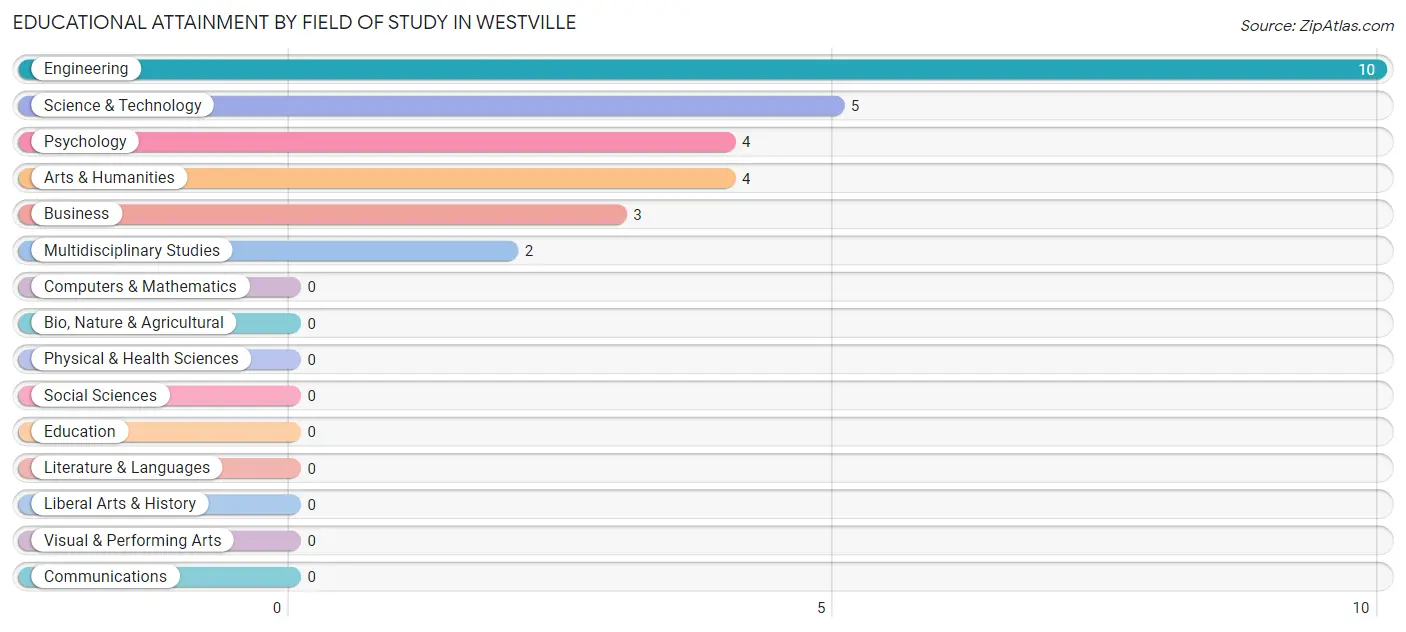
| Field of Study | # Graduates | % Graduates |
| Computers & Mathematics | 0 | 0.0% |
| Bio, Nature & Agricultural | 0 | 0.0% |
| Physical & Health Sciences | 0 | 0.0% |
| Psychology | 4 | 14.3% |
| Social Sciences | 0 | 0.0% |
| Engineering | 10 | 35.7% |
| Multidisciplinary Studies | 2 | 7.1% |
| Science & Technology | 5 | 17.9% |
| Business | 3 | 10.7% |
| Education | 0 | 0.0% |
| Literature & Languages | 0 | 0.0% |
| Liberal Arts & History | 0 | 0.0% |
| Visual & Performing Arts | 0 | 0.0% |
| Communications | 0 | 0.0% |
| Arts & Humanities | 4 | 14.3% |
| Total | 28 | 100.0% |
Transportation & Commute in Westville
Vehicle Availability by Sex in Westville
The most prevalent vehicle ownership categories in Westville are males with 2 vehicles (39, accounting for 49.4%) and females with 2 vehicles (25, making up 75.0%).
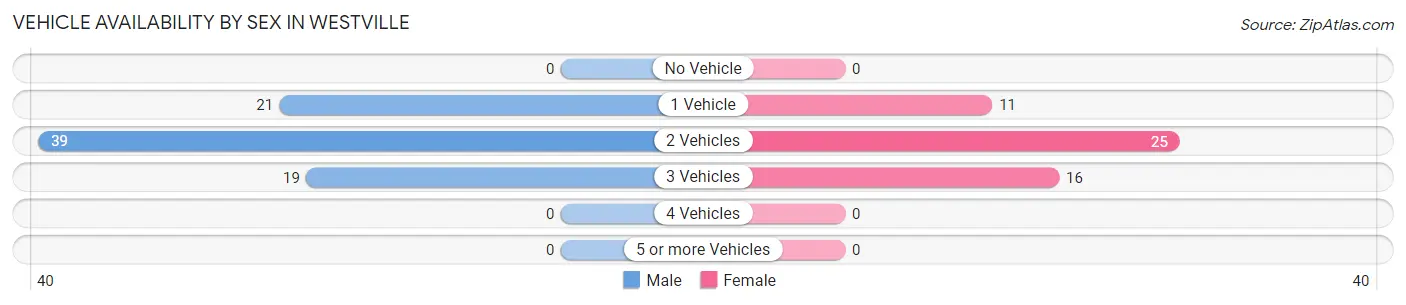
| Vehicles Available | Male | Female |
| No Vehicle | 0 (0.0%) | 0 (0.0%) |
| 1 Vehicle | 21 (26.6%) | 11 (21.1%) |
| 2 Vehicles | 39 (49.4%) | 25 (48.1%) |
| 3 Vehicles | 19 (24.0%) | 16 (30.8%) |
| 4 Vehicles | 0 (0.0%) | 0 (0.0%) |
| 5 or more Vehicles | 0 (0.0%) | 0 (0.0%) |
| Total | 79 (100.0%) | 52 (100.0%) |
Commute Time in Westville
The most frequently occuring commute durations in Westville are 30 to 34 minutes (38 commuters, 29.5%), 45 to 59 minutes (32 commuters, 24.8%), and 90 or more minutes (17 commuters, 13.2%).
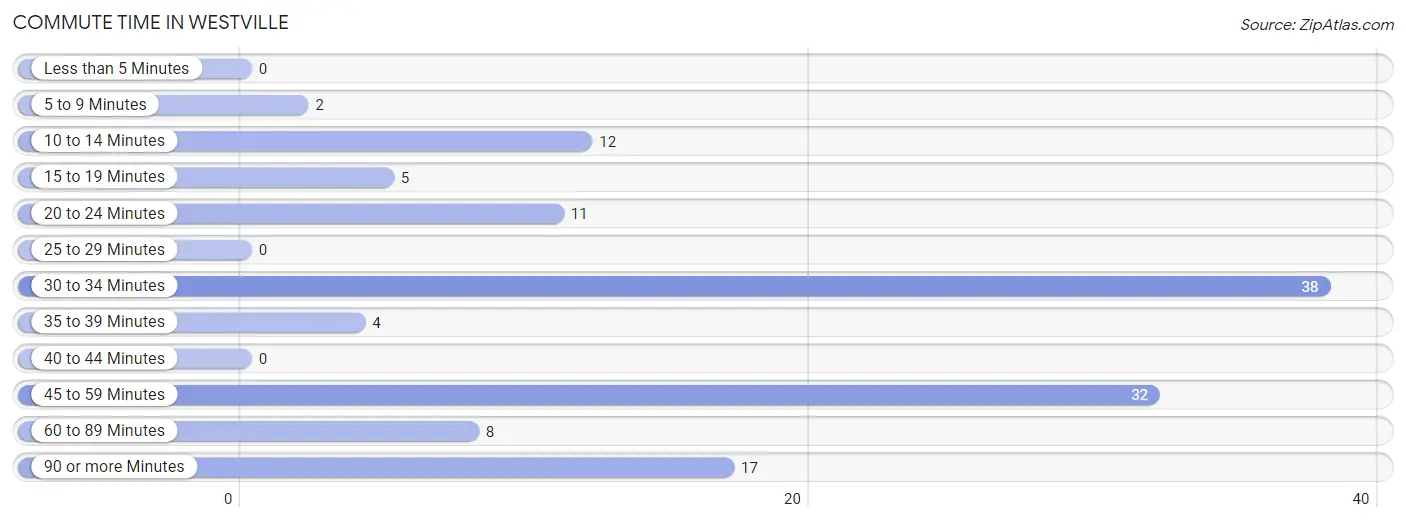
| Commute Time | # Commuters | % Commuters |
| Less than 5 Minutes | 0 | 0.0% |
| 5 to 9 Minutes | 2 | 1.5% |
| 10 to 14 Minutes | 12 | 9.3% |
| 15 to 19 Minutes | 5 | 3.9% |
| 20 to 24 Minutes | 11 | 8.5% |
| 25 to 29 Minutes | 0 | 0.0% |
| 30 to 34 Minutes | 38 | 29.5% |
| 35 to 39 Minutes | 4 | 3.1% |
| 40 to 44 Minutes | 0 | 0.0% |
| 45 to 59 Minutes | 32 | 24.8% |
| 60 to 89 Minutes | 8 | 6.2% |
| 90 or more Minutes | 17 | 13.2% |
Commute Time by Sex in Westville
The most common commute times in Westville are 30 to 34 minutes (26 commuters, 32.9%) for males and 45 to 59 minutes (17 commuters, 34.0%) for females.
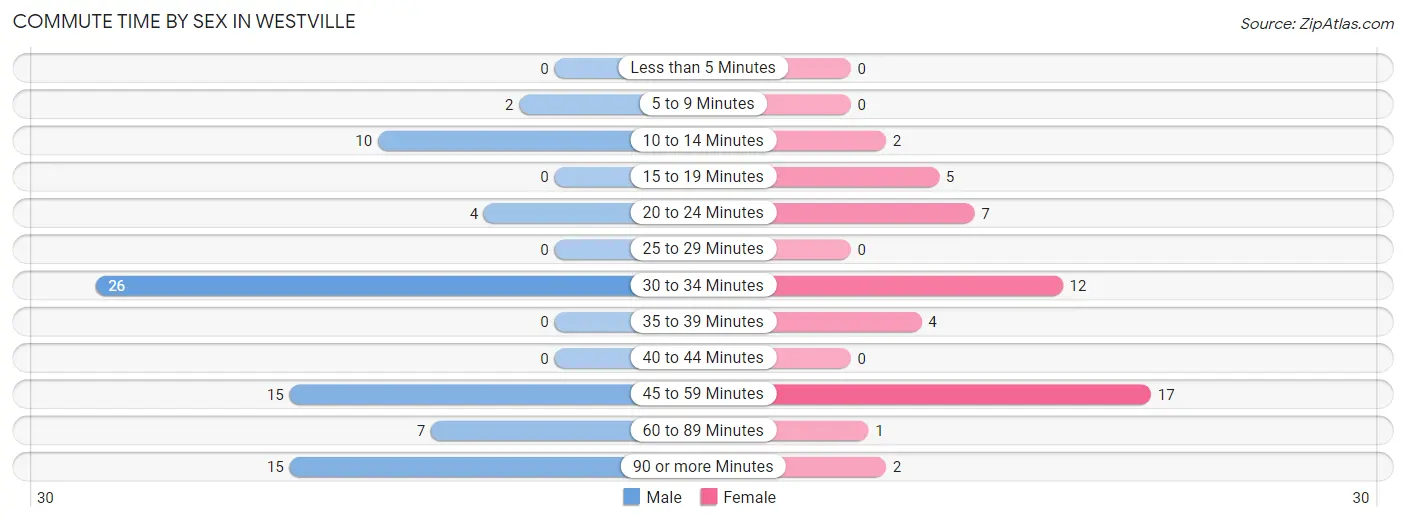
| Commute Time | Male | Female |
| Less than 5 Minutes | 0 (0.0%) | 0 (0.0%) |
| 5 to 9 Minutes | 2 (2.5%) | 0 (0.0%) |
| 10 to 14 Minutes | 10 (12.7%) | 2 (4.0%) |
| 15 to 19 Minutes | 0 (0.0%) | 5 (10.0%) |
| 20 to 24 Minutes | 4 (5.1%) | 7 (14.0%) |
| 25 to 29 Minutes | 0 (0.0%) | 0 (0.0%) |
| 30 to 34 Minutes | 26 (32.9%) | 12 (24.0%) |
| 35 to 39 Minutes | 0 (0.0%) | 4 (8.0%) |
| 40 to 44 Minutes | 0 (0.0%) | 0 (0.0%) |
| 45 to 59 Minutes | 15 (19.0%) | 17 (34.0%) |
| 60 to 89 Minutes | 7 (8.9%) | 1 (2.0%) |
| 90 or more Minutes | 15 (19.0%) | 2 (4.0%) |
Time of Departure to Work by Sex in Westville
The most frequent times of departure to work in Westville are 6:00 AM to 6:29 AM (40, 50.6%) for males and 6:00 AM to 6:29 AM (19, 38.0%) for females.
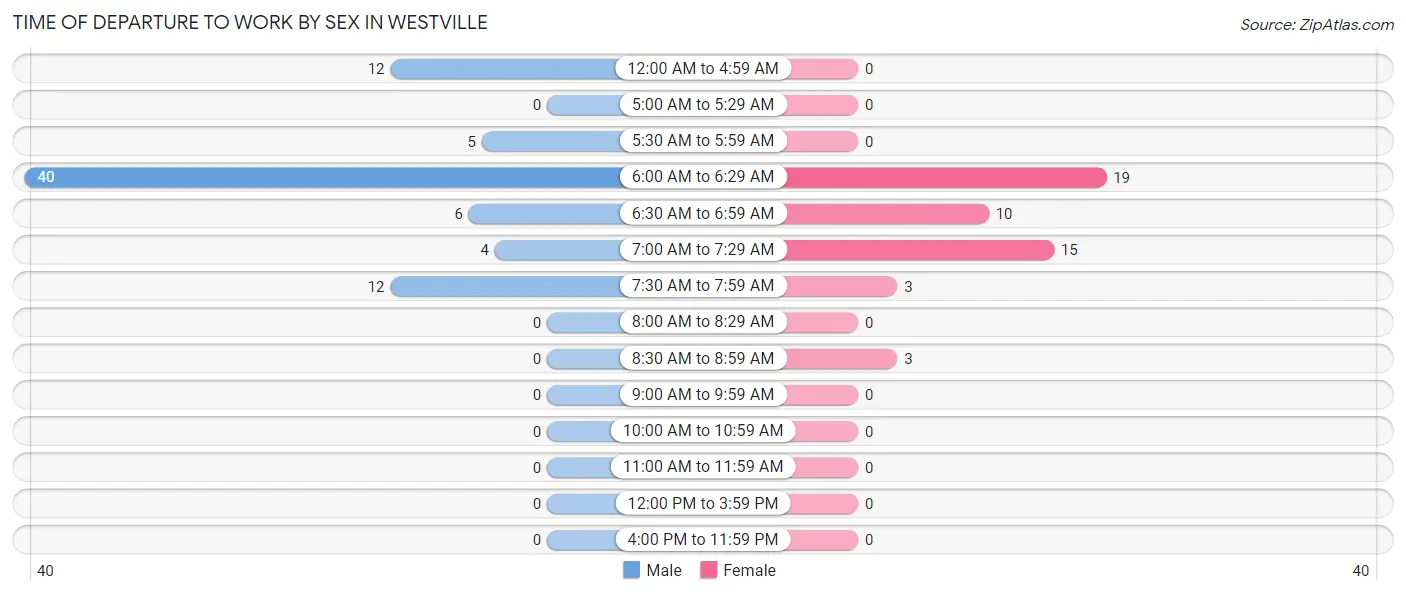
| Time of Departure | Male | Female |
| 12:00 AM to 4:59 AM | 12 (15.2%) | 0 (0.0%) |
| 5:00 AM to 5:29 AM | 0 (0.0%) | 0 (0.0%) |
| 5:30 AM to 5:59 AM | 5 (6.3%) | 0 (0.0%) |
| 6:00 AM to 6:29 AM | 40 (50.6%) | 19 (38.0%) |
| 6:30 AM to 6:59 AM | 6 (7.6%) | 10 (20.0%) |
| 7:00 AM to 7:29 AM | 4 (5.1%) | 15 (30.0%) |
| 7:30 AM to 7:59 AM | 12 (15.2%) | 3 (6.0%) |
| 8:00 AM to 8:29 AM | 0 (0.0%) | 0 (0.0%) |
| 8:30 AM to 8:59 AM | 0 (0.0%) | 3 (6.0%) |
| 9:00 AM to 9:59 AM | 0 (0.0%) | 0 (0.0%) |
| 10:00 AM to 10:59 AM | 0 (0.0%) | 0 (0.0%) |
| 11:00 AM to 11:59 AM | 0 (0.0%) | 0 (0.0%) |
| 12:00 PM to 3:59 PM | 0 (0.0%) | 0 (0.0%) |
| 4:00 PM to 11:59 PM | 0 (0.0%) | 0 (0.0%) |
| Total | 79 (100.0%) | 50 (100.0%) |
Housing Occupancy in Westville
Occupancy by Ownership in Westville
Of the total 120 dwellings in Westville, owner-occupied units account for 104 (86.7%), while renter-occupied units make up 16 (13.3%).
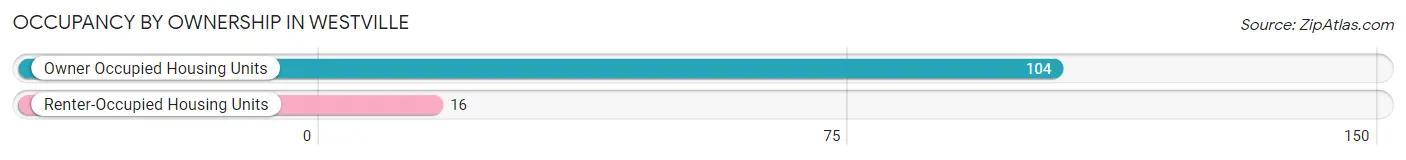
| Occupancy | # Housing Units | % Housing Units |
| Owner Occupied Housing Units | 104 | 86.7% |
| Renter-Occupied Housing Units | 16 | 13.3% |
| Total Occupied Housing Units | 120 | 100.0% |
Occupancy by Household Size in Westville
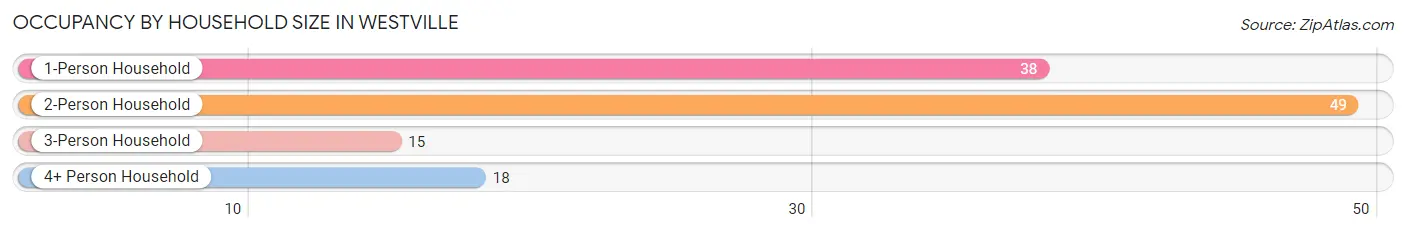
| Household Size | # Housing Units | % Housing Units |
| 1-Person Household | 38 | 31.7% |
| 2-Person Household | 49 | 40.8% |
| 3-Person Household | 15 | 12.5% |
| 4+ Person Household | 18 | 15.0% |
| Total Housing Units | 120 | 100.0% |
Occupancy by Ownership by Household Size in Westville
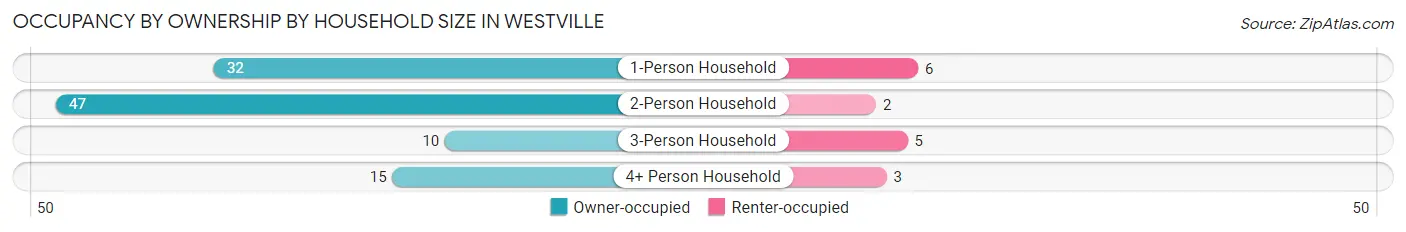
| Household Size | Owner-occupied | Renter-occupied |
| 1-Person Household | 32 (84.2%) | 6 (15.8%) |
| 2-Person Household | 47 (95.9%) | 2 (4.1%) |
| 3-Person Household | 10 (66.7%) | 5 (33.3%) |
| 4+ Person Household | 15 (83.3%) | 3 (16.7%) |
| Total Housing Units | 104 (86.7%) | 16 (13.3%) |
Occupancy by Educational Attainment in Westville
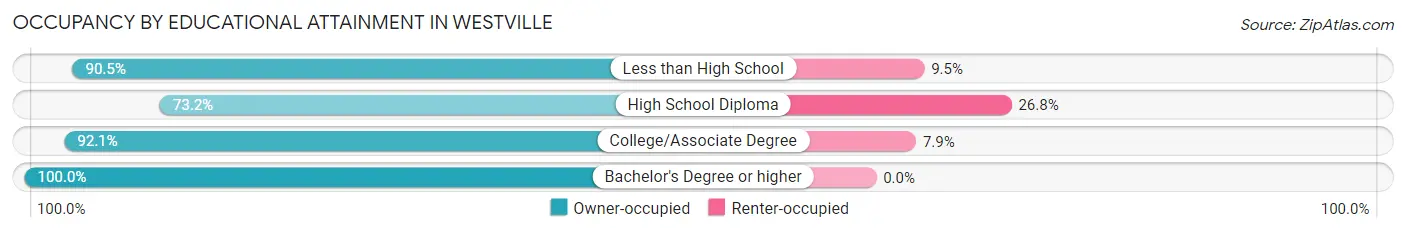
| Household Size | Owner-occupied | Renter-occupied |
| Less than High School | 19 (90.5%) | 2 (9.5%) |
| High School Diploma | 30 (73.2%) | 11 (26.8%) |
| College/Associate Degree | 35 (92.1%) | 3 (7.9%) |
| Bachelor's Degree or higher | 20 (100.0%) | 0 (0.0%) |
Occupancy by Age of Householder in Westville
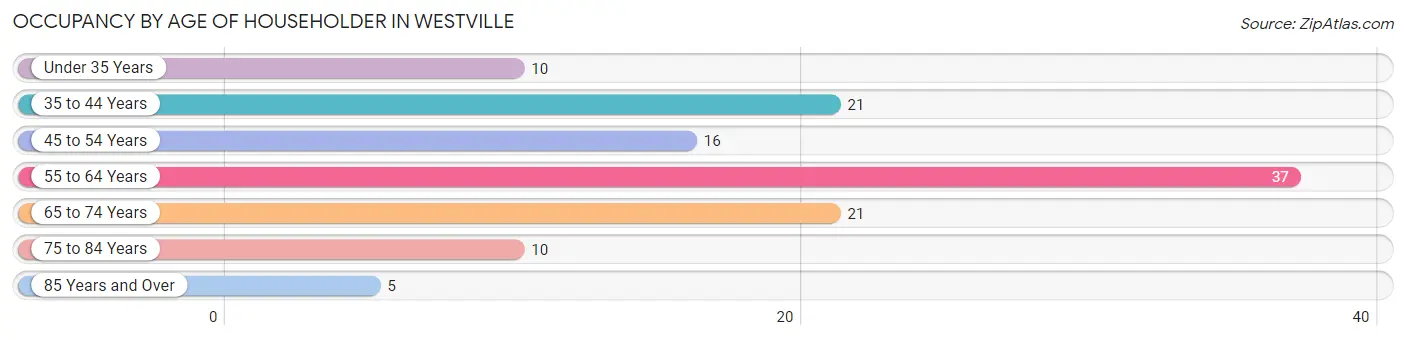
| Age Bracket | # Households | % Households |
| Under 35 Years | 10 | 8.3% |
| 35 to 44 Years | 21 | 17.5% |
| 45 to 54 Years | 16 | 13.3% |
| 55 to 64 Years | 37 | 30.8% |
| 65 to 74 Years | 21 | 17.5% |
| 75 to 84 Years | 10 | 8.3% |
| 85 Years and Over | 5 | 4.2% |
| Total | 120 | 100.0% |
Housing Finances in Westville
Median Income by Occupancy in Westville
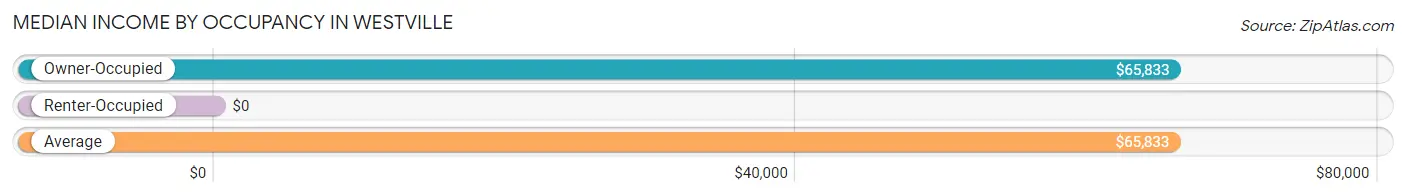
| Occupancy Type | # Households | Median Income |
| Owner-Occupied | 104 (86.7%) | $65,833 |
| Renter-Occupied | 16 (13.3%) | $0 |
| Average | 120 (100.0%) | $65,833 |
Occupancy by Householder Income Bracket in Westville
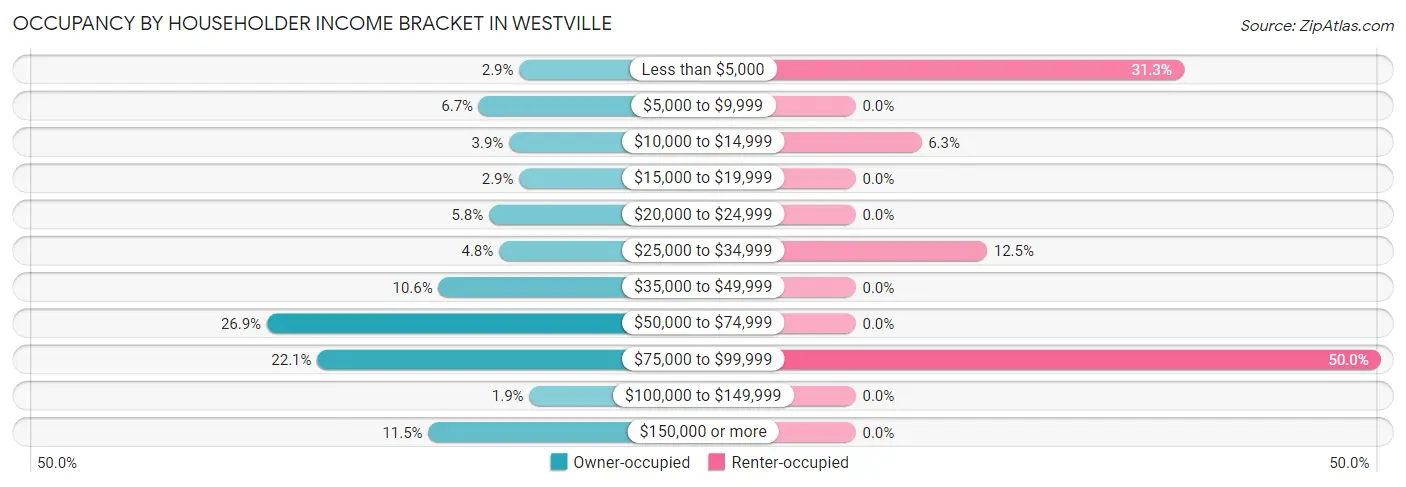
| Income Bracket | Owner-occupied | Renter-occupied |
| Less than $5,000 | 3 (2.9%) | 5 (31.2%) |
| $5,000 to $9,999 | 7 (6.7%) | 0 (0.0%) |
| $10,000 to $14,999 | 4 (3.8%) | 1 (6.2%) |
| $15,000 to $19,999 | 3 (2.9%) | 0 (0.0%) |
| $20,000 to $24,999 | 6 (5.8%) | 0 (0.0%) |
| $25,000 to $34,999 | 5 (4.8%) | 2 (12.5%) |
| $35,000 to $49,999 | 11 (10.6%) | 0 (0.0%) |
| $50,000 to $74,999 | 28 (26.9%) | 0 (0.0%) |
| $75,000 to $99,999 | 23 (22.1%) | 8 (50.0%) |
| $100,000 to $149,999 | 2 (1.9%) | 0 (0.0%) |
| $150,000 or more | 12 (11.5%) | 0 (0.0%) |
| Total | 104 (100.0%) | 16 (100.0%) |
Monthly Housing Cost Tiers in Westville
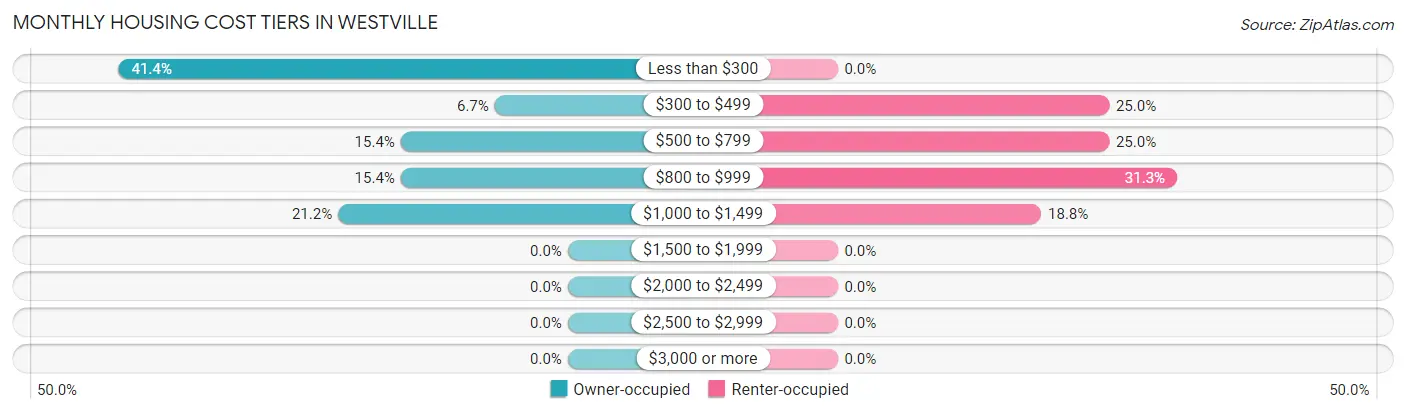
| Monthly Cost | Owner-occupied | Renter-occupied |
| Less than $300 | 43 (41.3%) | 0 (0.0%) |
| $300 to $499 | 7 (6.7%) | 4 (25.0%) |
| $500 to $799 | 16 (15.4%) | 4 (25.0%) |
| $800 to $999 | 16 (15.4%) | 5 (31.2%) |
| $1,000 to $1,499 | 22 (21.1%) | 3 (18.8%) |
| $1,500 to $1,999 | 0 (0.0%) | 0 (0.0%) |
| $2,000 to $2,499 | 0 (0.0%) | 0 (0.0%) |
| $2,500 to $2,999 | 0 (0.0%) | 0 (0.0%) |
| $3,000 or more | 0 (0.0%) | 0 (0.0%) |
| Total | 104 (100.0%) | 16 (100.0%) |
Physical Housing Characteristics in Westville
Housing Structures in Westville
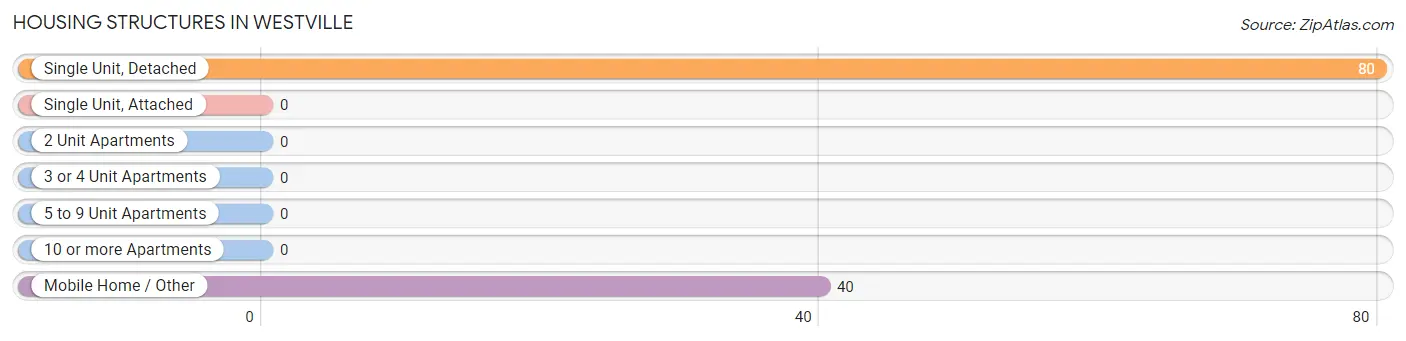
| Structure Type | # Housing Units | % Housing Units |
| Single Unit, Detached | 80 | 66.7% |
| Single Unit, Attached | 0 | 0.0% |
| 2 Unit Apartments | 0 | 0.0% |
| 3 or 4 Unit Apartments | 0 | 0.0% |
| 5 to 9 Unit Apartments | 0 | 0.0% |
| 10 or more Apartments | 0 | 0.0% |
| Mobile Home / Other | 40 | 33.3% |
| Total | 120 | 100.0% |
Housing Structures by Occupancy in Westville
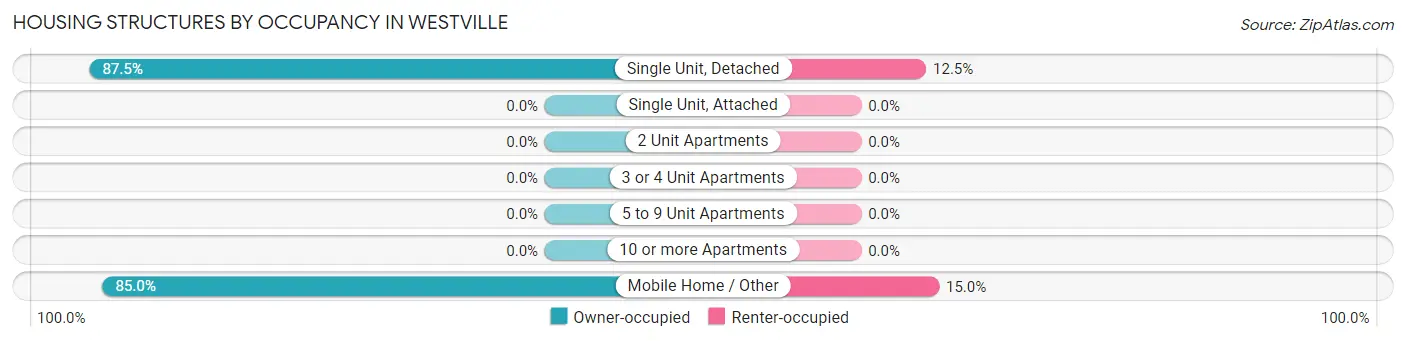
| Structure Type | Owner-occupied | Renter-occupied |
| Single Unit, Detached | 70 (87.5%) | 10 (12.5%) |
| Single Unit, Attached | 0 (0.0%) | 0 (0.0%) |
| 2 Unit Apartments | 0 (0.0%) | 0 (0.0%) |
| 3 or 4 Unit Apartments | 0 (0.0%) | 0 (0.0%) |
| 5 to 9 Unit Apartments | 0 (0.0%) | 0 (0.0%) |
| 10 or more Apartments | 0 (0.0%) | 0 (0.0%) |
| Mobile Home / Other | 34 (85.0%) | 6 (15.0%) |
| Total | 104 (86.7%) | 16 (13.3%) |
Housing Structures by Number of Rooms in Westville
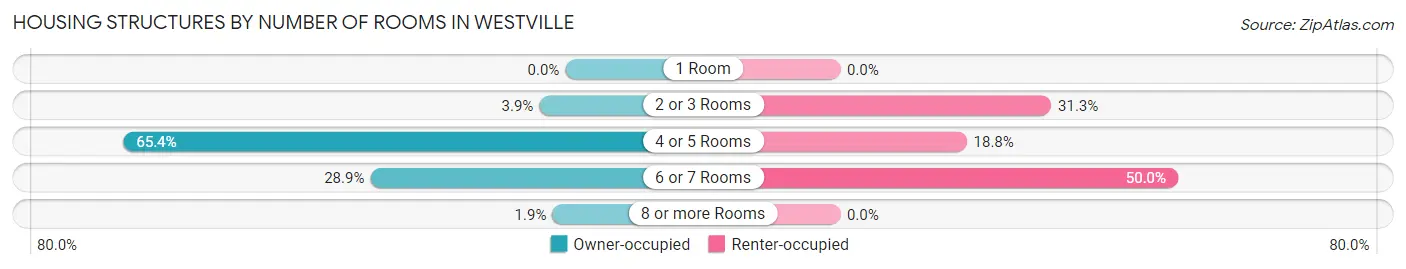
| Number of Rooms | Owner-occupied | Renter-occupied |
| 1 Room | 0 (0.0%) | 0 (0.0%) |
| 2 or 3 Rooms | 4 (3.8%) | 5 (31.2%) |
| 4 or 5 Rooms | 68 (65.4%) | 3 (18.8%) |
| 6 or 7 Rooms | 30 (28.8%) | 8 (50.0%) |
| 8 or more Rooms | 2 (1.9%) | 0 (0.0%) |
| Total | 104 (100.0%) | 16 (100.0%) |
Housing Structure by Heating Type in Westville
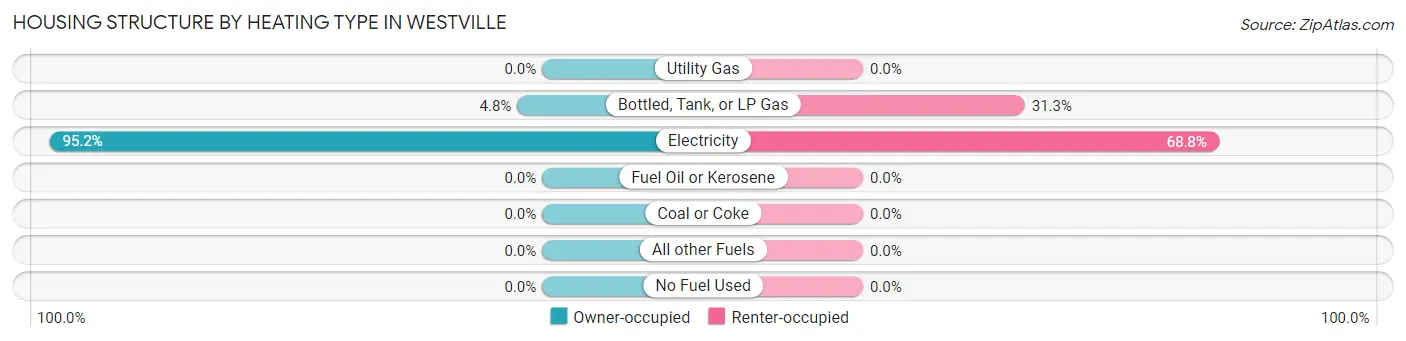
| Heating Type | Owner-occupied | Renter-occupied |
| Utility Gas | 0 (0.0%) | 0 (0.0%) |
| Bottled, Tank, or LP Gas | 5 (4.8%) | 5 (31.2%) |
| Electricity | 99 (95.2%) | 11 (68.8%) |
| Fuel Oil or Kerosene | 0 (0.0%) | 0 (0.0%) |
| Coal or Coke | 0 (0.0%) | 0 (0.0%) |
| All other Fuels | 0 (0.0%) | 0 (0.0%) |
| No Fuel Used | 0 (0.0%) | 0 (0.0%) |
| Total | 104 (100.0%) | 16 (100.0%) |
Household Vehicle Usage in Westville
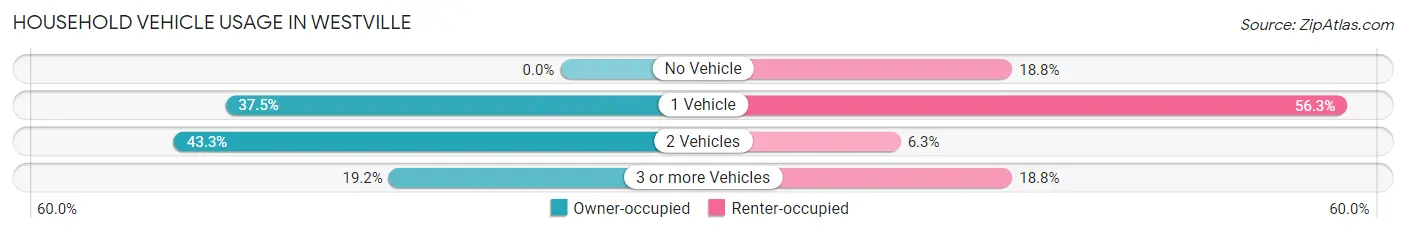
| Vehicles per Household | Owner-occupied | Renter-occupied |
| No Vehicle | 0 (0.0%) | 3 (18.8%) |
| 1 Vehicle | 39 (37.5%) | 9 (56.2%) |
| 2 Vehicles | 45 (43.3%) | 1 (6.2%) |
| 3 or more Vehicles | 20 (19.2%) | 3 (18.8%) |
| Total | 104 (100.0%) | 16 (100.0%) |
Real Estate & Mortgages in Westville
Real Estate and Mortgage Overview in Westville
| Characteristic | Without Mortgage | With Mortgage |
| Housing Units | 53 | 51 |
| Median Property Value | $75,000 | $165,600 |
| Median Household Income | $41,250 | $12 |
| Monthly Housing Costs | $225 | $0 |
| Real Estate Taxes | $206 | $2 |
Property Value by Mortgage Status in Westville
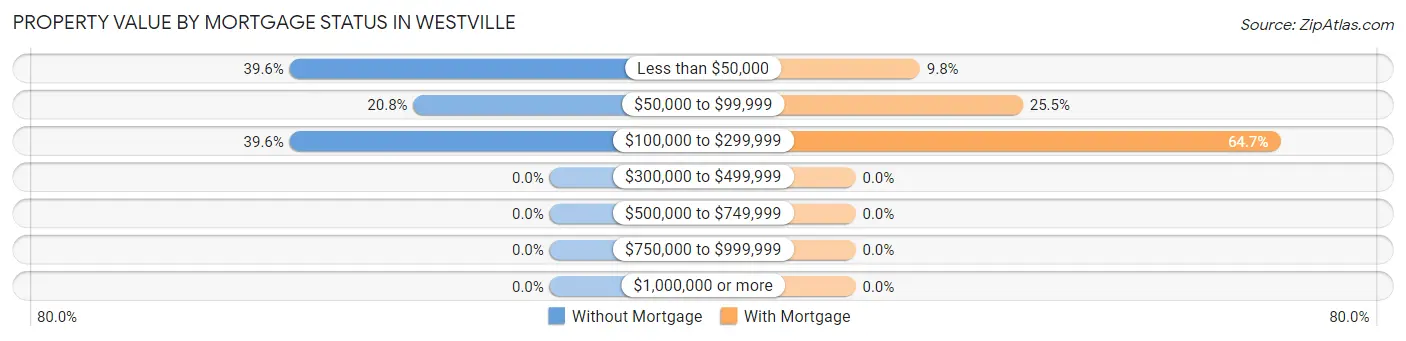
| Property Value | Without Mortgage | With Mortgage |
| Less than $50,000 | 21 (39.6%) | 5 (9.8%) |
| $50,000 to $99,999 | 11 (20.7%) | 13 (25.5%) |
| $100,000 to $299,999 | 21 (39.6%) | 33 (64.7%) |
| $300,000 to $499,999 | 0 (0.0%) | 0 (0.0%) |
| $500,000 to $749,999 | 0 (0.0%) | 0 (0.0%) |
| $750,000 to $999,999 | 0 (0.0%) | 0 (0.0%) |
| $1,000,000 or more | 0 (0.0%) | 0 (0.0%) |
| Total | 53 (100.0%) | 51 (100.0%) |
Household Income by Mortgage Status in Westville
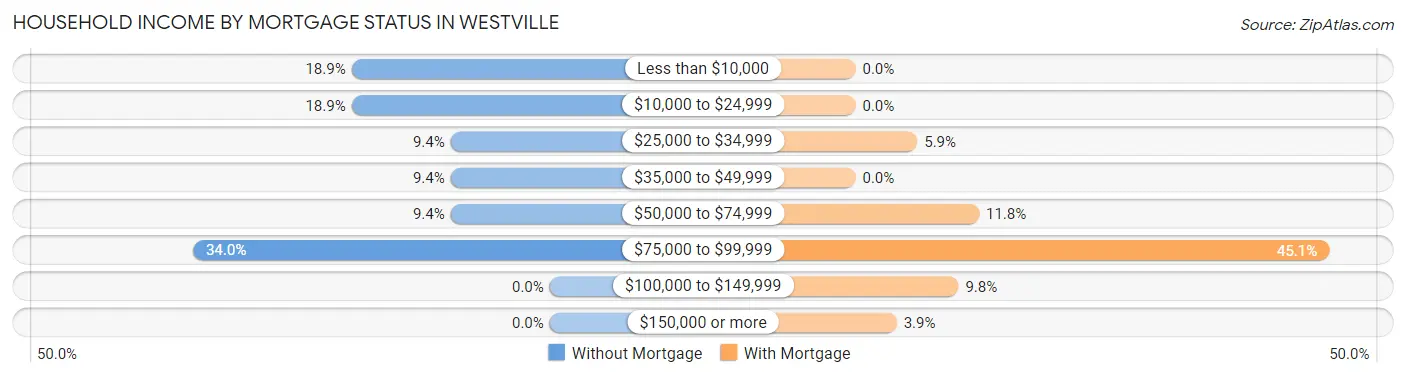
| Household Income | Without Mortgage | With Mortgage |
| Less than $10,000 | 10 (18.9%) | 0 (0.0%) |
| $10,000 to $24,999 | 10 (18.9%) | 0 (0.0%) |
| $25,000 to $34,999 | 5 (9.4%) | 3 (5.9%) |
| $35,000 to $49,999 | 5 (9.4%) | 0 (0.0%) |
| $50,000 to $74,999 | 5 (9.4%) | 6 (11.8%) |
| $75,000 to $99,999 | 18 (34.0%) | 23 (45.1%) |
| $100,000 to $149,999 | 0 (0.0%) | 5 (9.8%) |
| $150,000 or more | 0 (0.0%) | 2 (3.9%) |
| Total | 53 (100.0%) | 51 (100.0%) |
Property Value to Household Income Ratio in Westville
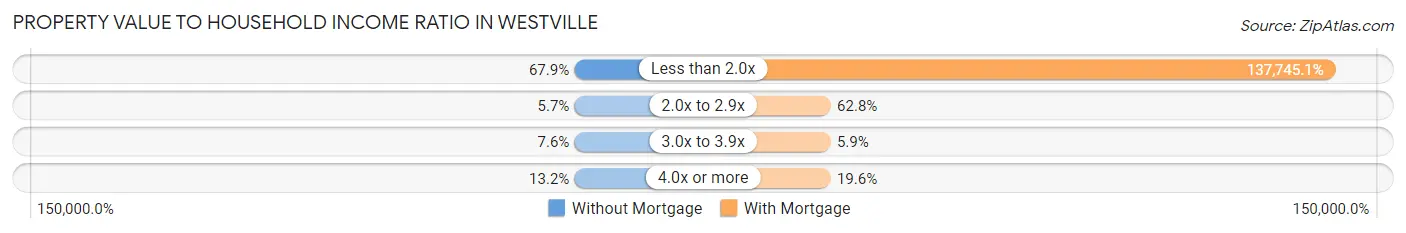
| Value-to-Income Ratio | Without Mortgage | With Mortgage |
| Less than 2.0x | 36 (67.9%) | 70,250 (137,745.1%) |
| 2.0x to 2.9x | 3 (5.7%) | 32 (62.7%) |
| 3.0x to 3.9x | 4 (7.5%) | 3 (5.9%) |
| 4.0x or more | 7 (13.2%) | 10 (19.6%) |
| Total | 53 (100.0%) | 51 (100.0%) |
Real Estate Taxes by Mortgage Status in Westville
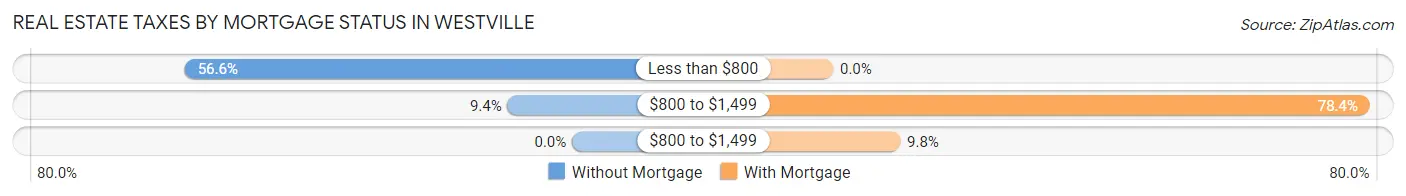
| Property Taxes | Without Mortgage | With Mortgage |
| Less than $800 | 30 (56.6%) | 0 (0.0%) |
| $800 to $1,499 | 5 (9.4%) | 40 (78.4%) |
| $800 to $1,499 | 0 (0.0%) | 5 (9.8%) |
| Total | 53 (100.0%) | 51 (100.0%) |
Health & Disability in Westville
Health Insurance Coverage by Age in Westville
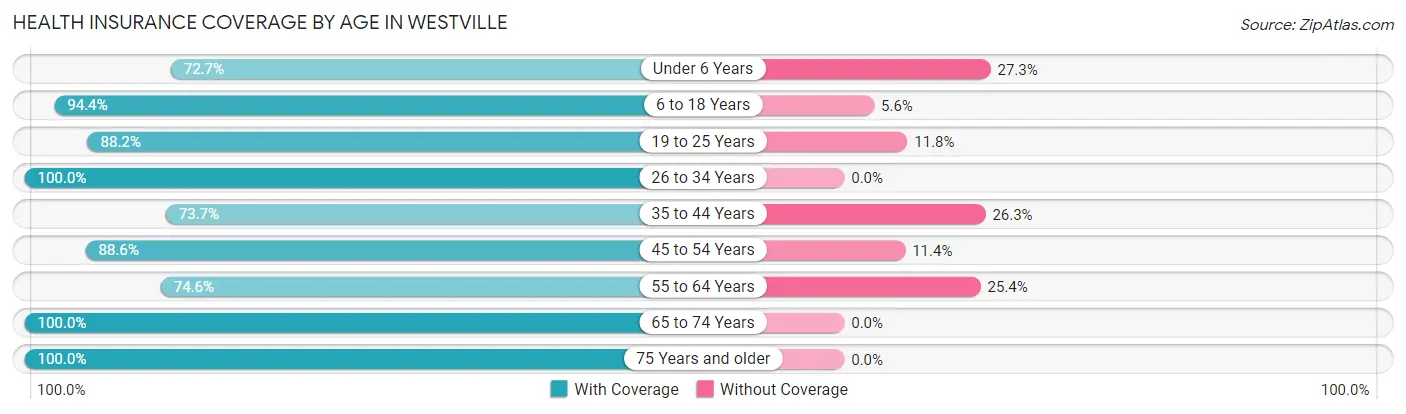
| Age Bracket | With Coverage | Without Coverage |
| Under 6 Years | 8 (72.7%) | 3 (27.3%) |
| 6 to 18 Years | 34 (94.4%) | 2 (5.6%) |
| 19 to 25 Years | 15 (88.2%) | 2 (11.8%) |
| 26 to 34 Years | 8 (100.0%) | 0 (0.0%) |
| 35 to 44 Years | 28 (73.7%) | 10 (26.3%) |
| 45 to 54 Years | 39 (88.6%) | 5 (11.4%) |
| 55 to 64 Years | 44 (74.6%) | 15 (25.4%) |
| 65 to 74 Years | 37 (100.0%) | 0 (0.0%) |
| 75 Years and older | 18 (100.0%) | 0 (0.0%) |
| Total | 231 (86.2%) | 37 (13.8%) |
Health Insurance Coverage by Citizenship Status in Westville
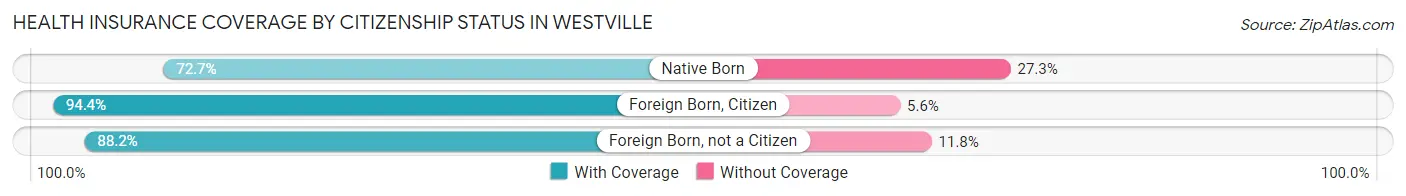
| Citizenship Status | With Coverage | Without Coverage |
| Native Born | 8 (72.7%) | 3 (27.3%) |
| Foreign Born, Citizen | 34 (94.4%) | 2 (5.6%) |
| Foreign Born, not a Citizen | 15 (88.2%) | 2 (11.8%) |
Health Insurance Coverage by Household Income in Westville
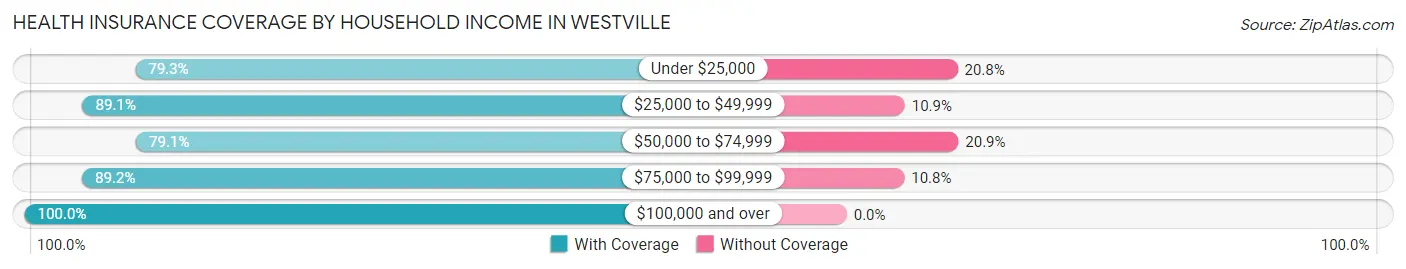
| Household Income | With Coverage | Without Coverage |
| Under $25,000 | 42 (79.2%) | 11 (20.7%) |
| $25,000 to $49,999 | 41 (89.1%) | 5 (10.9%) |
| $50,000 to $74,999 | 53 (79.1%) | 14 (20.9%) |
| $75,000 to $99,999 | 58 (89.2%) | 7 (10.8%) |
| $100,000 and over | 37 (100.0%) | 0 (0.0%) |
Public vs Private Health Insurance Coverage by Age in Westville
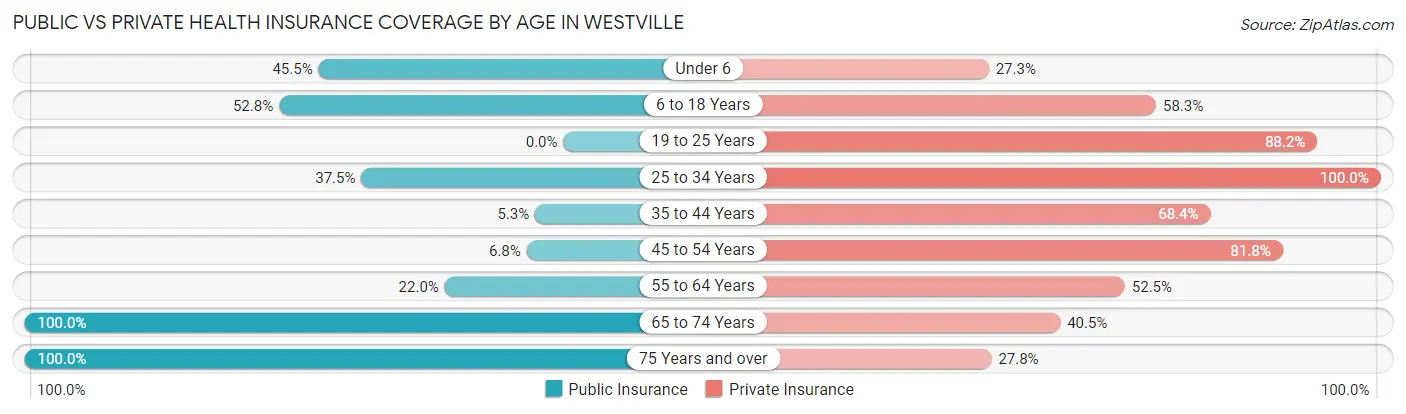
| Age Bracket | Public Insurance | Private Insurance |
| Under 6 | 5 (45.5%) | 3 (27.3%) |
| 6 to 18 Years | 19 (52.8%) | 21 (58.3%) |
| 19 to 25 Years | 0 (0.0%) | 15 (88.2%) |
| 25 to 34 Years | 3 (37.5%) | 8 (100.0%) |
| 35 to 44 Years | 2 (5.3%) | 26 (68.4%) |
| 45 to 54 Years | 3 (6.8%) | 36 (81.8%) |
| 55 to 64 Years | 13 (22.0%) | 31 (52.5%) |
| 65 to 74 Years | 37 (100.0%) | 15 (40.5%) |
| 75 Years and over | 18 (100.0%) | 5 (27.8%) |
| Total | 100 (37.3%) | 160 (59.7%) |
Disability Status by Sex by Age in Westville

| Age Bracket | Male | Female |
| Under 5 Years | 0 (0.0%) | 0 (0.0%) |
| 5 to 17 Years | 0 (0.0%) | 0 (0.0%) |
| 18 to 34 Years | 0 (0.0%) | 0 (0.0%) |
| 35 to 64 Years | 7 (9.5%) | 15 (22.4%) |
| 65 to 74 Years | 8 (66.7%) | 8 (32.0%) |
| 75 Years and over | 0 (0.0%) | 2 (25.0%) |
Disability Class by Sex by Age in Westville
Disability Class: Hearing Difficulty
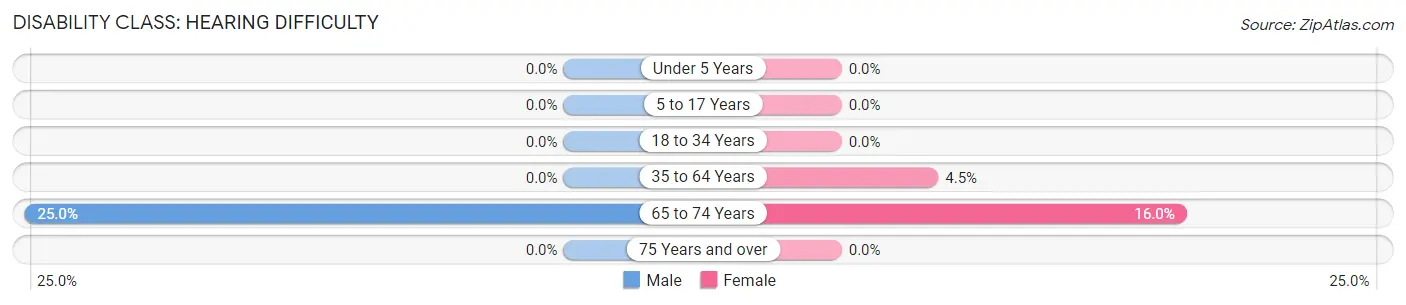
| Age Bracket | Male | Female |
| Under 5 Years | 0 (0.0%) | 0 (0.0%) |
| 5 to 17 Years | 0 (0.0%) | 0 (0.0%) |
| 18 to 34 Years | 0 (0.0%) | 0 (0.0%) |
| 35 to 64 Years | 0 (0.0%) | 3 (4.5%) |
| 65 to 74 Years | 3 (25.0%) | 4 (16.0%) |
| 75 Years and over | 0 (0.0%) | 0 (0.0%) |
Disability Class: Vision Difficulty
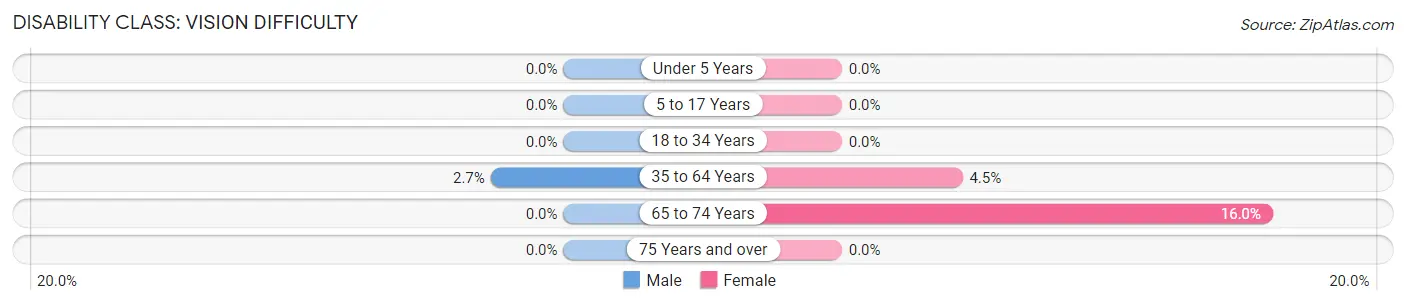
| Age Bracket | Male | Female |
| Under 5 Years | 0 (0.0%) | 0 (0.0%) |
| 5 to 17 Years | 0 (0.0%) | 0 (0.0%) |
| 18 to 34 Years | 0 (0.0%) | 0 (0.0%) |
| 35 to 64 Years | 2 (2.7%) | 3 (4.5%) |
| 65 to 74 Years | 0 (0.0%) | 4 (16.0%) |
| 75 Years and over | 0 (0.0%) | 0 (0.0%) |
Disability Class: Cognitive Difficulty
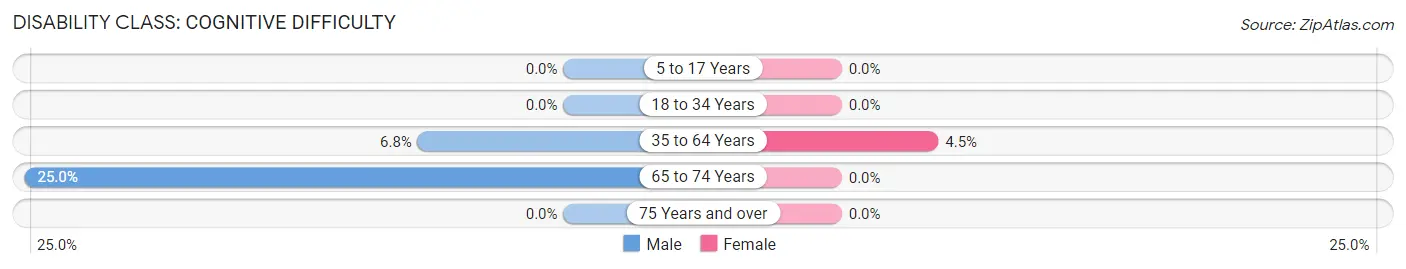
| Age Bracket | Male | Female |
| 5 to 17 Years | 0 (0.0%) | 0 (0.0%) |
| 18 to 34 Years | 0 (0.0%) | 0 (0.0%) |
| 35 to 64 Years | 5 (6.8%) | 3 (4.5%) |
| 65 to 74 Years | 3 (25.0%) | 0 (0.0%) |
| 75 Years and over | 0 (0.0%) | 0 (0.0%) |
Disability Class: Ambulatory Difficulty
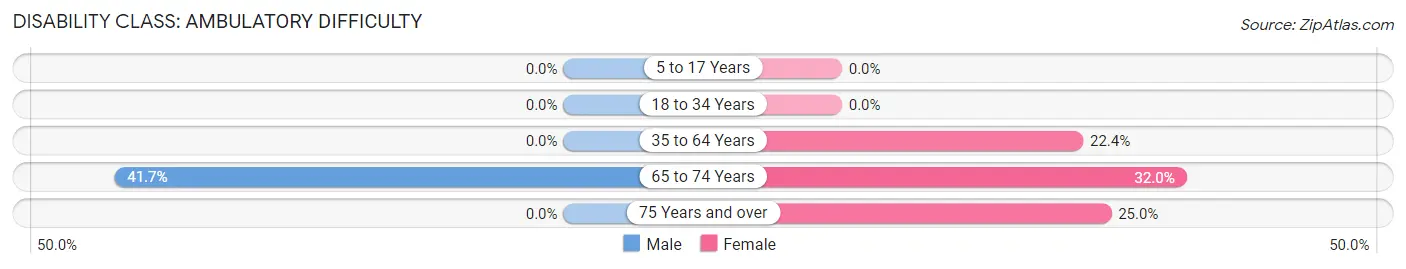
| Age Bracket | Male | Female |
| 5 to 17 Years | 0 (0.0%) | 0 (0.0%) |
| 18 to 34 Years | 0 (0.0%) | 0 (0.0%) |
| 35 to 64 Years | 0 (0.0%) | 15 (22.4%) |
| 65 to 74 Years | 5 (41.7%) | 8 (32.0%) |
| 75 Years and over | 0 (0.0%) | 2 (25.0%) |
Disability Class: Self-Care Difficulty
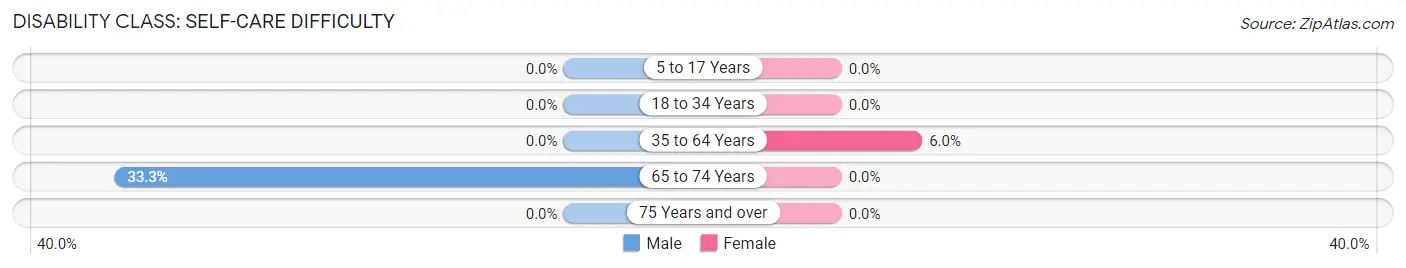
| Age Bracket | Male | Female |
| 5 to 17 Years | 0 (0.0%) | 0 (0.0%) |
| 18 to 34 Years | 0 (0.0%) | 0 (0.0%) |
| 35 to 64 Years | 0 (0.0%) | 4 (6.0%) |
| 65 to 74 Years | 4 (33.3%) | 0 (0.0%) |
| 75 Years and over | 0 (0.0%) | 0 (0.0%) |
Technology Access in Westville
Computing Device Access in Westville
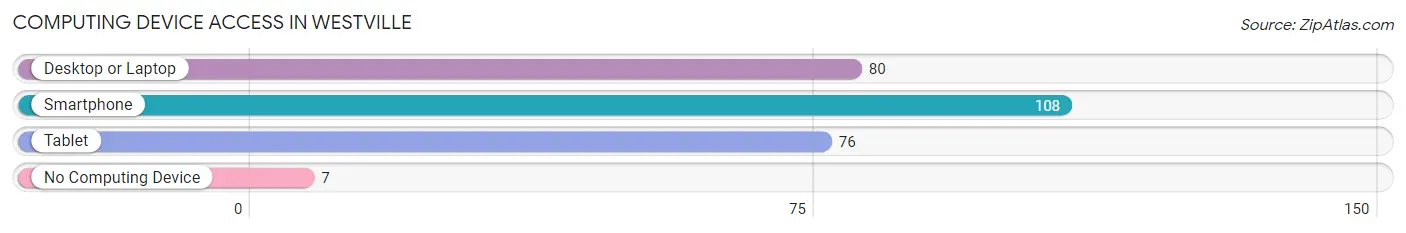
| Device Type | # Households | % Households |
| Desktop or Laptop | 80 | 66.7% |
| Smartphone | 108 | 90.0% |
| Tablet | 76 | 63.3% |
| No Computing Device | 7 | 5.8% |
| Total | 120 | 100.0% |
Internet Access in Westville
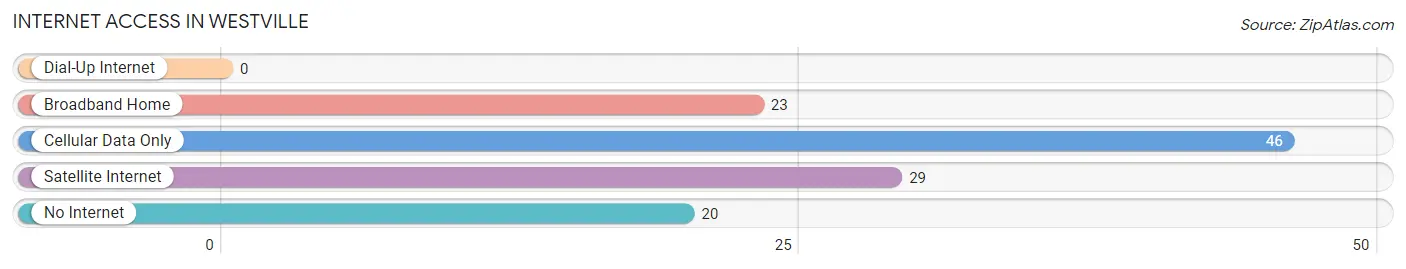
| Internet Type | # Households | % Households |
| Dial-Up Internet | 0 | 0.0% |
| Broadband Home | 23 | 19.2% |
| Cellular Data Only | 46 | 38.3% |
| Satellite Internet | 29 | 24.2% |
| No Internet | 20 | 16.7% |
| Total | 120 | 100.0% |
Westville Summary
History
The small town of Westville, Florida is located in Holmes County, in the northwest corner of the state. It was founded in 1883 by a group of settlers from Georgia, who were looking for a place to settle and start a new life. The town was named after the first settler, William West, who was a former Confederate soldier.
The town grew slowly but steadily, and by the early 1900s, it had become a thriving community. It was home to a variety of businesses, including a sawmill, a grist mill, a cotton gin, and a general store. The town also had a post office, a bank, and a school.
In the 1920s, Westville experienced a period of growth and prosperity. The town was home to several churches, a movie theater, and a variety of other businesses. The population of Westville peaked in the 1930s, with over 1,000 residents.
The Great Depression hit Westville hard, and the population began to decline. The town was further affected by the Dust Bowl of the 1930s, which caused many of the town’s residents to leave in search of work elsewhere. By the 1940s, the population had dropped to just over 500.
In the 1950s, Westville began to experience a resurgence. The town was home to a variety of businesses, including a furniture store, a grocery store, and a hardware store. The population of Westville began to grow again, and by the 1960s, it had reached over 1,000.
The town continued to grow throughout the 1970s and 1980s, and by the 1990s, the population had reached over 1,500. Today, Westville is a small but thriving community, with a population of around 2,000.
Geography
Westville is located in the northwest corner of Florida, in Holmes County. It is situated on the banks of the Choctawhatchee River, which flows through the town. The town is surrounded by rolling hills and lush forests, and is home to a variety of wildlife, including deer, wild turkeys, and bald eagles.
The climate in Westville is mild and humid, with hot summers and mild winters. The average temperature in the summer is around 90 degrees Fahrenheit, and in the winter it is around 50 degrees Fahrenheit. The town receives an average of 50 inches of rain per year.
Economy
Westville’s economy is largely based on agriculture and tourism. The town is home to several farms, which produce a variety of crops, including corn, soybeans, cotton, and peanuts. The town is also home to several tourist attractions, including a museum, a historic district, and a variety of outdoor activities.
The town is also home to a variety of businesses, including restaurants, retail stores, and service providers. The town is home to a number of manufacturing companies, which produce a variety of products, including furniture, clothing, and electronics.
Demographics
As of the 2010 census, the population of Westville was 2,039. The racial makeup of the town was 94.3% White, 2.3% African American, 0.7% Native American, 0.3% Asian, 0.1% Pacific Islander, and 2.3% from other races. The median household income was $30,938, and the median family income was $37,813.
The town is home to a variety of religious denominations, including Baptist, Methodist, and Catholic. The town is also home to a variety of cultural events, including the Westville Music Festival, the Westville Arts Festival, and the Westville Film Festival.
Conclusion
Westville, Florida is a small but thriving community located in Holmes County. The town was founded in 1883 by a group of settlers from Georgia, and has since grown to a population of over 2,000. The town’s economy is largely based on agriculture and tourism, and it is home to a variety of businesses, churches, and cultural events. Westville is a great place to live, work, and play.
Common Questions
What is Per Capita Income in Westville?
Per Capita income in Westville is $30,200.
What is the Median Family Income in Westville?
Median Family Income in Westville is $67,292.
What is the Median Household income in Westville?
Median Household Income in Westville is $65,833.
What is Income or Wage Gap in Westville?
Income or Wage Gap in Westville is 38.4%.
Women in Westville earn 61.6 cents for every dollar earned by a man.
What is Inequality or Gini Index in Westville?
Inequality or Gini Index in Westville is 0.38.
What is the Total Population of Westville?
Total Population of Westville is 268.
What is the Total Male Population of Westville?
Total Male Population of Westville is 124.
What is the Total Female Population of Westville?
Total Female Population of Westville is 144.
What is the Ratio of Males per 100 Females in Westville?
There are 86.11 Males per 100 Females in Westville.
What is the Ratio of Females per 100 Males in Westville?
There are 116.13 Females per 100 Males in Westville.
What is the Median Population Age in Westville?
Median Population Age in Westville is 52.8 Years.
What is the Average Family Size in Westville
Average Family Size in Westville is 2.9 People.
What is the Average Household Size in Westville
Average Household Size in Westville is 2.2 People.
How Large is the Labor Force in Westville?
There are 132 People in the Labor Forcein in Westville.
What is the Percentage of People in the Labor Force in Westville?
56.7% of People are in the Labor Force in Westville.
What is the Unemployment Rate in Westville?
Unemployment Rate in Westville is 0.8%.