Wauchula, FL Map & Demographics
Wauchula Map
Wauchula Overview
$19,691
PER CAPITA INCOME
$49,253
AVG FAMILY INCOME
$32,854
AVG HOUSEHOLD INCOME
28.5%
WAGE / INCOME GAP [ % ]
71.5¢/ $1
WAGE / INCOME GAP [ $ ]
0.49
INEQUALITY / GINI INDEX
4,898
TOTAL POPULATION
2,416
MALE POPULATION
2,482
FEMALE POPULATION
97.34
MALES / 100 FEMALES
102.73
FEMALES / 100 MALES
33.5
MEDIAN AGE
3.0
AVG FAMILY SIZE
2.5
AVG HOUSEHOLD SIZE
1,632
LABOR FORCE [ PEOPLE ]
47.7%
PERCENT IN LABOR FORCE
2.5%
UNEMPLOYMENT RATE
Wauchula Zip Codes
Wauchula Area Codes
Income in Wauchula
Income Overview in Wauchula
Per Capita Income in Wauchula is $19,691, while median incomes of families and households are $49,253 and $32,854 respectively.
| Characteristic | Number | Measure |
| Per Capita Income | 4,898 | $19,691 |
| Median Family Income | 1,241 | $49,253 |
| Mean Family Income | 1,241 | $65,134 |
| Median Household Income | 1,804 | $32,854 |
| Mean Household Income | 1,804 | $52,832 |
| Income Deficit | 1,241 | $0 |
| Wage / Income Gap (%) | 4,898 | 28.48% |
| Wage / Income Gap ($) | 4,898 | 71.52¢ per $1 |
| Gini / Inequality Index | 4,898 | 0.49 |
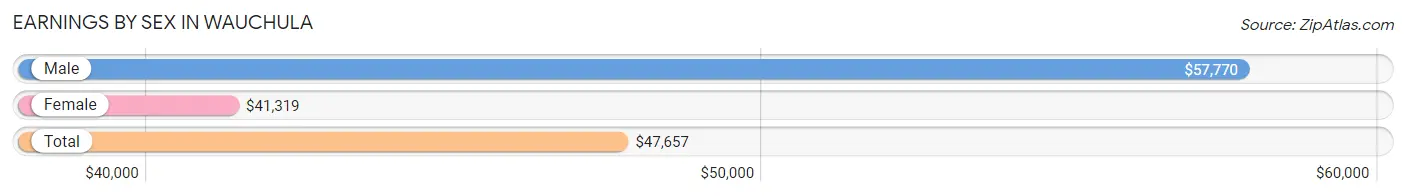
Earnings by Sex in Wauchula
Average Earnings in Wauchula are $47,657, $57,770 for men and $41,319 for women, a difference of 28.5%.
| Sex | Number | Average Earnings |
| Male | 994 (59.0%) | $57,770 |
| Female | 692 (41.0%) | $41,319 |
| Total | 1,686 (100.0%) | $47,657 |
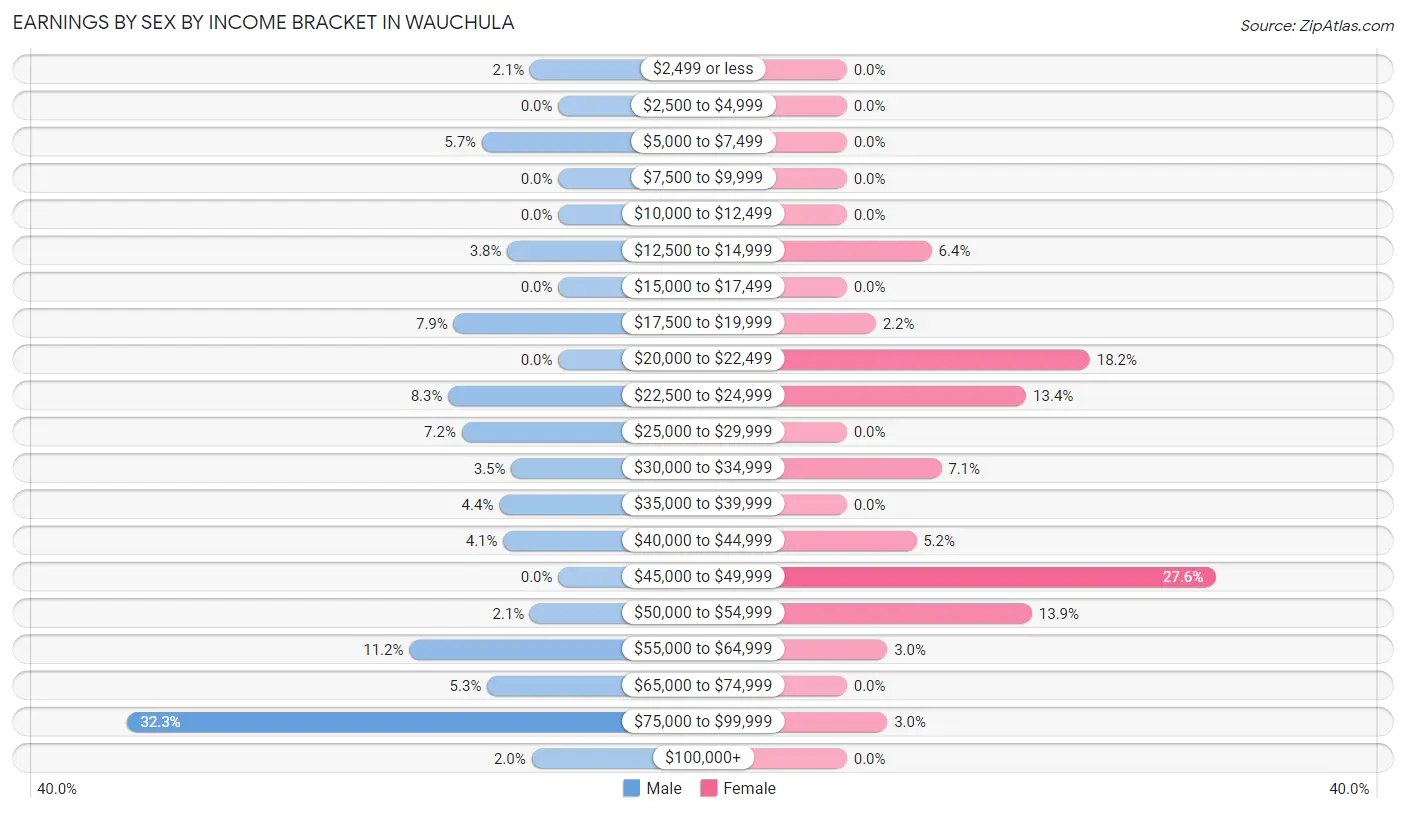
Earnings by Sex by Income Bracket in Wauchula
The most common earnings brackets in Wauchula are $75,000 to $99,999 for men (321 | 32.3%) and $45,000 to $49,999 for women (191 | 27.6%).
| Income | Male | Female |
| $2,499 or less | 21 (2.1%) | 0 (0.0%) |
| $2,500 to $4,999 | 0 (0.0%) | 0 (0.0%) |
| $5,000 to $7,499 | 57 (5.7%) | 0 (0.0%) |
| $7,500 to $9,999 | 0 (0.0%) | 0 (0.0%) |
| $10,000 to $12,499 | 0 (0.0%) | 0 (0.0%) |
| $12,500 to $14,999 | 38 (3.8%) | 44 (6.4%) |
| $15,000 to $17,499 | 0 (0.0%) | 0 (0.0%) |
| $17,500 to $19,999 | 78 (7.9%) | 15 (2.2%) |
| $20,000 to $22,499 | 0 (0.0%) | 126 (18.2%) |
| $22,500 to $24,999 | 82 (8.3%) | 93 (13.4%) |
| $25,000 to $29,999 | 72 (7.2%) | 0 (0.0%) |
| $30,000 to $34,999 | 35 (3.5%) | 49 (7.1%) |
| $35,000 to $39,999 | 44 (4.4%) | 0 (0.0%) |
| $40,000 to $44,999 | 41 (4.1%) | 36 (5.2%) |
| $45,000 to $49,999 | 0 (0.0%) | 191 (27.6%) |
| $50,000 to $54,999 | 21 (2.1%) | 96 (13.9%) |
| $55,000 to $64,999 | 111 (11.2%) | 21 (3.0%) |
| $65,000 to $74,999 | 53 (5.3%) | 0 (0.0%) |
| $75,000 to $99,999 | 321 (32.3%) | 21 (3.0%) |
| $100,000+ | 20 (2.0%) | 0 (0.0%) |
| Total | 994 (100.0%) | 692 (100.0%) |
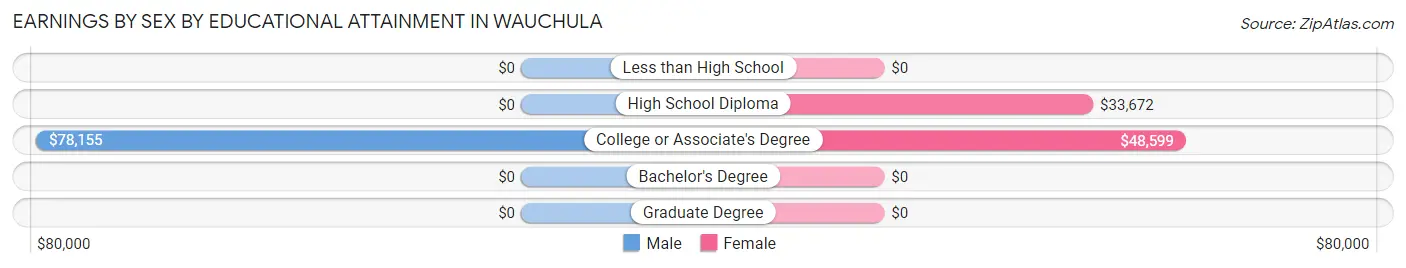
Earnings by Sex by Educational Attainment in Wauchula
Average earnings in Wauchula are $58,125 for men and $34,490 for women, a difference of 40.7%. Men with an educational attainment of college or associate's degree enjoy the highest average annual earnings of $78,155, while those with college or associate's degree education earn the least with $78,155. Women with an educational attainment of college or associate's degree earn the most with the average annual earnings of $48,599, while those with high school diploma education have the smallest earnings of $33,672.
| Educational Attainment | Male Income | Female Income |
| Less than High School | - | - |
| High School Diploma | - | - |
| College or Associate's Degree | $78,155 | $48,599 |
| Bachelor's Degree | - | - |
| Graduate Degree | - | - |
| Total | $58,125 | $34,490 |
Family Income in Wauchula
Family Income Brackets in Wauchula
According to the Wauchula family income data, there are 297 families falling into the $100,000 to $149,999 income range, which is the most common income bracket and makes up 23.9% of all families.
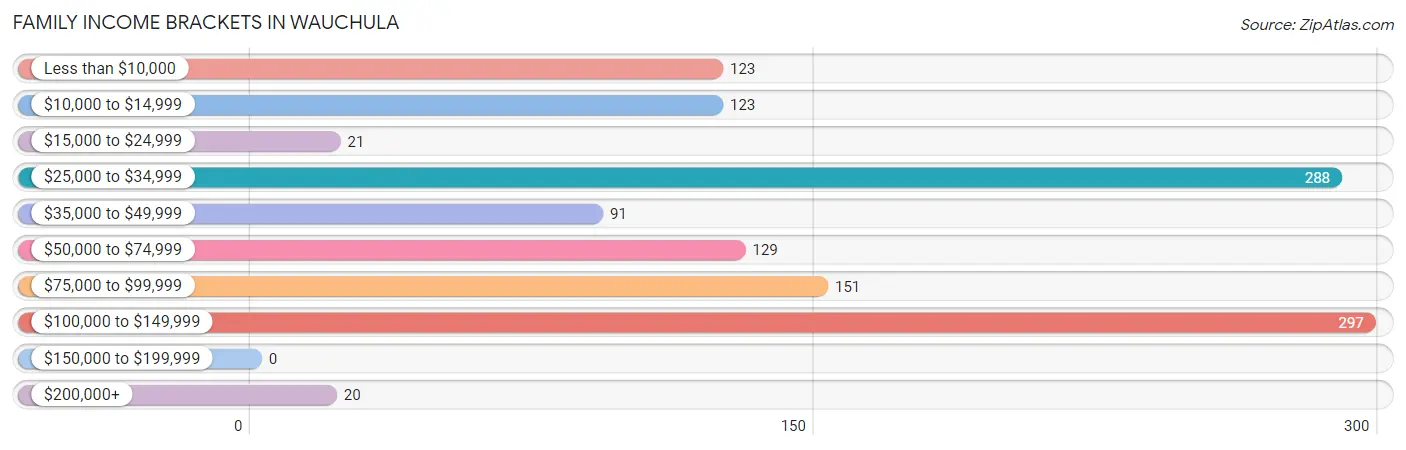
| Income Bracket | # Families | % Families |
| Less than $10,000 | 123 | 9.9% |
| $10,000 to $14,999 | 123 | 9.9% |
| $15,000 to $24,999 | 21 | 1.7% |
| $25,000 to $34,999 | 288 | 23.2% |
| $35,000 to $49,999 | 91 | 7.3% |
| $50,000 to $74,999 | 129 | 10.4% |
| $75,000 to $99,999 | 151 | 12.2% |
| $100,000 to $149,999 | 297 | 23.9% |
| $150,000 to $199,999 | 0 | 0.0% |
| $200,000+ | 20 | 1.6% |
Family Income by Famaliy Size in Wauchula
3-person families (516 | 41.6%) account for the highest median family income in Wauchula with $127,697 per family, while 3-person families (516 | 41.6%) have the highest median income of $42,566 per family member.
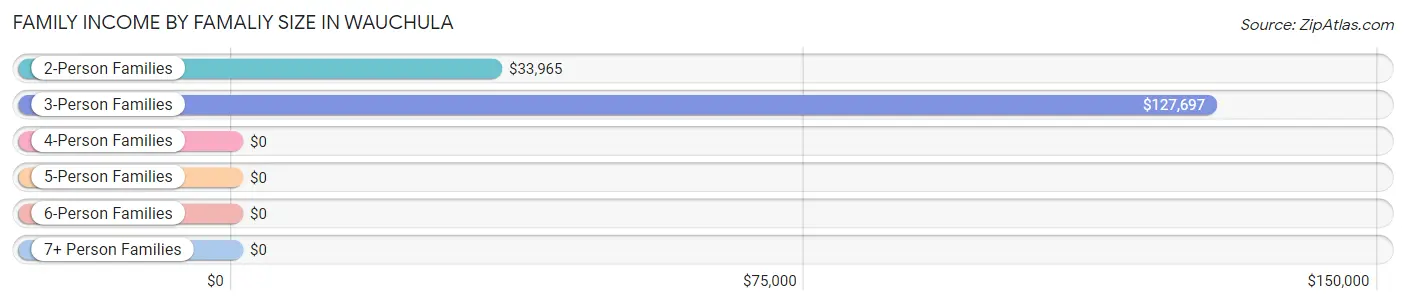
| Income Bracket | # Families | Median Income |
| 2-Person Families | 385 (31.0%) | $33,965 |
| 3-Person Families | 516 (41.6%) | $127,697 |
| 4-Person Families | 134 (10.8%) | $0 |
| 5-Person Families | 206 (16.6%) | $0 |
| 6-Person Families | 0 (0.0%) | $0 |
| 7+ Person Families | 0 (0.0%) | $0 |
| Total | 1,241 (100.0%) | $49,253 |
Family Income by Number of Earners in Wauchula
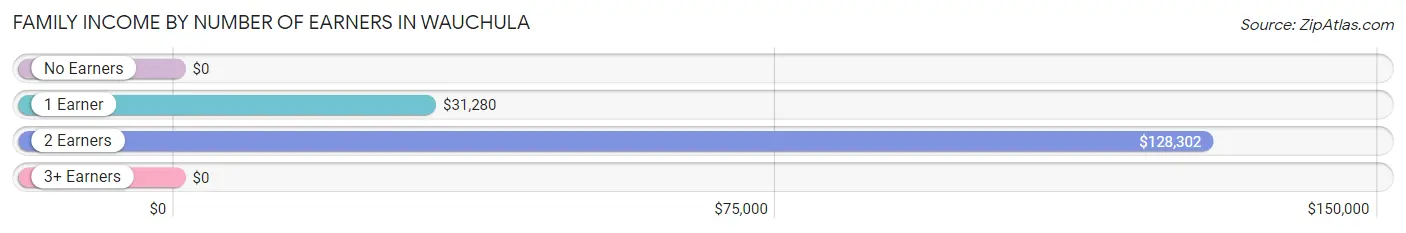
| Number of Earners | # Families | Median Income |
| No Earners | 195 (15.7%) | $0 |
| 1 Earner | 561 (45.2%) | $31,280 |
| 2 Earners | 485 (39.1%) | $128,302 |
| 3+ Earners | 0 (0.0%) | $0 |
| Total | 1,241 (100.0%) | $49,253 |
Household Income in Wauchula
Household Income Brackets in Wauchula
With 339 households falling in the category, the $10,000 to $14,999 income range is the most frequent in Wauchula, accounting for 18.8% of all households. In contrast, only 20 households (1.1%) fall into the $200,000+ income bracket, making it the least populous group.
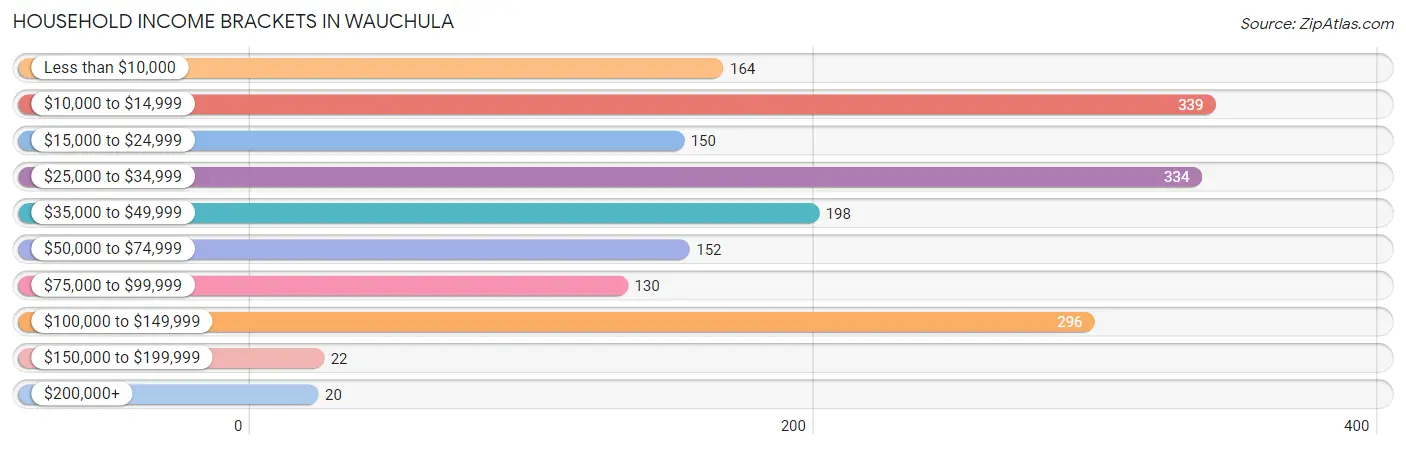
| Income Bracket | # Households | % Households |
| Less than $10,000 | 164 | 9.1% |
| $10,000 to $14,999 | 339 | 18.8% |
| $15,000 to $24,999 | 150 | 8.3% |
| $25,000 to $34,999 | 334 | 18.5% |
| $35,000 to $49,999 | 198 | 11.0% |
| $50,000 to $74,999 | 152 | 8.4% |
| $75,000 to $99,999 | 130 | 7.2% |
| $100,000 to $149,999 | 296 | 16.4% |
| $150,000 to $199,999 | 22 | 1.2% |
| $200,000+ | 20 | 1.1% |
Household Income by Householder Age in Wauchula
The median household income in Wauchula is $32,854, with the highest median household income of $62,381 found in the 45 to 64 years age bracket for the primary householder. A total of 658 households (36.5%) fall into this category. Meanwhile, the 15 to 24 years age bracket for the primary householder has the lowest median household income of $0, with 19 households (1.1%) in this group.
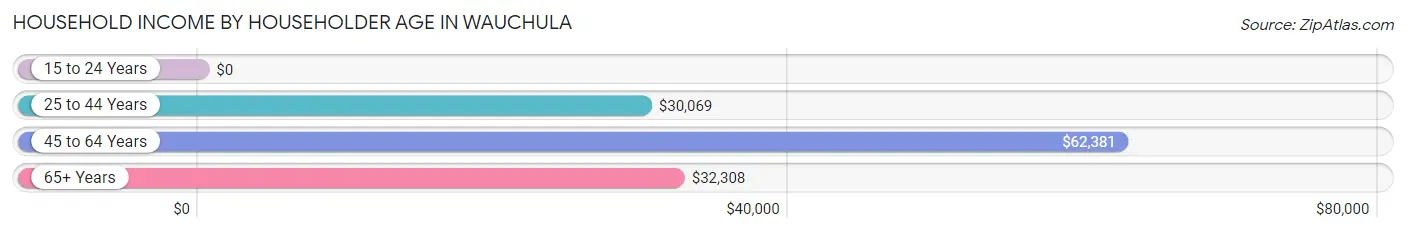
| Income Bracket | # Households | Median Income |
| 15 to 24 Years | 19 (1.1%) | $0 |
| 25 to 44 Years | 857 (47.5%) | $30,069 |
| 45 to 64 Years | 658 (36.5%) | $62,381 |
| 65+ Years | 270 (15.0%) | $32,308 |
| Total | 1,804 (100.0%) | $32,854 |
Poverty in Wauchula
Income Below Poverty by Sex and Age in Wauchula
With 31.6% poverty level for males and 58.1% for females among the residents of Wauchula, 65 to 74 year old males and 5 year old females are the most vulnerable to poverty, with 48 males (100.0%) and 86 females (100.0%) in their respective age groups living below the poverty level.
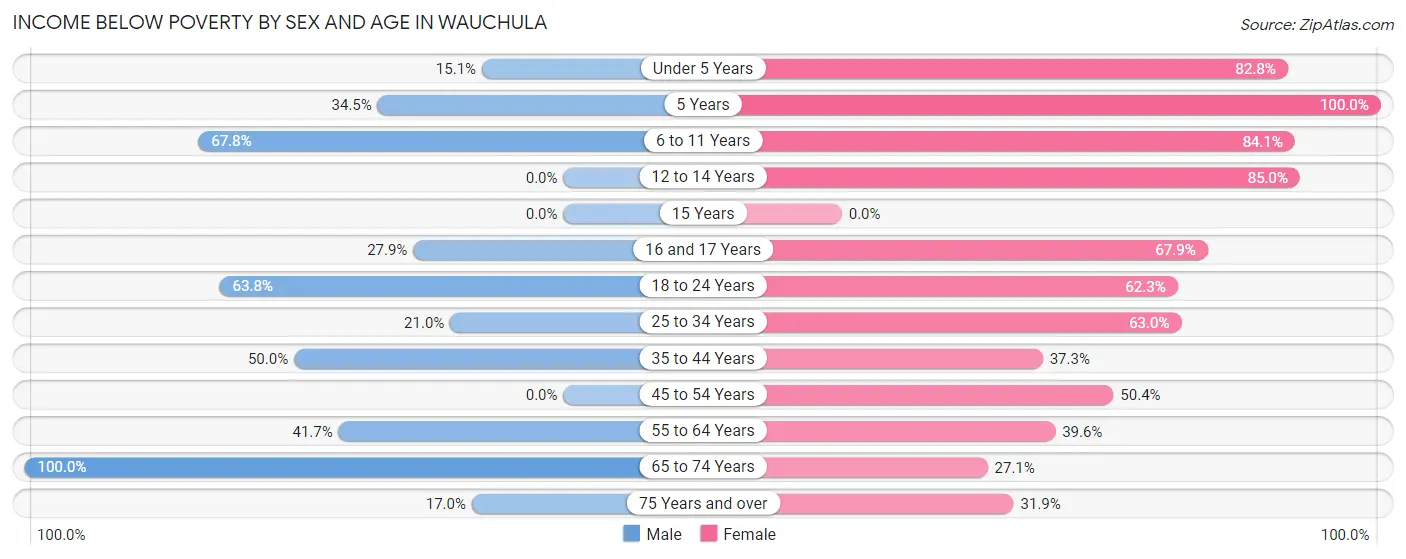
| Age Bracket | Male | Female |
| Under 5 Years | 13 (15.1%) | 283 (82.8%) |
| 5 Years | 30 (34.5%) | 86 (100.0%) |
| 6 to 11 Years | 208 (67.7%) | 58 (84.1%) |
| 12 to 14 Years | 0 (0.0%) | 153 (85.0%) |
| 15 Years | 0 (0.0%) | 0 (0.0%) |
| 16 and 17 Years | 17 (27.9%) | 112 (67.9%) |
| 18 to 24 Years | 37 (63.8%) | 119 (62.3%) |
| 25 to 34 Years | 71 (21.0%) | 126 (63.0%) |
| 35 to 44 Years | 188 (50.0%) | 163 (37.3%) |
| 45 to 54 Years | 0 (0.0%) | 120 (50.4%) |
| 55 to 64 Years | 106 (41.7%) | 61 (39.6%) |
| 65 to 74 Years | 48 (100.0%) | 36 (27.1%) |
| 75 Years and over | 17 (17.0%) | 51 (31.9%) |
| Total | 735 (31.6%) | 1,368 (58.1%) |
Income Above Poverty by Sex and Age in Wauchula
According to the poverty statistics in Wauchula, males aged 12 to 14 years and females aged 65 to 74 years are the age groups that are most secure financially, with 100.0% of males and 72.9% of females in these age groups living above the poverty line.
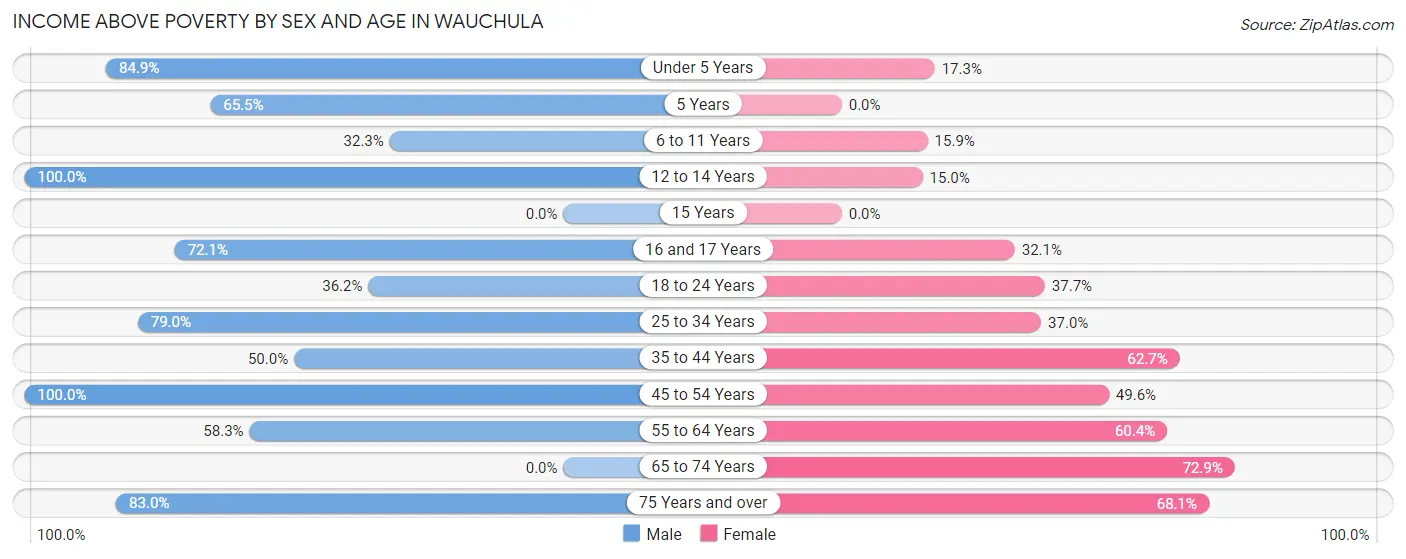
| Age Bracket | Male | Female |
| Under 5 Years | 73 (84.9%) | 59 (17.2%) |
| 5 Years | 57 (65.5%) | 0 (0.0%) |
| 6 to 11 Years | 99 (32.3%) | 11 (15.9%) |
| 12 to 14 Years | 235 (100.0%) | 27 (15.0%) |
| 15 Years | 0 (0.0%) | 0 (0.0%) |
| 16 and 17 Years | 44 (72.1%) | 53 (32.1%) |
| 18 to 24 Years | 21 (36.2%) | 72 (37.7%) |
| 25 to 34 Years | 267 (79.0%) | 74 (37.0%) |
| 35 to 44 Years | 188 (50.0%) | 274 (62.7%) |
| 45 to 54 Years | 376 (100.0%) | 118 (49.6%) |
| 55 to 64 Years | 148 (58.3%) | 93 (60.4%) |
| 65 to 74 Years | 0 (0.0%) | 97 (72.9%) |
| 75 Years and over | 83 (83.0%) | 109 (68.1%) |
| Total | 1,591 (68.4%) | 987 (41.9%) |
Income Below Poverty Among Married-Couple Families in Wauchula
The poverty statistics for married-couple families in Wauchula show that 4.8% or 36 of the total 748 families live below the poverty line. Families with no children have the highest poverty rate of 12.9%, comprising of 36 families. On the other hand, families with 1 or 2 children have the lowest poverty rate of 0.0%, which includes 0 families.
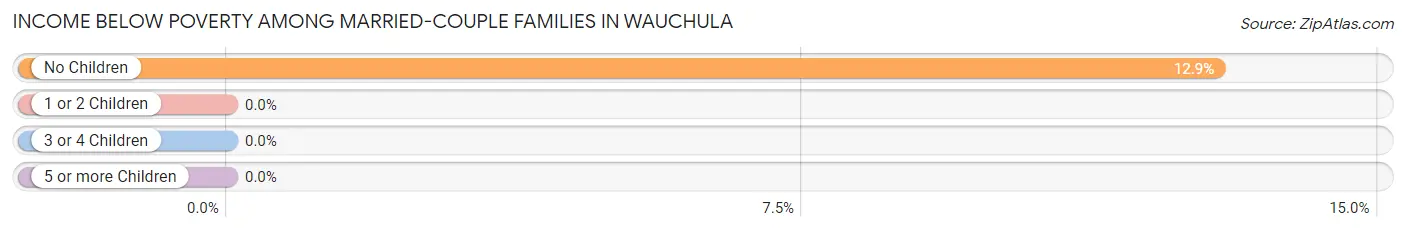
| Children | Above Poverty | Below Poverty |
| No Children | 243 (87.1%) | 36 (12.9%) |
| 1 or 2 Children | 412 (100.0%) | 0 (0.0%) |
| 3 or 4 Children | 57 (100.0%) | 0 (0.0%) |
| 5 or more Children | 0 (0.0%) | 0 (0.0%) |
| Total | 712 (95.2%) | 36 (4.8%) |
Income Below Poverty Among Single-Parent Households in Wauchula
According to the poverty data in Wauchula, 43.6% or 95 single-father households and 87.6% or 241 single-mother households are living below the poverty line. Among single-father households, those with 3 or 4 children have the highest poverty rate, with 57 households (100.0%) experiencing poverty. Likewise, among single-mother households, those with 3 or 4 children have the highest poverty rate, with 149 households (100.0%) falling below the poverty line.
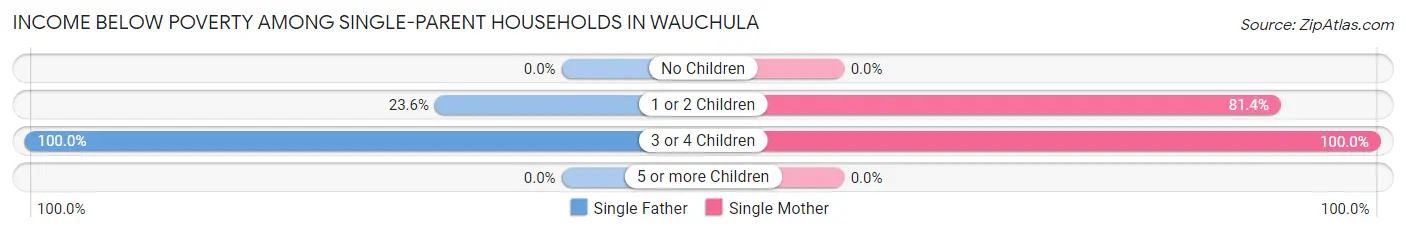
| Children | Single Father | Single Mother |
| No Children | 0 (0.0%) | 0 (0.0%) |
| 1 or 2 Children | 38 (23.6%) | 92 (81.4%) |
| 3 or 4 Children | 57 (100.0%) | 149 (100.0%) |
| 5 or more Children | 0 (0.0%) | 0 (0.0%) |
| Total | 95 (43.6%) | 241 (87.6%) |
Income Below Poverty Among Married-Couple vs Single-Parent Households in Wauchula
The poverty data for Wauchula shows that 36 of the married-couple family households (4.8%) and 336 of the single-parent households (68.1%) are living below the poverty level. Within the married-couple family households, those with no children have the highest poverty rate, with 36 households (12.9%) falling below the poverty line. Among the single-parent households, those with 3 or 4 children have the highest poverty rate, with 206 household (100.0%) living below poverty.
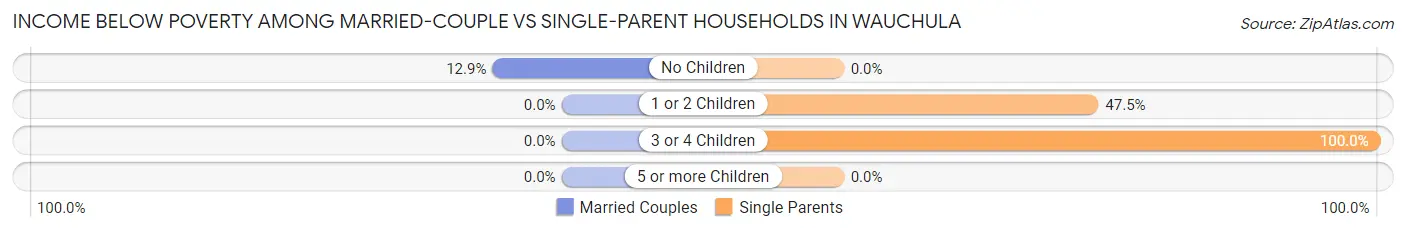
| Children | Married-Couple Families | Single-Parent Households |
| No Children | 36 (12.9%) | 0 (0.0%) |
| 1 or 2 Children | 0 (0.0%) | 130 (47.4%) |
| 3 or 4 Children | 0 (0.0%) | 206 (100.0%) |
| 5 or more Children | 0 (0.0%) | 0 (0.0%) |
| Total | 36 (4.8%) | 336 (68.1%) |
Race in Wauchula
The most populous races in Wauchula are White / Caucasian (3,031 | 61.9%), Hispanic or Latino (2,745 | 56.0%), and Two or more Races (894 | 18.2%).
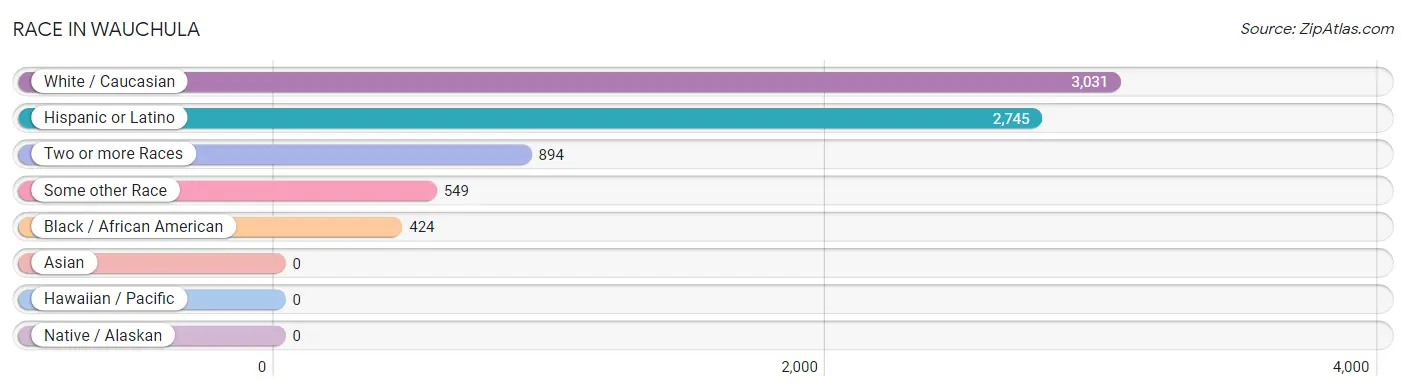
| Race | # Population | % Population |
| Asian | 0 | 0.0% |
| Black / African American | 424 | 8.7% |
| Hawaiian / Pacific | 0 | 0.0% |
| Hispanic or Latino | 2,745 | 56.0% |
| Native / Alaskan | 0 | 0.0% |
| White / Caucasian | 3,031 | 61.9% |
| Two or more Races | 894 | 18.2% |
| Some other Race | 549 | 11.2% |
| Total | 4,898 | 100.0% |
Ancestry in Wauchula
The most populous ancestries reported in Wauchula are Mexican (1,838 | 37.5%), Puerto Rican (865 | 17.7%), American (408 | 8.3%), English (276 | 5.6%), and Irish (211 | 4.3%), together accounting for 73.5% of all Wauchula residents.
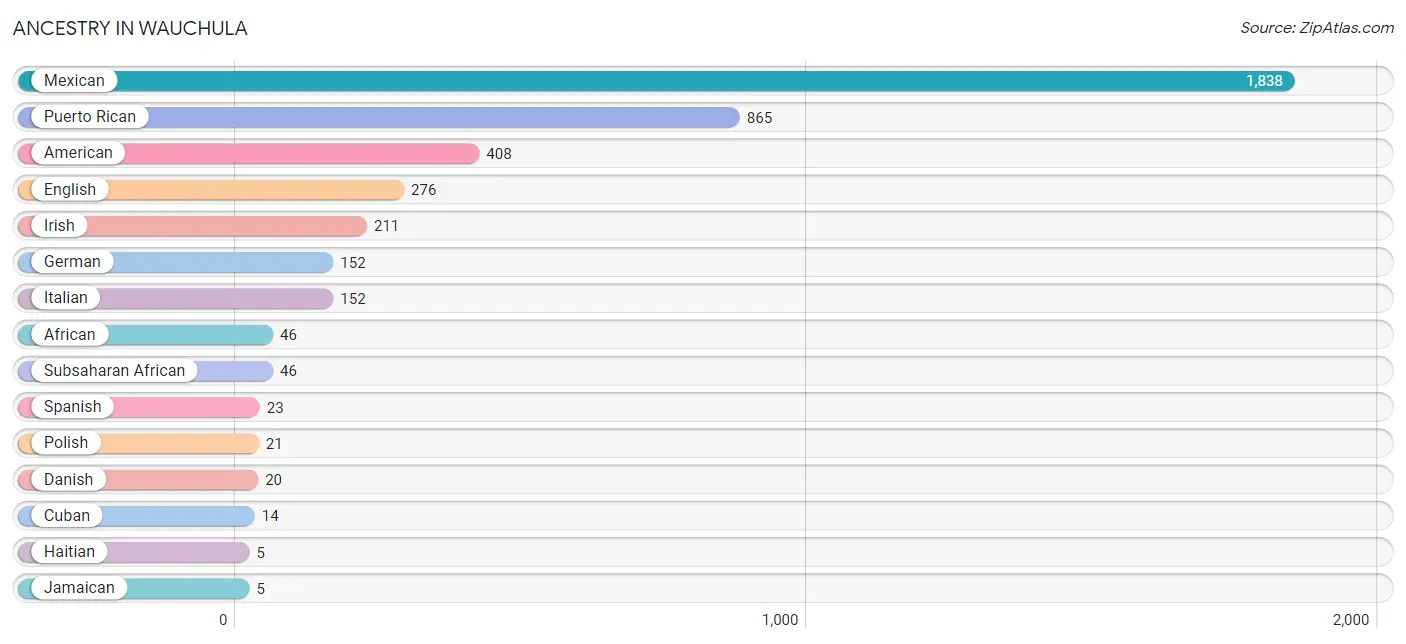
| Ancestry | # Population | % Population |
| African | 46 | 0.9% |
| American | 408 | 8.3% |
| Cherokee | 2 | 0.0% |
| Cuban | 14 | 0.3% |
| Danish | 20 | 0.4% |
| English | 276 | 5.6% |
| German | 152 | 3.1% |
| Haitian | 5 | 0.1% |
| Irish | 211 | 4.3% |
| Italian | 152 | 3.1% |
| Jamaican | 5 | 0.1% |
| Mexican | 1,838 | 37.5% |
| Polish | 21 | 0.4% |
| Puerto Rican | 865 | 17.7% |
| Scottish | 3 | 0.1% |
| Spanish | 23 | 0.5% |
| Subsaharan African | 46 | 0.9% | View All 17 Rows |
Immigrants in Wauchula
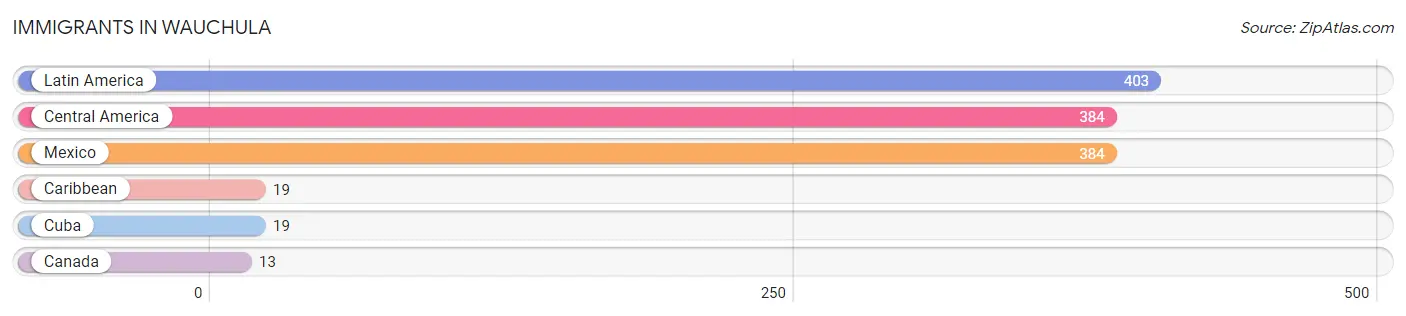
The most numerous immigrant groups reported in Wauchula came from Latin America (403 | 8.2%), Central America (384 | 7.8%), Mexico (384 | 7.8%), Caribbean (19 | 0.4%), and Cuba (19 | 0.4%), together accounting for 24.7% of all Wauchula residents.
| Immigration Origin | # Population | % Population |
| Canada | 13 | 0.3% |
| Caribbean | 19 | 0.4% |
| Central America | 384 | 7.8% |
| Cuba | 19 | 0.4% |
| Latin America | 403 | 8.2% |
| Mexico | 384 | 7.8% | View All 6 Rows |
Sex and Age in Wauchula
Sex and Age in Wauchula
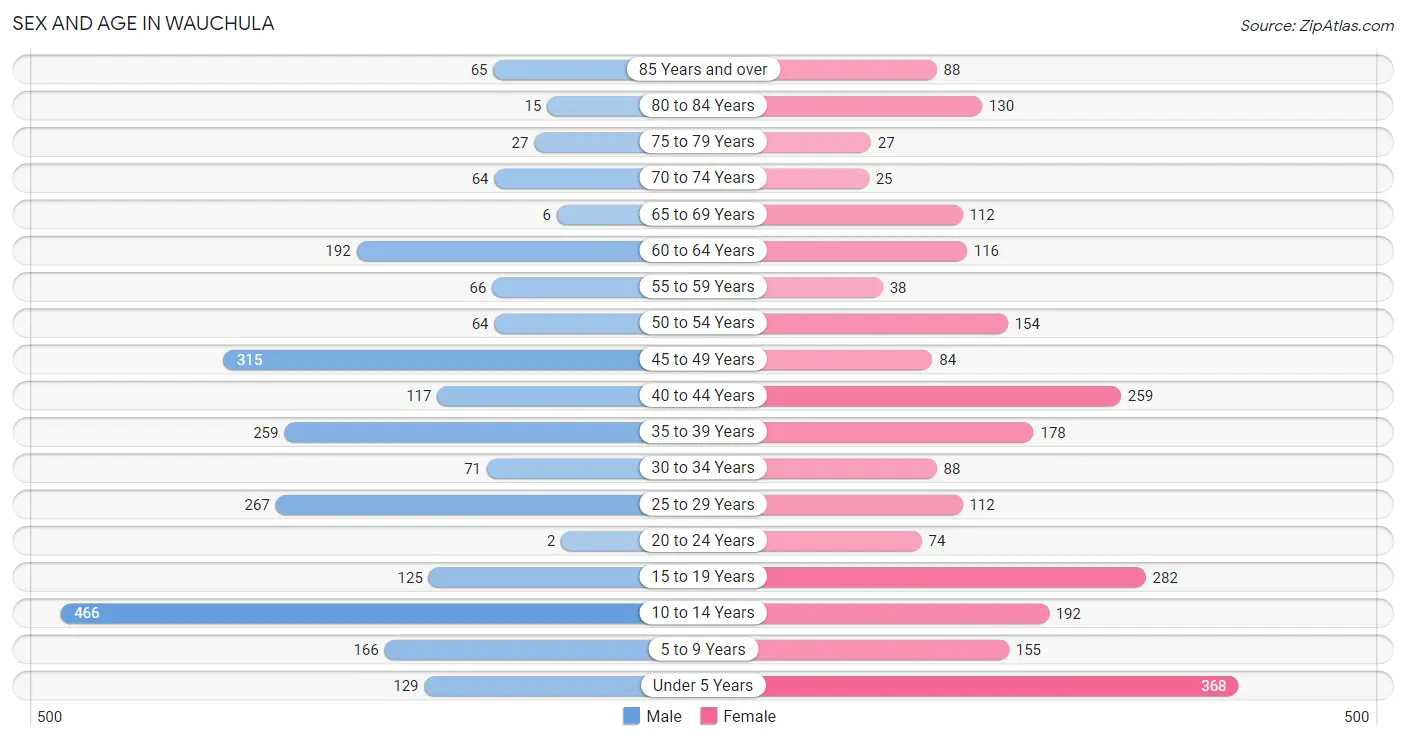
The most populous age groups in Wauchula are 10 to 14 Years (466 | 19.3%) for men and Under 5 Years (368 | 14.8%) for women.
| Age Bracket | Male | Female |
| Under 5 Years | 129 (5.3%) | 368 (14.8%) |
| 5 to 9 Years | 166 (6.9%) | 155 (6.2%) |
| 10 to 14 Years | 466 (19.3%) | 192 (7.7%) |
| 15 to 19 Years | 125 (5.2%) | 282 (11.4%) |
| 20 to 24 Years | 2 (0.1%) | 74 (3.0%) |
| 25 to 29 Years | 267 (11.1%) | 112 (4.5%) |
| 30 to 34 Years | 71 (2.9%) | 88 (3.5%) |
| 35 to 39 Years | 259 (10.7%) | 178 (7.2%) |
| 40 to 44 Years | 117 (4.8%) | 259 (10.4%) |
| 45 to 49 Years | 315 (13.0%) | 84 (3.4%) |
| 50 to 54 Years | 64 (2.6%) | 154 (6.2%) |
| 55 to 59 Years | 66 (2.7%) | 38 (1.5%) |
| 60 to 64 Years | 192 (8.0%) | 116 (4.7%) |
| 65 to 69 Years | 6 (0.3%) | 112 (4.5%) |
| 70 to 74 Years | 64 (2.6%) | 25 (1.0%) |
| 75 to 79 Years | 27 (1.1%) | 27 (1.1%) |
| 80 to 84 Years | 15 (0.6%) | 130 (5.2%) |
| 85 Years and over | 65 (2.7%) | 88 (3.5%) |
| Total | 2,416 (100.0%) | 2,482 (100.0%) |
Families and Households in Wauchula
Median Family Size in Wauchula
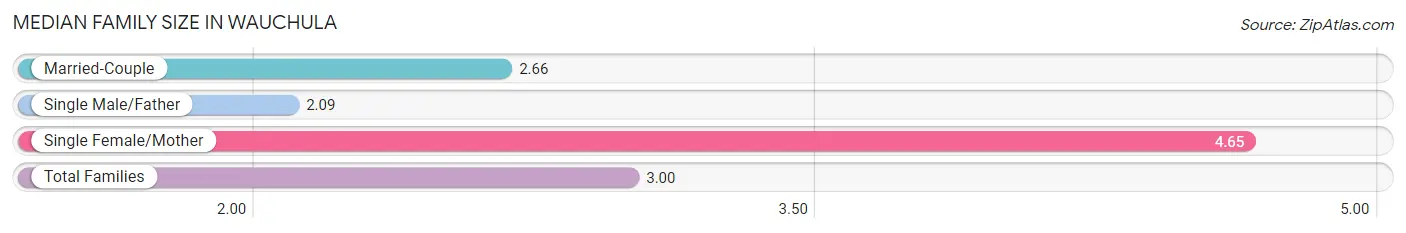
The median family size in Wauchula is 3.00 persons per family, with single female/mother families (275 | 22.2%) accounting for the largest median family size of 4.65 persons per family. On the other hand, single male/father families (218 | 17.6%) represent the smallest median family size with 2.09 persons per family.
| Family Type | # Families | Family Size |
| Married-Couple | 748 (60.3%) | 2.66 |
| Single Male/Father | 218 (17.6%) | 2.09 |
| Single Female/Mother | 275 (22.2%) | 4.65 |
| Total Families | 1,241 (100.0%) | 3.00 |
Median Household Size in Wauchula
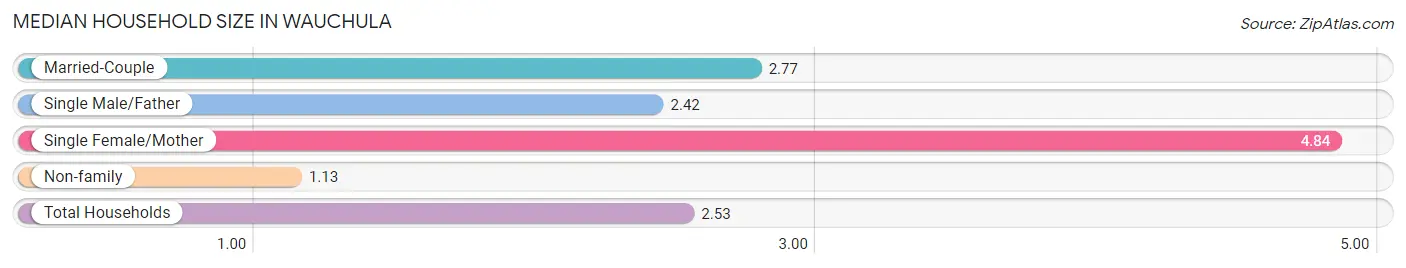
The median household size in Wauchula is 2.53 persons per household, with single female/mother households (275 | 15.2%) accounting for the largest median household size of 4.84 persons per household. non-family households (563 | 31.2%) represent the smallest median household size with 1.13 persons per household.
| Household Type | # Households | Household Size |
| Married-Couple | 748 (41.5%) | 2.77 |
| Single Male/Father | 218 (12.1%) | 2.42 |
| Single Female/Mother | 275 (15.2%) | 4.84 |
| Non-family | 563 (31.2%) | 1.13 |
| Total Households | 1,804 (100.0%) | 2.53 |
Household Size by Marriage Status in Wauchula
Out of a total of 1,804 households in Wauchula, 1,241 (68.8%) are family households, while 563 (31.2%) are nonfamily households. The most numerous type of family households are 3-person households, comprising 550, and the most common type of nonfamily households are 1-person households, comprising 495.
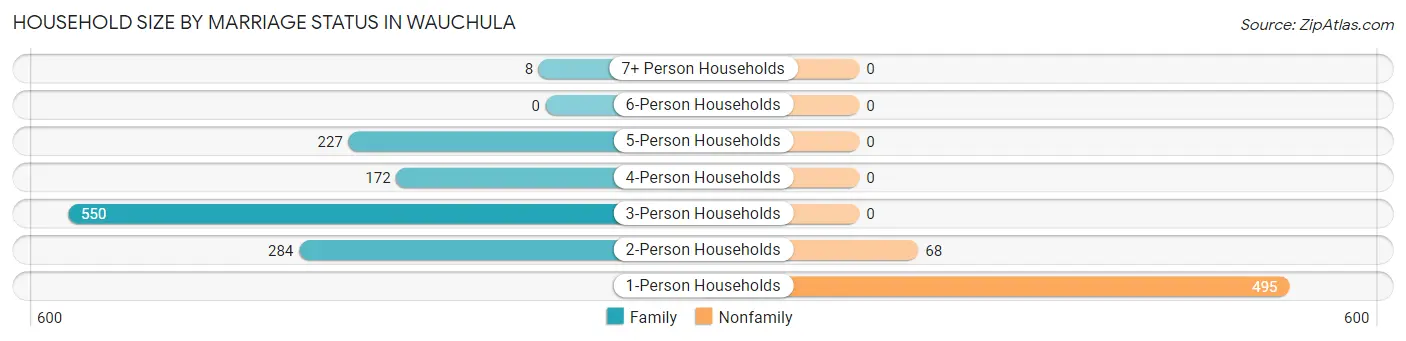
| Household Size | Family Households | Nonfamily Households |
| 1-Person Households | - | 495 (27.4%) |
| 2-Person Households | 284 (15.7%) | 68 (3.8%) |
| 3-Person Households | 550 (30.5%) | 0 (0.0%) |
| 4-Person Households | 172 (9.5%) | 0 (0.0%) |
| 5-Person Households | 227 (12.6%) | 0 (0.0%) |
| 6-Person Households | 0 (0.0%) | 0 (0.0%) |
| 7+ Person Households | 8 (0.4%) | 0 (0.0%) |
| Total | 1,241 (68.8%) | 563 (31.2%) |
Female Fertility in Wauchula
Fertility by Age in Wauchula
Average fertility rate in Wauchula is 114.0 births per 1,000 women. Women in the age bracket of 20 to 34 years have the highest fertility rate with 391.0 births per 1,000 women. Women in the age bracket of 20 to 34 years acount for 83.6% of all women with births.
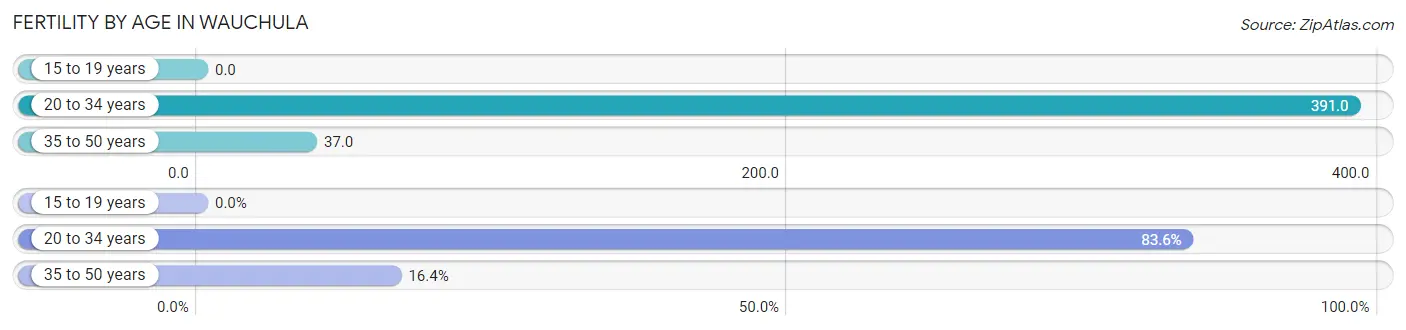
| Age Bracket | Women with Births | Births / 1,000 Women |
| 15 to 19 years | 0 (0.0%) | 0.0 |
| 20 to 34 years | 107 (83.6%) | 391.0 |
| 35 to 50 years | 21 (16.4%) | 37.0 |
| Total | 128 (100.0%) | 114.0 |
Fertility by Age by Marriage Status in Wauchula
31.2% of women with births (128) in Wauchula are married. The highest percentage of unmarried women with births falls into 20 to 34 years age bracket with 82.2% of them unmarried at the time of birth, while the lowest percentage of unmarried women with births belong to 35 to 50 years age bracket with 0.0% of them unmarried.
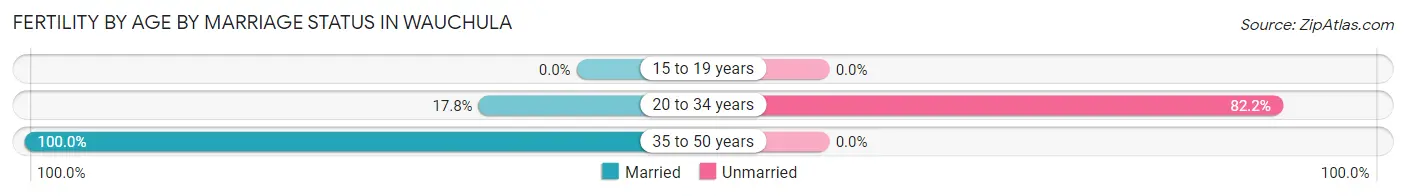
| Age Bracket | Married | Unmarried |
| 15 to 19 years | 0 (0.0%) | 0 (0.0%) |
| 20 to 34 years | 19 (17.8%) | 88 (82.2%) |
| 35 to 50 years | 21 (100.0%) | 0 (0.0%) |
| Total | 40 (31.2%) | 88 (68.8%) |
Fertility by Education in Wauchula
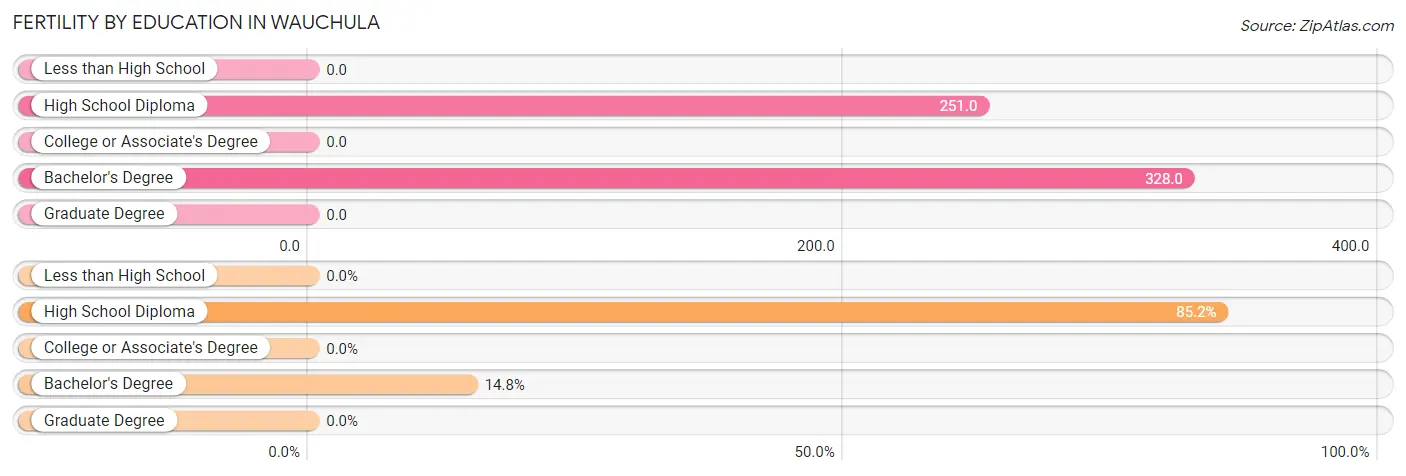
| Educational Attainment | Women with Births | Births / 1,000 Women |
| Less than High School | 0 (0.0%) | 0.0 |
| High School Diploma | 109 (85.2%) | 251.0 |
| College or Associate's Degree | 0 (0.0%) | 0.0 |
| Bachelor's Degree | 19 (14.8%) | 328.0 |
| Graduate Degree | 0 (0.0%) | 0.0 |
| Total | 128 (100.0%) | 114.0 |
Fertility by Education by Marriage Status in Wauchula
68.8% of women with births in Wauchula are unmarried. Women with the educational attainment of bachelor's degree are most likely to be married with 100.0% of them married at childbirth, while women with the educational attainment of high school diploma are least likely to be married with 80.7% of them unmarried at childbirth.
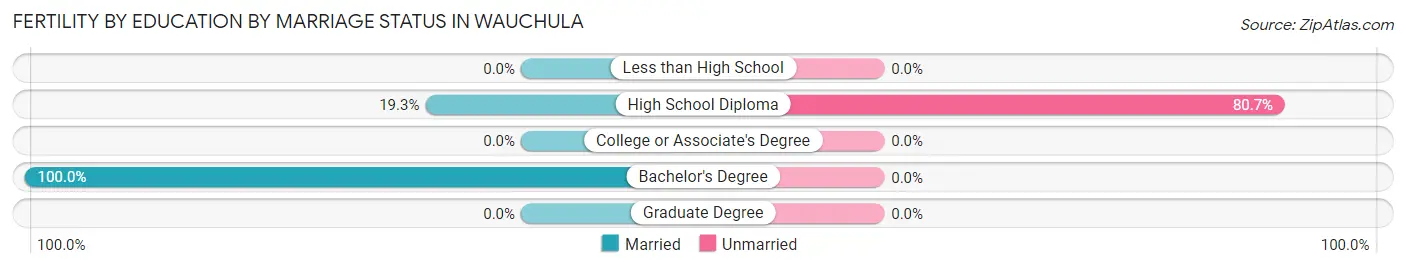
| Educational Attainment | Married | Unmarried |
| Less than High School | 0 (0.0%) | 0 (0.0%) |
| High School Diploma | 21 (19.3%) | 88 (80.7%) |
| College or Associate's Degree | 0 (0.0%) | 0 (0.0%) |
| Bachelor's Degree | 19 (100.0%) | 0 (0.0%) |
| Graduate Degree | 0 (0.0%) | 0 (0.0%) |
| Total | 40 (31.2%) | 88 (68.8%) |
Employment Characteristics in Wauchula
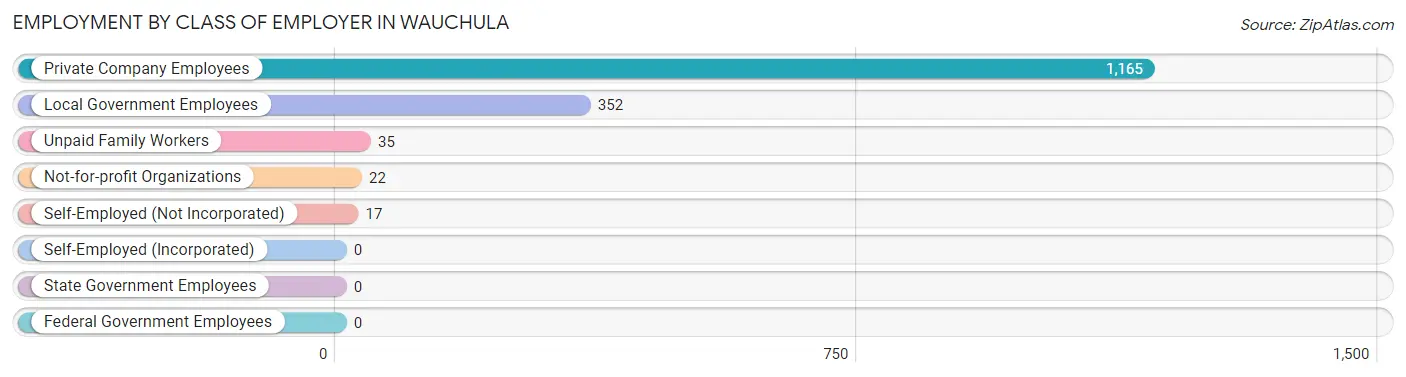
Employment by Class of Employer in Wauchula
Among the 1,591 employed individuals in Wauchula, private company employees (1,165 | 73.2%), local government employees (352 | 22.1%), and unpaid family workers (35 | 2.2%) make up the most common classes of employment.
| Employer Class | # Employees | % Employees |
| Private Company Employees | 1,165 | 73.2% |
| Self-Employed (Incorporated) | 0 | 0.0% |
| Self-Employed (Not Incorporated) | 17 | 1.1% |
| Not-for-profit Organizations | 22 | 1.4% |
| Local Government Employees | 352 | 22.1% |
| State Government Employees | 0 | 0.0% |
| Federal Government Employees | 0 | 0.0% |
| Unpaid Family Workers | 35 | 2.2% |
| Total | 1,591 | 100.0% |
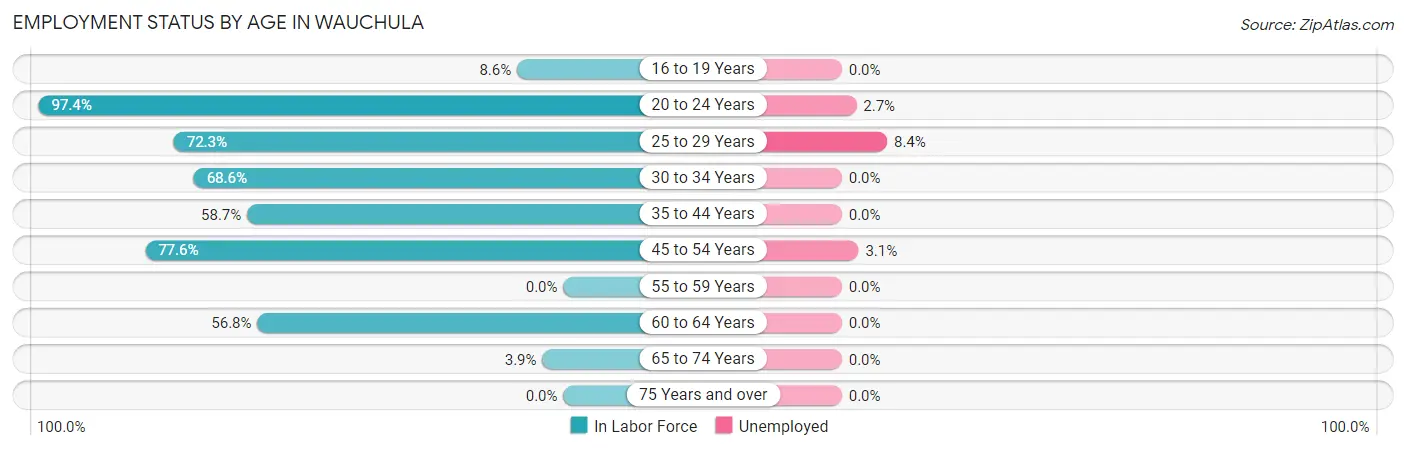
Employment Status by Age in Wauchula
According to the labor force statistics for Wauchula, out of the total population over 16 years of age (3,422), 47.7% or 1,632 individuals are in the labor force, with 2.5% or 41 of them unemployed. The age group with the highest labor force participation rate is 20 to 24 years, with 97.4% or 74 individuals in the labor force. Within the labor force, the 25 to 29 years age range has the highest percentage of unemployed individuals, with 8.4% or 23 of them being unemployed.
| Age Bracket | In Labor Force | Unemployed |
| 16 to 19 Years | 35 (8.6%) | 0 (0.0%) |
| 20 to 24 Years | 74 (97.4%) | 2 (2.7%) |
| 25 to 29 Years | 274 (72.3%) | 23 (8.4%) |
| 30 to 34 Years | 109 (68.6%) | 0 (0.0%) |
| 35 to 44 Years | 477 (58.7%) | 0 (0.0%) |
| 45 to 54 Years | 479 (77.6%) | 15 (3.1%) |
| 55 to 59 Years | 0 (0.0%) | 0 (0.0%) |
| 60 to 64 Years | 175 (56.8%) | 0 (0.0%) |
| 65 to 74 Years | 8 (3.9%) | 0 (0.0%) |
| 75 Years and over | 0 (0.0%) | 0 (0.0%) |
| Total | 1,632 (47.7%) | 41 (2.5%) |
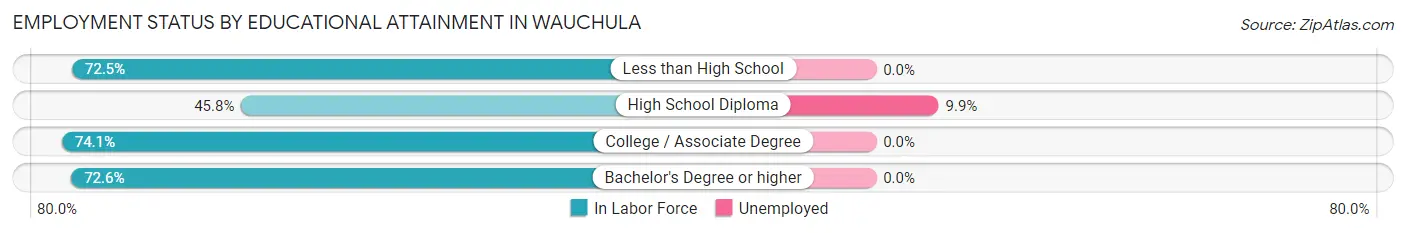
Employment Status by Educational Attainment in Wauchula
According to labor force statistics for Wauchula, 63.6% of individuals (1,514) out of the total population between 25 and 64 years of age (2,380) are in the labor force, with 2.5% or 38 of them being unemployed. The group with the highest labor force participation rate are those with the educational attainment of college / associate degree, with 74.1% or 560 individuals in the labor force. Within the labor force, individuals with high school diploma education have the highest percentage of unemployment, with 9.9% or 38 of them being unemployed.
| Educational Attainment | In Labor Force | Unemployed |
| Less than High School | 480 (72.5%) | 0 (0.0%) |
| High School Diploma | 384 (45.8%) | 83 (9.9%) |
| College / Associate Degree | 560 (74.1%) | 0 (0.0%) |
| Bachelor's Degree or higher | 90 (72.6%) | 0 (0.0%) |
| Total | 1,514 (63.6%) | 60 (2.5%) |
Employment Occupations by Sex in Wauchula
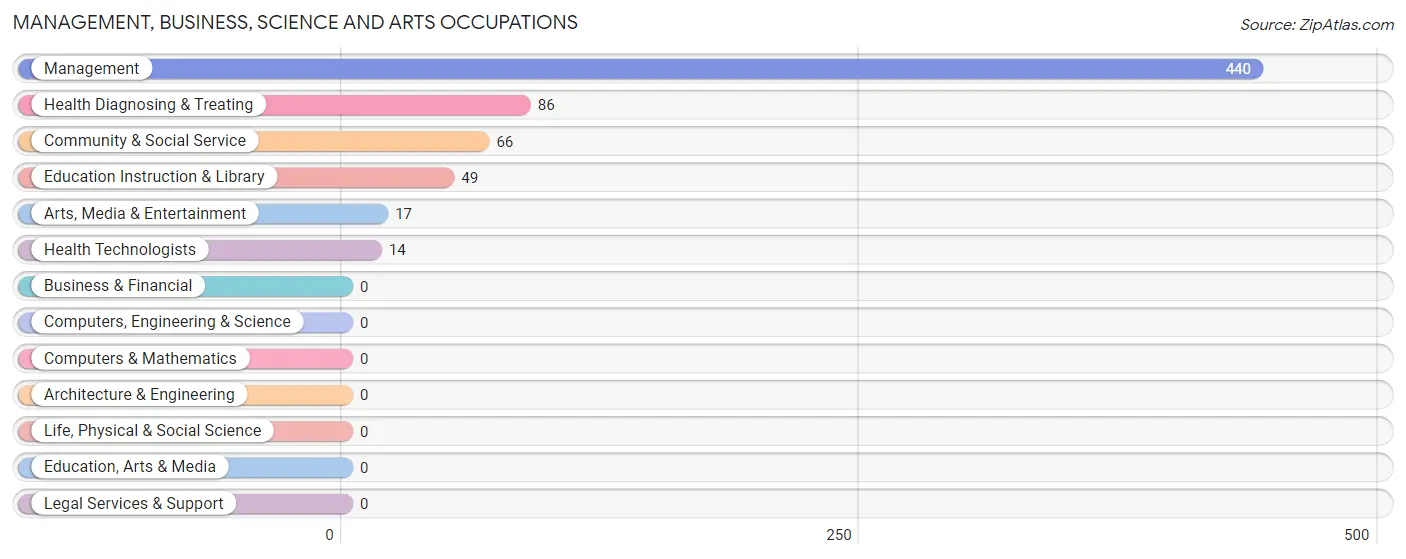
Management, Business, Science and Arts Occupations
The most common Management, Business, Science and Arts occupations in Wauchula are Management (440 | 27.7%), Health Diagnosing & Treating (86 | 5.4%), Community & Social Service (66 | 4.2%), Education Instruction & Library (49 | 3.1%), and Arts, Media & Entertainment (17 | 1.1%).
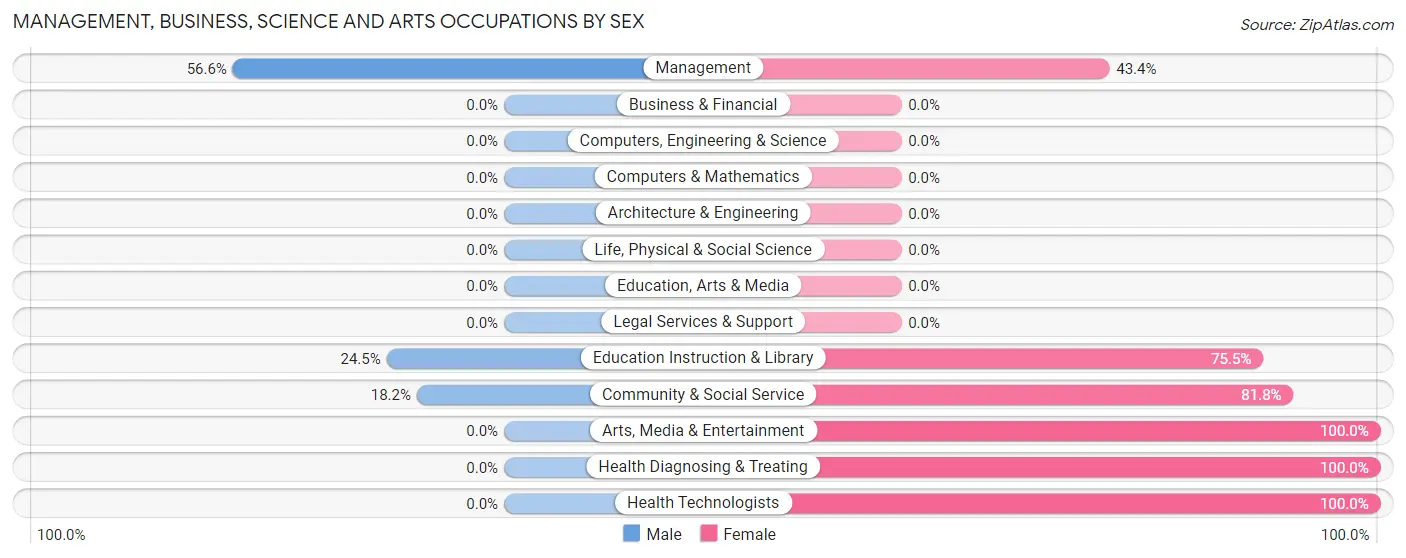
Management, Business, Science and Arts Occupations by Sex
Within the Management, Business, Science and Arts occupations in Wauchula, the most male-oriented occupations are Management (56.6%), Education Instruction & Library (24.5%), and Community & Social Service (18.2%), while the most female-oriented occupations are Arts, Media & Entertainment (100.0%), Health Diagnosing & Treating (100.0%), and Health Technologists (100.0%).
| Occupation | Male | Female |
| Management | 249 (56.6%) | 191 (43.4%) |
| Business & Financial | 0 (0.0%) | 0 (0.0%) |
| Computers, Engineering & Science | 0 (0.0%) | 0 (0.0%) |
| Computers & Mathematics | 0 (0.0%) | 0 (0.0%) |
| Architecture & Engineering | 0 (0.0%) | 0 (0.0%) |
| Life, Physical & Social Science | 0 (0.0%) | 0 (0.0%) |
| Community & Social Service | 12 (18.2%) | 54 (81.8%) |
| Education, Arts & Media | 0 (0.0%) | 0 (0.0%) |
| Legal Services & Support | 0 (0.0%) | 0 (0.0%) |
| Education Instruction & Library | 12 (24.5%) | 37 (75.5%) |
| Arts, Media & Entertainment | 0 (0.0%) | 17 (100.0%) |
| Health Diagnosing & Treating | 0 (0.0%) | 86 (100.0%) |
| Health Technologists | 0 (0.0%) | 14 (100.0%) |
| Total (Category) | 261 (44.1%) | 331 (55.9%) |
| Total (Overall) | 937 (58.9%) | 654 (41.1%) |
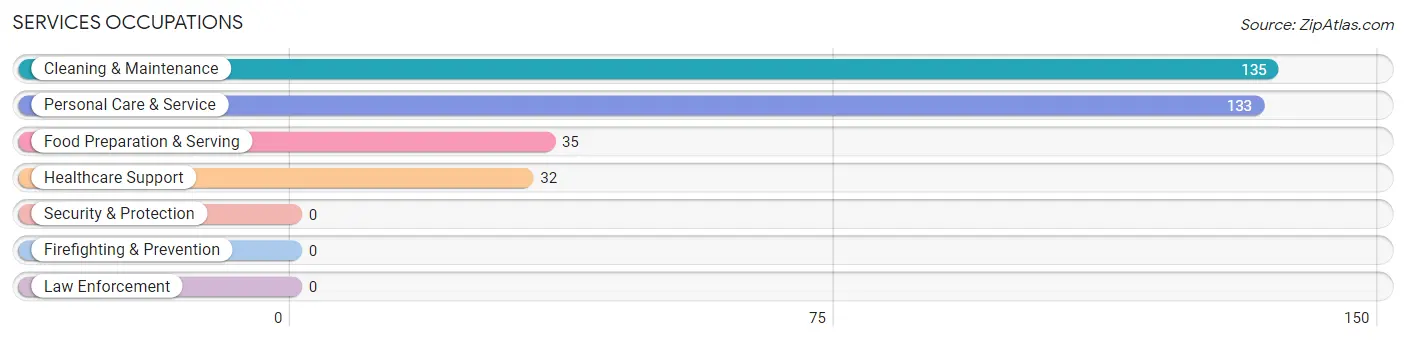
Services Occupations
The most common Services occupations in Wauchula are Cleaning & Maintenance (135 | 8.5%), Personal Care & Service (133 | 8.4%), Food Preparation & Serving (35 | 2.2%), and Healthcare Support (32 | 2.0%).
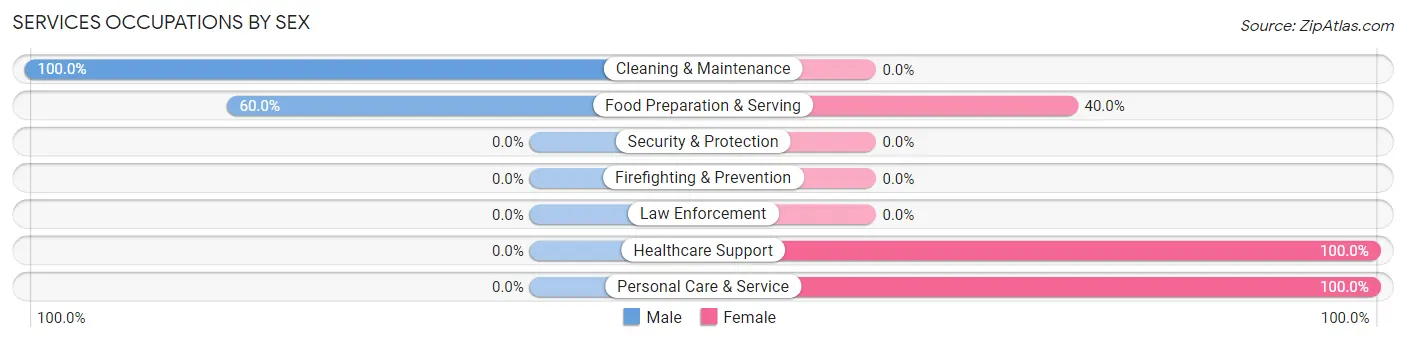
Services Occupations by Sex
Within the Services occupations in Wauchula, the most male-oriented occupations are Cleaning & Maintenance (100.0%), and Food Preparation & Serving (60.0%), while the most female-oriented occupations are Healthcare Support (100.0%), Personal Care & Service (100.0%), and Food Preparation & Serving (40.0%).
| Occupation | Male | Female |
| Healthcare Support | 0 (0.0%) | 32 (100.0%) |
| Security & Protection | 0 (0.0%) | 0 (0.0%) |
| Firefighting & Prevention | 0 (0.0%) | 0 (0.0%) |
| Law Enforcement | 0 (0.0%) | 0 (0.0%) |
| Food Preparation & Serving | 21 (60.0%) | 14 (40.0%) |
| Cleaning & Maintenance | 135 (100.0%) | 0 (0.0%) |
| Personal Care & Service | 0 (0.0%) | 133 (100.0%) |
| Total (Category) | 156 (46.6%) | 179 (53.4%) |
| Total (Overall) | 937 (58.9%) | 654 (41.1%) |
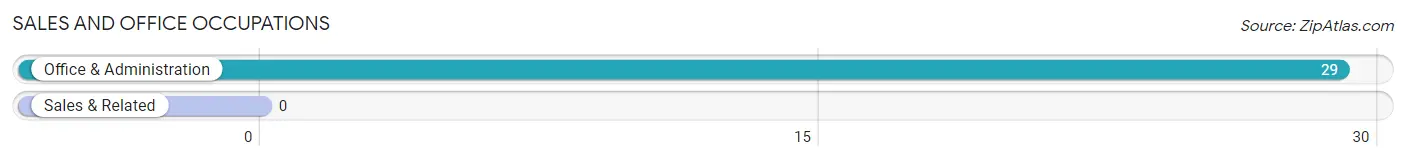
Sales and Office Occupations
The most common Sales and Office occupations in Wauchula are , and Office & Administration (29 | 1.8%).
Sales and Office Occupations by Sex
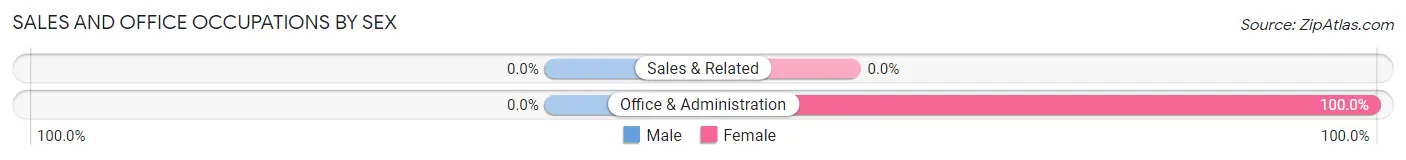
| Occupation | Male | Female |
| Sales & Related | 0 (0.0%) | 0 (0.0%) |
| Office & Administration | 0 (0.0%) | 29 (100.0%) |
| Total (Category) | 0 (0.0%) | 29 (100.0%) |
| Total (Overall) | 937 (58.9%) | 654 (41.1%) |
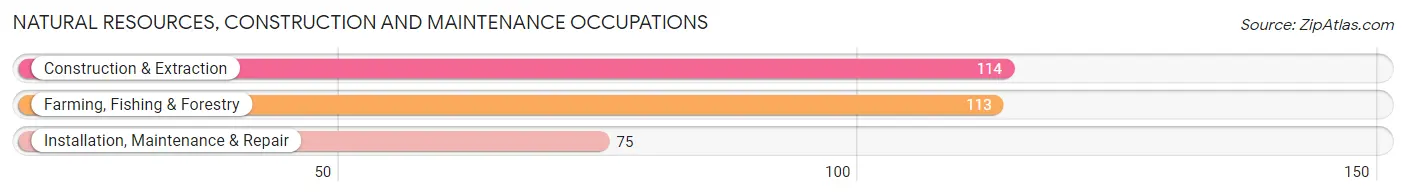
Natural Resources, Construction and Maintenance Occupations
The most common Natural Resources, Construction and Maintenance occupations in Wauchula are Construction & Extraction (114 | 7.2%), Farming, Fishing & Forestry (113 | 7.1%), and Installation, Maintenance & Repair (75 | 4.7%).
Natural Resources, Construction and Maintenance Occupations by Sex
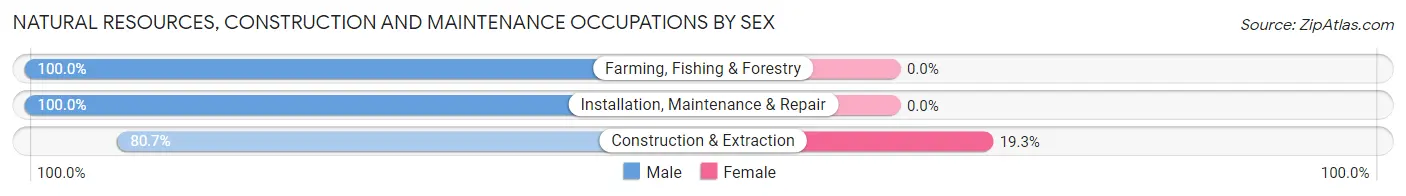
| Occupation | Male | Female |
| Farming, Fishing & Forestry | 113 (100.0%) | 0 (0.0%) |
| Construction & Extraction | 92 (80.7%) | 22 (19.3%) |
| Installation, Maintenance & Repair | 75 (100.0%) | 0 (0.0%) |
| Total (Category) | 280 (92.7%) | 22 (7.3%) |
| Total (Overall) | 937 (58.9%) | 654 (41.1%) |
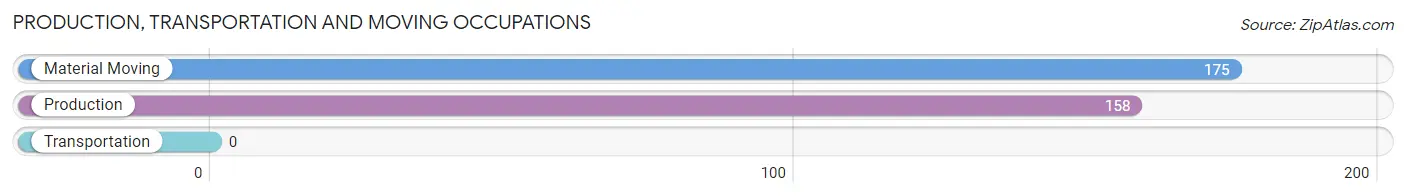
Production, Transportation and Moving Occupations
The most common Production, Transportation and Moving occupations in Wauchula are Material Moving (175 | 11.0%), and Production (158 | 9.9%).
Production, Transportation and Moving Occupations by Sex
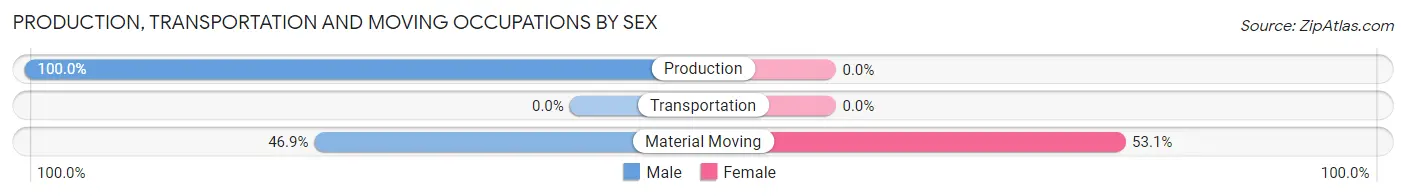
| Occupation | Male | Female |
| Production | 158 (100.0%) | 0 (0.0%) |
| Transportation | 0 (0.0%) | 0 (0.0%) |
| Material Moving | 82 (46.9%) | 93 (53.1%) |
| Total (Category) | 240 (72.1%) | 93 (27.9%) |
| Total (Overall) | 937 (58.9%) | 654 (41.1%) |
Employment Industries by Sex in Wauchula
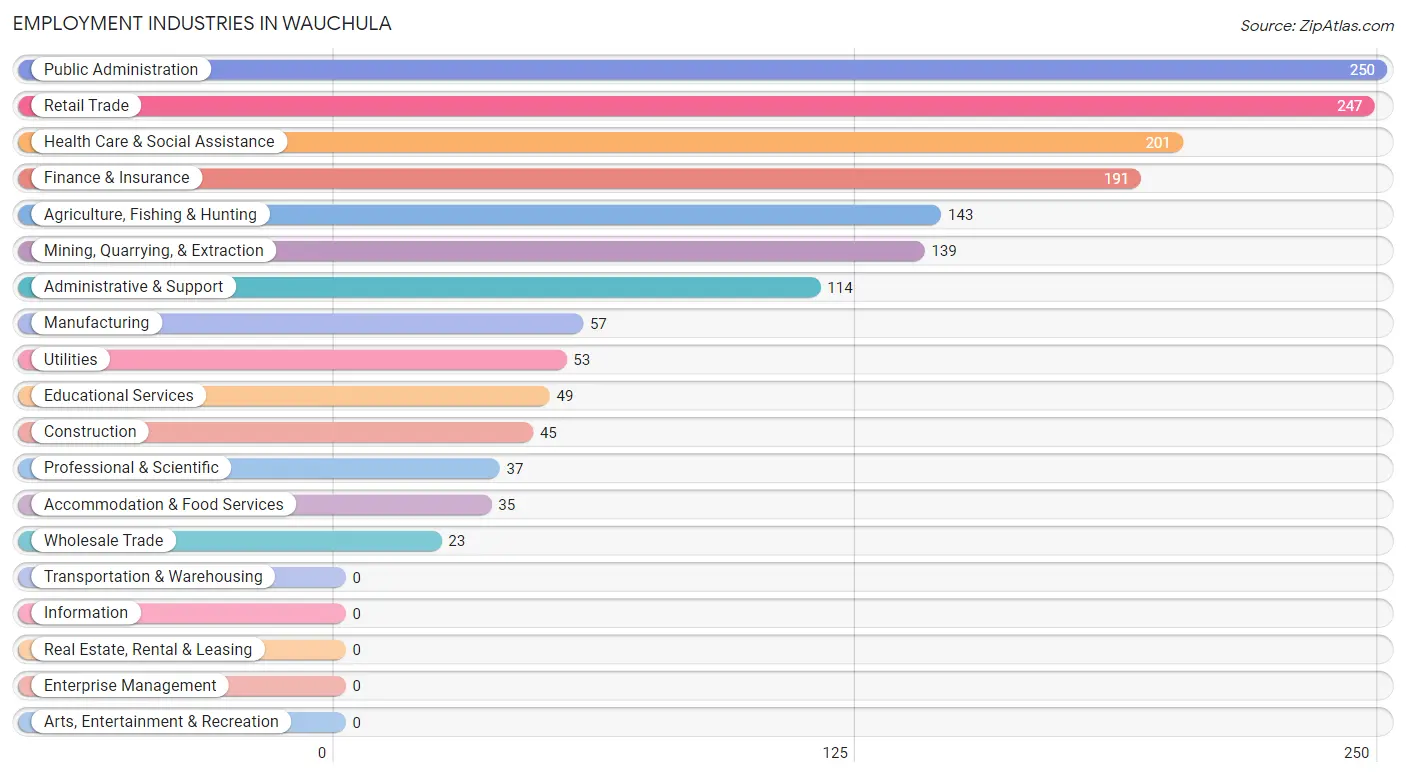
Employment Industries in Wauchula
The major employment industries in Wauchula include Public Administration (250 | 15.7%), Retail Trade (247 | 15.5%), Health Care & Social Assistance (201 | 12.6%), Finance & Insurance (191 | 12.0%), and Agriculture, Fishing & Hunting (143 | 9.0%).
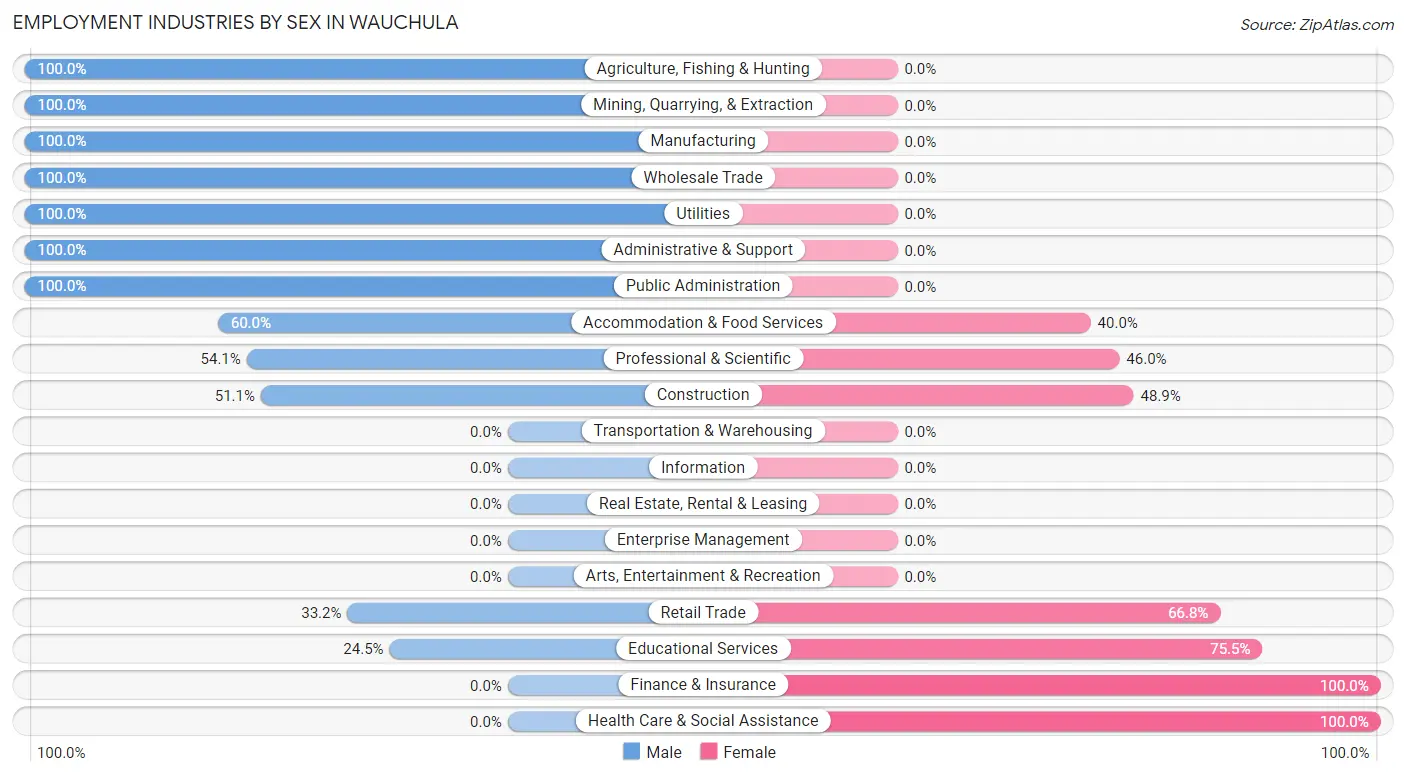
Employment Industries by Sex in Wauchula
The Wauchula industries that see more men than women are Agriculture, Fishing & Hunting (100.0%), Mining, Quarrying, & Extraction (100.0%), and Manufacturing (100.0%), whereas the industries that tend to have a higher number of women are Finance & Insurance (100.0%), Health Care & Social Assistance (100.0%), and Educational Services (75.5%).
| Industry | Male | Female |
| Agriculture, Fishing & Hunting | 143 (100.0%) | 0 (0.0%) |
| Mining, Quarrying, & Extraction | 139 (100.0%) | 0 (0.0%) |
| Construction | 23 (51.1%) | 22 (48.9%) |
| Manufacturing | 57 (100.0%) | 0 (0.0%) |
| Wholesale Trade | 23 (100.0%) | 0 (0.0%) |
| Retail Trade | 82 (33.2%) | 165 (66.8%) |
| Transportation & Warehousing | 0 (0.0%) | 0 (0.0%) |
| Utilities | 53 (100.0%) | 0 (0.0%) |
| Information | 0 (0.0%) | 0 (0.0%) |
| Finance & Insurance | 0 (0.0%) | 191 (100.0%) |
| Real Estate, Rental & Leasing | 0 (0.0%) | 0 (0.0%) |
| Professional & Scientific | 20 (54.0%) | 17 (46.0%) |
| Enterprise Management | 0 (0.0%) | 0 (0.0%) |
| Administrative & Support | 114 (100.0%) | 0 (0.0%) |
| Educational Services | 12 (24.5%) | 37 (75.5%) |
| Health Care & Social Assistance | 0 (0.0%) | 201 (100.0%) |
| Arts, Entertainment & Recreation | 0 (0.0%) | 0 (0.0%) |
| Accommodation & Food Services | 21 (60.0%) | 14 (40.0%) |
| Public Administration | 250 (100.0%) | 0 (0.0%) |
| Total | 937 (58.9%) | 654 (41.1%) |
Education in Wauchula
School Enrollment in Wauchula
The most common levels of schooling among the 1,408 students in Wauchula are high school (455 | 32.3%), middle school (291 | 20.7%), and elementary school (288 | 20.4%).
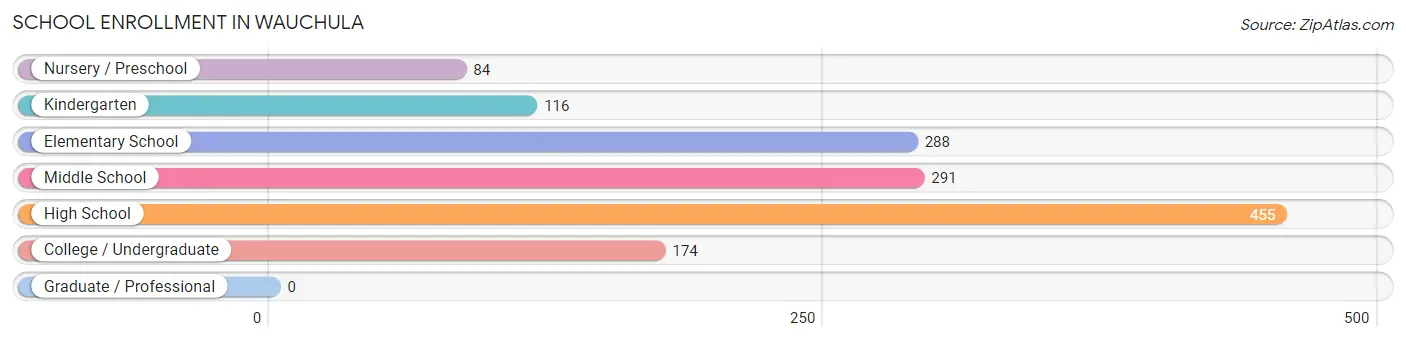
| School Level | # Students | % Students |
| Nursery / Preschool | 84 | 6.0% |
| Kindergarten | 116 | 8.2% |
| Elementary School | 288 | 20.4% |
| Middle School | 291 | 20.7% |
| High School | 455 | 32.3% |
| College / Undergraduate | 174 | 12.4% |
| Graduate / Professional | 0 | 0.0% |
| Total | 1,408 | 100.0% |
School Enrollment by Age by Funding Source in Wauchula
Out of a total of 1,408 students who are enrolled in schools in Wauchula, 1 (0.1%) attend a private institution, while the remaining 1,407 (99.9%) are enrolled in public schools. The age group of 10 to 14 year olds has the highest likelihood of being enrolled in private schools, with 1 (0.2% in the age bracket) enrolled. Conversely, the age group of 3 to 4 year olds has the lowest likelihood of being enrolled in a private school, with 14 (100.0% in the age bracket) attending a public institution.
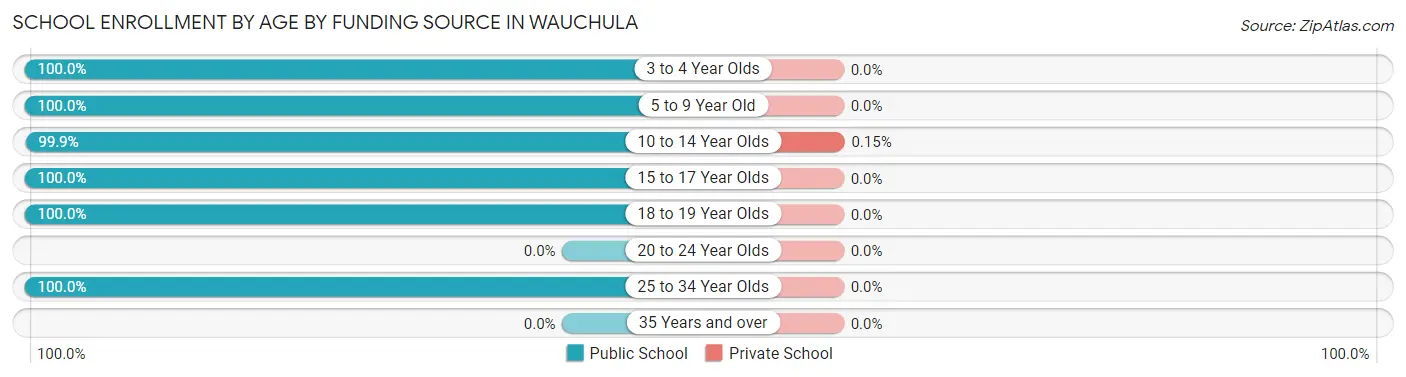
| Age Bracket | Public School | Private School |
| 3 to 4 Year Olds | 14 (100.0%) | 0 (0.0%) |
| 5 to 9 Year Old | 321 (100.0%) | 0 (0.0%) |
| 10 to 14 Year Olds | 657 (99.9%) | 1 (0.2%) |
| 15 to 17 Year Olds | 227 (100.0%) | 0 (0.0%) |
| 18 to 19 Year Olds | 138 (100.0%) | 0 (0.0%) |
| 20 to 24 Year Olds | 0 (0.0%) | 0 (0.0%) |
| 25 to 34 Year Olds | 50 (100.0%) | 0 (0.0%) |
| 35 Years and over | 0 (0.0%) | 0 (0.0%) |
| Total | 1,407 (99.9%) | 1 (0.1%) |
Educational Attainment by Field of Study in Wauchula
Education (48 | 38.7%), psychology (24 | 19.4%), bio, nature & agricultural (21 | 16.9%), business (19 | 15.3%), and visual & performing arts (12 | 9.7%) are the most common fields of study among 124 individuals in Wauchula who have obtained a bachelor's degree or higher.
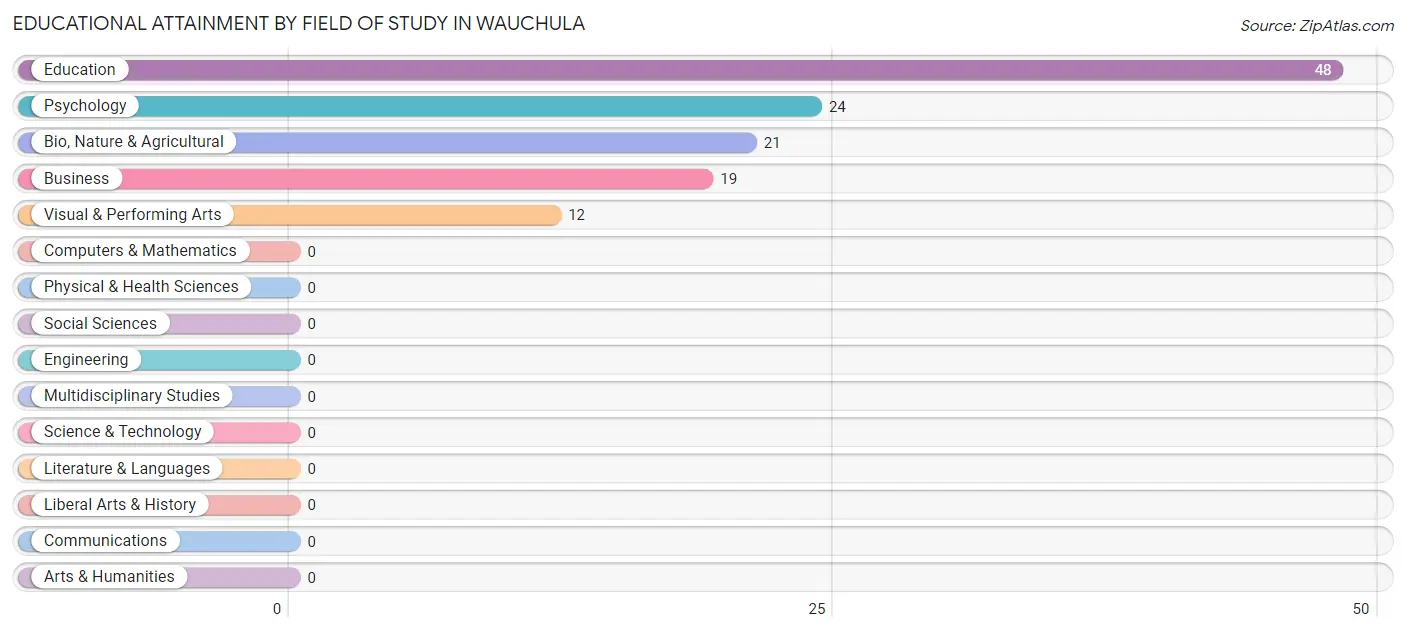
| Field of Study | # Graduates | % Graduates |
| Computers & Mathematics | 0 | 0.0% |
| Bio, Nature & Agricultural | 21 | 16.9% |
| Physical & Health Sciences | 0 | 0.0% |
| Psychology | 24 | 19.4% |
| Social Sciences | 0 | 0.0% |
| Engineering | 0 | 0.0% |
| Multidisciplinary Studies | 0 | 0.0% |
| Science & Technology | 0 | 0.0% |
| Business | 19 | 15.3% |
| Education | 48 | 38.7% |
| Literature & Languages | 0 | 0.0% |
| Liberal Arts & History | 0 | 0.0% |
| Visual & Performing Arts | 12 | 9.7% |
| Communications | 0 | 0.0% |
| Arts & Humanities | 0 | 0.0% |
| Total | 124 | 100.0% |
Transportation & Commute in Wauchula
Vehicle Availability by Sex in Wauchula
The most prevalent vehicle ownership categories in Wauchula are males with 1 vehicle (290, accounting for 30.9%) and females with 1 vehicle (240, making up 44.3%).
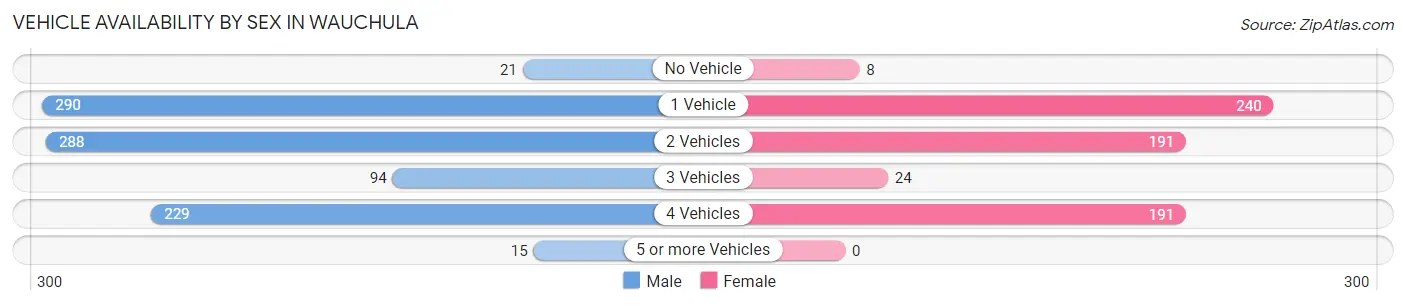
| Vehicles Available | Male | Female |
| No Vehicle | 21 (2.2%) | 8 (1.2%) |
| 1 Vehicle | 290 (30.9%) | 240 (36.7%) |
| 2 Vehicles | 288 (30.7%) | 191 (29.2%) |
| 3 Vehicles | 94 (10.0%) | 24 (3.7%) |
| 4 Vehicles | 229 (24.4%) | 191 (29.2%) |
| 5 or more Vehicles | 15 (1.6%) | 0 (0.0%) |
| Total | 937 (100.0%) | 654 (100.0%) |
Commute Time in Wauchula
The most frequently occuring commute durations in Wauchula are 15 to 19 minutes (301 commuters, 19.1%), 20 to 24 minutes (287 commuters, 18.2%), and 45 to 59 minutes (250 commuters, 15.9%).
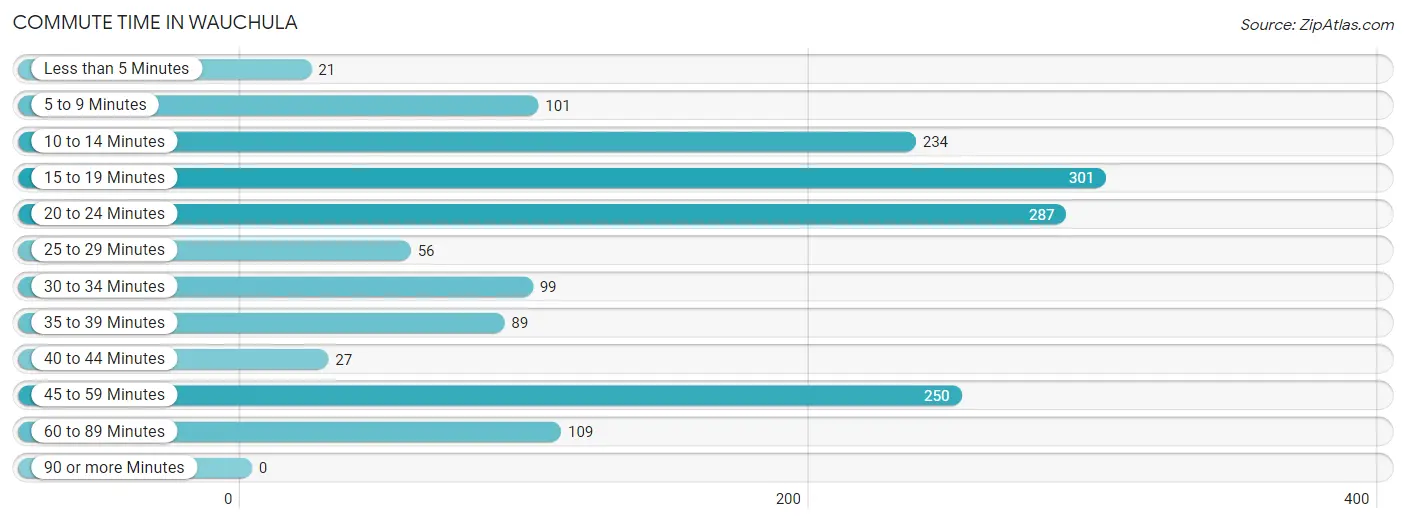
| Commute Time | # Commuters | % Commuters |
| Less than 5 Minutes | 21 | 1.3% |
| 5 to 9 Minutes | 101 | 6.4% |
| 10 to 14 Minutes | 234 | 14.9% |
| 15 to 19 Minutes | 301 | 19.1% |
| 20 to 24 Minutes | 287 | 18.2% |
| 25 to 29 Minutes | 56 | 3.6% |
| 30 to 34 Minutes | 99 | 6.3% |
| 35 to 39 Minutes | 89 | 5.7% |
| 40 to 44 Minutes | 27 | 1.7% |
| 45 to 59 Minutes | 250 | 15.9% |
| 60 to 89 Minutes | 109 | 6.9% |
| 90 or more Minutes | 0 | 0.0% |
Commute Time by Sex in Wauchula
The most common commute times in Wauchula are 45 to 59 minutes (250 commuters, 26.7%) for males and 15 to 19 minutes (219 commuters, 34.4%) for females.
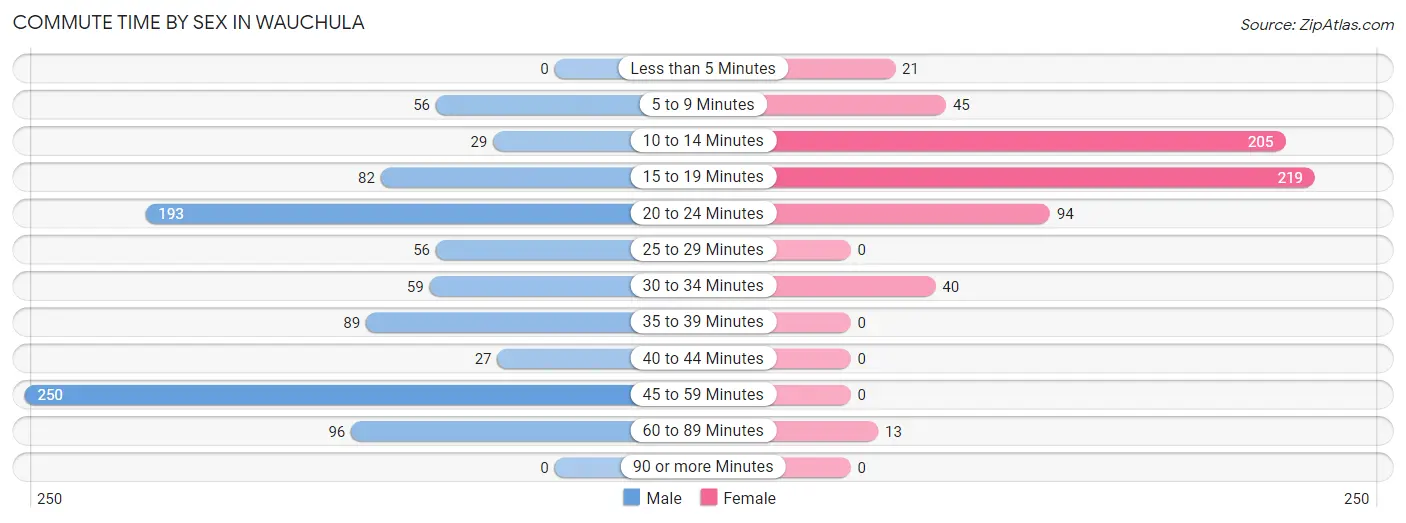
| Commute Time | Male | Female |
| Less than 5 Minutes | 0 (0.0%) | 21 (3.3%) |
| 5 to 9 Minutes | 56 (6.0%) | 45 (7.1%) |
| 10 to 14 Minutes | 29 (3.1%) | 205 (32.2%) |
| 15 to 19 Minutes | 82 (8.7%) | 219 (34.4%) |
| 20 to 24 Minutes | 193 (20.6%) | 94 (14.8%) |
| 25 to 29 Minutes | 56 (6.0%) | 0 (0.0%) |
| 30 to 34 Minutes | 59 (6.3%) | 40 (6.3%) |
| 35 to 39 Minutes | 89 (9.5%) | 0 (0.0%) |
| 40 to 44 Minutes | 27 (2.9%) | 0 (0.0%) |
| 45 to 59 Minutes | 250 (26.7%) | 0 (0.0%) |
| 60 to 89 Minutes | 96 (10.2%) | 13 (2.0%) |
| 90 or more Minutes | 0 (0.0%) | 0 (0.0%) |
Time of Departure to Work by Sex in Wauchula
The most frequent times of departure to work in Wauchula are 5:00 AM to 5:29 AM (256, 27.3%) for males and 12:00 PM to 3:59 PM (213, 33.4%) for females.
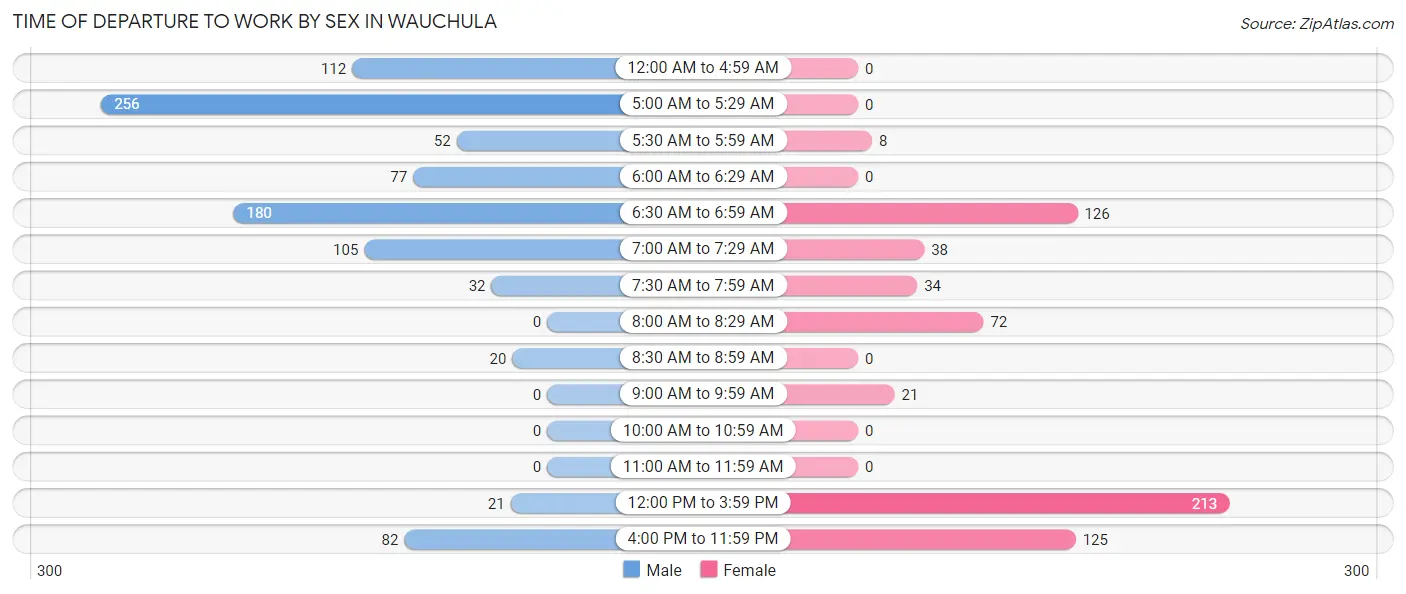
| Time of Departure | Male | Female |
| 12:00 AM to 4:59 AM | 112 (11.9%) | 0 (0.0%) |
| 5:00 AM to 5:29 AM | 256 (27.3%) | 0 (0.0%) |
| 5:30 AM to 5:59 AM | 52 (5.6%) | 8 (1.3%) |
| 6:00 AM to 6:29 AM | 77 (8.2%) | 0 (0.0%) |
| 6:30 AM to 6:59 AM | 180 (19.2%) | 126 (19.8%) |
| 7:00 AM to 7:29 AM | 105 (11.2%) | 38 (6.0%) |
| 7:30 AM to 7:59 AM | 32 (3.4%) | 34 (5.3%) |
| 8:00 AM to 8:29 AM | 0 (0.0%) | 72 (11.3%) |
| 8:30 AM to 8:59 AM | 20 (2.1%) | 0 (0.0%) |
| 9:00 AM to 9:59 AM | 0 (0.0%) | 21 (3.3%) |
| 10:00 AM to 10:59 AM | 0 (0.0%) | 0 (0.0%) |
| 11:00 AM to 11:59 AM | 0 (0.0%) | 0 (0.0%) |
| 12:00 PM to 3:59 PM | 21 (2.2%) | 213 (33.4%) |
| 4:00 PM to 11:59 PM | 82 (8.7%) | 125 (19.6%) |
| Total | 937 (100.0%) | 637 (100.0%) |
Housing Occupancy in Wauchula
Occupancy by Ownership in Wauchula
Of the total 1,804 dwellings in Wauchula, owner-occupied units account for 778 (43.1%), while renter-occupied units make up 1,026 (56.9%).
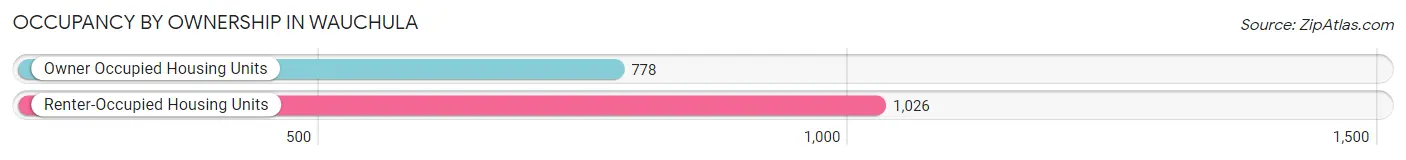
| Occupancy | # Housing Units | % Housing Units |
| Owner Occupied Housing Units | 778 | 43.1% |
| Renter-Occupied Housing Units | 1,026 | 56.9% |
| Total Occupied Housing Units | 1,804 | 100.0% |
Occupancy by Household Size in Wauchula
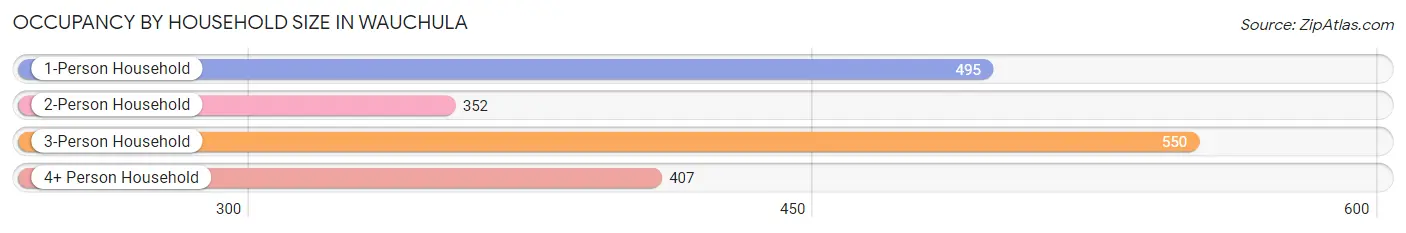
| Household Size | # Housing Units | % Housing Units |
| 1-Person Household | 495 | 27.4% |
| 2-Person Household | 352 | 19.5% |
| 3-Person Household | 550 | 30.5% |
| 4+ Person Household | 407 | 22.6% |
| Total Housing Units | 1,804 | 100.0% |
Occupancy by Ownership by Household Size in Wauchula
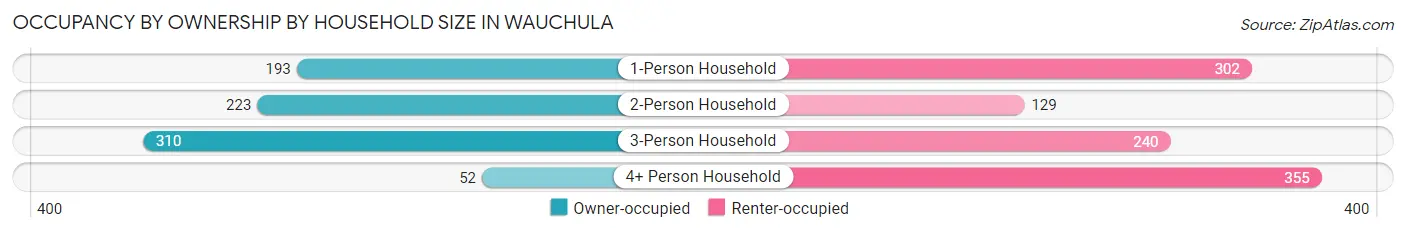
| Household Size | Owner-occupied | Renter-occupied |
| 1-Person Household | 193 (39.0%) | 302 (61.0%) |
| 2-Person Household | 223 (63.3%) | 129 (36.6%) |
| 3-Person Household | 310 (56.4%) | 240 (43.6%) |
| 4+ Person Household | 52 (12.8%) | 355 (87.2%) |
| Total Housing Units | 778 (43.1%) | 1,026 (56.9%) |
Occupancy by Educational Attainment in Wauchula
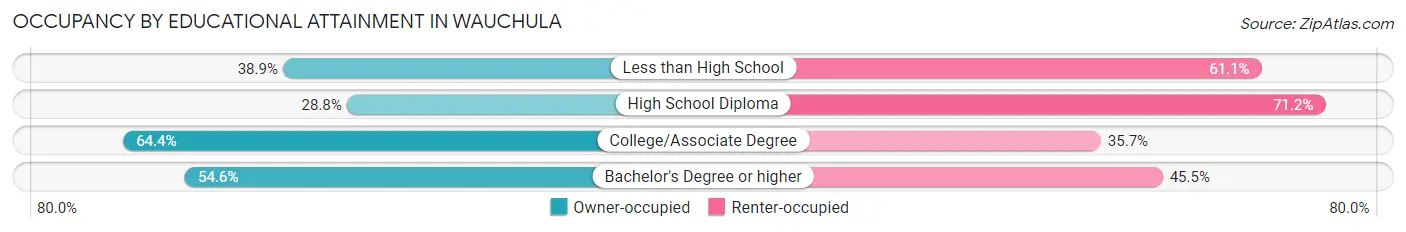
| Household Size | Owner-occupied | Renter-occupied |
| Less than High School | 198 (38.9%) | 311 (61.1%) |
| High School Diploma | 198 (28.8%) | 490 (71.2%) |
| College/Associate Degree | 334 (64.3%) | 185 (35.6%) |
| Bachelor's Degree or higher | 48 (54.5%) | 40 (45.5%) |
Occupancy by Age of Householder in Wauchula
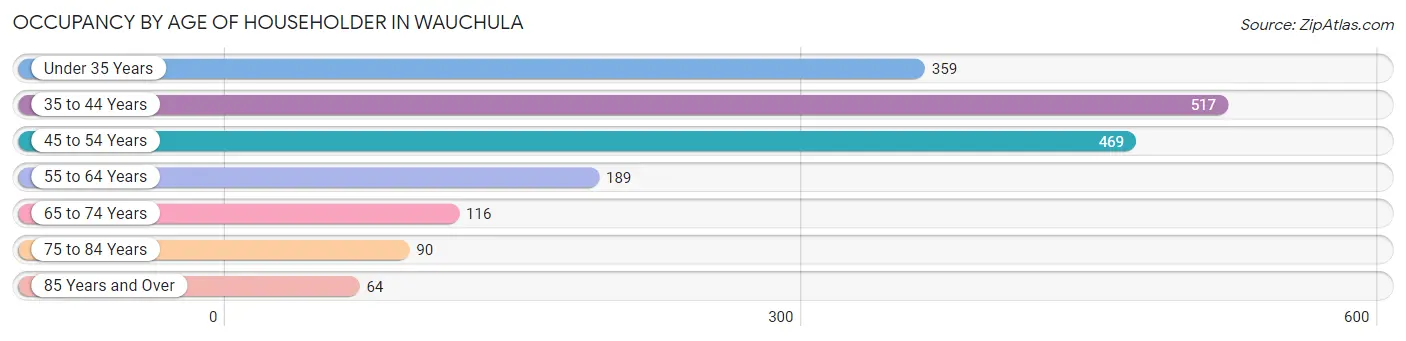
| Age Bracket | # Households | % Households |
| Under 35 Years | 359 | 19.9% |
| 35 to 44 Years | 517 | 28.7% |
| 45 to 54 Years | 469 | 26.0% |
| 55 to 64 Years | 189 | 10.5% |
| 65 to 74 Years | 116 | 6.4% |
| 75 to 84 Years | 90 | 5.0% |
| 85 Years and Over | 64 | 3.5% |
| Total | 1,804 | 100.0% |
Housing Finances in Wauchula
Median Income by Occupancy in Wauchula
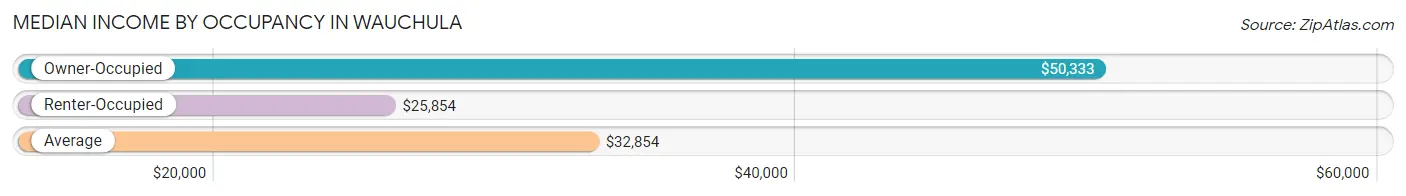
| Occupancy Type | # Households | Median Income |
| Owner-Occupied | 778 (43.1%) | $50,333 |
| Renter-Occupied | 1,026 (56.9%) | $25,854 |
| Average | 1,804 (100.0%) | $32,854 |
Occupancy by Householder Income Bracket in Wauchula
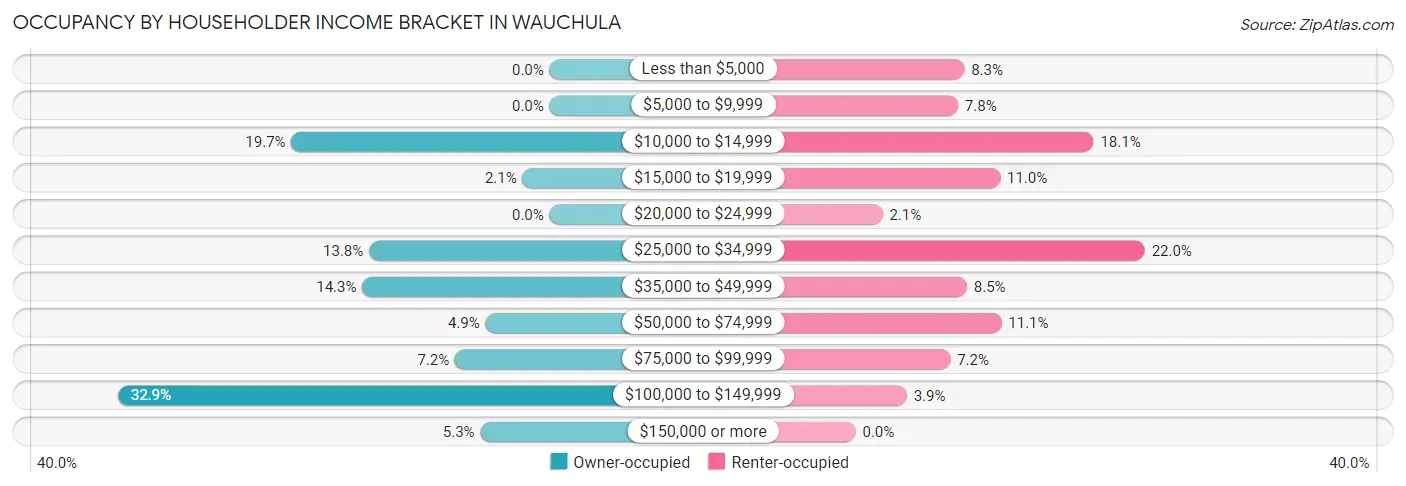
| Income Bracket | Owner-occupied | Renter-occupied |
| Less than $5,000 | 0 (0.0%) | 85 (8.3%) |
| $5,000 to $9,999 | 0 (0.0%) | 80 (7.8%) |
| $10,000 to $14,999 | 153 (19.7%) | 186 (18.1%) |
| $15,000 to $19,999 | 16 (2.1%) | 113 (11.0%) |
| $20,000 to $24,999 | 0 (0.0%) | 21 (2.1%) |
| $25,000 to $34,999 | 107 (13.8%) | 226 (22.0%) |
| $35,000 to $49,999 | 111 (14.3%) | 87 (8.5%) |
| $50,000 to $74,999 | 38 (4.9%) | 114 (11.1%) |
| $75,000 to $99,999 | 56 (7.2%) | 74 (7.2%) |
| $100,000 to $149,999 | 256 (32.9%) | 40 (3.9%) |
| $150,000 or more | 41 (5.3%) | 0 (0.0%) |
| Total | 778 (100.0%) | 1,026 (100.0%) |
Monthly Housing Cost Tiers in Wauchula
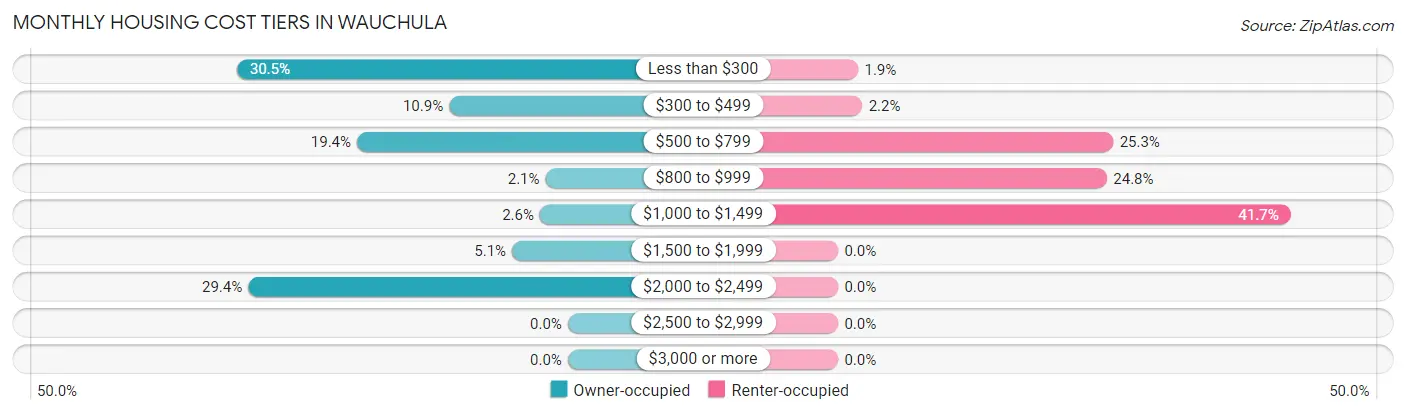
| Monthly Cost | Owner-occupied | Renter-occupied |
| Less than $300 | 237 (30.5%) | 19 (1.8%) |
| $300 to $499 | 85 (10.9%) | 23 (2.2%) |
| $500 to $799 | 151 (19.4%) | 260 (25.3%) |
| $800 to $999 | 16 (2.1%) | 254 (24.8%) |
| $1,000 to $1,499 | 20 (2.6%) | 428 (41.7%) |
| $1,500 to $1,999 | 40 (5.1%) | 0 (0.0%) |
| $2,000 to $2,499 | 229 (29.4%) | 0 (0.0%) |
| $2,500 to $2,999 | 0 (0.0%) | 0 (0.0%) |
| $3,000 or more | 0 (0.0%) | 0 (0.0%) |
| Total | 778 (100.0%) | 1,026 (100.0%) |
Physical Housing Characteristics in Wauchula
Housing Structures in Wauchula
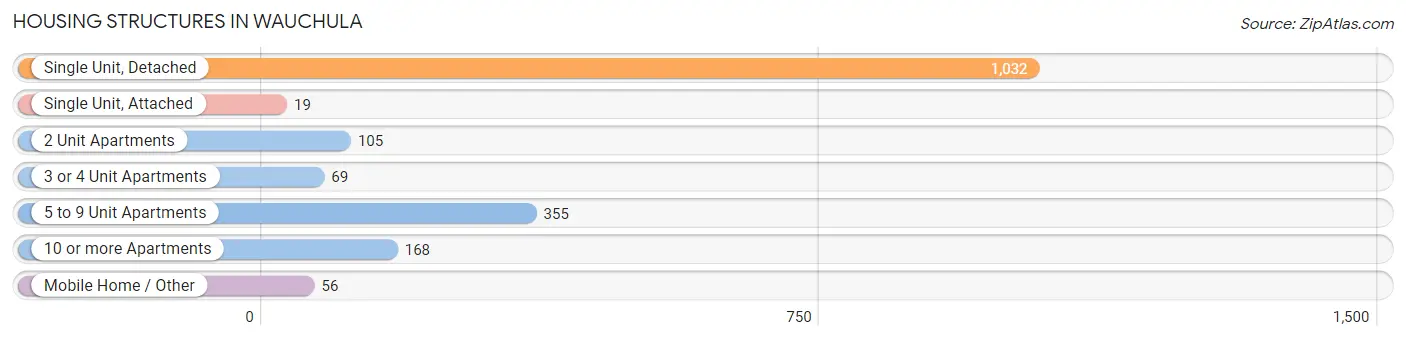
| Structure Type | # Housing Units | % Housing Units |
| Single Unit, Detached | 1,032 | 57.2% |
| Single Unit, Attached | 19 | 1.1% |
| 2 Unit Apartments | 105 | 5.8% |
| 3 or 4 Unit Apartments | 69 | 3.8% |
| 5 to 9 Unit Apartments | 355 | 19.7% |
| 10 or more Apartments | 168 | 9.3% |
| Mobile Home / Other | 56 | 3.1% |
| Total | 1,804 | 100.0% |
Housing Structures by Occupancy in Wauchula
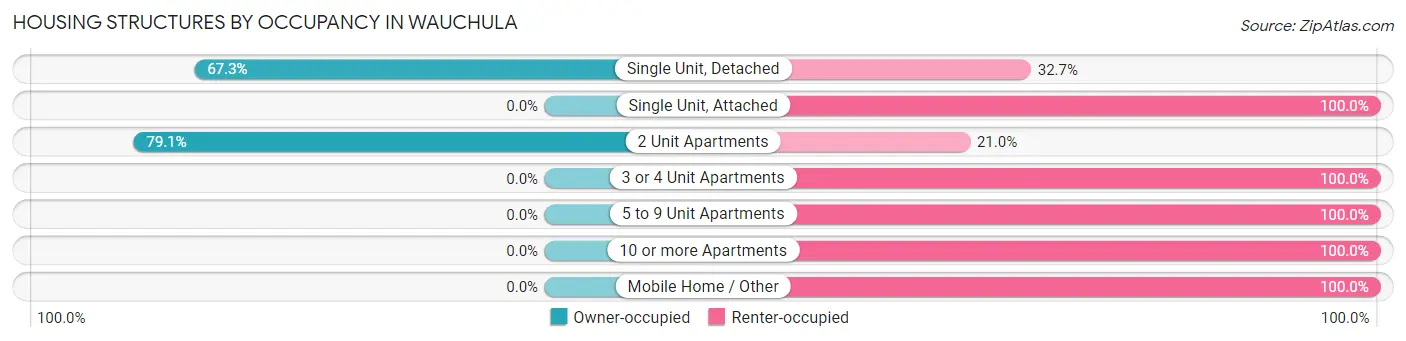
| Structure Type | Owner-occupied | Renter-occupied |
| Single Unit, Detached | 695 (67.3%) | 337 (32.7%) |
| Single Unit, Attached | 0 (0.0%) | 19 (100.0%) |
| 2 Unit Apartments | 83 (79.0%) | 22 (20.9%) |
| 3 or 4 Unit Apartments | 0 (0.0%) | 69 (100.0%) |
| 5 to 9 Unit Apartments | 0 (0.0%) | 355 (100.0%) |
| 10 or more Apartments | 0 (0.0%) | 168 (100.0%) |
| Mobile Home / Other | 0 (0.0%) | 56 (100.0%) |
| Total | 778 (43.1%) | 1,026 (56.9%) |
Housing Structures by Number of Rooms in Wauchula
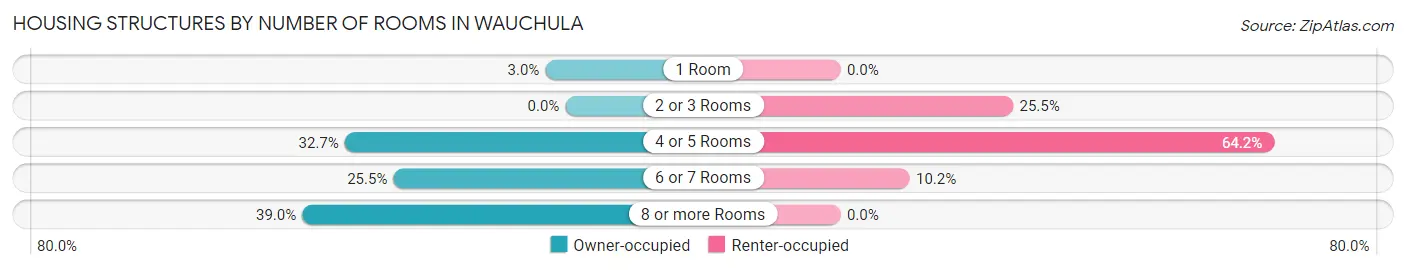
| Number of Rooms | Owner-occupied | Renter-occupied |
| 1 Room | 23 (3.0%) | 0 (0.0%) |
| 2 or 3 Rooms | 0 (0.0%) | 262 (25.5%) |
| 4 or 5 Rooms | 254 (32.7%) | 659 (64.2%) |
| 6 or 7 Rooms | 198 (25.5%) | 105 (10.2%) |
| 8 or more Rooms | 303 (39.0%) | 0 (0.0%) |
| Total | 778 (100.0%) | 1,026 (100.0%) |
Housing Structure by Heating Type in Wauchula
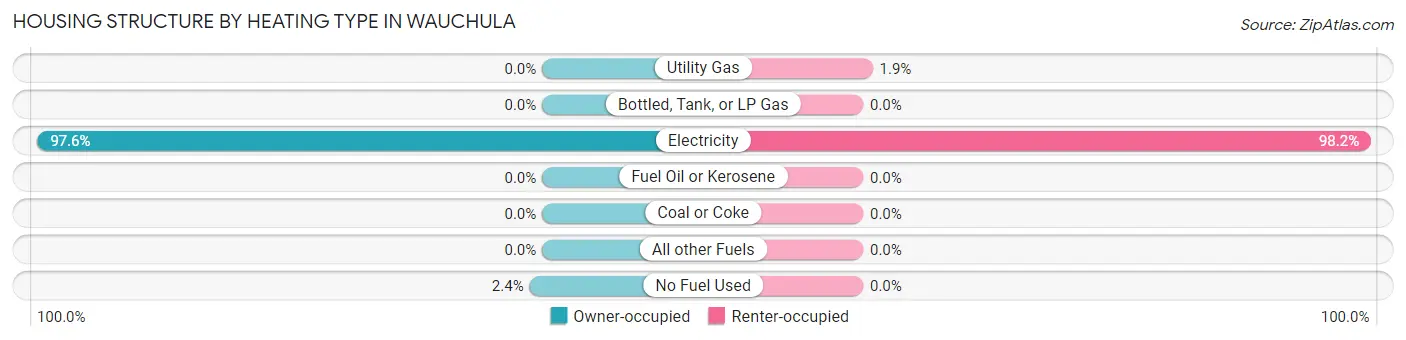
| Heating Type | Owner-occupied | Renter-occupied |
| Utility Gas | 0 (0.0%) | 19 (1.8%) |
| Bottled, Tank, or LP Gas | 0 (0.0%) | 0 (0.0%) |
| Electricity | 759 (97.6%) | 1,007 (98.2%) |
| Fuel Oil or Kerosene | 0 (0.0%) | 0 (0.0%) |
| Coal or Coke | 0 (0.0%) | 0 (0.0%) |
| All other Fuels | 0 (0.0%) | 0 (0.0%) |
| No Fuel Used | 19 (2.4%) | 0 (0.0%) |
| Total | 778 (100.0%) | 1,026 (100.0%) |
Household Vehicle Usage in Wauchula
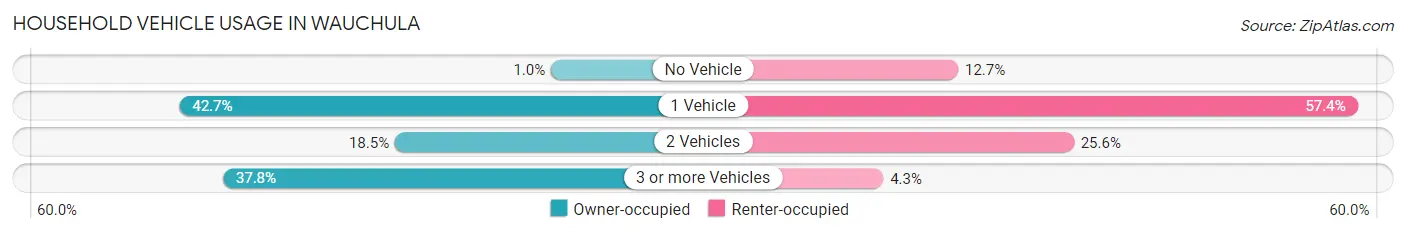
| Vehicles per Household | Owner-occupied | Renter-occupied |
| No Vehicle | 8 (1.0%) | 130 (12.7%) |
| 1 Vehicle | 332 (42.7%) | 589 (57.4%) |
| 2 Vehicles | 144 (18.5%) | 263 (25.6%) |
| 3 or more Vehicles | 294 (37.8%) | 44 (4.3%) |
| Total | 778 (100.0%) | 1,026 (100.0%) |
Real Estate & Mortgages in Wauchula
Real Estate and Mortgage Overview in Wauchula
| Characteristic | Without Mortgage | With Mortgage |
| Housing Units | 371 | 407 |
| Median Property Value | $75,300 | $255,600 |
| Median Household Income | - | - |
| Monthly Housing Costs | $287 | $0 |
| Real Estate Taxes | $816 | $0 |
Property Value by Mortgage Status in Wauchula
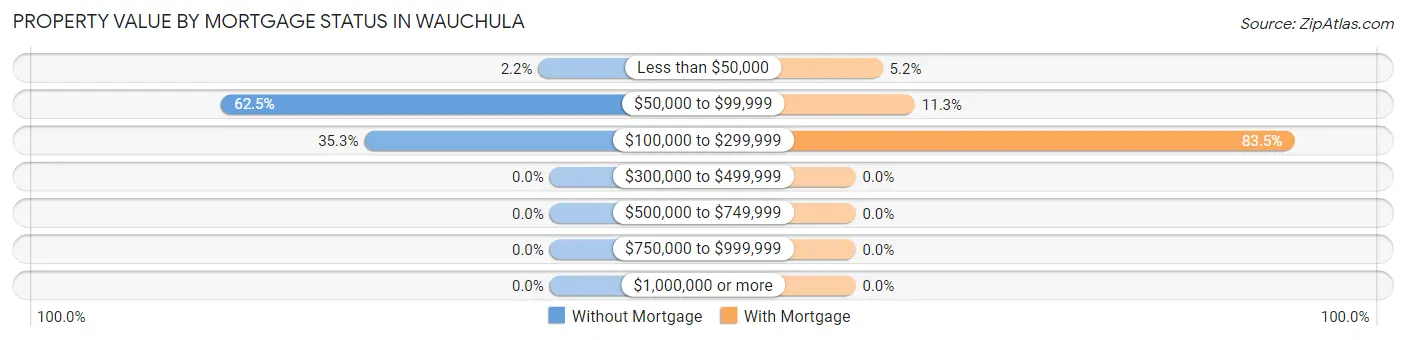
| Property Value | Without Mortgage | With Mortgage |
| Less than $50,000 | 8 (2.2%) | 21 (5.2%) |
| $50,000 to $99,999 | 232 (62.5%) | 46 (11.3%) |
| $100,000 to $299,999 | 131 (35.3%) | 340 (83.5%) |
| $300,000 to $499,999 | 0 (0.0%) | 0 (0.0%) |
| $500,000 to $749,999 | 0 (0.0%) | 0 (0.0%) |
| $750,000 to $999,999 | 0 (0.0%) | 0 (0.0%) |
| $1,000,000 or more | 0 (0.0%) | 0 (0.0%) |
| Total | 371 (100.0%) | 407 (100.0%) |
Household Income by Mortgage Status in Wauchula
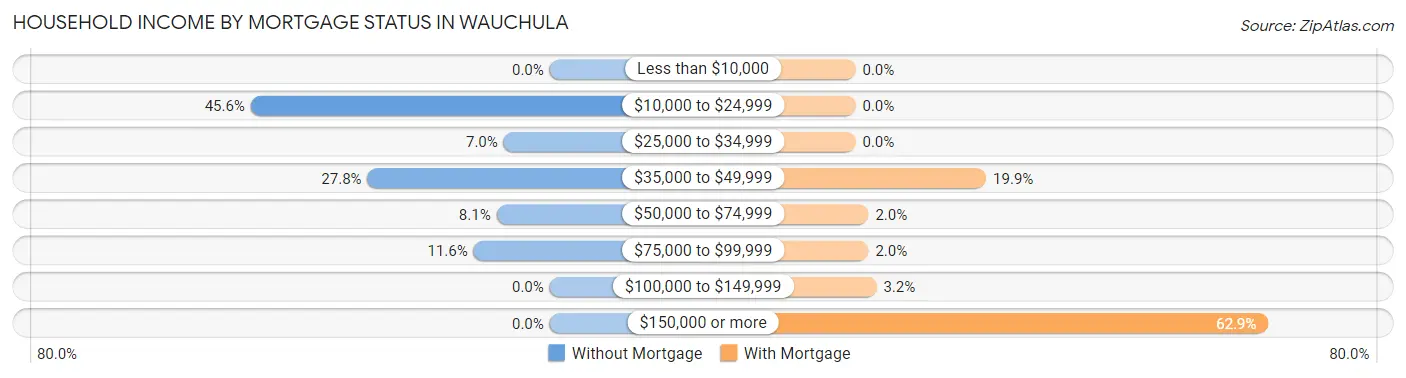
| Household Income | Without Mortgage | With Mortgage |
| Less than $10,000 | 0 (0.0%) | 0 (0.0%) |
| $10,000 to $24,999 | 169 (45.6%) | 0 (0.0%) |
| $25,000 to $34,999 | 26 (7.0%) | 0 (0.0%) |
| $35,000 to $49,999 | 103 (27.8%) | 81 (19.9%) |
| $50,000 to $74,999 | 30 (8.1%) | 8 (2.0%) |
| $75,000 to $99,999 | 43 (11.6%) | 8 (2.0%) |
| $100,000 to $149,999 | 0 (0.0%) | 13 (3.2%) |
| $150,000 or more | 0 (0.0%) | 256 (62.9%) |
| Total | 371 (100.0%) | 407 (100.0%) |
Property Value to Household Income Ratio in Wauchula
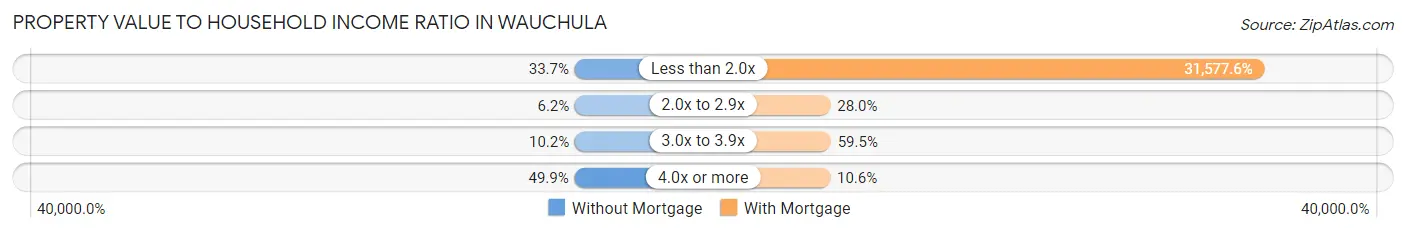
| Value-to-Income Ratio | Without Mortgage | With Mortgage |
| Less than 2.0x | 125 (33.7%) | 128,521 (31,577.6%) |
| 2.0x to 2.9x | 23 (6.2%) | 114 (28.0%) |
| 3.0x to 3.9x | 38 (10.2%) | 242 (59.5%) |
| 4.0x or more | 185 (49.9%) | 43 (10.6%) |
| Total | 371 (100.0%) | 407 (100.0%) |
Real Estate Taxes by Mortgage Status in Wauchula
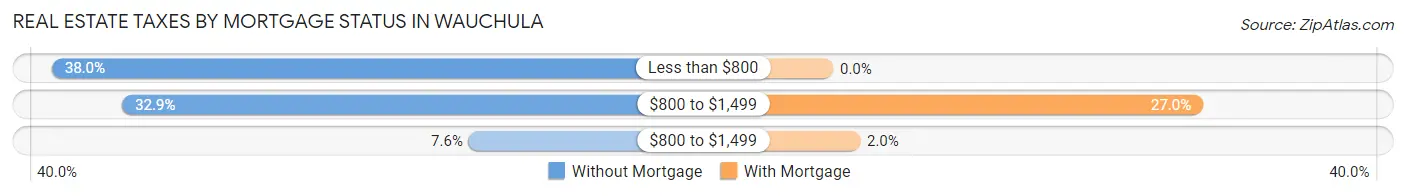
| Property Taxes | Without Mortgage | With Mortgage |
| Less than $800 | 141 (38.0%) | 0 (0.0%) |
| $800 to $1,499 | 122 (32.9%) | 110 (27.0%) |
| $800 to $1,499 | 28 (7.5%) | 8 (2.0%) |
| Total | 371 (100.0%) | 407 (100.0%) |
Health & Disability in Wauchula
Health Insurance Coverage by Age in Wauchula
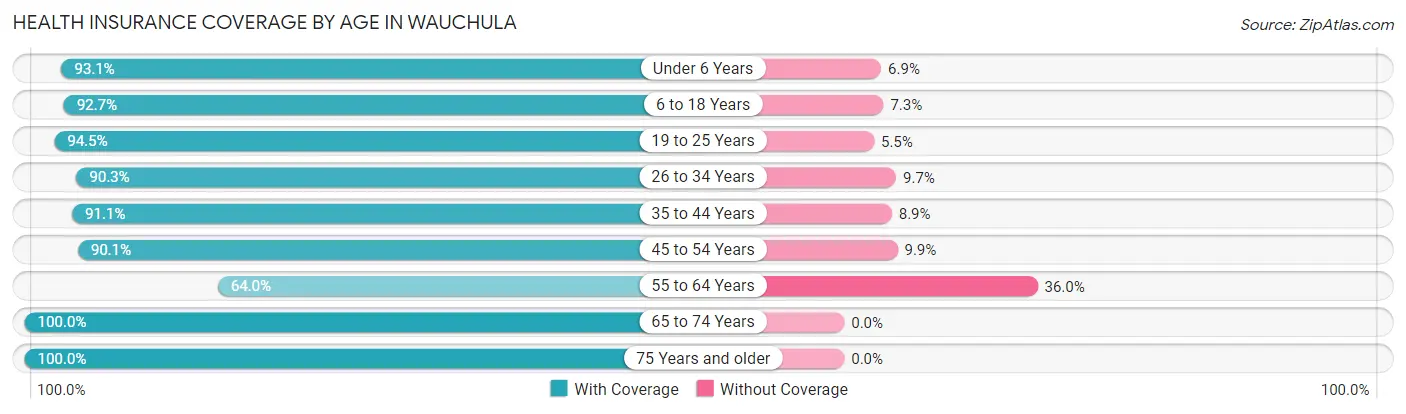
| Age Bracket | With Coverage | Without Coverage |
| Under 6 Years | 624 (93.1%) | 46 (6.9%) |
| 6 to 18 Years | 965 (92.7%) | 76 (7.3%) |
| 19 to 25 Years | 290 (94.5%) | 17 (5.5%) |
| 26 to 34 Years | 421 (90.3%) | 45 (9.7%) |
| 35 to 44 Years | 741 (91.1%) | 72 (8.9%) |
| 45 to 54 Years | 553 (90.1%) | 61 (9.9%) |
| 55 to 64 Years | 261 (64.0%) | 147 (36.0%) |
| 65 to 74 Years | 181 (100.0%) | 0 (0.0%) |
| 75 Years and older | 260 (100.0%) | 0 (0.0%) |
| Total | 4,296 (90.2%) | 464 (9.8%) |
Health Insurance Coverage by Citizenship Status in Wauchula
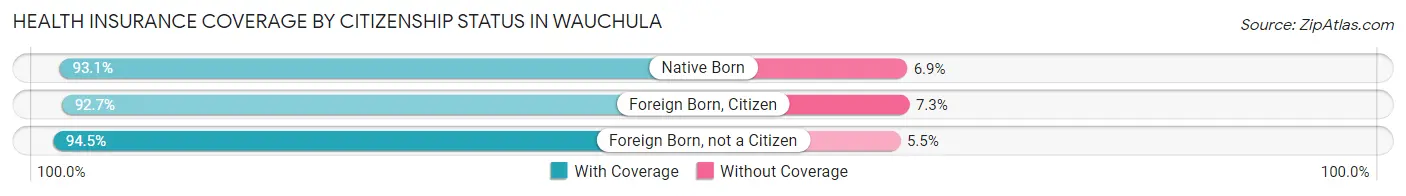
| Citizenship Status | With Coverage | Without Coverage |
| Native Born | 624 (93.1%) | 46 (6.9%) |
| Foreign Born, Citizen | 965 (92.7%) | 76 (7.3%) |
| Foreign Born, not a Citizen | 290 (94.5%) | 17 (5.5%) |
Health Insurance Coverage by Household Income in Wauchula
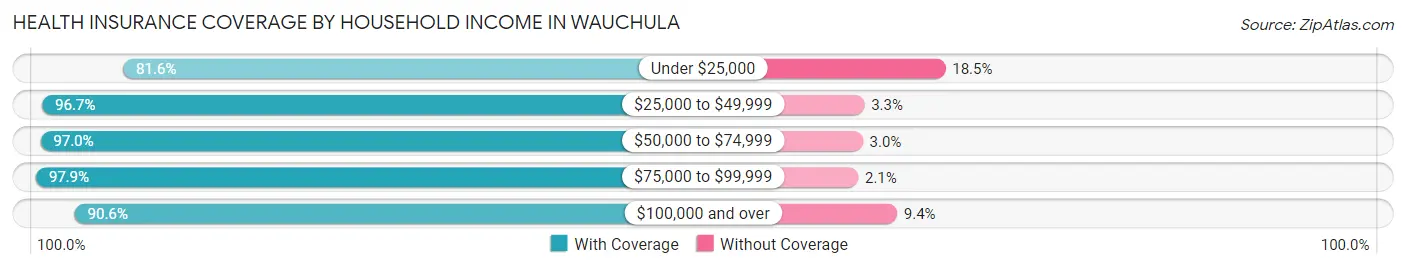
| Household Income | With Coverage | Without Coverage |
| Under $25,000 | 1,114 (81.6%) | 252 (18.4%) |
| $25,000 to $49,999 | 1,360 (96.7%) | 46 (3.3%) |
| $50,000 to $74,999 | 393 (97.0%) | 12 (3.0%) |
| $75,000 to $99,999 | 325 (97.9%) | 7 (2.1%) |
| $100,000 and over | 957 (90.6%) | 99 (9.4%) |
Public vs Private Health Insurance Coverage by Age in Wauchula
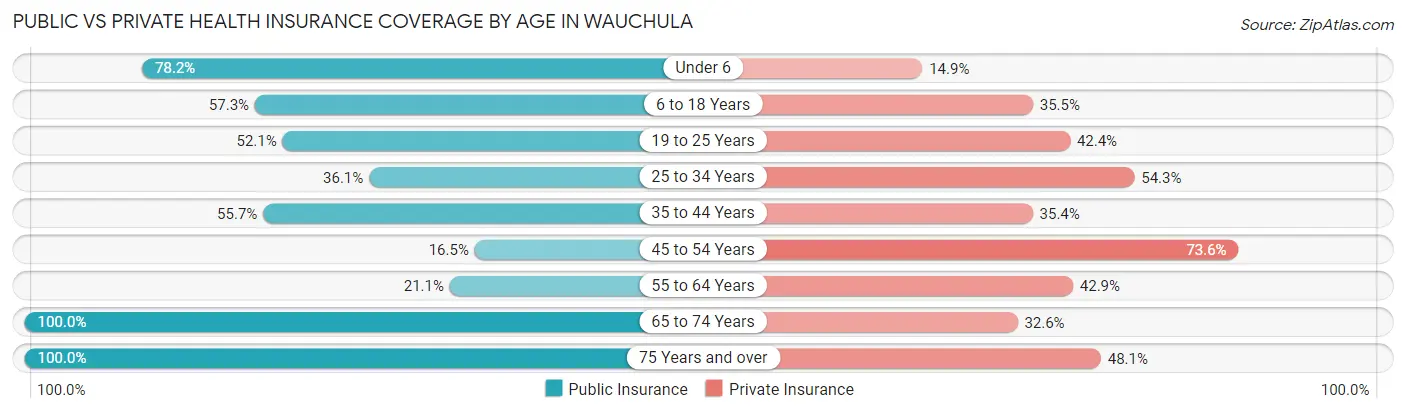
| Age Bracket | Public Insurance | Private Insurance |
| Under 6 | 524 (78.2%) | 100 (14.9%) |
| 6 to 18 Years | 596 (57.3%) | 369 (35.4%) |
| 19 to 25 Years | 160 (52.1%) | 130 (42.3%) |
| 25 to 34 Years | 168 (36.0%) | 253 (54.3%) |
| 35 to 44 Years | 453 (55.7%) | 288 (35.4%) |
| 45 to 54 Years | 101 (16.5%) | 452 (73.6%) |
| 55 to 64 Years | 86 (21.1%) | 175 (42.9%) |
| 65 to 74 Years | 181 (100.0%) | 59 (32.6%) |
| 75 Years and over | 260 (100.0%) | 125 (48.1%) |
| Total | 2,529 (53.1%) | 1,951 (41.0%) |
Disability Status by Sex by Age in Wauchula
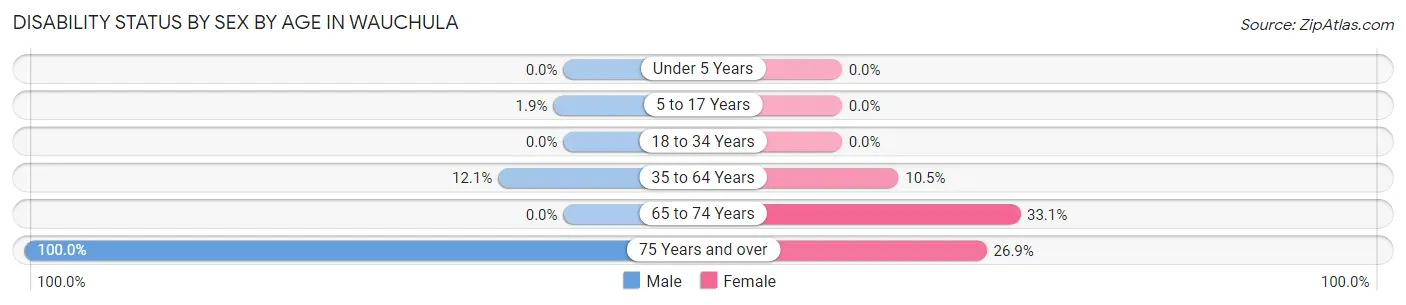
| Age Bracket | Male | Female |
| Under 5 Years | 0 (0.0%) | 0 (0.0%) |
| 5 to 17 Years | 13 (1.9%) | 0 (0.0%) |
| 18 to 34 Years | 0 (0.0%) | 0 (0.0%) |
| 35 to 64 Years | 122 (12.1%) | 87 (10.5%) |
| 65 to 74 Years | 0 (0.0%) | 44 (33.1%) |
| 75 Years and over | 100 (100.0%) | 43 (26.9%) |
Disability Class by Sex by Age in Wauchula
Disability Class: Hearing Difficulty
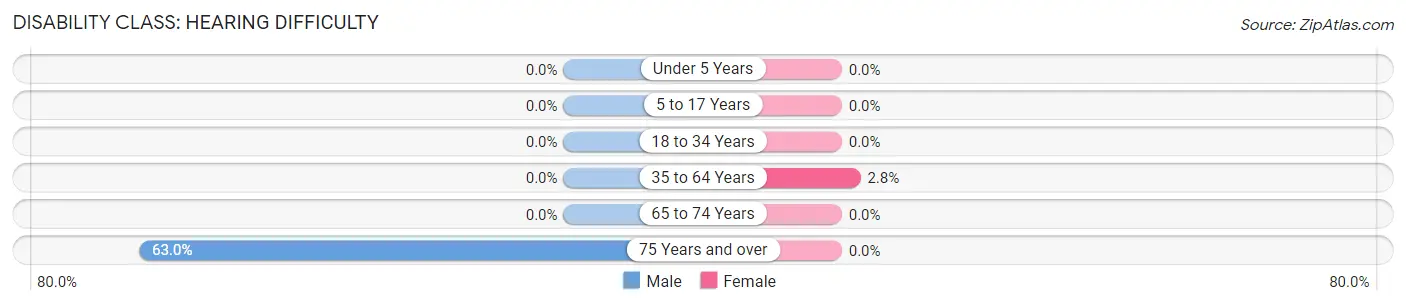
| Age Bracket | Male | Female |
| Under 5 Years | 0 (0.0%) | 0 (0.0%) |
| 5 to 17 Years | 0 (0.0%) | 0 (0.0%) |
| 18 to 34 Years | 0 (0.0%) | 0 (0.0%) |
| 35 to 64 Years | 0 (0.0%) | 23 (2.8%) |
| 65 to 74 Years | 0 (0.0%) | 0 (0.0%) |
| 75 Years and over | 63 (63.0%) | 0 (0.0%) |
Disability Class: Vision Difficulty
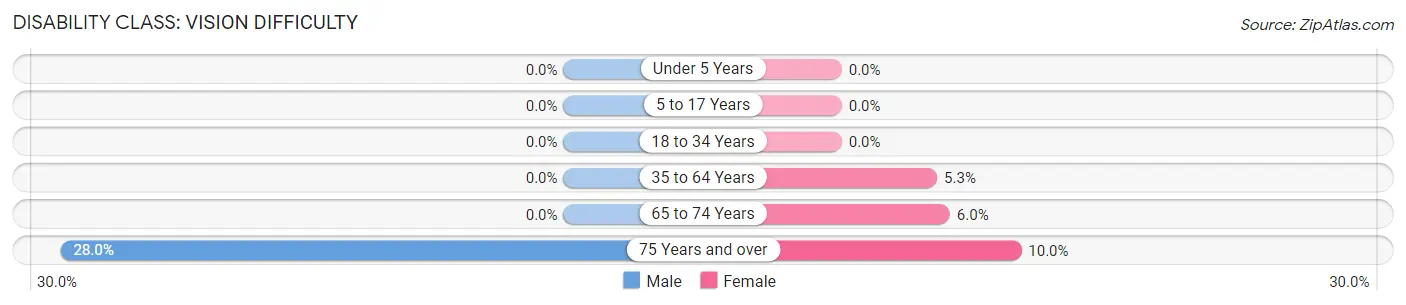
| Age Bracket | Male | Female |
| Under 5 Years | 0 (0.0%) | 0 (0.0%) |
| 5 to 17 Years | 0 (0.0%) | 0 (0.0%) |
| 18 to 34 Years | 0 (0.0%) | 0 (0.0%) |
| 35 to 64 Years | 0 (0.0%) | 44 (5.3%) |
| 65 to 74 Years | 0 (0.0%) | 8 (6.0%) |
| 75 Years and over | 28 (28.0%) | 16 (10.0%) |
Disability Class: Cognitive Difficulty
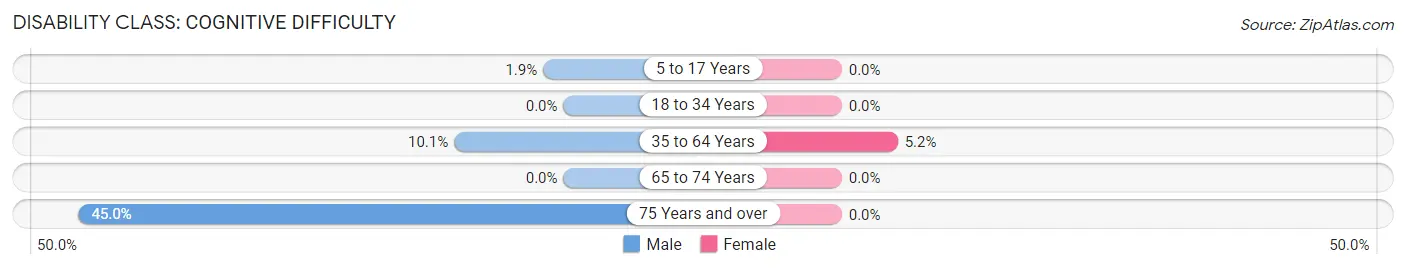
| Age Bracket | Male | Female |
| 5 to 17 Years | 13 (1.9%) | 0 (0.0%) |
| 18 to 34 Years | 0 (0.0%) | 0 (0.0%) |
| 35 to 64 Years | 102 (10.1%) | 43 (5.2%) |
| 65 to 74 Years | 0 (0.0%) | 0 (0.0%) |
| 75 Years and over | 45 (45.0%) | 0 (0.0%) |
Disability Class: Ambulatory Difficulty
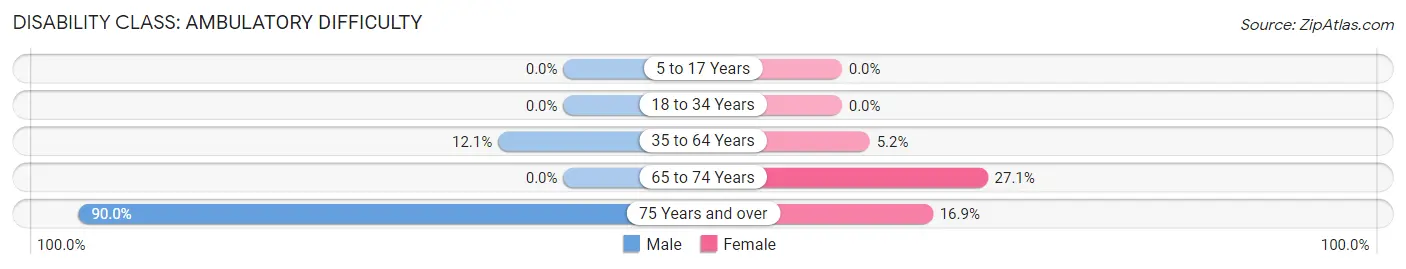
| Age Bracket | Male | Female |
| 5 to 17 Years | 0 (0.0%) | 0 (0.0%) |
| 18 to 34 Years | 0 (0.0%) | 0 (0.0%) |
| 35 to 64 Years | 122 (12.1%) | 43 (5.2%) |
| 65 to 74 Years | 0 (0.0%) | 36 (27.1%) |
| 75 Years and over | 90 (90.0%) | 27 (16.9%) |
Disability Class: Self-Care Difficulty
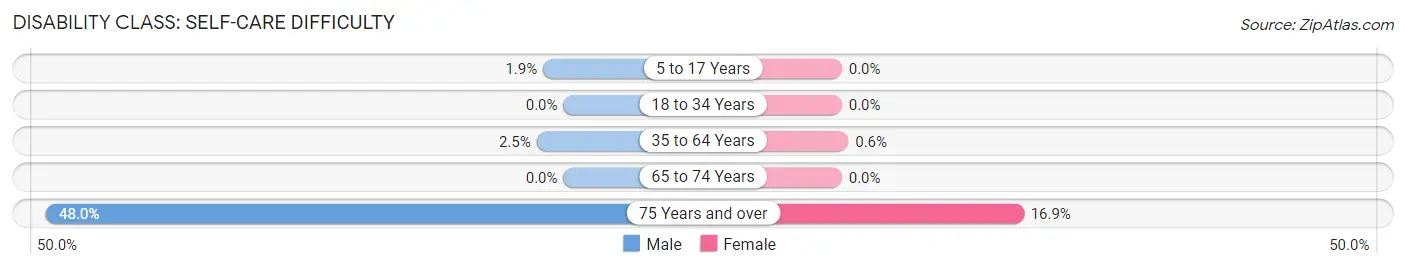
| Age Bracket | Male | Female |
| 5 to 17 Years | 13 (1.9%) | 0 (0.0%) |
| 18 to 34 Years | 0 (0.0%) | 0 (0.0%) |
| 35 to 64 Years | 25 (2.5%) | 5 (0.6%) |
| 65 to 74 Years | 0 (0.0%) | 0 (0.0%) |
| 75 Years and over | 48 (48.0%) | 27 (16.9%) |
Technology Access in Wauchula
Computing Device Access in Wauchula
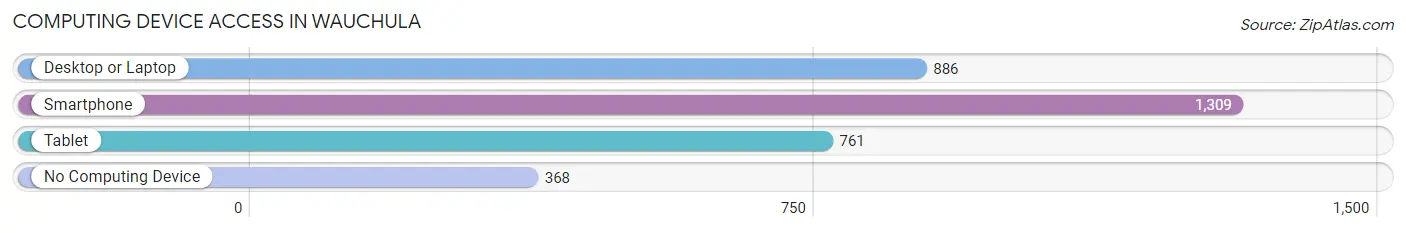
| Device Type | # Households | % Households |
| Desktop or Laptop | 886 | 49.1% |
| Smartphone | 1,309 | 72.6% |
| Tablet | 761 | 42.2% |
| No Computing Device | 368 | 20.4% |
| Total | 1,804 | 100.0% |
Internet Access in Wauchula
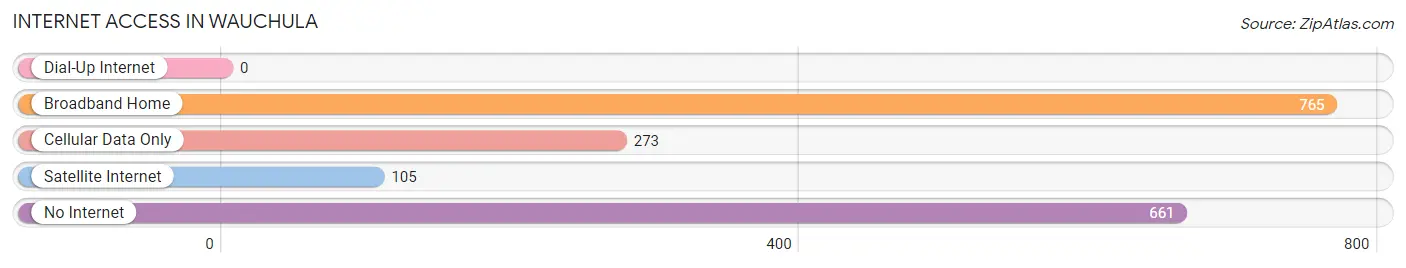
| Internet Type | # Households | % Households |
| Dial-Up Internet | 0 | 0.0% |
| Broadband Home | 765 | 42.4% |
| Cellular Data Only | 273 | 15.1% |
| Satellite Internet | 105 | 5.8% |
| No Internet | 661 | 36.6% |
| Total | 1,804 | 100.0% |
Wauchula Summary
Wauchula is a small city located in Hardee County, Florida. It is situated in the center of the state, approximately 50 miles east of Tampa and 50 miles south of Orlando. The city is known for its rural charm and its close proximity to the Peace River, which is a popular destination for fishing, canoeing, and kayaking. The population of Wauchula was 4,368 in the year 2000, according to the U.S. Census Bureau.
History
The area that is now Wauchula was originally inhabited by the Seminole Indians. The first European settlers arrived in the area in the late 1800s, and the town was officially founded in 1876. The town was named after Chief Wauchula, a Seminole leader who was known for his peaceful nature.
The town grew slowly over the years, and by the early 1900s, it had become a center for citrus production. The town was also home to several sawmills and turpentine stills. In the 1920s, the town was connected to the rest of the state by the Seaboard Air Line Railroad.
Geography
Wauchula is located in the center of Hardee County, approximately 50 miles east of Tampa and 50 miles south of Orlando. The city is situated on the Peace River, which is a popular destination for fishing, canoeing, and kayaking. The city is surrounded by citrus groves and rolling hills.
The climate in Wauchula is subtropical, with hot, humid summers and mild winters. The average temperature in the summer is around 90 degrees Fahrenheit, and the average temperature in the winter is around 60 degrees Fahrenheit.
Economy
The economy of Wauchula is largely based on agriculture. The city is home to several citrus groves, and the surrounding area is known for its production of oranges, grapefruit, and tangerines. The city is also home to several sawmills and turpentine stills.
In addition to agriculture, Wauchula is home to several small businesses, including restaurants, retail stores, and service providers. The city is also home to several manufacturing companies, including a furniture manufacturer and a plastics manufacturer.
Demographics
As of the year 2000, the population of Wauchula was 4,368, according to the U.S. Census Bureau. The population is predominantly white (83.3%), with a small Hispanic population (14.2%). The median household income in Wauchula is $30,945, and the median age is 37.7 years.
Conclusion
Wauchula is a small city located in Hardee County, Florida. It is situated in the center of the state, approximately 50 miles east of Tampa and 50 miles south of Orlando. The city is known for its rural charm and its close proximity to the Peace River, which is a popular destination for fishing, canoeing, and kayaking. The economy of Wauchula is largely based on agriculture, and the city is home to several small businesses. The population of Wauchula was 4,368 in the year 2000, according to the U.S. Census Bureau.
Common Questions
What is Per Capita Income in Wauchula?
Per Capita income in Wauchula is $19,691.
What is the Median Family Income in Wauchula?
Median Family Income in Wauchula is $49,253.
What is the Median Household income in Wauchula?
Median Household Income in Wauchula is $32,854.
What is Income or Wage Gap in Wauchula?
Income or Wage Gap in Wauchula is 28.5%.
Women in Wauchula earn 71.5 cents for every dollar earned by a man.
What is Inequality or Gini Index in Wauchula?
Inequality or Gini Index in Wauchula is 0.49.
What is the Total Population of Wauchula?
Total Population of Wauchula is 4,898.
What is the Total Male Population of Wauchula?
Total Male Population of Wauchula is 2,416.
What is the Total Female Population of Wauchula?
Total Female Population of Wauchula is 2,482.
What is the Ratio of Males per 100 Females in Wauchula?
There are 97.34 Males per 100 Females in Wauchula.
What is the Ratio of Females per 100 Males in Wauchula?
There are 102.73 Females per 100 Males in Wauchula.
What is the Median Population Age in Wauchula?
Median Population Age in Wauchula is 33.5 Years.
What is the Average Family Size in Wauchula
Average Family Size in Wauchula is 3.0 People.
What is the Average Household Size in Wauchula
Average Household Size in Wauchula is 2.5 People.
How Large is the Labor Force in Wauchula?
There are 1,632 People in the Labor Forcein in Wauchula.
What is the Percentage of People in the Labor Force in Wauchula?
47.7% of People are in the Labor Force in Wauchula.
What is the Unemployment Rate in Wauchula?
Unemployment Rate in Wauchula is 2.5%.