Watertown, FL Map & Demographics
Watertown Map
Watertown Overview
$24,034
PER CAPITA INCOME
$45,313
AVG FAMILY INCOME
$41,303
AVG HOUSEHOLD INCOME
5.1%
WAGE / INCOME GAP [ % ]
94.9¢/ $1
WAGE / INCOME GAP [ $ ]
0.39
INEQUALITY / GINI INDEX
2,657
TOTAL POPULATION
1,119
MALE POPULATION
1,538
FEMALE POPULATION
72.76
MALES / 100 FEMALES
137.44
FEMALES / 100 MALES
49.6
MEDIAN AGE
2.9
AVG FAMILY SIZE
1.9
AVG HOUSEHOLD SIZE
1,068
LABOR FORCE [ PEOPLE ]
46.0%
PERCENT IN LABOR FORCE
19.6%
UNEMPLOYMENT RATE
Income in Watertown
Income Overview in Watertown
Per Capita Income in Watertown is $24,034, while median incomes of families and households are $45,313 and $41,303 respectively.
| Characteristic | Number | Measure |
| Per Capita Income | 2,657 | $24,034 |
| Median Family Income | 538 | $45,313 |
| Mean Family Income | 538 | $55,295 |
| Median Household Income | 1,405 | $41,303 |
| Mean Household Income | 1,405 | $45,410 |
| Income Deficit | 538 | $0 |
| Wage / Income Gap (%) | 2,657 | 5.08% |
| Wage / Income Gap ($) | 2,657 | 94.92¢ per $1 |
| Gini / Inequality Index | 2,657 | 0.39 |
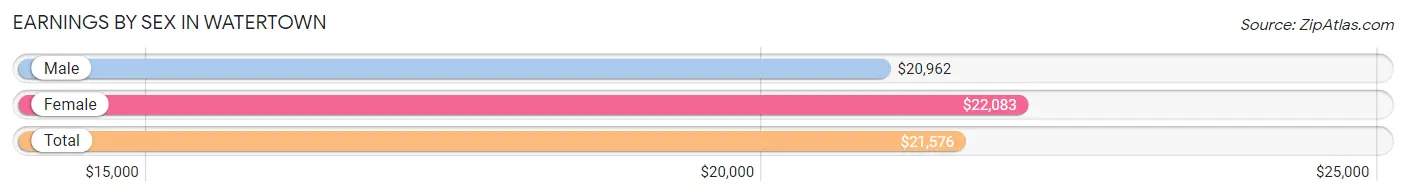
Earnings by Sex in Watertown
Average Earnings in Watertown are $21,576, $20,962 for men and $22,083 for women, a difference of 5.1%.
| Sex | Number | Average Earnings |
| Male | 532 (48.3%) | $20,962 |
| Female | 569 (51.7%) | $22,083 |
| Total | 1,101 (100.0%) | $21,576 |
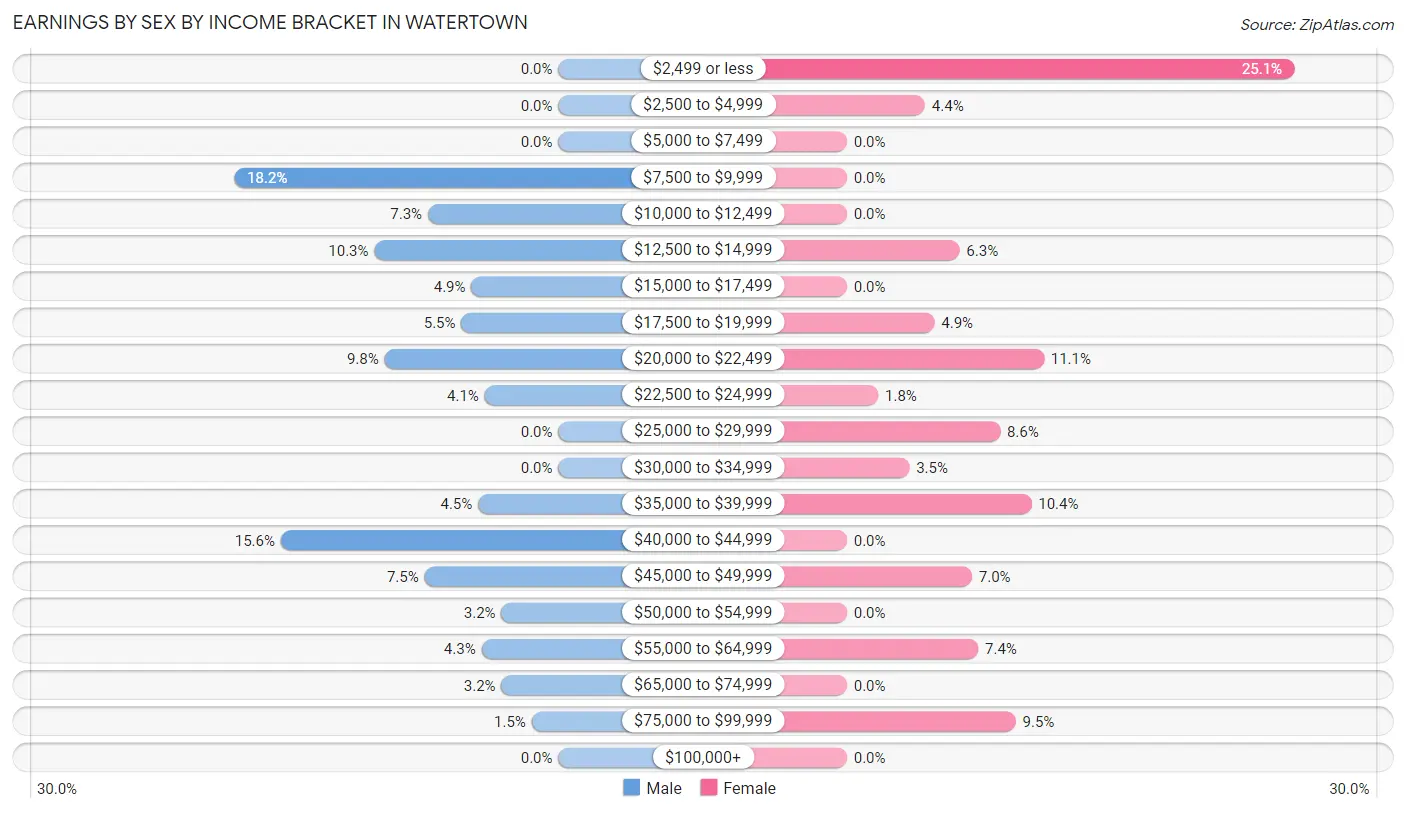
Earnings by Sex by Income Bracket in Watertown
The most common earnings brackets in Watertown are $7,500 to $9,999 for men (97 | 18.2%) and $2,499 or less for women (143 | 25.1%).
| Income | Male | Female |
| $2,499 or less | 0 (0.0%) | 143 (25.1%) |
| $2,500 to $4,999 | 0 (0.0%) | 25 (4.4%) |
| $5,000 to $7,499 | 0 (0.0%) | 0 (0.0%) |
| $7,500 to $9,999 | 97 (18.2%) | 0 (0.0%) |
| $10,000 to $12,499 | 39 (7.3%) | 0 (0.0%) |
| $12,500 to $14,999 | 55 (10.3%) | 36 (6.3%) |
| $15,000 to $17,499 | 26 (4.9%) | 0 (0.0%) |
| $17,500 to $19,999 | 29 (5.4%) | 28 (4.9%) |
| $20,000 to $22,499 | 52 (9.8%) | 63 (11.1%) |
| $22,500 to $24,999 | 22 (4.1%) | 10 (1.8%) |
| $25,000 to $29,999 | 0 (0.0%) | 49 (8.6%) |
| $30,000 to $34,999 | 0 (0.0%) | 20 (3.5%) |
| $35,000 to $39,999 | 24 (4.5%) | 59 (10.4%) |
| $40,000 to $44,999 | 83 (15.6%) | 0 (0.0%) |
| $45,000 to $49,999 | 40 (7.5%) | 40 (7.0%) |
| $50,000 to $54,999 | 17 (3.2%) | 0 (0.0%) |
| $55,000 to $64,999 | 23 (4.3%) | 42 (7.4%) |
| $65,000 to $74,999 | 17 (3.2%) | 0 (0.0%) |
| $75,000 to $99,999 | 8 (1.5%) | 54 (9.5%) |
| $100,000+ | 0 (0.0%) | 0 (0.0%) |
| Total | 532 (100.0%) | 569 (100.0%) |
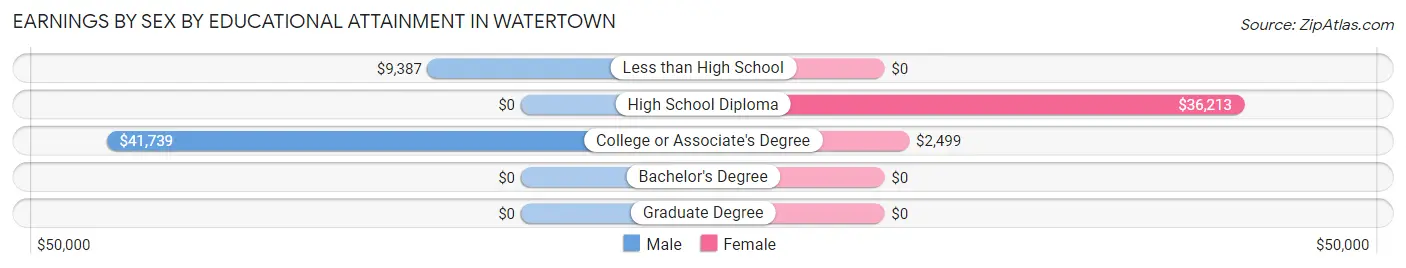
Earnings by Sex by Educational Attainment in Watertown
Average earnings in Watertown are $35,573 for men and $32,813 for women, a difference of 7.8%. Men with an educational attainment of college or associate's degree enjoy the highest average annual earnings of $41,739, while those with less than high school education earn the least with $9,387. Women with an educational attainment of high school diploma earn the most with the average annual earnings of $36,213, while those with college or associate's degree education have the smallest earnings of $2,499.
| Educational Attainment | Male Income | Female Income |
| Less than High School | $9,387 | $0 |
| High School Diploma | - | - |
| College or Associate's Degree | $41,739 | $2,499 |
| Bachelor's Degree | - | - |
| Graduate Degree | - | - |
| Total | $35,573 | $32,813 |
Family Income in Watertown
Family Income Brackets in Watertown
According to the Watertown family income data, there are 165 families falling into the $25,000 to $34,999 income range, which is the most common income bracket and makes up 30.7% of all families.
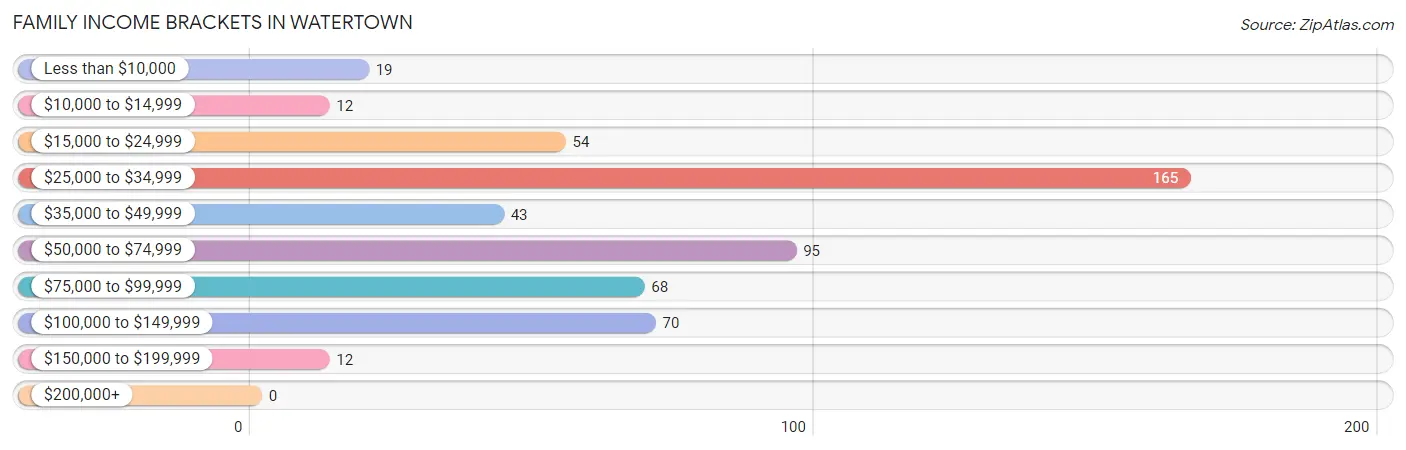
| Income Bracket | # Families | % Families |
| Less than $10,000 | 19 | 3.5% |
| $10,000 to $14,999 | 12 | 2.2% |
| $15,000 to $24,999 | 54 | 10.0% |
| $25,000 to $34,999 | 165 | 30.7% |
| $35,000 to $49,999 | 43 | 8.0% |
| $50,000 to $74,999 | 95 | 17.7% |
| $75,000 to $99,999 | 68 | 12.6% |
| $100,000 to $149,999 | 70 | 13.0% |
| $150,000 to $199,999 | 12 | 2.2% |
| $200,000+ | 0 | 0.0% |
Family Income by Famaliy Size in Watertown
2-person families (341 | 63.4%) account for the highest median family income in Watertown with $52,153 per family, while 2-person families (341 | 63.4%) have the highest median income of $26,076 per family member.
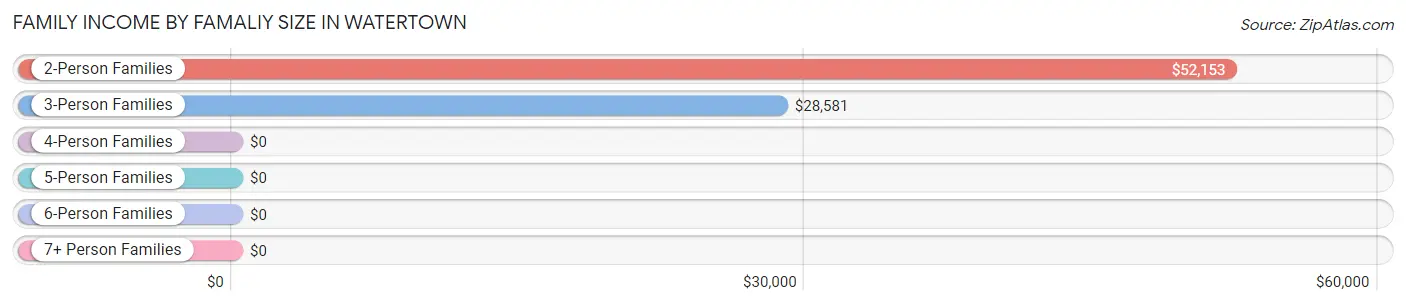
| Income Bracket | # Families | Median Income |
| 2-Person Families | 341 (63.4%) | $52,153 |
| 3-Person Families | 133 (24.7%) | $28,581 |
| 4-Person Families | 31 (5.8%) | $0 |
| 5-Person Families | 16 (3.0%) | $0 |
| 6-Person Families | 17 (3.2%) | $0 |
| 7+ Person Families | 0 (0.0%) | $0 |
| Total | 538 (100.0%) | $45,313 |
Family Income by Number of Earners in Watertown
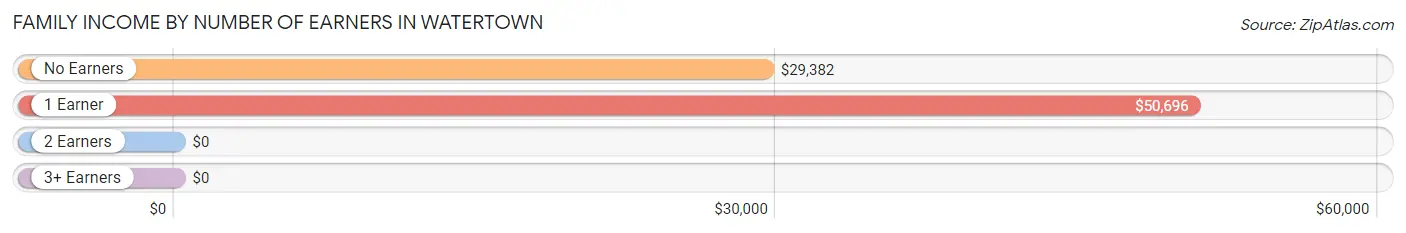
| Number of Earners | # Families | Median Income |
| No Earners | 174 (32.3%) | $29,382 |
| 1 Earner | 233 (43.3%) | $50,696 |
| 2 Earners | 119 (22.1%) | $0 |
| 3+ Earners | 12 (2.2%) | $0 |
| Total | 538 (100.0%) | $45,313 |
Household Income in Watertown
Household Income Brackets in Watertown
With 296 households falling in the category, the $35,000 to $49,999 income range is the most frequent in Watertown, accounting for 21.1% of all households.
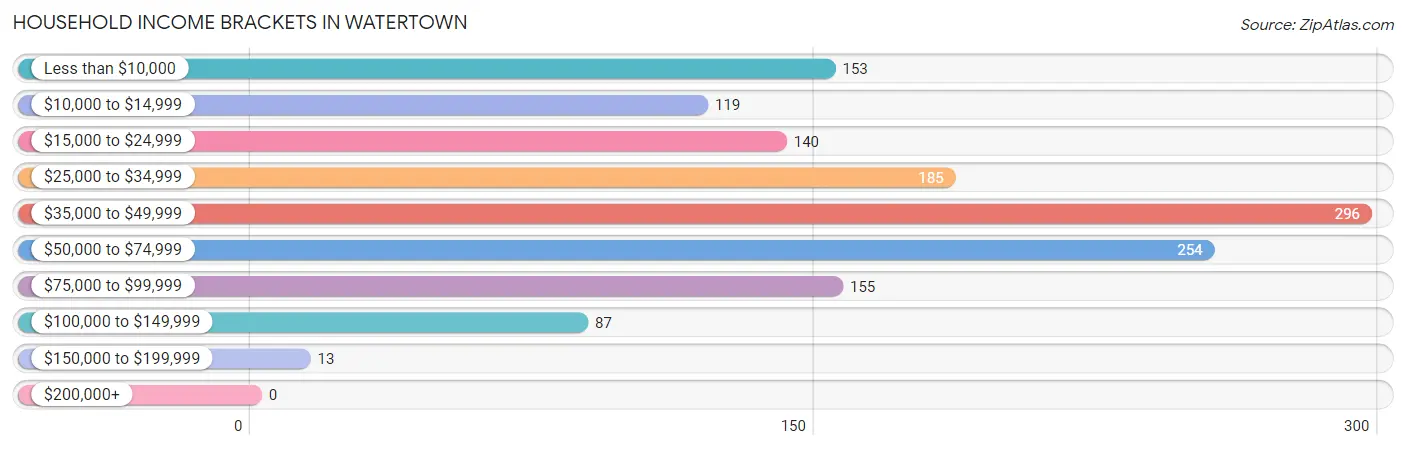
| Income Bracket | # Households | % Households |
| Less than $10,000 | 153 | 10.9% |
| $10,000 to $14,999 | 119 | 8.5% |
| $15,000 to $24,999 | 140 | 10.0% |
| $25,000 to $34,999 | 185 | 13.2% |
| $35,000 to $49,999 | 296 | 21.1% |
| $50,000 to $74,999 | 254 | 18.1% |
| $75,000 to $99,999 | 155 | 11.0% |
| $100,000 to $149,999 | 87 | 6.2% |
| $150,000 to $199,999 | 13 | 0.9% |
| $200,000+ | 0 | 0.0% |
Household Income by Householder Age in Watertown
The median household income in Watertown is $41,303, with the highest median household income of $50,911 found in the 65+ years age bracket for the primary householder. A total of 513 households (36.5%) fall into this category. Meanwhile, the 15 to 24 years age bracket for the primary householder has the lowest median household income of $32,019, with 98 households (7.0%) in this group.
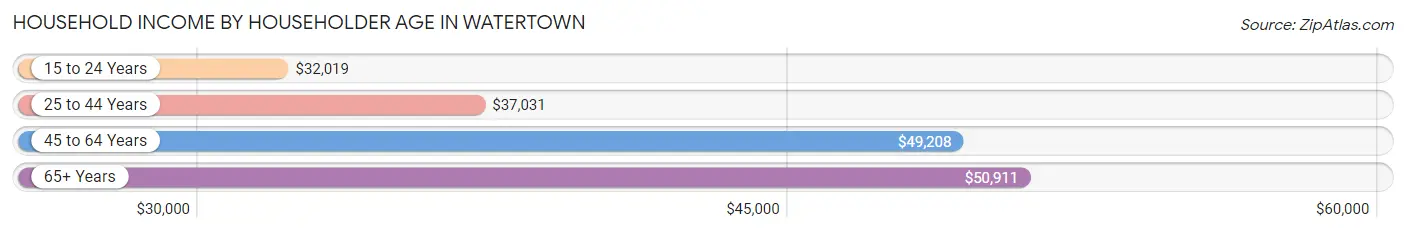
| Income Bracket | # Households | Median Income |
| 15 to 24 Years | 98 (7.0%) | $32,019 |
| 25 to 44 Years | 353 (25.1%) | $37,031 |
| 45 to 64 Years | 441 (31.4%) | $49,208 |
| 65+ Years | 513 (36.5%) | $50,911 |
| Total | 1,405 (100.0%) | $41,303 |
Poverty in Watertown
Income Below Poverty by Sex and Age in Watertown
With 30.1% poverty level for males and 27.0% for females among the residents of Watertown, under 5 year old males and under 5 year old females are the most vulnerable to poverty, with 43 males (100.0%) and 50 females (100.0%) in their respective age groups living below the poverty level.
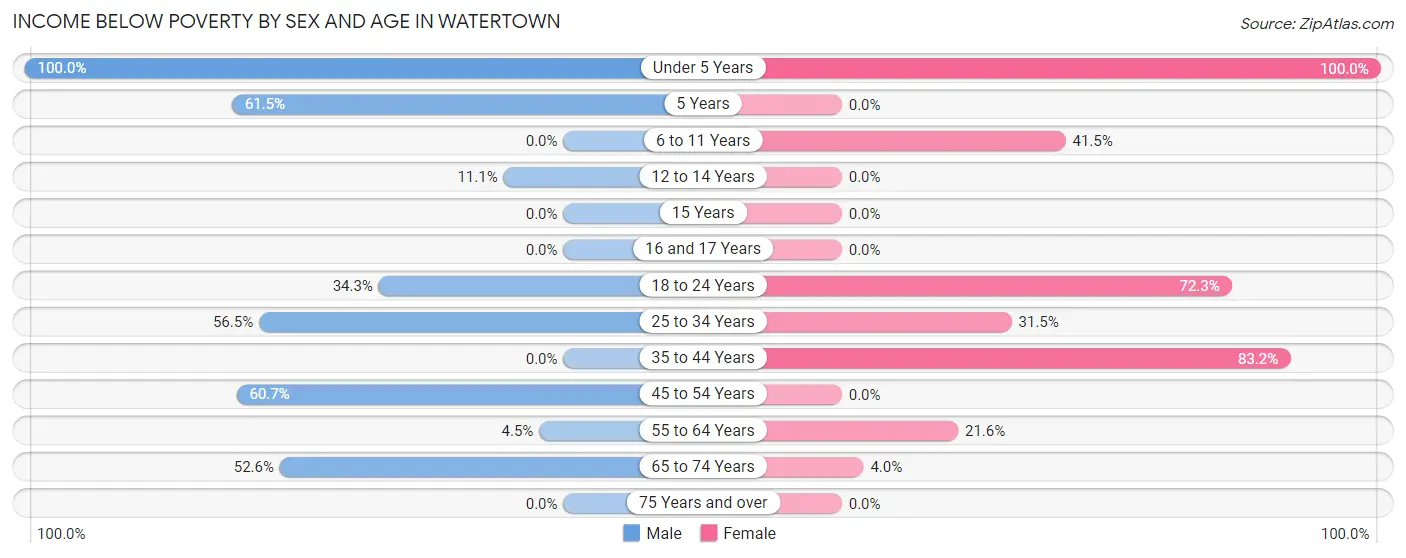
| Age Bracket | Male | Female |
| Under 5 Years | 43 (100.0%) | 50 (100.0%) |
| 5 Years | 16 (61.5%) | 0 (0.0%) |
| 6 to 11 Years | 0 (0.0%) | 76 (41.5%) |
| 12 to 14 Years | 2 (11.1%) | 0 (0.0%) |
| 15 Years | 0 (0.0%) | 0 (0.0%) |
| 16 and 17 Years | 0 (0.0%) | 0 (0.0%) |
| 18 to 24 Years | 49 (34.3%) | 68 (72.3%) |
| 25 to 34 Years | 74 (56.5%) | 52 (31.5%) |
| 35 to 44 Years | 0 (0.0%) | 104 (83.2%) |
| 45 to 54 Years | 108 (60.7%) | 0 (0.0%) |
| 55 to 64 Years | 15 (4.5%) | 52 (21.6%) |
| 65 to 74 Years | 30 (52.6%) | 11 (4.0%) |
| 75 Years and over | 0 (0.0%) | 0 (0.0%) |
| Total | 337 (30.1%) | 413 (27.0%) |
Income Above Poverty by Sex and Age in Watertown
According to the poverty statistics in Watertown, males aged 35 to 44 years and females aged 5 years are the age groups that are most secure financially, with 100.0% of males and 100.0% of females in these age groups living above the poverty line.
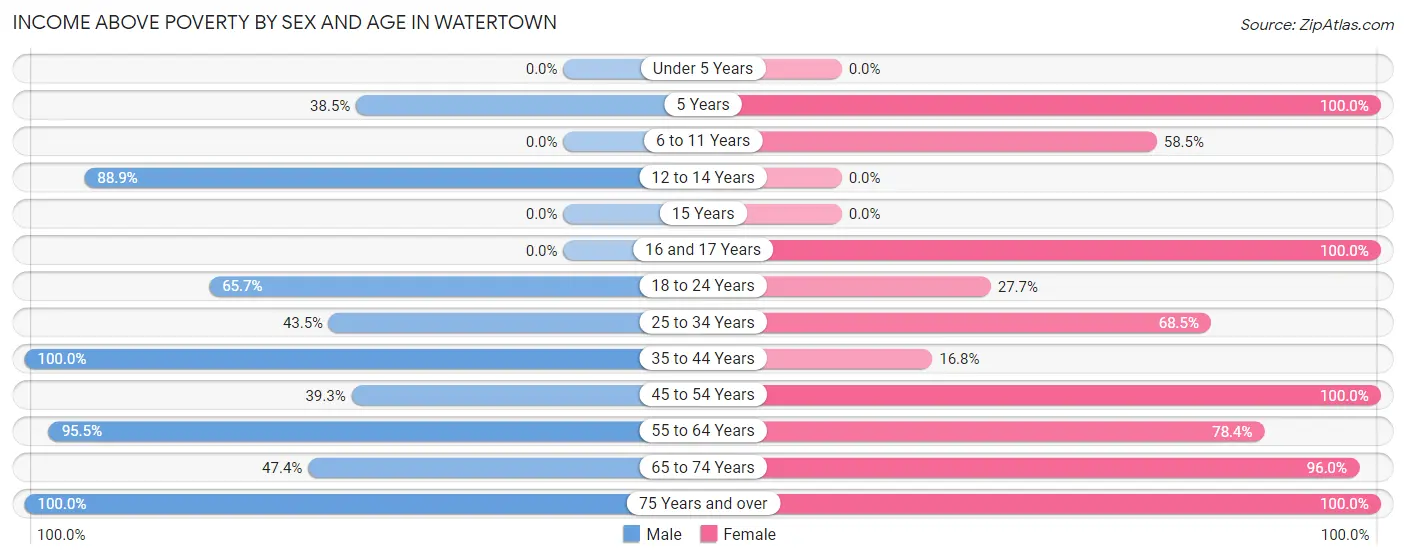
| Age Bracket | Male | Female |
| Under 5 Years | 0 (0.0%) | 0 (0.0%) |
| 5 Years | 10 (38.5%) | 15 (100.0%) |
| 6 to 11 Years | 0 (0.0%) | 107 (58.5%) |
| 12 to 14 Years | 16 (88.9%) | 0 (0.0%) |
| 15 Years | 0 (0.0%) | 0 (0.0%) |
| 16 and 17 Years | 0 (0.0%) | 50 (100.0%) |
| 18 to 24 Years | 94 (65.7%) | 26 (27.7%) |
| 25 to 34 Years | 57 (43.5%) | 113 (68.5%) |
| 35 to 44 Years | 91 (100.0%) | 21 (16.8%) |
| 45 to 54 Years | 70 (39.3%) | 135 (100.0%) |
| 55 to 64 Years | 319 (95.5%) | 189 (78.4%) |
| 65 to 74 Years | 27 (47.4%) | 262 (96.0%) |
| 75 Years and over | 98 (100.0%) | 199 (100.0%) |
| Total | 782 (69.9%) | 1,117 (73.0%) |
Income Below Poverty Among Married-Couple Families in Watertown
The poverty statistics for married-couple families in Watertown show that 6.6% or 19 of the total 289 families live below the poverty line. Families with 1 or 2 children have the highest poverty rate of 17.6%, comprising of 19 families. On the other hand, families with no children have the lowest poverty rate of 0.0%, which includes 0 families.
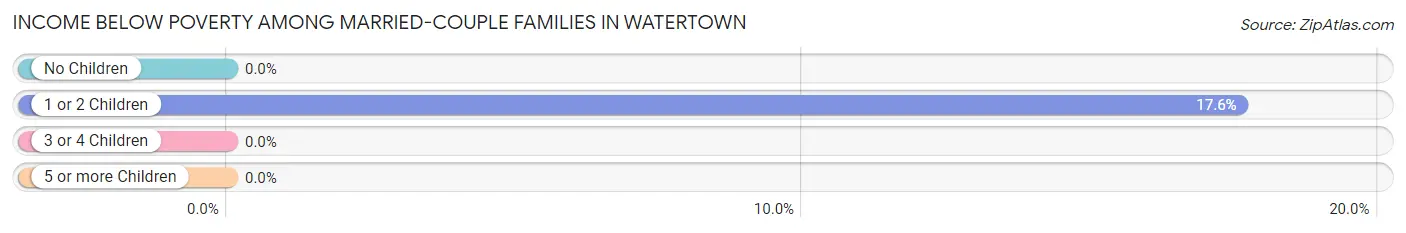
| Children | Above Poverty | Below Poverty |
| No Children | 181 (100.0%) | 0 (0.0%) |
| 1 or 2 Children | 89 (82.4%) | 19 (17.6%) |
| 3 or 4 Children | 0 (0.0%) | 0 (0.0%) |
| 5 or more Children | 0 (0.0%) | 0 (0.0%) |
| Total | 270 (93.4%) | 19 (6.6%) |
Income Below Poverty Among Single-Parent Households in Watertown
According to the poverty data in Watertown, 50.0% or 12 single-father households and 20.0% or 45 single-mother households are living below the poverty line. Among single-father households, those with 1 or 2 children have the highest poverty rate, with 12 households (54.5%) experiencing poverty. Likewise, among single-mother households, those with 3 or 4 children have the highest poverty rate, with 17 households (100.0%) falling below the poverty line.
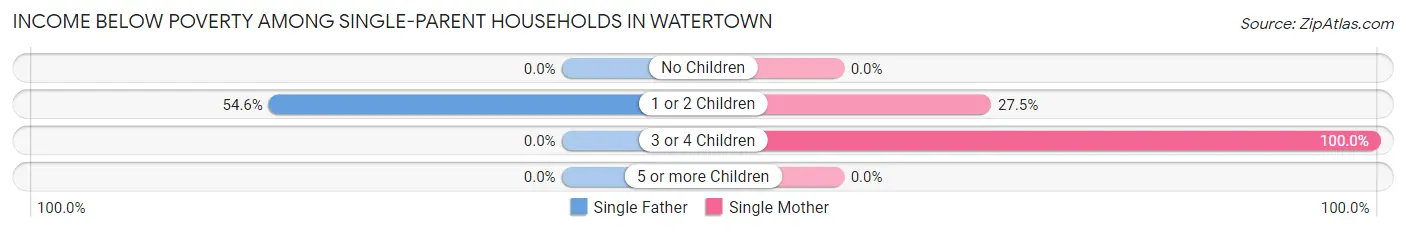
| Children | Single Father | Single Mother |
| No Children | 0 (0.0%) | 0 (0.0%) |
| 1 or 2 Children | 12 (54.5%) | 28 (27.5%) |
| 3 or 4 Children | 0 (0.0%) | 17 (100.0%) |
| 5 or more Children | 0 (0.0%) | 0 (0.0%) |
| Total | 12 (50.0%) | 45 (20.0%) |
Income Below Poverty Among Married-Couple vs Single-Parent Households in Watertown
The poverty data for Watertown shows that 19 of the married-couple family households (6.6%) and 57 of the single-parent households (22.9%) are living below the poverty level. Within the married-couple family households, those with 1 or 2 children have the highest poverty rate, with 19 households (17.6%) falling below the poverty line. Among the single-parent households, those with 3 or 4 children have the highest poverty rate, with 17 household (100.0%) living below poverty.
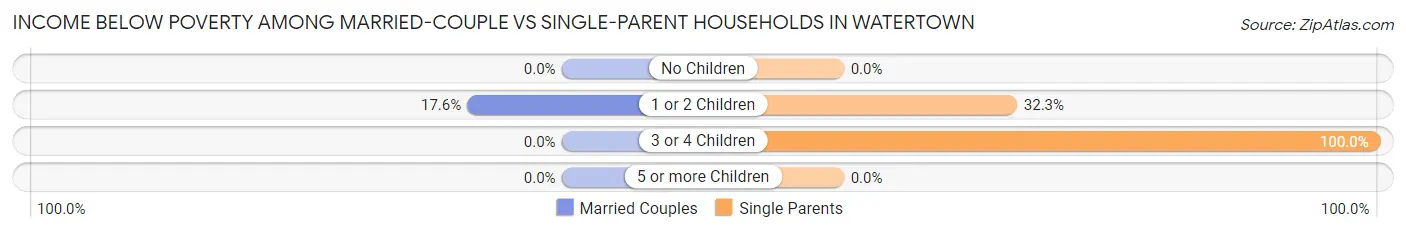
| Children | Married-Couple Families | Single-Parent Households |
| No Children | 0 (0.0%) | 0 (0.0%) |
| 1 or 2 Children | 19 (17.6%) | 40 (32.3%) |
| 3 or 4 Children | 0 (0.0%) | 17 (100.0%) |
| 5 or more Children | 0 (0.0%) | 0 (0.0%) |
| Total | 19 (6.6%) | 57 (22.9%) |
Race in Watertown
The most populous races in Watertown are White / Caucasian (1,568 | 59.0%), Black / African American (810 | 30.5%), and Hispanic or Latino (179 | 6.7%).
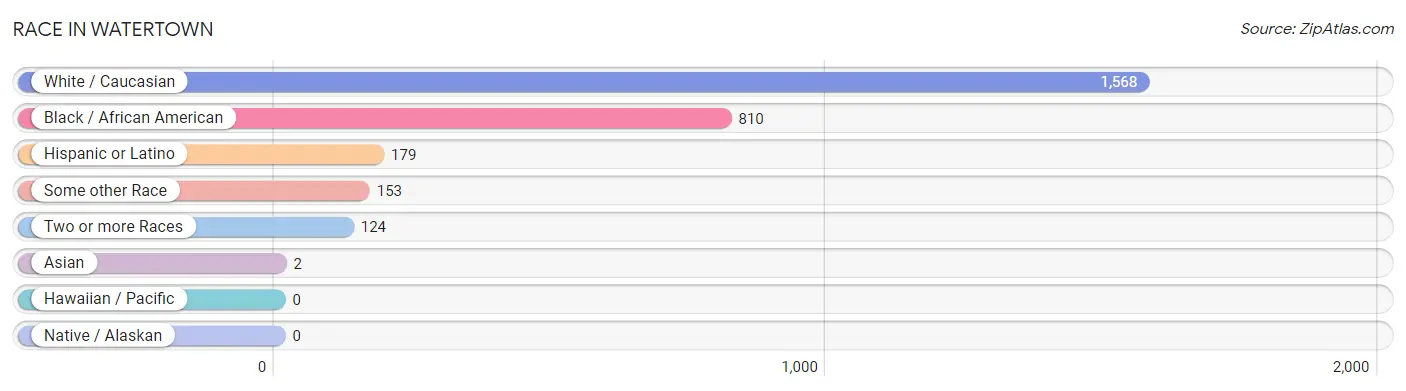
| Race | # Population | % Population |
| Asian | 2 | 0.1% |
| Black / African American | 810 | 30.5% |
| Hawaiian / Pacific | 0 | 0.0% |
| Hispanic or Latino | 179 | 6.7% |
| Native / Alaskan | 0 | 0.0% |
| White / Caucasian | 1,568 | 59.0% |
| Two or more Races | 124 | 4.7% |
| Some other Race | 153 | 5.8% |
| Total | 2,657 | 100.0% |
Ancestry in Watertown
The most populous ancestries reported in Watertown are American (393 | 14.8%), English (248 | 9.3%), German (232 | 8.7%), Irish (211 | 7.9%), and African (140 | 5.3%), together accounting for 46.1% of all Watertown residents.
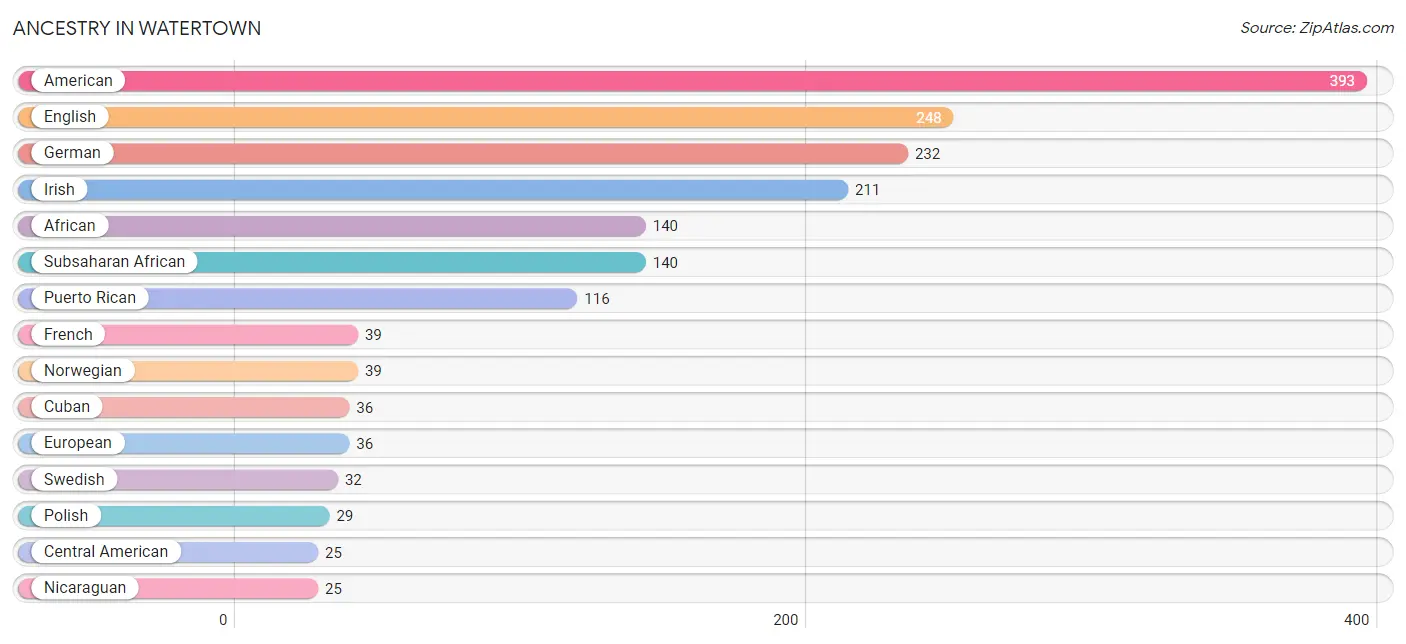
| Ancestry | # Population | % Population |
| African | 140 | 5.3% |
| American | 393 | 14.8% |
| Central American | 25 | 0.9% |
| Cherokee | 6 | 0.2% |
| Cuban | 36 | 1.3% |
| English | 248 | 9.3% |
| European | 36 | 1.3% |
| French | 39 | 1.5% |
| German | 232 | 8.7% |
| Hungarian | 11 | 0.4% |
| Irish | 211 | 7.9% |
| Italian | 6 | 0.2% |
| Jamaican | 2 | 0.1% |
| Korean | 2 | 0.1% |
| Nicaraguan | 25 | 0.9% |
| Norwegian | 39 | 1.5% |
| Polish | 29 | 1.1% |
| Puerto Rican | 116 | 4.4% |
| Subsaharan African | 140 | 5.3% |
| Swedish | 32 | 1.2% |
| Swiss | 10 | 0.4% | View All 21 Rows |
Immigrants in Watertown
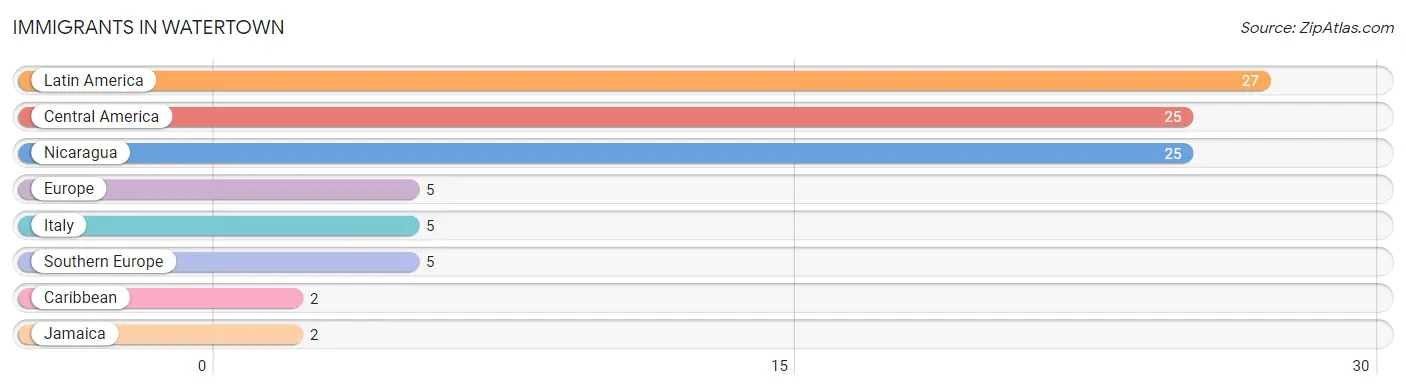
The most numerous immigrant groups reported in Watertown came from Latin America (27 | 1.0%), Central America (25 | 0.9%), Nicaragua (25 | 0.9%), Europe (5 | 0.2%), and Italy (5 | 0.2%), together accounting for 3.3% of all Watertown residents.
| Immigration Origin | # Population | % Population |
| Caribbean | 2 | 0.1% |
| Central America | 25 | 0.9% |
| Europe | 5 | 0.2% |
| Italy | 5 | 0.2% |
| Jamaica | 2 | 0.1% |
| Latin America | 27 | 1.0% |
| Nicaragua | 25 | 0.9% |
| Southern Europe | 5 | 0.2% | View All 8 Rows |
Sex and Age in Watertown
Sex and Age in Watertown
The most populous age groups in Watertown are 60 to 64 Years (265 | 23.7%) for men and 5 to 9 Years (198 | 12.9%) for women.
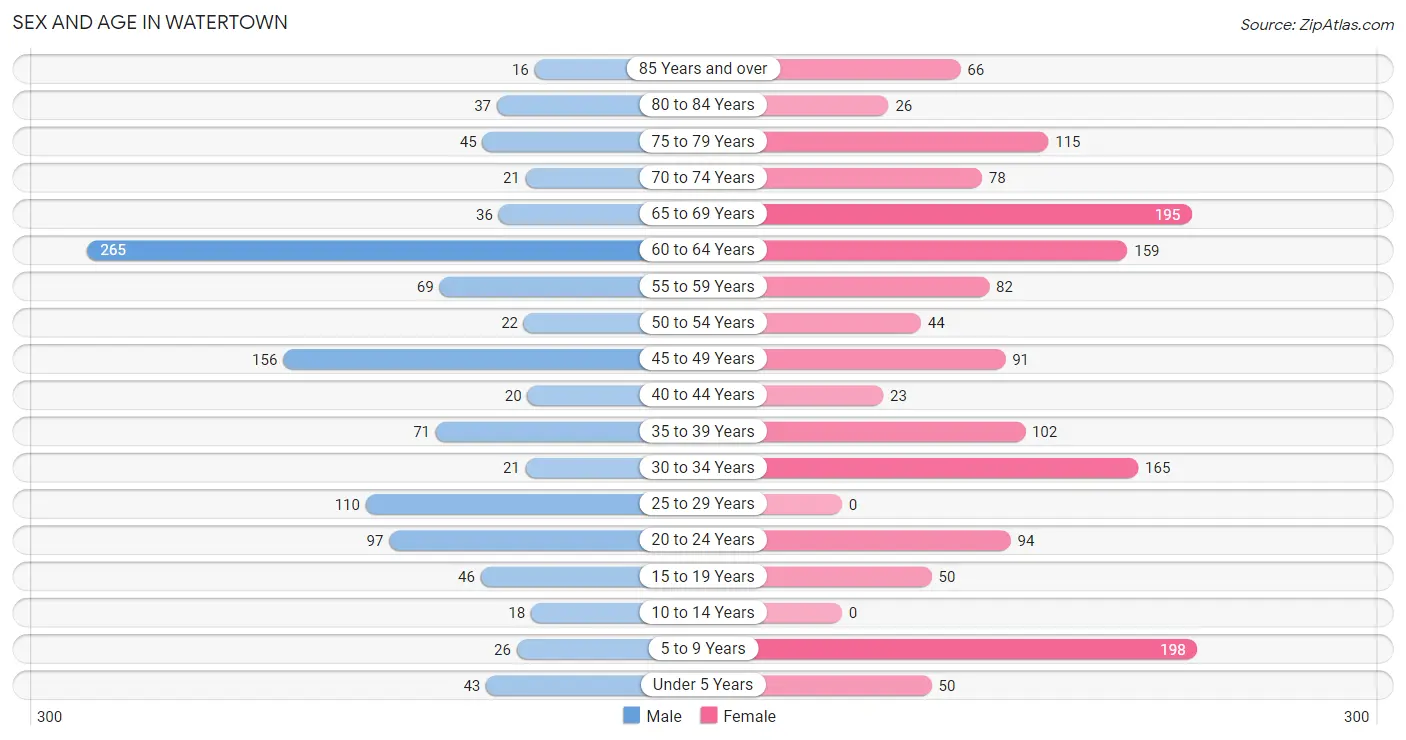
| Age Bracket | Male | Female |
| Under 5 Years | 43 (3.8%) | 50 (3.3%) |
| 5 to 9 Years | 26 (2.3%) | 198 (12.9%) |
| 10 to 14 Years | 18 (1.6%) | 0 (0.0%) |
| 15 to 19 Years | 46 (4.1%) | 50 (3.3%) |
| 20 to 24 Years | 97 (8.7%) | 94 (6.1%) |
| 25 to 29 Years | 110 (9.8%) | 0 (0.0%) |
| 30 to 34 Years | 21 (1.9%) | 165 (10.7%) |
| 35 to 39 Years | 71 (6.3%) | 102 (6.6%) |
| 40 to 44 Years | 20 (1.8%) | 23 (1.5%) |
| 45 to 49 Years | 156 (13.9%) | 91 (5.9%) |
| 50 to 54 Years | 22 (2.0%) | 44 (2.9%) |
| 55 to 59 Years | 69 (6.2%) | 82 (5.3%) |
| 60 to 64 Years | 265 (23.7%) | 159 (10.3%) |
| 65 to 69 Years | 36 (3.2%) | 195 (12.7%) |
| 70 to 74 Years | 21 (1.9%) | 78 (5.1%) |
| 75 to 79 Years | 45 (4.0%) | 115 (7.5%) |
| 80 to 84 Years | 37 (3.3%) | 26 (1.7%) |
| 85 Years and over | 16 (1.4%) | 66 (4.3%) |
| Total | 1,119 (100.0%) | 1,538 (100.0%) |
Families and Households in Watertown
Median Family Size in Watertown
The median family size in Watertown is 2.85 persons per family, with single female/mother families (225 | 41.8%) accounting for the largest median family size of 3.04 persons per family. On the other hand, single male/father families (24 | 4.5%) represent the smallest median family size with 1.58 persons per family.
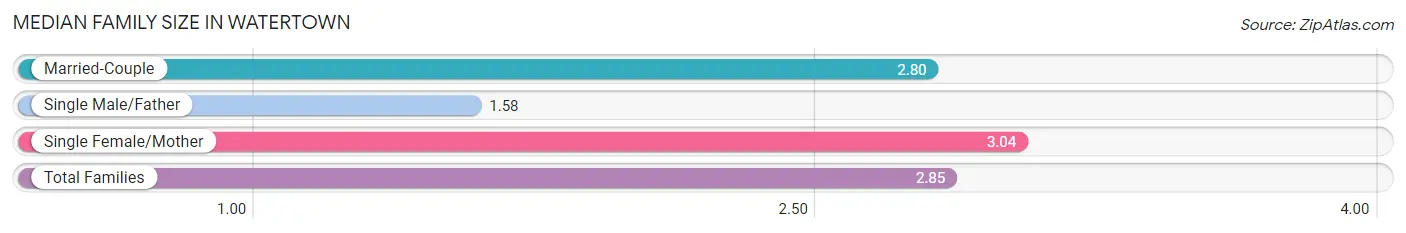
| Family Type | # Families | Family Size |
| Married-Couple | 289 (53.7%) | 2.80 |
| Single Male/Father | 24 (4.5%) | 1.58 |
| Single Female/Mother | 225 (41.8%) | 3.04 |
| Total Families | 538 (100.0%) | 2.85 |
Median Household Size in Watertown
The median household size in Watertown is 1.88 persons per household, with single female/mother households (225 | 16.0%) accounting for the largest median household size of 3.25 persons per household. non-family households (867 | 61.7%) represent the smallest median household size with 1.22 persons per household.
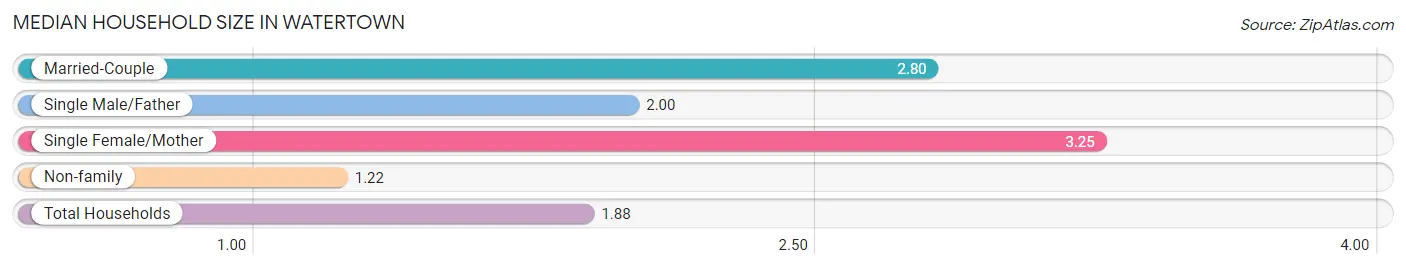
| Household Type | # Households | Household Size |
| Married-Couple | 289 (20.6%) | 2.80 |
| Single Male/Father | 24 (1.7%) | 2.00 |
| Single Female/Mother | 225 (16.0%) | 3.25 |
| Non-family | 867 (61.7%) | 1.22 |
| Total Households | 1,405 (100.0%) | 1.88 |
Household Size by Marriage Status in Watertown
Out of a total of 1,405 households in Watertown, 538 (38.3%) are family households, while 867 (61.7%) are nonfamily households. The most numerous type of family households are 2-person households, comprising 310, and the most common type of nonfamily households are 1-person households, comprising 673.
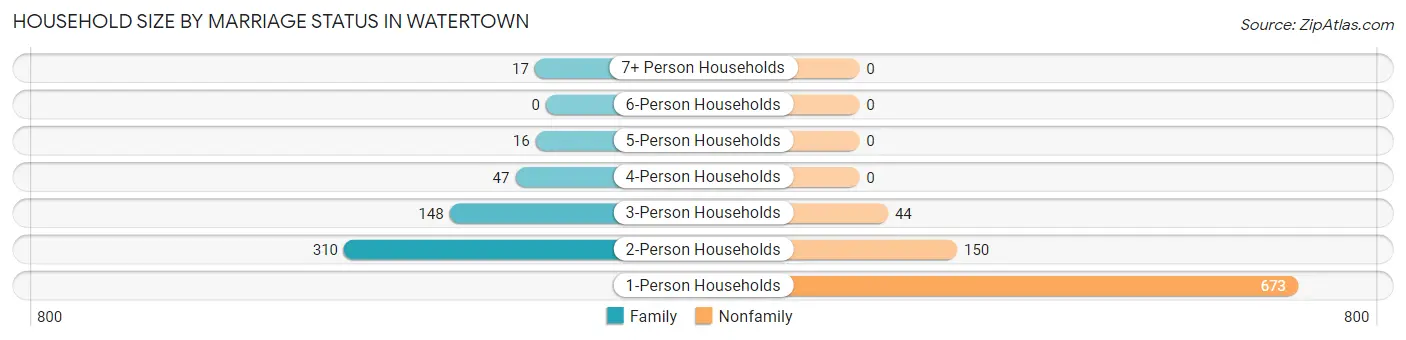
| Household Size | Family Households | Nonfamily Households |
| 1-Person Households | - | 673 (47.9%) |
| 2-Person Households | 310 (22.1%) | 150 (10.7%) |
| 3-Person Households | 148 (10.5%) | 44 (3.1%) |
| 4-Person Households | 47 (3.4%) | 0 (0.0%) |
| 5-Person Households | 16 (1.1%) | 0 (0.0%) |
| 6-Person Households | 0 (0.0%) | 0 (0.0%) |
| 7+ Person Households | 17 (1.2%) | 0 (0.0%) |
| Total | 538 (38.3%) | 867 (61.7%) |
Female Fertility in Watertown
Fertility by Age in Watertown
Average fertility rate in Watertown is 31.0 births per 1,000 women. Women in the age bracket of 20 to 34 years have the highest fertility rate with 66.0 births per 1,000 women. Women in the age bracket of 20 to 34 years acount for 100.0% of all women with births.
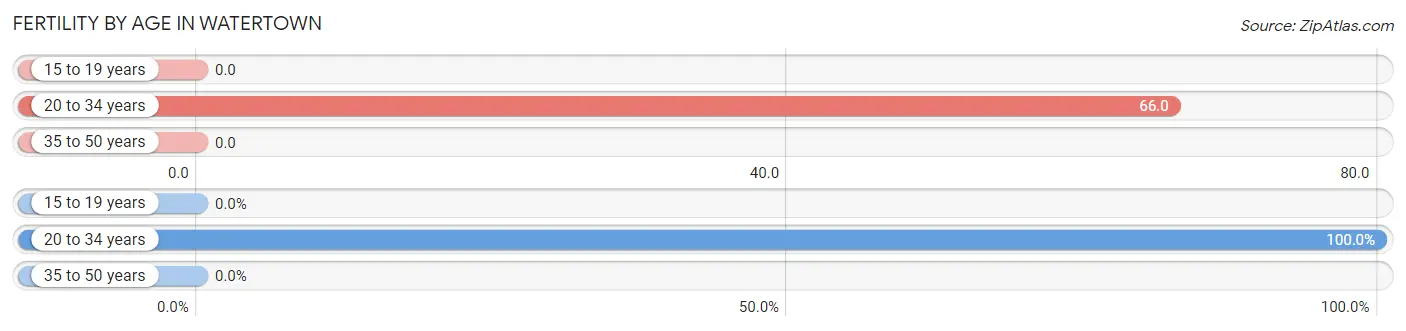
| Age Bracket | Women with Births | Births / 1,000 Women |
| 15 to 19 years | 0 (0.0%) | 0.0 |
| 20 to 34 years | 17 (100.0%) | 66.0 |
| 35 to 50 years | 0 (0.0%) | 0.0 |
| Total | 17 (100.0%) | 31.0 |
Fertility by Age by Marriage Status in Watertown
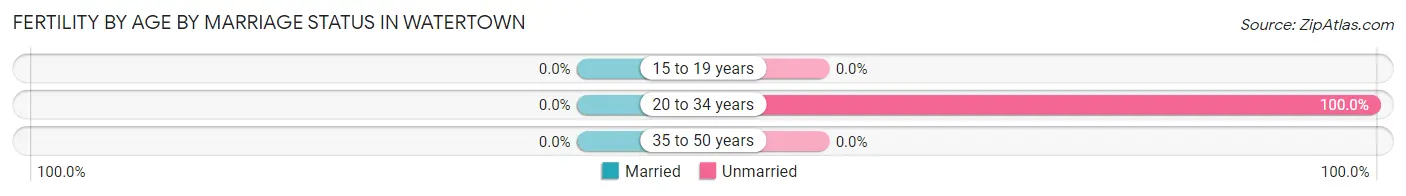
| Age Bracket | Married | Unmarried |
| 15 to 19 years | 0 (0.0%) | 0 (0.0%) |
| 20 to 34 years | 0 (0.0%) | 17 (100.0%) |
| 35 to 50 years | 0 (0.0%) | 0 (0.0%) |
| Total | 0 (0.0%) | 17 (100.0%) |
Fertility by Education in Watertown
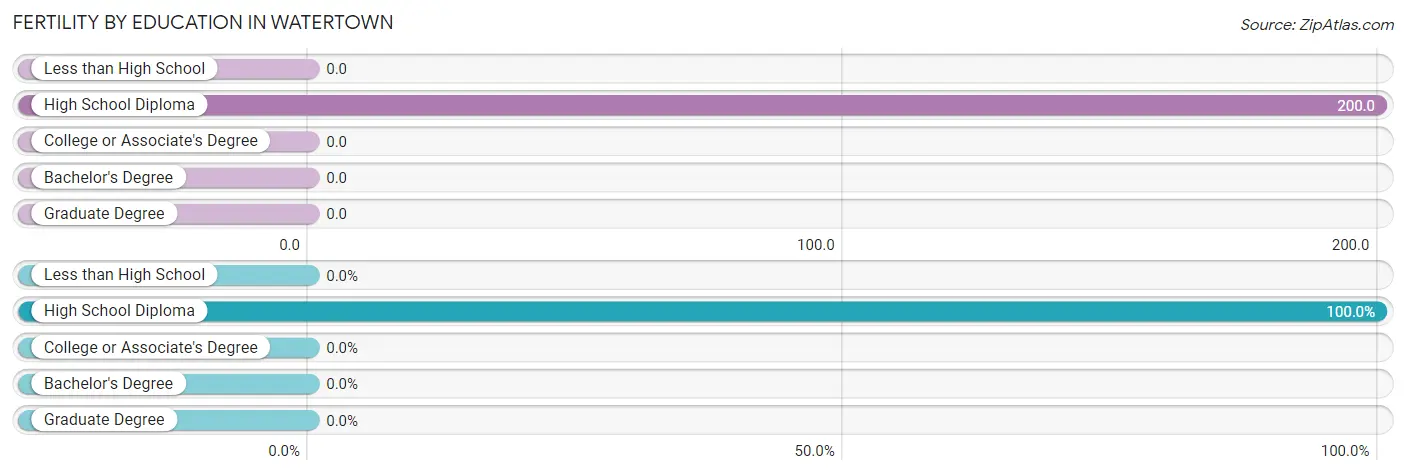
| Educational Attainment | Women with Births | Births / 1,000 Women |
| Less than High School | 0 (0.0%) | 0.0 |
| High School Diploma | 17 (100.0%) | 200.0 |
| College or Associate's Degree | 0 (0.0%) | 0.0 |
| Bachelor's Degree | 0 (0.0%) | 0.0 |
| Graduate Degree | 0 (0.0%) | 0.0 |
| Total | 17 (100.0%) | 31.0 |
Fertility by Education by Marriage Status in Watertown
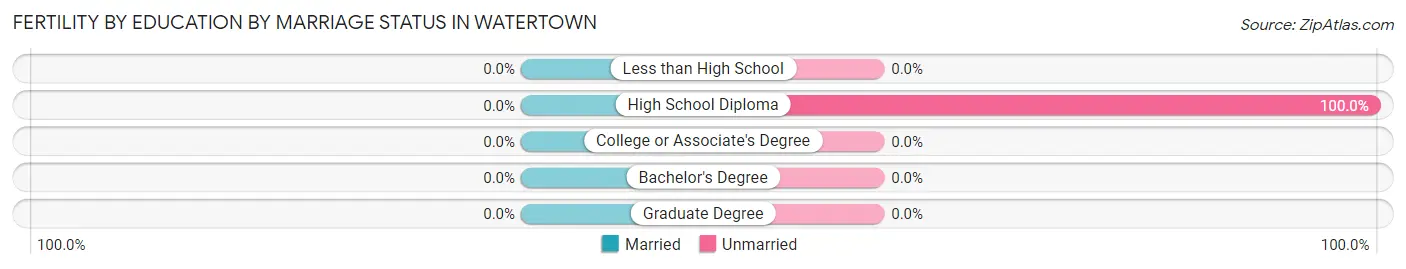
| Educational Attainment | Married | Unmarried |
| Less than High School | 0 (0.0%) | 0 (0.0%) |
| High School Diploma | 0 (0.0%) | 17 (100.0%) |
| College or Associate's Degree | 0 (0.0%) | 0 (0.0%) |
| Bachelor's Degree | 0 (0.0%) | 0 (0.0%) |
| Graduate Degree | 0 (0.0%) | 0 (0.0%) |
| Total | 0 (0.0%) | 17 (100.0%) |
Employment Characteristics in Watertown
Employment by Class of Employer in Watertown
Among the 840 employed individuals in Watertown, private company employees (535 | 63.7%), state government employees (138 | 16.4%), and local government employees (74 | 8.8%) make up the most common classes of employment.
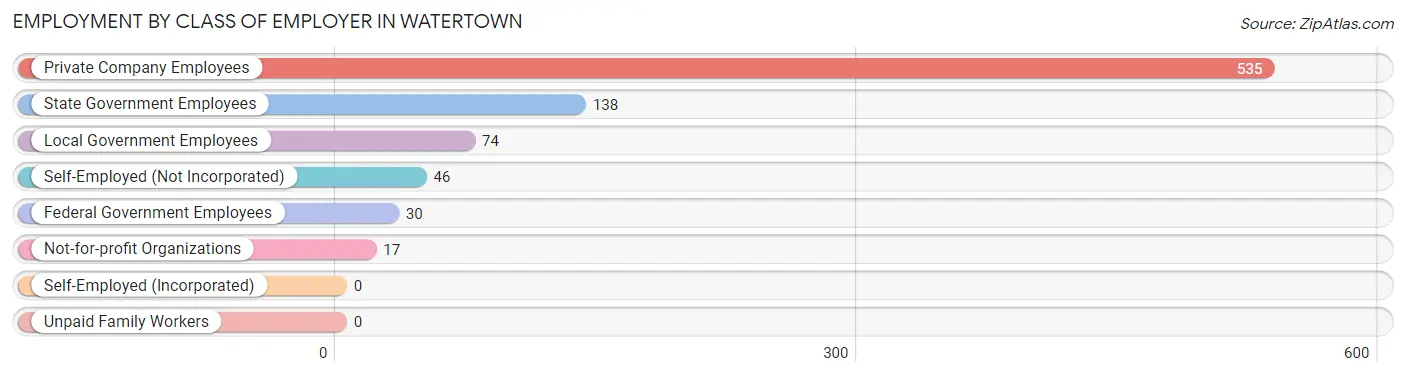
| Employer Class | # Employees | % Employees |
| Private Company Employees | 535 | 63.7% |
| Self-Employed (Incorporated) | 0 | 0.0% |
| Self-Employed (Not Incorporated) | 46 | 5.5% |
| Not-for-profit Organizations | 17 | 2.0% |
| Local Government Employees | 74 | 8.8% |
| State Government Employees | 138 | 16.4% |
| Federal Government Employees | 30 | 3.6% |
| Unpaid Family Workers | 0 | 0.0% |
| Total | 840 | 100.0% |
Employment Status by Age in Watertown
According to the labor force statistics for Watertown, out of the total population over 16 years of age (2,322), 46.0% or 1,068 individuals are in the labor force, with 19.6% or 209 of them unemployed. The age group with the highest labor force participation rate is 16 to 19 years, with 100.0% or 96 individuals in the labor force. Within the labor force, the 25 to 29 years age range has the highest percentage of unemployed individuals, with 51.8% or 57 of them being unemployed.
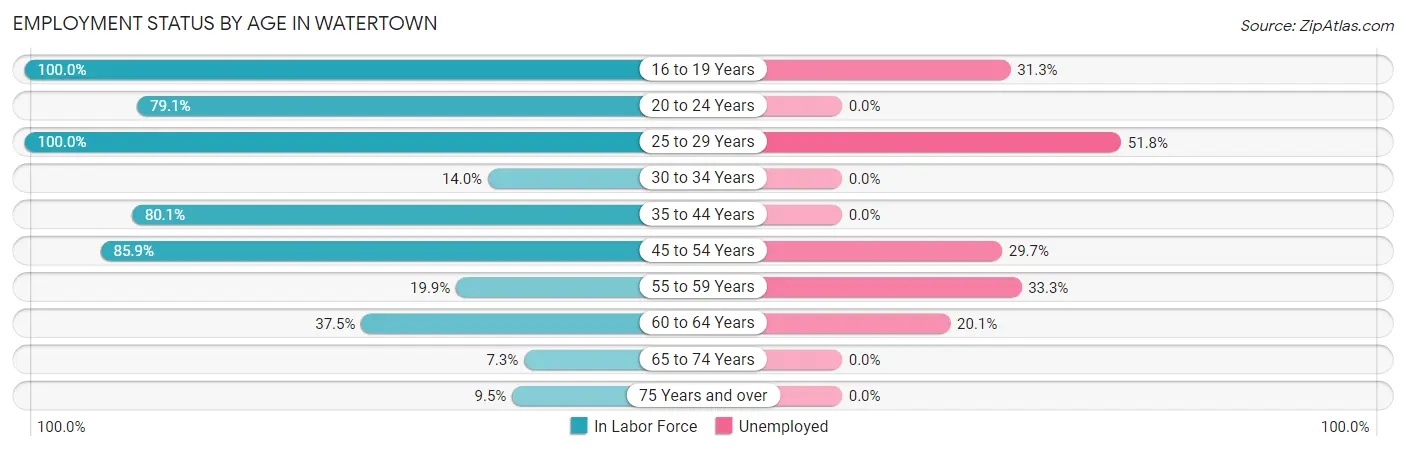
| Age Bracket | In Labor Force | Unemployed |
| 16 to 19 Years | 96 (100.0%) | 30 (31.3%) |
| 20 to 24 Years | 151 (79.1%) | 0 (0.0%) |
| 25 to 29 Years | 110 (100.0%) | 57 (51.8%) |
| 30 to 34 Years | 26 (14.0%) | 0 (0.0%) |
| 35 to 44 Years | 173 (80.1%) | 0 (0.0%) |
| 45 to 54 Years | 269 (85.9%) | 80 (29.7%) |
| 55 to 59 Years | 30 (19.9%) | 10 (33.3%) |
| 60 to 64 Years | 159 (37.5%) | 32 (20.1%) |
| 65 to 74 Years | 24 (7.3%) | 0 (0.0%) |
| 75 Years and over | 29 (9.5%) | 0 (0.0%) |
| Total | 1,068 (46.0%) | 209 (19.6%) |
Employment Status by Educational Attainment in Watertown
According to labor force statistics for Watertown, 54.8% of individuals (767) out of the total population between 25 and 64 years of age (1,400) are in the labor force, with 23.3% or 179 of them being unemployed. The group with the highest labor force participation rate are those with the educational attainment of less than high school, with 82.2% or 106 individuals in the labor force. Within the labor force, individuals with high school diploma education have the highest percentage of unemployment, with 37.8% or 148 of them being unemployed.
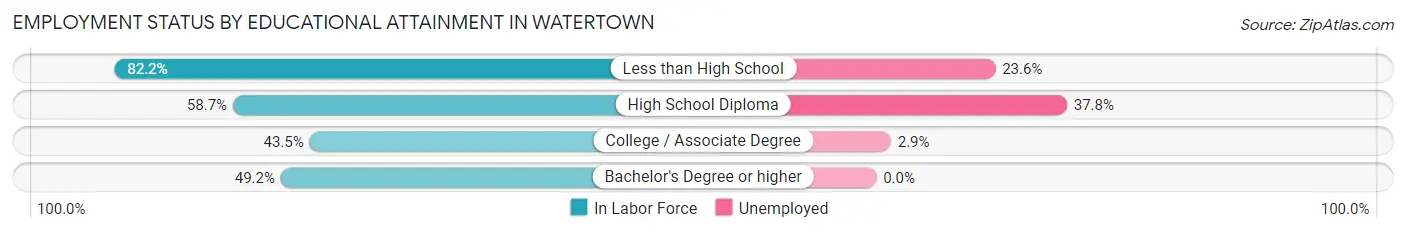
| Educational Attainment | In Labor Force | Unemployed |
| Less than High School | 106 (82.2%) | 30 (23.6%) |
| High School Diploma | 392 (58.7%) | 253 (37.8%) |
| College / Associate Degree | 210 (43.5%) | 14 (2.9%) |
| Bachelor's Degree or higher | 59 (49.2%) | 0 (0.0%) |
| Total | 767 (54.8%) | 326 (23.3%) |
Employment Occupations by Sex in Watertown
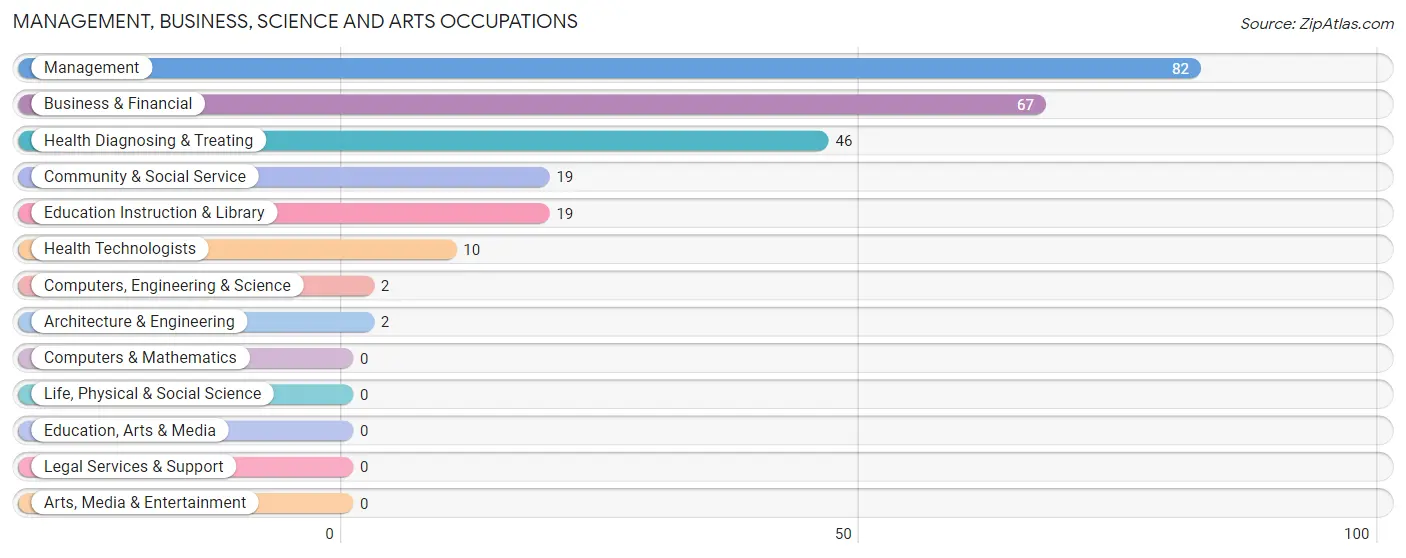
Management, Business, Science and Arts Occupations
The most common Management, Business, Science and Arts occupations in Watertown are Management (82 | 9.6%), Business & Financial (67 | 7.8%), Health Diagnosing & Treating (46 | 5.4%), Community & Social Service (19 | 2.2%), and Education Instruction & Library (19 | 2.2%).
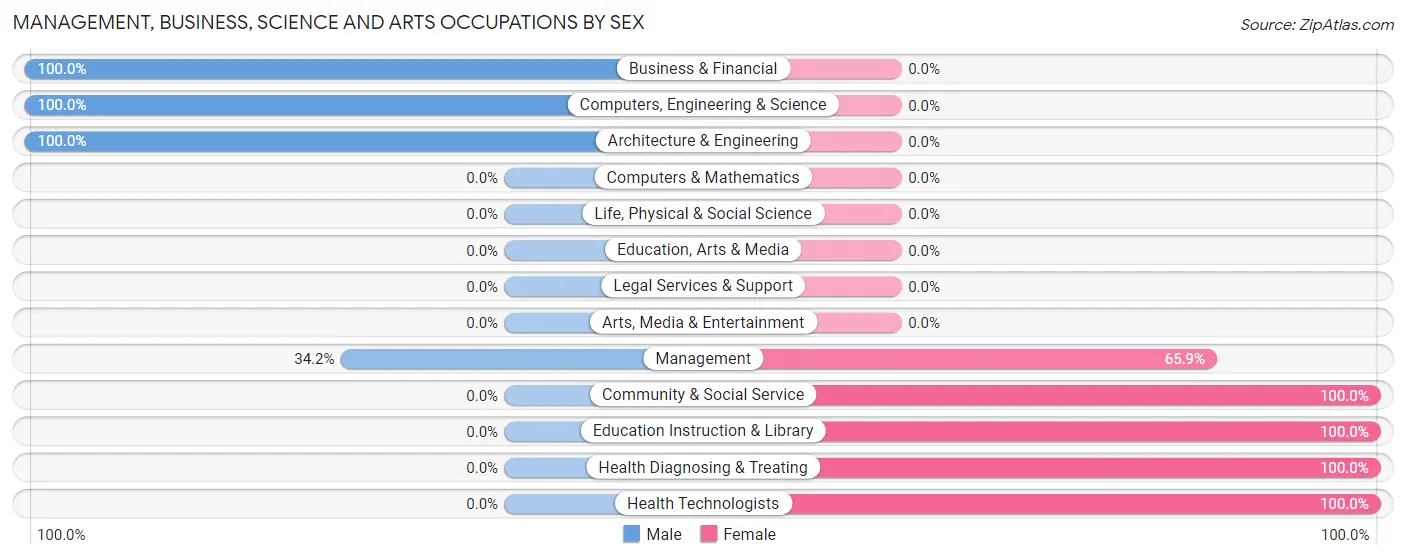
Management, Business, Science and Arts Occupations by Sex
Within the Management, Business, Science and Arts occupations in Watertown, the most male-oriented occupations are Business & Financial (100.0%), Computers, Engineering & Science (100.0%), and Architecture & Engineering (100.0%), while the most female-oriented occupations are Community & Social Service (100.0%), Education Instruction & Library (100.0%), and Health Diagnosing & Treating (100.0%).
| Occupation | Male | Female |
| Management | 28 (34.2%) | 54 (65.8%) |
| Business & Financial | 67 (100.0%) | 0 (0.0%) |
| Computers, Engineering & Science | 2 (100.0%) | 0 (0.0%) |
| Computers & Mathematics | 0 (0.0%) | 0 (0.0%) |
| Architecture & Engineering | 2 (100.0%) | 0 (0.0%) |
| Life, Physical & Social Science | 0 (0.0%) | 0 (0.0%) |
| Community & Social Service | 0 (0.0%) | 19 (100.0%) |
| Education, Arts & Media | 0 (0.0%) | 0 (0.0%) |
| Legal Services & Support | 0 (0.0%) | 0 (0.0%) |
| Education Instruction & Library | 0 (0.0%) | 19 (100.0%) |
| Arts, Media & Entertainment | 0 (0.0%) | 0 (0.0%) |
| Health Diagnosing & Treating | 0 (0.0%) | 46 (100.0%) |
| Health Technologists | 0 (0.0%) | 10 (100.0%) |
| Total (Category) | 97 (44.9%) | 119 (55.1%) |
| Total (Overall) | 409 (47.7%) | 449 (52.3%) |
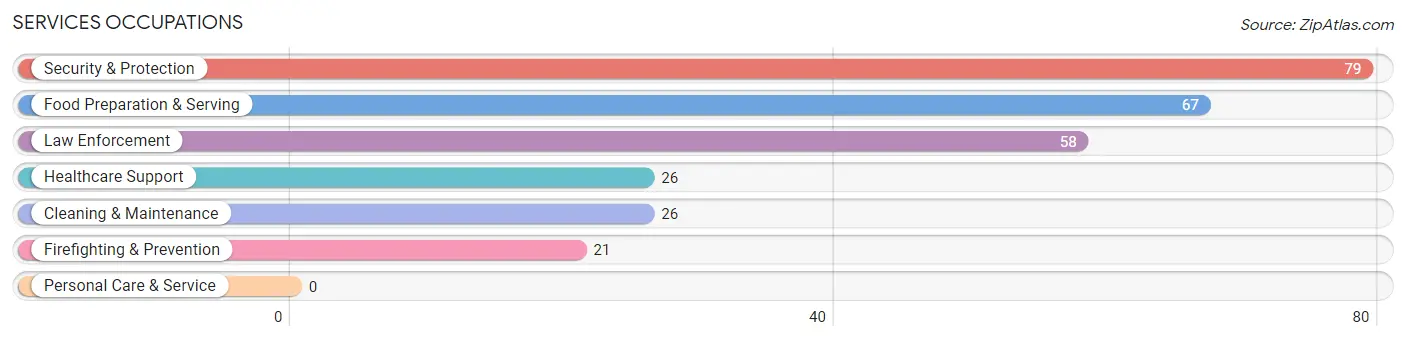
Services Occupations
The most common Services occupations in Watertown are Security & Protection (79 | 9.2%), Food Preparation & Serving (67 | 7.8%), Law Enforcement (58 | 6.8%), Healthcare Support (26 | 3.0%), and Cleaning & Maintenance (26 | 3.0%).
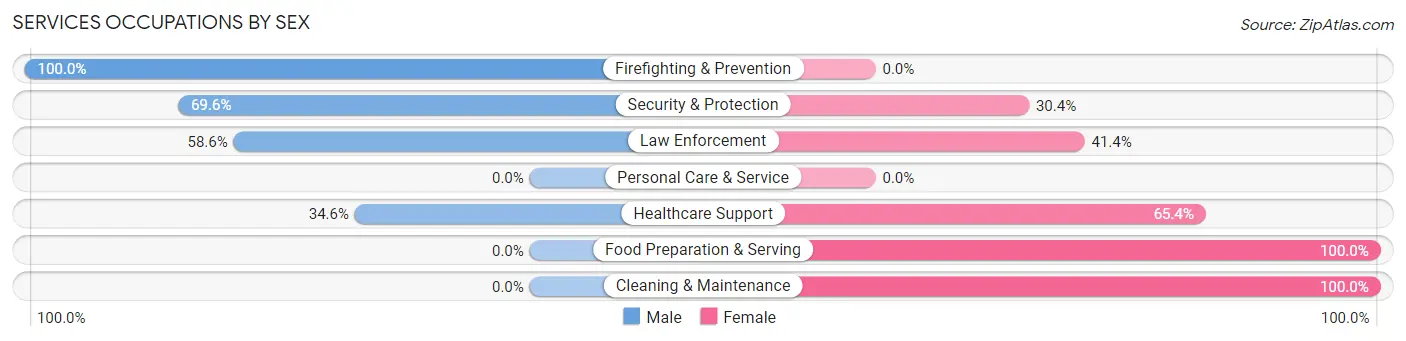
Services Occupations by Sex
Within the Services occupations in Watertown, the most male-oriented occupations are Firefighting & Prevention (100.0%), Security & Protection (69.6%), and Law Enforcement (58.6%), while the most female-oriented occupations are Food Preparation & Serving (100.0%), Cleaning & Maintenance (100.0%), and Healthcare Support (65.4%).
| Occupation | Male | Female |
| Healthcare Support | 9 (34.6%) | 17 (65.4%) |
| Security & Protection | 55 (69.6%) | 24 (30.4%) |
| Firefighting & Prevention | 21 (100.0%) | 0 (0.0%) |
| Law Enforcement | 34 (58.6%) | 24 (41.4%) |
| Food Preparation & Serving | 0 (0.0%) | 67 (100.0%) |
| Cleaning & Maintenance | 0 (0.0%) | 26 (100.0%) |
| Personal Care & Service | 0 (0.0%) | 0 (0.0%) |
| Total (Category) | 64 (32.3%) | 134 (67.7%) |
| Total (Overall) | 409 (47.7%) | 449 (52.3%) |
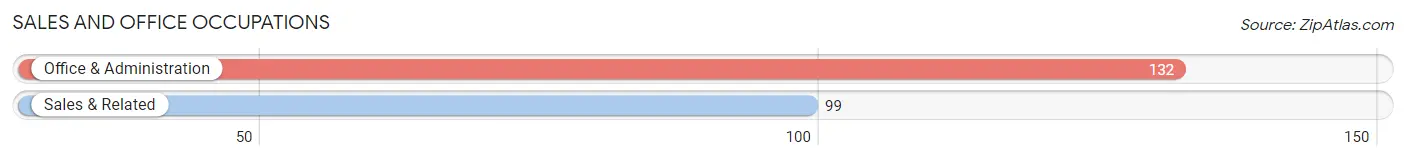
Sales and Office Occupations
The most common Sales and Office occupations in Watertown are Office & Administration (132 | 15.4%), and Sales & Related (99 | 11.5%).
Sales and Office Occupations by Sex
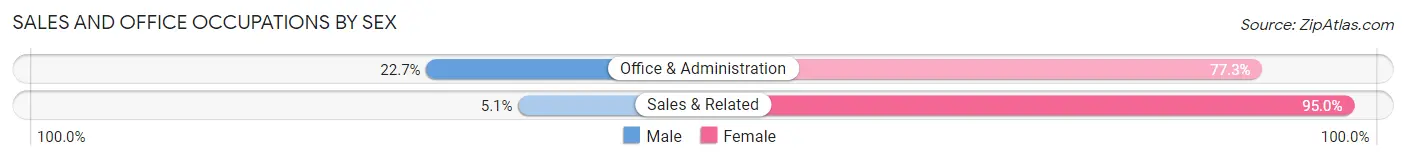
| Occupation | Male | Female |
| Sales & Related | 5 (5.1%) | 94 (95.0%) |
| Office & Administration | 30 (22.7%) | 102 (77.3%) |
| Total (Category) | 35 (15.1%) | 196 (84.9%) |
| Total (Overall) | 409 (47.7%) | 449 (52.3%) |
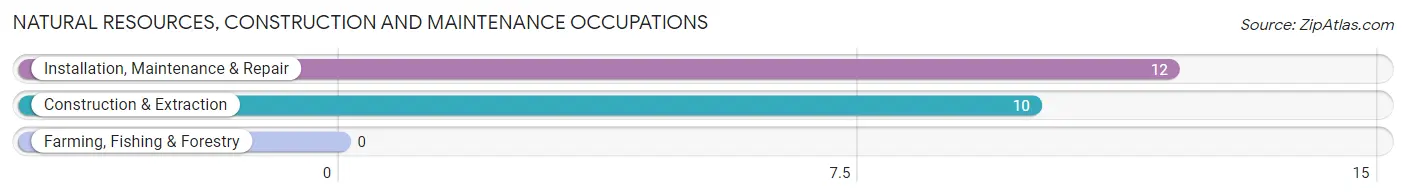
Natural Resources, Construction and Maintenance Occupations
The most common Natural Resources, Construction and Maintenance occupations in Watertown are Installation, Maintenance & Repair (12 | 1.4%), and Construction & Extraction (10 | 1.2%).
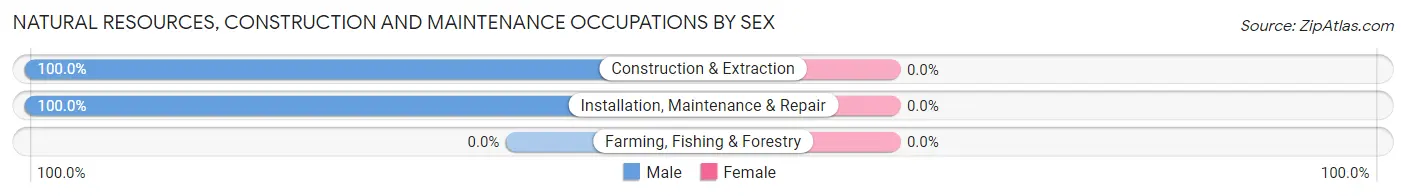
Natural Resources, Construction and Maintenance Occupations by Sex
| Occupation | Male | Female |
| Farming, Fishing & Forestry | 0 (0.0%) | 0 (0.0%) |
| Construction & Extraction | 10 (100.0%) | 0 (0.0%) |
| Installation, Maintenance & Repair | 12 (100.0%) | 0 (0.0%) |
| Total (Category) | 22 (100.0%) | 0 (0.0%) |
| Total (Overall) | 409 (47.7%) | 449 (52.3%) |
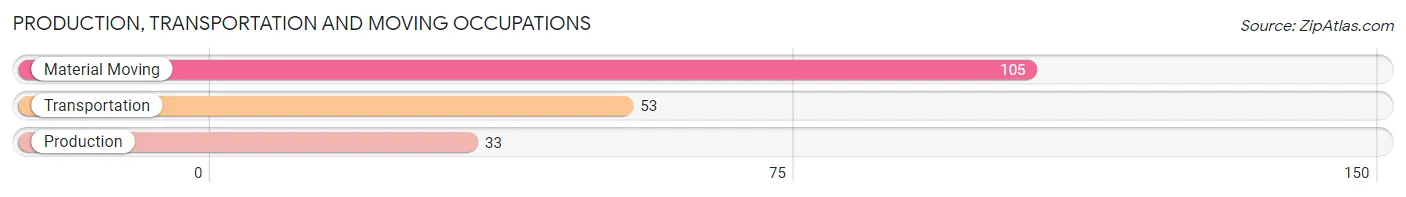
Production, Transportation and Moving Occupations
The most common Production, Transportation and Moving occupations in Watertown are Material Moving (105 | 12.2%), Transportation (53 | 6.2%), and Production (33 | 3.8%).
Production, Transportation and Moving Occupations by Sex
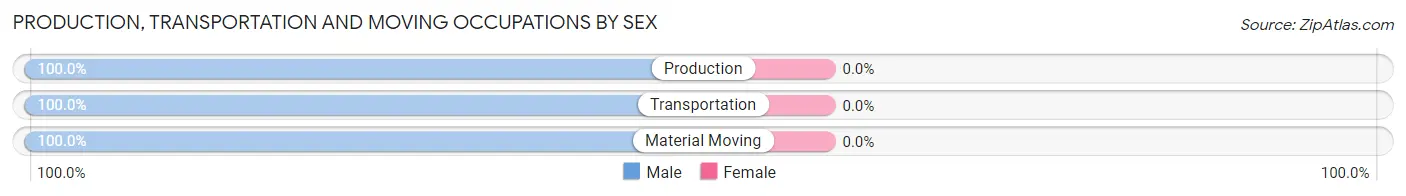
| Occupation | Male | Female |
| Production | 33 (100.0%) | 0 (0.0%) |
| Transportation | 53 (100.0%) | 0 (0.0%) |
| Material Moving | 105 (100.0%) | 0 (0.0%) |
| Total (Category) | 191 (100.0%) | 0 (0.0%) |
| Total (Overall) | 409 (47.7%) | 449 (52.3%) |
Employment Industries by Sex in Watertown
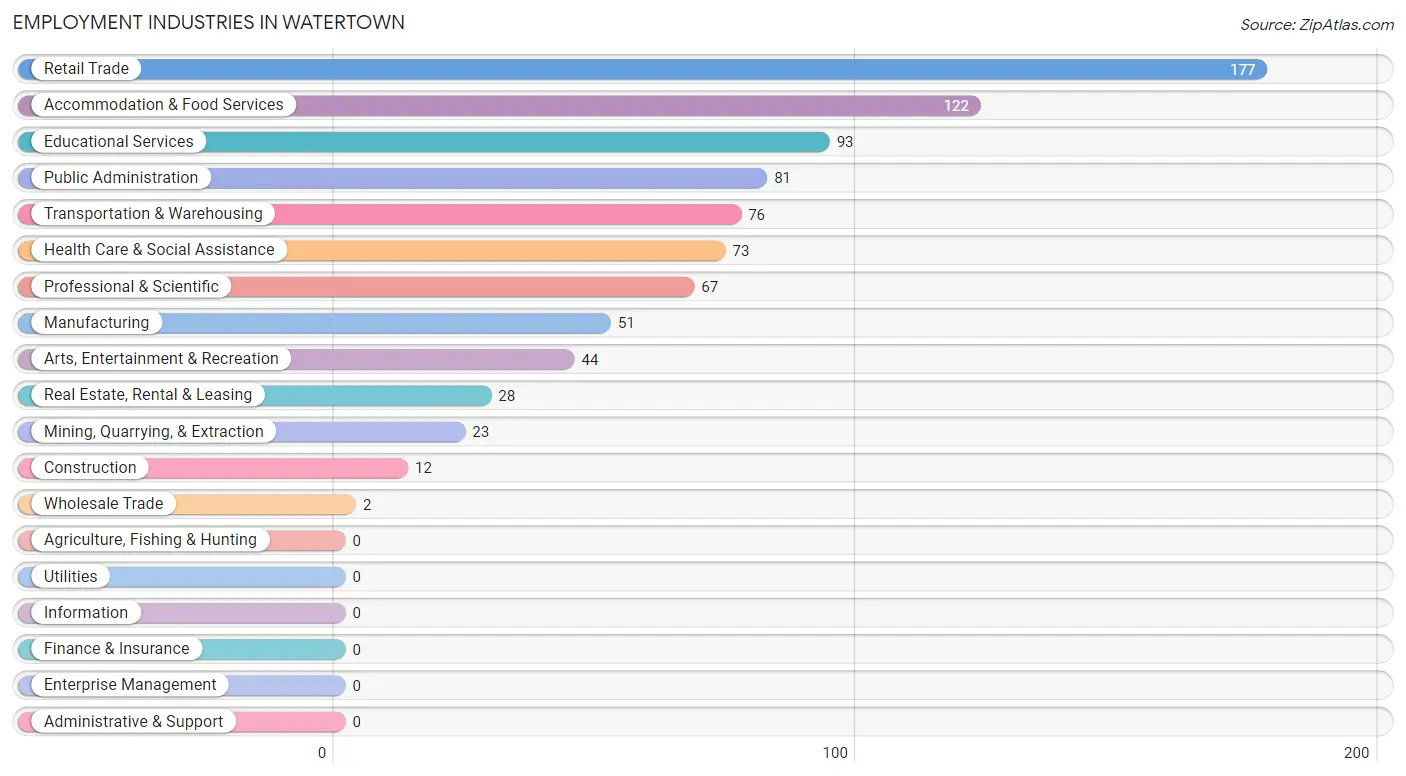
Employment Industries in Watertown
The major employment industries in Watertown include Retail Trade (177 | 20.6%), Accommodation & Food Services (122 | 14.2%), Educational Services (93 | 10.8%), Public Administration (81 | 9.4%), and Transportation & Warehousing (76 | 8.9%).
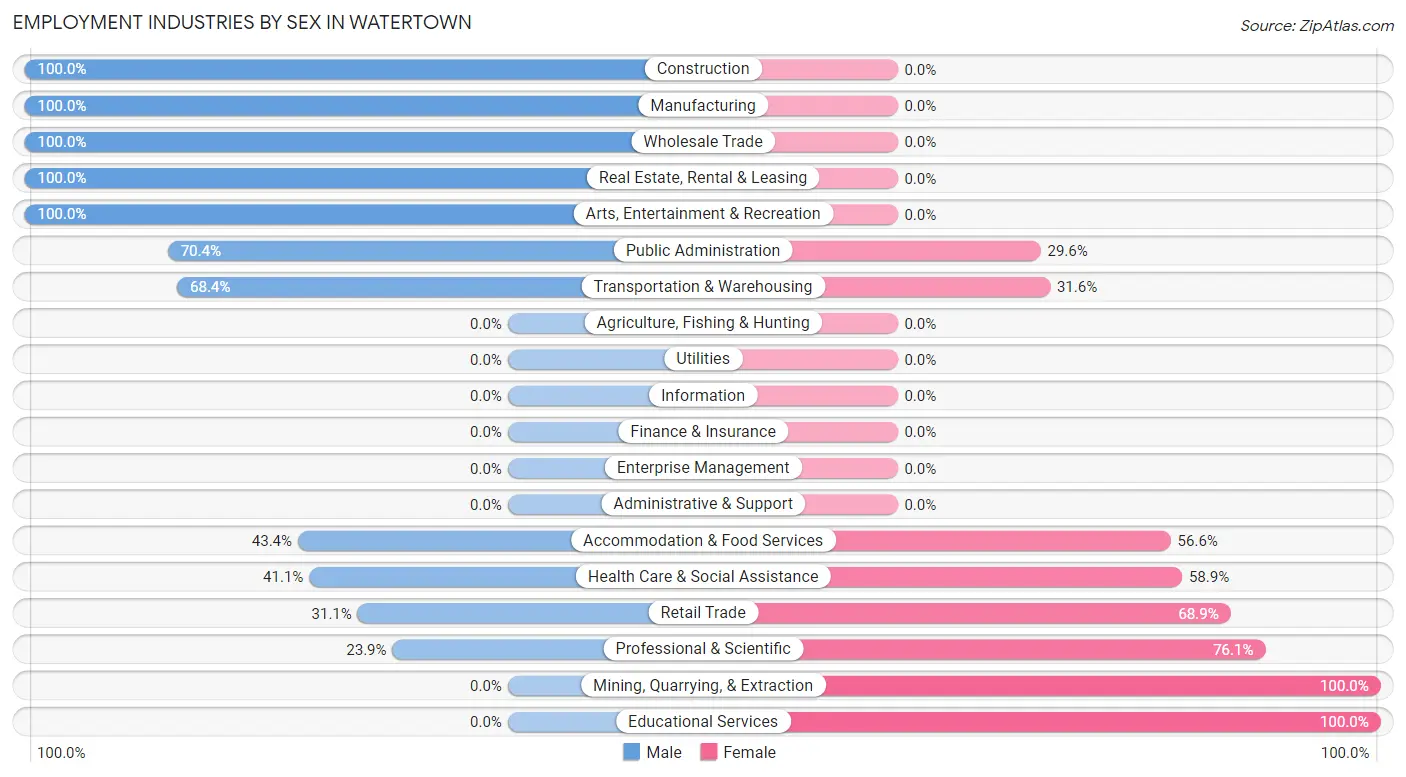
Employment Industries by Sex in Watertown
The Watertown industries that see more men than women are Construction (100.0%), Manufacturing (100.0%), and Wholesale Trade (100.0%), whereas the industries that tend to have a higher number of women are Mining, Quarrying, & Extraction (100.0%), Educational Services (100.0%), and Professional & Scientific (76.1%).
| Industry | Male | Female |
| Agriculture, Fishing & Hunting | 0 (0.0%) | 0 (0.0%) |
| Mining, Quarrying, & Extraction | 0 (0.0%) | 23 (100.0%) |
| Construction | 12 (100.0%) | 0 (0.0%) |
| Manufacturing | 51 (100.0%) | 0 (0.0%) |
| Wholesale Trade | 2 (100.0%) | 0 (0.0%) |
| Retail Trade | 55 (31.1%) | 122 (68.9%) |
| Transportation & Warehousing | 52 (68.4%) | 24 (31.6%) |
| Utilities | 0 (0.0%) | 0 (0.0%) |
| Information | 0 (0.0%) | 0 (0.0%) |
| Finance & Insurance | 0 (0.0%) | 0 (0.0%) |
| Real Estate, Rental & Leasing | 28 (100.0%) | 0 (0.0%) |
| Professional & Scientific | 16 (23.9%) | 51 (76.1%) |
| Enterprise Management | 0 (0.0%) | 0 (0.0%) |
| Administrative & Support | 0 (0.0%) | 0 (0.0%) |
| Educational Services | 0 (0.0%) | 93 (100.0%) |
| Health Care & Social Assistance | 30 (41.1%) | 43 (58.9%) |
| Arts, Entertainment & Recreation | 44 (100.0%) | 0 (0.0%) |
| Accommodation & Food Services | 53 (43.4%) | 69 (56.6%) |
| Public Administration | 57 (70.4%) | 24 (29.6%) |
| Total | 409 (47.7%) | 449 (52.3%) |
Education in Watertown
School Enrollment in Watertown
The most common levels of schooling among the 266 students in Watertown are college / undergraduate (117 | 44.0%), elementary school (57 | 21.4%), and nursery / preschool (33 | 12.4%).
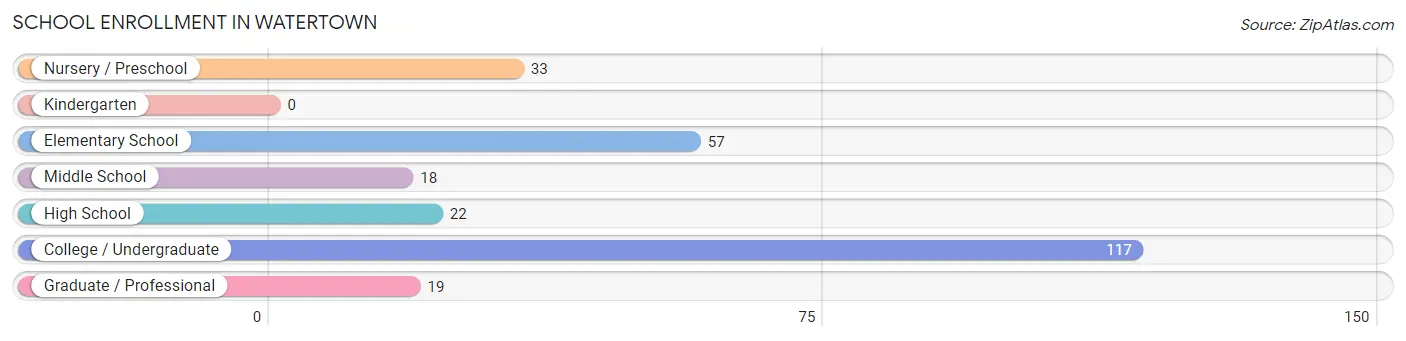
| School Level | # Students | % Students |
| Nursery / Preschool | 33 | 12.4% |
| Kindergarten | 0 | 0.0% |
| Elementary School | 57 | 21.4% |
| Middle School | 18 | 6.8% |
| High School | 22 | 8.3% |
| College / Undergraduate | 117 | 44.0% |
| Graduate / Professional | 19 | 7.1% |
| Total | 266 | 100.0% |
School Enrollment by Age by Funding Source in Watertown
Out of a total of 266 students who are enrolled in schools in Watertown, 44 (16.5%) attend a private institution, while the remaining 222 (83.5%) are enrolled in public schools. The age group of 18 to 19 year olds has the highest likelihood of being enrolled in private schools, with 44 (100.0% in the age bracket) enrolled. Conversely, the age group of 3 to 4 year olds has the lowest likelihood of being enrolled in a private school, with 18 (100.0% in the age bracket) attending a public institution.
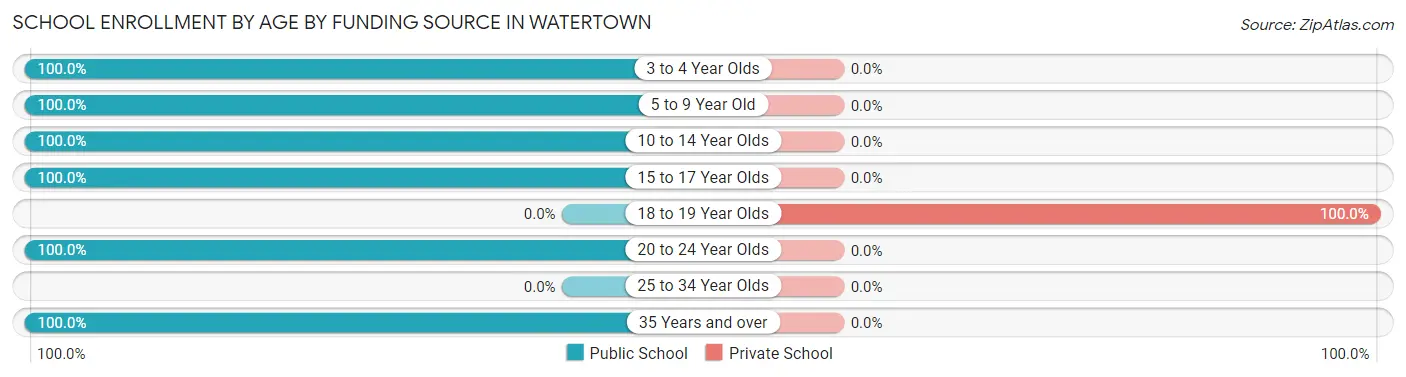
| Age Bracket | Public School | Private School |
| 3 to 4 Year Olds | 18 (100.0%) | 0 (0.0%) |
| 5 to 9 Year Old | 72 (100.0%) | 0 (0.0%) |
| 10 to 14 Year Olds | 18 (100.0%) | 0 (0.0%) |
| 15 to 17 Year Olds | 22 (100.0%) | 0 (0.0%) |
| 18 to 19 Year Olds | 0 (0.0%) | 44 (100.0%) |
| 20 to 24 Year Olds | 73 (100.0%) | 0 (0.0%) |
| 25 to 34 Year Olds | 0 (0.0%) | 0 (0.0%) |
| 35 Years and over | 19 (100.0%) | 0 (0.0%) |
| Total | 222 (83.5%) | 44 (16.5%) |
Educational Attainment by Field of Study in Watertown
Science & technology (54 | 29.0%), education (35 | 18.8%), psychology (31 | 16.7%), social sciences (30 | 16.1%), and business (19 | 10.2%) are the most common fields of study among 186 individuals in Watertown who have obtained a bachelor's degree or higher.
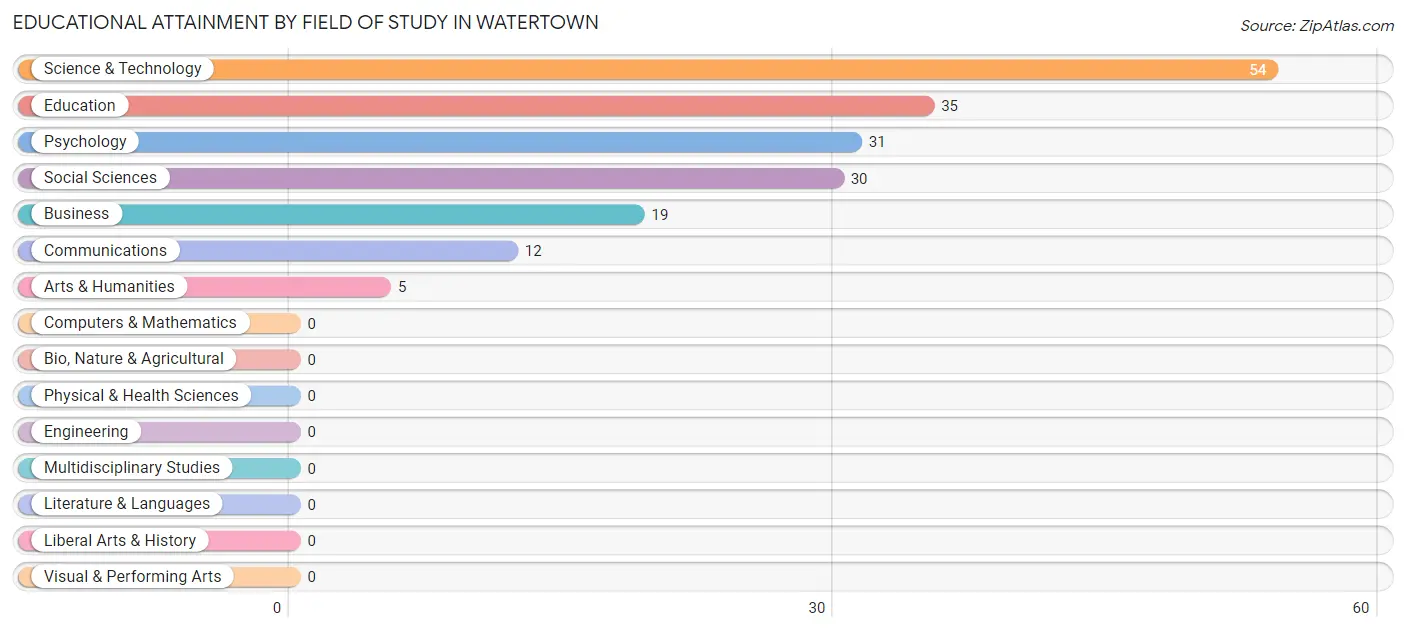
| Field of Study | # Graduates | % Graduates |
| Computers & Mathematics | 0 | 0.0% |
| Bio, Nature & Agricultural | 0 | 0.0% |
| Physical & Health Sciences | 0 | 0.0% |
| Psychology | 31 | 16.7% |
| Social Sciences | 30 | 16.1% |
| Engineering | 0 | 0.0% |
| Multidisciplinary Studies | 0 | 0.0% |
| Science & Technology | 54 | 29.0% |
| Business | 19 | 10.2% |
| Education | 35 | 18.8% |
| Literature & Languages | 0 | 0.0% |
| Liberal Arts & History | 0 | 0.0% |
| Visual & Performing Arts | 0 | 0.0% |
| Communications | 12 | 6.5% |
| Arts & Humanities | 5 | 2.7% |
| Total | 186 | 100.0% |
Transportation & Commute in Watertown
Vehicle Availability by Sex in Watertown
The most prevalent vehicle ownership categories in Watertown are males with 1 vehicle (176, accounting for 43.6%) and females with 1 vehicle (222, making up 40.4%).
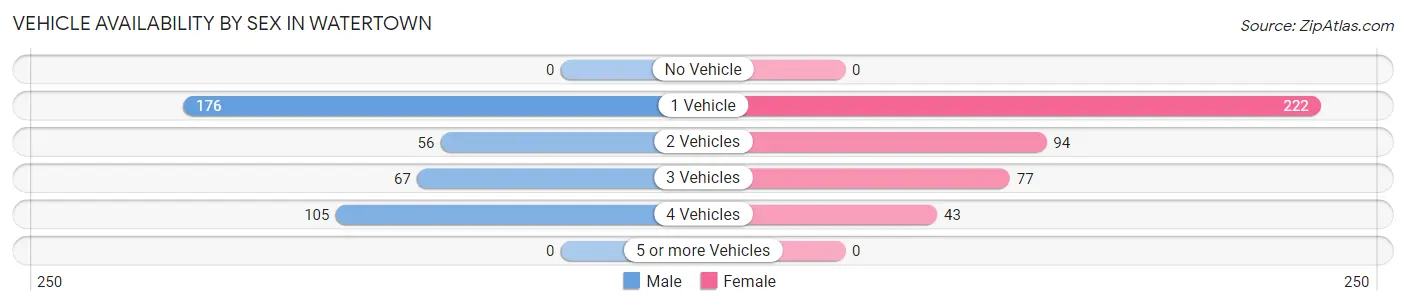
| Vehicles Available | Male | Female |
| No Vehicle | 0 (0.0%) | 0 (0.0%) |
| 1 Vehicle | 176 (43.6%) | 222 (50.9%) |
| 2 Vehicles | 56 (13.9%) | 94 (21.6%) |
| 3 Vehicles | 67 (16.6%) | 77 (17.7%) |
| 4 Vehicles | 105 (26.0%) | 43 (9.9%) |
| 5 or more Vehicles | 0 (0.0%) | 0 (0.0%) |
| Total | 404 (100.0%) | 436 (100.0%) |
Commute Time in Watertown
The most frequently occuring commute durations in Watertown are 10 to 14 minutes (264 commuters, 31.9%), 15 to 19 minutes (221 commuters, 26.7%), and 5 to 9 minutes (216 commuters, 26.1%).
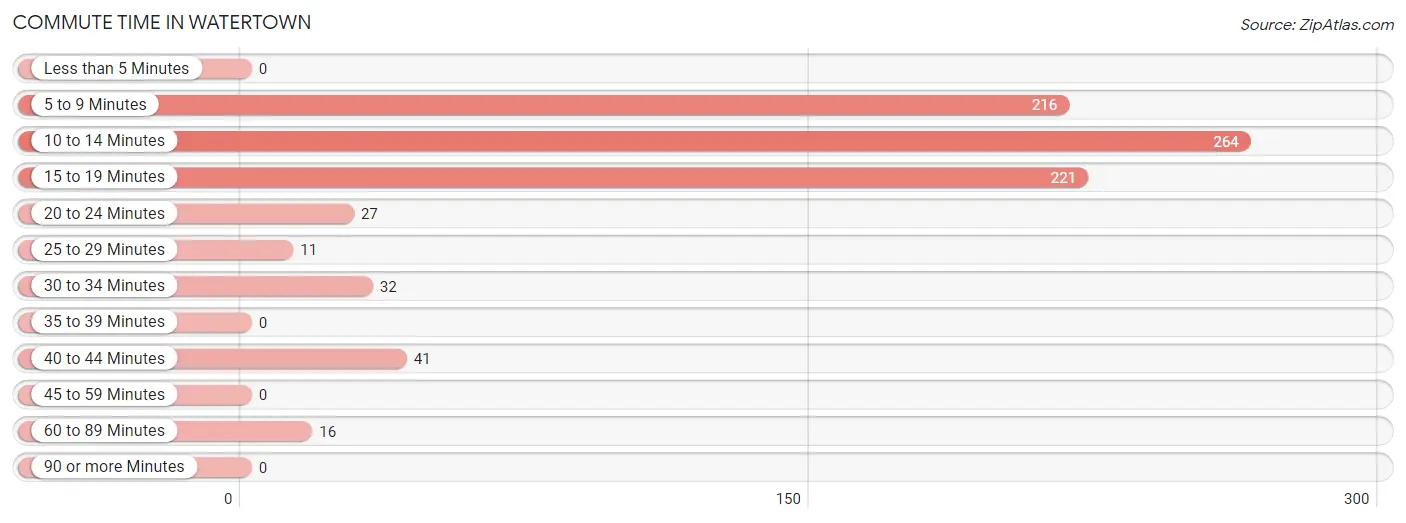
| Commute Time | # Commuters | % Commuters |
| Less than 5 Minutes | 0 | 0.0% |
| 5 to 9 Minutes | 216 | 26.1% |
| 10 to 14 Minutes | 264 | 31.9% |
| 15 to 19 Minutes | 221 | 26.7% |
| 20 to 24 Minutes | 27 | 3.3% |
| 25 to 29 Minutes | 11 | 1.3% |
| 30 to 34 Minutes | 32 | 3.9% |
| 35 to 39 Minutes | 0 | 0.0% |
| 40 to 44 Minutes | 41 | 5.0% |
| 45 to 59 Minutes | 0 | 0.0% |
| 60 to 89 Minutes | 16 | 1.9% |
| 90 or more Minutes | 0 | 0.0% |
Commute Time by Sex in Watertown
The most common commute times in Watertown are 10 to 14 minutes (163 commuters, 41.6%) for males and 15 to 19 minutes (182 commuters, 41.7%) for females.
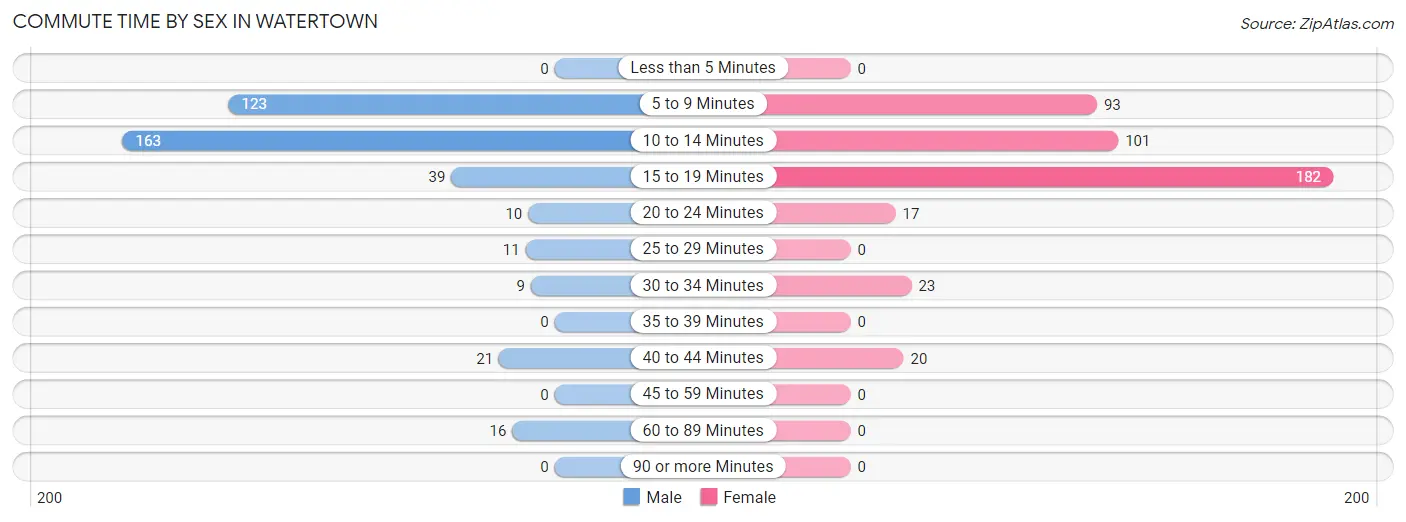
| Commute Time | Male | Female |
| Less than 5 Minutes | 0 (0.0%) | 0 (0.0%) |
| 5 to 9 Minutes | 123 (31.4%) | 93 (21.3%) |
| 10 to 14 Minutes | 163 (41.6%) | 101 (23.2%) |
| 15 to 19 Minutes | 39 (10.0%) | 182 (41.7%) |
| 20 to 24 Minutes | 10 (2.5%) | 17 (3.9%) |
| 25 to 29 Minutes | 11 (2.8%) | 0 (0.0%) |
| 30 to 34 Minutes | 9 (2.3%) | 23 (5.3%) |
| 35 to 39 Minutes | 0 (0.0%) | 0 (0.0%) |
| 40 to 44 Minutes | 21 (5.4%) | 20 (4.6%) |
| 45 to 59 Minutes | 0 (0.0%) | 0 (0.0%) |
| 60 to 89 Minutes | 16 (4.1%) | 0 (0.0%) |
| 90 or more Minutes | 0 (0.0%) | 0 (0.0%) |
Time of Departure to Work by Sex in Watertown
The most frequent times of departure to work in Watertown are 4:00 PM to 11:59 PM (165, 42.1%) for males and 7:00 AM to 7:29 AM (126, 28.9%) for females.
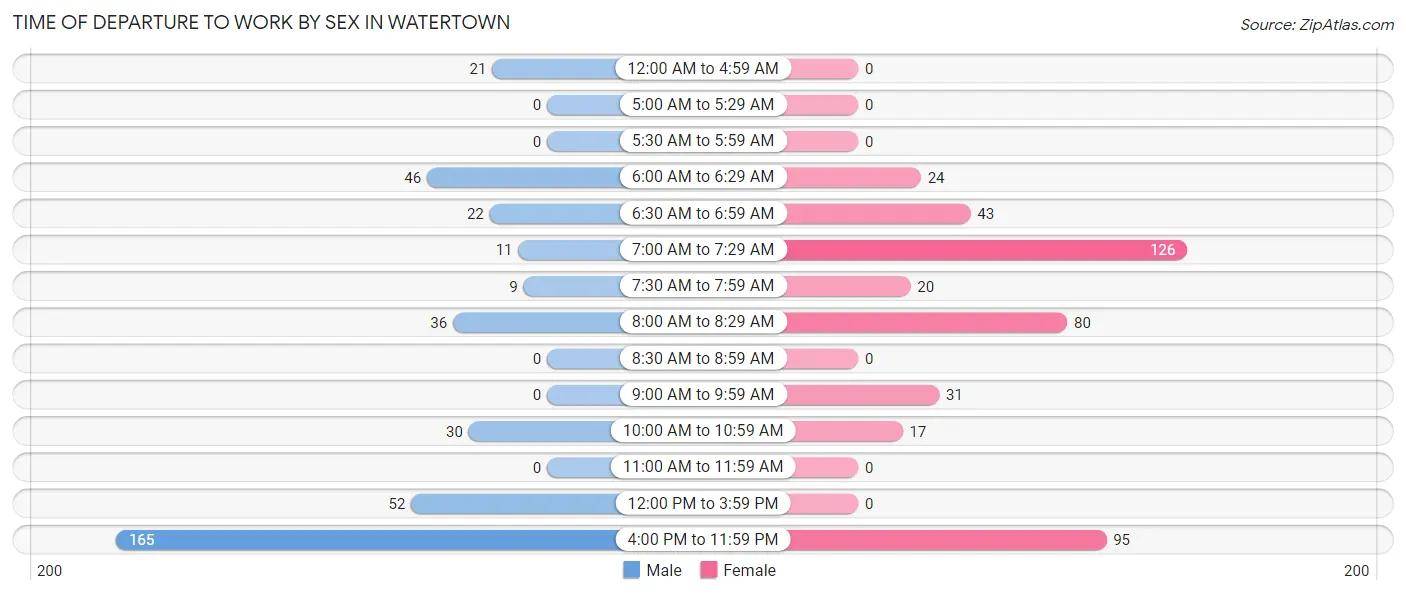
| Time of Departure | Male | Female |
| 12:00 AM to 4:59 AM | 21 (5.4%) | 0 (0.0%) |
| 5:00 AM to 5:29 AM | 0 (0.0%) | 0 (0.0%) |
| 5:30 AM to 5:59 AM | 0 (0.0%) | 0 (0.0%) |
| 6:00 AM to 6:29 AM | 46 (11.7%) | 24 (5.5%) |
| 6:30 AM to 6:59 AM | 22 (5.6%) | 43 (9.9%) |
| 7:00 AM to 7:29 AM | 11 (2.8%) | 126 (28.9%) |
| 7:30 AM to 7:59 AM | 9 (2.3%) | 20 (4.6%) |
| 8:00 AM to 8:29 AM | 36 (9.2%) | 80 (18.3%) |
| 8:30 AM to 8:59 AM | 0 (0.0%) | 0 (0.0%) |
| 9:00 AM to 9:59 AM | 0 (0.0%) | 31 (7.1%) |
| 10:00 AM to 10:59 AM | 30 (7.6%) | 17 (3.9%) |
| 11:00 AM to 11:59 AM | 0 (0.0%) | 0 (0.0%) |
| 12:00 PM to 3:59 PM | 52 (13.3%) | 0 (0.0%) |
| 4:00 PM to 11:59 PM | 165 (42.1%) | 95 (21.8%) |
| Total | 392 (100.0%) | 436 (100.0%) |
Housing Occupancy in Watertown
Occupancy by Ownership in Watertown
Of the total 1,405 dwellings in Watertown, owner-occupied units account for 720 (51.2%), while renter-occupied units make up 685 (48.7%).
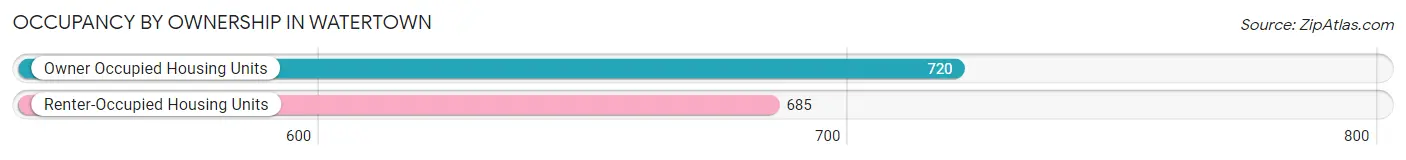
| Occupancy | # Housing Units | % Housing Units |
| Owner Occupied Housing Units | 720 | 51.2% |
| Renter-Occupied Housing Units | 685 | 48.7% |
| Total Occupied Housing Units | 1,405 | 100.0% |
Occupancy by Household Size in Watertown
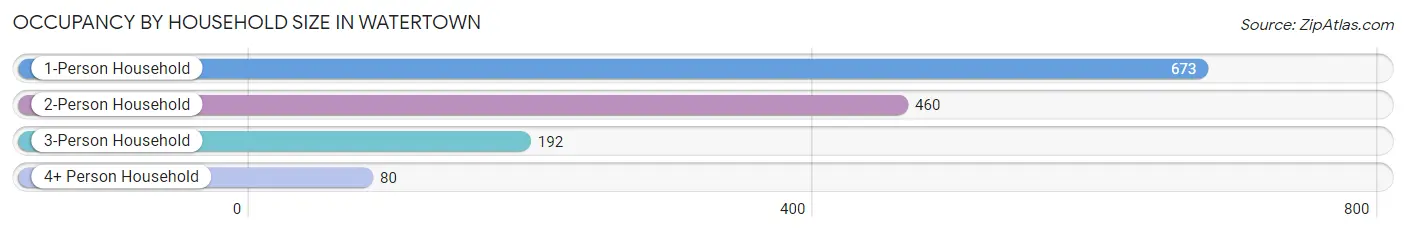
| Household Size | # Housing Units | % Housing Units |
| 1-Person Household | 673 | 47.9% |
| 2-Person Household | 460 | 32.7% |
| 3-Person Household | 192 | 13.7% |
| 4+ Person Household | 80 | 5.7% |
| Total Housing Units | 1,405 | 100.0% |
Occupancy by Ownership by Household Size in Watertown
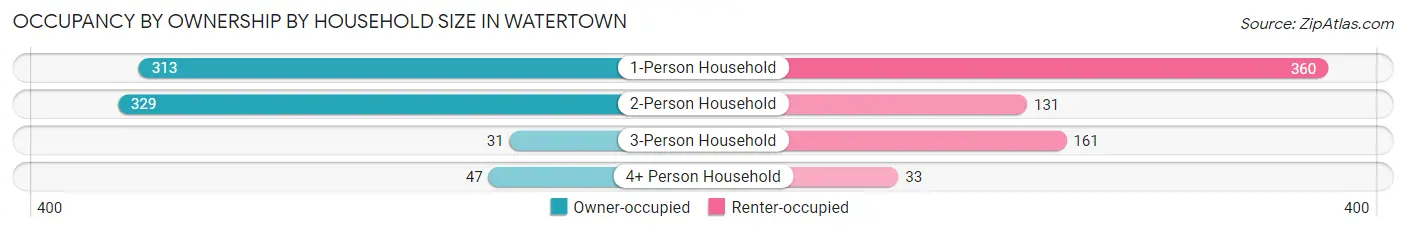
| Household Size | Owner-occupied | Renter-occupied |
| 1-Person Household | 313 (46.5%) | 360 (53.5%) |
| 2-Person Household | 329 (71.5%) | 131 (28.5%) |
| 3-Person Household | 31 (16.2%) | 161 (83.9%) |
| 4+ Person Household | 47 (58.8%) | 33 (41.2%) |
| Total Housing Units | 720 (51.2%) | 685 (48.7%) |
Occupancy by Educational Attainment in Watertown
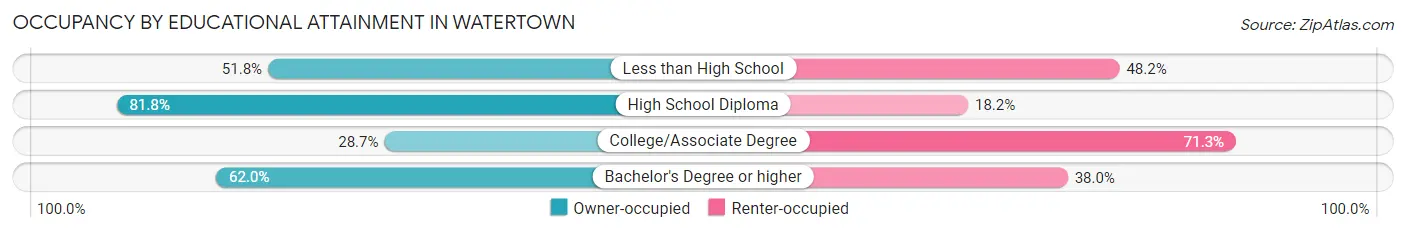
| Household Size | Owner-occupied | Renter-occupied |
| Less than High School | 103 (51.8%) | 96 (48.2%) |
| High School Diploma | 377 (81.8%) | 84 (18.2%) |
| College/Associate Degree | 191 (28.7%) | 475 (71.3%) |
| Bachelor's Degree or higher | 49 (62.0%) | 30 (38.0%) |
Occupancy by Age of Householder in Watertown
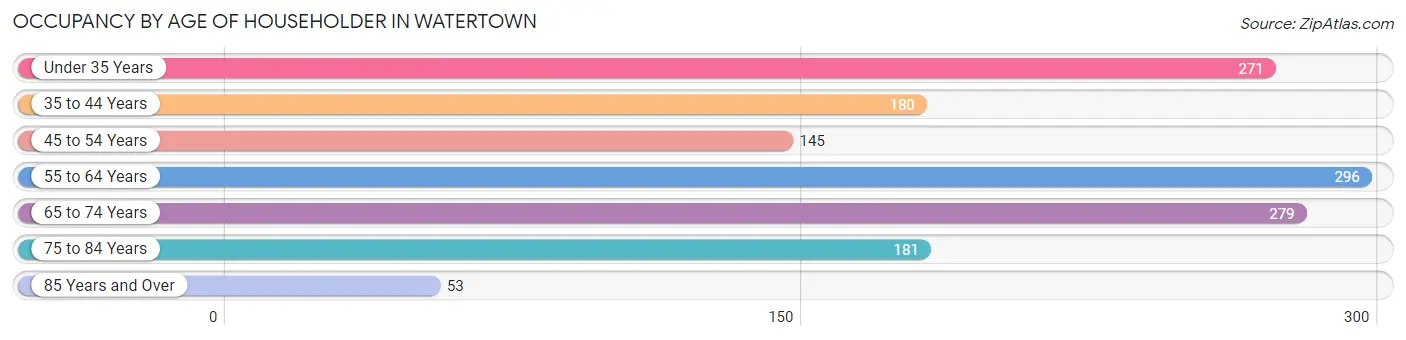
| Age Bracket | # Households | % Households |
| Under 35 Years | 271 | 19.3% |
| 35 to 44 Years | 180 | 12.8% |
| 45 to 54 Years | 145 | 10.3% |
| 55 to 64 Years | 296 | 21.1% |
| 65 to 74 Years | 279 | 19.9% |
| 75 to 84 Years | 181 | 12.9% |
| 85 Years and Over | 53 | 3.8% |
| Total | 1,405 | 100.0% |
Housing Finances in Watertown
Median Income by Occupancy in Watertown
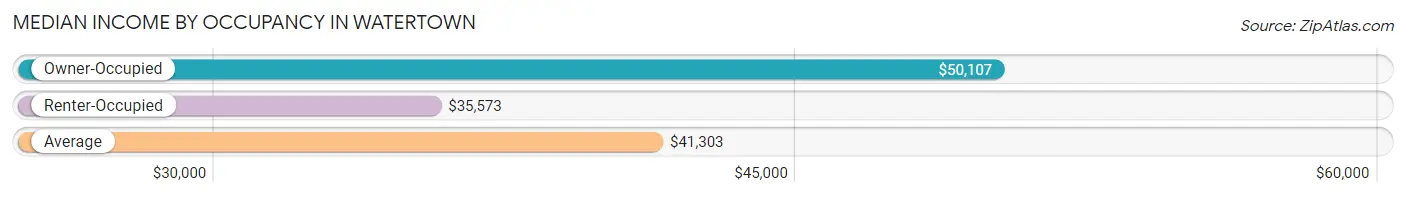
| Occupancy Type | # Households | Median Income |
| Owner-Occupied | 720 (51.2%) | $50,107 |
| Renter-Occupied | 685 (48.7%) | $35,573 |
| Average | 1,405 (100.0%) | $41,303 |
Occupancy by Householder Income Bracket in Watertown
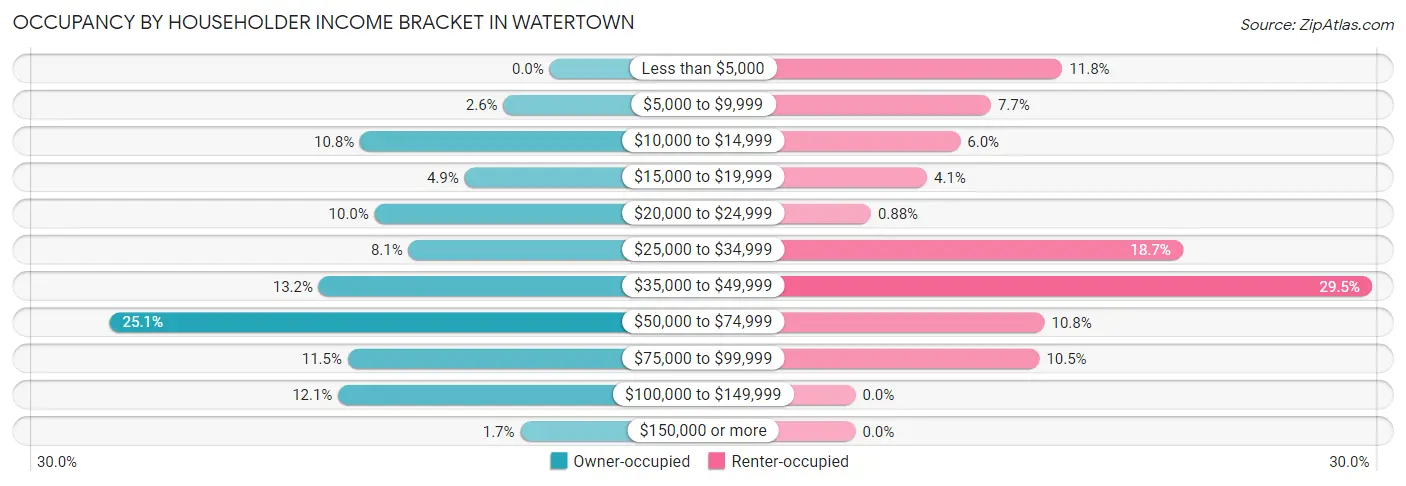
| Income Bracket | Owner-occupied | Renter-occupied |
| Less than $5,000 | 0 (0.0%) | 81 (11.8%) |
| $5,000 to $9,999 | 19 (2.6%) | 53 (7.7%) |
| $10,000 to $14,999 | 78 (10.8%) | 41 (6.0%) |
| $15,000 to $19,999 | 35 (4.9%) | 28 (4.1%) |
| $20,000 to $24,999 | 72 (10.0%) | 6 (0.9%) |
| $25,000 to $34,999 | 58 (8.1%) | 128 (18.7%) |
| $35,000 to $49,999 | 95 (13.2%) | 202 (29.5%) |
| $50,000 to $74,999 | 181 (25.1%) | 74 (10.8%) |
| $75,000 to $99,999 | 83 (11.5%) | 72 (10.5%) |
| $100,000 to $149,999 | 87 (12.1%) | 0 (0.0%) |
| $150,000 or more | 12 (1.7%) | 0 (0.0%) |
| Total | 720 (100.0%) | 685 (100.0%) |
Monthly Housing Cost Tiers in Watertown
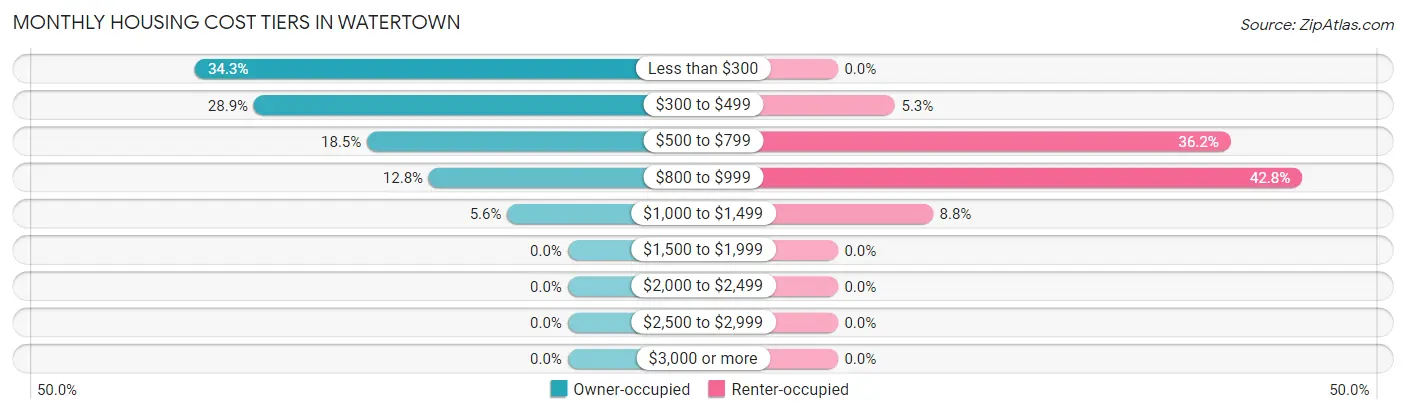
| Monthly Cost | Owner-occupied | Renter-occupied |
| Less than $300 | 247 (34.3%) | 0 (0.0%) |
| $300 to $499 | 208 (28.9%) | 36 (5.3%) |
| $500 to $799 | 133 (18.5%) | 248 (36.2%) |
| $800 to $999 | 92 (12.8%) | 293 (42.8%) |
| $1,000 to $1,499 | 40 (5.6%) | 60 (8.8%) |
| $1,500 to $1,999 | 0 (0.0%) | 0 (0.0%) |
| $2,000 to $2,499 | 0 (0.0%) | 0 (0.0%) |
| $2,500 to $2,999 | 0 (0.0%) | 0 (0.0%) |
| $3,000 or more | 0 (0.0%) | 0 (0.0%) |
| Total | 720 (100.0%) | 685 (100.0%) |
Physical Housing Characteristics in Watertown
Housing Structures in Watertown
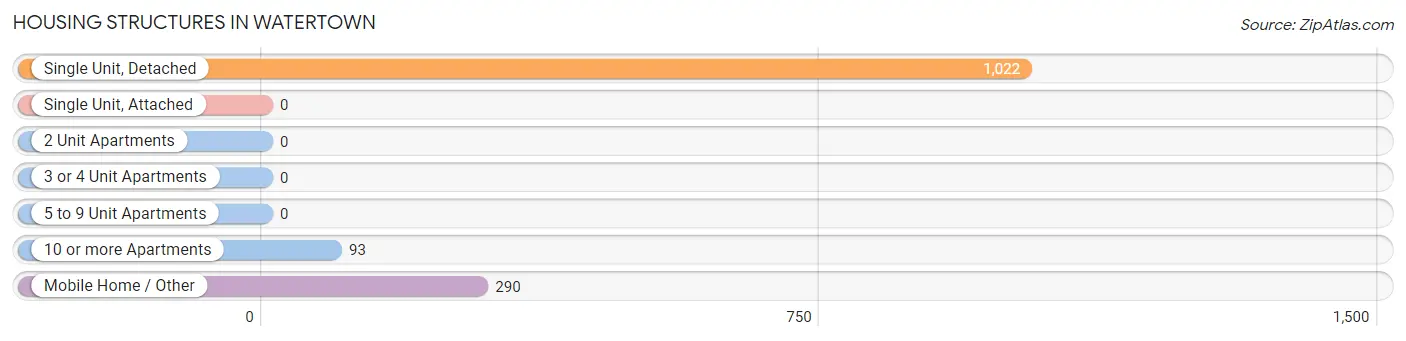
| Structure Type | # Housing Units | % Housing Units |
| Single Unit, Detached | 1,022 | 72.7% |
| Single Unit, Attached | 0 | 0.0% |
| 2 Unit Apartments | 0 | 0.0% |
| 3 or 4 Unit Apartments | 0 | 0.0% |
| 5 to 9 Unit Apartments | 0 | 0.0% |
| 10 or more Apartments | 93 | 6.6% |
| Mobile Home / Other | 290 | 20.6% |
| Total | 1,405 | 100.0% |
Housing Structures by Occupancy in Watertown
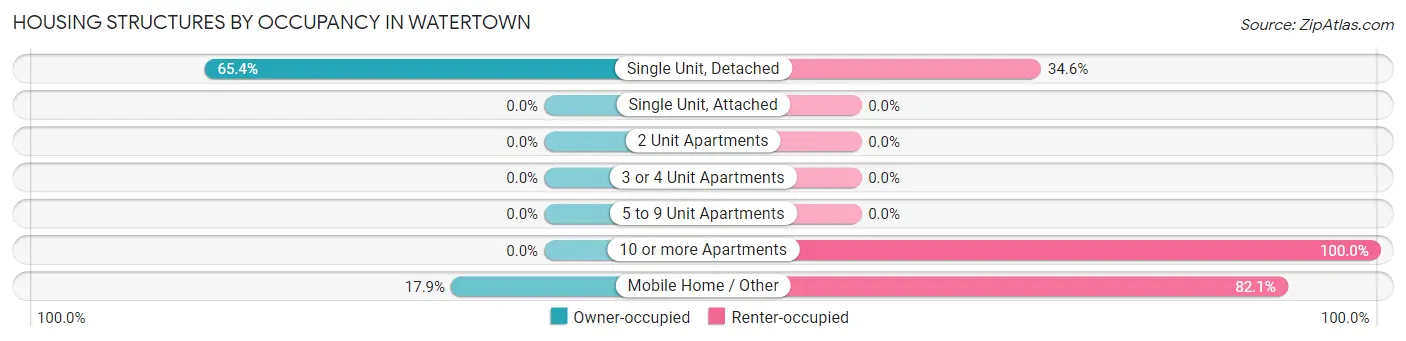
| Structure Type | Owner-occupied | Renter-occupied |
| Single Unit, Detached | 668 (65.4%) | 354 (34.6%) |
| Single Unit, Attached | 0 (0.0%) | 0 (0.0%) |
| 2 Unit Apartments | 0 (0.0%) | 0 (0.0%) |
| 3 or 4 Unit Apartments | 0 (0.0%) | 0 (0.0%) |
| 5 to 9 Unit Apartments | 0 (0.0%) | 0 (0.0%) |
| 10 or more Apartments | 0 (0.0%) | 93 (100.0%) |
| Mobile Home / Other | 52 (17.9%) | 238 (82.1%) |
| Total | 720 (51.2%) | 685 (48.7%) |
Housing Structures by Number of Rooms in Watertown
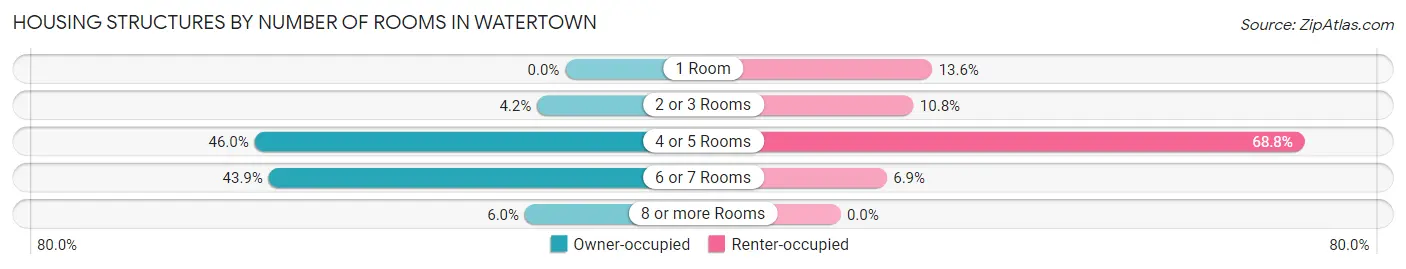
| Number of Rooms | Owner-occupied | Renter-occupied |
| 1 Room | 0 (0.0%) | 93 (13.6%) |
| 2 or 3 Rooms | 30 (4.2%) | 74 (10.8%) |
| 4 or 5 Rooms | 331 (46.0%) | 471 (68.8%) |
| 6 or 7 Rooms | 316 (43.9%) | 47 (6.9%) |
| 8 or more Rooms | 43 (6.0%) | 0 (0.0%) |
| Total | 720 (100.0%) | 685 (100.0%) |
Housing Structure by Heating Type in Watertown
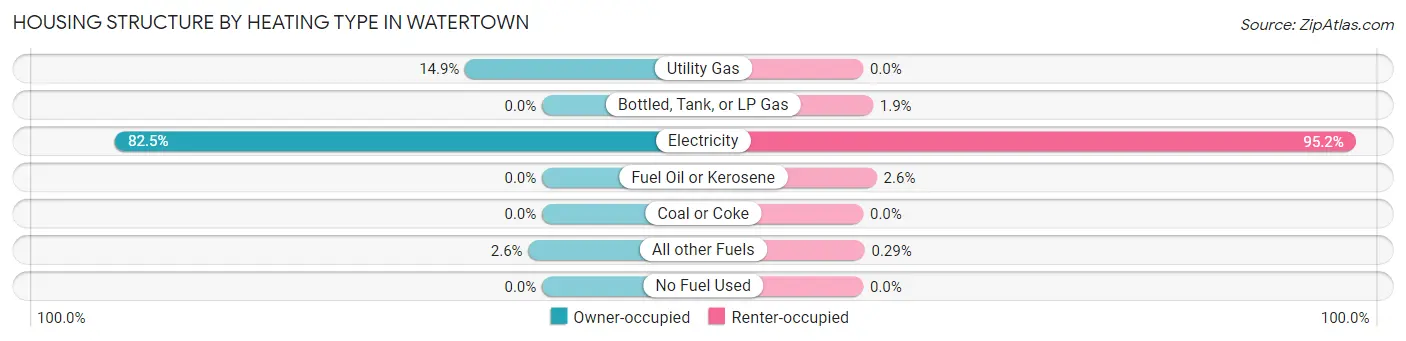
| Heating Type | Owner-occupied | Renter-occupied |
| Utility Gas | 107 (14.9%) | 0 (0.0%) |
| Bottled, Tank, or LP Gas | 0 (0.0%) | 13 (1.9%) |
| Electricity | 594 (82.5%) | 652 (95.2%) |
| Fuel Oil or Kerosene | 0 (0.0%) | 18 (2.6%) |
| Coal or Coke | 0 (0.0%) | 0 (0.0%) |
| All other Fuels | 19 (2.6%) | 2 (0.3%) |
| No Fuel Used | 0 (0.0%) | 0 (0.0%) |
| Total | 720 (100.0%) | 685 (100.0%) |
Household Vehicle Usage in Watertown
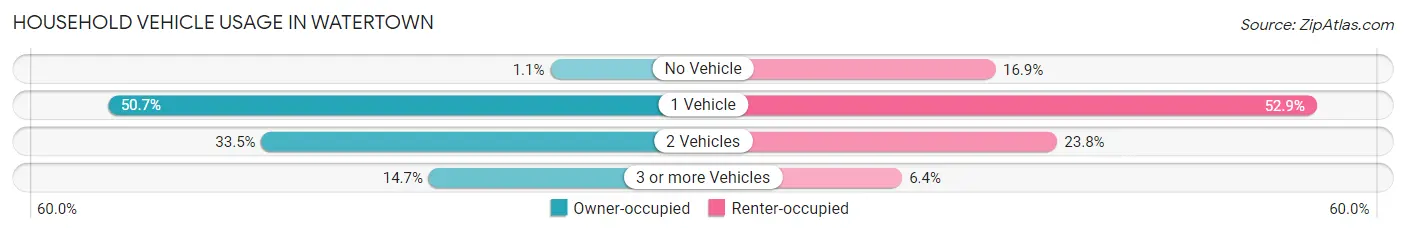
| Vehicles per Household | Owner-occupied | Renter-occupied |
| No Vehicle | 8 (1.1%) | 116 (16.9%) |
| 1 Vehicle | 365 (50.7%) | 362 (52.8%) |
| 2 Vehicles | 241 (33.5%) | 163 (23.8%) |
| 3 or more Vehicles | 106 (14.7%) | 44 (6.4%) |
| Total | 720 (100.0%) | 685 (100.0%) |
Real Estate & Mortgages in Watertown
Real Estate and Mortgage Overview in Watertown
| Characteristic | Without Mortgage | With Mortgage |
| Housing Units | 453 | 267 |
| Median Property Value | $112,400 | $121,000 |
| Median Household Income | $40,025 | $0 |
| Monthly Housing Costs | $291 | $0 |
| Real Estate Taxes | $831 | $26 |
Property Value by Mortgage Status in Watertown
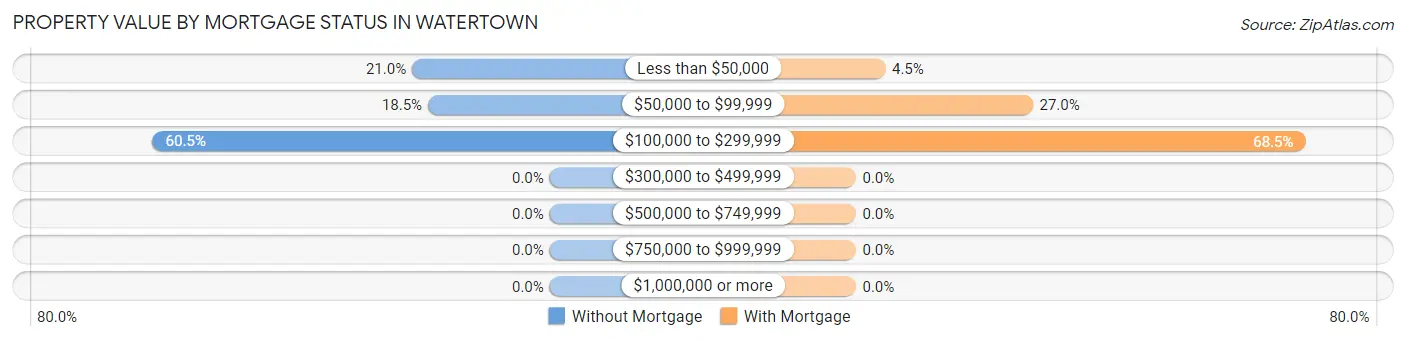
| Property Value | Without Mortgage | With Mortgage |
| Less than $50,000 | 95 (21.0%) | 12 (4.5%) |
| $50,000 to $99,999 | 84 (18.5%) | 72 (27.0%) |
| $100,000 to $299,999 | 274 (60.5%) | 183 (68.5%) |
| $300,000 to $499,999 | 0 (0.0%) | 0 (0.0%) |
| $500,000 to $749,999 | 0 (0.0%) | 0 (0.0%) |
| $750,000 to $999,999 | 0 (0.0%) | 0 (0.0%) |
| $1,000,000 or more | 0 (0.0%) | 0 (0.0%) |
| Total | 453 (100.0%) | 267 (100.0%) |
Household Income by Mortgage Status in Watertown
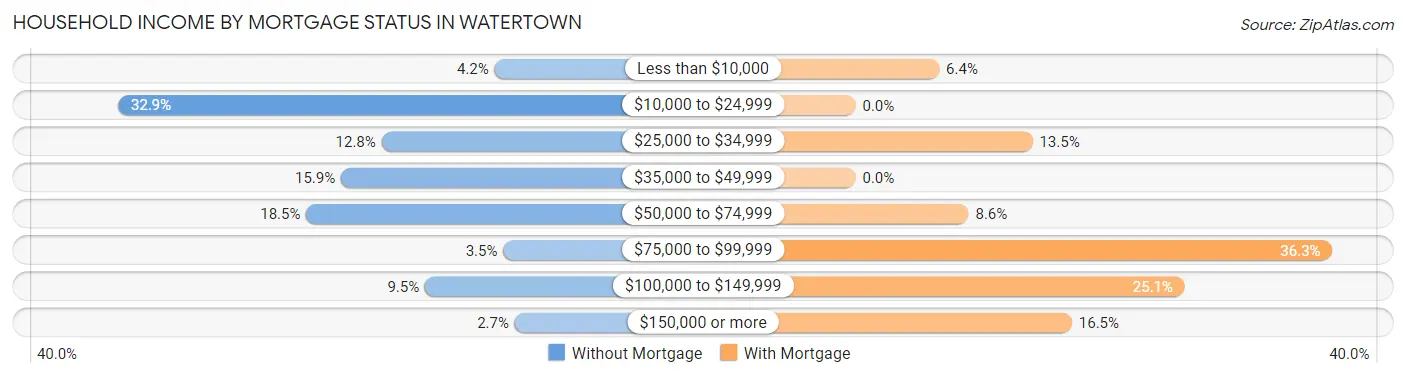
| Household Income | Without Mortgage | With Mortgage |
| Less than $10,000 | 19 (4.2%) | 17 (6.4%) |
| $10,000 to $24,999 | 149 (32.9%) | 0 (0.0%) |
| $25,000 to $34,999 | 58 (12.8%) | 36 (13.5%) |
| $35,000 to $49,999 | 72 (15.9%) | 0 (0.0%) |
| $50,000 to $74,999 | 84 (18.5%) | 23 (8.6%) |
| $75,000 to $99,999 | 16 (3.5%) | 97 (36.3%) |
| $100,000 to $149,999 | 43 (9.5%) | 67 (25.1%) |
| $150,000 or more | 12 (2.6%) | 44 (16.5%) |
| Total | 453 (100.0%) | 267 (100.0%) |
Property Value to Household Income Ratio in Watertown
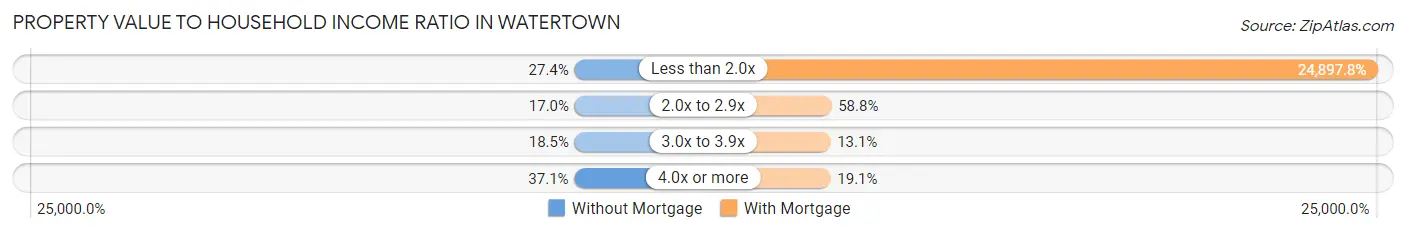
| Value-to-Income Ratio | Without Mortgage | With Mortgage |
| Less than 2.0x | 124 (27.4%) | 66,477 (24,897.7%) |
| 2.0x to 2.9x | 77 (17.0%) | 157 (58.8%) |
| 3.0x to 3.9x | 84 (18.5%) | 35 (13.1%) |
| 4.0x or more | 168 (37.1%) | 51 (19.1%) |
| Total | 453 (100.0%) | 267 (100.0%) |
Real Estate Taxes by Mortgage Status in Watertown
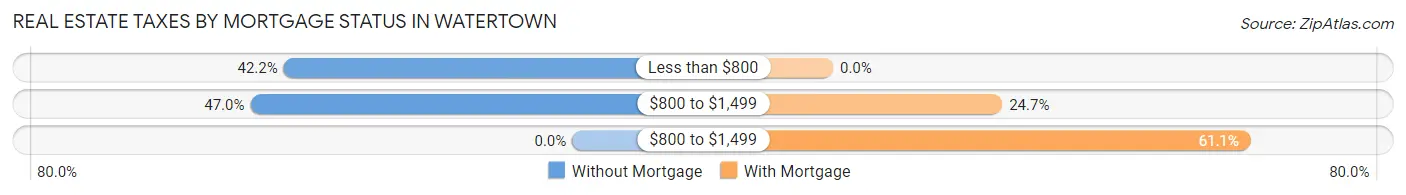
| Property Taxes | Without Mortgage | With Mortgage |
| Less than $800 | 191 (42.2%) | 0 (0.0%) |
| $800 to $1,499 | 213 (47.0%) | 66 (24.7%) |
| $800 to $1,499 | 0 (0.0%) | 163 (61.1%) |
| Total | 453 (100.0%) | 267 (100.0%) |
Health & Disability in Watertown
Health Insurance Coverage by Age in Watertown
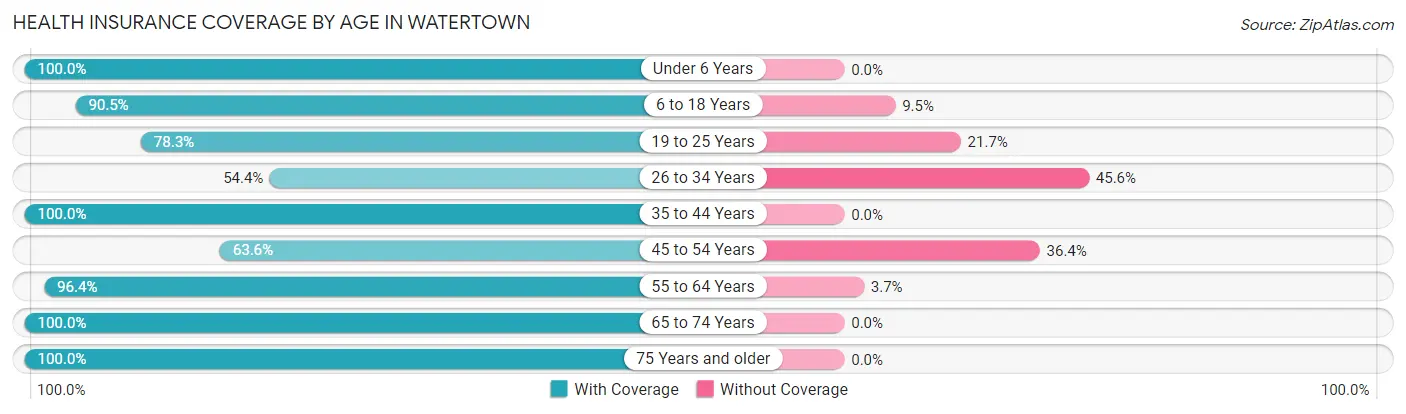
| Age Bracket | With Coverage | Without Coverage |
| Under 6 Years | 134 (100.0%) | 0 (0.0%) |
| 6 to 18 Years | 229 (90.5%) | 24 (9.5%) |
| 19 to 25 Years | 184 (78.3%) | 51 (21.7%) |
| 26 to 34 Years | 161 (54.4%) | 135 (45.6%) |
| 35 to 44 Years | 216 (100.0%) | 0 (0.0%) |
| 45 to 54 Years | 199 (63.6%) | 114 (36.4%) |
| 55 to 64 Years | 554 (96.4%) | 21 (3.6%) |
| 65 to 74 Years | 330 (100.0%) | 0 (0.0%) |
| 75 Years and older | 297 (100.0%) | 0 (0.0%) |
| Total | 2,304 (87.0%) | 345 (13.0%) |
Health Insurance Coverage by Citizenship Status in Watertown
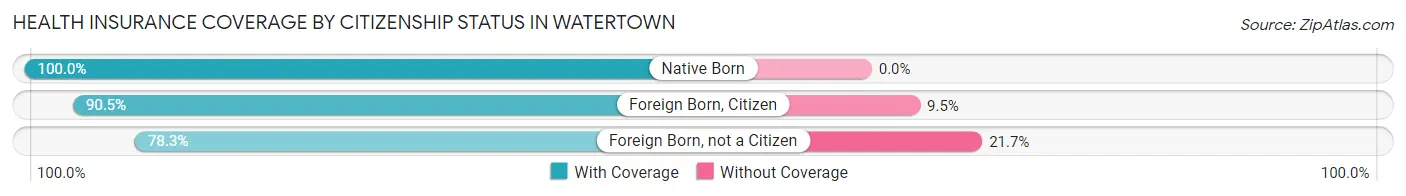
| Citizenship Status | With Coverage | Without Coverage |
| Native Born | 134 (100.0%) | 0 (0.0%) |
| Foreign Born, Citizen | 229 (90.5%) | 24 (9.5%) |
| Foreign Born, not a Citizen | 184 (78.3%) | 51 (21.7%) |
Health Insurance Coverage by Household Income in Watertown
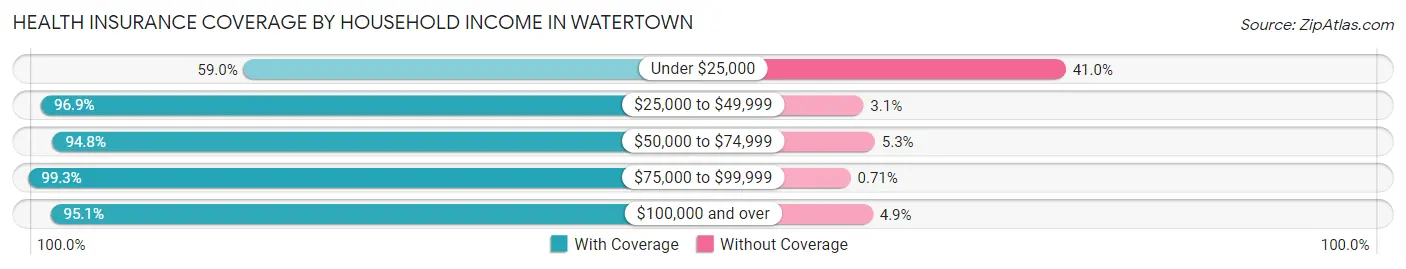
| Household Income | With Coverage | Without Coverage |
| Under $25,000 | 394 (59.0%) | 274 (41.0%) |
| $25,000 to $49,999 | 966 (96.9%) | 31 (3.1%) |
| $50,000 to $74,999 | 451 (94.8%) | 25 (5.2%) |
| $75,000 to $99,999 | 278 (99.3%) | 2 (0.7%) |
| $100,000 and over | 215 (95.1%) | 11 (4.9%) |
Public vs Private Health Insurance Coverage by Age in Watertown
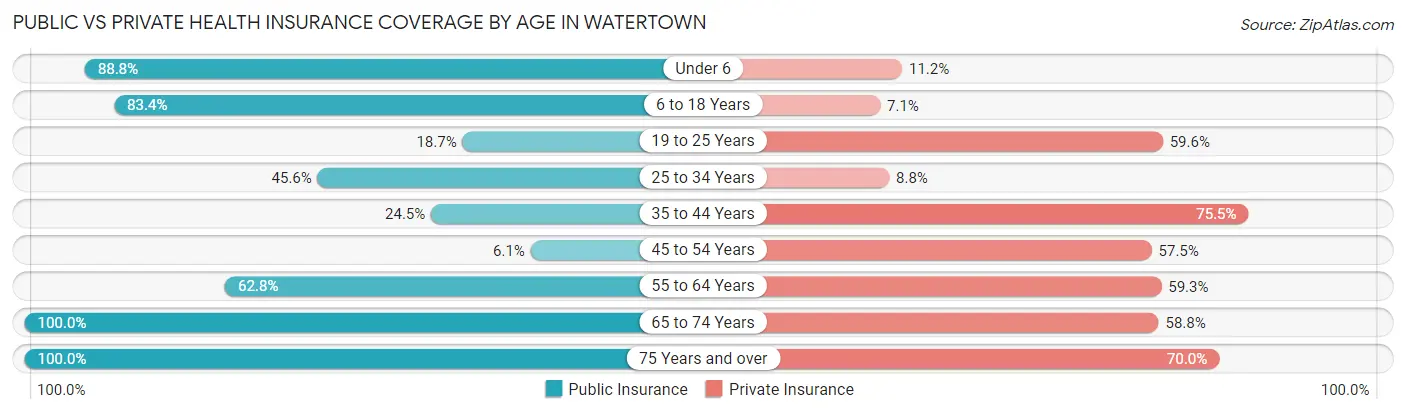
| Age Bracket | Public Insurance | Private Insurance |
| Under 6 | 119 (88.8%) | 15 (11.2%) |
| 6 to 18 Years | 211 (83.4%) | 18 (7.1%) |
| 19 to 25 Years | 44 (18.7%) | 140 (59.6%) |
| 25 to 34 Years | 135 (45.6%) | 26 (8.8%) |
| 35 to 44 Years | 53 (24.5%) | 163 (75.5%) |
| 45 to 54 Years | 19 (6.1%) | 180 (57.5%) |
| 55 to 64 Years | 361 (62.8%) | 341 (59.3%) |
| 65 to 74 Years | 330 (100.0%) | 194 (58.8%) |
| 75 Years and over | 297 (100.0%) | 208 (70.0%) |
| Total | 1,569 (59.2%) | 1,285 (48.5%) |
Disability Status by Sex by Age in Watertown
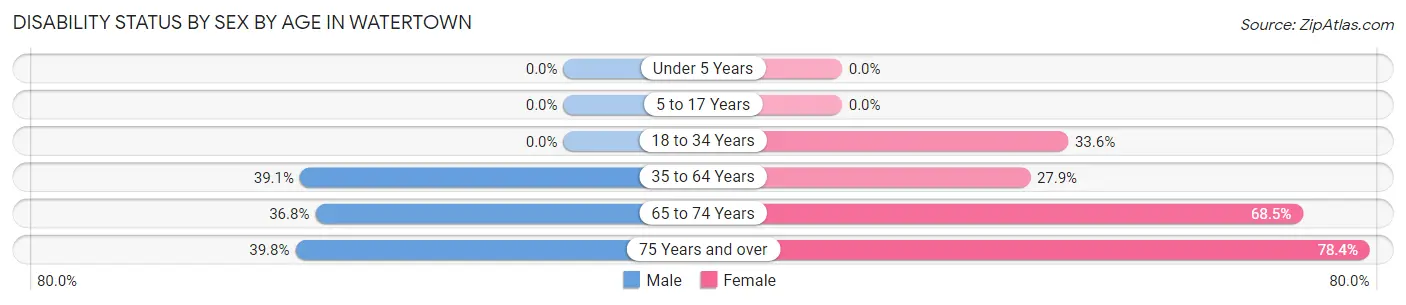
| Age Bracket | Male | Female |
| Under 5 Years | 0 (0.0%) | 0 (0.0%) |
| 5 to 17 Years | 0 (0.0%) | 0 (0.0%) |
| 18 to 34 Years | 0 (0.0%) | 87 (33.6%) |
| 35 to 64 Years | 236 (39.1%) | 140 (27.9%) |
| 65 to 74 Years | 21 (36.8%) | 187 (68.5%) |
| 75 Years and over | 39 (39.8%) | 156 (78.4%) |
Disability Class by Sex by Age in Watertown
Disability Class: Hearing Difficulty
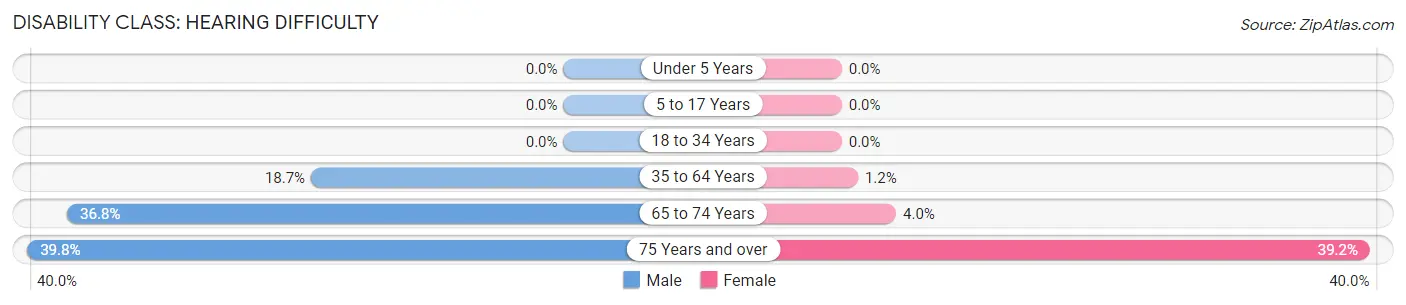
| Age Bracket | Male | Female |
| Under 5 Years | 0 (0.0%) | 0 (0.0%) |
| 5 to 17 Years | 0 (0.0%) | 0 (0.0%) |
| 18 to 34 Years | 0 (0.0%) | 0 (0.0%) |
| 35 to 64 Years | 113 (18.7%) | 6 (1.2%) |
| 65 to 74 Years | 21 (36.8%) | 11 (4.0%) |
| 75 Years and over | 39 (39.8%) | 78 (39.2%) |
Disability Class: Vision Difficulty
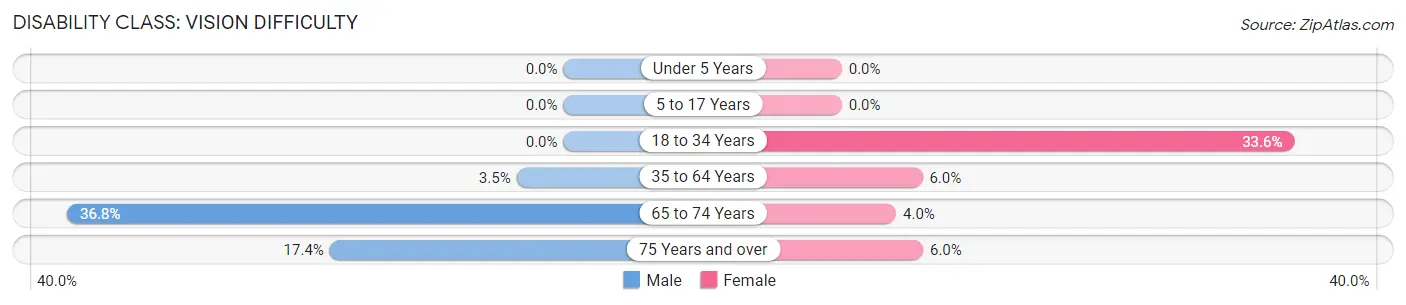
| Age Bracket | Male | Female |
| Under 5 Years | 0 (0.0%) | 0 (0.0%) |
| 5 to 17 Years | 0 (0.0%) | 0 (0.0%) |
| 18 to 34 Years | 0 (0.0%) | 87 (33.6%) |
| 35 to 64 Years | 21 (3.5%) | 30 (6.0%) |
| 65 to 74 Years | 21 (36.8%) | 11 (4.0%) |
| 75 Years and over | 17 (17.3%) | 12 (6.0%) |
Disability Class: Cognitive Difficulty
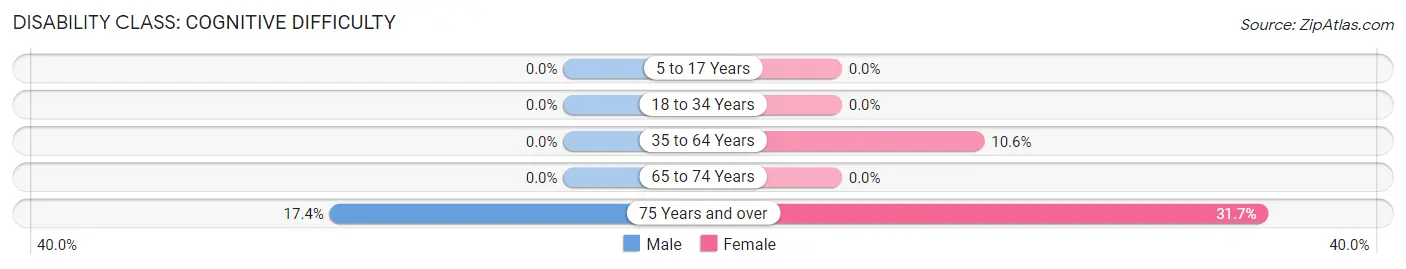
| Age Bracket | Male | Female |
| 5 to 17 Years | 0 (0.0%) | 0 (0.0%) |
| 18 to 34 Years | 0 (0.0%) | 0 (0.0%) |
| 35 to 64 Years | 0 (0.0%) | 53 (10.6%) |
| 65 to 74 Years | 0 (0.0%) | 0 (0.0%) |
| 75 Years and over | 17 (17.3%) | 63 (31.7%) |
Disability Class: Ambulatory Difficulty
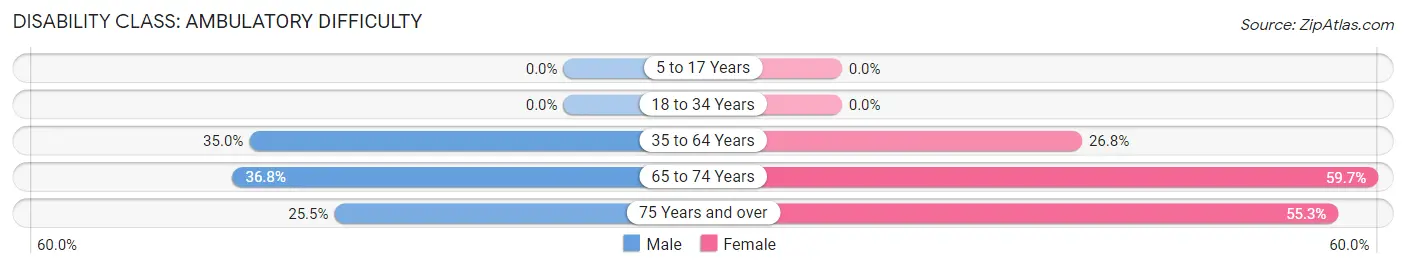
| Age Bracket | Male | Female |
| 5 to 17 Years | 0 (0.0%) | 0 (0.0%) |
| 18 to 34 Years | 0 (0.0%) | 0 (0.0%) |
| 35 to 64 Years | 211 (35.0%) | 134 (26.8%) |
| 65 to 74 Years | 21 (36.8%) | 163 (59.7%) |
| 75 Years and over | 25 (25.5%) | 110 (55.3%) |
Disability Class: Self-Care Difficulty
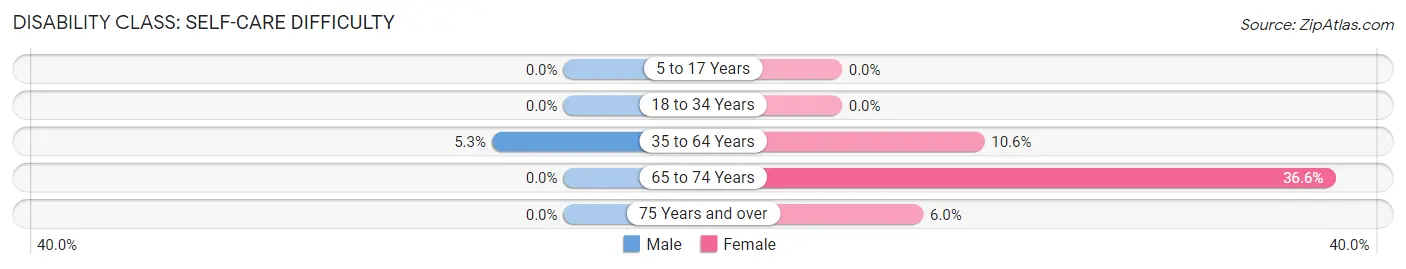
| Age Bracket | Male | Female |
| 5 to 17 Years | 0 (0.0%) | 0 (0.0%) |
| 18 to 34 Years | 0 (0.0%) | 0 (0.0%) |
| 35 to 64 Years | 32 (5.3%) | 53 (10.6%) |
| 65 to 74 Years | 0 (0.0%) | 100 (36.6%) |
| 75 Years and over | 0 (0.0%) | 12 (6.0%) |
Technology Access in Watertown
Computing Device Access in Watertown
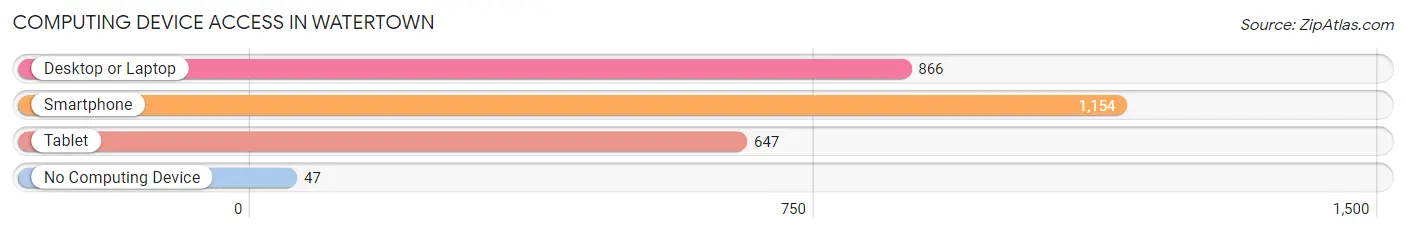
| Device Type | # Households | % Households |
| Desktop or Laptop | 866 | 61.6% |
| Smartphone | 1,154 | 82.1% |
| Tablet | 647 | 46.1% |
| No Computing Device | 47 | 3.4% |
| Total | 1,405 | 100.0% |
Internet Access in Watertown
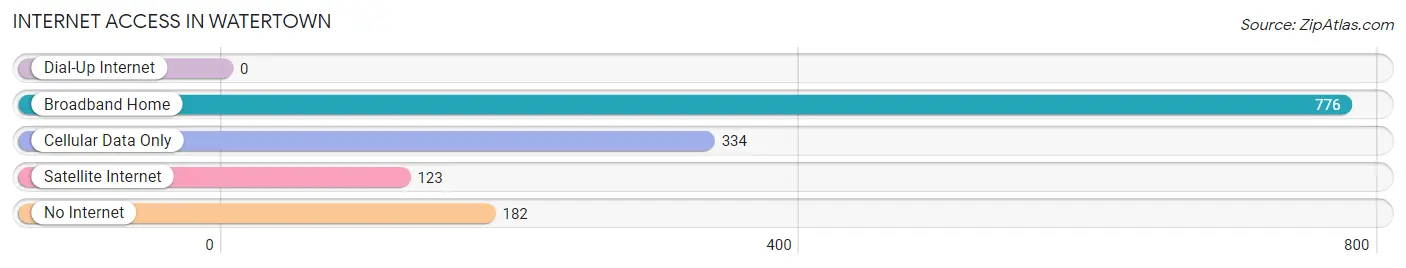
| Internet Type | # Households | % Households |
| Dial-Up Internet | 0 | 0.0% |
| Broadband Home | 776 | 55.2% |
| Cellular Data Only | 334 | 23.8% |
| Satellite Internet | 123 | 8.7% |
| No Internet | 182 | 13.0% |
| Total | 1,405 | 100.0% |
Watertown Summary
History
The town of Watertown, Florida is located in the northern part of the state, in Jackson County. It is a small, rural community with a population of just over 1,000 people. The town was founded in 1845 by a group of settlers from Georgia and Alabama. The settlers were looking for a place to settle and start a new life, and they found it in Watertown.
The town was named after the nearby Watertown Creek, which was named for the abundance of water in the area. The settlers built a small log cabin and began to farm the land. They grew cotton, corn, and other crops, and raised livestock. The town grew slowly, but steadily, and by the late 1800s, it had become a thriving community.
In the early 1900s, the town began to experience a period of growth and prosperity. The railroad came to town, bringing with it new businesses and opportunities. The town also became a popular destination for tourists, who came to enjoy the natural beauty of the area.
By the mid-1900s, Watertown had become a thriving community with a population of over 1,000 people. The town had a variety of businesses, including a bank, a hotel, a movie theater, and several stores. The town also had a school, a library, and a post office.
Geography
Watertown is located in the northern part of Florida, in Jackson County. It is situated on the banks of the Chipola River, which is a tributary of the Apalachicola River. The town is surrounded by rolling hills and lush forests, and is home to a variety of wildlife, including deer, turkey, and wild hogs.
The town is located about 30 miles from the Gulf of Mexico, and is close to several state parks, including Falling Waters State Park and Florida Caverns State Park. The town is also close to the Apalachicola National Forest, which is the largest national forest in the state.
Economy
The economy of Watertown is largely based on agriculture and tourism. The town is home to several farms, which produce a variety of crops, including cotton, corn, and soybeans. The town is also home to several tourist attractions, including the Falling Waters State Park and the Florida Caverns State Park.
The town also has a variety of businesses, including a bank, a hotel, a movie theater, and several stores. The town also has a school, a library, and a post office.
Demographics
As of the 2010 census, the population of Watertown was 1,072. The racial makeup of the town was 94.3% White, 2.7% African American, 0.3% Native American, 0.2% Asian, 0.1% Pacific Islander, 0.7% from other races, and 1.7% from two or more races. Hispanic or Latino of any race were 2.2% of the population.
The median income for a household in the town was $30,000, and the median income for a family was $35,000. The per capita income for the town was $14,000. About 17.3% of families and 20.2% of the population were below the poverty line, including 28.3% of those under age 18 and 11.7% of those age 65 or over.
Common Questions
What is Per Capita Income in Watertown?
Per Capita income in Watertown is $24,034.
What is the Median Family Income in Watertown?
Median Family Income in Watertown is $45,313.
What is the Median Household income in Watertown?
Median Household Income in Watertown is $41,303.
What is Income or Wage Gap in Watertown?
Income or Wage Gap in Watertown is 5.1%.
Women in Watertown earn 94.9 cents for every dollar earned by a man.
What is Inequality or Gini Index in Watertown?
Inequality or Gini Index in Watertown is 0.39.
What is the Total Population of Watertown?
Total Population of Watertown is 2,657.
What is the Total Male Population of Watertown?
Total Male Population of Watertown is 1,119.
What is the Total Female Population of Watertown?
Total Female Population of Watertown is 1,538.
What is the Ratio of Males per 100 Females in Watertown?
There are 72.76 Males per 100 Females in Watertown.
What is the Ratio of Females per 100 Males in Watertown?
There are 137.44 Females per 100 Males in Watertown.
What is the Median Population Age in Watertown?
Median Population Age in Watertown is 49.6 Years.
What is the Average Family Size in Watertown
Average Family Size in Watertown is 2.9 People.
What is the Average Household Size in Watertown
Average Household Size in Watertown is 1.9 People.
How Large is the Labor Force in Watertown?
There are 1,068 People in the Labor Forcein in Watertown.
What is the Percentage of People in the Labor Force in Watertown?
46.0% of People are in the Labor Force in Watertown.
What is the Unemployment Rate in Watertown?
Unemployment Rate in Watertown is 19.6%.