Wahneta, FL Map & Demographics
Wahneta Map
Wahneta Overview
$14,046
PER CAPITA INCOME
$41,953
AVG FAMILY INCOME
$45,392
AVG HOUSEHOLD INCOME
32.3%
WAGE / INCOME GAP [ % ]
67.7¢/ $1
WAGE / INCOME GAP [ $ ]
$13,102
FAMILY INCOME DEFICIT
0.35
INEQUALITY / GINI INDEX
4,406
TOTAL POPULATION
2,104
MALE POPULATION
2,302
FEMALE POPULATION
91.40
MALES / 100 FEMALES
109.41
FEMALES / 100 MALES
31.5
MEDIAN AGE
4.1
AVG FAMILY SIZE
3.5
AVG HOUSEHOLD SIZE
1,685
LABOR FORCE [ PEOPLE ]
53.1%
PERCENT IN LABOR FORCE
4.3%
UNEMPLOYMENT RATE
Income in Wahneta
Income Overview in Wahneta
Per Capita Income in Wahneta is $14,046, while median incomes of families and households are $41,953 and $45,392 respectively.
| Characteristic | Number | Measure |
| Per Capita Income | 4,406 | $14,046 |
| Median Family Income | 946 | $41,953 |
| Mean Family Income | 946 | $44,604 |
| Median Household Income | 1,250 | $45,392 |
| Mean Household Income | 1,250 | $45,451 |
| Income Deficit | 946 | $13,102 |
| Wage / Income Gap (%) | 4,406 | 32.34% |
| Wage / Income Gap ($) | 4,406 | 67.66¢ per $1 |
| Gini / Inequality Index | 4,406 | 0.35 |
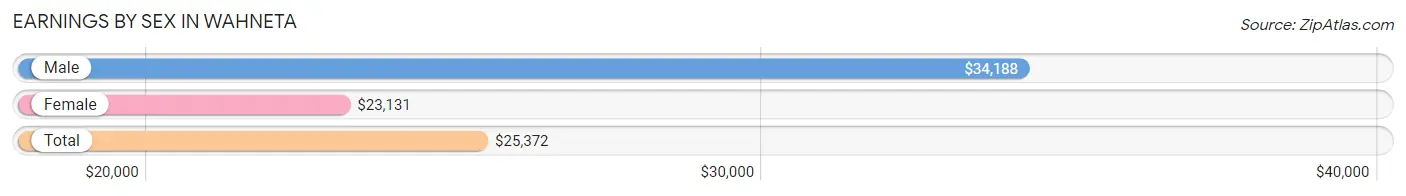
Earnings by Sex in Wahneta
Average Earnings in Wahneta are $25,372, $34,188 for men and $23,131 for women, a difference of 32.3%.
| Sex | Number | Average Earnings |
| Male | 929 (53.3%) | $34,188 |
| Female | 814 (46.7%) | $23,131 |
| Total | 1,743 (100.0%) | $25,372 |
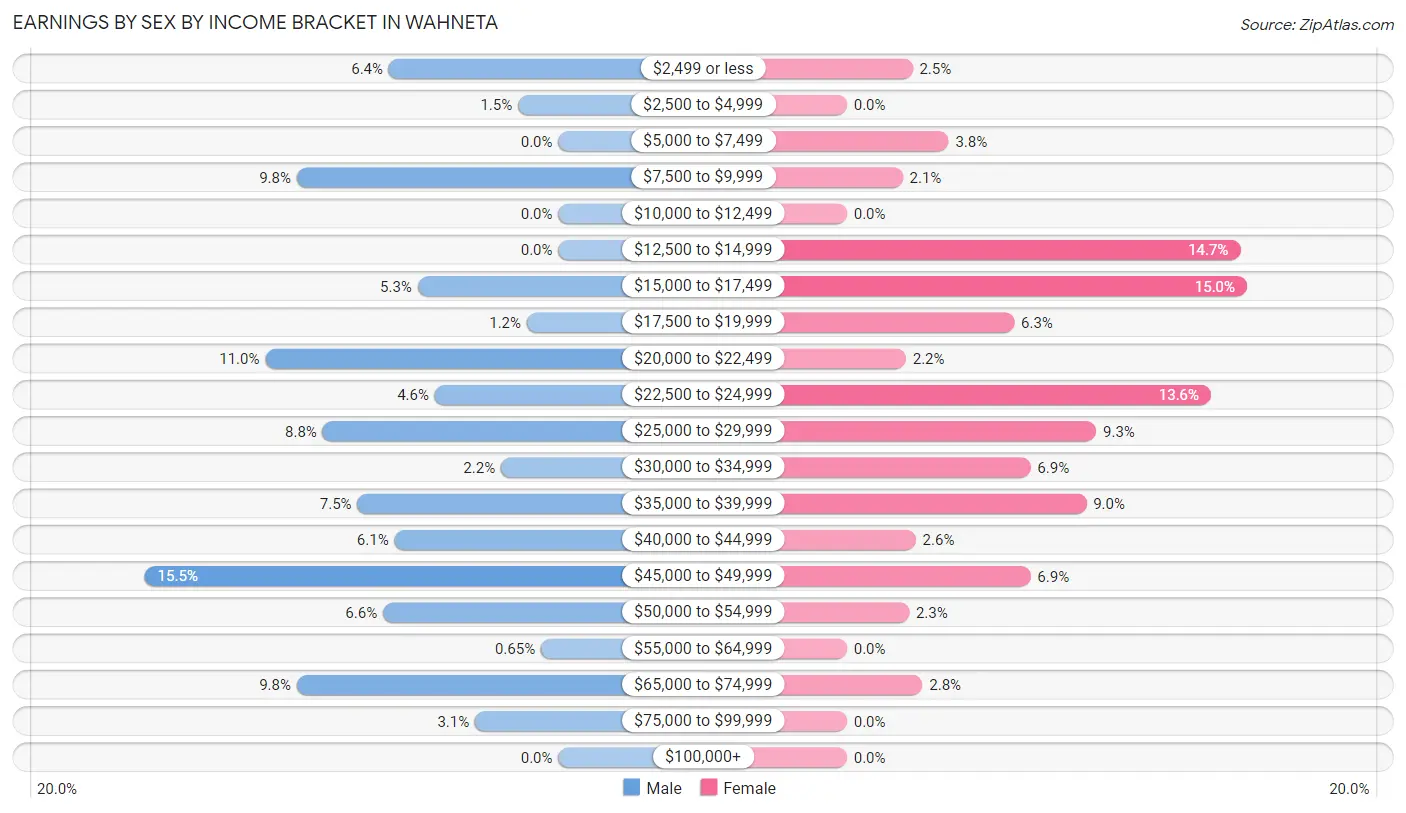
Earnings by Sex by Income Bracket in Wahneta
The most common earnings brackets in Wahneta are $45,000 to $49,999 for men (144 | 15.5%) and $15,000 to $17,499 for women (122 | 15.0%).
| Income | Male | Female |
| $2,499 or less | 59 (6.4%) | 20 (2.5%) |
| $2,500 to $4,999 | 14 (1.5%) | 0 (0.0%) |
| $5,000 to $7,499 | 0 (0.0%) | 31 (3.8%) |
| $7,500 to $9,999 | 91 (9.8%) | 17 (2.1%) |
| $10,000 to $12,499 | 0 (0.0%) | 0 (0.0%) |
| $12,500 to $14,999 | 0 (0.0%) | 120 (14.7%) |
| $15,000 to $17,499 | 49 (5.3%) | 122 (15.0%) |
| $17,500 to $19,999 | 11 (1.2%) | 51 (6.3%) |
| $20,000 to $22,499 | 102 (11.0%) | 18 (2.2%) |
| $22,500 to $24,999 | 43 (4.6%) | 111 (13.6%) |
| $25,000 to $29,999 | 82 (8.8%) | 76 (9.3%) |
| $30,000 to $34,999 | 20 (2.1%) | 56 (6.9%) |
| $35,000 to $39,999 | 70 (7.5%) | 73 (9.0%) |
| $40,000 to $44,999 | 57 (6.1%) | 21 (2.6%) |
| $45,000 to $49,999 | 144 (15.5%) | 56 (6.9%) |
| $50,000 to $54,999 | 61 (6.6%) | 19 (2.3%) |
| $55,000 to $64,999 | 6 (0.6%) | 0 (0.0%) |
| $65,000 to $74,999 | 91 (9.8%) | 23 (2.8%) |
| $75,000 to $99,999 | 29 (3.1%) | 0 (0.0%) |
| $100,000+ | 0 (0.0%) | 0 (0.0%) |
| Total | 929 (100.0%) | 814 (100.0%) |
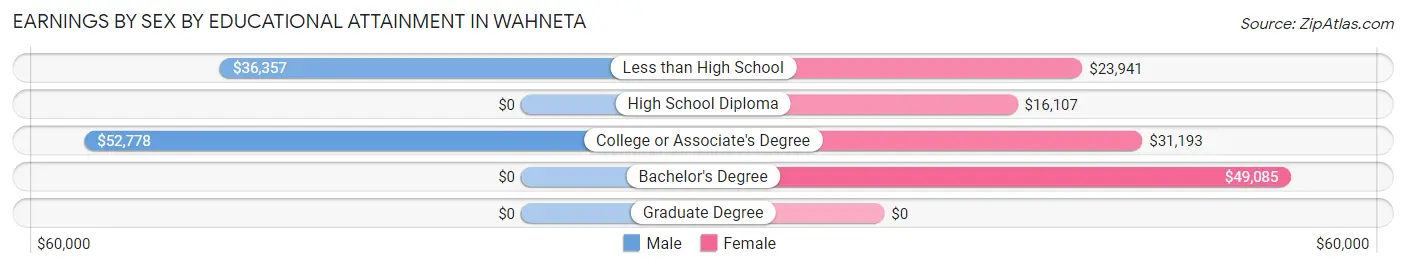
Earnings by Sex by Educational Attainment in Wahneta
Average earnings in Wahneta are $36,018 for men and $23,243 for women, a difference of 35.5%. Men with an educational attainment of college or associate's degree enjoy the highest average annual earnings of $52,778, while those with less than high school education earn the least with $36,357. Women with an educational attainment of bachelor's degree earn the most with the average annual earnings of $49,085, while those with high school diploma education have the smallest earnings of $16,107.
| Educational Attainment | Male Income | Female Income |
| Less than High School | $36,357 | $23,941 |
| High School Diploma | - | - |
| College or Associate's Degree | $52,778 | $31,193 |
| Bachelor's Degree | - | - |
| Graduate Degree | - | - |
| Total | $36,018 | $23,243 |
Family Income in Wahneta
Family Income Brackets in Wahneta
According to the Wahneta family income data, there are 262 families falling into the $15,000 to $24,999 income range, which is the most common income bracket and makes up 27.7% of all families.
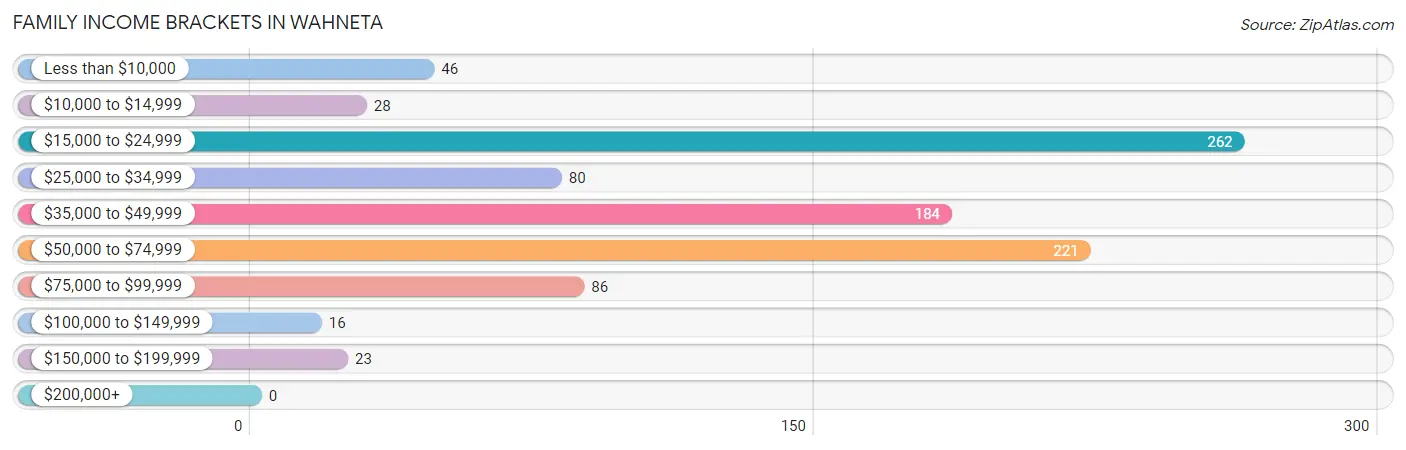
| Income Bracket | # Families | % Families |
| Less than $10,000 | 46 | 4.9% |
| $10,000 to $14,999 | 28 | 3.0% |
| $15,000 to $24,999 | 262 | 27.7% |
| $25,000 to $34,999 | 80 | 8.5% |
| $35,000 to $49,999 | 184 | 19.5% |
| $50,000 to $74,999 | 221 | 23.4% |
| $75,000 to $99,999 | 86 | 9.1% |
| $100,000 to $149,999 | 16 | 1.7% |
| $150,000 to $199,999 | 23 | 2.4% |
| $200,000+ | 0 | 0.0% |
Family Income by Famaliy Size in Wahneta
4-person families (284 | 30.0%) account for the highest median family income in Wahneta with $50,429 per family, while 2-person families (252 | 26.6%) have the highest median income of $20,196 per family member.
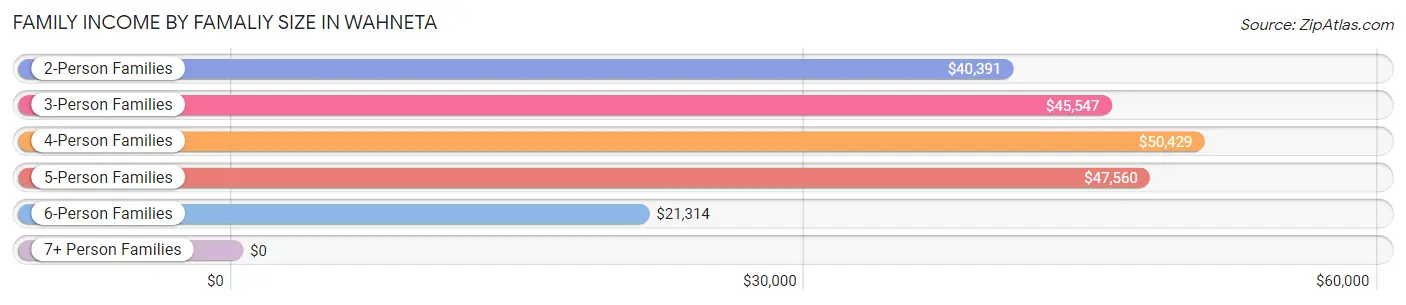
| Income Bracket | # Families | Median Income |
| 2-Person Families | 252 (26.6%) | $40,391 |
| 3-Person Families | 108 (11.4%) | $45,547 |
| 4-Person Families | 284 (30.0%) | $50,429 |
| 5-Person Families | 77 (8.1%) | $47,560 |
| 6-Person Families | 166 (17.5%) | $21,314 |
| 7+ Person Families | 59 (6.2%) | $0 |
| Total | 946 (100.0%) | $41,953 |
Family Income by Number of Earners in Wahneta
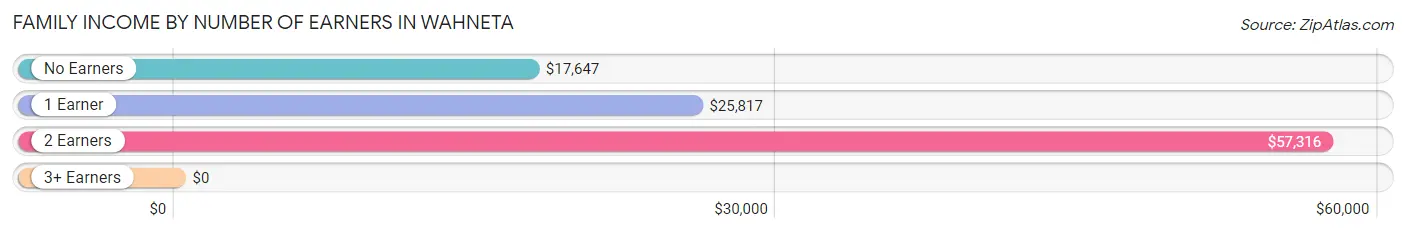
| Number of Earners | # Families | Median Income |
| No Earners | 124 (13.1%) | $17,647 |
| 1 Earner | 481 (50.8%) | $25,817 |
| 2 Earners | 237 (25.1%) | $57,316 |
| 3+ Earners | 104 (11.0%) | $0 |
| Total | 946 (100.0%) | $41,953 |
Household Income in Wahneta
Household Income Brackets in Wahneta
With 392 households falling in the category, the $50,000 to $74,999 income range is the most frequent in Wahneta, accounting for 31.4% of all households.
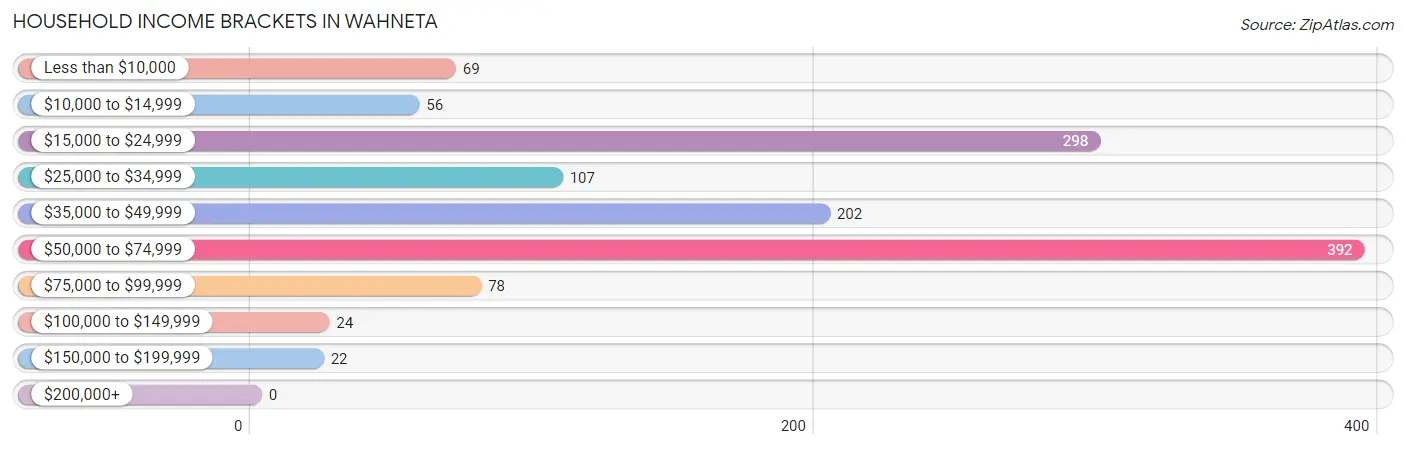
| Income Bracket | # Households | % Households |
| Less than $10,000 | 69 | 5.5% |
| $10,000 to $14,999 | 56 | 4.5% |
| $15,000 to $24,999 | 298 | 23.8% |
| $25,000 to $34,999 | 107 | 8.6% |
| $35,000 to $49,999 | 202 | 16.2% |
| $50,000 to $74,999 | 392 | 31.4% |
| $75,000 to $99,999 | 78 | 6.2% |
| $100,000 to $149,999 | 24 | 1.9% |
| $150,000 to $199,999 | 22 | 1.8% |
| $200,000+ | 0 | 0.0% |
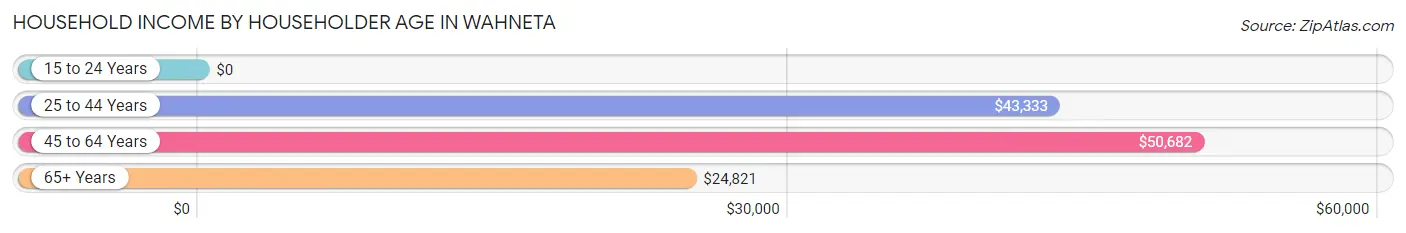
Household Income by Householder Age in Wahneta
The median household income in Wahneta is $45,392, with the highest median household income of $50,682 found in the 45 to 64 years age bracket for the primary householder. A total of 464 households (37.1%) fall into this category.
| Income Bracket | # Households | Median Income |
| 15 to 24 Years | 0 (0.0%) | $0 |
| 25 to 44 Years | 536 (42.9%) | $43,333 |
| 45 to 64 Years | 464 (37.1%) | $50,682 |
| 65+ Years | 250 (20.0%) | $24,821 |
| Total | 1,250 (100.0%) | $45,392 |
Poverty in Wahneta
Income Below Poverty by Sex and Age in Wahneta
With 42.6% poverty level for males and 33.6% for females among the residents of Wahneta, 5 year old males and 65 to 74 year old females are the most vulnerable to poverty, with 53 males (100.0%) and 86 females (76.1%) in their respective age groups living below the poverty level.
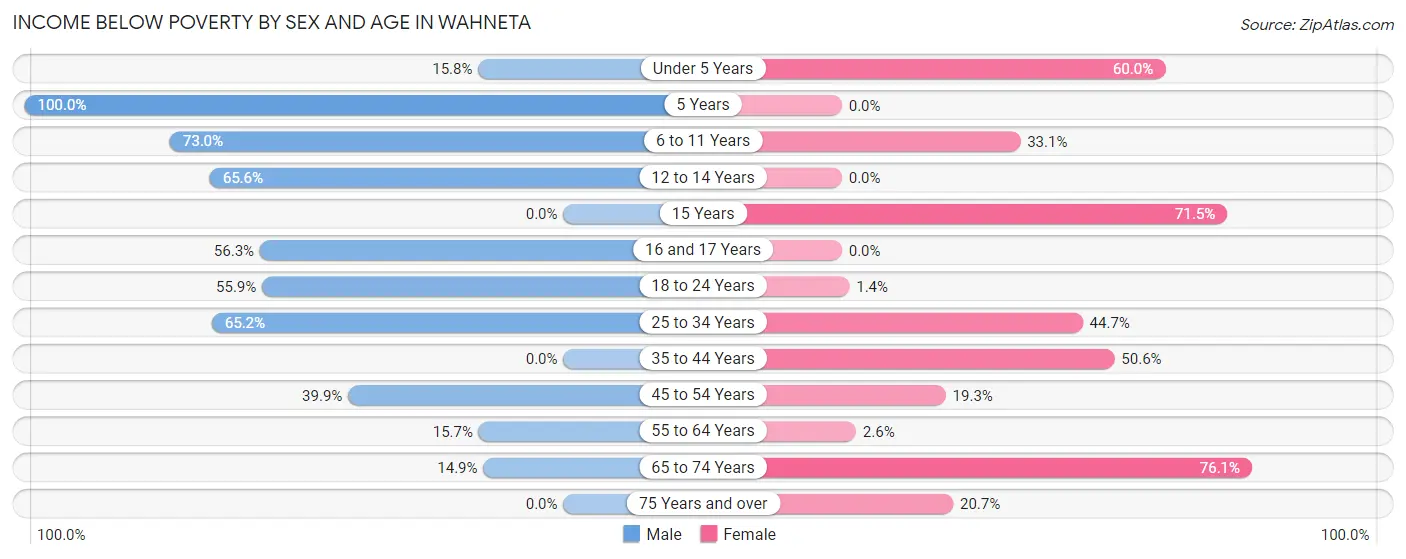
| Age Bracket | Male | Female |
| Under 5 Years | 6 (15.8%) | 111 (60.0%) |
| 5 Years | 53 (100.0%) | 0 (0.0%) |
| 6 to 11 Years | 260 (73.0%) | 52 (33.1%) |
| 12 to 14 Years | 84 (65.6%) | 0 (0.0%) |
| 15 Years | 0 (0.0%) | 118 (71.5%) |
| 16 and 17 Years | 98 (56.3%) | 0 (0.0%) |
| 18 to 24 Years | 85 (55.9%) | 3 (1.4%) |
| 25 to 34 Years | 137 (65.2%) | 148 (44.7%) |
| 35 to 44 Years | 0 (0.0%) | 168 (50.6%) |
| 45 to 54 Years | 125 (39.9%) | 64 (19.3%) |
| 55 to 64 Years | 19 (15.7%) | 5 (2.6%) |
| 65 to 74 Years | 30 (14.8%) | 86 (76.1%) |
| 75 Years and over | 0 (0.0%) | 19 (20.6%) |
| Total | 897 (42.6%) | 774 (33.6%) |
Income Above Poverty by Sex and Age in Wahneta
According to the poverty statistics in Wahneta, males aged 15 years and females aged 12 to 14 years are the age groups that are most secure financially, with 100.0% of males and 100.0% of females in these age groups living above the poverty line.
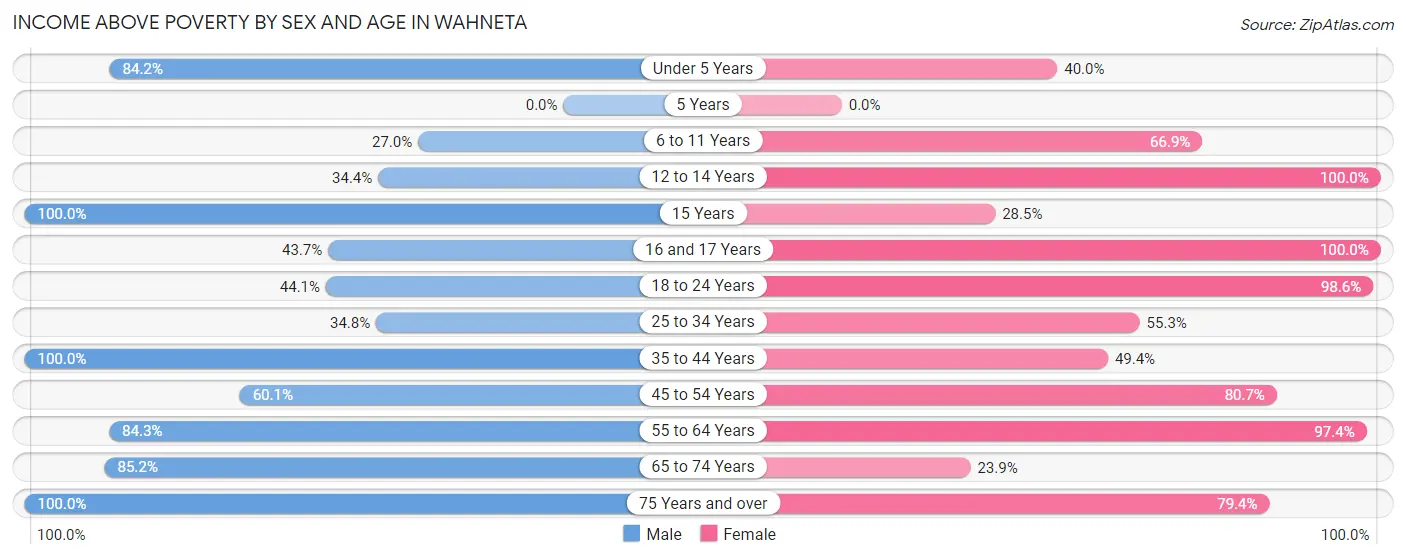
| Age Bracket | Male | Female |
| Under 5 Years | 32 (84.2%) | 74 (40.0%) |
| 5 Years | 0 (0.0%) | 0 (0.0%) |
| 6 to 11 Years | 96 (27.0%) | 105 (66.9%) |
| 12 to 14 Years | 44 (34.4%) | 83 (100.0%) |
| 15 Years | 68 (100.0%) | 47 (28.5%) |
| 16 and 17 Years | 76 (43.7%) | 105 (100.0%) |
| 18 to 24 Years | 67 (44.1%) | 213 (98.6%) |
| 25 to 34 Years | 73 (34.8%) | 183 (55.3%) |
| 35 to 44 Years | 284 (100.0%) | 164 (49.4%) |
| 45 to 54 Years | 188 (60.1%) | 268 (80.7%) |
| 55 to 64 Years | 102 (84.3%) | 186 (97.4%) |
| 65 to 74 Years | 172 (85.2%) | 27 (23.9%) |
| 75 Years and over | 5 (100.0%) | 73 (79.3%) |
| Total | 1,207 (57.4%) | 1,528 (66.4%) |
Income Below Poverty Among Married-Couple Families in Wahneta
The poverty statistics for married-couple families in Wahneta show that 29.4% or 154 of the total 524 families live below the poverty line. Families with 1 or 2 children have the highest poverty rate of 40.0%, comprising of 70 families. On the other hand, families with no children have the lowest poverty rate of 11.5%, which includes 20 families.
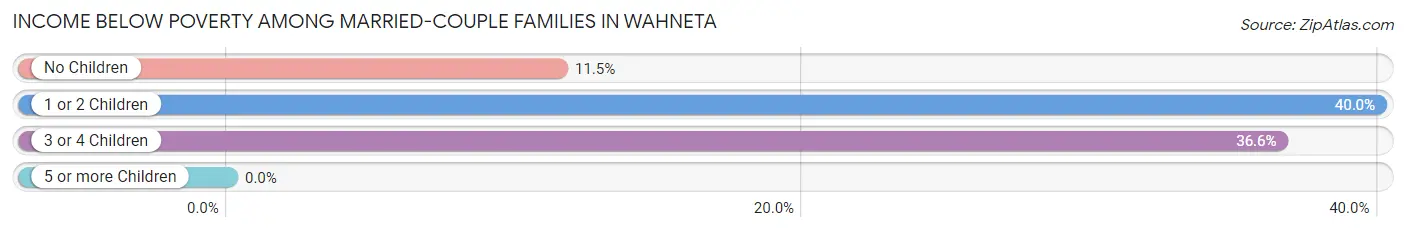
| Children | Above Poverty | Below Poverty |
| No Children | 154 (88.5%) | 20 (11.5%) |
| 1 or 2 Children | 105 (60.0%) | 70 (40.0%) |
| 3 or 4 Children | 111 (63.4%) | 64 (36.6%) |
| 5 or more Children | 0 (0.0%) | 0 (0.0%) |
| Total | 370 (70.6%) | 154 (29.4%) |
Income Below Poverty Among Single-Parent Households in Wahneta
According to the poverty data in Wahneta, 49.5% or 53 single-father households and 39.1% or 123 single-mother households are living below the poverty line. Among single-father households, those with 5 or more children have the highest poverty rate, with 21 households (100.0%) experiencing poverty. Likewise, among single-mother households, those with 3 or 4 children have the highest poverty rate, with 95 households (66.9%) falling below the poverty line.
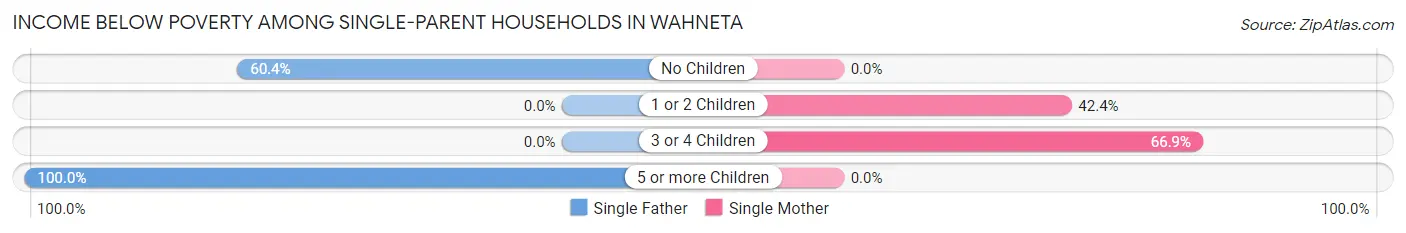
| Children | Single Father | Single Mother |
| No Children | 32 (60.4%) | 0 (0.0%) |
| 1 or 2 Children | 0 (0.0%) | 28 (42.4%) |
| 3 or 4 Children | 0 (0.0%) | 95 (66.9%) |
| 5 or more Children | 21 (100.0%) | 0 (0.0%) |
| Total | 53 (49.5%) | 123 (39.1%) |
Income Below Poverty Among Married-Couple vs Single-Parent Households in Wahneta
The poverty data for Wahneta shows that 154 of the married-couple family households (29.4%) and 176 of the single-parent households (41.7%) are living below the poverty level. Within the married-couple family households, those with 1 or 2 children have the highest poverty rate, with 70 households (40.0%) falling below the poverty line. Among the single-parent households, those with 5 or more children have the highest poverty rate, with 21 household (100.0%) living below poverty.
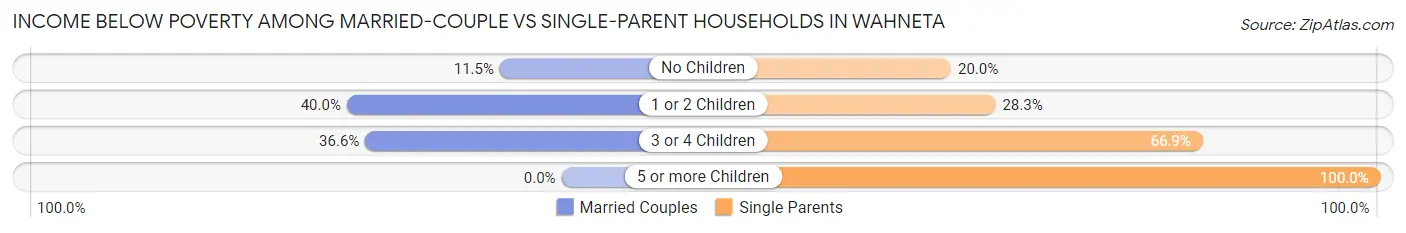
| Children | Married-Couple Families | Single-Parent Households |
| No Children | 20 (11.5%) | 32 (20.0%) |
| 1 or 2 Children | 70 (40.0%) | 28 (28.3%) |
| 3 or 4 Children | 64 (36.6%) | 95 (66.9%) |
| 5 or more Children | 0 (0.0%) | 21 (100.0%) |
| Total | 154 (29.4%) | 176 (41.7%) |
Race in Wahneta
The most populous races in Wahneta are White / Caucasian (3,029 | 68.8%), Hispanic or Latino (2,969 | 67.4%), and Some other Race (1,001 | 22.7%).
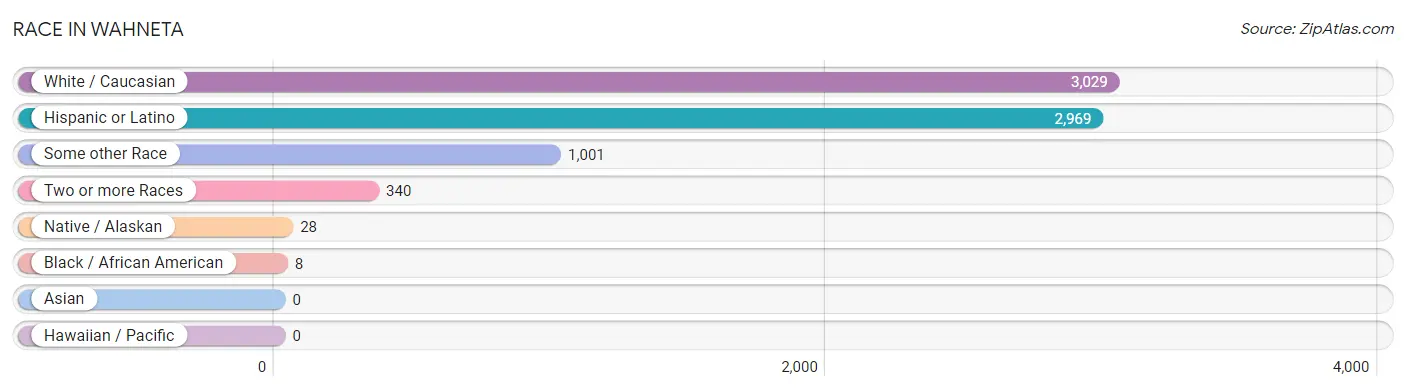
| Race | # Population | % Population |
| Asian | 0 | 0.0% |
| Black / African American | 8 | 0.2% |
| Hawaiian / Pacific | 0 | 0.0% |
| Hispanic or Latino | 2,969 | 67.4% |
| Native / Alaskan | 28 | 0.6% |
| White / Caucasian | 3,029 | 68.8% |
| Two or more Races | 340 | 7.7% |
| Some other Race | 1,001 | 22.7% |
| Total | 4,406 | 100.0% |
Ancestry in Wahneta
The most populous ancestries reported in Wahneta are Mexican (2,664 | 60.5%), American (607 | 13.8%), English (210 | 4.8%), Irish (183 | 4.2%), and Puerto Rican (147 | 3.3%), together accounting for 86.5% of all Wahneta residents.
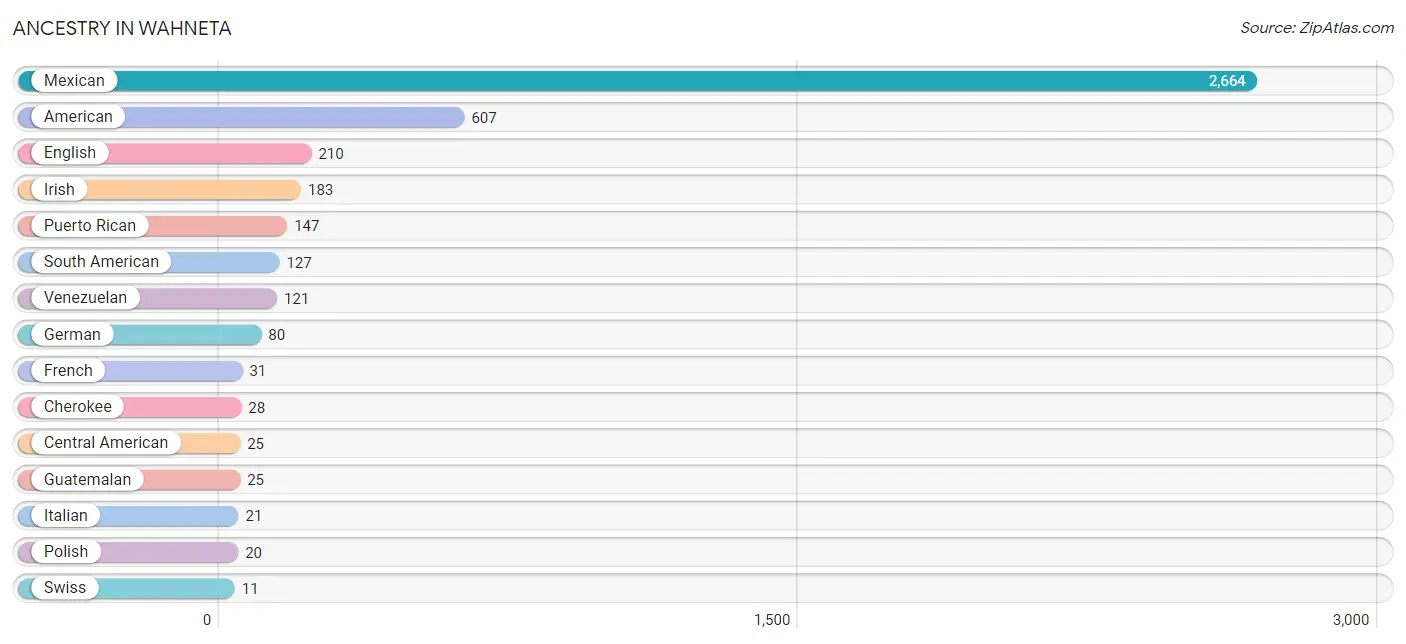
| Ancestry | # Population | % Population |
| American | 607 | 13.8% |
| Arab | 8 | 0.2% |
| Central American | 25 | 0.6% |
| Cherokee | 28 | 0.6% |
| Ecuadorian | 6 | 0.1% |
| English | 210 | 4.8% |
| European | 6 | 0.1% |
| French | 31 | 0.7% |
| German | 80 | 1.8% |
| Guatemalan | 25 | 0.6% |
| Irish | 183 | 4.2% |
| Italian | 21 | 0.5% |
| Mexican | 2,664 | 60.5% |
| Polish | 20 | 0.4% |
| Puerto Rican | 147 | 3.3% |
| Scandinavian | 6 | 0.1% |
| South American | 127 | 2.9% |
| Swiss | 11 | 0.3% |
| Venezuelan | 121 | 2.8% | View All 19 Rows |
Immigrants in Wahneta
The most numerous immigrant groups reported in Wahneta came from Latin America (935 | 21.2%), Central America (864 | 19.6%), Mexico (839 | 19.0%), South America (71 | 1.6%), and Venezuela (65 | 1.5%), together accounting for 63.0% of all Wahneta residents.
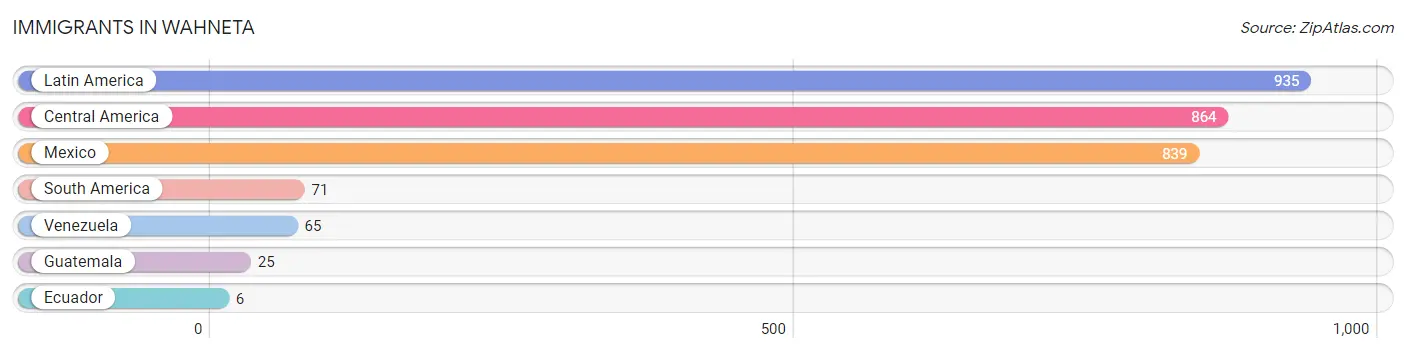
| Immigration Origin | # Population | % Population |
| Central America | 864 | 19.6% |
| Ecuador | 6 | 0.1% |
| Guatemala | 25 | 0.6% |
| Latin America | 935 | 21.2% |
| Mexico | 839 | 19.0% |
| South America | 71 | 1.6% |
| Venezuela | 65 | 1.5% | View All 7 Rows |
Sex and Age in Wahneta
Sex and Age in Wahneta
The most populous age groups in Wahneta are 15 to 19 Years (353 | 16.8%) for men and 15 to 19 Years (395 | 17.2%) for women.
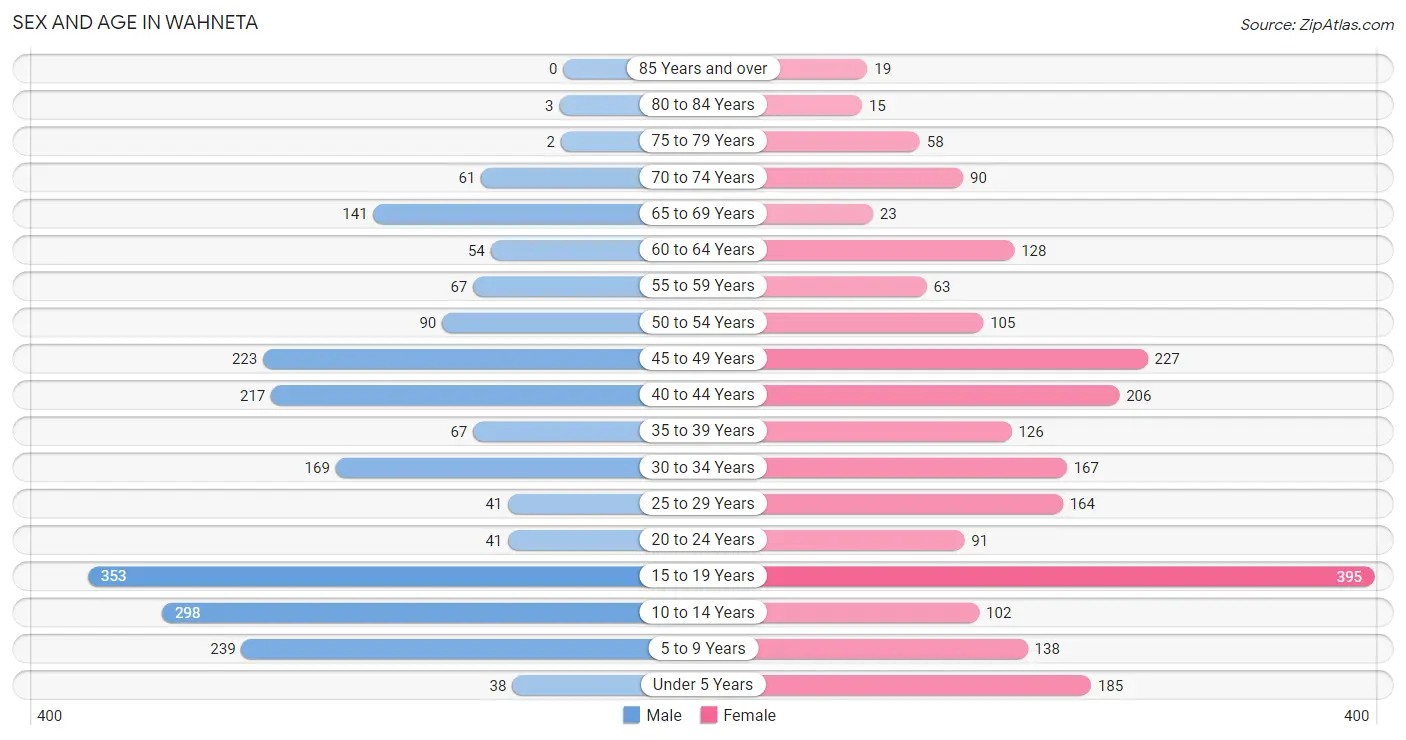
| Age Bracket | Male | Female |
| Under 5 Years | 38 (1.8%) | 185 (8.0%) |
| 5 to 9 Years | 239 (11.4%) | 138 (6.0%) |
| 10 to 14 Years | 298 (14.2%) | 102 (4.4%) |
| 15 to 19 Years | 353 (16.8%) | 395 (17.2%) |
| 20 to 24 Years | 41 (1.9%) | 91 (4.0%) |
| 25 to 29 Years | 41 (1.9%) | 164 (7.1%) |
| 30 to 34 Years | 169 (8.0%) | 167 (7.2%) |
| 35 to 39 Years | 67 (3.2%) | 126 (5.5%) |
| 40 to 44 Years | 217 (10.3%) | 206 (8.9%) |
| 45 to 49 Years | 223 (10.6%) | 227 (9.9%) |
| 50 to 54 Years | 90 (4.3%) | 105 (4.6%) |
| 55 to 59 Years | 67 (3.2%) | 63 (2.7%) |
| 60 to 64 Years | 54 (2.6%) | 128 (5.6%) |
| 65 to 69 Years | 141 (6.7%) | 23 (1.0%) |
| 70 to 74 Years | 61 (2.9%) | 90 (3.9%) |
| 75 to 79 Years | 2 (0.1%) | 58 (2.5%) |
| 80 to 84 Years | 3 (0.1%) | 15 (0.6%) |
| 85 Years and over | 0 (0.0%) | 19 (0.8%) |
| Total | 2,104 (100.0%) | 2,302 (100.0%) |
Families and Households in Wahneta
Median Family Size in Wahneta
The median family size in Wahneta is 4.09 persons per family, with single female/mother families (315 | 33.3%) accounting for the largest median family size of 4.4 persons per family. On the other hand, single male/father families (107 | 11.3%) represent the smallest median family size with 3.66 persons per family.
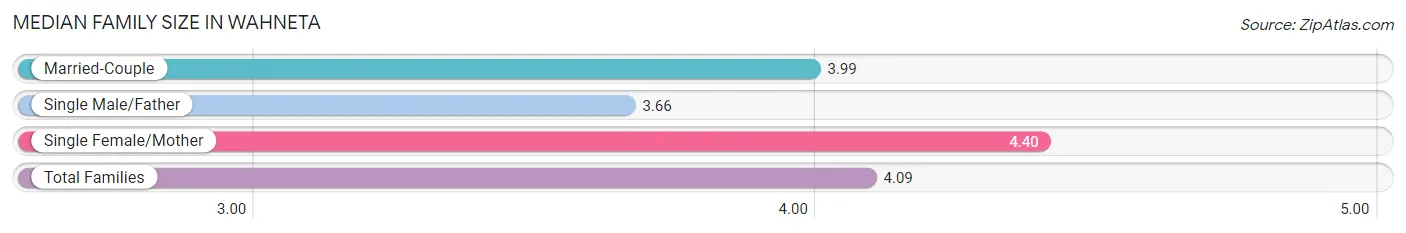
| Family Type | # Families | Family Size |
| Married-Couple | 524 (55.4%) | 3.99 |
| Single Male/Father | 107 (11.3%) | 3.66 |
| Single Female/Mother | 315 (33.3%) | 4.40 |
| Total Families | 946 (100.0%) | 4.09 |
Median Household Size in Wahneta
The median household size in Wahneta is 3.52 persons per household, with single female/mother households (315 | 25.2%) accounting for the largest median household size of 4.52 persons per household. non-family households (304 | 24.3%) represent the smallest median household size with 1.33 persons per household.
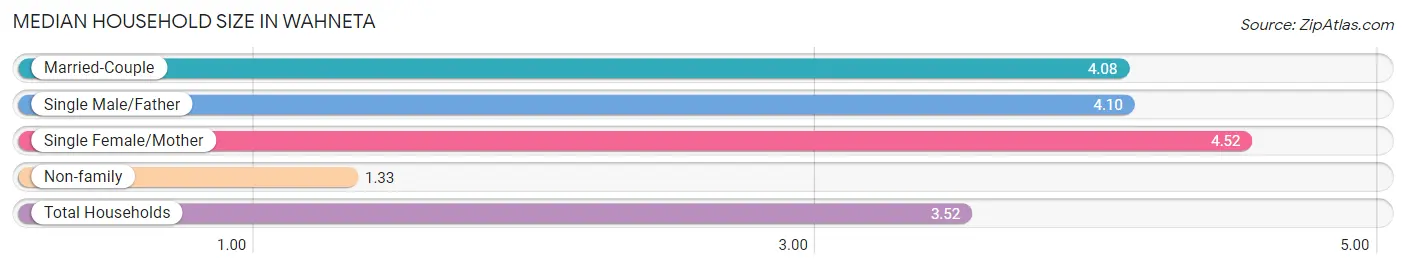
| Household Type | # Households | Household Size |
| Married-Couple | 524 (41.9%) | 4.08 |
| Single Male/Father | 107 (8.6%) | 4.10 |
| Single Female/Mother | 315 (25.2%) | 4.52 |
| Non-family | 304 (24.3%) | 1.33 |
| Total Households | 1,250 (100.0%) | 3.52 |
Household Size by Marriage Status in Wahneta
Out of a total of 1,250 households in Wahneta, 946 (75.7%) are family households, while 304 (24.3%) are nonfamily households. The most numerous type of family households are 4-person households, comprising 248, and the most common type of nonfamily households are 1-person households, comprising 206.
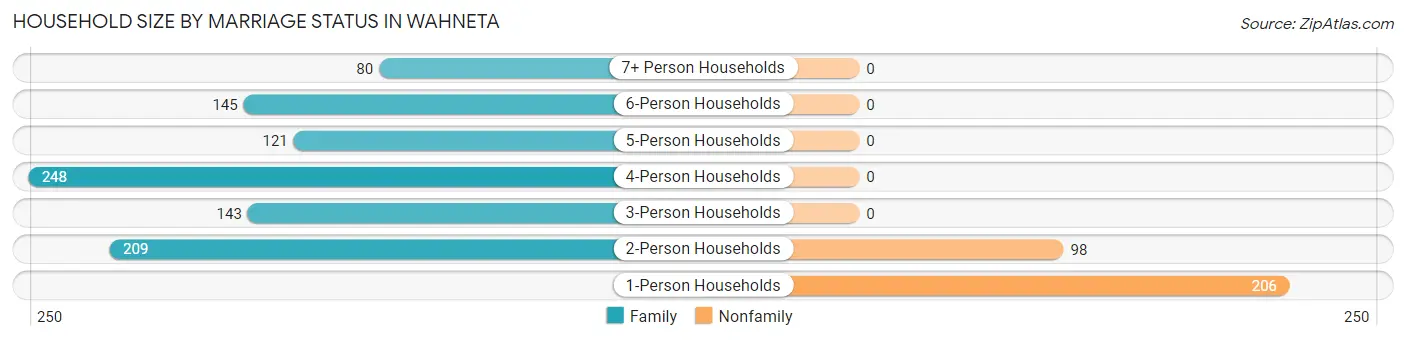
| Household Size | Family Households | Nonfamily Households |
| 1-Person Households | - | 206 (16.5%) |
| 2-Person Households | 209 (16.7%) | 98 (7.8%) |
| 3-Person Households | 143 (11.4%) | 0 (0.0%) |
| 4-Person Households | 248 (19.8%) | 0 (0.0%) |
| 5-Person Households | 121 (9.7%) | 0 (0.0%) |
| 6-Person Households | 145 (11.6%) | 0 (0.0%) |
| 7+ Person Households | 80 (6.4%) | 0 (0.0%) |
| Total | 946 (75.7%) | 304 (24.3%) |
Female Fertility in Wahneta
Fertility by Age in Wahneta
Average fertility rate in Wahneta is 67.0 births per 1,000 women. Women in the age bracket of 20 to 34 years have the highest fertility rate with 175.0 births per 1,000 women. Women in the age bracket of 20 to 34 years acount for 78.7% of all women with births.
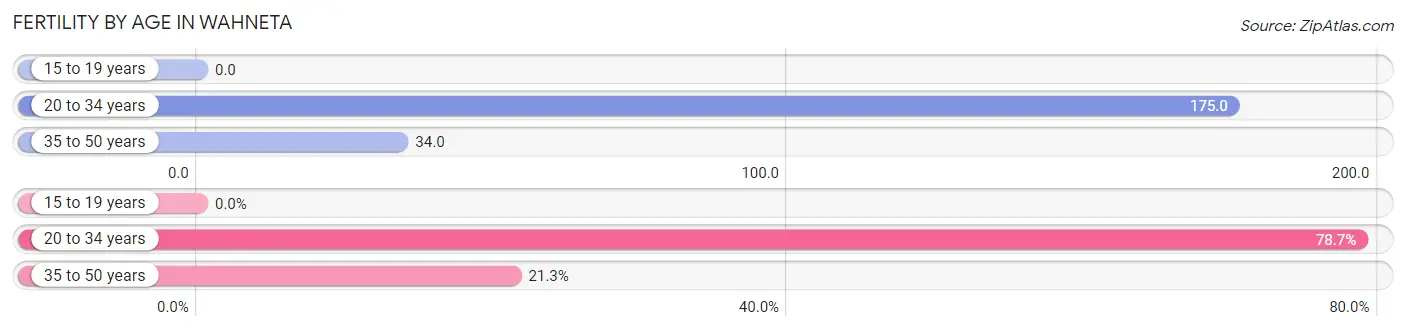
| Age Bracket | Women with Births | Births / 1,000 Women |
| 15 to 19 years | 0 (0.0%) | 0.0 |
| 20 to 34 years | 74 (78.7%) | 175.0 |
| 35 to 50 years | 20 (21.3%) | 34.0 |
| Total | 94 (100.0%) | 67.0 |
Fertility by Age by Marriage Status in Wahneta
55.3% of women with births (94) in Wahneta are married. The highest percentage of unmarried women with births falls into 35 to 50 years age bracket with 100.0% of them unmarried at the time of birth, while the lowest percentage of unmarried women with births belong to 20 to 34 years age bracket with 29.7% of them unmarried.
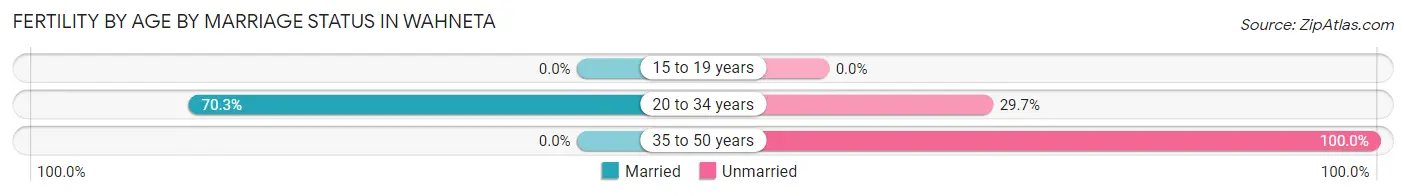
| Age Bracket | Married | Unmarried |
| 15 to 19 years | 0 (0.0%) | 0 (0.0%) |
| 20 to 34 years | 52 (70.3%) | 22 (29.7%) |
| 35 to 50 years | 0 (0.0%) | 20 (100.0%) |
| Total | 52 (55.3%) | 42 (44.7%) |
Fertility by Education in Wahneta
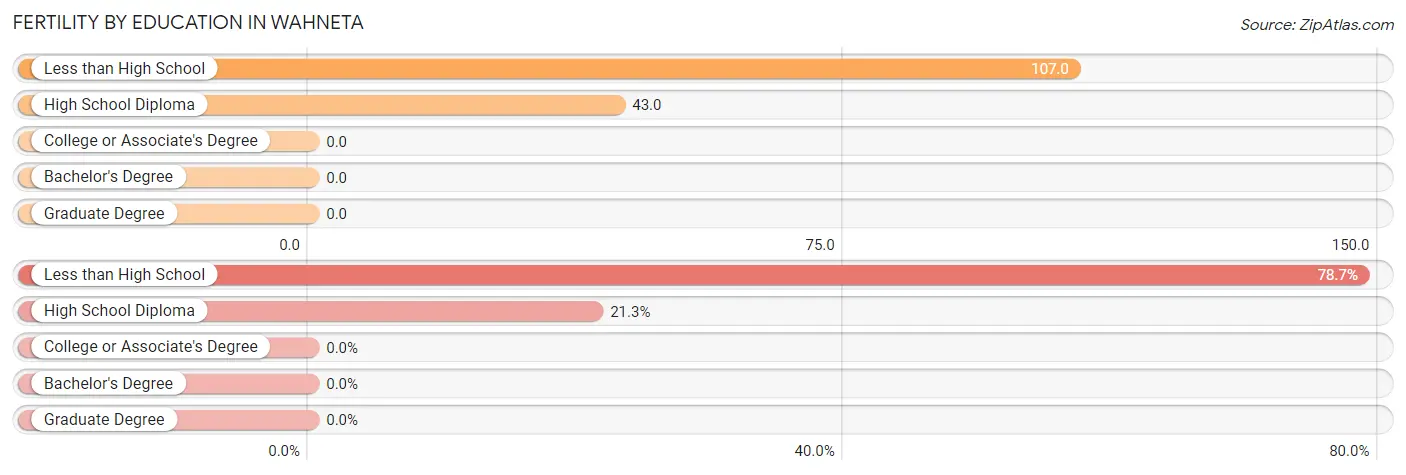
| Educational Attainment | Women with Births | Births / 1,000 Women |
| Less than High School | 74 (78.7%) | 107.0 |
| High School Diploma | 20 (21.3%) | 43.0 |
| College or Associate's Degree | 0 (0.0%) | 0.0 |
| Bachelor's Degree | 0 (0.0%) | 0.0 |
| Graduate Degree | 0 (0.0%) | 0.0 |
| Total | 94 (100.0%) | 67.0 |
Fertility by Education by Marriage Status in Wahneta
44.7% of women with births in Wahneta are unmarried. Women with the educational attainment of less than high school are most likely to be married with 70.3% of them married at childbirth, while women with the educational attainment of high school diploma are least likely to be married with 100.0% of them unmarried at childbirth.
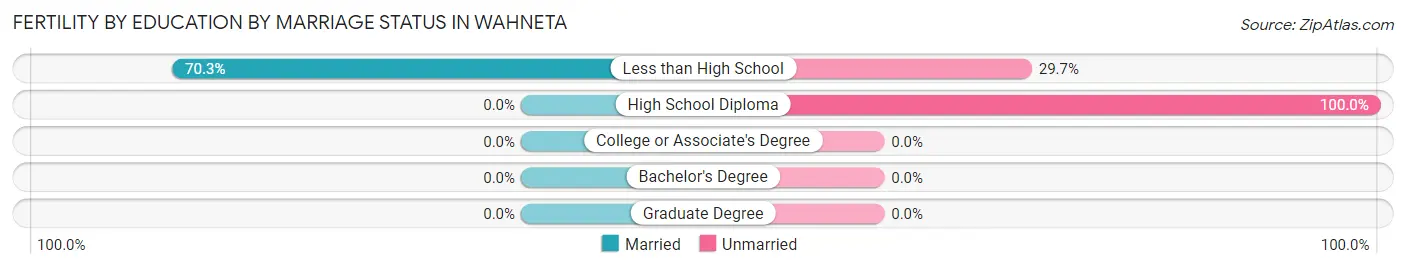
| Educational Attainment | Married | Unmarried |
| Less than High School | 52 (70.3%) | 22 (29.7%) |
| High School Diploma | 0 (0.0%) | 20 (100.0%) |
| College or Associate's Degree | 0 (0.0%) | 0 (0.0%) |
| Bachelor's Degree | 0 (0.0%) | 0 (0.0%) |
| Graduate Degree | 0 (0.0%) | 0 (0.0%) |
| Total | 52 (55.3%) | 42 (44.7%) |
Employment Characteristics in Wahneta
Employment by Class of Employer in Wahneta
Among the 1,568 employed individuals in Wahneta, private company employees (1,388 | 88.5%), local government employees (117 | 7.5%), and federal government employees (29 | 1.8%) make up the most common classes of employment.
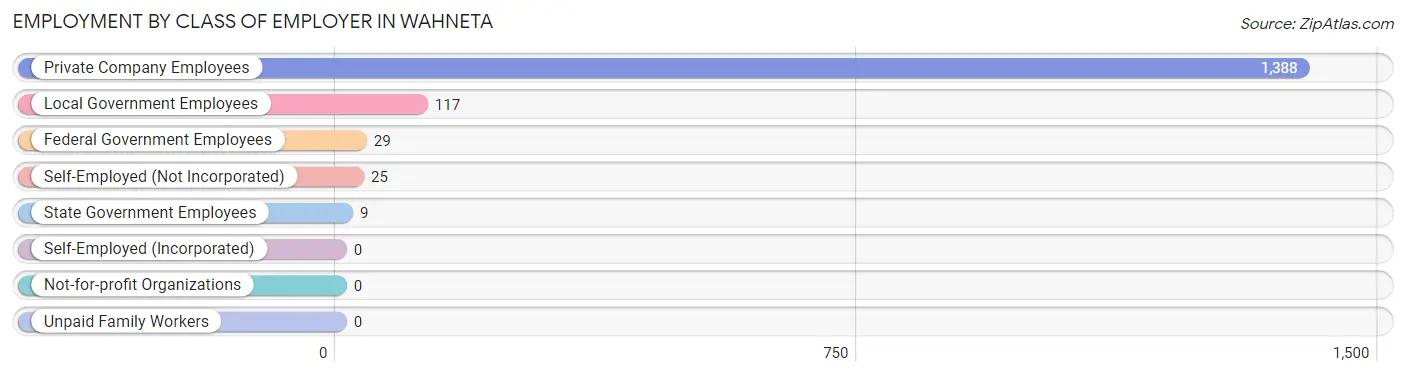
| Employer Class | # Employees | % Employees |
| Private Company Employees | 1,388 | 88.5% |
| Self-Employed (Incorporated) | 0 | 0.0% |
| Self-Employed (Not Incorporated) | 25 | 1.6% |
| Not-for-profit Organizations | 0 | 0.0% |
| Local Government Employees | 117 | 7.5% |
| State Government Employees | 9 | 0.6% |
| Federal Government Employees | 29 | 1.8% |
| Unpaid Family Workers | 0 | 0.0% |
| Total | 1,568 | 100.0% |
Employment Status by Age in Wahneta
According to the labor force statistics for Wahneta, out of the total population over 16 years of age (3,173), 53.1% or 1,685 individuals are in the labor force, with 4.3% or 72 of them unemployed. The age group with the highest labor force participation rate is 25 to 29 years, with 88.3% or 181 individuals in the labor force. Within the labor force, the 16 to 19 years age range has the highest percentage of unemployed individuals, with 48.7% or 55 of them being unemployed.
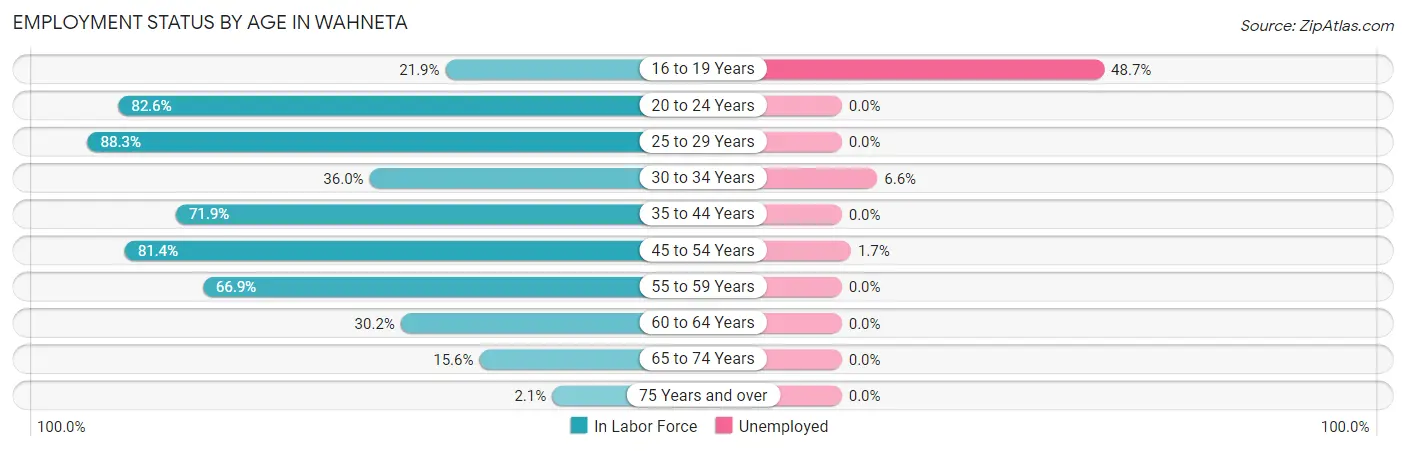
| Age Bracket | In Labor Force | Unemployed |
| 16 to 19 Years | 113 (21.9%) | 55 (48.7%) |
| 20 to 24 Years | 109 (82.6%) | 0 (0.0%) |
| 25 to 29 Years | 181 (88.3%) | 0 (0.0%) |
| 30 to 34 Years | 121 (36.0%) | 8 (6.6%) |
| 35 to 44 Years | 443 (71.9%) | 0 (0.0%) |
| 45 to 54 Years | 525 (81.4%) | 9 (1.7%) |
| 55 to 59 Years | 87 (66.9%) | 0 (0.0%) |
| 60 to 64 Years | 55 (30.2%) | 0 (0.0%) |
| 65 to 74 Years | 49 (15.6%) | 0 (0.0%) |
| 75 Years and over | 2 (2.1%) | 0 (0.0%) |
| Total | 1,685 (53.1%) | 72 (4.3%) |
Employment Status by Educational Attainment in Wahneta
According to labor force statistics for Wahneta, 66.8% of individuals (1,412) out of the total population between 25 and 64 years of age (2,114) are in the labor force, with 1.2% or 17 of them being unemployed. The group with the highest labor force participation rate are those with the educational attainment of bachelor's degree or higher, with 91.6% or 87 individuals in the labor force. Within the labor force, individuals with bachelor's degree or higher education have the highest percentage of unemployment, with 9.2% or 8 of them being unemployed.
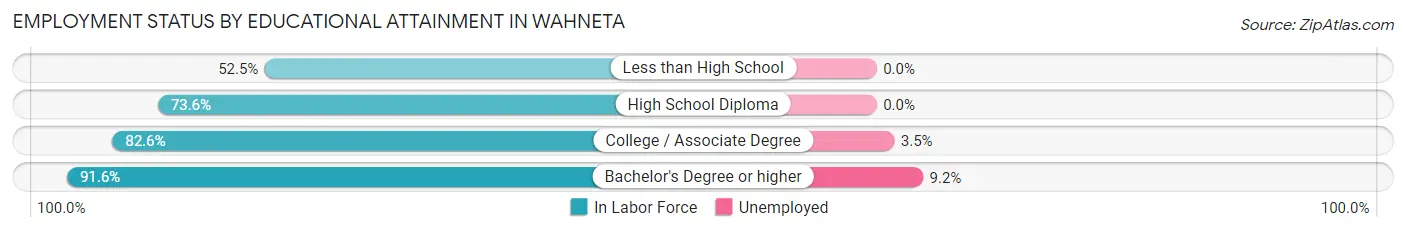
| Educational Attainment | In Labor Force | Unemployed |
| Less than High School | 476 (52.5%) | 0 (0.0%) |
| High School Diploma | 568 (73.6%) | 0 (0.0%) |
| College / Associate Degree | 281 (82.6%) | 12 (3.5%) |
| Bachelor's Degree or higher | 87 (91.6%) | 9 (9.2%) |
| Total | 1,412 (66.8%) | 25 (1.2%) |
Employment Occupations by Sex in Wahneta
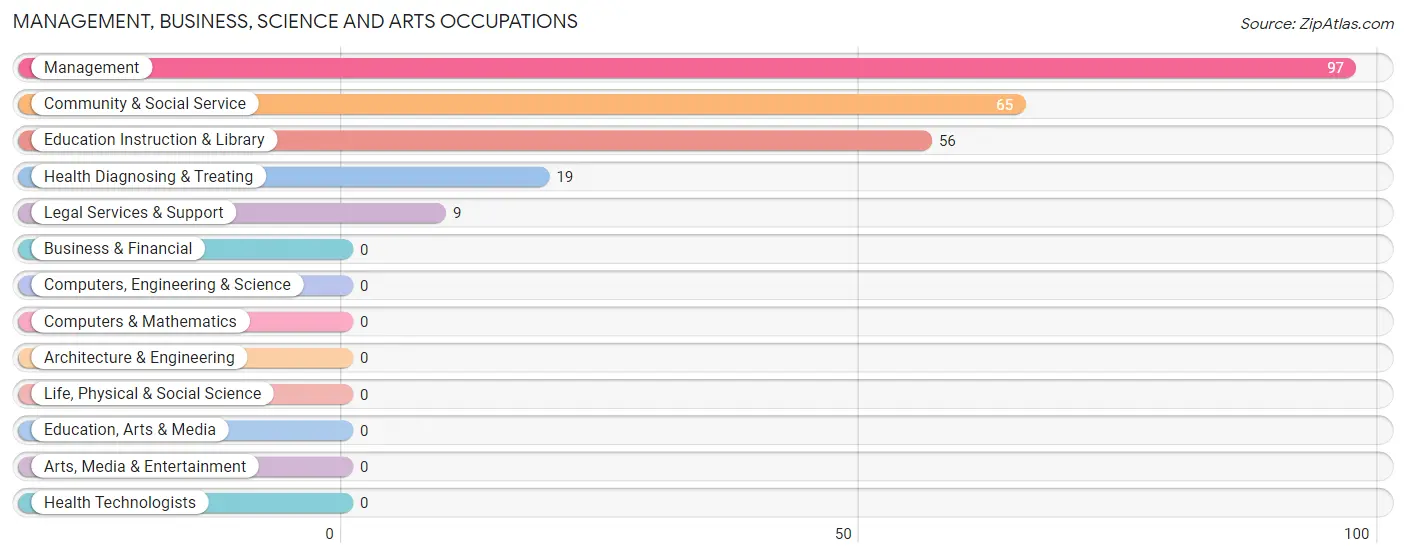
Management, Business, Science and Arts Occupations
The most common Management, Business, Science and Arts occupations in Wahneta are Management (97 | 6.1%), Community & Social Service (65 | 4.1%), Education Instruction & Library (56 | 3.5%), Health Diagnosing & Treating (19 | 1.2%), and Legal Services & Support (9 | 0.6%).
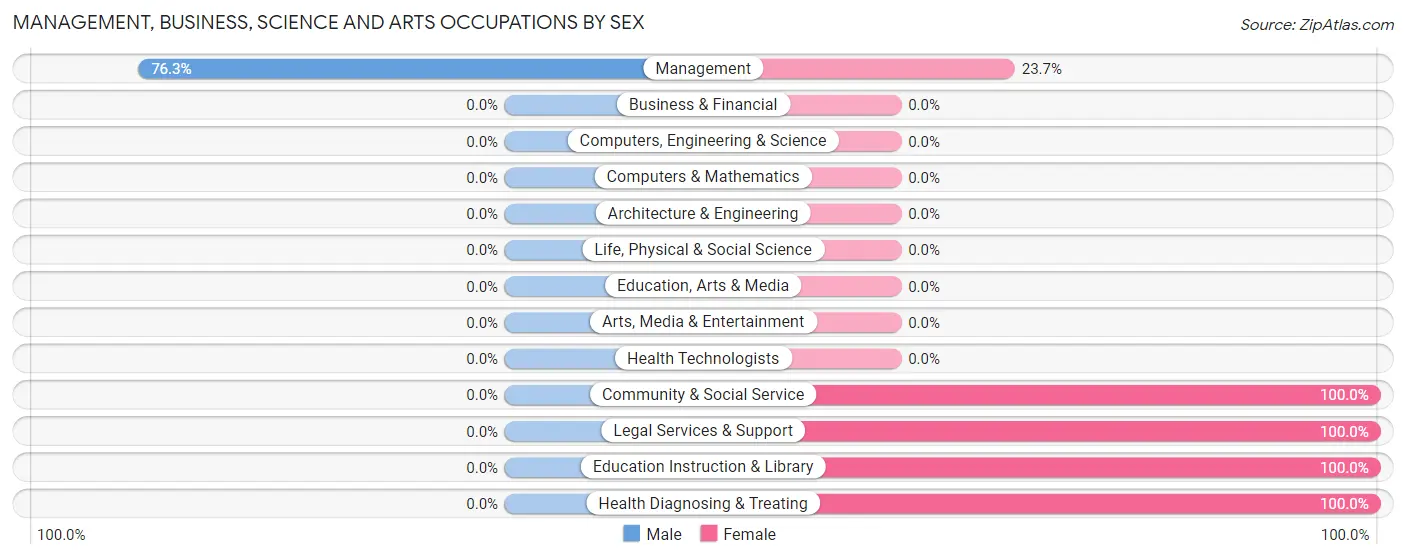
Management, Business, Science and Arts Occupations by Sex
| Occupation | Male | Female |
| Management | 74 (76.3%) | 23 (23.7%) |
| Business & Financial | 0 (0.0%) | 0 (0.0%) |
| Computers, Engineering & Science | 0 (0.0%) | 0 (0.0%) |
| Computers & Mathematics | 0 (0.0%) | 0 (0.0%) |
| Architecture & Engineering | 0 (0.0%) | 0 (0.0%) |
| Life, Physical & Social Science | 0 (0.0%) | 0 (0.0%) |
| Community & Social Service | 0 (0.0%) | 65 (100.0%) |
| Education, Arts & Media | 0 (0.0%) | 0 (0.0%) |
| Legal Services & Support | 0 (0.0%) | 9 (100.0%) |
| Education Instruction & Library | 0 (0.0%) | 56 (100.0%) |
| Arts, Media & Entertainment | 0 (0.0%) | 0 (0.0%) |
| Health Diagnosing & Treating | 0 (0.0%) | 19 (100.0%) |
| Health Technologists | 0 (0.0%) | 0 (0.0%) |
| Total (Category) | 74 (40.9%) | 107 (59.1%) |
| Total (Overall) | 860 (54.0%) | 732 (46.0%) |
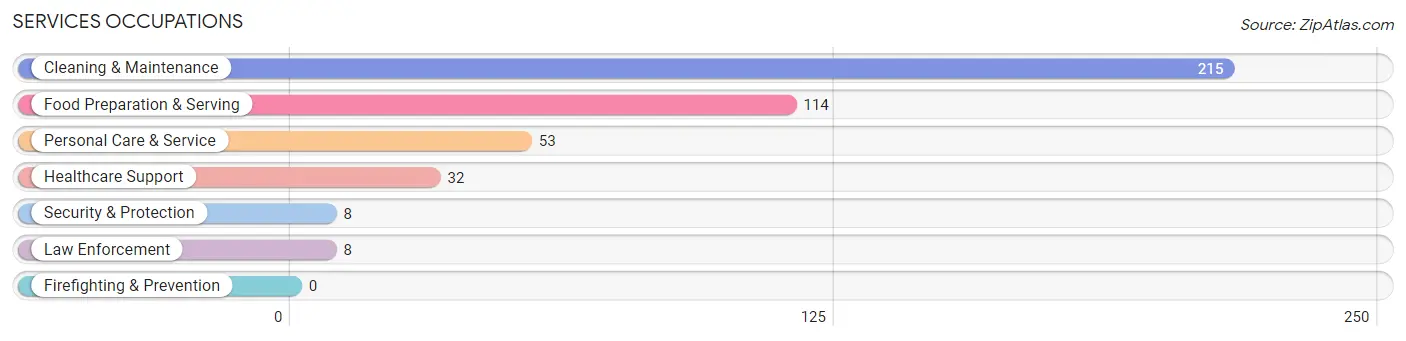
Services Occupations
The most common Services occupations in Wahneta are Cleaning & Maintenance (215 | 13.5%), Food Preparation & Serving (114 | 7.2%), Personal Care & Service (53 | 3.3%), Healthcare Support (32 | 2.0%), and Security & Protection (8 | 0.5%).
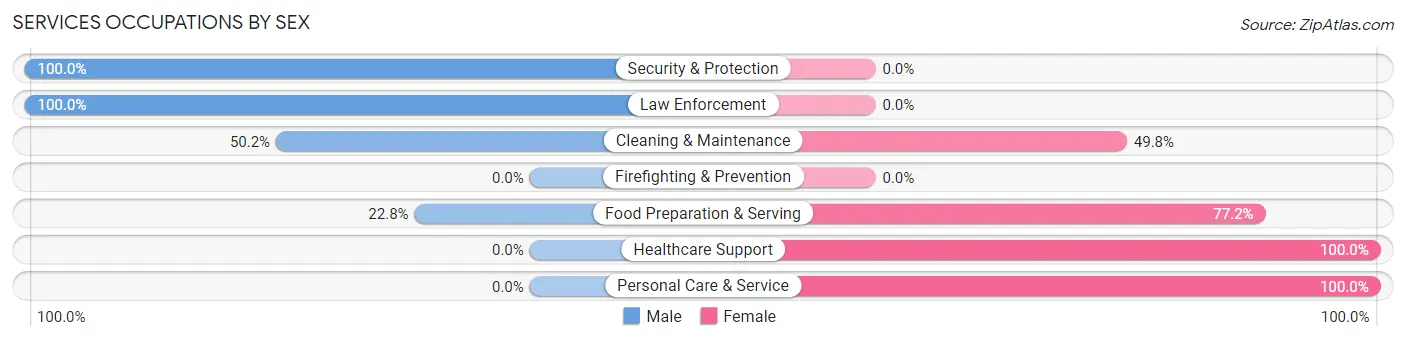
Services Occupations by Sex
Within the Services occupations in Wahneta, the most male-oriented occupations are Security & Protection (100.0%), Law Enforcement (100.0%), and Cleaning & Maintenance (50.2%), while the most female-oriented occupations are Healthcare Support (100.0%), Personal Care & Service (100.0%), and Food Preparation & Serving (77.2%).
| Occupation | Male | Female |
| Healthcare Support | 0 (0.0%) | 32 (100.0%) |
| Security & Protection | 8 (100.0%) | 0 (0.0%) |
| Firefighting & Prevention | 0 (0.0%) | 0 (0.0%) |
| Law Enforcement | 8 (100.0%) | 0 (0.0%) |
| Food Preparation & Serving | 26 (22.8%) | 88 (77.2%) |
| Cleaning & Maintenance | 108 (50.2%) | 107 (49.8%) |
| Personal Care & Service | 0 (0.0%) | 53 (100.0%) |
| Total (Category) | 142 (33.7%) | 280 (66.3%) |
| Total (Overall) | 860 (54.0%) | 732 (46.0%) |
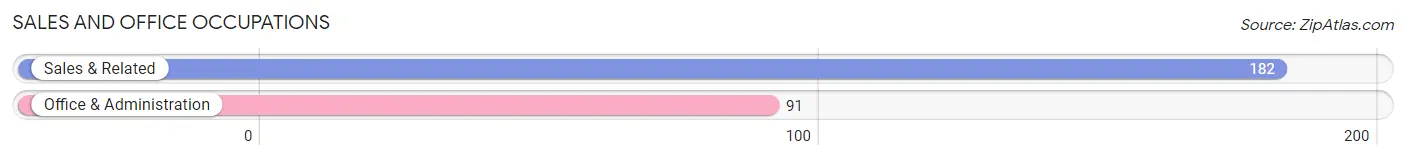
Sales and Office Occupations
The most common Sales and Office occupations in Wahneta are Sales & Related (182 | 11.4%), and Office & Administration (91 | 5.7%).
Sales and Office Occupations by Sex
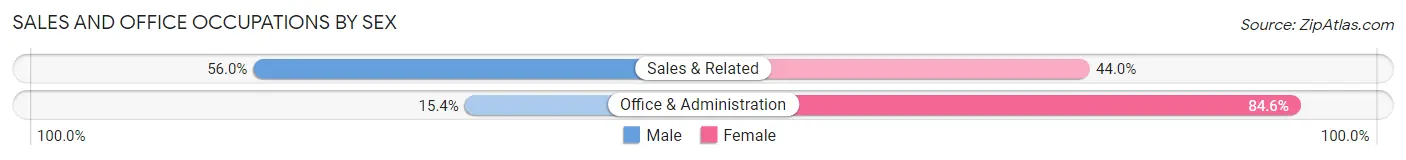
| Occupation | Male | Female |
| Sales & Related | 102 (56.0%) | 80 (44.0%) |
| Office & Administration | 14 (15.4%) | 77 (84.6%) |
| Total (Category) | 116 (42.5%) | 157 (57.5%) |
| Total (Overall) | 860 (54.0%) | 732 (46.0%) |
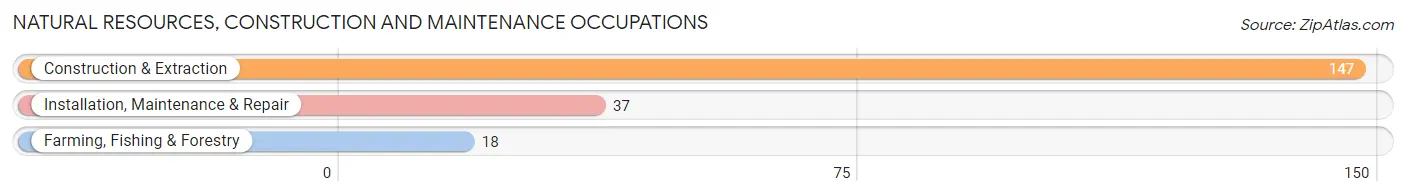
Natural Resources, Construction and Maintenance Occupations
The most common Natural Resources, Construction and Maintenance occupations in Wahneta are Construction & Extraction (147 | 9.2%), Installation, Maintenance & Repair (37 | 2.3%), and Farming, Fishing & Forestry (18 | 1.1%).
Natural Resources, Construction and Maintenance Occupations by Sex
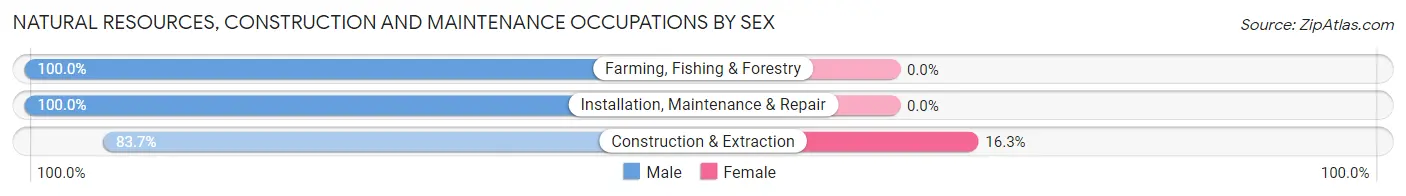
| Occupation | Male | Female |
| Farming, Fishing & Forestry | 18 (100.0%) | 0 (0.0%) |
| Construction & Extraction | 123 (83.7%) | 24 (16.3%) |
| Installation, Maintenance & Repair | 37 (100.0%) | 0 (0.0%) |
| Total (Category) | 178 (88.1%) | 24 (11.9%) |
| Total (Overall) | 860 (54.0%) | 732 (46.0%) |
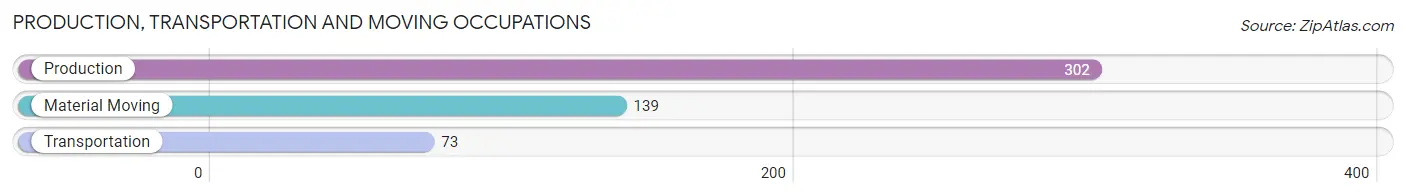
Production, Transportation and Moving Occupations
The most common Production, Transportation and Moving occupations in Wahneta are Production (302 | 19.0%), Material Moving (139 | 8.7%), and Transportation (73 | 4.6%).
Production, Transportation and Moving Occupations by Sex
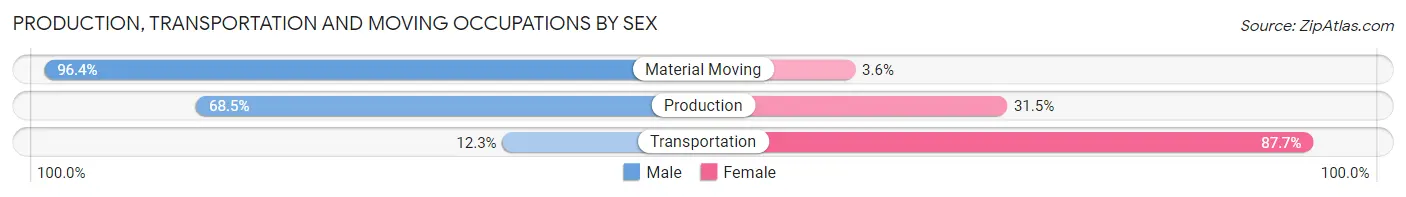
| Occupation | Male | Female |
| Production | 207 (68.5%) | 95 (31.5%) |
| Transportation | 9 (12.3%) | 64 (87.7%) |
| Material Moving | 134 (96.4%) | 5 (3.6%) |
| Total (Category) | 350 (68.1%) | 164 (31.9%) |
| Total (Overall) | 860 (54.0%) | 732 (46.0%) |
Employment Industries by Sex in Wahneta
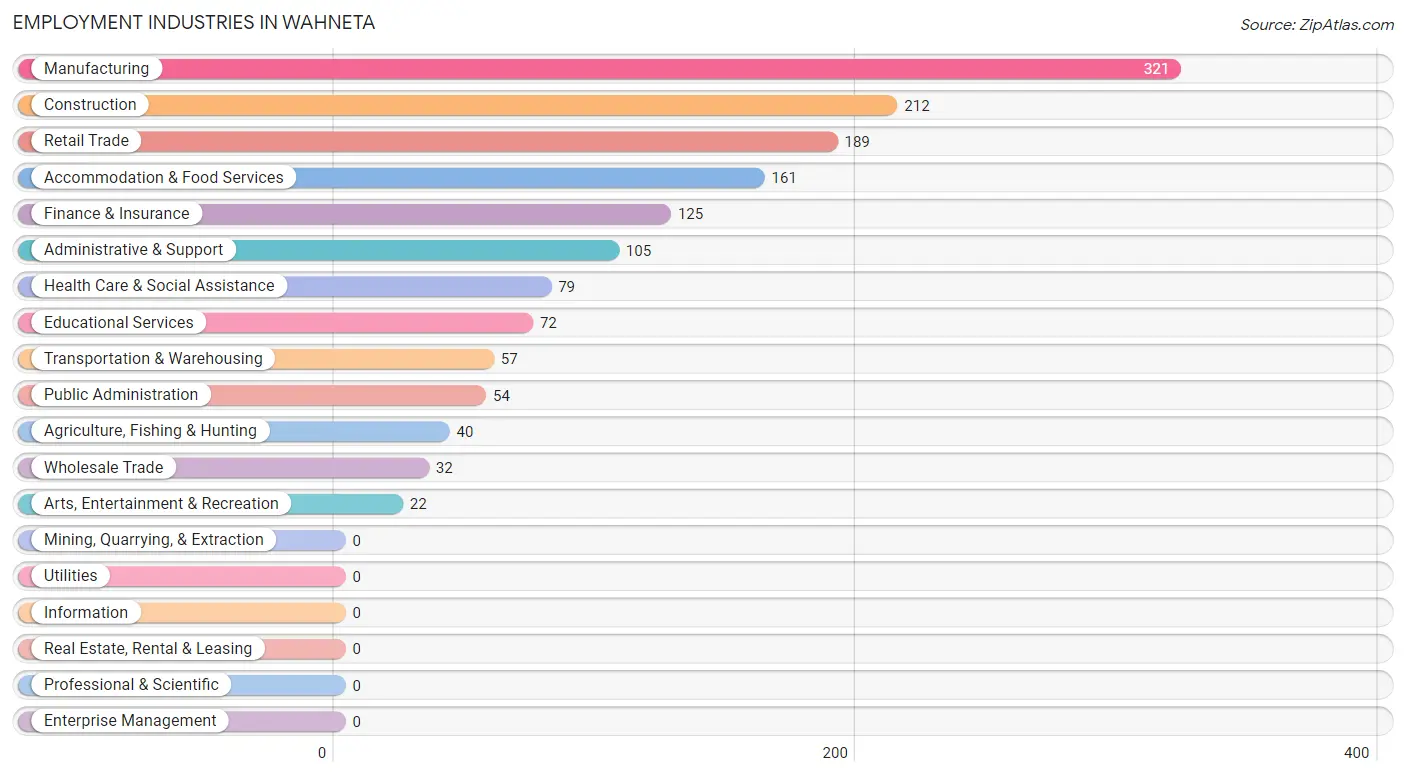
Employment Industries in Wahneta
The major employment industries in Wahneta include Manufacturing (321 | 20.2%), Construction (212 | 13.3%), Retail Trade (189 | 11.9%), Accommodation & Food Services (161 | 10.1%), and Finance & Insurance (125 | 7.9%).
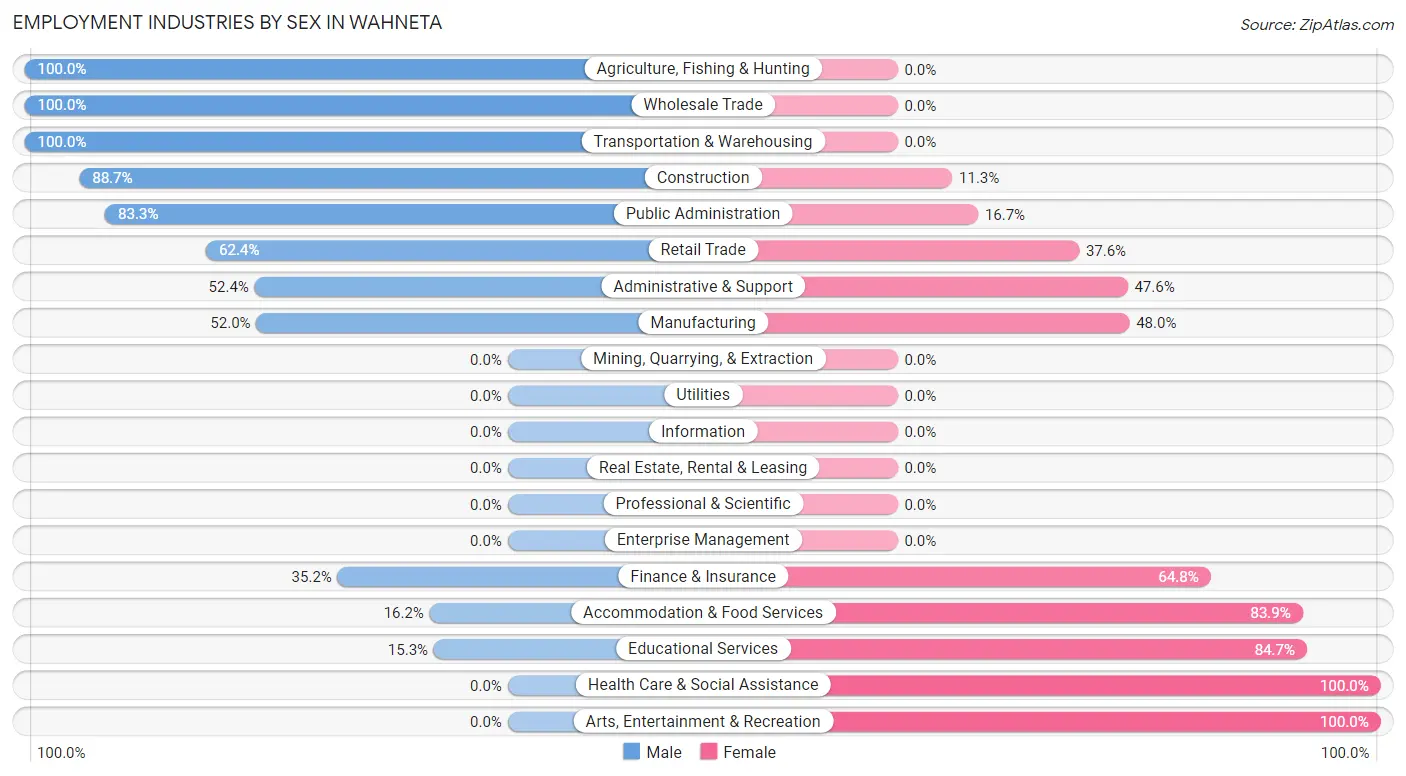
Employment Industries by Sex in Wahneta
The Wahneta industries that see more men than women are Agriculture, Fishing & Hunting (100.0%), Wholesale Trade (100.0%), and Transportation & Warehousing (100.0%), whereas the industries that tend to have a higher number of women are Health Care & Social Assistance (100.0%), Arts, Entertainment & Recreation (100.0%), and Educational Services (84.7%).
| Industry | Male | Female |
| Agriculture, Fishing & Hunting | 40 (100.0%) | 0 (0.0%) |
| Mining, Quarrying, & Extraction | 0 (0.0%) | 0 (0.0%) |
| Construction | 188 (88.7%) | 24 (11.3%) |
| Manufacturing | 167 (52.0%) | 154 (48.0%) |
| Wholesale Trade | 32 (100.0%) | 0 (0.0%) |
| Retail Trade | 118 (62.4%) | 71 (37.6%) |
| Transportation & Warehousing | 57 (100.0%) | 0 (0.0%) |
| Utilities | 0 (0.0%) | 0 (0.0%) |
| Information | 0 (0.0%) | 0 (0.0%) |
| Finance & Insurance | 44 (35.2%) | 81 (64.8%) |
| Real Estate, Rental & Leasing | 0 (0.0%) | 0 (0.0%) |
| Professional & Scientific | 0 (0.0%) | 0 (0.0%) |
| Enterprise Management | 0 (0.0%) | 0 (0.0%) |
| Administrative & Support | 55 (52.4%) | 50 (47.6%) |
| Educational Services | 11 (15.3%) | 61 (84.7%) |
| Health Care & Social Assistance | 0 (0.0%) | 79 (100.0%) |
| Arts, Entertainment & Recreation | 0 (0.0%) | 22 (100.0%) |
| Accommodation & Food Services | 26 (16.2%) | 135 (83.9%) |
| Public Administration | 45 (83.3%) | 9 (16.7%) |
| Total | 860 (54.0%) | 732 (46.0%) |
Education in Wahneta
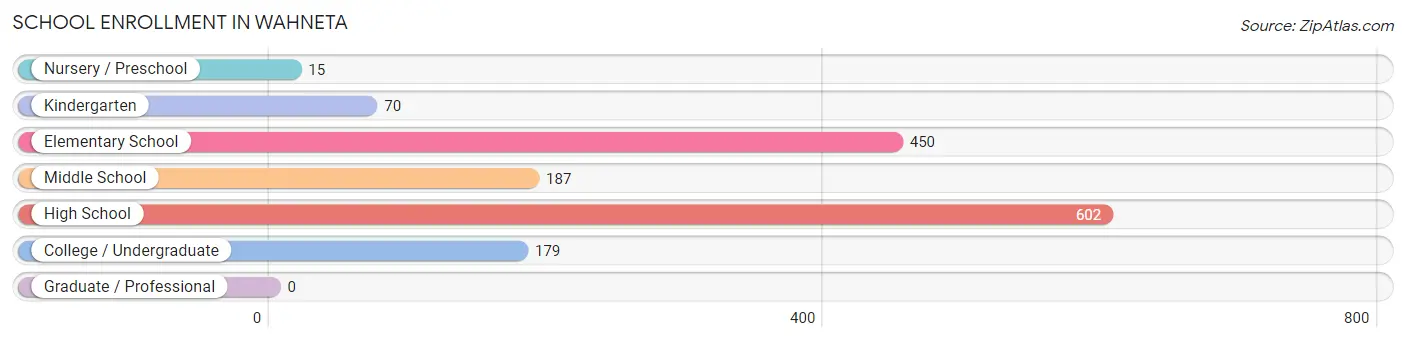
School Enrollment in Wahneta
The most common levels of schooling among the 1,503 students in Wahneta are high school (602 | 40.1%), elementary school (450 | 29.9%), and middle school (187 | 12.4%).
| School Level | # Students | % Students |
| Nursery / Preschool | 15 | 1.0% |
| Kindergarten | 70 | 4.7% |
| Elementary School | 450 | 29.9% |
| Middle School | 187 | 12.4% |
| High School | 602 | 40.1% |
| College / Undergraduate | 179 | 11.9% |
| Graduate / Professional | 0 | 0.0% |
| Total | 1,503 | 100.0% |
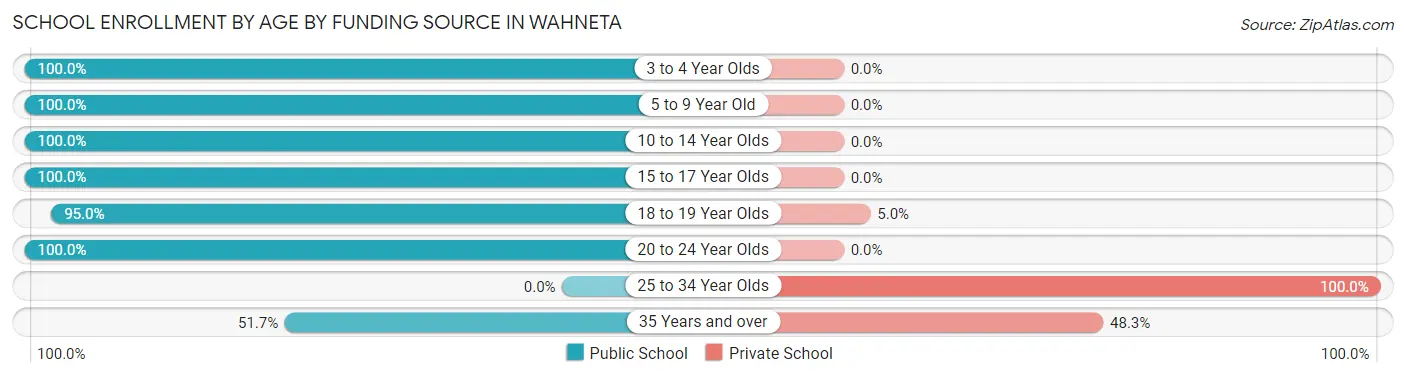
School Enrollment by Age by Funding Source in Wahneta
Out of a total of 1,503 students who are enrolled in schools in Wahneta, 47 (3.1%) attend a private institution, while the remaining 1,456 (96.9%) are enrolled in public schools. The age group of 25 to 34 year olds has the highest likelihood of being enrolled in private schools, with 8 (100.0% in the age bracket) enrolled. Conversely, the age group of 3 to 4 year olds has the lowest likelihood of being enrolled in a private school, with 11 (100.0% in the age bracket) attending a public institution.
| Age Bracket | Public School | Private School |
| 3 to 4 Year Olds | 11 (100.0%) | 0 (0.0%) |
| 5 to 9 Year Old | 358 (100.0%) | 0 (0.0%) |
| 10 to 14 Year Olds | 353 (100.0%) | 0 (0.0%) |
| 15 to 17 Year Olds | 416 (100.0%) | 0 (0.0%) |
| 18 to 19 Year Olds | 172 (95.0%) | 9 (5.0%) |
| 20 to 24 Year Olds | 116 (100.0%) | 0 (0.0%) |
| 25 to 34 Year Olds | 0 (0.0%) | 8 (100.0%) |
| 35 Years and over | 31 (51.7%) | 29 (48.3%) |
| Total | 1,456 (96.9%) | 47 (3.1%) |
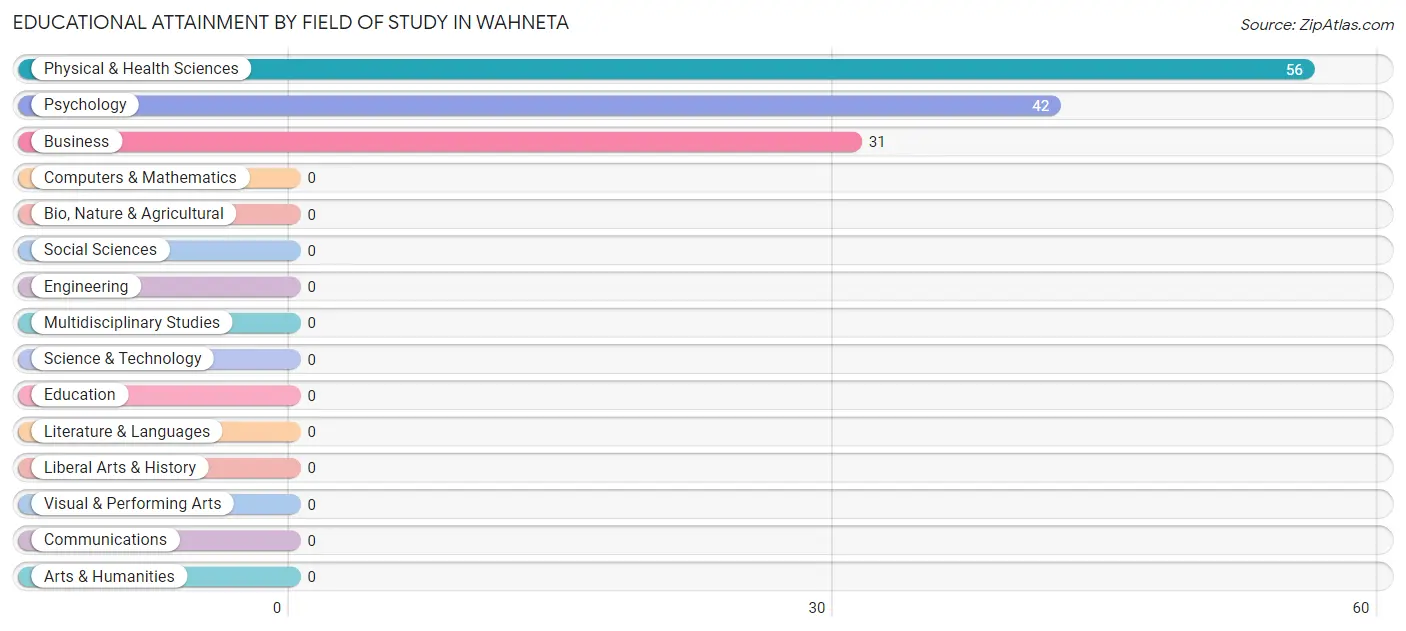
Educational Attainment by Field of Study in Wahneta
Physical & health sciences (56 | 43.4%), psychology (42 | 32.6%), and business (31 | 24.0%) are the most common fields of study among 129 individuals in Wahneta who have obtained a bachelor's degree or higher.
| Field of Study | # Graduates | % Graduates |
| Computers & Mathematics | 0 | 0.0% |
| Bio, Nature & Agricultural | 0 | 0.0% |
| Physical & Health Sciences | 56 | 43.4% |
| Psychology | 42 | 32.6% |
| Social Sciences | 0 | 0.0% |
| Engineering | 0 | 0.0% |
| Multidisciplinary Studies | 0 | 0.0% |
| Science & Technology | 0 | 0.0% |
| Business | 31 | 24.0% |
| Education | 0 | 0.0% |
| Literature & Languages | 0 | 0.0% |
| Liberal Arts & History | 0 | 0.0% |
| Visual & Performing Arts | 0 | 0.0% |
| Communications | 0 | 0.0% |
| Arts & Humanities | 0 | 0.0% |
| Total | 129 | 100.0% |
Transportation & Commute in Wahneta
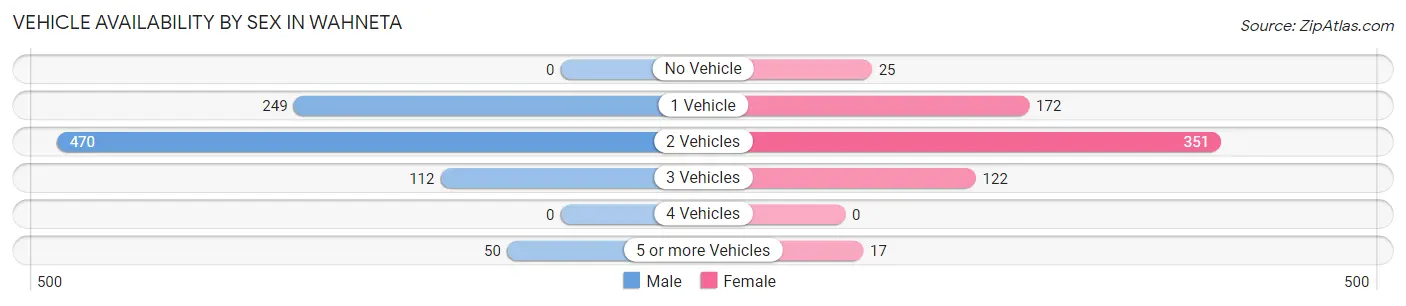
Vehicle Availability by Sex in Wahneta
The most prevalent vehicle ownership categories in Wahneta are males with 2 vehicles (470, accounting for 53.3%) and females with 2 vehicles (351, making up 68.4%).
| Vehicles Available | Male | Female |
| No Vehicle | 0 (0.0%) | 25 (3.6%) |
| 1 Vehicle | 249 (28.3%) | 172 (25.0%) |
| 2 Vehicles | 470 (53.3%) | 351 (51.1%) |
| 3 Vehicles | 112 (12.7%) | 122 (17.8%) |
| 4 Vehicles | 0 (0.0%) | 0 (0.0%) |
| 5 or more Vehicles | 50 (5.7%) | 17 (2.5%) |
| Total | 881 (100.0%) | 687 (100.0%) |
Commute Time in Wahneta
The most frequently occuring commute durations in Wahneta are 30 to 34 minutes (390 commuters, 26.2%), 15 to 19 minutes (334 commuters, 22.4%), and 25 to 29 minutes (204 commuters, 13.7%).
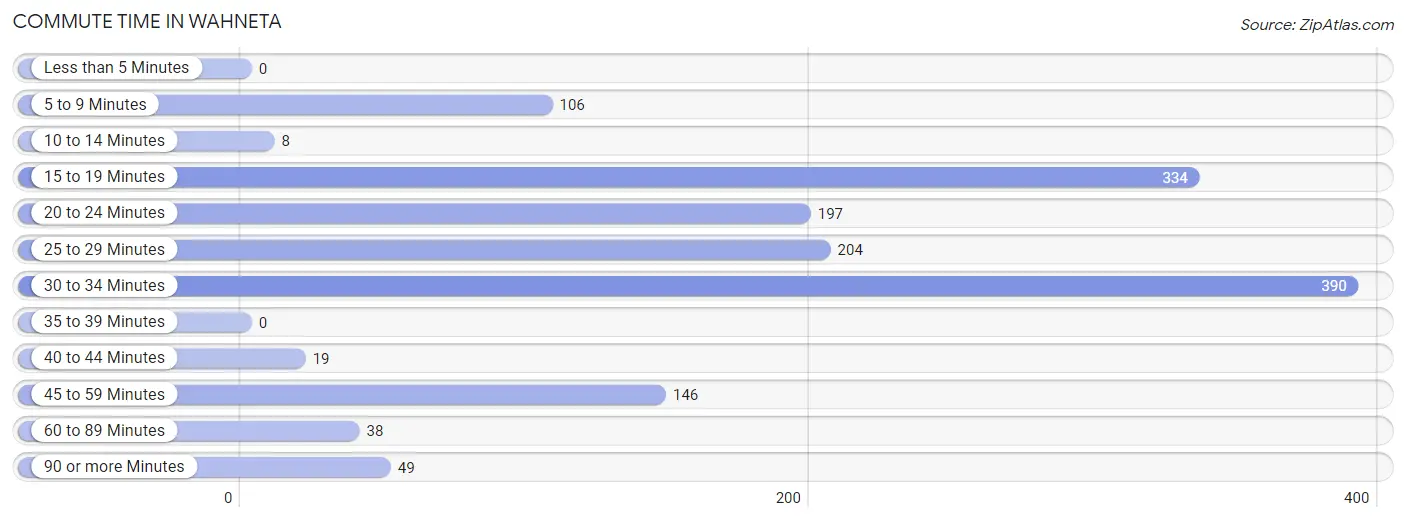
| Commute Time | # Commuters | % Commuters |
| Less than 5 Minutes | 0 | 0.0% |
| 5 to 9 Minutes | 106 | 7.1% |
| 10 to 14 Minutes | 8 | 0.5% |
| 15 to 19 Minutes | 334 | 22.4% |
| 20 to 24 Minutes | 197 | 13.2% |
| 25 to 29 Minutes | 204 | 13.7% |
| 30 to 34 Minutes | 390 | 26.2% |
| 35 to 39 Minutes | 0 | 0.0% |
| 40 to 44 Minutes | 19 | 1.3% |
| 45 to 59 Minutes | 146 | 9.8% |
| 60 to 89 Minutes | 38 | 2.5% |
| 90 or more Minutes | 49 | 3.3% |
Commute Time by Sex in Wahneta
The most common commute times in Wahneta are 25 to 29 minutes (180 commuters, 22.4%) for males and 30 to 34 minutes (240 commuters, 34.9%) for females.
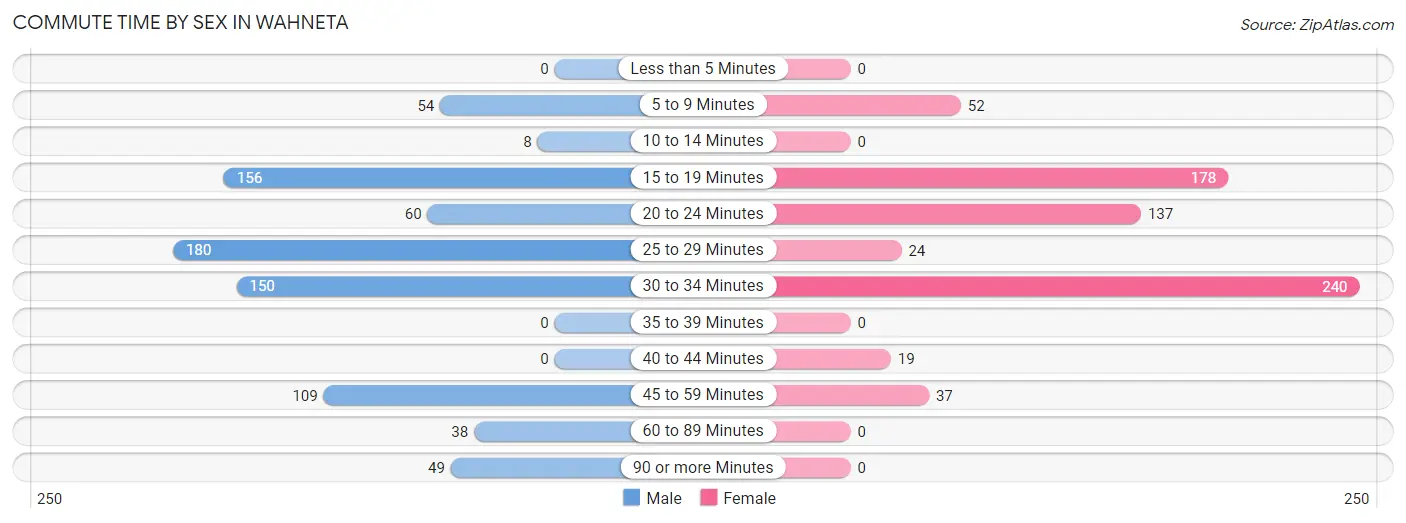
| Commute Time | Male | Female |
| Less than 5 Minutes | 0 (0.0%) | 0 (0.0%) |
| 5 to 9 Minutes | 54 (6.7%) | 52 (7.6%) |
| 10 to 14 Minutes | 8 (1.0%) | 0 (0.0%) |
| 15 to 19 Minutes | 156 (19.4%) | 178 (25.9%) |
| 20 to 24 Minutes | 60 (7.5%) | 137 (19.9%) |
| 25 to 29 Minutes | 180 (22.4%) | 24 (3.5%) |
| 30 to 34 Minutes | 150 (18.7%) | 240 (34.9%) |
| 35 to 39 Minutes | 0 (0.0%) | 0 (0.0%) |
| 40 to 44 Minutes | 0 (0.0%) | 19 (2.8%) |
| 45 to 59 Minutes | 109 (13.6%) | 37 (5.4%) |
| 60 to 89 Minutes | 38 (4.7%) | 0 (0.0%) |
| 90 or more Minutes | 49 (6.1%) | 0 (0.0%) |
Time of Departure to Work by Sex in Wahneta
The most frequent times of departure to work in Wahneta are 7:00 AM to 7:29 AM (234, 29.1%) for males and 7:00 AM to 7:29 AM (134, 19.5%) for females.
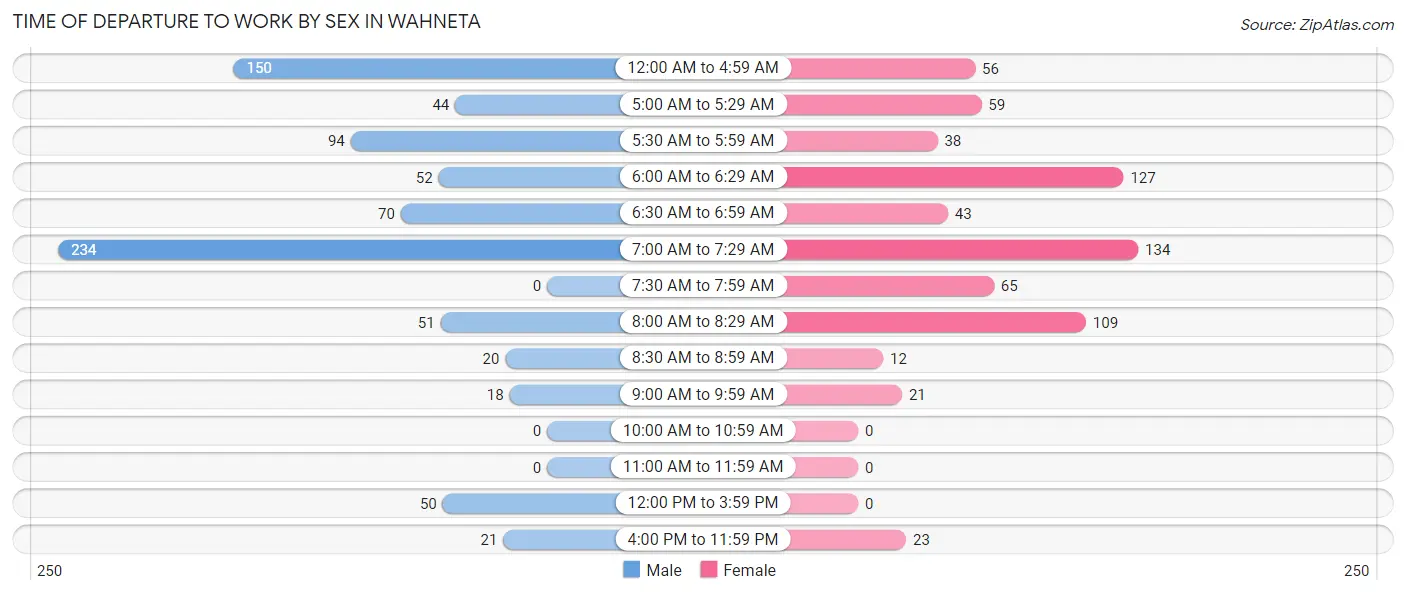
| Time of Departure | Male | Female |
| 12:00 AM to 4:59 AM | 150 (18.7%) | 56 (8.2%) |
| 5:00 AM to 5:29 AM | 44 (5.5%) | 59 (8.6%) |
| 5:30 AM to 5:59 AM | 94 (11.7%) | 38 (5.5%) |
| 6:00 AM to 6:29 AM | 52 (6.5%) | 127 (18.5%) |
| 6:30 AM to 6:59 AM | 70 (8.7%) | 43 (6.3%) |
| 7:00 AM to 7:29 AM | 234 (29.1%) | 134 (19.5%) |
| 7:30 AM to 7:59 AM | 0 (0.0%) | 65 (9.5%) |
| 8:00 AM to 8:29 AM | 51 (6.3%) | 109 (15.9%) |
| 8:30 AM to 8:59 AM | 20 (2.5%) | 12 (1.8%) |
| 9:00 AM to 9:59 AM | 18 (2.2%) | 21 (3.1%) |
| 10:00 AM to 10:59 AM | 0 (0.0%) | 0 (0.0%) |
| 11:00 AM to 11:59 AM | 0 (0.0%) | 0 (0.0%) |
| 12:00 PM to 3:59 PM | 50 (6.2%) | 0 (0.0%) |
| 4:00 PM to 11:59 PM | 21 (2.6%) | 23 (3.4%) |
| Total | 804 (100.0%) | 687 (100.0%) |
Housing Occupancy in Wahneta
Occupancy by Ownership in Wahneta
Of the total 1,250 dwellings in Wahneta, owner-occupied units account for 840 (67.2%), while renter-occupied units make up 410 (32.8%).
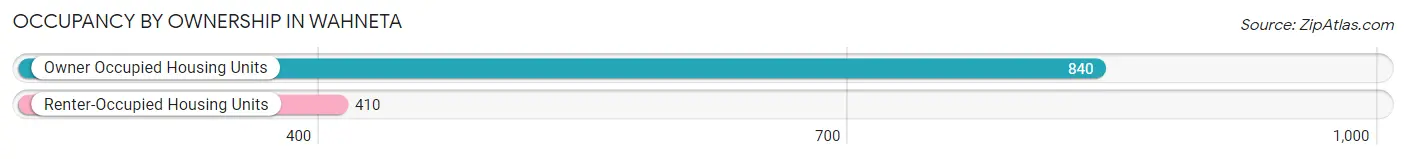
| Occupancy | # Housing Units | % Housing Units |
| Owner Occupied Housing Units | 840 | 67.2% |
| Renter-Occupied Housing Units | 410 | 32.8% |
| Total Occupied Housing Units | 1,250 | 100.0% |
Occupancy by Household Size in Wahneta
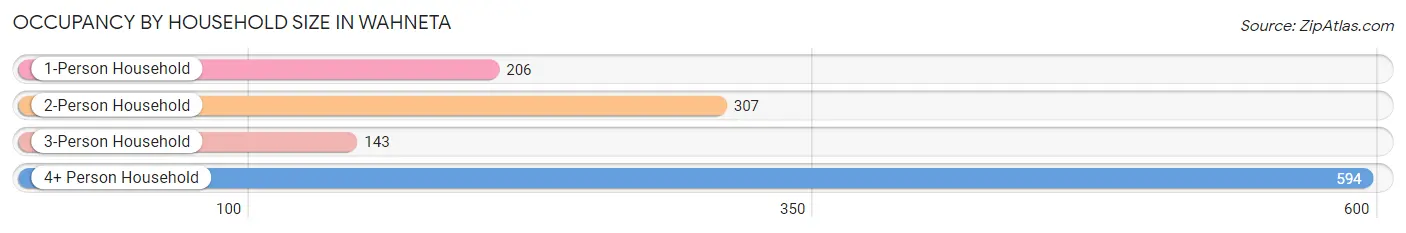
| Household Size | # Housing Units | % Housing Units |
| 1-Person Household | 206 | 16.5% |
| 2-Person Household | 307 | 24.6% |
| 3-Person Household | 143 | 11.4% |
| 4+ Person Household | 594 | 47.5% |
| Total Housing Units | 1,250 | 100.0% |
Occupancy by Ownership by Household Size in Wahneta
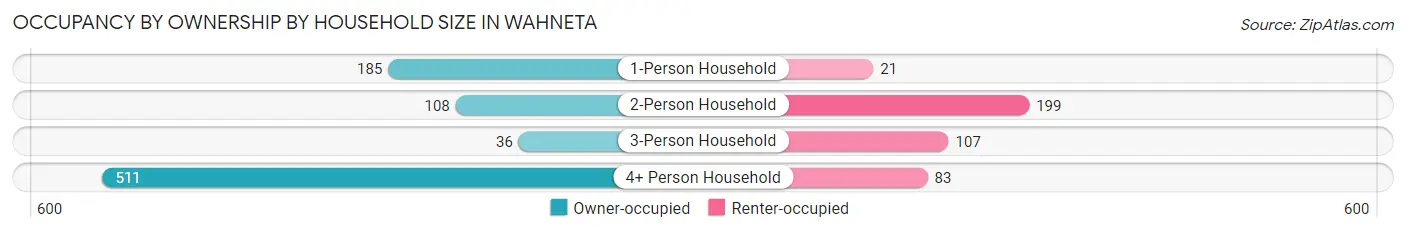
| Household Size | Owner-occupied | Renter-occupied |
| 1-Person Household | 185 (89.8%) | 21 (10.2%) |
| 2-Person Household | 108 (35.2%) | 199 (64.8%) |
| 3-Person Household | 36 (25.2%) | 107 (74.8%) |
| 4+ Person Household | 511 (86.0%) | 83 (14.0%) |
| Total Housing Units | 840 (67.2%) | 410 (32.8%) |
Occupancy by Educational Attainment in Wahneta
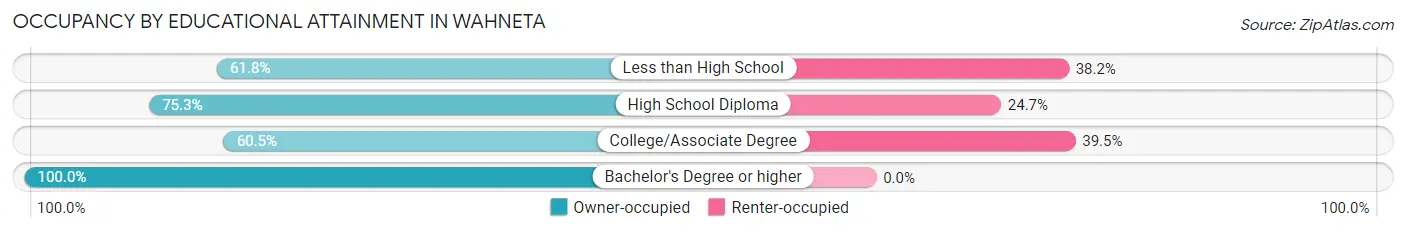
| Household Size | Owner-occupied | Renter-occupied |
| Less than High School | 371 (61.8%) | 229 (38.2%) |
| High School Diploma | 271 (75.3%) | 89 (24.7%) |
| College/Associate Degree | 141 (60.5%) | 92 (39.5%) |
| Bachelor's Degree or higher | 57 (100.0%) | 0 (0.0%) |
Occupancy by Age of Householder in Wahneta
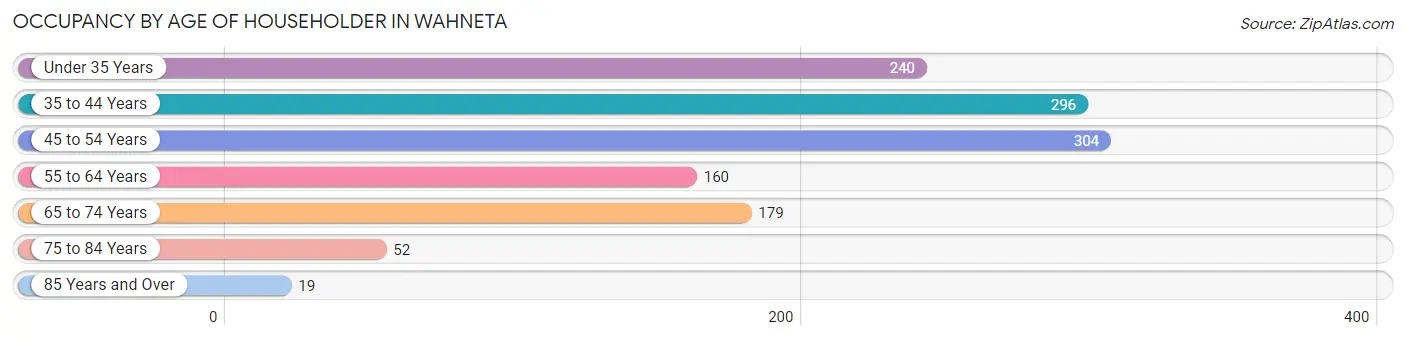
| Age Bracket | # Households | % Households |
| Under 35 Years | 240 | 19.2% |
| 35 to 44 Years | 296 | 23.7% |
| 45 to 54 Years | 304 | 24.3% |
| 55 to 64 Years | 160 | 12.8% |
| 65 to 74 Years | 179 | 14.3% |
| 75 to 84 Years | 52 | 4.2% |
| 85 Years and Over | 19 | 1.5% |
| Total | 1,250 | 100.0% |
Housing Finances in Wahneta
Median Income by Occupancy in Wahneta
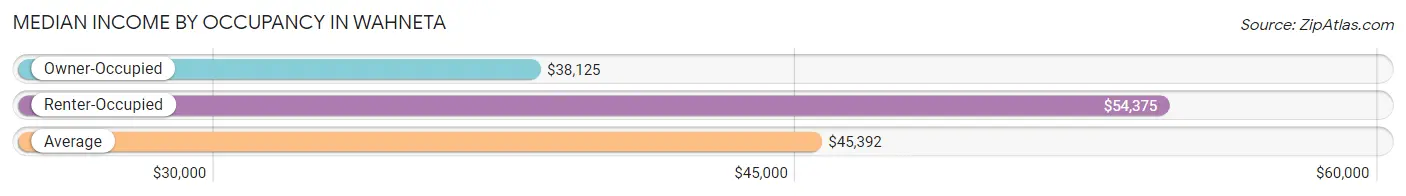
| Occupancy Type | # Households | Median Income |
| Owner-Occupied | 840 (67.2%) | $38,125 |
| Renter-Occupied | 410 (32.8%) | $54,375 |
| Average | 1,250 (100.0%) | $45,392 |
Occupancy by Householder Income Bracket in Wahneta
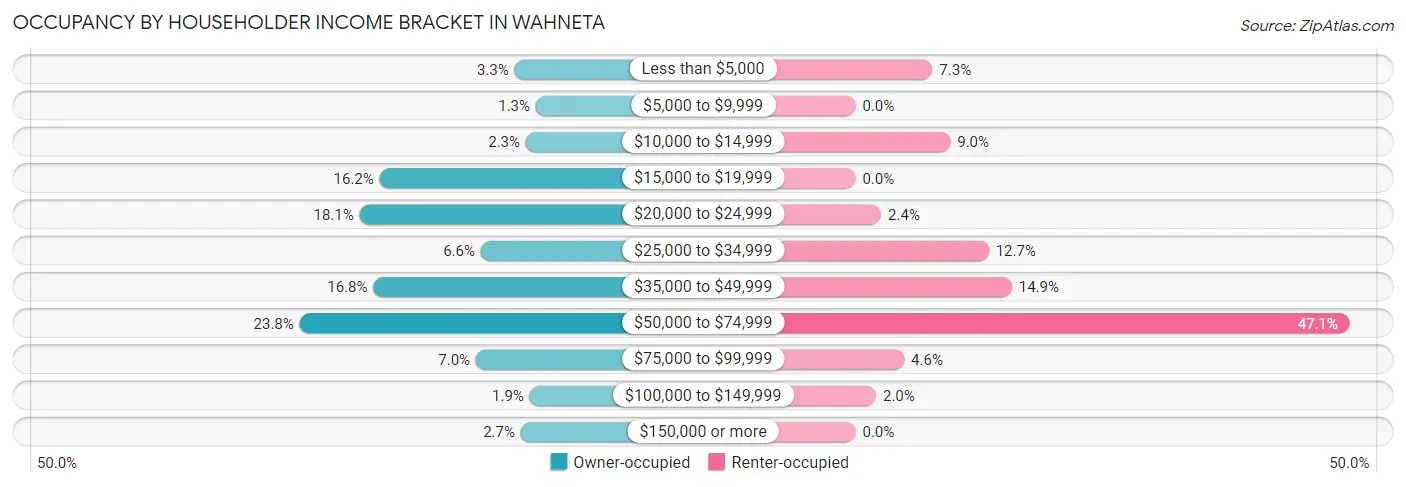
| Income Bracket | Owner-occupied | Renter-occupied |
| Less than $5,000 | 28 (3.3%) | 30 (7.3%) |
| $5,000 to $9,999 | 11 (1.3%) | 0 (0.0%) |
| $10,000 to $14,999 | 19 (2.3%) | 37 (9.0%) |
| $15,000 to $19,999 | 136 (16.2%) | 0 (0.0%) |
| $20,000 to $24,999 | 152 (18.1%) | 10 (2.4%) |
| $25,000 to $34,999 | 55 (6.6%) | 52 (12.7%) |
| $35,000 to $49,999 | 141 (16.8%) | 61 (14.9%) |
| $50,000 to $74,999 | 200 (23.8%) | 193 (47.1%) |
| $75,000 to $99,999 | 59 (7.0%) | 19 (4.6%) |
| $100,000 to $149,999 | 16 (1.9%) | 8 (1.9%) |
| $150,000 or more | 23 (2.7%) | 0 (0.0%) |
| Total | 840 (100.0%) | 410 (100.0%) |
Monthly Housing Cost Tiers in Wahneta
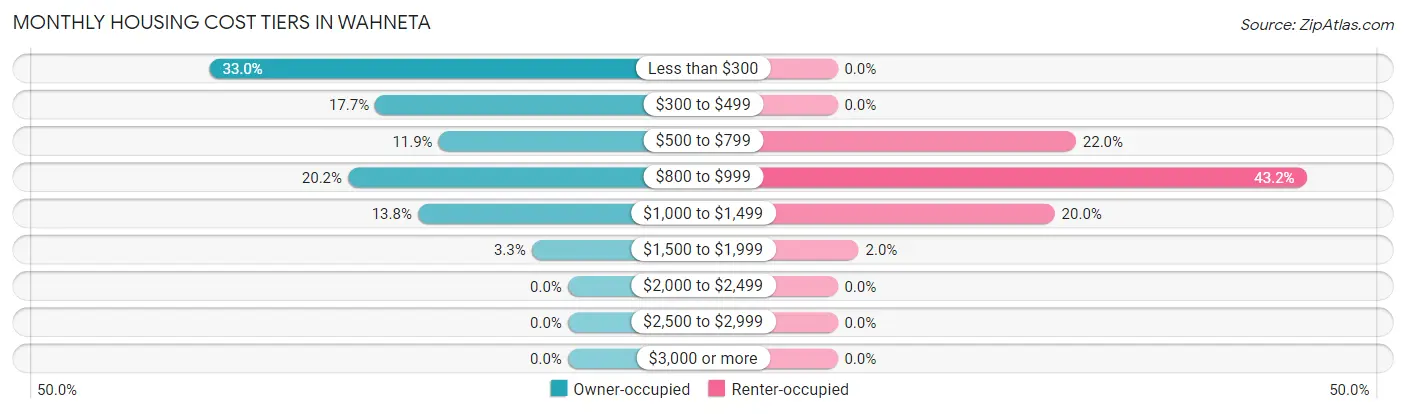
| Monthly Cost | Owner-occupied | Renter-occupied |
| Less than $300 | 277 (33.0%) | 0 (0.0%) |
| $300 to $499 | 149 (17.7%) | 0 (0.0%) |
| $500 to $799 | 100 (11.9%) | 90 (22.0%) |
| $800 to $999 | 170 (20.2%) | 177 (43.2%) |
| $1,000 to $1,499 | 116 (13.8%) | 82 (20.0%) |
| $1,500 to $1,999 | 28 (3.3%) | 8 (1.9%) |
| $2,000 to $2,499 | 0 (0.0%) | 0 (0.0%) |
| $2,500 to $2,999 | 0 (0.0%) | 0 (0.0%) |
| $3,000 or more | 0 (0.0%) | 0 (0.0%) |
| Total | 840 (100.0%) | 410 (100.0%) |
Physical Housing Characteristics in Wahneta
Housing Structures in Wahneta
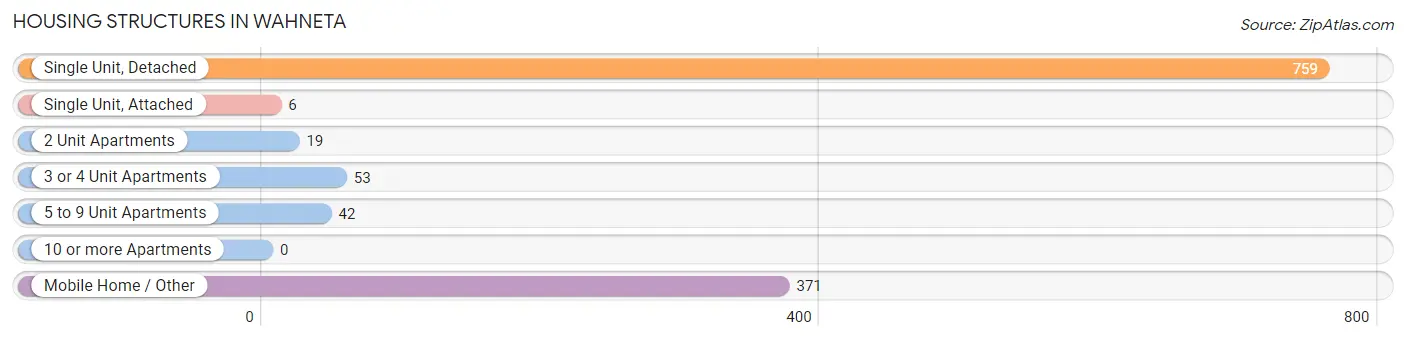
| Structure Type | # Housing Units | % Housing Units |
| Single Unit, Detached | 759 | 60.7% |
| Single Unit, Attached | 6 | 0.5% |
| 2 Unit Apartments | 19 | 1.5% |
| 3 or 4 Unit Apartments | 53 | 4.2% |
| 5 to 9 Unit Apartments | 42 | 3.4% |
| 10 or more Apartments | 0 | 0.0% |
| Mobile Home / Other | 371 | 29.7% |
| Total | 1,250 | 100.0% |
Housing Structures by Occupancy in Wahneta
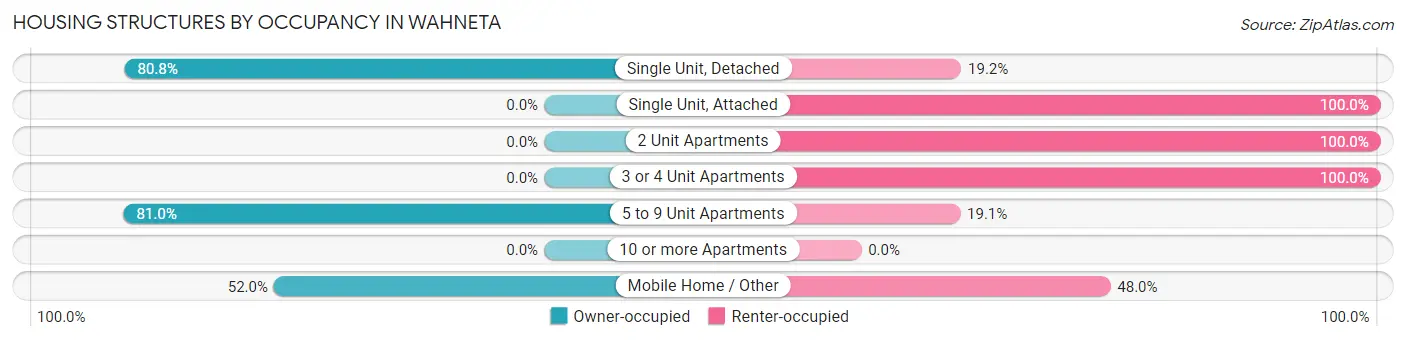
| Structure Type | Owner-occupied | Renter-occupied |
| Single Unit, Detached | 613 (80.8%) | 146 (19.2%) |
| Single Unit, Attached | 0 (0.0%) | 6 (100.0%) |
| 2 Unit Apartments | 0 (0.0%) | 19 (100.0%) |
| 3 or 4 Unit Apartments | 0 (0.0%) | 53 (100.0%) |
| 5 to 9 Unit Apartments | 34 (80.9%) | 8 (19.1%) |
| 10 or more Apartments | 0 (0.0%) | 0 (0.0%) |
| Mobile Home / Other | 193 (52.0%) | 178 (48.0%) |
| Total | 840 (67.2%) | 410 (32.8%) |
Housing Structures by Number of Rooms in Wahneta
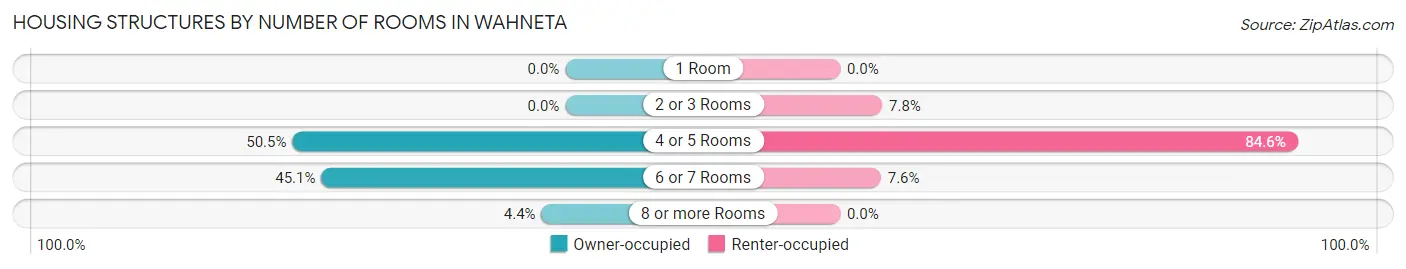
| Number of Rooms | Owner-occupied | Renter-occupied |
| 1 Room | 0 (0.0%) | 0 (0.0%) |
| 2 or 3 Rooms | 0 (0.0%) | 32 (7.8%) |
| 4 or 5 Rooms | 424 (50.5%) | 347 (84.6%) |
| 6 or 7 Rooms | 379 (45.1%) | 31 (7.6%) |
| 8 or more Rooms | 37 (4.4%) | 0 (0.0%) |
| Total | 840 (100.0%) | 410 (100.0%) |
Housing Structure by Heating Type in Wahneta
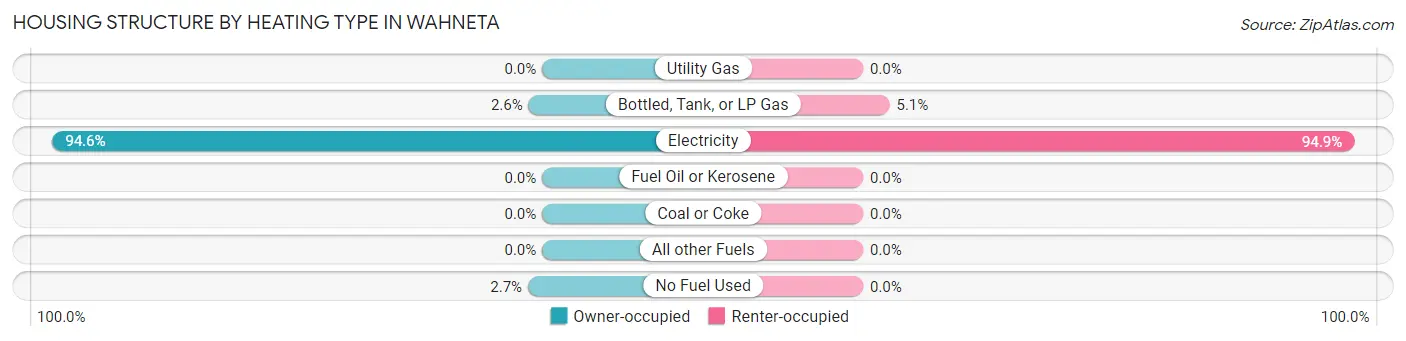
| Heating Type | Owner-occupied | Renter-occupied |
| Utility Gas | 0 (0.0%) | 0 (0.0%) |
| Bottled, Tank, or LP Gas | 22 (2.6%) | 21 (5.1%) |
| Electricity | 795 (94.6%) | 389 (94.9%) |
| Fuel Oil or Kerosene | 0 (0.0%) | 0 (0.0%) |
| Coal or Coke | 0 (0.0%) | 0 (0.0%) |
| All other Fuels | 0 (0.0%) | 0 (0.0%) |
| No Fuel Used | 23 (2.7%) | 0 (0.0%) |
| Total | 840 (100.0%) | 410 (100.0%) |
Household Vehicle Usage in Wahneta
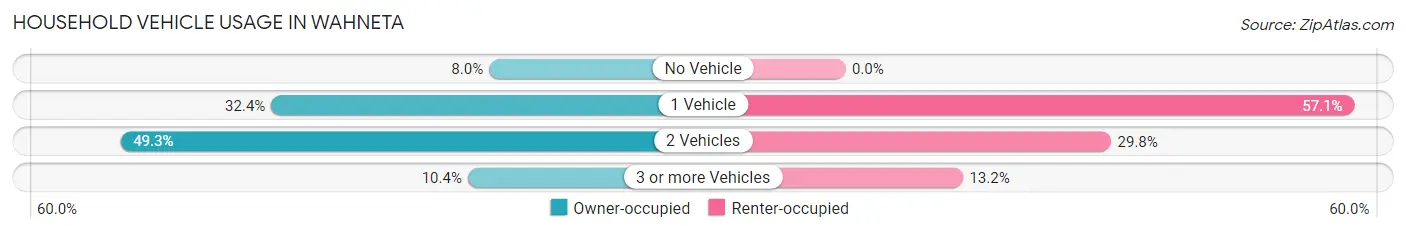
| Vehicles per Household | Owner-occupied | Renter-occupied |
| No Vehicle | 67 (8.0%) | 0 (0.0%) |
| 1 Vehicle | 272 (32.4%) | 234 (57.1%) |
| 2 Vehicles | 414 (49.3%) | 122 (29.8%) |
| 3 or more Vehicles | 87 (10.4%) | 54 (13.2%) |
| Total | 840 (100.0%) | 410 (100.0%) |
Real Estate & Mortgages in Wahneta
Real Estate and Mortgage Overview in Wahneta
| Characteristic | Without Mortgage | With Mortgage |
| Housing Units | 558 | 282 |
| Median Property Value | $48,000 | $153,900 |
| Median Household Income | $42,333 | $23 |
| Monthly Housing Costs | $302 | $0 |
| Real Estate Taxes | $785 | $0 |
Property Value by Mortgage Status in Wahneta
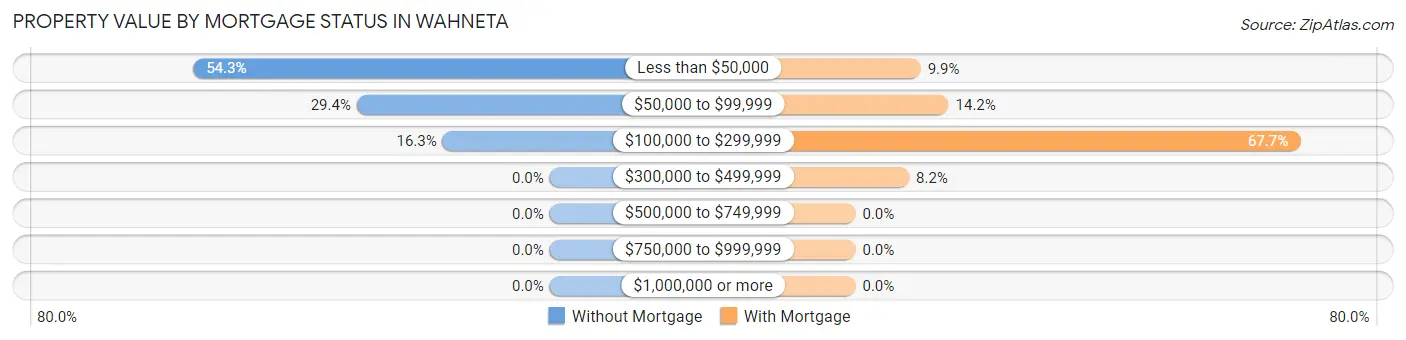
| Property Value | Without Mortgage | With Mortgage |
| Less than $50,000 | 303 (54.3%) | 28 (9.9%) |
| $50,000 to $99,999 | 164 (29.4%) | 40 (14.2%) |
| $100,000 to $299,999 | 91 (16.3%) | 191 (67.7%) |
| $300,000 to $499,999 | 0 (0.0%) | 23 (8.2%) |
| $500,000 to $749,999 | 0 (0.0%) | 0 (0.0%) |
| $750,000 to $999,999 | 0 (0.0%) | 0 (0.0%) |
| $1,000,000 or more | 0 (0.0%) | 0 (0.0%) |
| Total | 558 (100.0%) | 282 (100.0%) |
Household Income by Mortgage Status in Wahneta
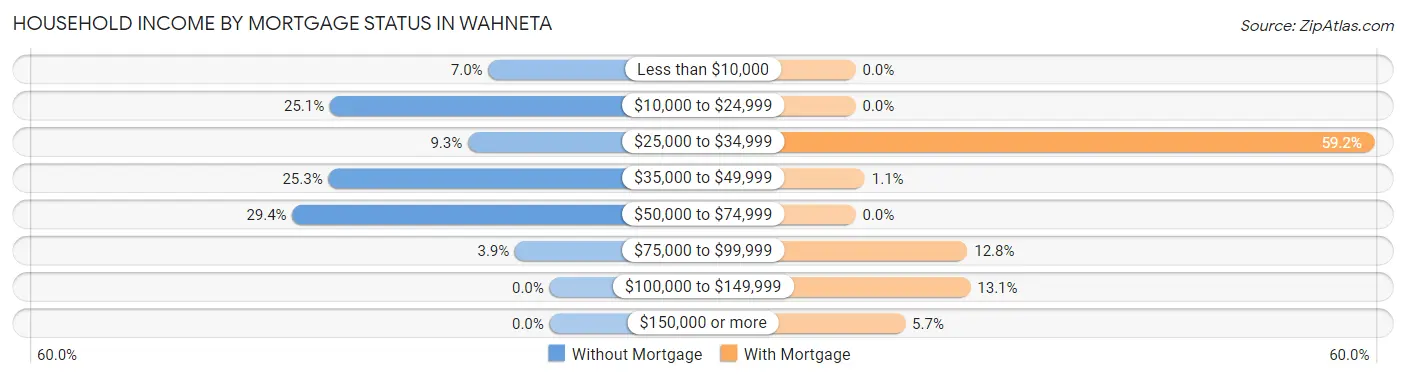
| Household Income | Without Mortgage | With Mortgage |
| Less than $10,000 | 39 (7.0%) | 0 (0.0%) |
| $10,000 to $24,999 | 140 (25.1%) | 0 (0.0%) |
| $25,000 to $34,999 | 52 (9.3%) | 167 (59.2%) |
| $35,000 to $49,999 | 141 (25.3%) | 3 (1.1%) |
| $50,000 to $74,999 | 164 (29.4%) | 0 (0.0%) |
| $75,000 to $99,999 | 22 (3.9%) | 36 (12.8%) |
| $100,000 to $149,999 | 0 (0.0%) | 37 (13.1%) |
| $150,000 or more | 0 (0.0%) | 16 (5.7%) |
| Total | 558 (100.0%) | 282 (100.0%) |
Property Value to Household Income Ratio in Wahneta
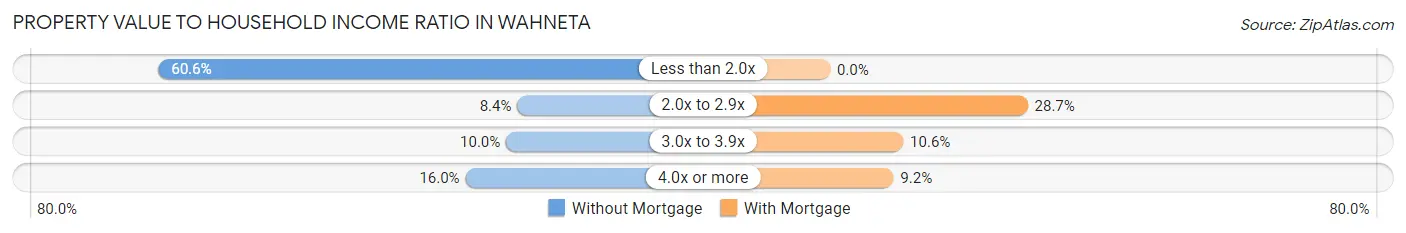
| Value-to-Income Ratio | Without Mortgage | With Mortgage |
| Less than 2.0x | 338 (60.6%) | 0 (0.0%) |
| 2.0x to 2.9x | 47 (8.4%) | 81 (28.7%) |
| 3.0x to 3.9x | 56 (10.0%) | 30 (10.6%) |
| 4.0x or more | 89 (16.0%) | 26 (9.2%) |
| Total | 558 (100.0%) | 282 (100.0%) |
Real Estate Taxes by Mortgage Status in Wahneta
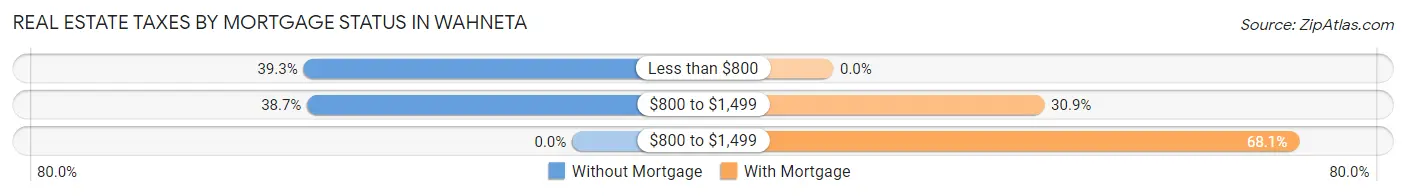
| Property Taxes | Without Mortgage | With Mortgage |
| Less than $800 | 219 (39.3%) | 0 (0.0%) |
| $800 to $1,499 | 216 (38.7%) | 87 (30.8%) |
| $800 to $1,499 | 0 (0.0%) | 192 (68.1%) |
| Total | 558 (100.0%) | 282 (100.0%) |
Health & Disability in Wahneta
Health Insurance Coverage by Age in Wahneta
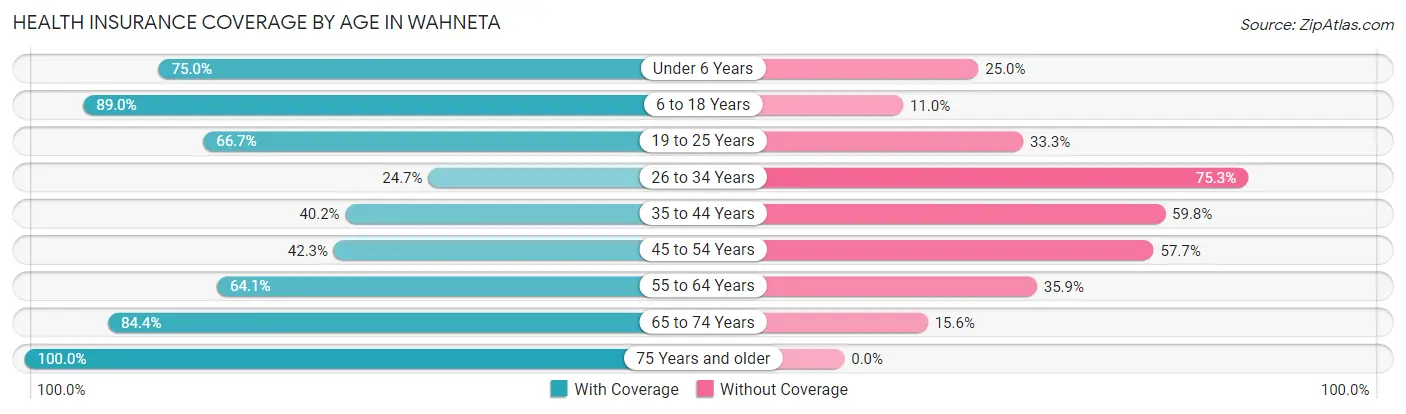
| Age Bracket | With Coverage | Without Coverage |
| Under 6 Years | 207 (75.0%) | 69 (25.0%) |
| 6 to 18 Years | 1,202 (89.0%) | 148 (11.0%) |
| 19 to 25 Years | 244 (66.7%) | 122 (33.3%) |
| 26 to 34 Years | 106 (24.7%) | 323 (75.3%) |
| 35 to 44 Years | 239 (40.2%) | 356 (59.8%) |
| 45 to 54 Years | 273 (42.3%) | 372 (57.7%) |
| 55 to 64 Years | 200 (64.1%) | 112 (35.9%) |
| 65 to 74 Years | 266 (84.4%) | 49 (15.6%) |
| 75 Years and older | 97 (100.0%) | 0 (0.0%) |
| Total | 2,834 (64.6%) | 1,551 (35.4%) |
Health Insurance Coverage by Citizenship Status in Wahneta
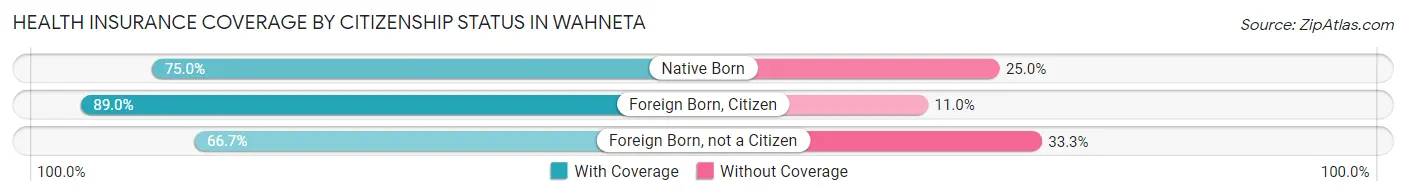
| Citizenship Status | With Coverage | Without Coverage |
| Native Born | 207 (75.0%) | 69 (25.0%) |
| Foreign Born, Citizen | 1,202 (89.0%) | 148 (11.0%) |
| Foreign Born, not a Citizen | 244 (66.7%) | 122 (33.3%) |
Health Insurance Coverage by Household Income in Wahneta
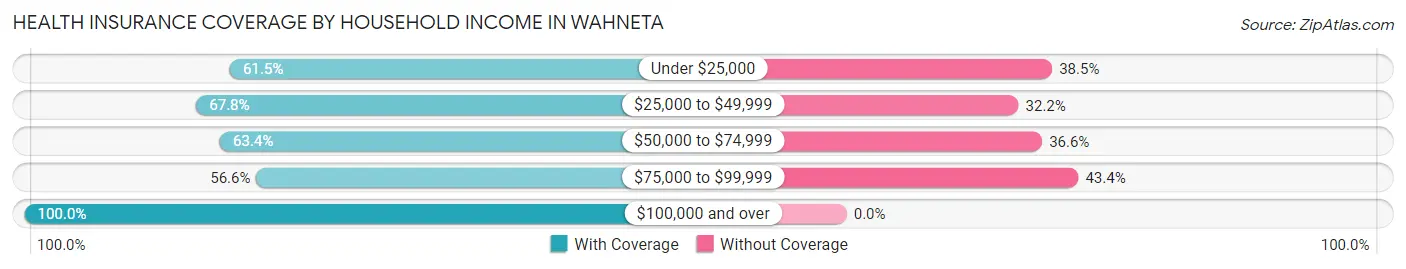
| Household Income | With Coverage | Without Coverage |
| Under $25,000 | 855 (61.5%) | 535 (38.5%) |
| $25,000 to $49,999 | 655 (67.8%) | 311 (32.2%) |
| $50,000 to $74,999 | 987 (63.4%) | 570 (36.6%) |
| $75,000 to $99,999 | 176 (56.6%) | 135 (43.4%) |
| $100,000 and over | 161 (100.0%) | 0 (0.0%) |
Public vs Private Health Insurance Coverage by Age in Wahneta
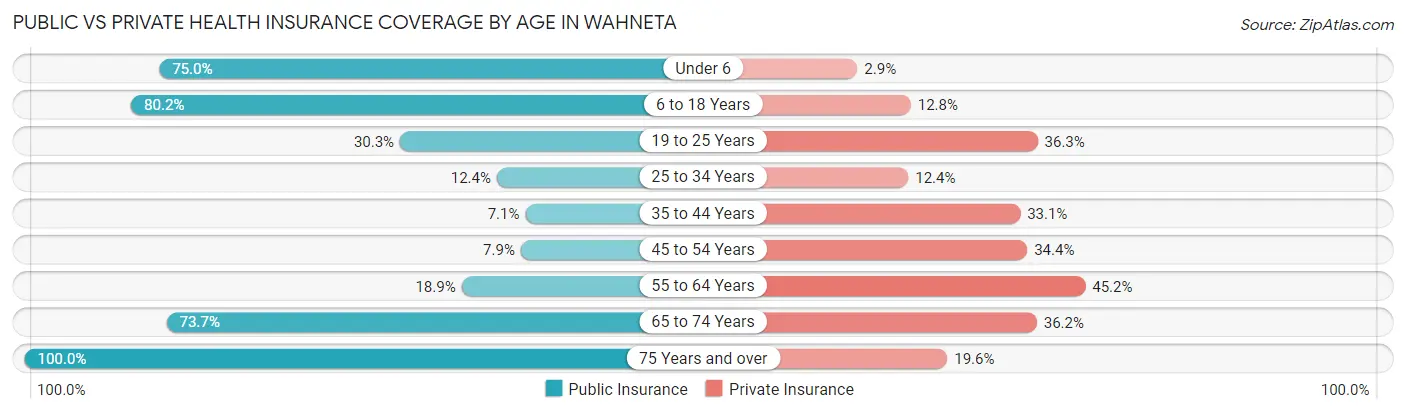
| Age Bracket | Public Insurance | Private Insurance |
| Under 6 | 207 (75.0%) | 8 (2.9%) |
| 6 to 18 Years | 1,083 (80.2%) | 173 (12.8%) |
| 19 to 25 Years | 111 (30.3%) | 133 (36.3%) |
| 25 to 34 Years | 53 (12.3%) | 53 (12.3%) |
| 35 to 44 Years | 42 (7.1%) | 197 (33.1%) |
| 45 to 54 Years | 51 (7.9%) | 222 (34.4%) |
| 55 to 64 Years | 59 (18.9%) | 141 (45.2%) |
| 65 to 74 Years | 232 (73.7%) | 114 (36.2%) |
| 75 Years and over | 97 (100.0%) | 19 (19.6%) |
| Total | 1,935 (44.1%) | 1,060 (24.2%) |
Disability Status by Sex by Age in Wahneta
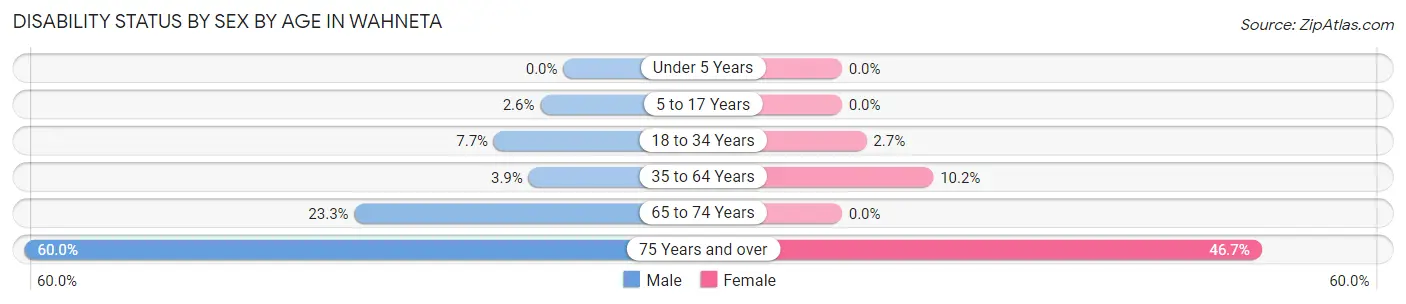
| Age Bracket | Male | Female |
| Under 5 Years | 0 (0.0%) | 0 (0.0%) |
| 5 to 17 Years | 20 (2.6%) | 0 (0.0%) |
| 18 to 34 Years | 28 (7.7%) | 15 (2.7%) |
| 35 to 64 Years | 27 (3.9%) | 87 (10.2%) |
| 65 to 74 Years | 47 (23.3%) | 0 (0.0%) |
| 75 Years and over | 3 (60.0%) | 43 (46.7%) |
Disability Class by Sex by Age in Wahneta
Disability Class: Hearing Difficulty
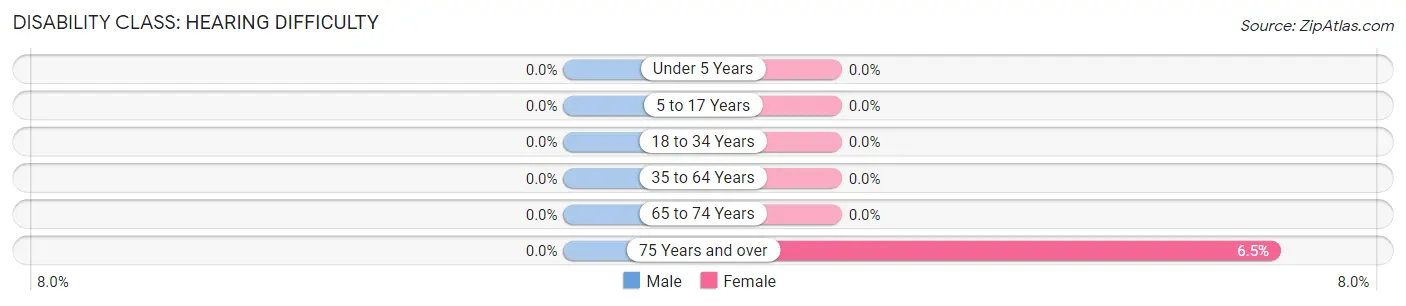
| Age Bracket | Male | Female |
| Under 5 Years | 0 (0.0%) | 0 (0.0%) |
| 5 to 17 Years | 0 (0.0%) | 0 (0.0%) |
| 18 to 34 Years | 0 (0.0%) | 0 (0.0%) |
| 35 to 64 Years | 0 (0.0%) | 0 (0.0%) |
| 65 to 74 Years | 0 (0.0%) | 0 (0.0%) |
| 75 Years and over | 0 (0.0%) | 6 (6.5%) |
Disability Class: Vision Difficulty
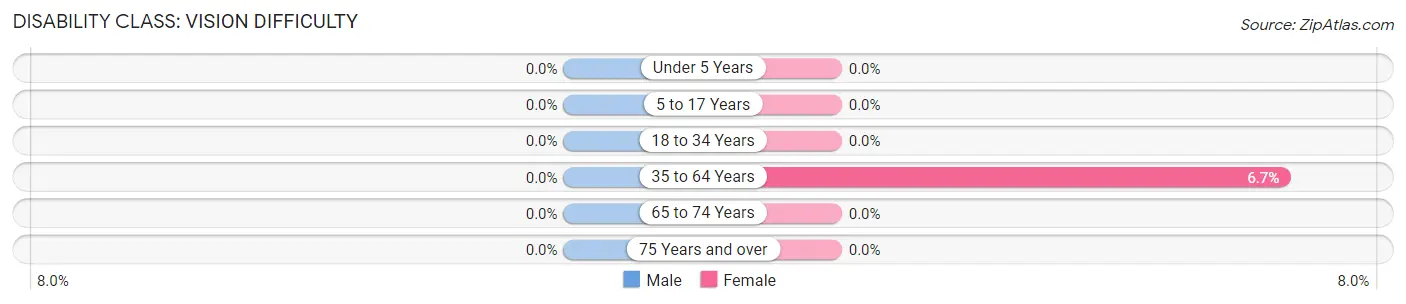
| Age Bracket | Male | Female |
| Under 5 Years | 0 (0.0%) | 0 (0.0%) |
| 5 to 17 Years | 0 (0.0%) | 0 (0.0%) |
| 18 to 34 Years | 0 (0.0%) | 0 (0.0%) |
| 35 to 64 Years | 0 (0.0%) | 57 (6.7%) |
| 65 to 74 Years | 0 (0.0%) | 0 (0.0%) |
| 75 Years and over | 0 (0.0%) | 0 (0.0%) |
Disability Class: Cognitive Difficulty
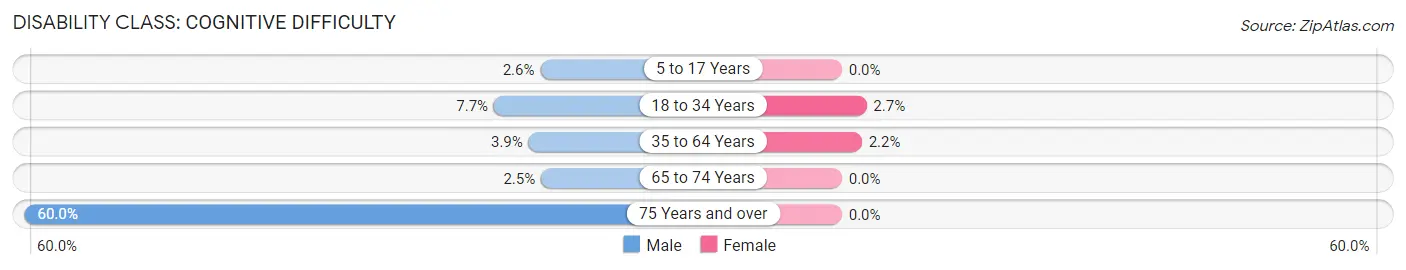
| Age Bracket | Male | Female |
| 5 to 17 Years | 20 (2.6%) | 0 (0.0%) |
| 18 to 34 Years | 28 (7.7%) | 15 (2.7%) |
| 35 to 64 Years | 27 (3.9%) | 19 (2.2%) |
| 65 to 74 Years | 5 (2.5%) | 0 (0.0%) |
| 75 Years and over | 3 (60.0%) | 0 (0.0%) |
Disability Class: Ambulatory Difficulty
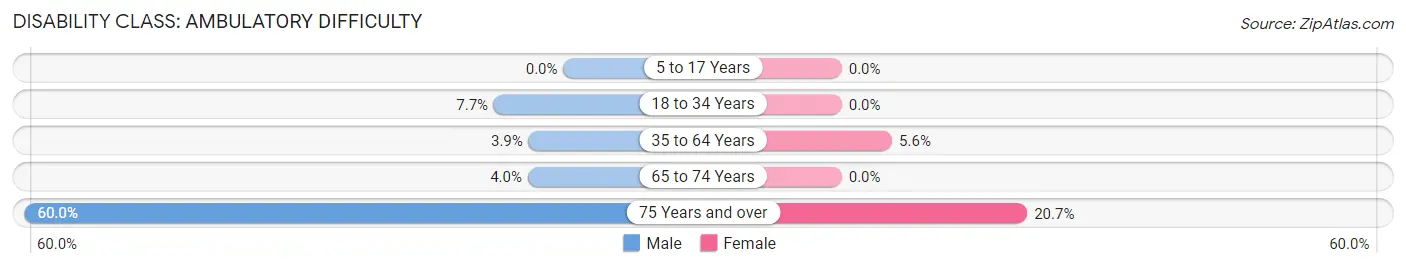
| Age Bracket | Male | Female |
| 5 to 17 Years | 0 (0.0%) | 0 (0.0%) |
| 18 to 34 Years | 28 (7.7%) | 0 (0.0%) |
| 35 to 64 Years | 27 (3.9%) | 48 (5.6%) |
| 65 to 74 Years | 8 (4.0%) | 0 (0.0%) |
| 75 Years and over | 3 (60.0%) | 19 (20.6%) |
Disability Class: Self-Care Difficulty
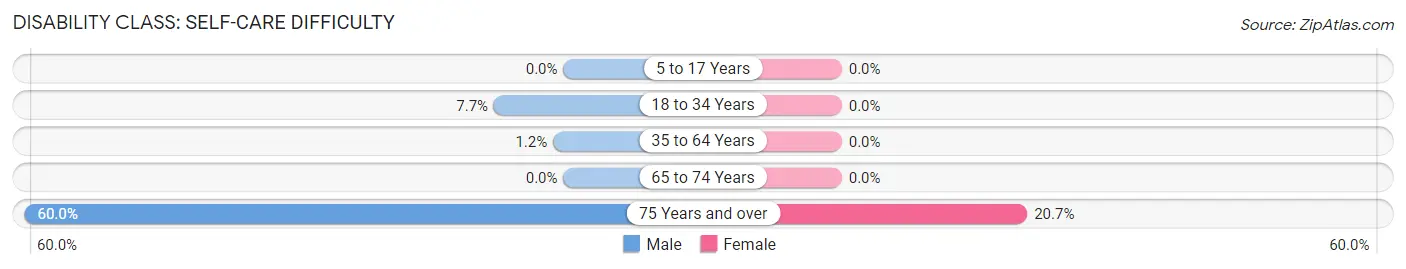
| Age Bracket | Male | Female |
| 5 to 17 Years | 0 (0.0%) | 0 (0.0%) |
| 18 to 34 Years | 28 (7.7%) | 0 (0.0%) |
| 35 to 64 Years | 8 (1.1%) | 0 (0.0%) |
| 65 to 74 Years | 0 (0.0%) | 0 (0.0%) |
| 75 Years and over | 3 (60.0%) | 19 (20.6%) |
Technology Access in Wahneta
Computing Device Access in Wahneta
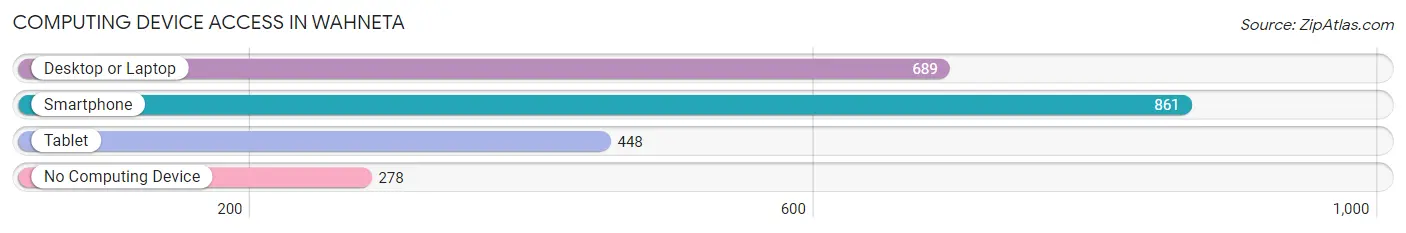
| Device Type | # Households | % Households |
| Desktop or Laptop | 689 | 55.1% |
| Smartphone | 861 | 68.9% |
| Tablet | 448 | 35.8% |
| No Computing Device | 278 | 22.2% |
| Total | 1,250 | 100.0% |
Internet Access in Wahneta
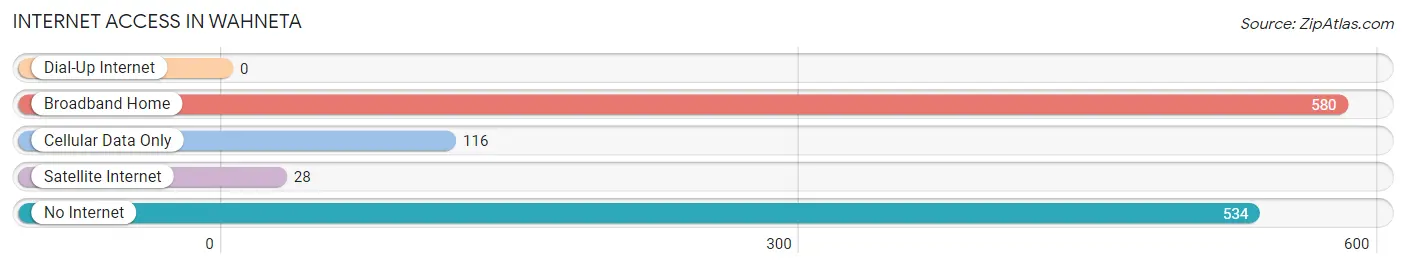
| Internet Type | # Households | % Households |
| Dial-Up Internet | 0 | 0.0% |
| Broadband Home | 580 | 46.4% |
| Cellular Data Only | 116 | 9.3% |
| Satellite Internet | 28 | 2.2% |
| No Internet | 534 | 42.7% |
| Total | 1,250 | 100.0% |
Wahneta Summary
Wahneta is an unincorporated community located in Polk County, Florida, United States. It is located on the south side of Lake Pierce, just east of the city of Winter Haven. The population of Wahneta was estimated to be 1,845 in 2019.
History
Wahneta was originally known as "Wahneta Station" when it was established in 1883. The name was derived from the Seminole Indian word for "water". The area was originally used as a stop on the South Florida Railroad, which ran from Sanford to Tampa. The railroad was later replaced by the Atlantic Coast Line Railroad, which ran from Jacksonville to Tampa.
The first post office in Wahneta was established in 1885. The town was officially incorporated in 1887. The first mayor of Wahneta was William H. Smith.
Geography
Wahneta is located in central Florida, approximately 25 miles east of Tampa and 40 miles southwest of Orlando. It is situated on the south side of Lake Pierce, just east of the city of Winter Haven. The town is bordered by the cities of Auburndale to the north, Lake Alfred to the east, and Eagle Lake to the south.
The terrain of Wahneta is mostly flat, with some rolling hills. The area is mostly rural, with some residential and commercial development. The town is home to several lakes, including Lake Pierce, Lake Alfred, and Lake Hamilton.
Economy
The economy of Wahneta is largely based on agriculture and tourism. The town is home to several citrus groves, as well as a number of small businesses. The town is also home to several tourist attractions, including the Polk County Historical Museum and the Wahneta Country Club.
Demographics
As of the 2010 census, the population of Wahneta was 1,845. The racial makeup of the town was 79.3% White, 15.2% African American, 0.3% Native American, 0.7% Asian, 0.1% Pacific Islander, 2.2% from other races, and 2.4% from two or more races. Hispanic or Latino of any race were 6.2% of the population.
The median household income in Wahneta was $37,917, and the median family income was $45,938. The per capita income for the town was $19,945. About 11.3% of families and 14.2% of the population were below the poverty line, including 19.2% of those under age 18 and 8.2% of those age 65 or over.
Common Questions
What is Per Capita Income in Wahneta?
Per Capita income in Wahneta is $14,046.
What is the Median Family Income in Wahneta?
Median Family Income in Wahneta is $41,953.
What is the Median Household income in Wahneta?
Median Household Income in Wahneta is $45,392.
What is Income or Wage Gap in Wahneta?
Income or Wage Gap in Wahneta is 32.3%.
Women in Wahneta earn 67.7 cents for every dollar earned by a man.
What is Family Income Deficit in Wahneta?
Family Income Deficit in Wahneta is $13,102.
Families that are below poverty line in Wahneta earn $13,102 less on average than the poverty threshold level.
What is Inequality or Gini Index in Wahneta?
Inequality or Gini Index in Wahneta is 0.35.
What is the Total Population of Wahneta?
Total Population of Wahneta is 4,406.
What is the Total Male Population of Wahneta?
Total Male Population of Wahneta is 2,104.
What is the Total Female Population of Wahneta?
Total Female Population of Wahneta is 2,302.
What is the Ratio of Males per 100 Females in Wahneta?
There are 91.40 Males per 100 Females in Wahneta.
What is the Ratio of Females per 100 Males in Wahneta?
There are 109.41 Females per 100 Males in Wahneta.
What is the Median Population Age in Wahneta?
Median Population Age in Wahneta is 31.5 Years.
What is the Average Family Size in Wahneta
Average Family Size in Wahneta is 4.1 People.
What is the Average Household Size in Wahneta
Average Household Size in Wahneta is 3.5 People.
How Large is the Labor Force in Wahneta?
There are 1,685 People in the Labor Forcein in Wahneta.
What is the Percentage of People in the Labor Force in Wahneta?
53.1% of People are in the Labor Force in Wahneta.
What is the Unemployment Rate in Wahneta?
Unemployment Rate in Wahneta is 4.3%.