Valrico, FL Map & Demographics
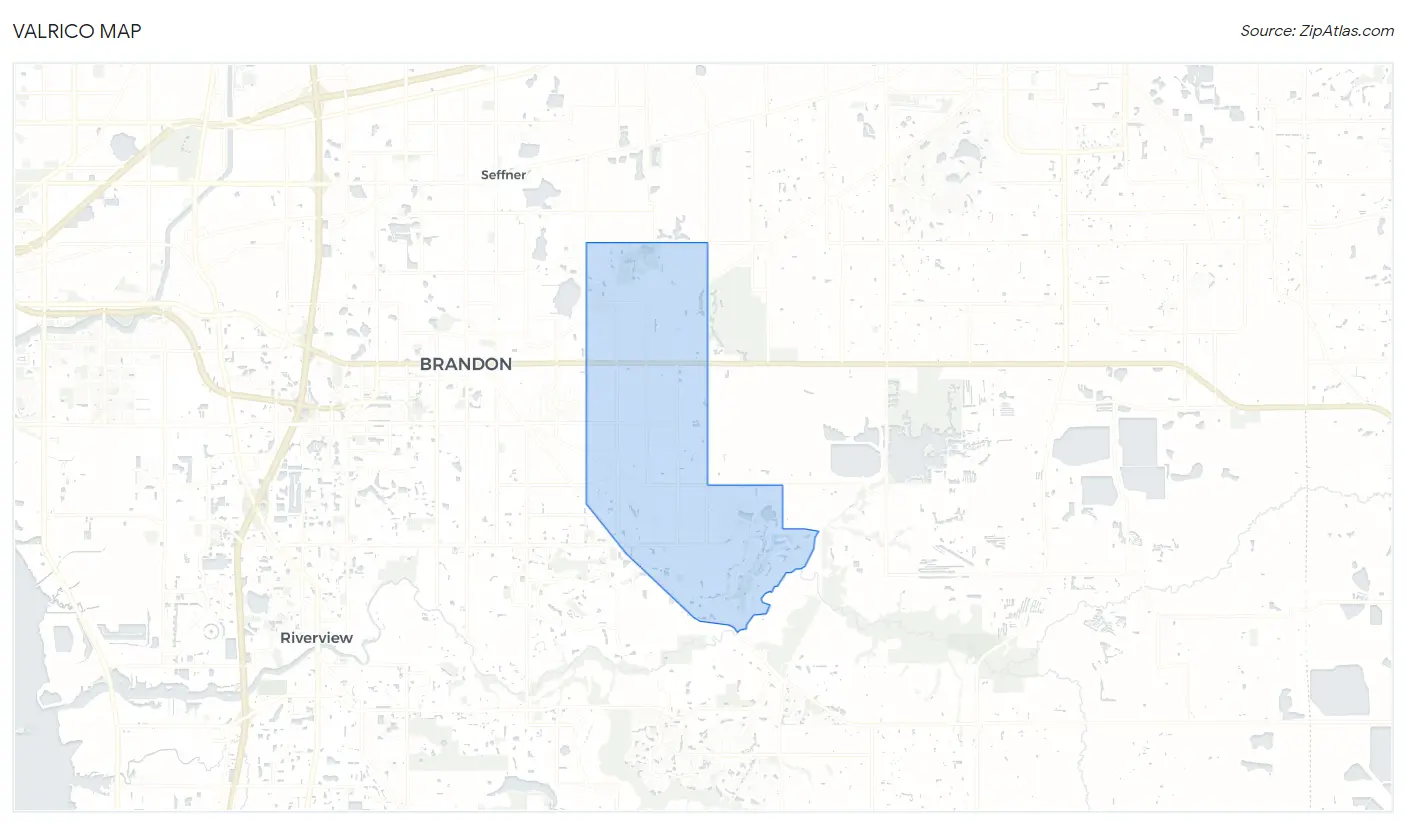
Valrico Map
Valrico Overview
$42,389
PER CAPITA INCOME
$109,330
AVG FAMILY INCOME
$91,704
AVG HOUSEHOLD INCOME
29.5%
WAGE / INCOME GAP [ % ]
70.5¢/ $1
WAGE / INCOME GAP [ $ ]
$8,470
FAMILY INCOME DEFICIT
0.41
INEQUALITY / GINI INDEX
38,594
TOTAL POPULATION
17,950
MALE POPULATION
20,644
FEMALE POPULATION
86.95
MALES / 100 FEMALES
115.01
FEMALES / 100 MALES
45.3
MEDIAN AGE
3.1
AVG FAMILY SIZE
2.7
AVG HOUSEHOLD SIZE
21,151
LABOR FORCE [ PEOPLE ]
65.5%
PERCENT IN LABOR FORCE
4.1%
UNEMPLOYMENT RATE
Valrico Area Codes
Income in Valrico
Income Overview in Valrico
Per Capita Income in Valrico is $42,389, while median incomes of families and households are $109,330 and $91,704 respectively.
| Characteristic | Number | Measure |
| Per Capita Income | 38,594 | $42,389 |
| Median Family Income | 10,476 | $109,330 |
| Mean Family Income | 10,476 | $128,903 |
| Median Household Income | 14,088 | $91,704 |
| Mean Household Income | 14,088 | $113,200 |
| Income Deficit | 10,476 | $8,470 |
| Wage / Income Gap (%) | 38,594 | 29.54% |
| Wage / Income Gap ($) | 38,594 | 70.46¢ per $1 |
| Gini / Inequality Index | 38,594 | 0.41 |
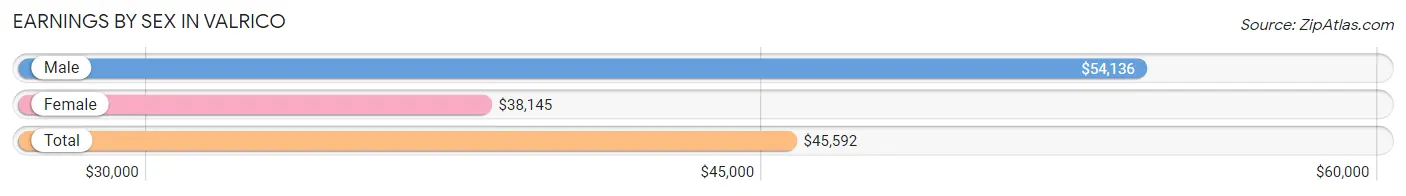
Earnings by Sex in Valrico
Average Earnings in Valrico are $45,592, $54,136 for men and $38,145 for women, a difference of 29.5%.
| Sex | Number | Average Earnings |
| Male | 10,786 (49.6%) | $54,136 |
| Female | 10,958 (50.4%) | $38,145 |
| Total | 21,744 (100.0%) | $45,592 |
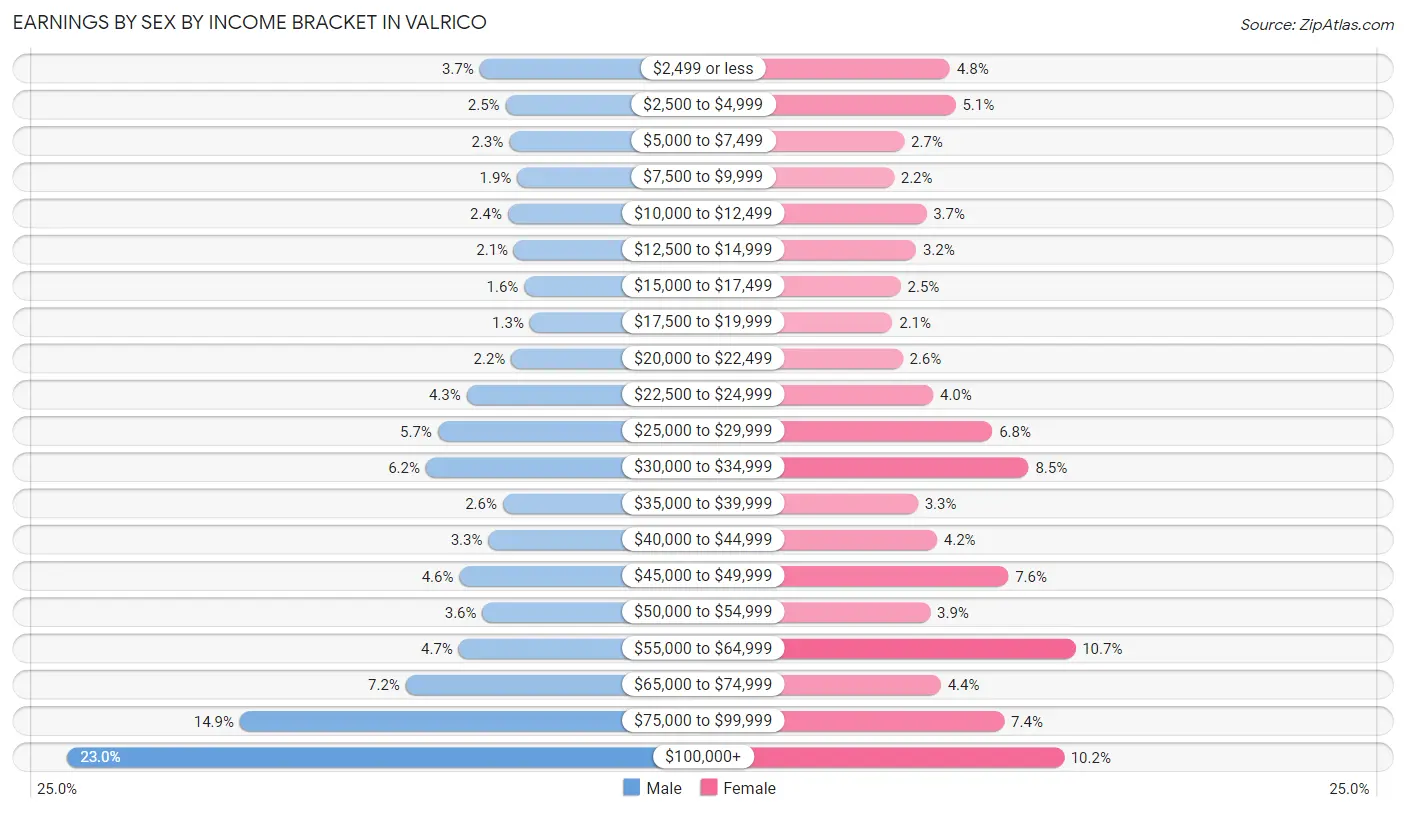
Earnings by Sex by Income Bracket in Valrico
The most common earnings brackets in Valrico are $100,000+ for men (2,481 | 23.0%) and $55,000 to $64,999 for women (1,172 | 10.7%).
| Income | Male | Female |
| $2,499 or less | 398 (3.7%) | 529 (4.8%) |
| $2,500 to $4,999 | 268 (2.5%) | 558 (5.1%) |
| $5,000 to $7,499 | 249 (2.3%) | 294 (2.7%) |
| $7,500 to $9,999 | 208 (1.9%) | 241 (2.2%) |
| $10,000 to $12,499 | 256 (2.4%) | 408 (3.7%) |
| $12,500 to $14,999 | 224 (2.1%) | 355 (3.2%) |
| $15,000 to $17,499 | 173 (1.6%) | 276 (2.5%) |
| $17,500 to $19,999 | 145 (1.3%) | 233 (2.1%) |
| $20,000 to $22,499 | 238 (2.2%) | 286 (2.6%) |
| $22,500 to $24,999 | 464 (4.3%) | 443 (4.0%) |
| $25,000 to $29,999 | 609 (5.7%) | 746 (6.8%) |
| $30,000 to $34,999 | 670 (6.2%) | 933 (8.5%) |
| $35,000 to $39,999 | 280 (2.6%) | 364 (3.3%) |
| $40,000 to $44,999 | 354 (3.3%) | 462 (4.2%) |
| $45,000 to $49,999 | 501 (4.6%) | 828 (7.6%) |
| $50,000 to $54,999 | 384 (3.6%) | 427 (3.9%) |
| $55,000 to $64,999 | 504 (4.7%) | 1,172 (10.7%) |
| $65,000 to $74,999 | 771 (7.1%) | 482 (4.4%) |
| $75,000 to $99,999 | 1,609 (14.9%) | 808 (7.4%) |
| $100,000+ | 2,481 (23.0%) | 1,113 (10.2%) |
| Total | 10,786 (100.0%) | 10,958 (100.0%) |
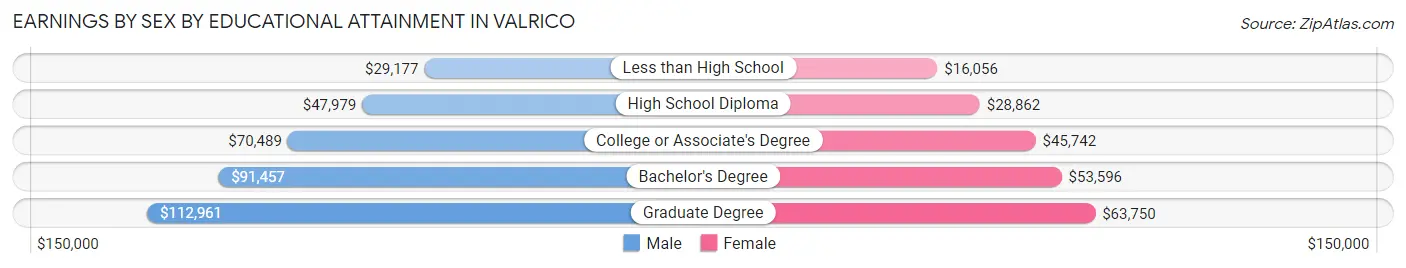
Earnings by Sex by Educational Attainment in Valrico
Average earnings in Valrico are $70,148 for men and $45,858 for women, a difference of 34.6%. Men with an educational attainment of graduate degree enjoy the highest average annual earnings of $112,961, while those with less than high school education earn the least with $29,177. Women with an educational attainment of graduate degree earn the most with the average annual earnings of $63,750, while those with less than high school education have the smallest earnings of $16,056.
| Educational Attainment | Male Income | Female Income |
| Less than High School | $29,177 | $16,056 |
| High School Diploma | $47,979 | $28,862 |
| College or Associate's Degree | $70,489 | $45,742 |
| Bachelor's Degree | $91,457 | $53,596 |
| Graduate Degree | $112,961 | $63,750 |
| Total | $70,148 | $45,858 |
Family Income in Valrico
Family Income Brackets in Valrico
According to the Valrico family income data, there are 2,273 families falling into the $100,000 to $149,999 income range, which is the most common income bracket and makes up 21.7% of all families. Conversely, the $10,000 to $14,999 income bracket is the least frequent group with only 157 families (1.5%) belonging to this category.
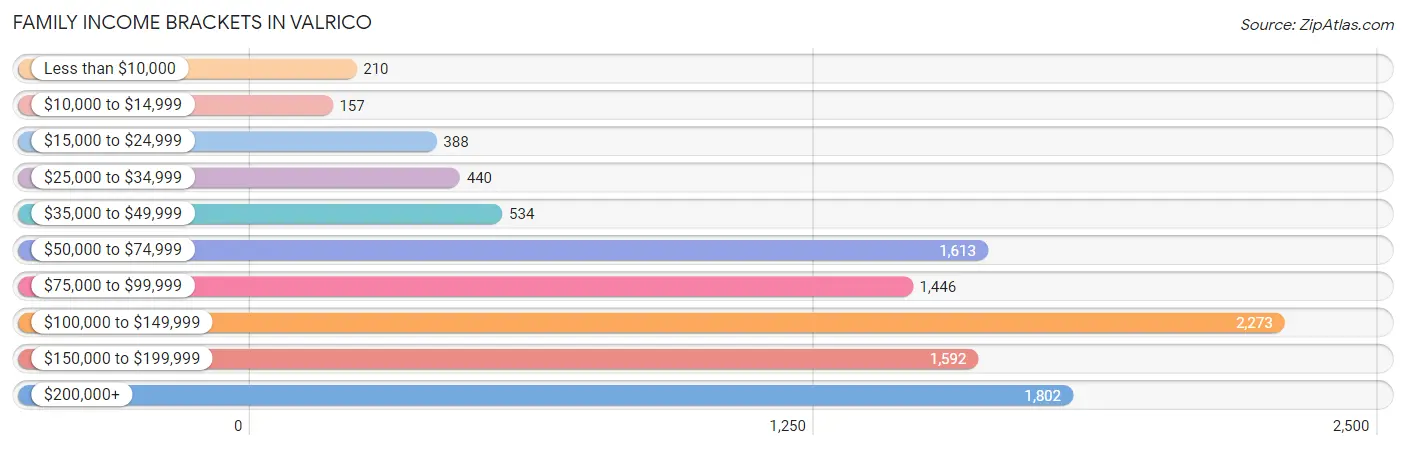
| Income Bracket | # Families | % Families |
| Less than $10,000 | 210 | 2.0% |
| $10,000 to $14,999 | 157 | 1.5% |
| $15,000 to $24,999 | 388 | 3.7% |
| $25,000 to $34,999 | 440 | 4.2% |
| $35,000 to $49,999 | 534 | 5.1% |
| $50,000 to $74,999 | 1,613 | 15.4% |
| $75,000 to $99,999 | 1,446 | 13.8% |
| $100,000 to $149,999 | 2,273 | 21.7% |
| $150,000 to $199,999 | 1,592 | 15.2% |
| $200,000+ | 1,802 | 17.2% |
Family Income by Famaliy Size in Valrico
6-person families (519 | 5.0%) account for the highest median family income in Valrico with $165,344 per family, while 3-person families (2,173 | 20.7%) have the highest median income of $43,470 per family member.
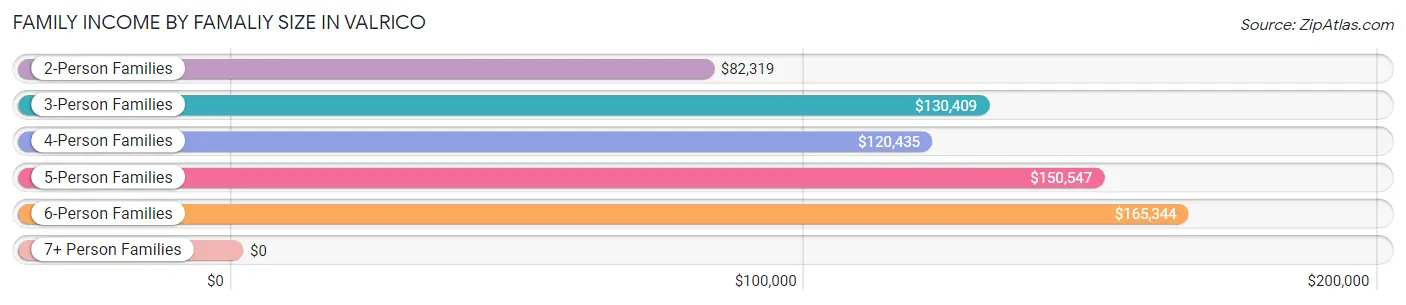
| Income Bracket | # Families | Median Income |
| 2-Person Families | 5,056 (48.3%) | $82,319 |
| 3-Person Families | 2,173 (20.7%) | $130,409 |
| 4-Person Families | 1,778 (17.0%) | $120,435 |
| 5-Person Families | 911 (8.7%) | $150,547 |
| 6-Person Families | 519 (5.0%) | $165,344 |
| 7+ Person Families | 39 (0.4%) | $0 |
| Total | 10,476 (100.0%) | $109,330 |
Family Income by Number of Earners in Valrico
The median family income in Valrico is $109,330, with families comprising 3+ earners (1,536) having the highest median family income of $172,315, while families with no earners (1,613) have the lowest median family income of $58,628, accounting for 14.7% and 15.4% of families, respectively.
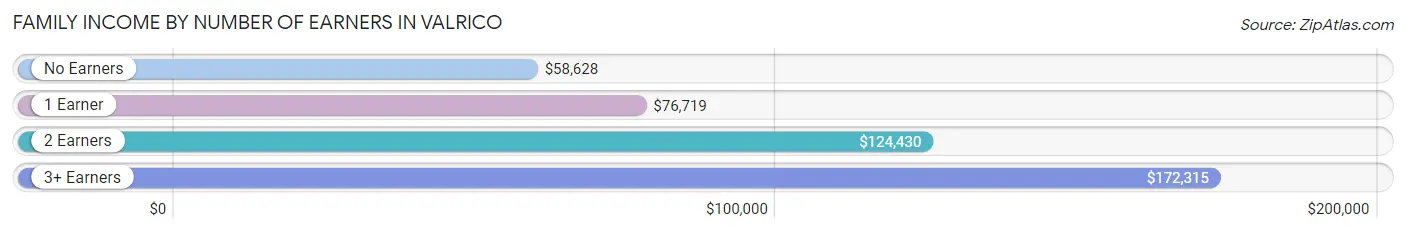
| Number of Earners | # Families | Median Income |
| No Earners | 1,613 (15.4%) | $58,628 |
| 1 Earner | 2,988 (28.5%) | $76,719 |
| 2 Earners | 4,339 (41.4%) | $124,430 |
| 3+ Earners | 1,536 (14.7%) | $172,315 |
| Total | 10,476 (100.0%) | $109,330 |
Household Income in Valrico
Household Income Brackets in Valrico
With 2,874 households falling in the category, the $100,000 to $149,999 income range is the most frequent in Valrico, accounting for 20.4% of all households. In contrast, only 239 households (1.7%) fall into the $10,000 to $14,999 income bracket, making it the least populous group.
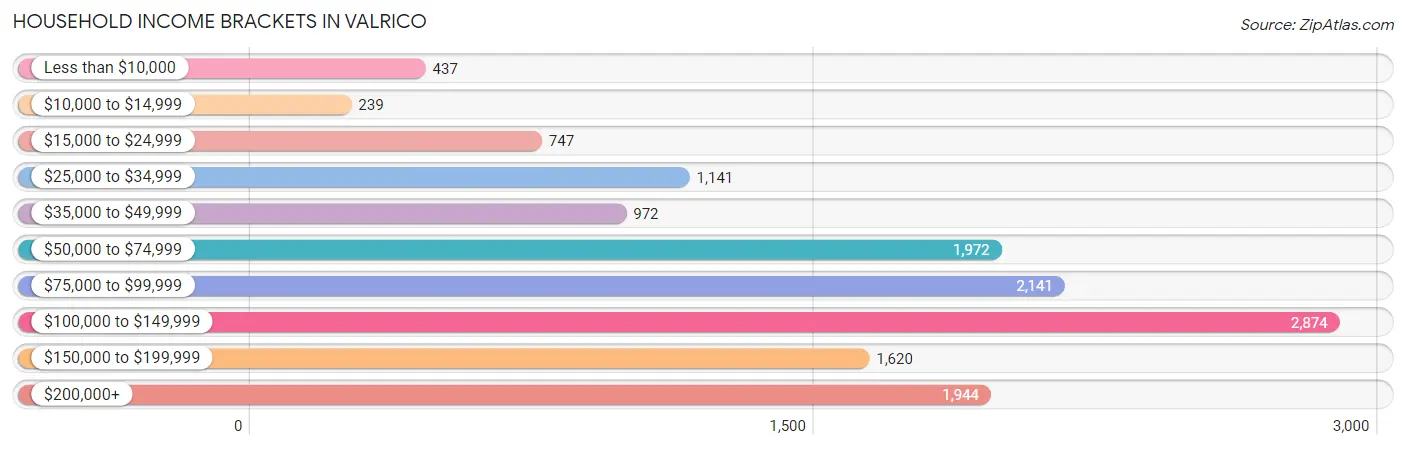
| Income Bracket | # Households | % Households |
| Less than $10,000 | 437 | 3.1% |
| $10,000 to $14,999 | 239 | 1.7% |
| $15,000 to $24,999 | 747 | 5.3% |
| $25,000 to $34,999 | 1,141 | 8.1% |
| $35,000 to $49,999 | 972 | 6.9% |
| $50,000 to $74,999 | 1,972 | 14.0% |
| $75,000 to $99,999 | 2,141 | 15.2% |
| $100,000 to $149,999 | 2,874 | 20.4% |
| $150,000 to $199,999 | 1,620 | 11.5% |
| $200,000+ | 1,944 | 13.8% |
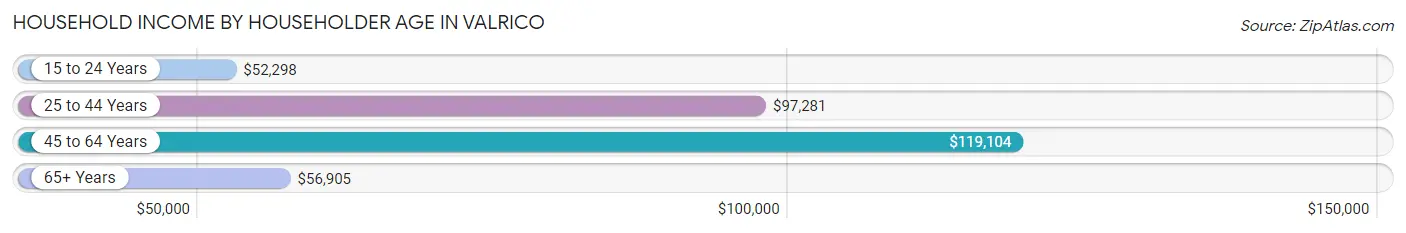
Household Income by Householder Age in Valrico
The median household income in Valrico is $91,704, with the highest median household income of $119,104 found in the 45 to 64 years age bracket for the primary householder. A total of 6,439 households (45.7%) fall into this category. Meanwhile, the 15 to 24 years age bracket for the primary householder has the lowest median household income of $52,298, with 236 households (1.7%) in this group.
| Income Bracket | # Households | Median Income |
| 15 to 24 Years | 236 (1.7%) | $52,298 |
| 25 to 44 Years | 3,272 (23.2%) | $97,281 |
| 45 to 64 Years | 6,439 (45.7%) | $119,104 |
| 65+ Years | 4,141 (29.4%) | $56,905 |
| Total | 14,088 (100.0%) | $91,704 |
Poverty in Valrico
Income Below Poverty by Sex and Age in Valrico
With 8.1% poverty level for males and 7.6% for females among the residents of Valrico, under 5 year old males and 12 to 14 year old females are the most vulnerable to poverty, with 117 males (17.7%) and 166 females (19.3%) in their respective age groups living below the poverty level.
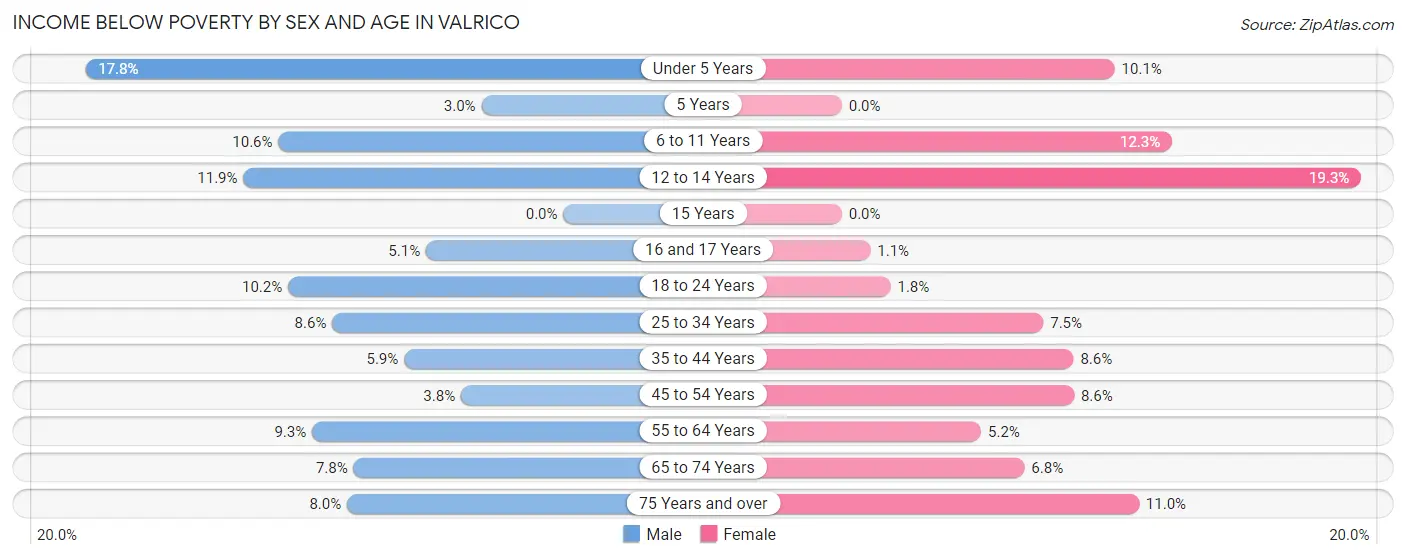
| Age Bracket | Male | Female |
| Under 5 Years | 117 (17.7%) | 84 (10.1%) |
| 5 Years | 8 (3.0%) | 0 (0.0%) |
| 6 to 11 Years | 133 (10.6%) | 130 (12.3%) |
| 12 to 14 Years | 79 (11.9%) | 166 (19.3%) |
| 15 Years | 0 (0.0%) | 0 (0.0%) |
| 16 and 17 Years | 24 (5.1%) | 10 (1.1%) |
| 18 to 24 Years | 205 (10.2%) | 30 (1.8%) |
| 25 to 34 Years | 128 (8.6%) | 132 (7.5%) |
| 35 to 44 Years | 127 (5.9%) | 206 (8.6%) |
| 45 to 54 Years | 100 (3.8%) | 285 (8.6%) |
| 55 to 64 Years | 299 (9.3%) | 150 (5.2%) |
| 65 to 74 Years | 155 (7.8%) | 182 (6.8%) |
| 75 Years and over | 74 (8.0%) | 194 (11.0%) |
| Total | 1,449 (8.1%) | 1,569 (7.6%) |
Income Above Poverty by Sex and Age in Valrico
According to the poverty statistics in Valrico, males aged 15 years and females aged 5 years are the age groups that are most secure financially, with 100.0% of males and 100.0% of females in these age groups living above the poverty line.
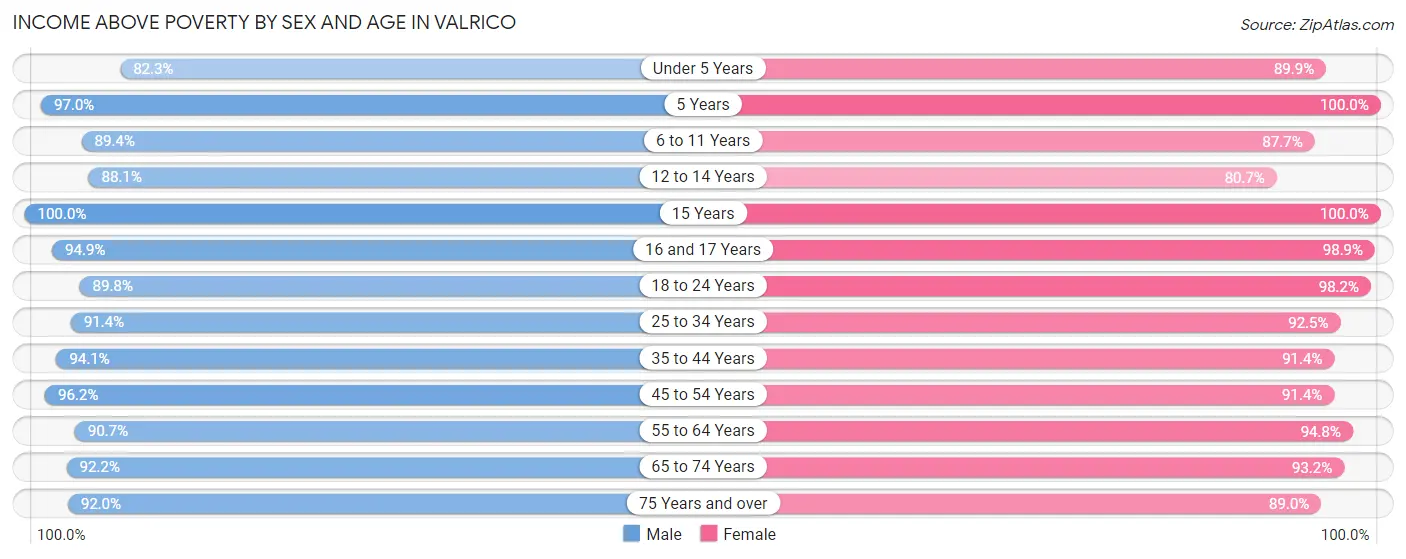
| Age Bracket | Male | Female |
| Under 5 Years | 542 (82.3%) | 745 (89.9%) |
| 5 Years | 255 (97.0%) | 157 (100.0%) |
| 6 to 11 Years | 1,124 (89.4%) | 930 (87.7%) |
| 12 to 14 Years | 586 (88.1%) | 695 (80.7%) |
| 15 Years | 231 (100.0%) | 275 (100.0%) |
| 16 and 17 Years | 447 (94.9%) | 931 (98.9%) |
| 18 to 24 Years | 1,800 (89.8%) | 1,631 (98.2%) |
| 25 to 34 Years | 1,363 (91.4%) | 1,632 (92.5%) |
| 35 to 44 Years | 2,021 (94.1%) | 2,188 (91.4%) |
| 45 to 54 Years | 2,532 (96.2%) | 3,023 (91.4%) |
| 55 to 64 Years | 2,905 (90.7%) | 2,753 (94.8%) |
| 65 to 74 Years | 1,834 (92.2%) | 2,503 (93.2%) |
| 75 Years and over | 847 (92.0%) | 1,565 (89.0%) |
| Total | 16,487 (91.9%) | 19,028 (92.4%) |
Income Below Poverty Among Married-Couple Families in Valrico
The poverty statistics for married-couple families in Valrico show that 5.8% or 504 of the total 8,721 families live below the poverty line. Families with 3 or 4 children have the highest poverty rate of 12.8%, comprising of 93 families. On the other hand, families with 1 or 2 children have the lowest poverty rate of 4.7%, which includes 127 families.
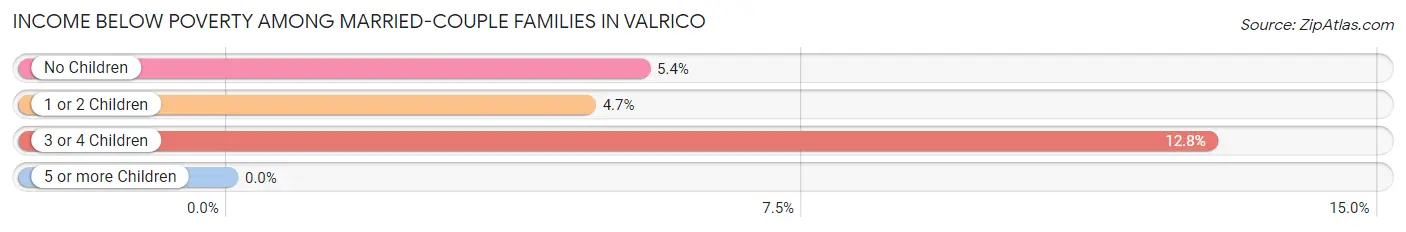
| Children | Above Poverty | Below Poverty |
| No Children | 4,993 (94.6%) | 284 (5.4%) |
| 1 or 2 Children | 2,590 (95.3%) | 127 (4.7%) |
| 3 or 4 Children | 634 (87.2%) | 93 (12.8%) |
| 5 or more Children | 0 (0.0%) | 0 (0.0%) |
| Total | 8,217 (94.2%) | 504 (5.8%) |
Income Below Poverty Among Single-Parent Households in Valrico
According to the poverty data in Valrico, 8.8% or 36 single-father households and 11.1% or 150 single-mother households are living below the poverty line. Among single-father households, those with 3 or 4 children have the highest poverty rate, with 9 households (100.0%) experiencing poverty. Likewise, among single-mother households, those with 3 or 4 children have the highest poverty rate, with 18 households (21.2%) falling below the poverty line.
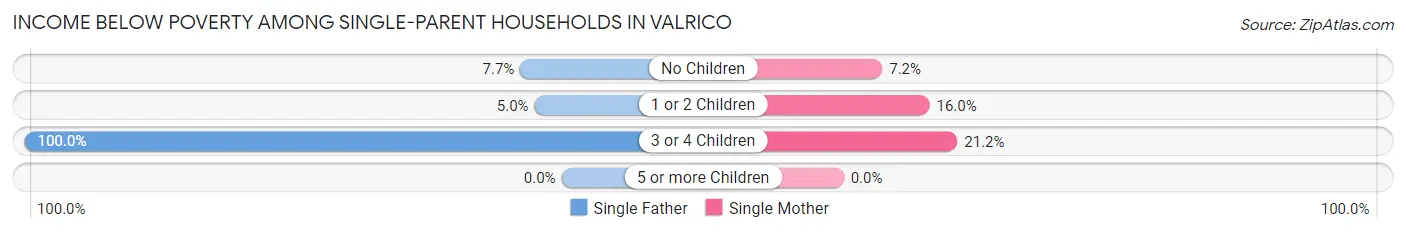
| Children | Single Father | Single Mother |
| No Children | 20 (7.7%) | 57 (7.2%) |
| 1 or 2 Children | 7 (5.0%) | 75 (16.0%) |
| 3 or 4 Children | 9 (100.0%) | 18 (21.2%) |
| 5 or more Children | 0 (0.0%) | 0 (0.0%) |
| Total | 36 (8.8%) | 150 (11.1%) |
Income Below Poverty Among Married-Couple vs Single-Parent Households in Valrico
The poverty data for Valrico shows that 504 of the married-couple family households (5.8%) and 186 of the single-parent households (10.6%) are living below the poverty level. Within the married-couple family households, those with 3 or 4 children have the highest poverty rate, with 93 households (12.8%) falling below the poverty line. Among the single-parent households, those with 3 or 4 children have the highest poverty rate, with 27 household (28.7%) living below poverty.
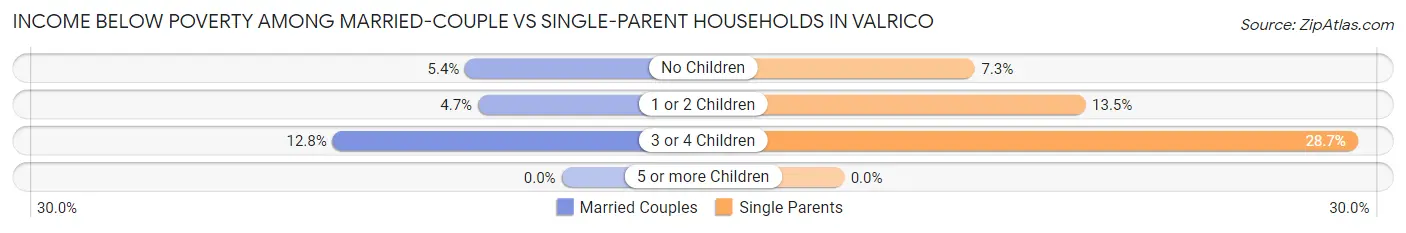
| Children | Married-Couple Families | Single-Parent Households |
| No Children | 284 (5.4%) | 77 (7.3%) |
| 1 or 2 Children | 127 (4.7%) | 82 (13.5%) |
| 3 or 4 Children | 93 (12.8%) | 27 (28.7%) |
| 5 or more Children | 0 (0.0%) | 0 (0.0%) |
| Total | 504 (5.8%) | 186 (10.6%) |
Race in Valrico
The most populous races in Valrico are White / Caucasian (25,357 | 65.7%), Hispanic or Latino (8,160 | 21.1%), and Black / African American (5,132 | 13.3%).
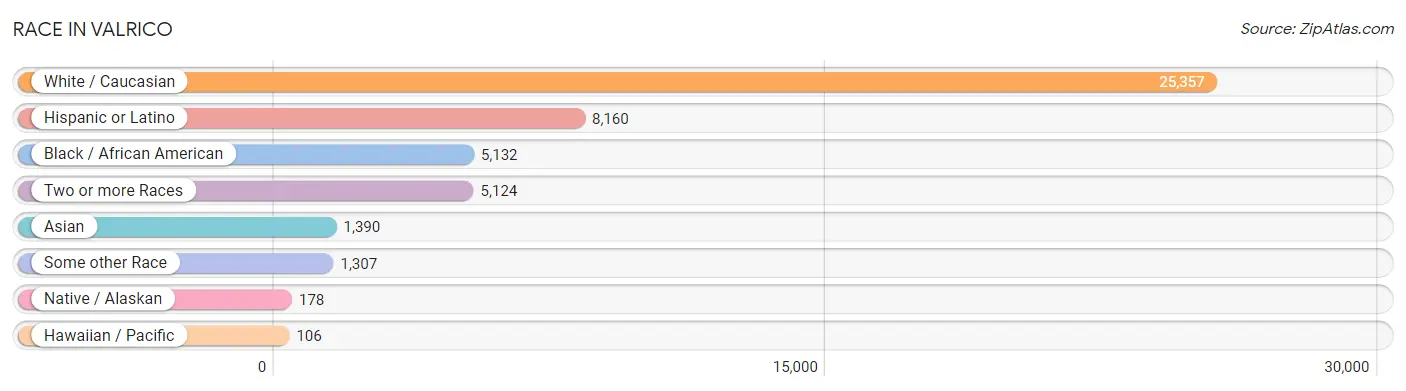
| Race | # Population | % Population |
| Asian | 1,390 | 3.6% |
| Black / African American | 5,132 | 13.3% |
| Hawaiian / Pacific | 106 | 0.3% |
| Hispanic or Latino | 8,160 | 21.1% |
| Native / Alaskan | 178 | 0.5% |
| White / Caucasian | 25,357 | 65.7% |
| Two or more Races | 5,124 | 13.3% |
| Some other Race | 1,307 | 3.4% |
| Total | 38,594 | 100.0% |
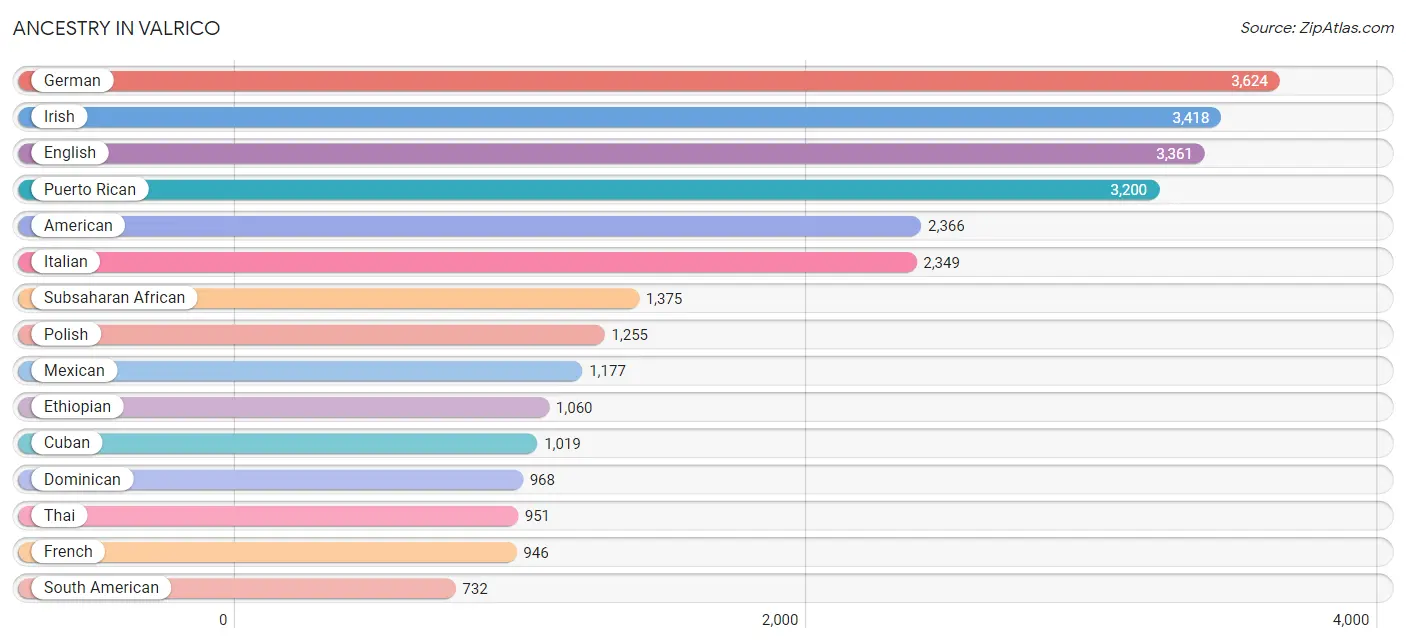
Ancestry in Valrico
The most populous ancestries reported in Valrico are German (3,624 | 9.4%), Irish (3,418 | 8.9%), English (3,361 | 8.7%), Puerto Rican (3,200 | 8.3%), and American (2,366 | 6.1%), together accounting for 41.4% of all Valrico residents.
| Ancestry | # Population | % Population |
| Afghan | 14 | 0.0% |
| African | 179 | 0.5% |
| Alaskan Athabascan | 8 | 0.0% |
| American | 2,366 | 6.1% |
| Arab | 173 | 0.4% |
| Argentinean | 59 | 0.2% |
| Armenian | 6 | 0.0% |
| Australian | 21 | 0.1% |
| Austrian | 47 | 0.1% |
| Bahamian | 76 | 0.2% |
| Barbadian | 44 | 0.1% |
| Belgian | 26 | 0.1% |
| Belizean | 10 | 0.0% |
| Bhutanese | 27 | 0.1% |
| Blackfeet | 30 | 0.1% |
| Brazilian | 65 | 0.2% |
| British | 348 | 0.9% |
| British West Indian | 53 | 0.1% |
| Burmese | 179 | 0.5% |
| Cajun | 4 | 0.0% |
| Canadian | 65 | 0.2% |
| Central American | 390 | 1.0% |
| Central American Indian | 47 | 0.1% |
| Cherokee | 50 | 0.1% |
| Chippewa | 12 | 0.0% |
| Choctaw | 20 | 0.1% |
| Colombian | 358 | 0.9% |
| Costa Rican | 23 | 0.1% |
| Cuban | 1,019 | 2.6% |
| Czech | 65 | 0.2% |
| Czechoslovakian | 53 | 0.1% |
| Danish | 77 | 0.2% |
| Dominican | 968 | 2.5% |
| Dutch | 430 | 1.1% |
| Eastern European | 158 | 0.4% |
| Ecuadorian | 70 | 0.2% |
| Egyptian | 15 | 0.0% |
| English | 3,361 | 8.7% |
| Estonian | 13 | 0.0% |
| Ethiopian | 1,060 | 2.8% |
| European | 563 | 1.5% |
| Finnish | 13 | 0.0% |
| French | 946 | 2.5% |
| French Canadian | 175 | 0.4% |
| German | 3,624 | 9.4% |
| Greek | 155 | 0.4% |
| Guatemalan | 18 | 0.1% |
| Guyanese | 7 | 0.0% |
| Haitian | 639 | 1.7% |
| Honduran | 194 | 0.5% |
| Hungarian | 73 | 0.2% |
| Indian (Asian) | 370 | 1.0% |
| Iranian | 70 | 0.2% |
| Irish | 3,418 | 8.9% |
| Italian | 2,349 | 6.1% |
| Jamaican | 489 | 1.3% |
| Jordanian | 88 | 0.2% |
| Korean | 516 | 1.3% |
| Laotian | 7 | 0.0% |
| Lebanese | 60 | 0.2% |
| Lithuanian | 14 | 0.0% |
| Macedonian | 9 | 0.0% |
| Mexican | 1,177 | 3.0% |
| Nicaraguan | 57 | 0.2% |
| Nigerian | 82 | 0.2% |
| Northern European | 40 | 0.1% |
| Norwegian | 221 | 0.6% |
| Pakistani | 119 | 0.3% |
| Palestinian | 10 | 0.0% |
| Panamanian | 50 | 0.1% |
| Pennsylvania German | 13 | 0.0% |
| Peruvian | 217 | 0.6% |
| Polish | 1,255 | 3.3% |
| Portuguese | 471 | 1.2% |
| Puerto Rican | 3,200 | 8.3% |
| Romanian | 27 | 0.1% |
| Russian | 228 | 0.6% |
| Salvadoran | 48 | 0.1% |
| Scandinavian | 117 | 0.3% |
| Scotch-Irish | 210 | 0.5% |
| Scottish | 624 | 1.6% |
| Slovak | 319 | 0.8% |
| South African | 27 | 0.1% |
| South American | 732 | 1.9% |
| Spaniard | 293 | 0.8% |
| Spanish | 102 | 0.3% |
| Sri Lankan | 39 | 0.1% |
| Subsaharan African | 1,375 | 3.6% |
| Swedish | 282 | 0.7% |
| Swiss | 21 | 0.1% |
| Syrian | 10 | 0.0% |
| Thai | 951 | 2.5% |
| Turkish | 57 | 0.2% |
| U.S. Virgin Islander | 25 | 0.1% |
| Ukrainian | 243 | 0.6% |
| Venezuelan | 28 | 0.1% |
| Welsh | 341 | 0.9% |
| West Indian | 122 | 0.3% |
| Yugoslavian | 11 | 0.0% | View All 99 Rows |
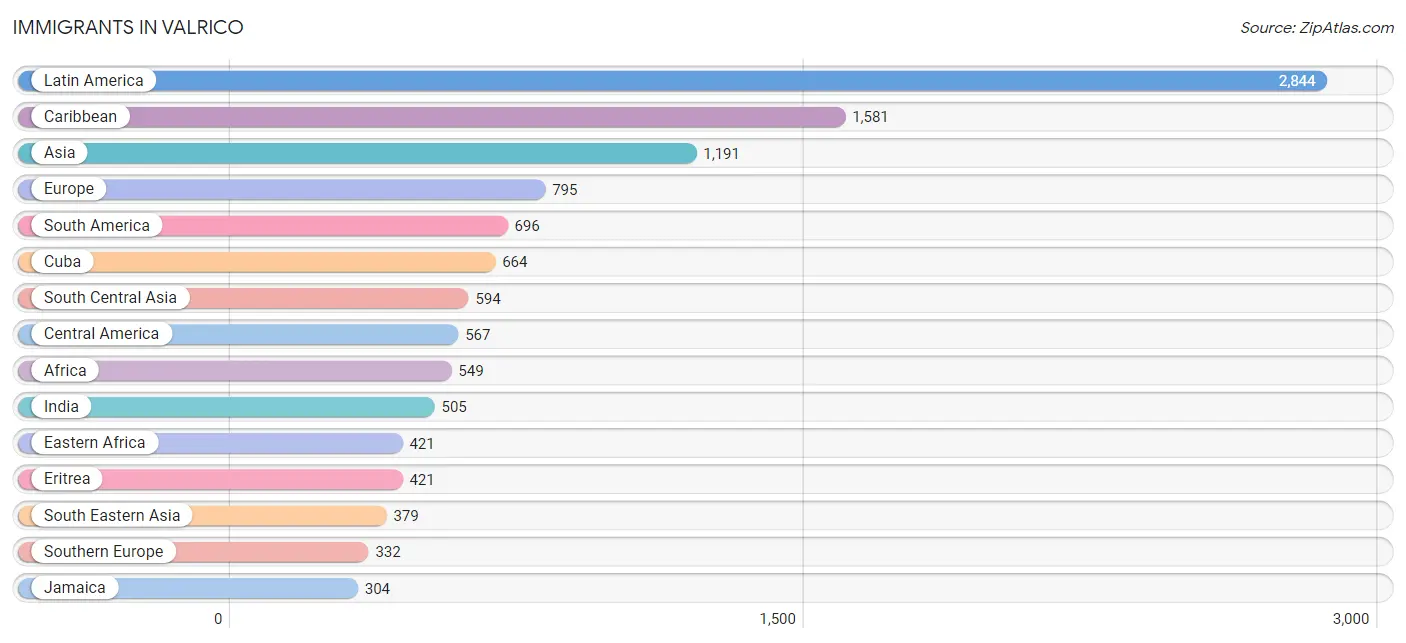
Immigrants in Valrico
The most numerous immigrant groups reported in Valrico came from Latin America (2,844 | 7.4%), Caribbean (1,581 | 4.1%), Asia (1,191 | 3.1%), Europe (795 | 2.1%), and South America (696 | 1.8%), together accounting for 18.4% of all Valrico residents.
| Immigration Origin | # Population | % Population |
| Afghanistan | 14 | 0.0% |
| Africa | 549 | 1.4% |
| Argentina | 52 | 0.1% |
| Asia | 1,191 | 3.1% |
| Australia | 11 | 0.0% |
| Bahamas | 43 | 0.1% |
| Bangladesh | 15 | 0.0% |
| Barbados | 47 | 0.1% |
| Belize | 10 | 0.0% |
| Bosnia and Herzegovina | 43 | 0.1% |
| Brazil | 127 | 0.3% |
| Canada | 218 | 0.6% |
| Caribbean | 1,581 | 4.1% |
| Central America | 567 | 1.5% |
| China | 88 | 0.2% |
| Colombia | 251 | 0.6% |
| Cuba | 664 | 1.7% |
| Czechoslovakia | 2 | 0.0% |
| Dominica | 25 | 0.1% |
| Dominican Republic | 280 | 0.7% |
| Eastern Africa | 421 | 1.1% |
| Eastern Asia | 107 | 0.3% |
| Eastern Europe | 148 | 0.4% |
| Ecuador | 75 | 0.2% |
| Egypt | 18 | 0.1% |
| El Salvador | 30 | 0.1% |
| England | 122 | 0.3% |
| Eritrea | 421 | 1.1% |
| Europe | 795 | 2.1% |
| France | 10 | 0.0% |
| Germany | 74 | 0.2% |
| Greece | 10 | 0.0% |
| Guatemala | 14 | 0.0% |
| Guyana | 7 | 0.0% |
| Haiti | 180 | 0.5% |
| Honduras | 194 | 0.5% |
| Hong Kong | 32 | 0.1% |
| Hungary | 9 | 0.0% |
| India | 505 | 1.3% |
| Iran | 35 | 0.1% |
| Ireland | 13 | 0.0% |
| Italy | 27 | 0.1% |
| Jamaica | 304 | 0.8% |
| Japan | 19 | 0.1% |
| Jordan | 28 | 0.1% |
| Latin America | 2,844 | 7.4% |
| Mexico | 270 | 0.7% |
| Moldova | 7 | 0.0% |
| Nicaragua | 7 | 0.0% |
| Nigeria | 26 | 0.1% |
| Northern Africa | 18 | 0.1% |
| Northern Europe | 231 | 0.6% |
| Oceania | 20 | 0.1% |
| Pakistan | 25 | 0.1% |
| Panama | 42 | 0.1% |
| Peru | 160 | 0.4% |
| Philippines | 286 | 0.7% |
| Poland | 7 | 0.0% |
| Portugal | 286 | 0.7% |
| Romania | 14 | 0.0% |
| Russia | 41 | 0.1% |
| Saudi Arabia | 83 | 0.2% |
| Scotland | 28 | 0.1% |
| South Africa | 48 | 0.1% |
| South America | 696 | 1.8% |
| South Central Asia | 594 | 1.5% |
| South Eastern Asia | 379 | 1.0% |
| Southern Europe | 332 | 0.9% |
| Spain | 9 | 0.0% |
| Thailand | 54 | 0.1% |
| Trinidad and Tobago | 29 | 0.1% |
| Ukraine | 25 | 0.1% |
| Uruguay | 11 | 0.0% |
| Venezuela | 13 | 0.0% |
| Vietnam | 39 | 0.1% |
| Western Africa | 62 | 0.2% |
| Western Asia | 111 | 0.3% |
| Western Europe | 84 | 0.2% | View All 78 Rows |
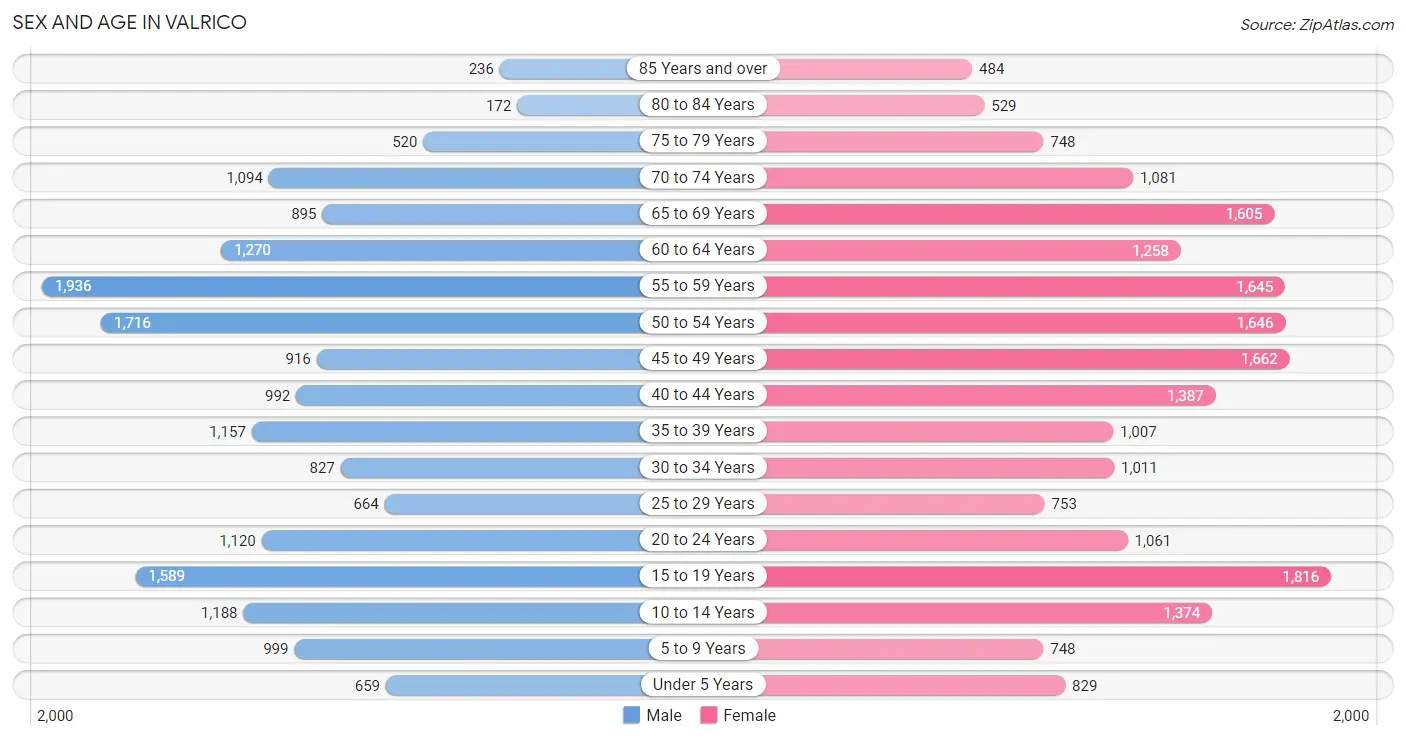
Sex and Age in Valrico
Sex and Age in Valrico
The most populous age groups in Valrico are 55 to 59 Years (1,936 | 10.8%) for men and 15 to 19 Years (1,816 | 8.8%) for women.
| Age Bracket | Male | Female |
| Under 5 Years | 659 (3.7%) | 829 (4.0%) |
| 5 to 9 Years | 999 (5.6%) | 748 (3.6%) |
| 10 to 14 Years | 1,188 (6.6%) | 1,374 (6.7%) |
| 15 to 19 Years | 1,589 (8.8%) | 1,816 (8.8%) |
| 20 to 24 Years | 1,120 (6.2%) | 1,061 (5.1%) |
| 25 to 29 Years | 664 (3.7%) | 753 (3.6%) |
| 30 to 34 Years | 827 (4.6%) | 1,011 (4.9%) |
| 35 to 39 Years | 1,157 (6.5%) | 1,007 (4.9%) |
| 40 to 44 Years | 992 (5.5%) | 1,387 (6.7%) |
| 45 to 49 Years | 916 (5.1%) | 1,662 (8.1%) |
| 50 to 54 Years | 1,716 (9.6%) | 1,646 (8.0%) |
| 55 to 59 Years | 1,936 (10.8%) | 1,645 (8.0%) |
| 60 to 64 Years | 1,270 (7.1%) | 1,258 (6.1%) |
| 65 to 69 Years | 895 (5.0%) | 1,605 (7.8%) |
| 70 to 74 Years | 1,094 (6.1%) | 1,081 (5.2%) |
| 75 to 79 Years | 520 (2.9%) | 748 (3.6%) |
| 80 to 84 Years | 172 (1.0%) | 529 (2.6%) |
| 85 Years and over | 236 (1.3%) | 484 (2.3%) |
| Total | 17,950 (100.0%) | 20,644 (100.0%) |
Families and Households in Valrico
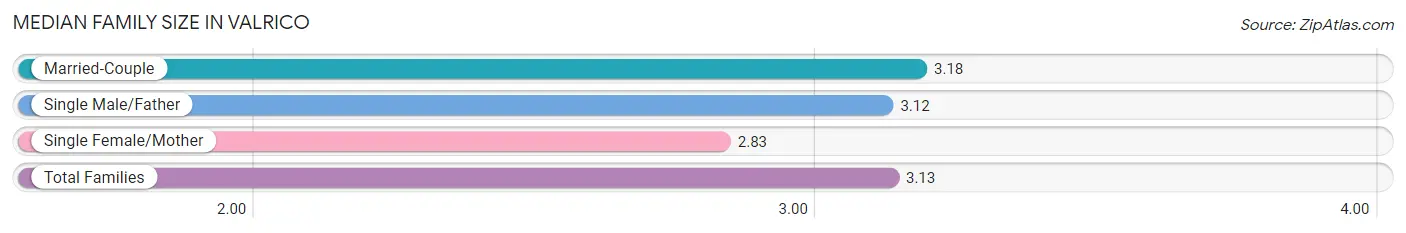
Median Family Size in Valrico
The median family size in Valrico is 3.13 persons per family, with married-couple families (8,721 | 83.3%) accounting for the largest median family size of 3.18 persons per family. On the other hand, single female/mother families (1,347 | 12.9%) represent the smallest median family size with 2.83 persons per family.
| Family Type | # Families | Family Size |
| Married-Couple | 8,721 (83.3%) | 3.18 |
| Single Male/Father | 408 (3.9%) | 3.12 |
| Single Female/Mother | 1,347 (12.9%) | 2.83 |
| Total Families | 10,476 (100.0%) | 3.13 |
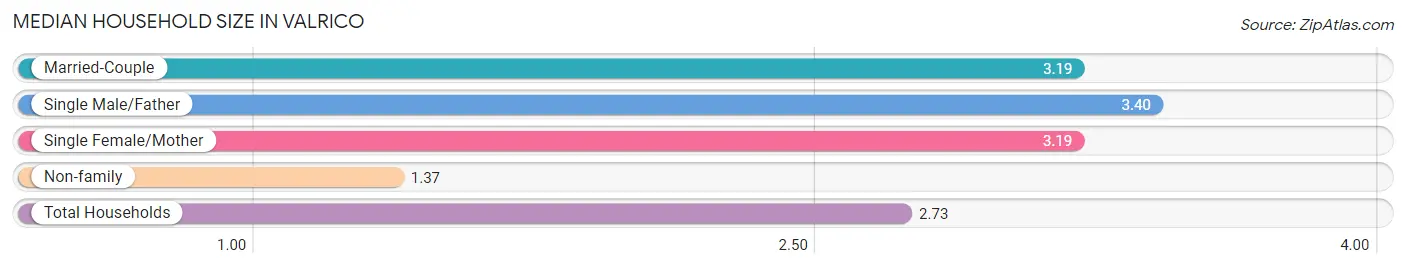
Median Household Size in Valrico
The median household size in Valrico is 2.73 persons per household, with single male/father households (408 | 2.9%) accounting for the largest median household size of 3.4 persons per household. non-family households (3,612 | 25.6%) represent the smallest median household size with 1.37 persons per household.
| Household Type | # Households | Household Size |
| Married-Couple | 8,721 (61.9%) | 3.19 |
| Single Male/Father | 408 (2.9%) | 3.40 |
| Single Female/Mother | 1,347 (9.6%) | 3.19 |
| Non-family | 3,612 (25.6%) | 1.37 |
| Total Households | 14,088 (100.0%) | 2.73 |
Household Size by Marriage Status in Valrico
Out of a total of 14,088 households in Valrico, 10,476 (74.4%) are family households, while 3,612 (25.6%) are nonfamily households. The most numerous type of family households are 2-person households, comprising 4,797, and the most common type of nonfamily households are 1-person households, comprising 2,861.
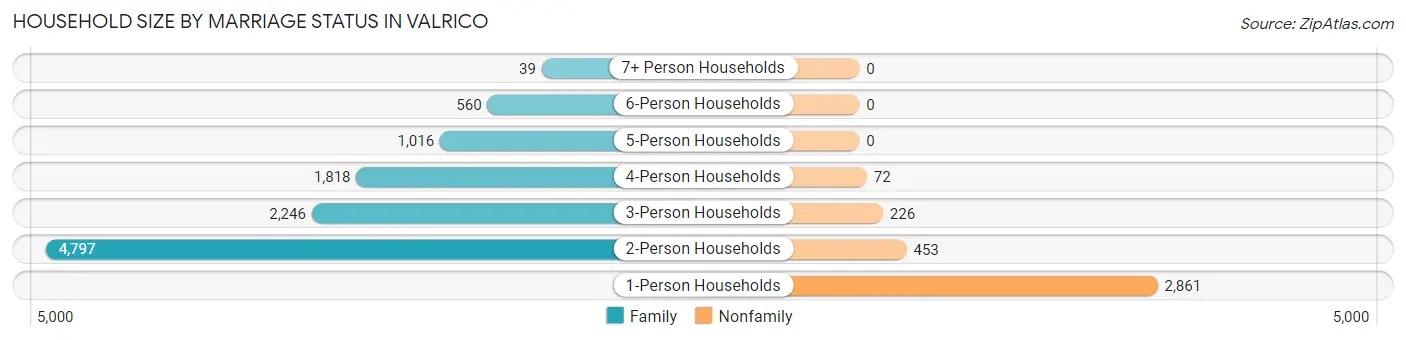
| Household Size | Family Households | Nonfamily Households |
| 1-Person Households | - | 2,861 (20.3%) |
| 2-Person Households | 4,797 (34.1%) | 453 (3.2%) |
| 3-Person Households | 2,246 (15.9%) | 226 (1.6%) |
| 4-Person Households | 1,818 (12.9%) | 72 (0.5%) |
| 5-Person Households | 1,016 (7.2%) | 0 (0.0%) |
| 6-Person Households | 560 (4.0%) | 0 (0.0%) |
| 7+ Person Households | 39 (0.3%) | 0 (0.0%) |
| Total | 10,476 (74.4%) | 3,612 (25.6%) |
Female Fertility in Valrico
Fertility by Age in Valrico
Average fertility rate in Valrico is 37.0 births per 1,000 women. Women in the age bracket of 20 to 34 years have the highest fertility rate with 70.0 births per 1,000 women. Women in the age bracket of 20 to 34 years acount for 58.9% of all women with births.
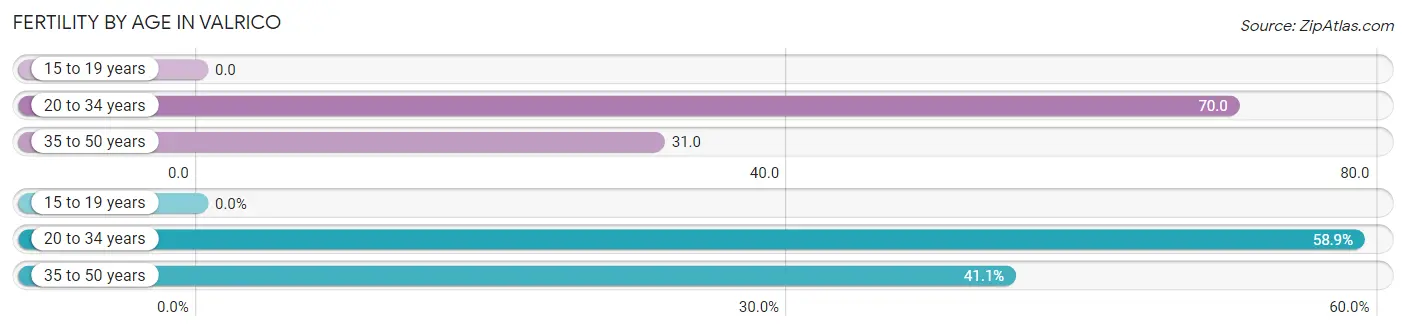
| Age Bracket | Women with Births | Births / 1,000 Women |
| 15 to 19 years | 0 (0.0%) | 0.0 |
| 20 to 34 years | 199 (58.9%) | 70.0 |
| 35 to 50 years | 139 (41.1%) | 31.0 |
| Total | 338 (100.0%) | 37.0 |
Fertility by Age by Marriage Status in Valrico
72.5% of women with births (338) in Valrico are married. The highest percentage of unmarried women with births falls into 20 to 34 years age bracket with 41.2% of them unmarried at the time of birth, while the lowest percentage of unmarried women with births belong to 35 to 50 years age bracket with 7.9% of them unmarried.
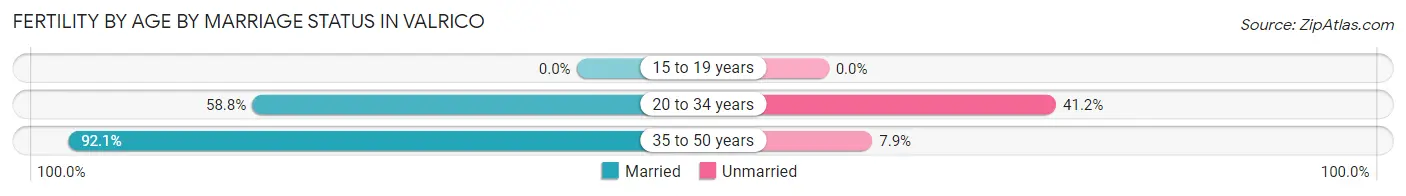
| Age Bracket | Married | Unmarried |
| 15 to 19 years | 0 (0.0%) | 0 (0.0%) |
| 20 to 34 years | 117 (58.8%) | 82 (41.2%) |
| 35 to 50 years | 128 (92.1%) | 11 (7.9%) |
| Total | 245 (72.5%) | 93 (27.5%) |
Fertility by Education in Valrico
Average fertility rate in Valrico is 37.0 births per 1,000 women. Women with the education attainment of college or associate's degree have the highest fertility rate of 48.0 births per 1,000 women, while women with the education attainment of less than high school have the lowest fertility at 6.0 births per 1,000 women. Women with the education attainment of college or associate's degree represent 42.0% of all women with births.
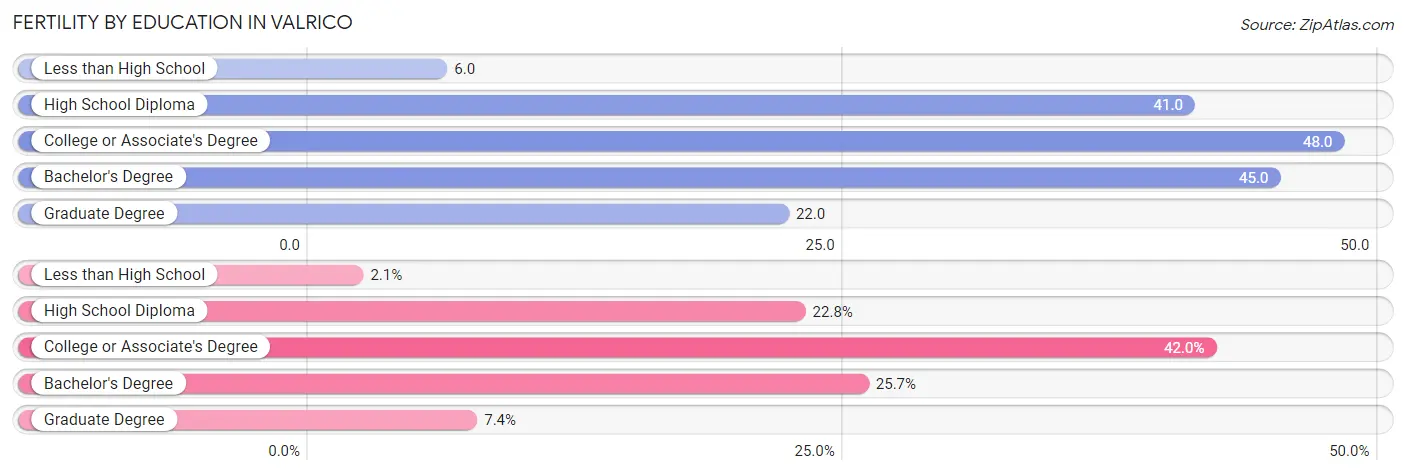
| Educational Attainment | Women with Births | Births / 1,000 Women |
| Less than High School | 7 (2.1%) | 6.0 |
| High School Diploma | 77 (22.8%) | 41.0 |
| College or Associate's Degree | 142 (42.0%) | 48.0 |
| Bachelor's Degree | 87 (25.7%) | 45.0 |
| Graduate Degree | 25 (7.4%) | 22.0 |
| Total | 338 (100.0%) | 37.0 |
Fertility by Education by Marriage Status in Valrico
27.5% of women with births in Valrico are unmarried. Women with the educational attainment of less than high school are most likely to be married with 100.0% of them married at childbirth, while women with the educational attainment of high school diploma are least likely to be married with 89.6% of them unmarried at childbirth.
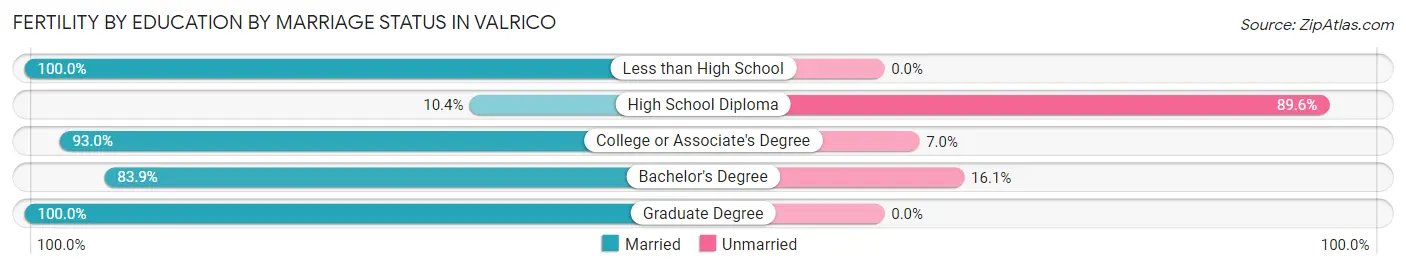
| Educational Attainment | Married | Unmarried |
| Less than High School | 7 (100.0%) | 0 (0.0%) |
| High School Diploma | 8 (10.4%) | 69 (89.6%) |
| College or Associate's Degree | 132 (93.0%) | 10 (7.0%) |
| Bachelor's Degree | 73 (83.9%) | 14 (16.1%) |
| Graduate Degree | 25 (100.0%) | 0 (0.0%) |
| Total | 245 (72.5%) | 93 (27.5%) |
Employment Characteristics in Valrico
Employment by Class of Employer in Valrico
Among the 20,033 employed individuals in Valrico, private company employees (13,983 | 69.8%), local government employees (1,174 | 5.9%), and federal government employees (1,167 | 5.8%) make up the most common classes of employment.
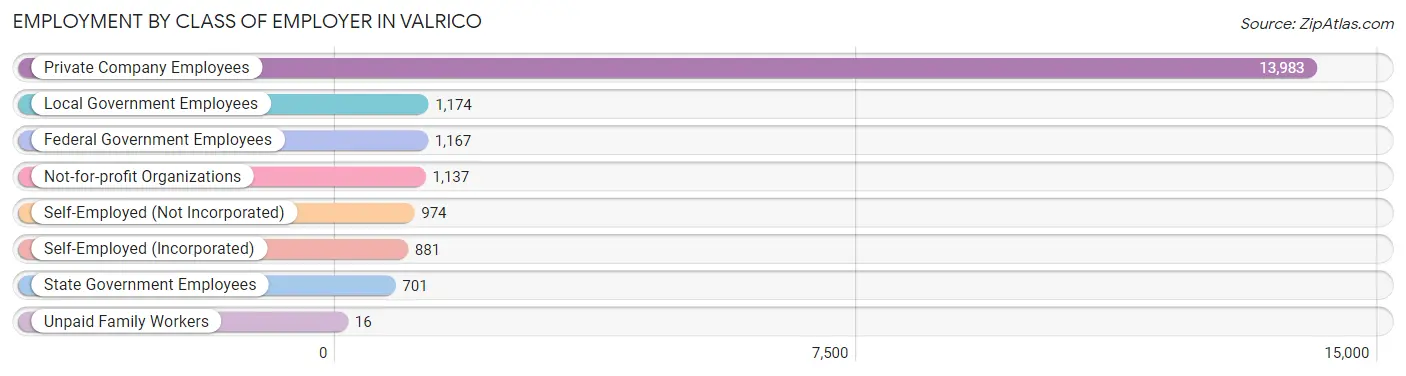
| Employer Class | # Employees | % Employees |
| Private Company Employees | 13,983 | 69.8% |
| Self-Employed (Incorporated) | 881 | 4.4% |
| Self-Employed (Not Incorporated) | 974 | 4.9% |
| Not-for-profit Organizations | 1,137 | 5.7% |
| Local Government Employees | 1,174 | 5.9% |
| State Government Employees | 701 | 3.5% |
| Federal Government Employees | 1,167 | 5.8% |
| Unpaid Family Workers | 16 | 0.1% |
| Total | 20,033 | 100.0% |
Employment Status by Age in Valrico
According to the labor force statistics for Valrico, out of the total population over 16 years of age (32,291), 65.5% or 21,151 individuals are in the labor force, with 4.1% or 867 of them unemployed. The age group with the highest labor force participation rate is 25 to 29 years, with 89.6% or 1,270 individuals in the labor force. Within the labor force, the 75 years and over age range has the highest percentage of unemployed individuals, with 17.3% or 43 of them being unemployed.
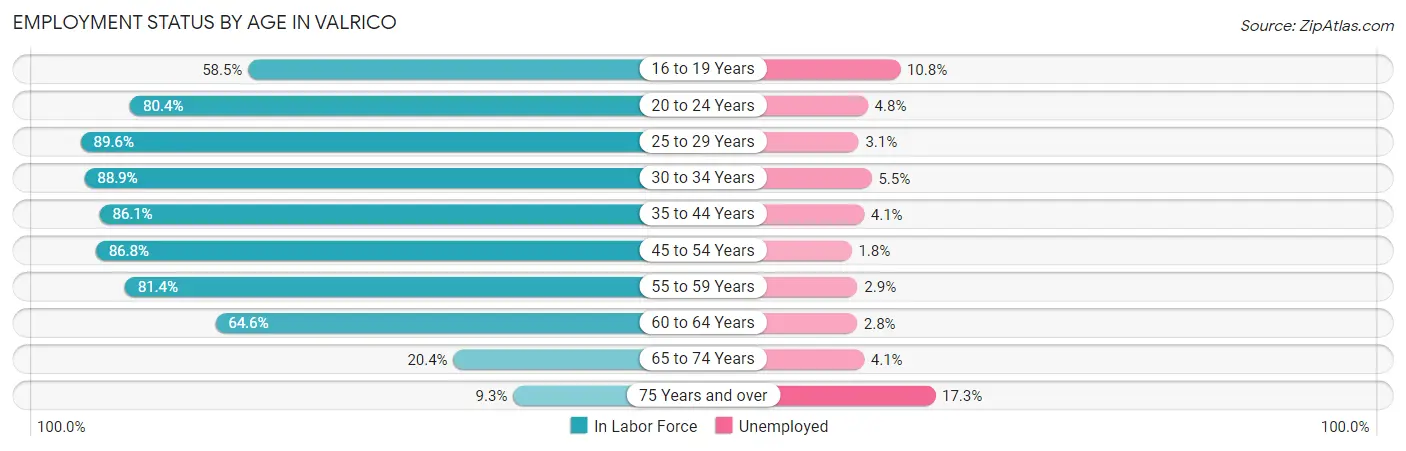
| Age Bracket | In Labor Force | Unemployed |
| 16 to 19 Years | 1,696 (58.5%) | 183 (10.8%) |
| 20 to 24 Years | 1,754 (80.4%) | 84 (4.8%) |
| 25 to 29 Years | 1,270 (89.6%) | 39 (3.1%) |
| 30 to 34 Years | 1,634 (88.9%) | 90 (5.5%) |
| 35 to 44 Years | 3,912 (86.1%) | 160 (4.1%) |
| 45 to 54 Years | 5,156 (86.8%) | 93 (1.8%) |
| 55 to 59 Years | 2,915 (81.4%) | 85 (2.9%) |
| 60 to 64 Years | 1,633 (64.6%) | 46 (2.8%) |
| 65 to 74 Years | 954 (20.4%) | 39 (4.1%) |
| 75 Years and over | 250 (9.3%) | 43 (17.3%) |
| Total | 21,151 (65.5%) | 867 (4.1%) |
Employment Status by Educational Attainment in Valrico
According to labor force statistics for Valrico, 83.2% of individuals (16,513) out of the total population between 25 and 64 years of age (19,847) are in the labor force, with 3.1% or 512 of them being unemployed. The group with the highest labor force participation rate are those with the educational attainment of bachelor's degree or higher, with 88.9% or 7,283 individuals in the labor force. Within the labor force, individuals with less than high school education have the highest percentage of unemployment, with 7.5% or 66 of them being unemployed.
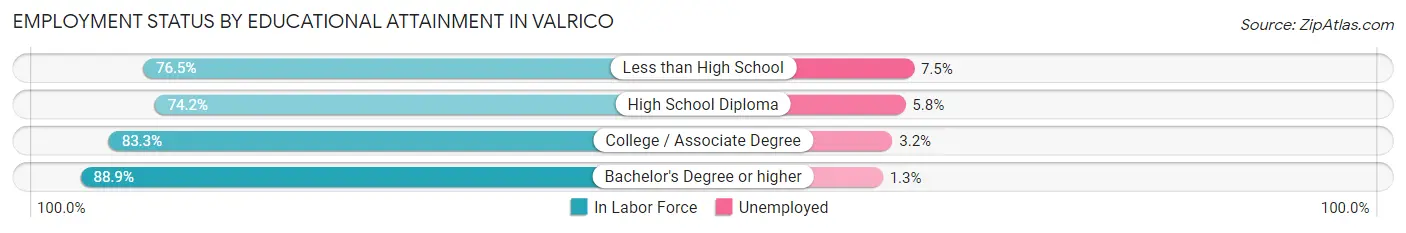
| Educational Attainment | In Labor Force | Unemployed |
| Less than High School | 882 (76.5%) | 86 (7.5%) |
| High School Diploma | 3,237 (74.2%) | 253 (5.8%) |
| College / Associate Degree | 5,114 (83.3%) | 196 (3.2%) |
| Bachelor's Degree or higher | 7,283 (88.9%) | 106 (1.3%) |
| Total | 16,513 (83.2%) | 615 (3.1%) |
Employment Occupations by Sex in Valrico
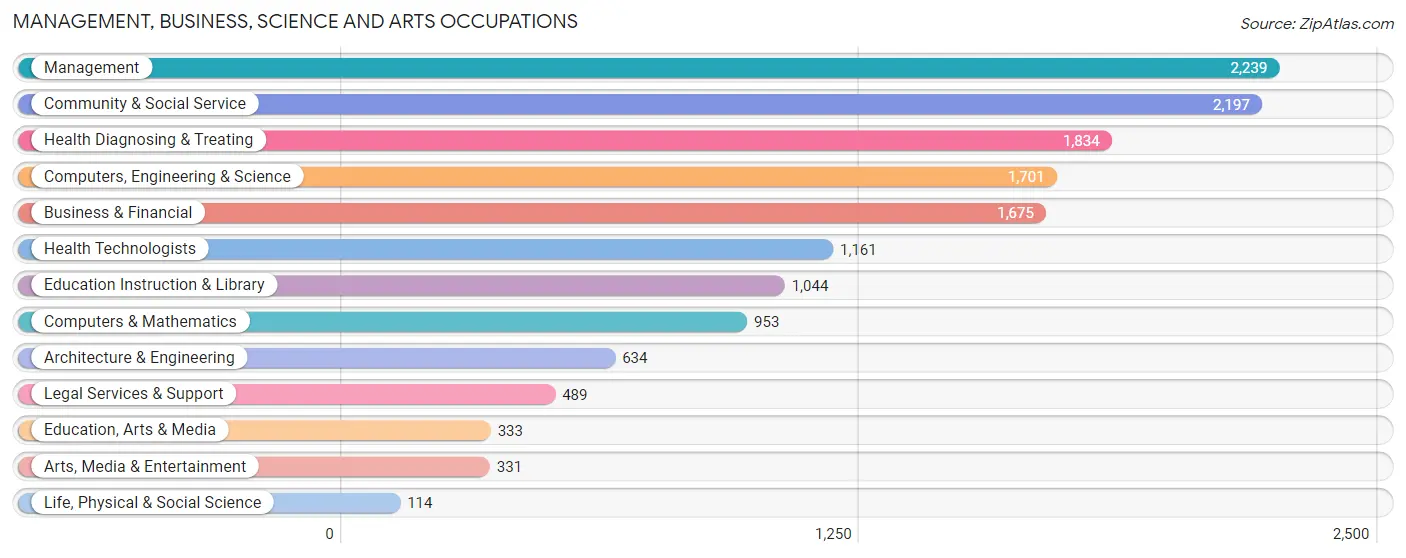
Management, Business, Science and Arts Occupations
The most common Management, Business, Science and Arts occupations in Valrico are Management (2,239 | 11.1%), Community & Social Service (2,197 | 10.9%), Health Diagnosing & Treating (1,834 | 9.1%), Computers, Engineering & Science (1,701 | 8.5%), and Business & Financial (1,675 | 8.3%).
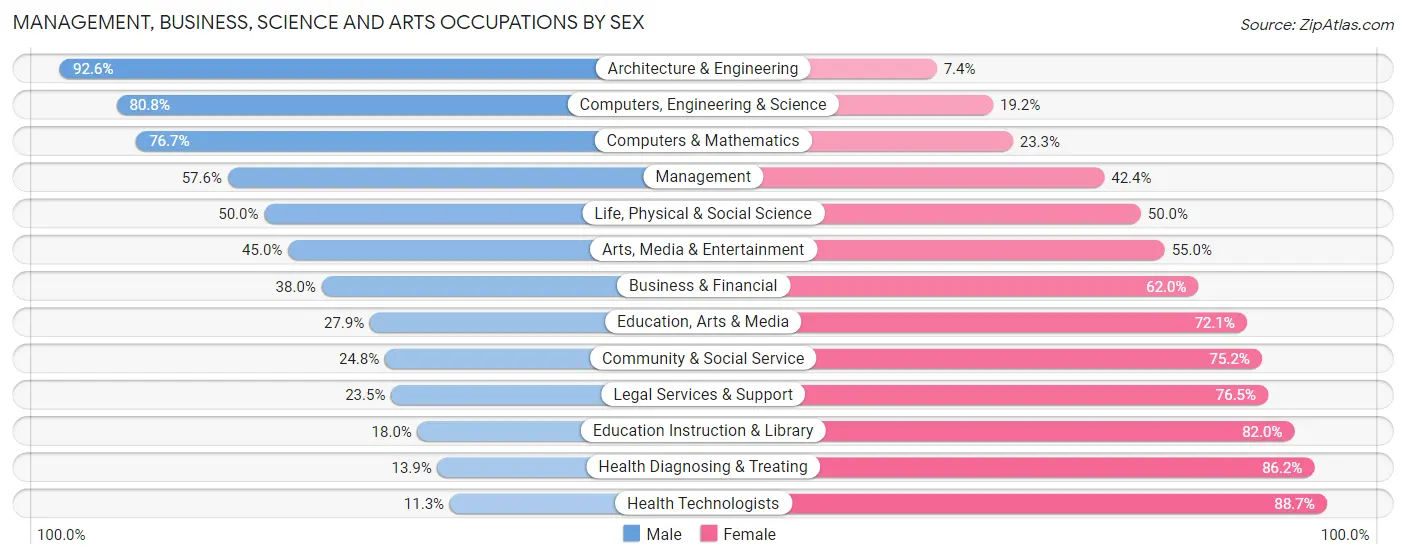
Management, Business, Science and Arts Occupations by Sex
Within the Management, Business, Science and Arts occupations in Valrico, the most male-oriented occupations are Architecture & Engineering (92.6%), Computers, Engineering & Science (80.8%), and Computers & Mathematics (76.7%), while the most female-oriented occupations are Health Technologists (88.7%), Health Diagnosing & Treating (86.2%), and Education Instruction & Library (82.0%).
| Occupation | Male | Female |
| Management | 1,290 (57.6%) | 949 (42.4%) |
| Business & Financial | 637 (38.0%) | 1,038 (62.0%) |
| Computers, Engineering & Science | 1,375 (80.8%) | 326 (19.2%) |
| Computers & Mathematics | 731 (76.7%) | 222 (23.3%) |
| Architecture & Engineering | 587 (92.6%) | 47 (7.4%) |
| Life, Physical & Social Science | 57 (50.0%) | 57 (50.0%) |
| Community & Social Service | 545 (24.8%) | 1,652 (75.2%) |
| Education, Arts & Media | 93 (27.9%) | 240 (72.1%) |
| Legal Services & Support | 115 (23.5%) | 374 (76.5%) |
| Education Instruction & Library | 188 (18.0%) | 856 (82.0%) |
| Arts, Media & Entertainment | 149 (45.0%) | 182 (55.0%) |
| Health Diagnosing & Treating | 254 (13.9%) | 1,580 (86.2%) |
| Health Technologists | 131 (11.3%) | 1,030 (88.7%) |
| Total (Category) | 4,101 (42.5%) | 5,545 (57.5%) |
| Total (Overall) | 9,889 (49.2%) | 10,215 (50.8%) |
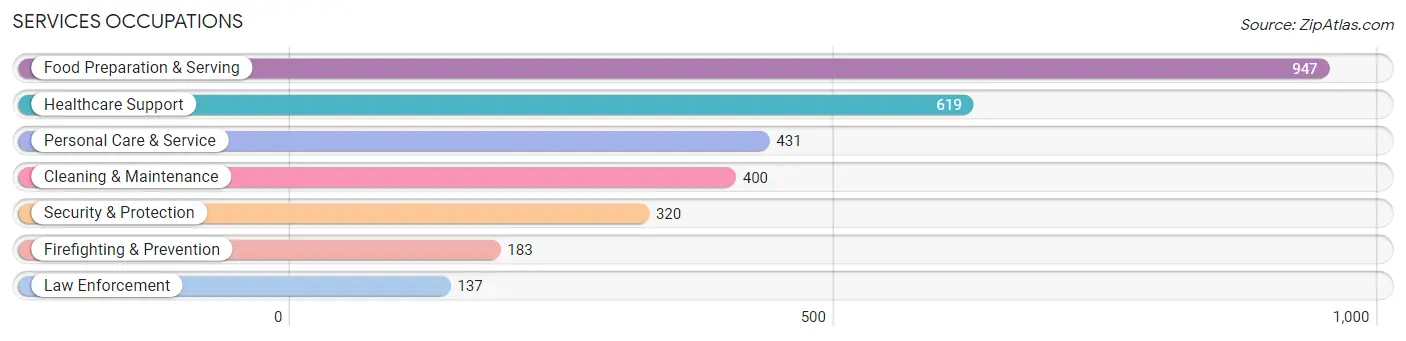
Services Occupations
The most common Services occupations in Valrico are Food Preparation & Serving (947 | 4.7%), Healthcare Support (619 | 3.1%), Personal Care & Service (431 | 2.1%), Cleaning & Maintenance (400 | 2.0%), and Security & Protection (320 | 1.6%).
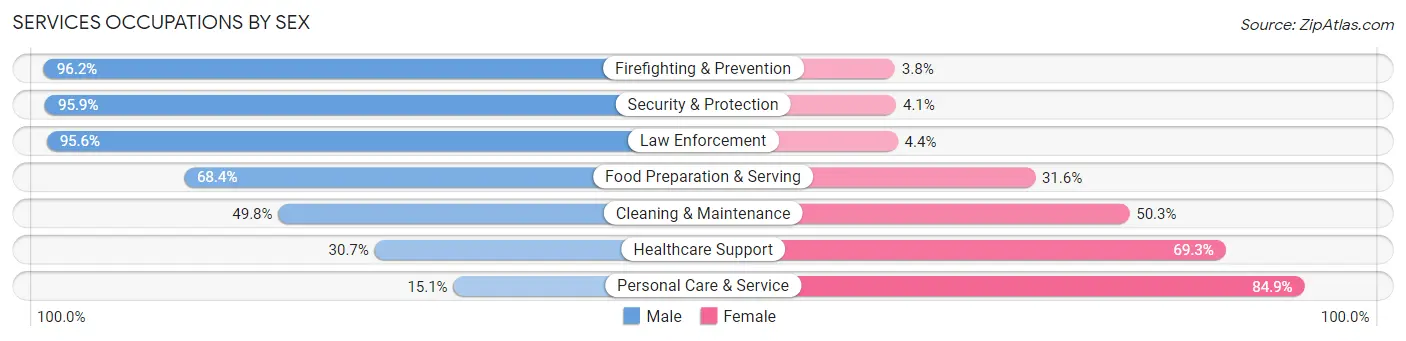
Services Occupations by Sex
Within the Services occupations in Valrico, the most male-oriented occupations are Firefighting & Prevention (96.2%), Security & Protection (95.9%), and Law Enforcement (95.6%), while the most female-oriented occupations are Personal Care & Service (84.9%), Healthcare Support (69.3%), and Cleaning & Maintenance (50.2%).
| Occupation | Male | Female |
| Healthcare Support | 190 (30.7%) | 429 (69.3%) |
| Security & Protection | 307 (95.9%) | 13 (4.1%) |
| Firefighting & Prevention | 176 (96.2%) | 7 (3.8%) |
| Law Enforcement | 131 (95.6%) | 6 (4.4%) |
| Food Preparation & Serving | 648 (68.4%) | 299 (31.6%) |
| Cleaning & Maintenance | 199 (49.7%) | 201 (50.2%) |
| Personal Care & Service | 65 (15.1%) | 366 (84.9%) |
| Total (Category) | 1,409 (51.9%) | 1,308 (48.1%) |
| Total (Overall) | 9,889 (49.2%) | 10,215 (50.8%) |
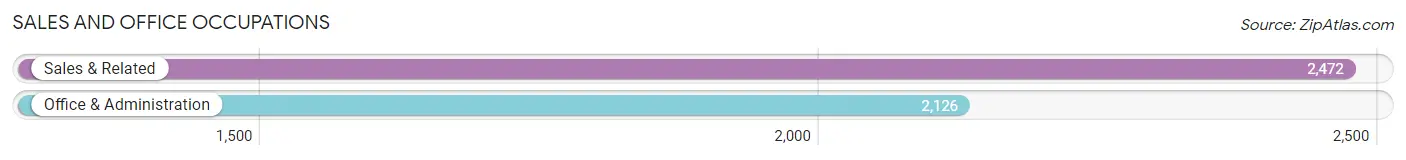
Sales and Office Occupations
The most common Sales and Office occupations in Valrico are Sales & Related (2,472 | 12.3%), and Office & Administration (2,126 | 10.6%).
Sales and Office Occupations by Sex
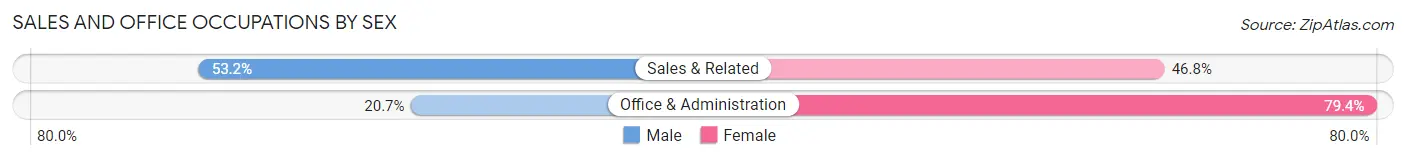
| Occupation | Male | Female |
| Sales & Related | 1,315 (53.2%) | 1,157 (46.8%) |
| Office & Administration | 439 (20.6%) | 1,687 (79.3%) |
| Total (Category) | 1,754 (38.2%) | 2,844 (61.9%) |
| Total (Overall) | 9,889 (49.2%) | 10,215 (50.8%) |
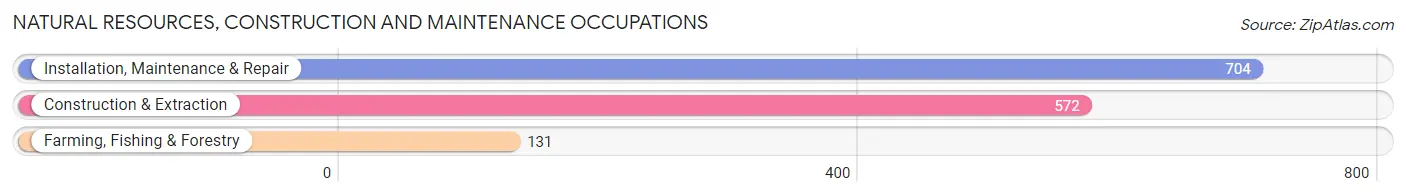
Natural Resources, Construction and Maintenance Occupations
The most common Natural Resources, Construction and Maintenance occupations in Valrico are Installation, Maintenance & Repair (704 | 3.5%), Construction & Extraction (572 | 2.9%), and Farming, Fishing & Forestry (131 | 0.6%).
Natural Resources, Construction and Maintenance Occupations by Sex
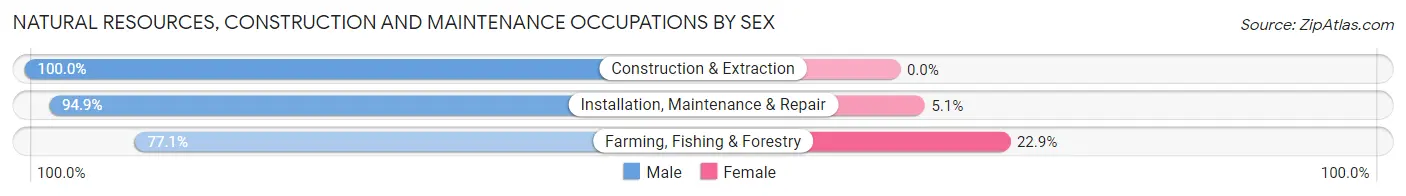
| Occupation | Male | Female |
| Farming, Fishing & Forestry | 101 (77.1%) | 30 (22.9%) |
| Construction & Extraction | 572 (100.0%) | 0 (0.0%) |
| Installation, Maintenance & Repair | 668 (94.9%) | 36 (5.1%) |
| Total (Category) | 1,341 (95.3%) | 66 (4.7%) |
| Total (Overall) | 9,889 (49.2%) | 10,215 (50.8%) |
Production, Transportation and Moving Occupations
The most common Production, Transportation and Moving occupations in Valrico are Transportation (677 | 3.4%), Production (654 | 3.3%), and Material Moving (405 | 2.0%).
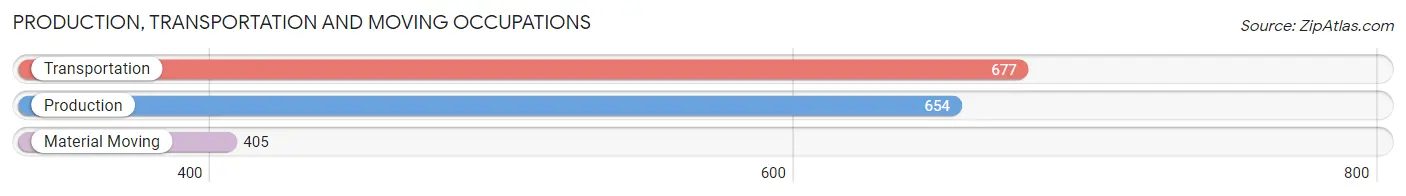
Production, Transportation and Moving Occupations by Sex
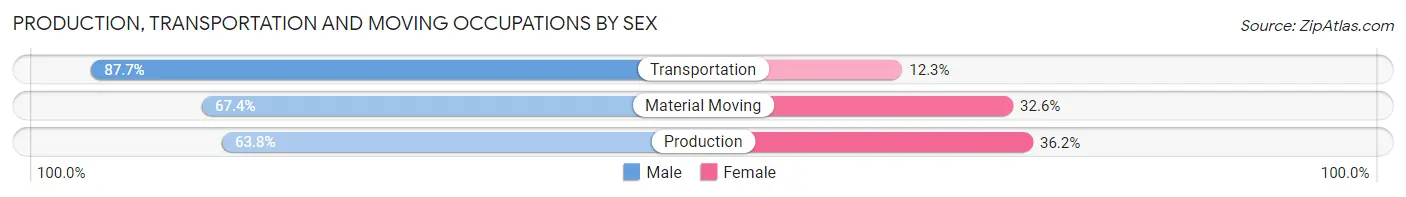
| Occupation | Male | Female |
| Production | 417 (63.8%) | 237 (36.2%) |
| Transportation | 594 (87.7%) | 83 (12.3%) |
| Material Moving | 273 (67.4%) | 132 (32.6%) |
| Total (Category) | 1,284 (74.0%) | 452 (26.0%) |
| Total (Overall) | 9,889 (49.2%) | 10,215 (50.8%) |
Employment Industries by Sex in Valrico
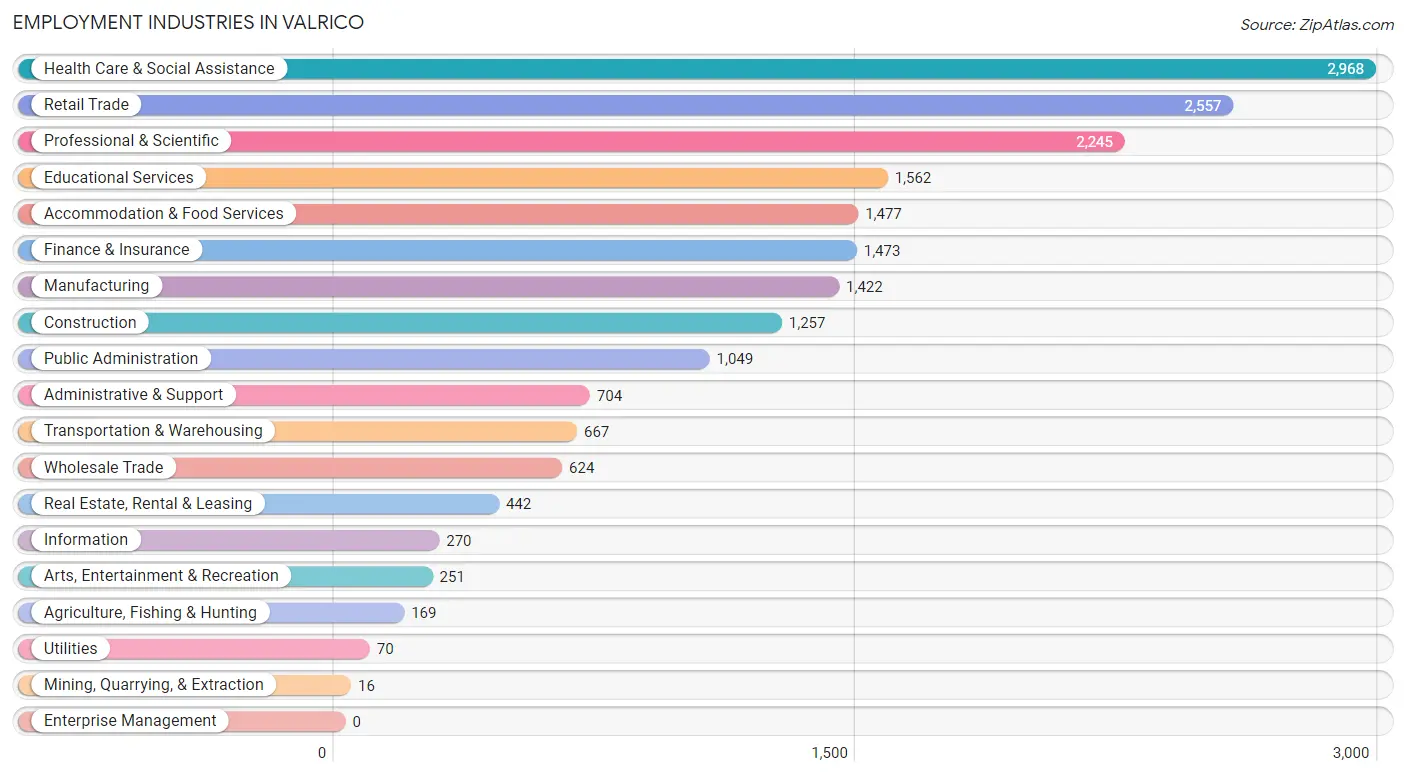
Employment Industries in Valrico
The major employment industries in Valrico include Health Care & Social Assistance (2,968 | 14.8%), Retail Trade (2,557 | 12.7%), Professional & Scientific (2,245 | 11.2%), Educational Services (1,562 | 7.8%), and Accommodation & Food Services (1,477 | 7.3%).
Employment Industries by Sex in Valrico
The Valrico industries that see more men than women are Mining, Quarrying, & Extraction (100.0%), Agriculture, Fishing & Hunting (82.3%), and Utilities (78.6%), whereas the industries that tend to have a higher number of women are Health Care & Social Assistance (83.7%), Educational Services (82.6%), and Retail Trade (48.9%).
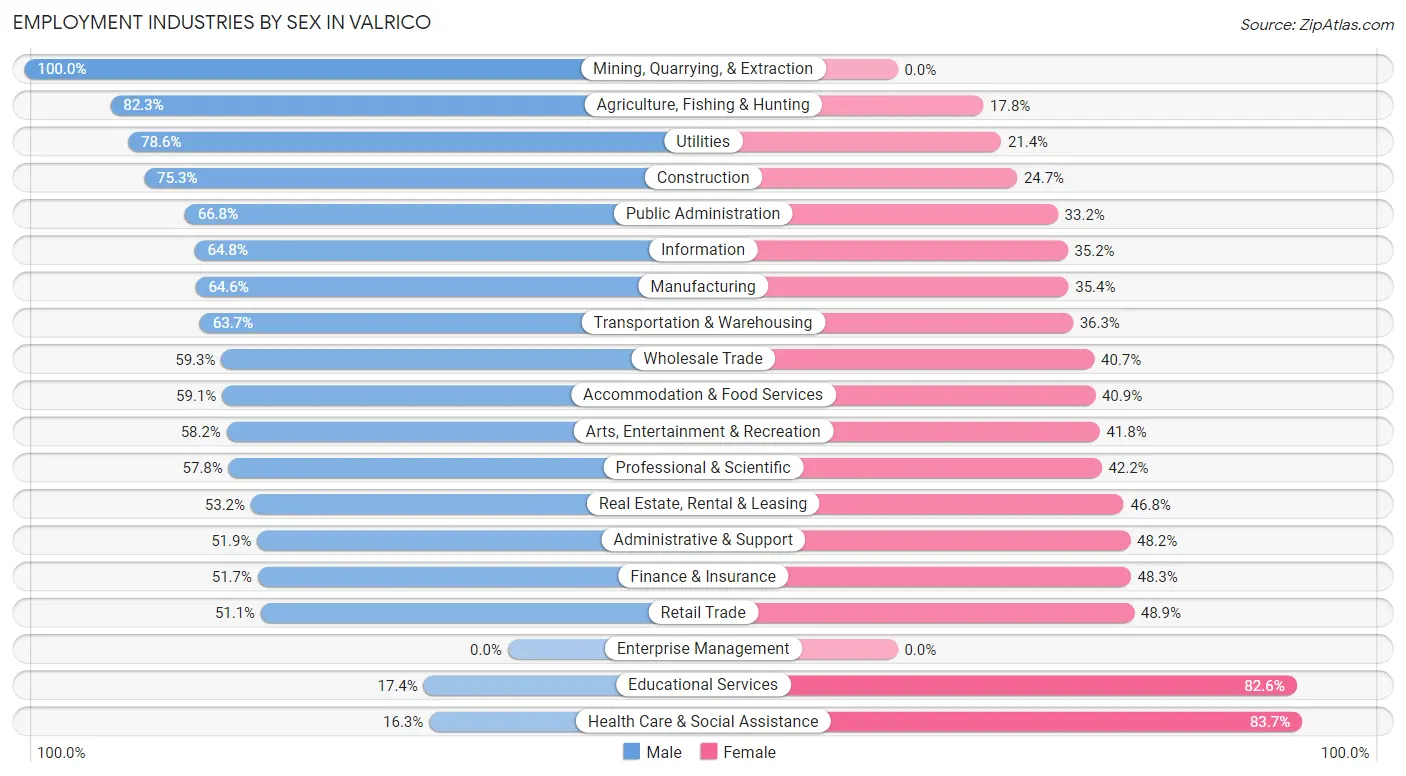
| Industry | Male | Female |
| Agriculture, Fishing & Hunting | 139 (82.3%) | 30 (17.7%) |
| Mining, Quarrying, & Extraction | 16 (100.0%) | 0 (0.0%) |
| Construction | 946 (75.3%) | 311 (24.7%) |
| Manufacturing | 919 (64.6%) | 503 (35.4%) |
| Wholesale Trade | 370 (59.3%) | 254 (40.7%) |
| Retail Trade | 1,306 (51.1%) | 1,251 (48.9%) |
| Transportation & Warehousing | 425 (63.7%) | 242 (36.3%) |
| Utilities | 55 (78.6%) | 15 (21.4%) |
| Information | 175 (64.8%) | 95 (35.2%) |
| Finance & Insurance | 762 (51.7%) | 711 (48.3%) |
| Real Estate, Rental & Leasing | 235 (53.2%) | 207 (46.8%) |
| Professional & Scientific | 1,297 (57.8%) | 948 (42.2%) |
| Enterprise Management | 0 (0.0%) | 0 (0.0%) |
| Administrative & Support | 365 (51.8%) | 339 (48.1%) |
| Educational Services | 272 (17.4%) | 1,290 (82.6%) |
| Health Care & Social Assistance | 483 (16.3%) | 2,485 (83.7%) |
| Arts, Entertainment & Recreation | 146 (58.2%) | 105 (41.8%) |
| Accommodation & Food Services | 873 (59.1%) | 604 (40.9%) |
| Public Administration | 701 (66.8%) | 348 (33.2%) |
| Total | 9,889 (49.2%) | 10,215 (50.8%) |
Education in Valrico
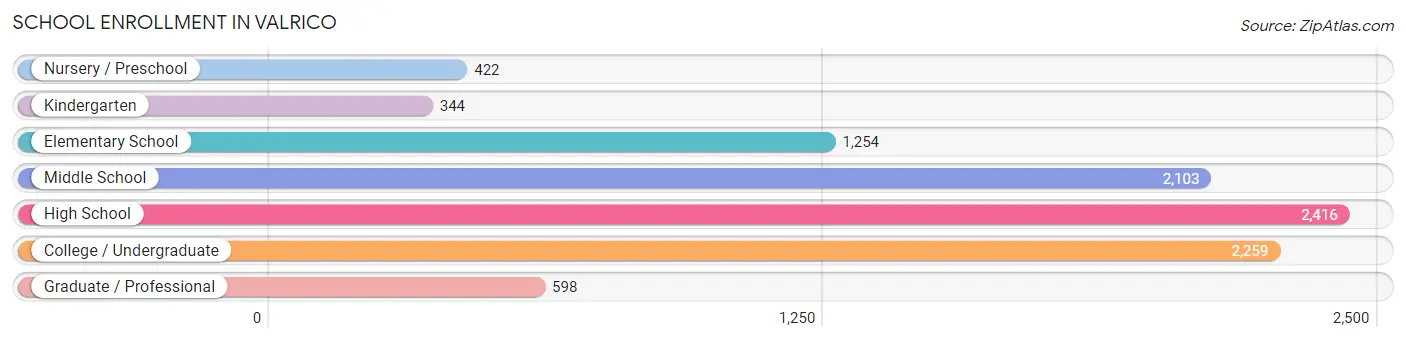
School Enrollment in Valrico
The most common levels of schooling among the 9,396 students in Valrico are high school (2,416 | 25.7%), college / undergraduate (2,259 | 24.0%), and middle school (2,103 | 22.4%).
| School Level | # Students | % Students |
| Nursery / Preschool | 422 | 4.5% |
| Kindergarten | 344 | 3.7% |
| Elementary School | 1,254 | 13.4% |
| Middle School | 2,103 | 22.4% |
| High School | 2,416 | 25.7% |
| College / Undergraduate | 2,259 | 24.0% |
| Graduate / Professional | 598 | 6.4% |
| Total | 9,396 | 100.0% |
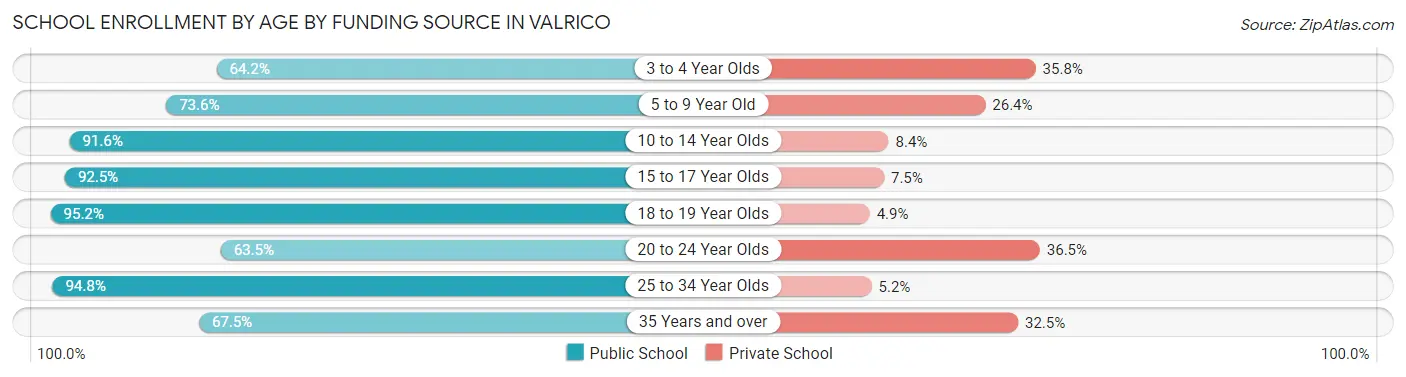
School Enrollment by Age by Funding Source in Valrico
Out of a total of 9,396 students who are enrolled in schools in Valrico, 1,569 (16.7%) attend a private institution, while the remaining 7,827 (83.3%) are enrolled in public schools. The age group of 20 to 24 year olds has the highest likelihood of being enrolled in private schools, with 422 (36.5% in the age bracket) enrolled. Conversely, the age group of 18 to 19 year olds has the lowest likelihood of being enrolled in a private school, with 902 (95.2% in the age bracket) attending a public institution.
| Age Bracket | Public School | Private School |
| 3 to 4 Year Olds | 185 (64.2%) | 103 (35.8%) |
| 5 to 9 Year Old | 1,208 (73.6%) | 433 (26.4%) |
| 10 to 14 Year Olds | 2,276 (91.6%) | 208 (8.4%) |
| 15 to 17 Year Olds | 1,746 (92.5%) | 142 (7.5%) |
| 18 to 19 Year Olds | 902 (95.2%) | 46 (4.9%) |
| 20 to 24 Year Olds | 733 (63.5%) | 422 (36.5%) |
| 25 to 34 Year Olds | 383 (94.8%) | 21 (5.2%) |
| 35 Years and over | 397 (67.5%) | 191 (32.5%) |
| Total | 7,827 (83.3%) | 1,569 (16.7%) |
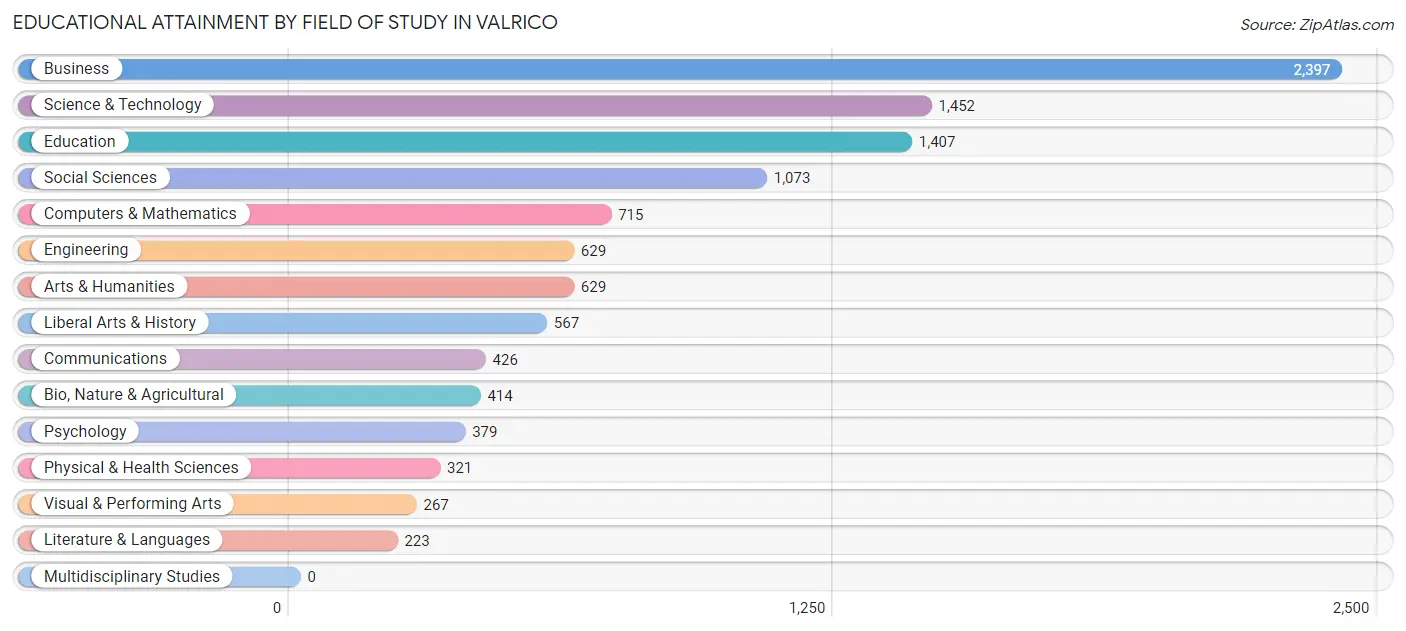
Educational Attainment by Field of Study in Valrico
Business (2,397 | 22.0%), science & technology (1,452 | 13.3%), education (1,407 | 12.9%), social sciences (1,073 | 9.8%), and computers & mathematics (715 | 6.6%) are the most common fields of study among 10,899 individuals in Valrico who have obtained a bachelor's degree or higher.
| Field of Study | # Graduates | % Graduates |
| Computers & Mathematics | 715 | 6.6% |
| Bio, Nature & Agricultural | 414 | 3.8% |
| Physical & Health Sciences | 321 | 2.9% |
| Psychology | 379 | 3.5% |
| Social Sciences | 1,073 | 9.8% |
| Engineering | 629 | 5.8% |
| Multidisciplinary Studies | 0 | 0.0% |
| Science & Technology | 1,452 | 13.3% |
| Business | 2,397 | 22.0% |
| Education | 1,407 | 12.9% |
| Literature & Languages | 223 | 2.1% |
| Liberal Arts & History | 567 | 5.2% |
| Visual & Performing Arts | 267 | 2.5% |
| Communications | 426 | 3.9% |
| Arts & Humanities | 629 | 5.8% |
| Total | 10,899 | 100.0% |
Transportation & Commute in Valrico
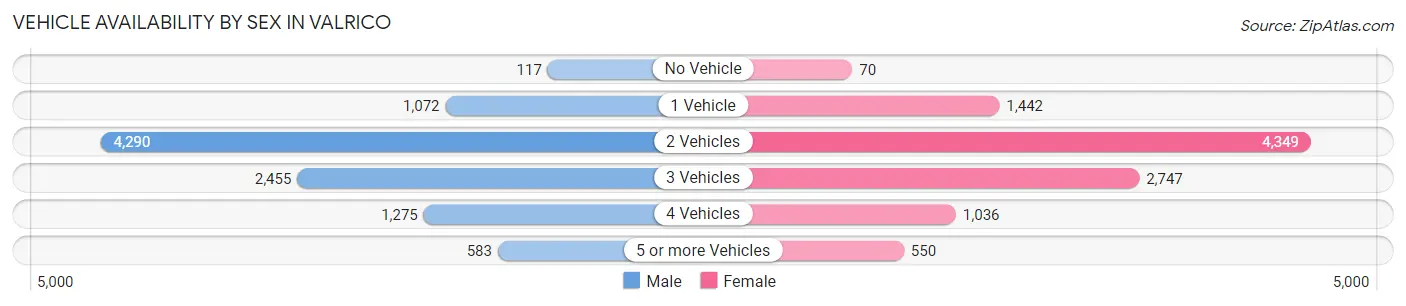
Vehicle Availability by Sex in Valrico
The most prevalent vehicle ownership categories in Valrico are males with 2 vehicles (4,290, accounting for 43.8%) and females with 2 vehicles (4,349, making up 42.1%).
| Vehicles Available | Male | Female |
| No Vehicle | 117 (1.2%) | 70 (0.7%) |
| 1 Vehicle | 1,072 (11.0%) | 1,442 (14.1%) |
| 2 Vehicles | 4,290 (43.8%) | 4,349 (42.7%) |
| 3 Vehicles | 2,455 (25.1%) | 2,747 (27.0%) |
| 4 Vehicles | 1,275 (13.0%) | 1,036 (10.2%) |
| 5 or more Vehicles | 583 (5.9%) | 550 (5.4%) |
| Total | 9,792 (100.0%) | 10,194 (100.0%) |
Commute Time in Valrico
The most frequently occuring commute durations in Valrico are 30 to 34 minutes (3,351 commuters, 21.1%), 45 to 59 minutes (2,293 commuters, 14.4%), and 20 to 24 minutes (2,183 commuters, 13.7%).
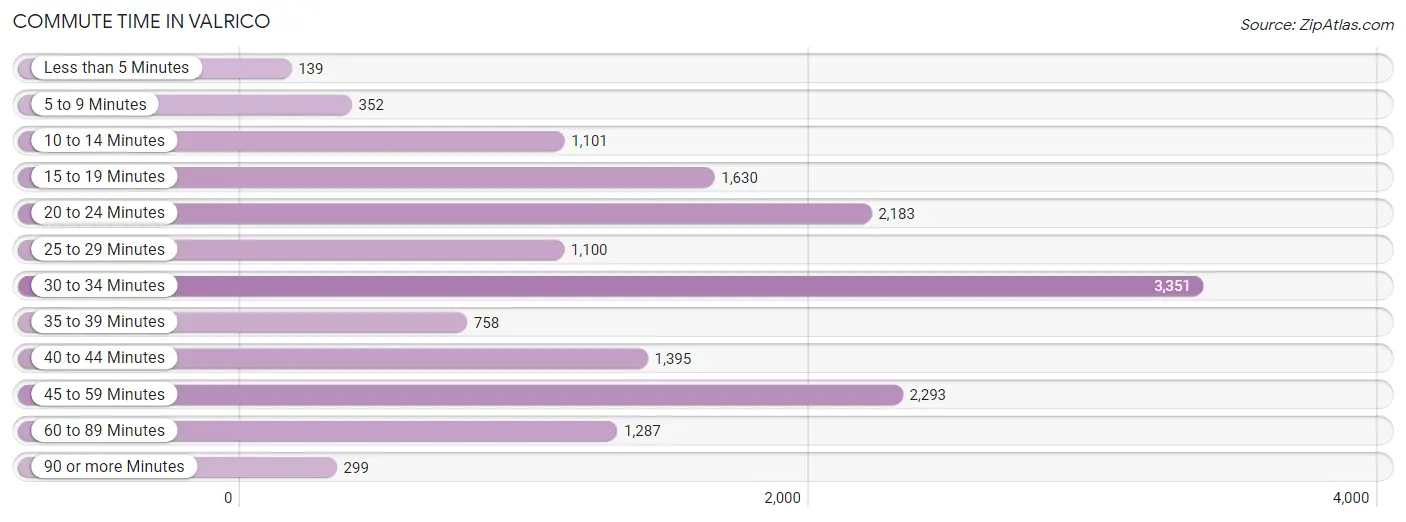
| Commute Time | # Commuters | % Commuters |
| Less than 5 Minutes | 139 | 0.9% |
| 5 to 9 Minutes | 352 | 2.2% |
| 10 to 14 Minutes | 1,101 | 6.9% |
| 15 to 19 Minutes | 1,630 | 10.3% |
| 20 to 24 Minutes | 2,183 | 13.7% |
| 25 to 29 Minutes | 1,100 | 6.9% |
| 30 to 34 Minutes | 3,351 | 21.1% |
| 35 to 39 Minutes | 758 | 4.8% |
| 40 to 44 Minutes | 1,395 | 8.8% |
| 45 to 59 Minutes | 2,293 | 14.4% |
| 60 to 89 Minutes | 1,287 | 8.1% |
| 90 or more Minutes | 299 | 1.9% |
Commute Time by Sex in Valrico
The most common commute times in Valrico are 30 to 34 minutes (2,039 commuters, 25.5%) for males and 30 to 34 minutes (1,312 commuters, 16.6%) for females.
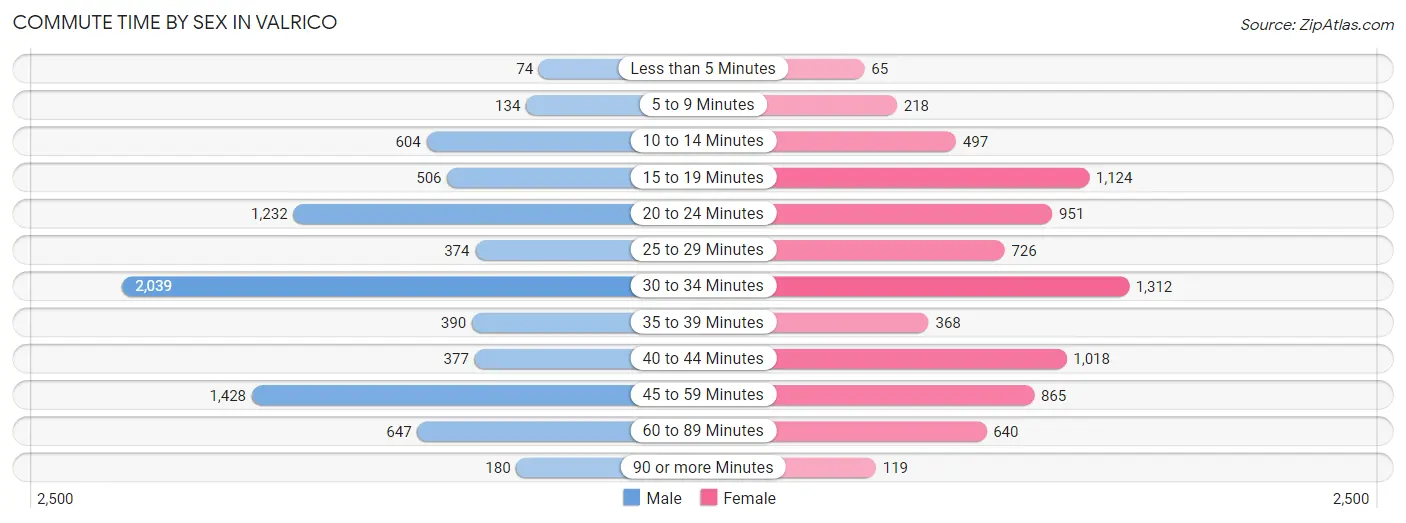
| Commute Time | Male | Female |
| Less than 5 Minutes | 74 (0.9%) | 65 (0.8%) |
| 5 to 9 Minutes | 134 (1.7%) | 218 (2.8%) |
| 10 to 14 Minutes | 604 (7.6%) | 497 (6.3%) |
| 15 to 19 Minutes | 506 (6.3%) | 1,124 (14.2%) |
| 20 to 24 Minutes | 1,232 (15.4%) | 951 (12.0%) |
| 25 to 29 Minutes | 374 (4.7%) | 726 (9.2%) |
| 30 to 34 Minutes | 2,039 (25.5%) | 1,312 (16.6%) |
| 35 to 39 Minutes | 390 (4.9%) | 368 (4.7%) |
| 40 to 44 Minutes | 377 (4.7%) | 1,018 (12.9%) |
| 45 to 59 Minutes | 1,428 (17.9%) | 865 (11.0%) |
| 60 to 89 Minutes | 647 (8.1%) | 640 (8.1%) |
| 90 or more Minutes | 180 (2.2%) | 119 (1.5%) |
Time of Departure to Work by Sex in Valrico
The most frequent times of departure to work in Valrico are 7:00 AM to 7:29 AM (1,395, 17.5%) for males and 7:00 AM to 7:29 AM (1,529, 19.4%) for females.
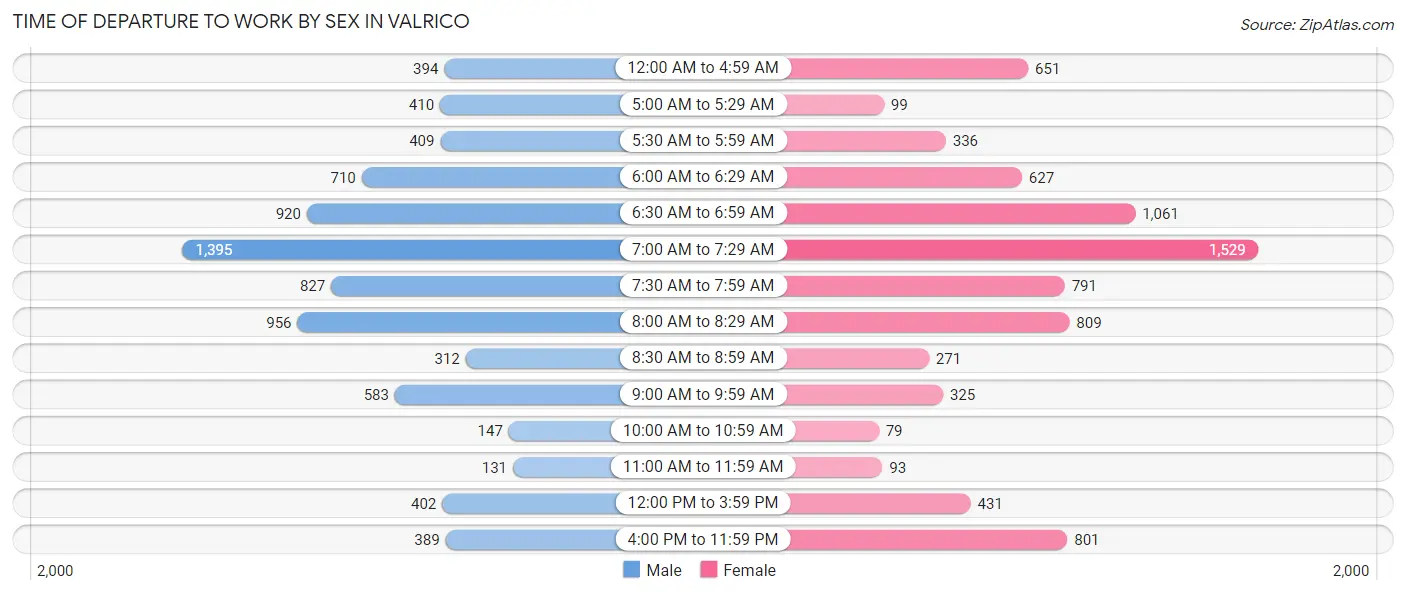
| Time of Departure | Male | Female |
| 12:00 AM to 4:59 AM | 394 (4.9%) | 651 (8.2%) |
| 5:00 AM to 5:29 AM | 410 (5.1%) | 99 (1.3%) |
| 5:30 AM to 5:59 AM | 409 (5.1%) | 336 (4.3%) |
| 6:00 AM to 6:29 AM | 710 (8.9%) | 627 (7.9%) |
| 6:30 AM to 6:59 AM | 920 (11.5%) | 1,061 (13.4%) |
| 7:00 AM to 7:29 AM | 1,395 (17.5%) | 1,529 (19.4%) |
| 7:30 AM to 7:59 AM | 827 (10.4%) | 791 (10.0%) |
| 8:00 AM to 8:29 AM | 956 (12.0%) | 809 (10.2%) |
| 8:30 AM to 8:59 AM | 312 (3.9%) | 271 (3.4%) |
| 9:00 AM to 9:59 AM | 583 (7.3%) | 325 (4.1%) |
| 10:00 AM to 10:59 AM | 147 (1.8%) | 79 (1.0%) |
| 11:00 AM to 11:59 AM | 131 (1.6%) | 93 (1.2%) |
| 12:00 PM to 3:59 PM | 402 (5.0%) | 431 (5.4%) |
| 4:00 PM to 11:59 PM | 389 (4.9%) | 801 (10.1%) |
| Total | 7,985 (100.0%) | 7,903 (100.0%) |
Housing Occupancy in Valrico
Occupancy by Ownership in Valrico
Of the total 14,088 dwellings in Valrico, owner-occupied units account for 11,170 (79.3%), while renter-occupied units make up 2,918 (20.7%).
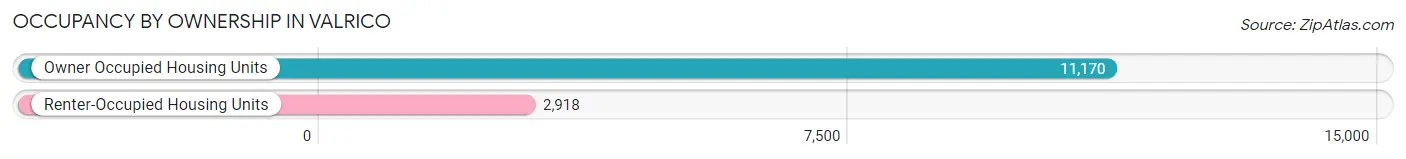
| Occupancy | # Housing Units | % Housing Units |
| Owner Occupied Housing Units | 11,170 | 79.3% |
| Renter-Occupied Housing Units | 2,918 | 20.7% |
| Total Occupied Housing Units | 14,088 | 100.0% |
Occupancy by Household Size in Valrico
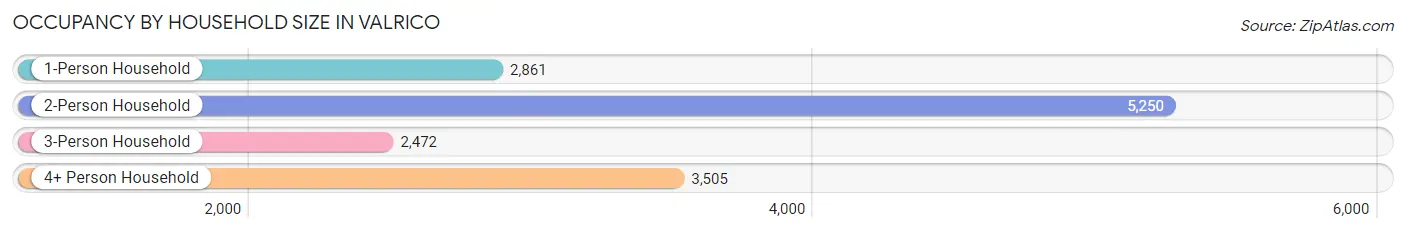
| Household Size | # Housing Units | % Housing Units |
| 1-Person Household | 2,861 | 20.3% |
| 2-Person Household | 5,250 | 37.3% |
| 3-Person Household | 2,472 | 17.5% |
| 4+ Person Household | 3,505 | 24.9% |
| Total Housing Units | 14,088 | 100.0% |
Occupancy by Ownership by Household Size in Valrico
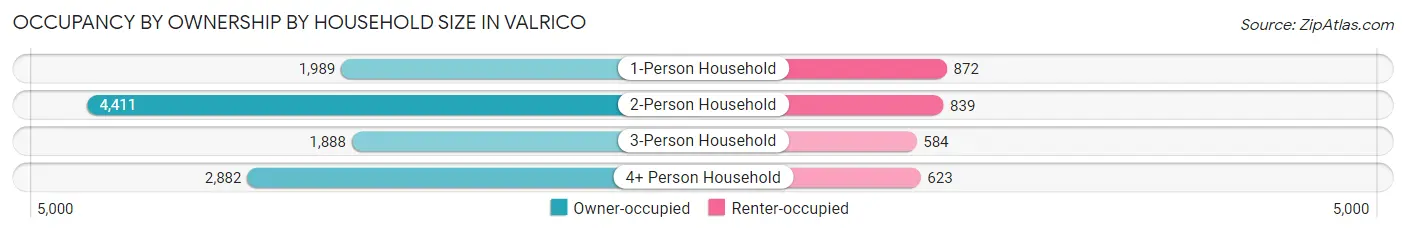
| Household Size | Owner-occupied | Renter-occupied |
| 1-Person Household | 1,989 (69.5%) | 872 (30.5%) |
| 2-Person Household | 4,411 (84.0%) | 839 (16.0%) |
| 3-Person Household | 1,888 (76.4%) | 584 (23.6%) |
| 4+ Person Household | 2,882 (82.2%) | 623 (17.8%) |
| Total Housing Units | 11,170 (79.3%) | 2,918 (20.7%) |
Occupancy by Educational Attainment in Valrico
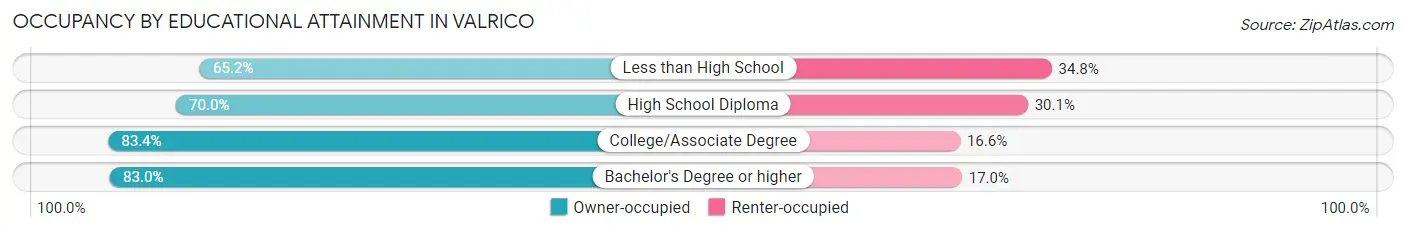
| Household Size | Owner-occupied | Renter-occupied |
| Less than High School | 452 (65.2%) | 241 (34.8%) |
| High School Diploma | 2,242 (70.0%) | 963 (30.0%) |
| College/Associate Degree | 3,598 (83.4%) | 717 (16.6%) |
| Bachelor's Degree or higher | 4,878 (83.0%) | 997 (17.0%) |
Occupancy by Age of Householder in Valrico
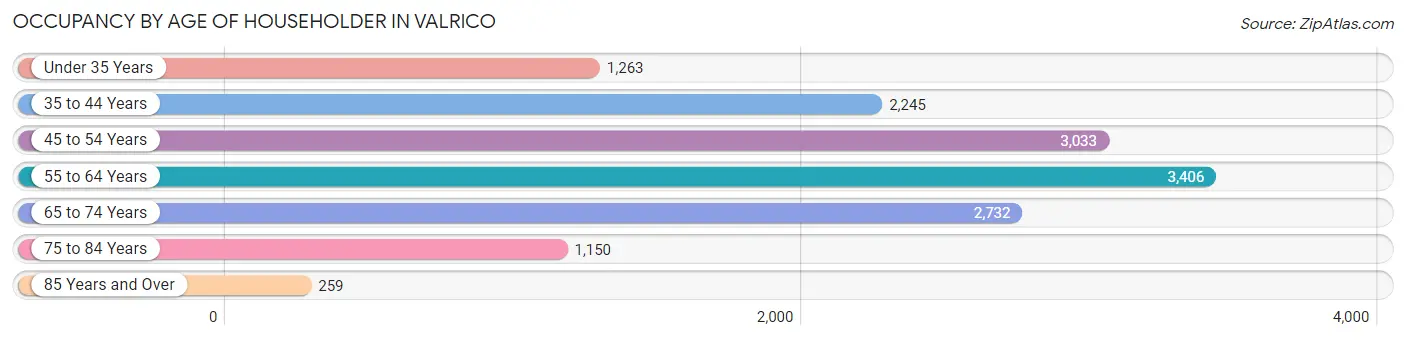
| Age Bracket | # Households | % Households |
| Under 35 Years | 1,263 | 9.0% |
| 35 to 44 Years | 2,245 | 15.9% |
| 45 to 54 Years | 3,033 | 21.5% |
| 55 to 64 Years | 3,406 | 24.2% |
| 65 to 74 Years | 2,732 | 19.4% |
| 75 to 84 Years | 1,150 | 8.2% |
| 85 Years and Over | 259 | 1.8% |
| Total | 14,088 | 100.0% |
Housing Finances in Valrico
Median Income by Occupancy in Valrico
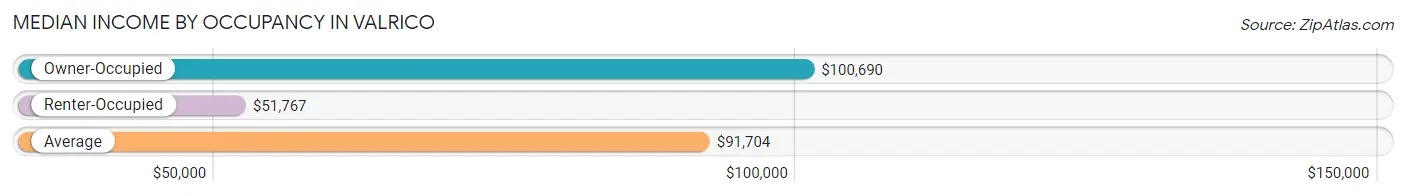
| Occupancy Type | # Households | Median Income |
| Owner-Occupied | 11,170 (79.3%) | $100,690 |
| Renter-Occupied | 2,918 (20.7%) | $51,767 |
| Average | 14,088 (100.0%) | $91,704 |
Occupancy by Householder Income Bracket in Valrico
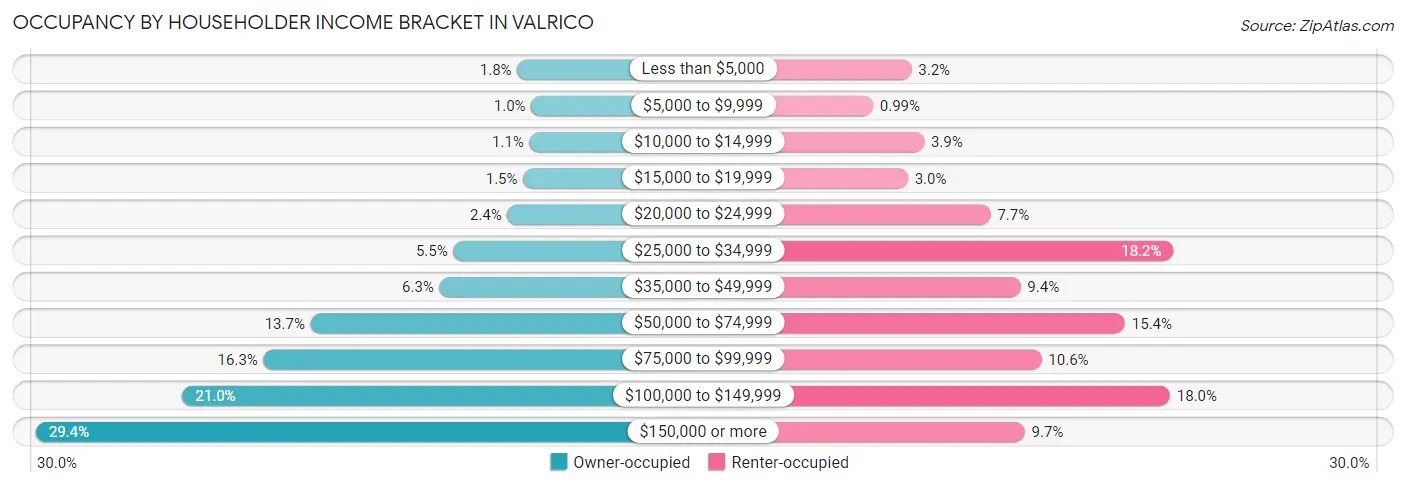
| Income Bracket | Owner-occupied | Renter-occupied |
| Less than $5,000 | 205 (1.8%) | 93 (3.2%) |
| $5,000 to $9,999 | 116 (1.0%) | 29 (1.0%) |
| $10,000 to $14,999 | 127 (1.1%) | 114 (3.9%) |
| $15,000 to $19,999 | 168 (1.5%) | 87 (3.0%) |
| $20,000 to $24,999 | 268 (2.4%) | 225 (7.7%) |
| $25,000 to $34,999 | 613 (5.5%) | 530 (18.2%) |
| $35,000 to $49,999 | 701 (6.3%) | 275 (9.4%) |
| $50,000 to $74,999 | 1,525 (13.7%) | 449 (15.4%) |
| $75,000 to $99,999 | 1,825 (16.3%) | 310 (10.6%) |
| $100,000 to $149,999 | 2,343 (21.0%) | 524 (18.0%) |
| $150,000 or more | 3,279 (29.4%) | 282 (9.7%) |
| Total | 11,170 (100.0%) | 2,918 (100.0%) |
Monthly Housing Cost Tiers in Valrico
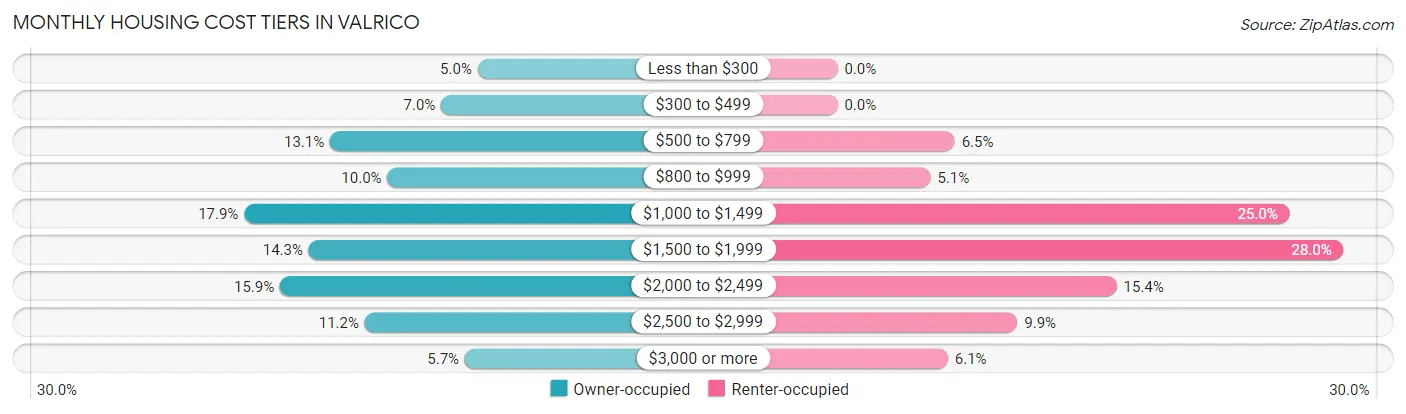
| Monthly Cost | Owner-occupied | Renter-occupied |
| Less than $300 | 555 (5.0%) | 0 (0.0%) |
| $300 to $499 | 781 (7.0%) | 0 (0.0%) |
| $500 to $799 | 1,467 (13.1%) | 189 (6.5%) |
| $800 to $999 | 1,112 (10.0%) | 150 (5.1%) |
| $1,000 to $1,499 | 1,996 (17.9%) | 729 (25.0%) |
| $1,500 to $1,999 | 1,597 (14.3%) | 816 (28.0%) |
| $2,000 to $2,499 | 1,775 (15.9%) | 450 (15.4%) |
| $2,500 to $2,999 | 1,252 (11.2%) | 290 (9.9%) |
| $3,000 or more | 635 (5.7%) | 178 (6.1%) |
| Total | 11,170 (100.0%) | 2,918 (100.0%) |
Physical Housing Characteristics in Valrico
Housing Structures in Valrico
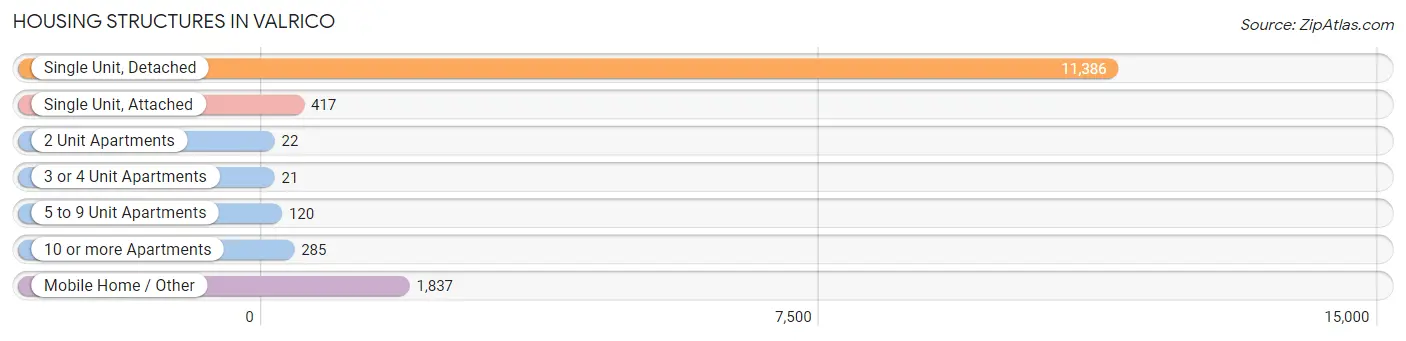
| Structure Type | # Housing Units | % Housing Units |
| Single Unit, Detached | 11,386 | 80.8% |
| Single Unit, Attached | 417 | 3.0% |
| 2 Unit Apartments | 22 | 0.2% |
| 3 or 4 Unit Apartments | 21 | 0.2% |
| 5 to 9 Unit Apartments | 120 | 0.9% |
| 10 or more Apartments | 285 | 2.0% |
| Mobile Home / Other | 1,837 | 13.0% |
| Total | 14,088 | 100.0% |
Housing Structures by Occupancy in Valrico
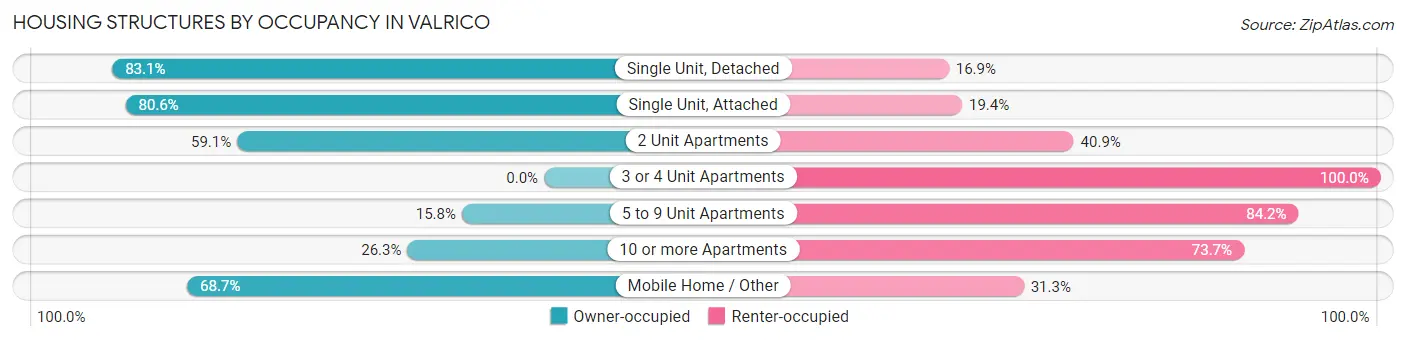
| Structure Type | Owner-occupied | Renter-occupied |
| Single Unit, Detached | 9,465 (83.1%) | 1,921 (16.9%) |
| Single Unit, Attached | 336 (80.6%) | 81 (19.4%) |
| 2 Unit Apartments | 13 (59.1%) | 9 (40.9%) |
| 3 or 4 Unit Apartments | 0 (0.0%) | 21 (100.0%) |
| 5 to 9 Unit Apartments | 19 (15.8%) | 101 (84.2%) |
| 10 or more Apartments | 75 (26.3%) | 210 (73.7%) |
| Mobile Home / Other | 1,262 (68.7%) | 575 (31.3%) |
| Total | 11,170 (79.3%) | 2,918 (20.7%) |
Housing Structures by Number of Rooms in Valrico
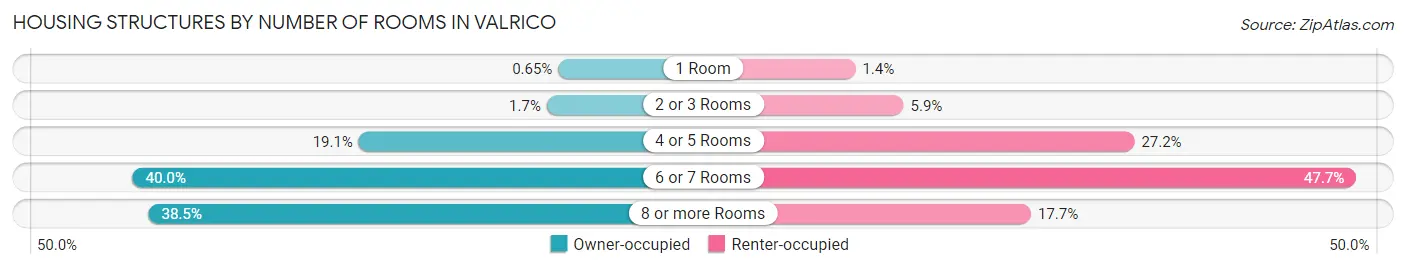
| Number of Rooms | Owner-occupied | Renter-occupied |
| 1 Room | 73 (0.6%) | 42 (1.4%) |
| 2 or 3 Rooms | 191 (1.7%) | 172 (5.9%) |
| 4 or 5 Rooms | 2,133 (19.1%) | 795 (27.2%) |
| 6 or 7 Rooms | 4,469 (40.0%) | 1,393 (47.7%) |
| 8 or more Rooms | 4,304 (38.5%) | 516 (17.7%) |
| Total | 11,170 (100.0%) | 2,918 (100.0%) |
Housing Structure by Heating Type in Valrico
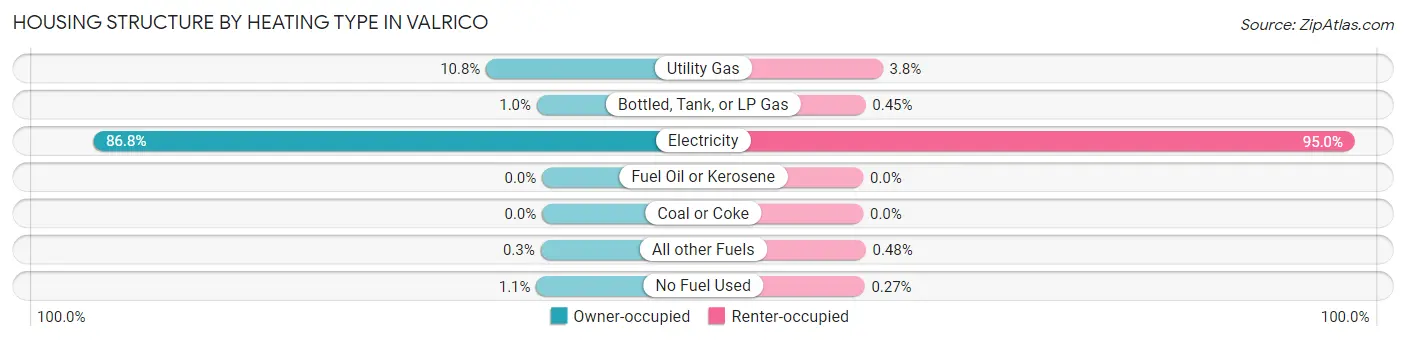
| Heating Type | Owner-occupied | Renter-occupied |
| Utility Gas | 1,206 (10.8%) | 110 (3.8%) |
| Bottled, Tank, or LP Gas | 113 (1.0%) | 13 (0.4%) |
| Electricity | 9,693 (86.8%) | 2,773 (95.0%) |
| Fuel Oil or Kerosene | 0 (0.0%) | 0 (0.0%) |
| Coal or Coke | 0 (0.0%) | 0 (0.0%) |
| All other Fuels | 34 (0.3%) | 14 (0.5%) |
| No Fuel Used | 124 (1.1%) | 8 (0.3%) |
| Total | 11,170 (100.0%) | 2,918 (100.0%) |
Household Vehicle Usage in Valrico
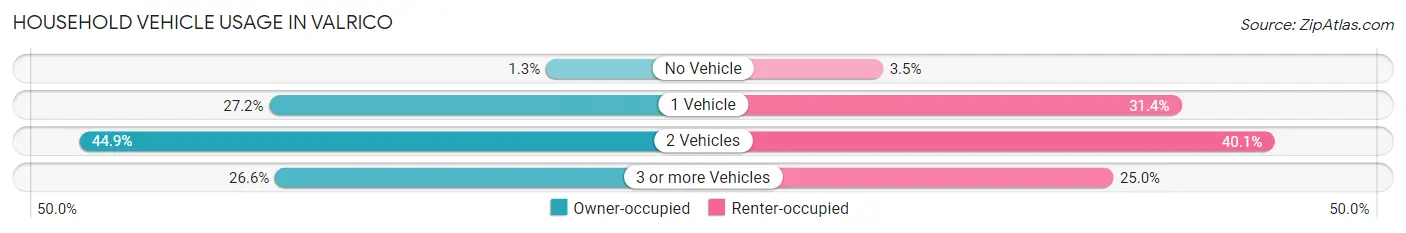
| Vehicles per Household | Owner-occupied | Renter-occupied |
| No Vehicle | 149 (1.3%) | 103 (3.5%) |
| 1 Vehicle | 3,033 (27.2%) | 916 (31.4%) |
| 2 Vehicles | 5,016 (44.9%) | 1,169 (40.1%) |
| 3 or more Vehicles | 2,972 (26.6%) | 730 (25.0%) |
| Total | 11,170 (100.0%) | 2,918 (100.0%) |
Real Estate & Mortgages in Valrico
Real Estate and Mortgage Overview in Valrico
| Characteristic | Without Mortgage | With Mortgage |
| Housing Units | 4,165 | 7,005 |
| Median Property Value | $264,600 | $347,600 |
| Median Household Income | $71,279 | $2,594 |
| Monthly Housing Costs | $673 | $604 |
| Real Estate Taxes | $2,474 | $268 |
Property Value by Mortgage Status in Valrico
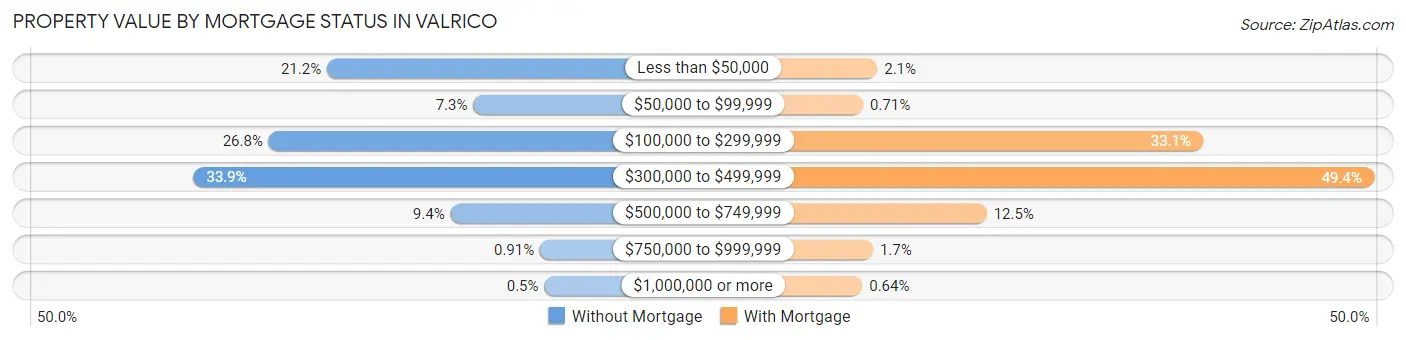
| Property Value | Without Mortgage | With Mortgage |
| Less than $50,000 | 883 (21.2%) | 145 (2.1%) |
| $50,000 to $99,999 | 303 (7.3%) | 50 (0.7%) |
| $100,000 to $299,999 | 1,114 (26.8%) | 2,317 (33.1%) |
| $300,000 to $499,999 | 1,413 (33.9%) | 3,457 (49.3%) |
| $500,000 to $749,999 | 393 (9.4%) | 875 (12.5%) |
| $750,000 to $999,999 | 38 (0.9%) | 116 (1.7%) |
| $1,000,000 or more | 21 (0.5%) | 45 (0.6%) |
| Total | 4,165 (100.0%) | 7,005 (100.0%) |
Household Income by Mortgage Status in Valrico
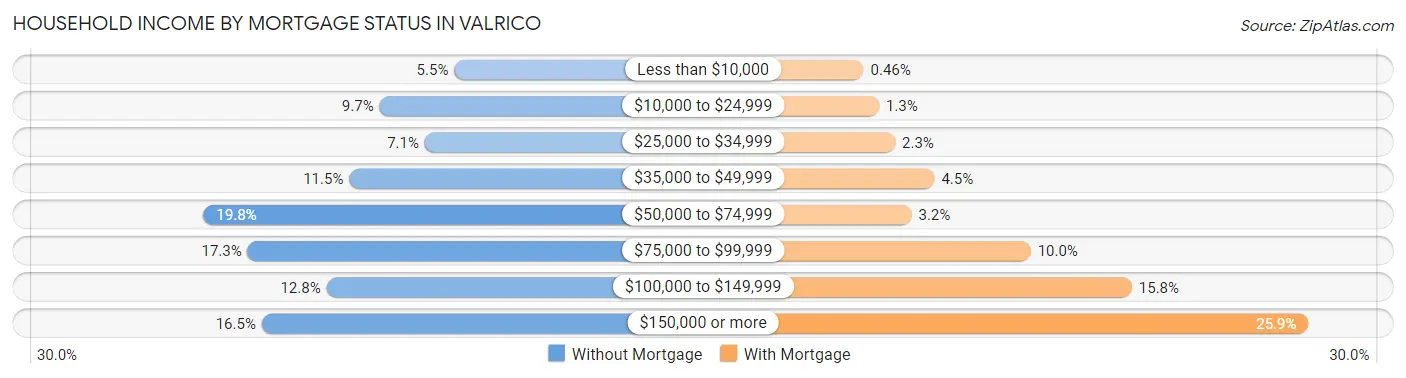
| Household Income | Without Mortgage | With Mortgage |
| Less than $10,000 | 227 (5.4%) | 32 (0.5%) |
| $10,000 to $24,999 | 405 (9.7%) | 94 (1.3%) |
| $25,000 to $34,999 | 297 (7.1%) | 158 (2.3%) |
| $35,000 to $49,999 | 477 (11.5%) | 316 (4.5%) |
| $50,000 to $74,999 | 824 (19.8%) | 224 (3.2%) |
| $75,000 to $99,999 | 719 (17.3%) | 701 (10.0%) |
| $100,000 to $149,999 | 531 (12.8%) | 1,106 (15.8%) |
| $150,000 or more | 685 (16.5%) | 1,812 (25.9%) |
| Total | 4,165 (100.0%) | 7,005 (100.0%) |
Property Value to Household Income Ratio in Valrico
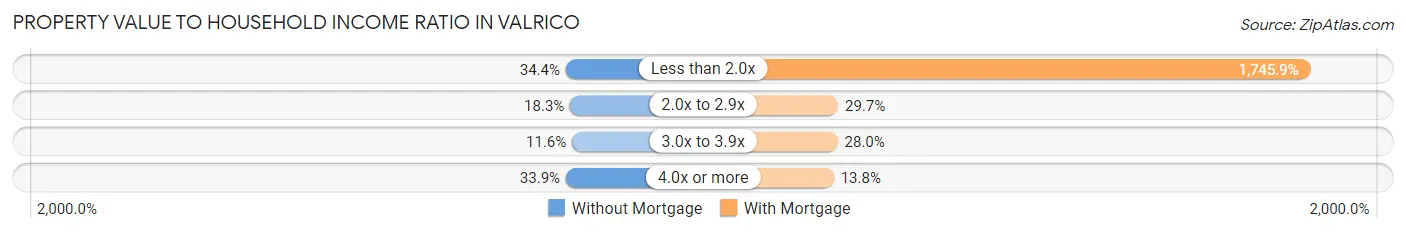
| Value-to-Income Ratio | Without Mortgage | With Mortgage |
| Less than 2.0x | 1,431 (34.4%) | 122,299 (1,745.9%) |
| 2.0x to 2.9x | 763 (18.3%) | 2,079 (29.7%) |
| 3.0x to 3.9x | 481 (11.6%) | 1,963 (28.0%) |
| 4.0x or more | 1,410 (33.9%) | 969 (13.8%) |
| Total | 4,165 (100.0%) | 7,005 (100.0%) |
Real Estate Taxes by Mortgage Status in Valrico

| Property Taxes | Without Mortgage | With Mortgage |
| Less than $800 | 542 (13.0%) | 50 (0.7%) |
| $800 to $1,499 | 613 (14.7%) | 159 (2.3%) |
| $800 to $1,499 | 2,200 (52.8%) | 688 (9.8%) |
| Total | 4,165 (100.0%) | 7,005 (100.0%) |
Health & Disability in Valrico
Health Insurance Coverage by Age in Valrico
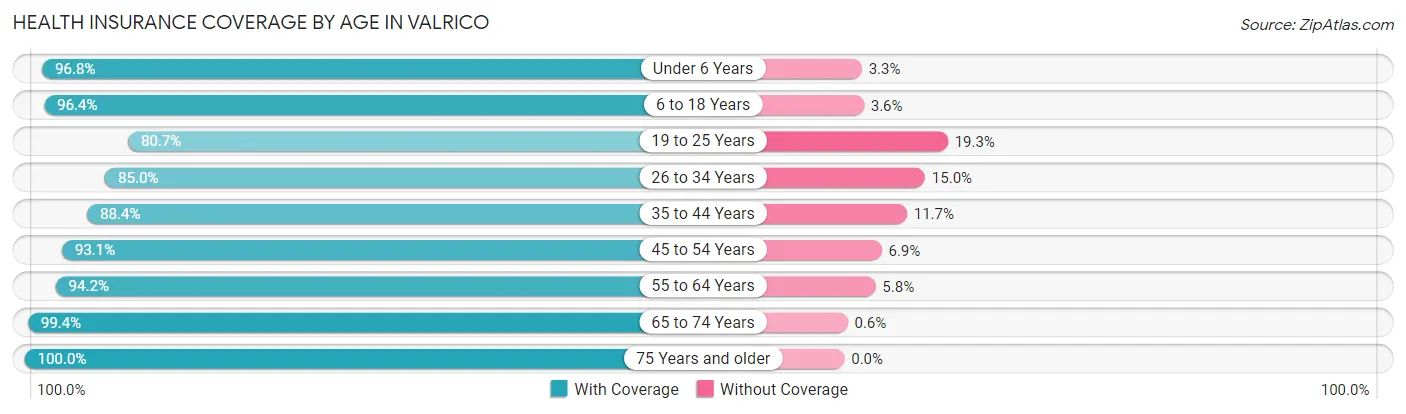
| Age Bracket | With Coverage | Without Coverage |
| Under 6 Years | 1,846 (96.8%) | 62 (3.3%) |
| 6 to 18 Years | 6,288 (96.4%) | 237 (3.6%) |
| 19 to 25 Years | 2,583 (80.7%) | 617 (19.3%) |
| 26 to 34 Years | 2,527 (85.0%) | 447 (15.0%) |
| 35 to 44 Years | 3,869 (88.3%) | 510 (11.7%) |
| 45 to 54 Years | 5,513 (93.1%) | 411 (6.9%) |
| 55 to 64 Years | 5,753 (94.2%) | 354 (5.8%) |
| 65 to 74 Years | 4,646 (99.4%) | 28 (0.6%) |
| 75 Years and older | 2,680 (100.0%) | 0 (0.0%) |
| Total | 35,705 (93.0%) | 2,666 (7.0%) |
Health Insurance Coverage by Citizenship Status in Valrico
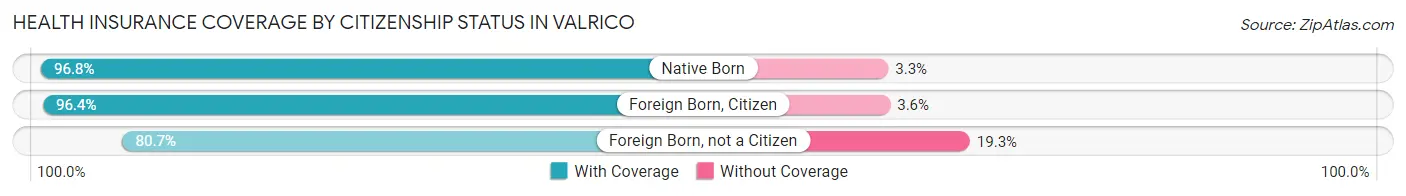
| Citizenship Status | With Coverage | Without Coverage |
| Native Born | 1,846 (96.8%) | 62 (3.3%) |
| Foreign Born, Citizen | 6,288 (96.4%) | 237 (3.6%) |
| Foreign Born, not a Citizen | 2,583 (80.7%) | 617 (19.3%) |
Health Insurance Coverage by Household Income in Valrico
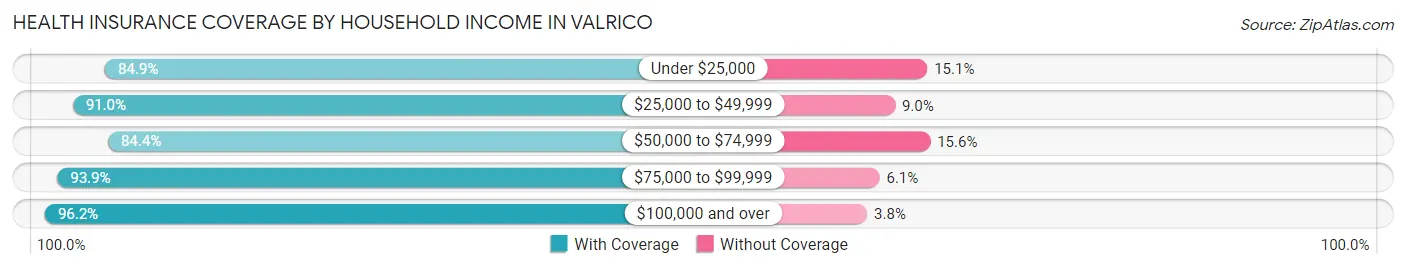
| Household Income | With Coverage | Without Coverage |
| Under $25,000 | 2,169 (84.9%) | 385 (15.1%) |
| $25,000 to $49,999 | 3,658 (91.0%) | 363 (9.0%) |
| $50,000 to $74,999 | 3,864 (84.4%) | 716 (15.6%) |
| $75,000 to $99,999 | 5,217 (93.9%) | 341 (6.1%) |
| $100,000 and over | 20,719 (96.2%) | 824 (3.8%) |
Public vs Private Health Insurance Coverage by Age in Valrico
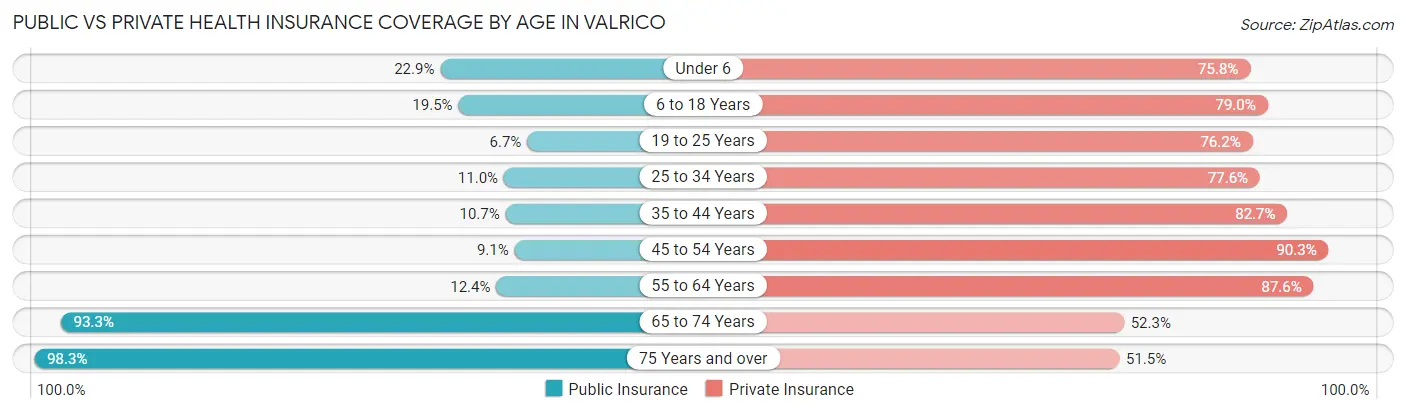
| Age Bracket | Public Insurance | Private Insurance |
| Under 6 | 436 (22.9%) | 1,446 (75.8%) |
| 6 to 18 Years | 1,271 (19.5%) | 5,156 (79.0%) |
| 19 to 25 Years | 215 (6.7%) | 2,439 (76.2%) |
| 25 to 34 Years | 328 (11.0%) | 2,308 (77.6%) |
| 35 to 44 Years | 470 (10.7%) | 3,621 (82.7%) |
| 45 to 54 Years | 537 (9.1%) | 5,351 (90.3%) |
| 55 to 64 Years | 760 (12.4%) | 5,347 (87.6%) |
| 65 to 74 Years | 4,362 (93.3%) | 2,446 (52.3%) |
| 75 Years and over | 2,633 (98.3%) | 1,379 (51.5%) |
| Total | 11,012 (28.7%) | 29,493 (76.9%) |
Disability Status by Sex by Age in Valrico
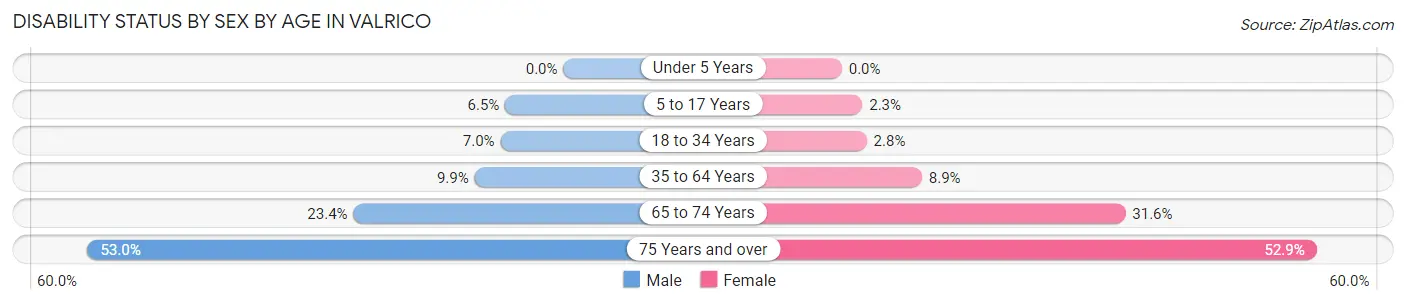
| Age Bracket | Male | Female |
| Under 5 Years | 0 (0.0%) | 0 (0.0%) |
| 5 to 17 Years | 187 (6.5%) | 76 (2.3%) |
| 18 to 34 Years | 245 (7.0%) | 94 (2.8%) |
| 35 to 64 Years | 779 (9.9%) | 761 (8.9%) |
| 65 to 74 Years | 465 (23.4%) | 848 (31.6%) |
| 75 Years and over | 488 (53.0%) | 930 (52.9%) |
Disability Class by Sex by Age in Valrico
Disability Class: Hearing Difficulty
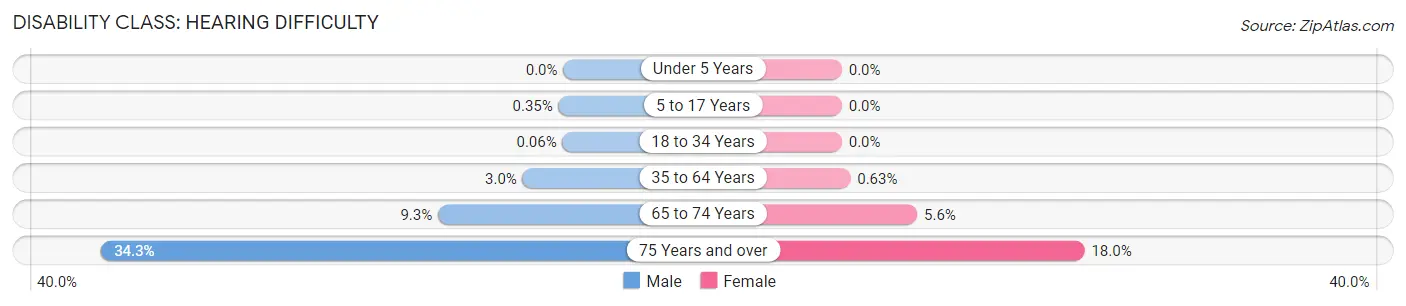
| Age Bracket | Male | Female |
| Under 5 Years | 0 (0.0%) | 0 (0.0%) |
| 5 to 17 Years | 10 (0.4%) | 0 (0.0%) |
| 18 to 34 Years | 2 (0.1%) | 0 (0.0%) |
| 35 to 64 Years | 238 (3.0%) | 54 (0.6%) |
| 65 to 74 Years | 185 (9.3%) | 150 (5.6%) |
| 75 Years and over | 316 (34.3%) | 317 (18.0%) |
Disability Class: Vision Difficulty
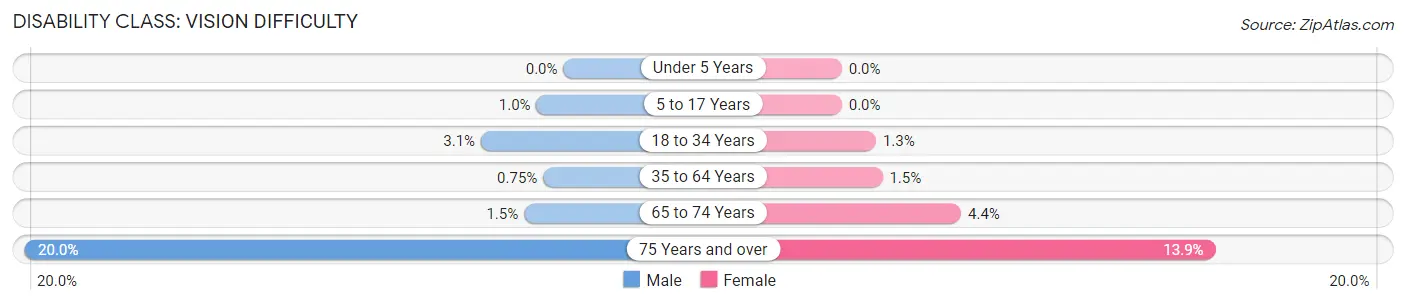
| Age Bracket | Male | Female |
| Under 5 Years | 0 (0.0%) | 0 (0.0%) |
| 5 to 17 Years | 29 (1.0%) | 0 (0.0%) |
| 18 to 34 Years | 107 (3.1%) | 43 (1.3%) |
| 35 to 64 Years | 59 (0.7%) | 129 (1.5%) |
| 65 to 74 Years | 29 (1.5%) | 119 (4.4%) |
| 75 Years and over | 184 (20.0%) | 244 (13.9%) |
Disability Class: Cognitive Difficulty
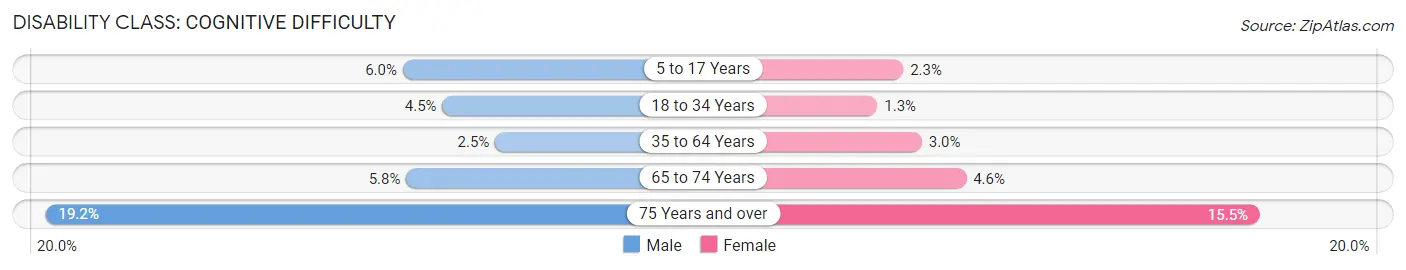
| Age Bracket | Male | Female |
| 5 to 17 Years | 172 (6.0%) | 76 (2.3%) |
| 18 to 34 Years | 157 (4.5%) | 45 (1.3%) |
| 35 to 64 Years | 199 (2.5%) | 253 (3.0%) |
| 65 to 74 Years | 116 (5.8%) | 124 (4.6%) |
| 75 Years and over | 177 (19.2%) | 273 (15.5%) |
Disability Class: Ambulatory Difficulty
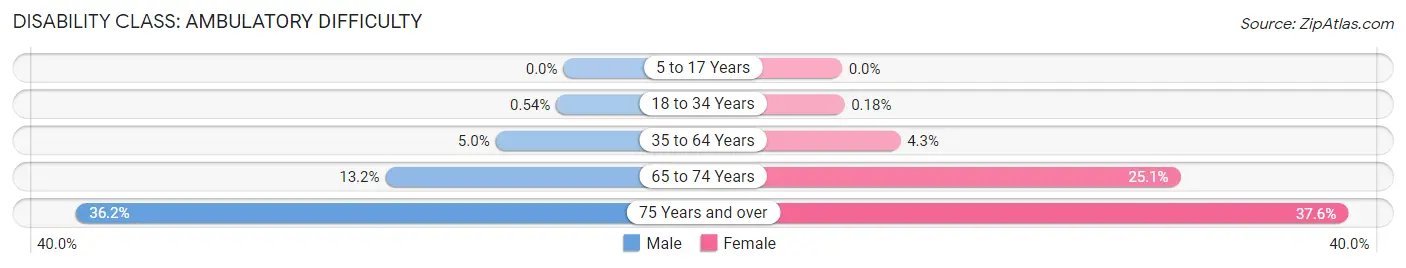
| Age Bracket | Male | Female |
| 5 to 17 Years | 0 (0.0%) | 0 (0.0%) |
| 18 to 34 Years | 19 (0.5%) | 6 (0.2%) |
| 35 to 64 Years | 397 (5.0%) | 370 (4.3%) |
| 65 to 74 Years | 263 (13.2%) | 675 (25.1%) |
| 75 Years and over | 333 (36.2%) | 661 (37.6%) |
Disability Class: Self-Care Difficulty
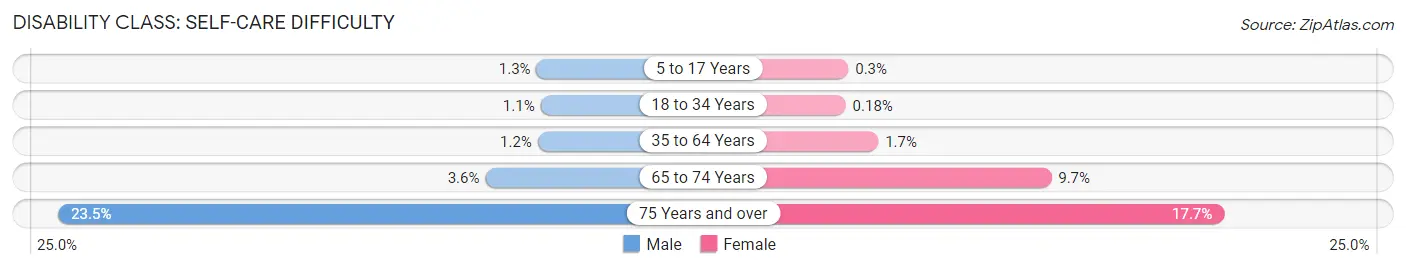
| Age Bracket | Male | Female |
| 5 to 17 Years | 36 (1.3%) | 10 (0.3%) |
| 18 to 34 Years | 37 (1.1%) | 6 (0.2%) |
| 35 to 64 Years | 94 (1.2%) | 144 (1.7%) |
| 65 to 74 Years | 72 (3.6%) | 261 (9.7%) |
| 75 Years and over | 216 (23.4%) | 312 (17.7%) |
Technology Access in Valrico
Computing Device Access in Valrico
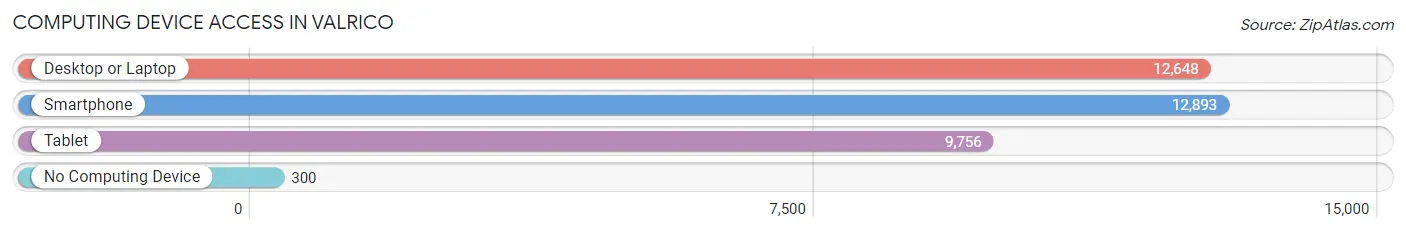
| Device Type | # Households | % Households |
| Desktop or Laptop | 12,648 | 89.8% |
| Smartphone | 12,893 | 91.5% |
| Tablet | 9,756 | 69.3% |
| No Computing Device | 300 | 2.1% |
| Total | 14,088 | 100.0% |
Internet Access in Valrico
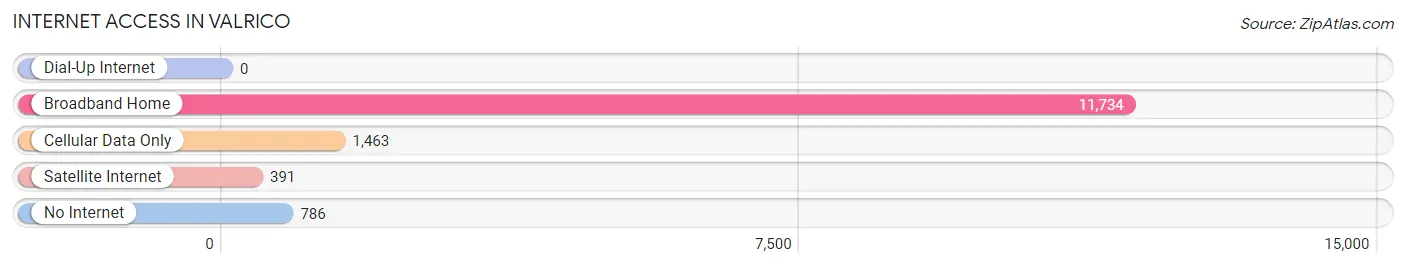
| Internet Type | # Households | % Households |
| Dial-Up Internet | 0 | 0.0% |
| Broadband Home | 11,734 | 83.3% |
| Cellular Data Only | 1,463 | 10.4% |
| Satellite Internet | 391 | 2.8% |
| No Internet | 786 | 5.6% |
| Total | 14,088 | 100.0% |
Valrico Summary
Valrico, FL is a census-designated place located in Hillsborough County, Florida. It is located approximately 15 miles east of Tampa and is part of the Tampa-St. Petersburg-Clearwater metropolitan area. Valrico is a small, suburban community with a population of approximately 35,000 people.
History
Valrico was originally inhabited by the Tocobaga Native American tribe. The area was first settled by European settlers in the late 19th century. The town was named after Valrico, a Spanish word meaning “valley of riches”. The town was officially incorporated in 1925 and was primarily a farming community. In the 1950s, the area began to experience rapid growth due to the construction of the Brandon Parkway, which connected Valrico to Tampa. This allowed for easy access to the city and helped to spur the growth of the town.
Geography
Valrico is located in Hillsborough County, Florida. It is situated approximately 15 miles east of Tampa and is part of the Tampa-St. Petersburg-Clearwater metropolitan area. Valrico is located in the central part of the county and is bordered by Brandon to the north, Lithia to the east, and Riverview to the south. The town is located on the Hillsborough River and is surrounded by several lakes, including Lake Weeks, Lake Rogers, and Lake St. Clair. Valrico is located at an elevation of approximately 50 feet above sea level.
Economy
Valrico’s economy is primarily driven by the service industry. The town is home to several large employers, including Publix Super Markets, Walmart, and Home Depot. Valrico is also home to several small businesses, including restaurants, retail stores, and professional services. The town is also home to several industrial parks, which provide employment opportunities for local residents.
Demographics
As of the 2010 census, Valrico had a population of 35,545 people. The racial makeup of the town was 79.3% White, 11.2% African American, 0.4% Native American, 2.2% Asian, 0.1% Pacific Islander, 4.2% from other races, and 2.7% from two or more races. Hispanic or Latino of any race were 11.3% of the population. The median household income in Valrico was $60,945, and the median family income was $68,945. The per capita income for the town was $25,945.
Valrico is a small, suburban community with a rich history and a diverse population. The town is home to several large employers and is a popular destination for those looking to escape the hustle and bustle of the city. Valrico is a great place to live, work, and play, and is sure to continue to grow and thrive in the years to come.
Common Questions
What is Per Capita Income in Valrico?
Per Capita income in Valrico is $42,389.
What is the Median Family Income in Valrico?
Median Family Income in Valrico is $109,330.
What is the Median Household income in Valrico?
Median Household Income in Valrico is $91,704.
What is Income or Wage Gap in Valrico?
Income or Wage Gap in Valrico is 29.5%.
Women in Valrico earn 70.5 cents for every dollar earned by a man.
What is Family Income Deficit in Valrico?
Family Income Deficit in Valrico is $8,470.
Families that are below poverty line in Valrico earn $8,470 less on average than the poverty threshold level.
What is Inequality or Gini Index in Valrico?
Inequality or Gini Index in Valrico is 0.41.
What is the Total Population of Valrico?
Total Population of Valrico is 38,594.
What is the Total Male Population of Valrico?
Total Male Population of Valrico is 17,950.
What is the Total Female Population of Valrico?
Total Female Population of Valrico is 20,644.
What is the Ratio of Males per 100 Females in Valrico?
There are 86.95 Males per 100 Females in Valrico.
What is the Ratio of Females per 100 Males in Valrico?
There are 115.01 Females per 100 Males in Valrico.
What is the Median Population Age in Valrico?
Median Population Age in Valrico is 45.3 Years.
What is the Average Family Size in Valrico
Average Family Size in Valrico is 3.1 People.
What is the Average Household Size in Valrico
Average Household Size in Valrico is 2.7 People.
How Large is the Labor Force in Valrico?
There are 21,151 People in the Labor Forcein in Valrico.
What is the Percentage of People in the Labor Force in Valrico?
65.5% of People are in the Labor Force in Valrico.
What is the Unemployment Rate in Valrico?
Unemployment Rate in Valrico is 4.1%.