Valparaiso, FL Map & Demographics
Valparaiso Map
Valparaiso Overview
$44,680
PER CAPITA INCOME
$82,946
AVG FAMILY INCOME
$77,837
AVG HOUSEHOLD INCOME
8.6%
WAGE / INCOME GAP [ % ]
91.4¢/ $1
WAGE / INCOME GAP [ $ ]
0.43
INEQUALITY / GINI INDEX
4,889
TOTAL POPULATION
2,762
MALE POPULATION
2,127
FEMALE POPULATION
129.85
MALES / 100 FEMALES
77.01
FEMALES / 100 MALES
28.1
MEDIAN AGE
2.7
AVG FAMILY SIZE
2.4
AVG HOUSEHOLD SIZE
2,969
LABOR FORCE [ PEOPLE ]
74.9%
PERCENT IN LABOR FORCE
3.0%
UNEMPLOYMENT RATE
Valparaiso Zip Codes
Valparaiso Area Codes
Income in Valparaiso
Income Overview in Valparaiso
Per Capita Income in Valparaiso is $44,680, while median incomes of families and households are $82,946 and $77,837 respectively.
| Characteristic | Number | Measure |
| Per Capita Income | 4,889 | $44,680 |
| Median Family Income | 1,155 | $82,946 |
| Mean Family Income | 1,155 | $121,577 |
| Median Household Income | 1,721 | $77,837 |
| Mean Household Income | 1,721 | $114,042 |
| Income Deficit | 1,155 | $0 |
| Wage / Income Gap (%) | 4,889 | 8.62% |
| Wage / Income Gap ($) | 4,889 | 91.38¢ per $1 |
| Gini / Inequality Index | 4,889 | 0.43 |
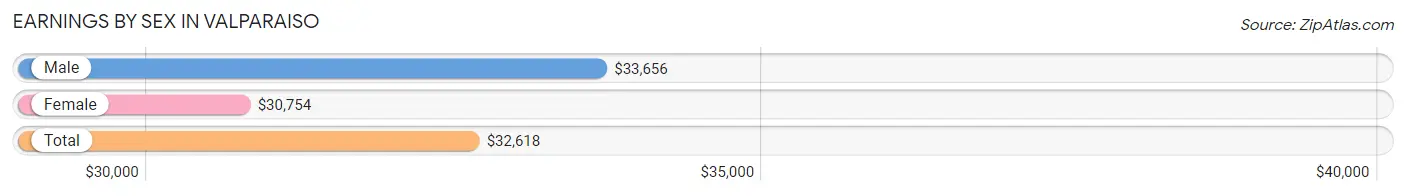
Earnings by Sex in Valparaiso
Average Earnings in Valparaiso are $32,618, $33,656 for men and $30,754 for women, a difference of 8.6%.
| Sex | Number | Average Earnings |
| Male | 2,008 (66.6%) | $33,656 |
| Female | 1,006 (33.4%) | $30,754 |
| Total | 3,014 (100.0%) | $32,618 |
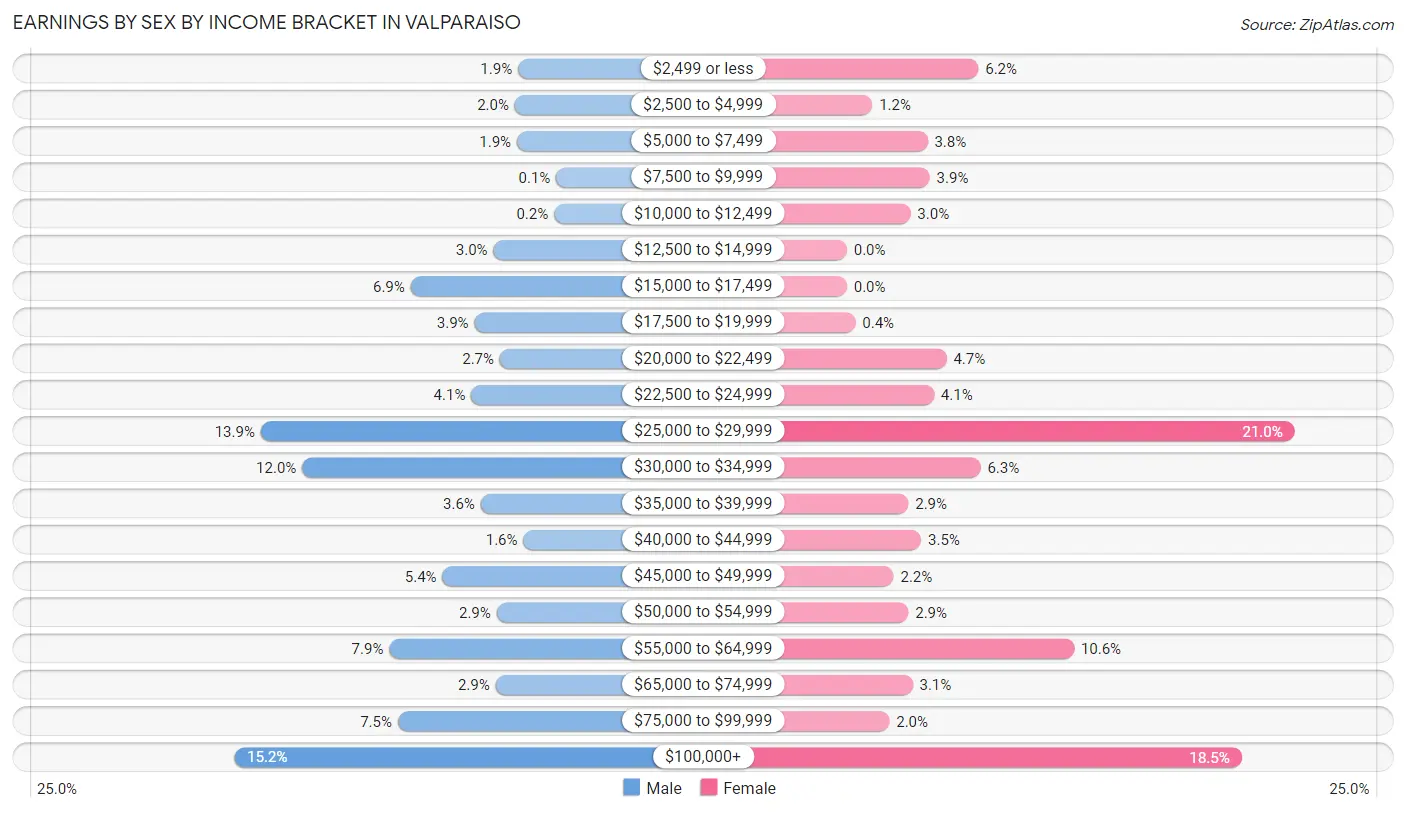
Earnings by Sex by Income Bracket in Valparaiso
The most common earnings brackets in Valparaiso are $100,000+ for men (305 | 15.2%) and $25,000 to $29,999 for women (211 | 21.0%).
| Income | Male | Female |
| $2,499 or less | 38 (1.9%) | 62 (6.2%) |
| $2,500 to $4,999 | 41 (2.0%) | 12 (1.2%) |
| $5,000 to $7,499 | 39 (1.9%) | 38 (3.8%) |
| $7,500 to $9,999 | 2 (0.1%) | 39 (3.9%) |
| $10,000 to $12,499 | 4 (0.2%) | 30 (3.0%) |
| $12,500 to $14,999 | 61 (3.0%) | 0 (0.0%) |
| $15,000 to $17,499 | 139 (6.9%) | 0 (0.0%) |
| $17,500 to $19,999 | 79 (3.9%) | 4 (0.4%) |
| $20,000 to $22,499 | 55 (2.7%) | 47 (4.7%) |
| $22,500 to $24,999 | 82 (4.1%) | 41 (4.1%) |
| $25,000 to $29,999 | 280 (13.9%) | 211 (21.0%) |
| $30,000 to $34,999 | 241 (12.0%) | 63 (6.3%) |
| $35,000 to $39,999 | 73 (3.6%) | 29 (2.9%) |
| $40,000 to $44,999 | 33 (1.6%) | 35 (3.5%) |
| $45,000 to $49,999 | 109 (5.4%) | 22 (2.2%) |
| $50,000 to $54,999 | 58 (2.9%) | 29 (2.9%) |
| $55,000 to $64,999 | 159 (7.9%) | 107 (10.6%) |
| $65,000 to $74,999 | 59 (2.9%) | 31 (3.1%) |
| $75,000 to $99,999 | 151 (7.5%) | 20 (2.0%) |
| $100,000+ | 305 (15.2%) | 186 (18.5%) |
| Total | 2,008 (100.0%) | 1,006 (100.0%) |
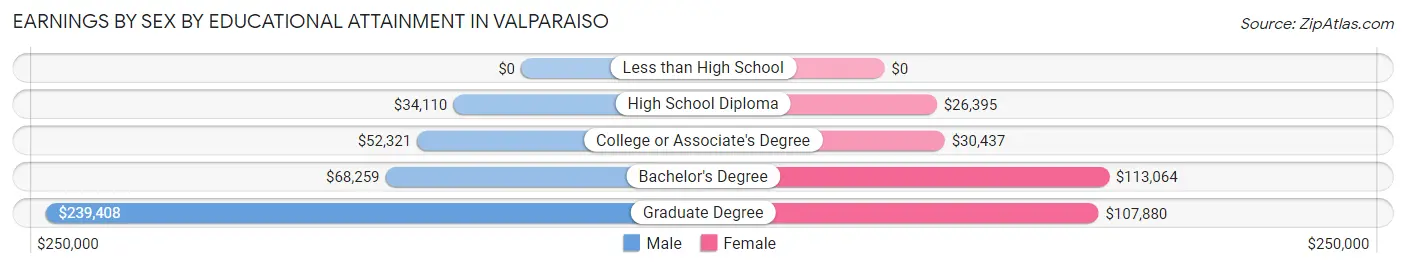
Earnings by Sex by Educational Attainment in Valparaiso
Average earnings in Valparaiso are $57,295 for men and $41,518 for women, a difference of 27.5%. Men with an educational attainment of graduate degree enjoy the highest average annual earnings of $239,408, while those with high school diploma education earn the least with $34,110. Women with an educational attainment of bachelor's degree earn the most with the average annual earnings of $113,064, while those with high school diploma education have the smallest earnings of $26,395.
| Educational Attainment | Male Income | Female Income |
| Less than High School | - | - |
| High School Diploma | $34,110 | $26,395 |
| College or Associate's Degree | $52,321 | $30,437 |
| Bachelor's Degree | $68,259 | $113,064 |
| Graduate Degree | $239,408 | $107,880 |
| Total | $57,295 | $41,518 |
Family Income in Valparaiso
Family Income Brackets in Valparaiso
According to the Valparaiso family income data, there are 255 families falling into the $50,000 to $74,999 income range, which is the most common income bracket and makes up 22.1% of all families.
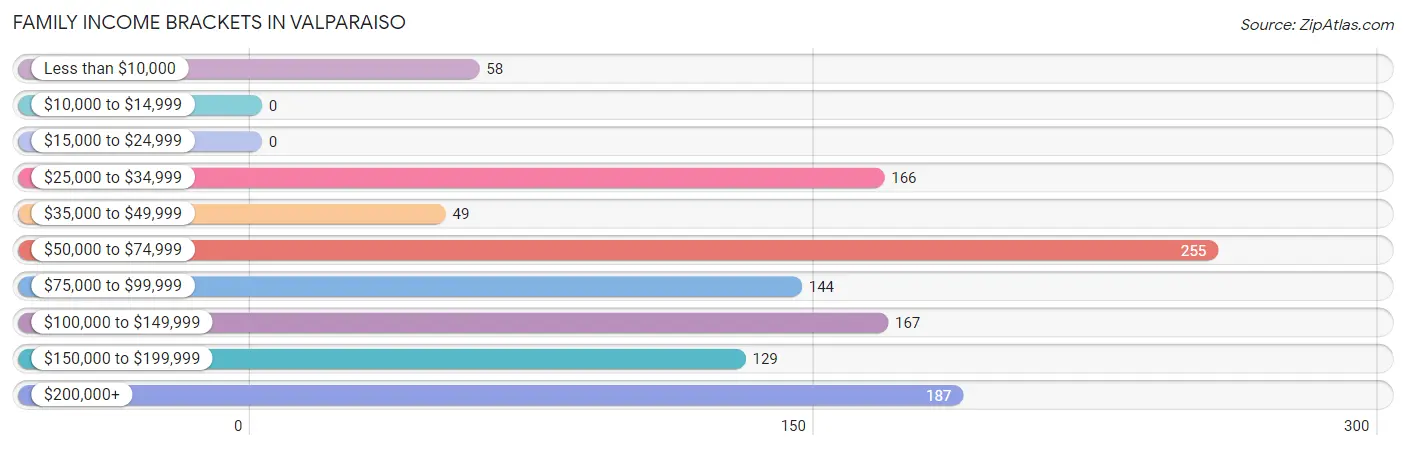
| Income Bracket | # Families | % Families |
| Less than $10,000 | 58 | 5.0% |
| $10,000 to $14,999 | 0 | 0.0% |
| $15,000 to $24,999 | 0 | 0.0% |
| $25,000 to $34,999 | 166 | 14.4% |
| $35,000 to $49,999 | 49 | 4.2% |
| $50,000 to $74,999 | 255 | 22.1% |
| $75,000 to $99,999 | 144 | 12.5% |
| $100,000 to $149,999 | 167 | 14.5% |
| $150,000 to $199,999 | 129 | 11.2% |
| $200,000+ | 187 | 16.2% |
Family Income by Famaliy Size in Valparaiso
4-person families (166 | 14.4%) account for the highest median family income in Valparaiso with $92,955 per family, while 2-person families (731 | 63.3%) have the highest median income of $41,294 per family member.
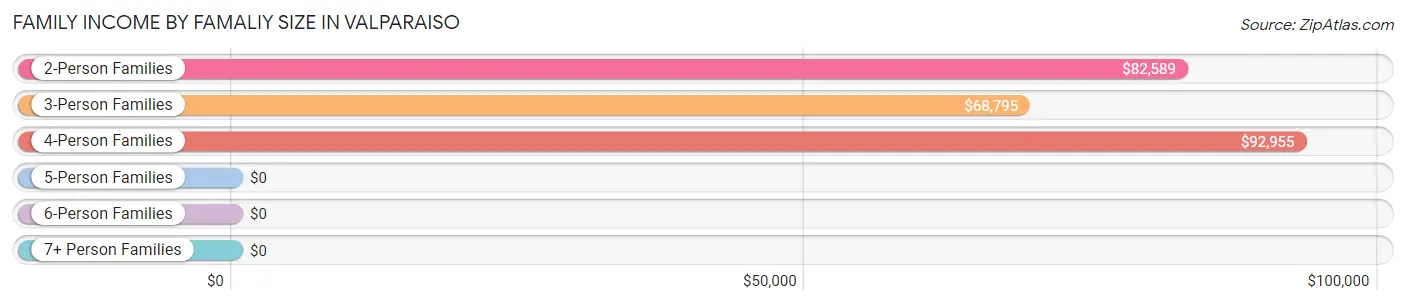
| Income Bracket | # Families | Median Income |
| 2-Person Families | 731 (63.3%) | $82,589 |
| 3-Person Families | 189 (16.4%) | $68,795 |
| 4-Person Families | 166 (14.4%) | $92,955 |
| 5-Person Families | 69 (6.0%) | $0 |
| 6-Person Families | 0 (0.0%) | $0 |
| 7+ Person Families | 0 (0.0%) | $0 |
| Total | 1,155 (100.0%) | $82,946 |
Family Income by Number of Earners in Valparaiso
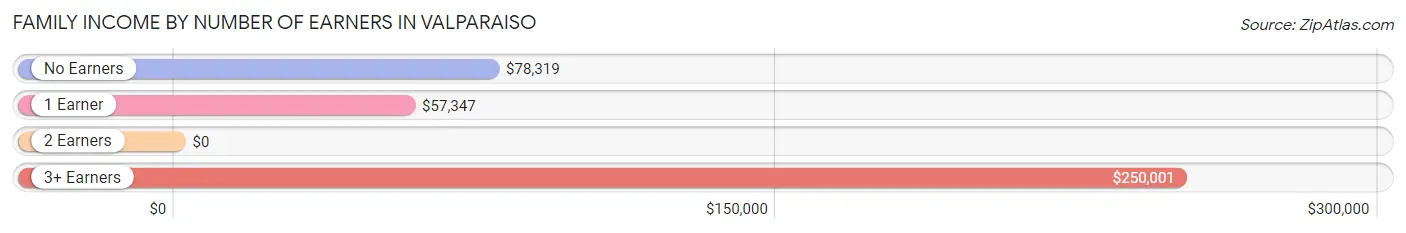
| Number of Earners | # Families | Median Income |
| No Earners | 293 (25.4%) | $78,319 |
| 1 Earner | 354 (30.6%) | $57,347 |
| 2 Earners | 435 (37.7%) | $0 |
| 3+ Earners | 73 (6.3%) | $250,001 |
| Total | 1,155 (100.0%) | $82,946 |
Household Income in Valparaiso
Household Income Brackets in Valparaiso
With 489 households falling in the category, the $50,000 to $74,999 income range is the most frequent in Valparaiso, accounting for 28.4% of all households. In contrast, only 14 households (0.8%) fall into the $10,000 to $14,999 income bracket, making it the least populous group.
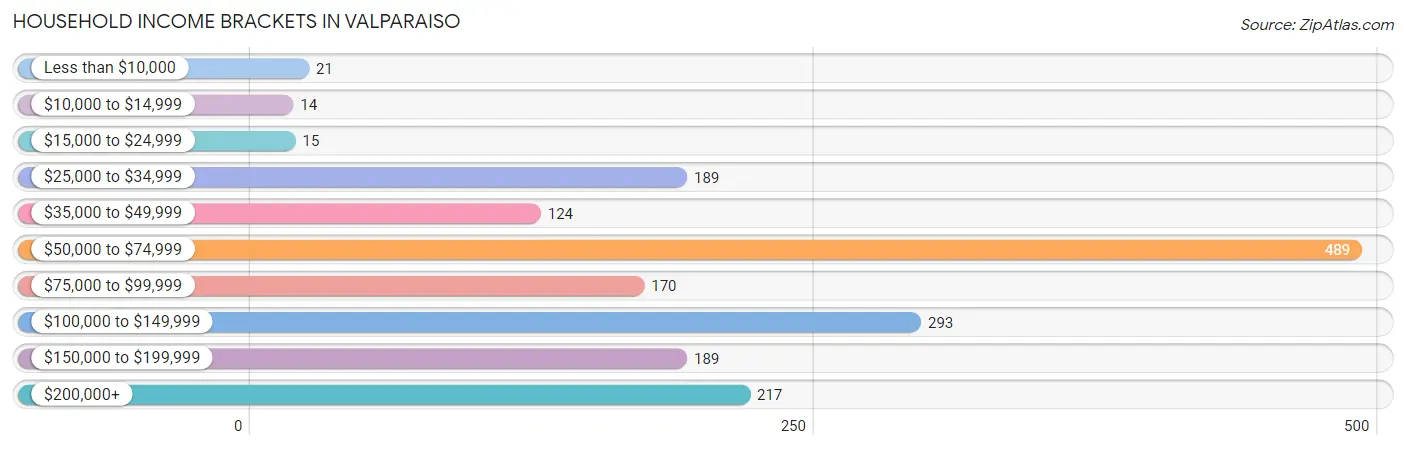
| Income Bracket | # Households | % Households |
| Less than $10,000 | 21 | 1.2% |
| $10,000 to $14,999 | 14 | 0.8% |
| $15,000 to $24,999 | 15 | 0.9% |
| $25,000 to $34,999 | 189 | 11.0% |
| $35,000 to $49,999 | 124 | 7.2% |
| $50,000 to $74,999 | 489 | 28.4% |
| $75,000 to $99,999 | 170 | 9.9% |
| $100,000 to $149,999 | 293 | 17.0% |
| $150,000 to $199,999 | 189 | 11.0% |
| $200,000+ | 217 | 12.6% |
Household Income by Householder Age in Valparaiso
The median household income in Valparaiso is $77,837, with the highest median household income of $117,656 found in the 45 to 64 years age bracket for the primary householder. A total of 448 households (26.0%) fall into this category. Meanwhile, the 15 to 24 years age bracket for the primary householder has the lowest median household income of $50,989, with 197 households (11.5%) in this group.
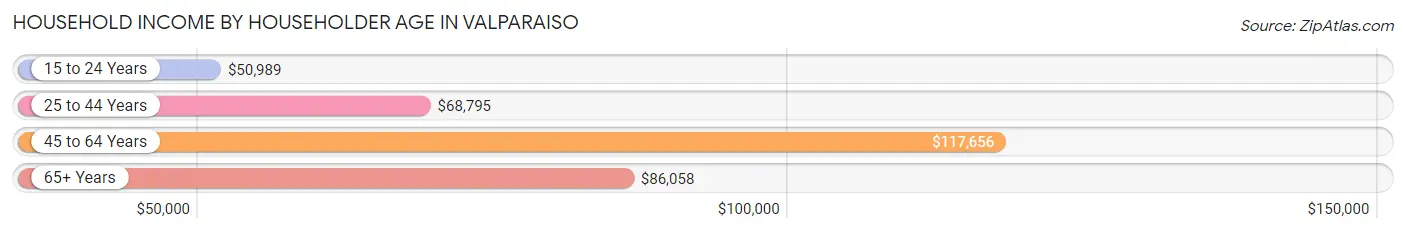
| Income Bracket | # Households | Median Income |
| 15 to 24 Years | 197 (11.5%) | $50,989 |
| 25 to 44 Years | 699 (40.6%) | $68,795 |
| 45 to 64 Years | 448 (26.0%) | $117,656 |
| 65+ Years | 377 (21.9%) | $86,058 |
| Total | 1,721 (100.0%) | $77,837 |
Poverty in Valparaiso
Income Below Poverty by Sex and Age in Valparaiso
With 6.5% poverty level for males and 10.1% for females among the residents of Valparaiso, 6 to 11 year old males and under 5 year old females are the most vulnerable to poverty, with 59 males (37.1%) and 47 females (37.3%) in their respective age groups living below the poverty level.
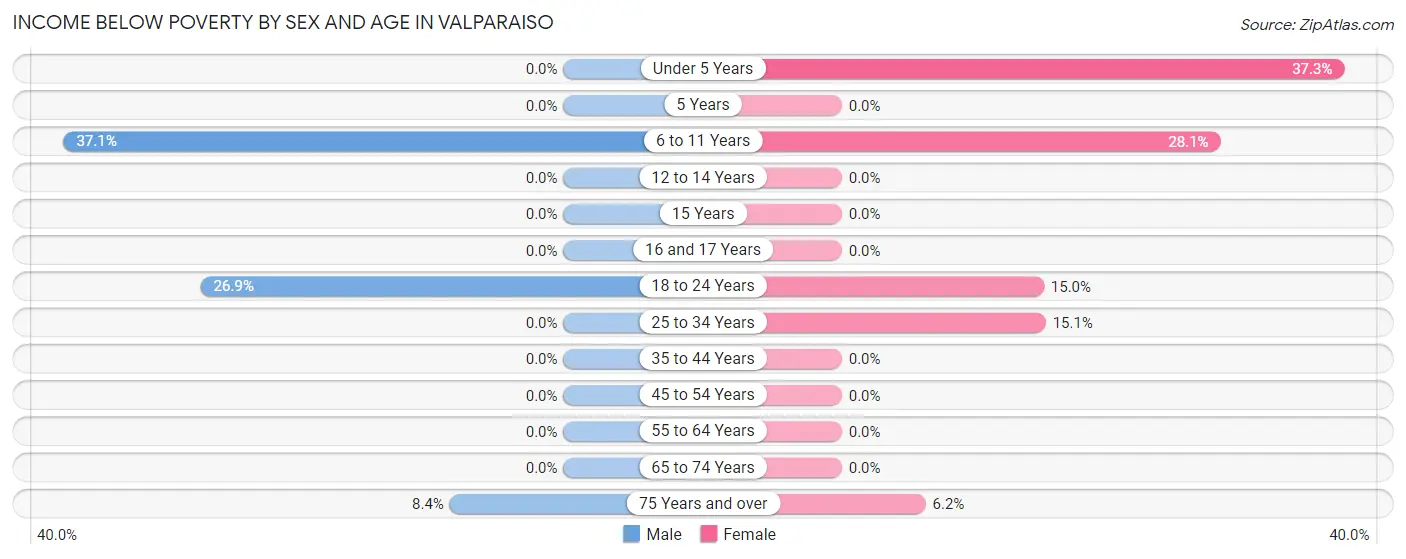
| Age Bracket | Male | Female |
| Under 5 Years | 0 (0.0%) | 47 (37.3%) |
| 5 Years | 0 (0.0%) | 0 (0.0%) |
| 6 to 11 Years | 59 (37.1%) | 52 (28.1%) |
| 12 to 14 Years | 0 (0.0%) | 0 (0.0%) |
| 15 Years | 0 (0.0%) | 0 (0.0%) |
| 16 and 17 Years | 0 (0.0%) | 0 (0.0%) |
| 18 to 24 Years | 59 (26.9%) | 30 (15.0%) |
| 25 to 34 Years | 0 (0.0%) | 61 (15.1%) |
| 35 to 44 Years | 0 (0.0%) | 0 (0.0%) |
| 45 to 54 Years | 0 (0.0%) | 0 (0.0%) |
| 55 to 64 Years | 0 (0.0%) | 0 (0.0%) |
| 65 to 74 Years | 0 (0.0%) | 0 (0.0%) |
| 75 Years and over | 13 (8.4%) | 13 (6.2%) |
| Total | 131 (6.5%) | 203 (10.1%) |
Income Above Poverty by Sex and Age in Valparaiso
According to the poverty statistics in Valparaiso, males aged under 5 years and females aged 5 years are the age groups that are most secure financially, with 100.0% of males and 100.0% of females in these age groups living above the poverty line.
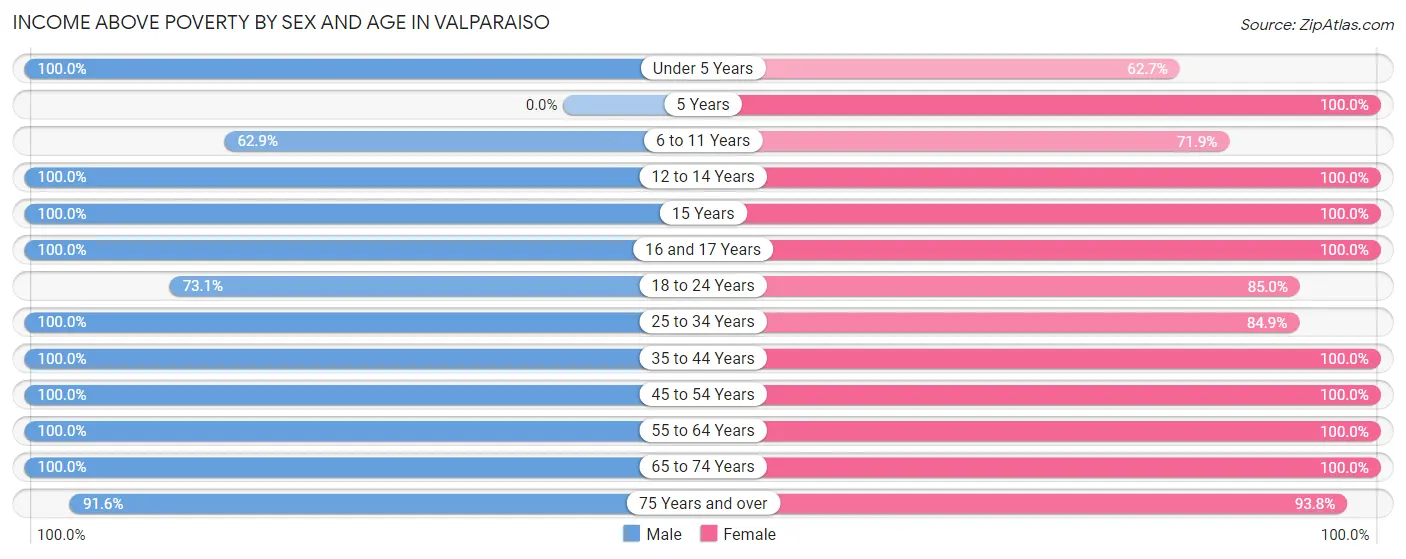
| Age Bracket | Male | Female |
| Under 5 Years | 51 (100.0%) | 79 (62.7%) |
| 5 Years | 0 (0.0%) | 71 (100.0%) |
| 6 to 11 Years | 100 (62.9%) | 133 (71.9%) |
| 12 to 14 Years | 133 (100.0%) | 63 (100.0%) |
| 15 Years | 14 (100.0%) | 13 (100.0%) |
| 16 and 17 Years | 19 (100.0%) | 43 (100.0%) |
| 18 to 24 Years | 160 (73.1%) | 170 (85.0%) |
| 25 to 34 Years | 539 (100.0%) | 342 (84.9%) |
| 35 to 44 Years | 160 (100.0%) | 194 (100.0%) |
| 45 to 54 Years | 155 (100.0%) | 125 (100.0%) |
| 55 to 64 Years | 210 (100.0%) | 295 (100.0%) |
| 65 to 74 Years | 195 (100.0%) | 84 (100.0%) |
| 75 Years and over | 141 (91.6%) | 196 (93.8%) |
| Total | 1,877 (93.5%) | 1,808 (89.9%) |
Income Below Poverty Among Married-Couple Families in Valparaiso
The poverty statistics for married-couple families in Valparaiso show that 1.6% or 13 of the total 803 families live below the poverty line. Families with no children have the highest poverty rate of 2.3%, comprising of 13 families. On the other hand, families with 1 or 2 children have the lowest poverty rate of 0.0%, which includes 0 families.
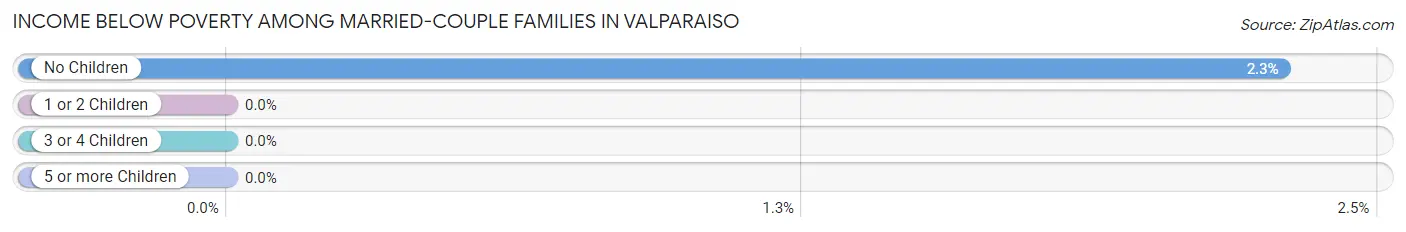
| Children | Above Poverty | Below Poverty |
| No Children | 554 (97.7%) | 13 (2.3%) |
| 1 or 2 Children | 181 (100.0%) | 0 (0.0%) |
| 3 or 4 Children | 55 (100.0%) | 0 (0.0%) |
| 5 or more Children | 0 (0.0%) | 0 (0.0%) |
| Total | 790 (98.4%) | 13 (1.6%) |
Income Below Poverty Among Single-Parent Households in Valparaiso
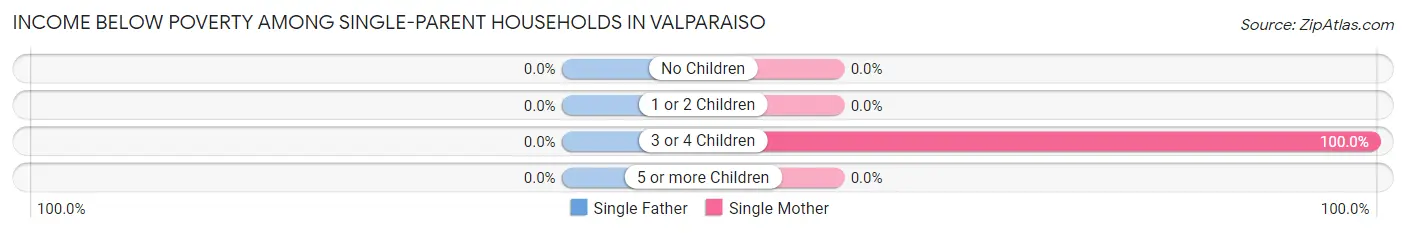
| Children | Single Father | Single Mother |
| No Children | 0 (0.0%) | 0 (0.0%) |
| 1 or 2 Children | 0 (0.0%) | 0 (0.0%) |
| 3 or 4 Children | 0 (0.0%) | 45 (100.0%) |
| 5 or more Children | 0 (0.0%) | 0 (0.0%) |
| Total | 0 (0.0%) | 45 (14.0%) |
Income Below Poverty Among Married-Couple vs Single-Parent Households in Valparaiso
The poverty data for Valparaiso shows that 13 of the married-couple family households (1.6%) and 45 of the single-parent households (12.8%) are living below the poverty level. Within the married-couple family households, those with no children have the highest poverty rate, with 13 households (2.3%) falling below the poverty line. Among the single-parent households, those with 3 or 4 children have the highest poverty rate, with 45 household (100.0%) living below poverty.
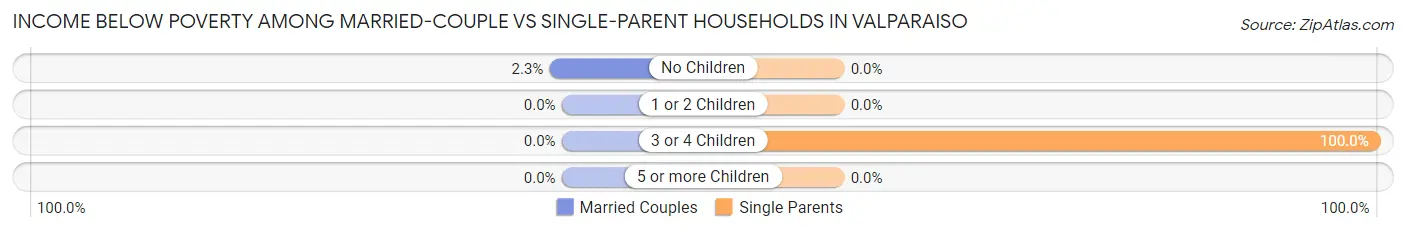
| Children | Married-Couple Families | Single-Parent Households |
| No Children | 13 (2.3%) | 0 (0.0%) |
| 1 or 2 Children | 0 (0.0%) | 0 (0.0%) |
| 3 or 4 Children | 0 (0.0%) | 45 (100.0%) |
| 5 or more Children | 0 (0.0%) | 0 (0.0%) |
| Total | 13 (1.6%) | 45 (12.8%) |
Race in Valparaiso
The most populous races in Valparaiso are White / Caucasian (3,451 | 70.6%), Black / African American (734 | 15.0%), and Two or more Races (432 | 8.8%).
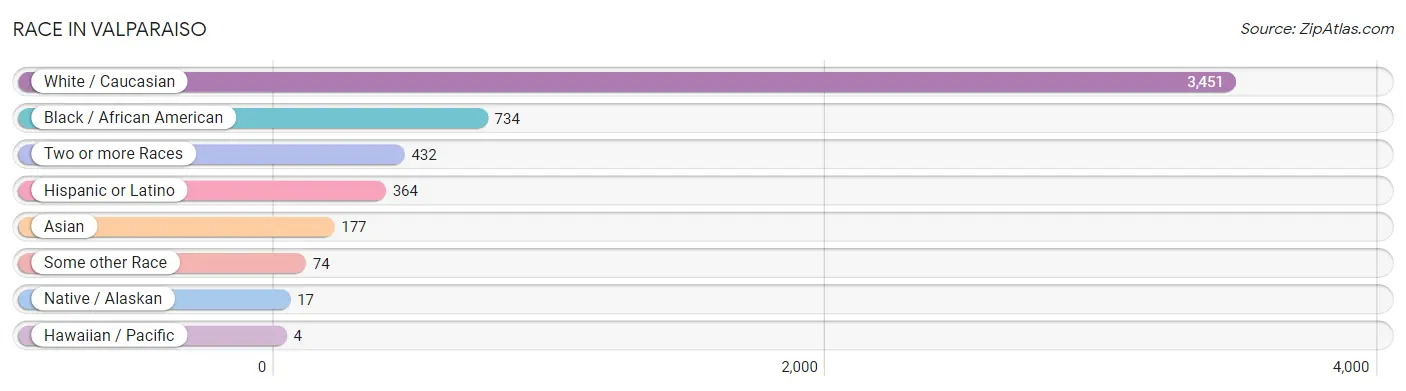
| Race | # Population | % Population |
| Asian | 177 | 3.6% |
| Black / African American | 734 | 15.0% |
| Hawaiian / Pacific | 4 | 0.1% |
| Hispanic or Latino | 364 | 7.4% |
| Native / Alaskan | 17 | 0.4% |
| White / Caucasian | 3,451 | 70.6% |
| Two or more Races | 432 | 8.8% |
| Some other Race | 74 | 1.5% |
| Total | 4,889 | 100.0% |
Ancestry in Valparaiso
The most populous ancestries reported in Valparaiso are German (687 | 14.1%), Irish (611 | 12.5%), English (572 | 11.7%), American (299 | 6.1%), and French (229 | 4.7%), together accounting for 49.0% of all Valparaiso residents.
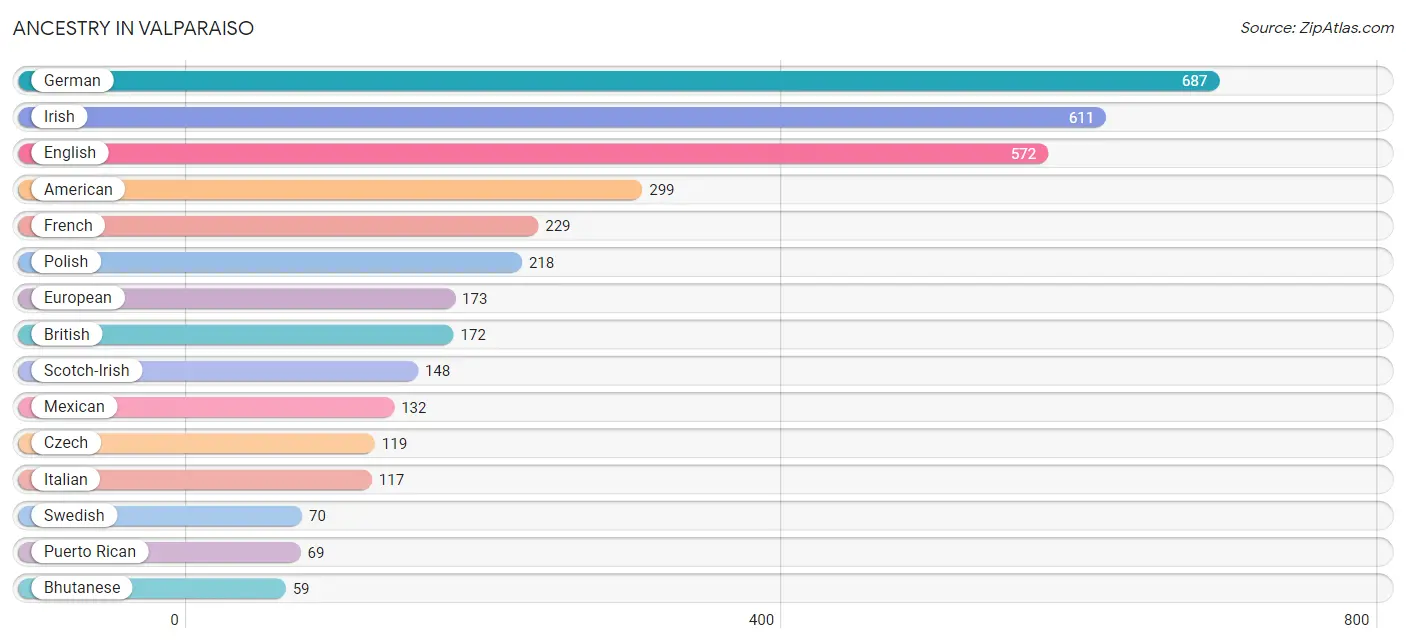
| Ancestry | # Population | % Population |
| Albanian | 3 | 0.1% |
| American | 299 | 6.1% |
| Austrian | 18 | 0.4% |
| Belizean | 4 | 0.1% |
| Bhutanese | 59 | 1.2% |
| British | 172 | 3.5% |
| Burmese | 18 | 0.4% |
| Cajun | 27 | 0.5% |
| Canadian | 14 | 0.3% |
| Colombian | 6 | 0.1% |
| Creek | 12 | 0.3% |
| Cuban | 9 | 0.2% |
| Czech | 119 | 2.4% |
| Dominican | 2 | 0.0% |
| Dutch | 42 | 0.9% |
| Eastern European | 30 | 0.6% |
| English | 572 | 11.7% |
| European | 173 | 3.5% |
| Finnish | 21 | 0.4% |
| French | 229 | 4.7% |
| German | 687 | 14.1% |
| Greek | 6 | 0.1% |
| Guamanian / Chamorro | 7 | 0.1% |
| Hungarian | 18 | 0.4% |
| Indian (Asian) | 24 | 0.5% |
| Irish | 611 | 12.5% |
| Italian | 117 | 2.4% |
| Jamaican | 34 | 0.7% |
| Korean | 52 | 1.1% |
| Mexican | 132 | 2.7% |
| Native Hawaiian | 16 | 0.3% |
| Navajo | 18 | 0.4% |
| Norwegian | 24 | 0.5% |
| Pakistani | 42 | 0.9% |
| Peruvian | 4 | 0.1% |
| Polish | 218 | 4.5% |
| Portuguese | 47 | 1.0% |
| Puerto Rican | 69 | 1.4% |
| Scandinavian | 46 | 0.9% |
| Scotch-Irish | 148 | 3.0% |
| Scottish | 49 | 1.0% |
| South American | 10 | 0.2% |
| Spanish | 30 | 0.6% |
| Sri Lankan | 16 | 0.3% |
| Swedish | 70 | 1.4% |
| Thai | 39 | 0.8% |
| Welsh | 27 | 0.5% |
| West Indian | 31 | 0.6% | View All 48 Rows |
Immigrants in Valparaiso
The most numerous immigrant groups reported in Valparaiso came from Asia (102 | 2.1%), Latin America (64 | 1.3%), India (53 | 1.1%), South Central Asia (53 | 1.1%), and Caribbean (46 | 0.9%), together accounting for 6.5% of all Valparaiso residents.
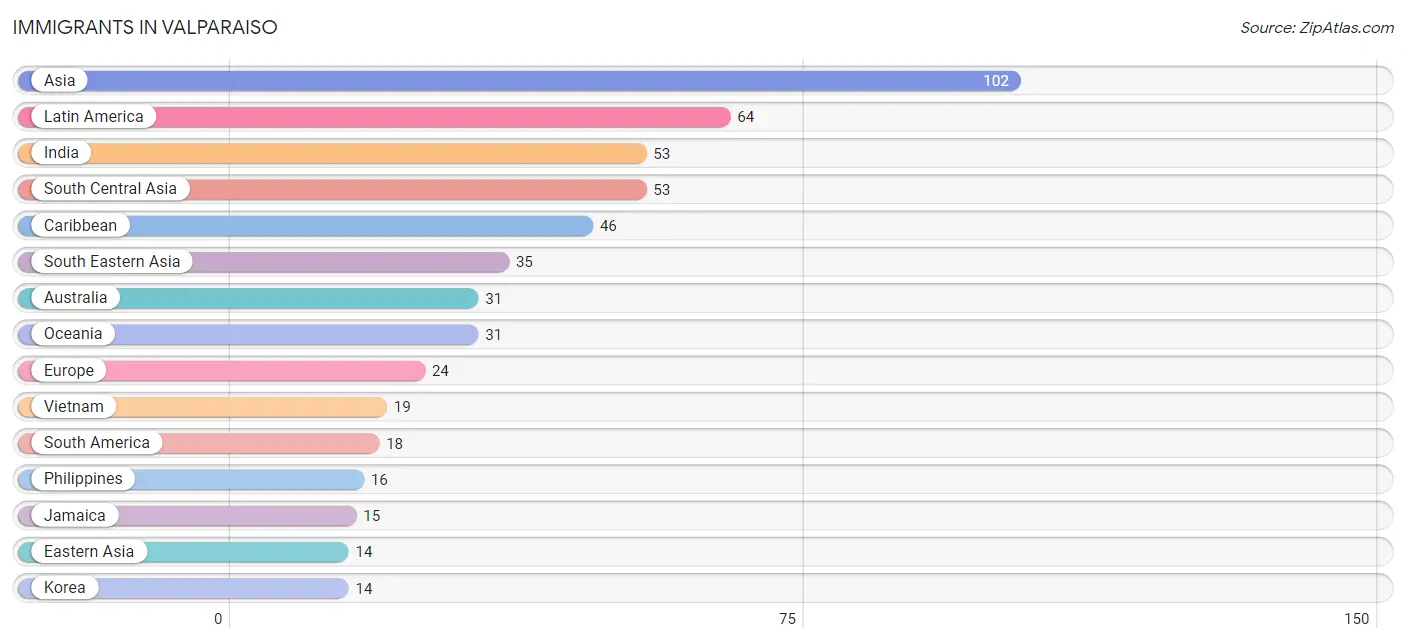
| Immigration Origin | # Population | % Population |
| Asia | 102 | 2.1% |
| Australia | 31 | 0.6% |
| Caribbean | 46 | 0.9% |
| Colombia | 6 | 0.1% |
| Eastern Asia | 14 | 0.3% |
| Ecuador | 12 | 0.3% |
| England | 13 | 0.3% |
| Europe | 24 | 0.5% |
| Germany | 11 | 0.2% |
| India | 53 | 1.1% |
| Jamaica | 15 | 0.3% |
| Korea | 14 | 0.3% |
| Latin America | 64 | 1.3% |
| Northern Europe | 13 | 0.3% |
| Oceania | 31 | 0.6% |
| Philippines | 16 | 0.3% |
| South America | 18 | 0.4% |
| South Central Asia | 53 | 1.1% |
| South Eastern Asia | 35 | 0.7% |
| Vietnam | 19 | 0.4% |
| Western Europe | 11 | 0.2% | View All 21 Rows |
Sex and Age in Valparaiso
Sex and Age in Valparaiso
The most populous age groups in Valparaiso are 20 to 24 Years (529 | 19.2%) for men and 25 to 29 Years (342 | 16.1%) for women.
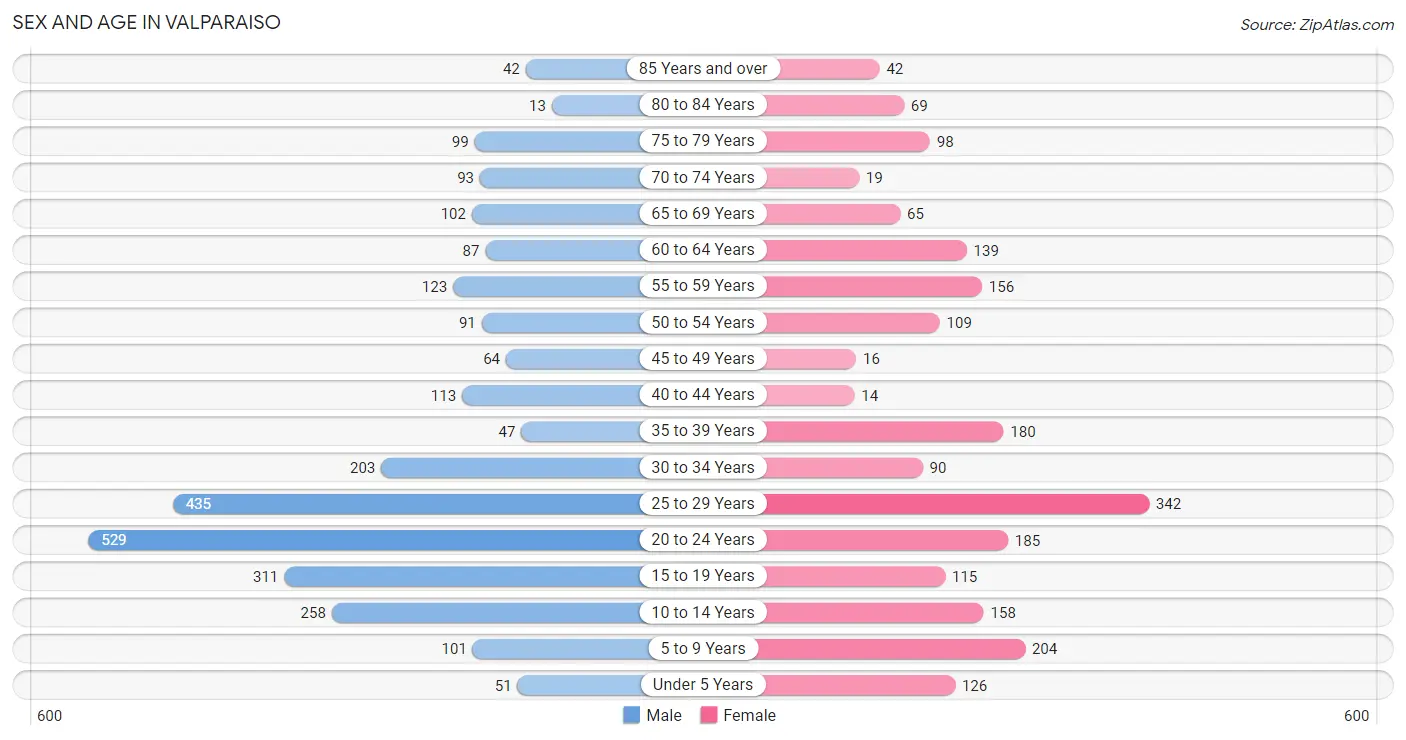
| Age Bracket | Male | Female |
| Under 5 Years | 51 (1.8%) | 126 (5.9%) |
| 5 to 9 Years | 101 (3.7%) | 204 (9.6%) |
| 10 to 14 Years | 258 (9.3%) | 158 (7.4%) |
| 15 to 19 Years | 311 (11.3%) | 115 (5.4%) |
| 20 to 24 Years | 529 (19.2%) | 185 (8.7%) |
| 25 to 29 Years | 435 (15.8%) | 342 (16.1%) |
| 30 to 34 Years | 203 (7.3%) | 90 (4.2%) |
| 35 to 39 Years | 47 (1.7%) | 180 (8.5%) |
| 40 to 44 Years | 113 (4.1%) | 14 (0.7%) |
| 45 to 49 Years | 64 (2.3%) | 16 (0.7%) |
| 50 to 54 Years | 91 (3.3%) | 109 (5.1%) |
| 55 to 59 Years | 123 (4.4%) | 156 (7.3%) |
| 60 to 64 Years | 87 (3.2%) | 139 (6.5%) |
| 65 to 69 Years | 102 (3.7%) | 65 (3.1%) |
| 70 to 74 Years | 93 (3.4%) | 19 (0.9%) |
| 75 to 79 Years | 99 (3.6%) | 98 (4.6%) |
| 80 to 84 Years | 13 (0.5%) | 69 (3.2%) |
| 85 Years and over | 42 (1.5%) | 42 (2.0%) |
| Total | 2,762 (100.0%) | 2,127 (100.0%) |
Families and Households in Valparaiso
Median Family Size in Valparaiso
The median family size in Valparaiso is 2.73 persons per family, with single male/father families (31 | 2.7%) accounting for the largest median family size of 2.84 persons per family. On the other hand, single female/mother families (321 | 27.8%) represent the smallest median family size with 2.57 persons per family.
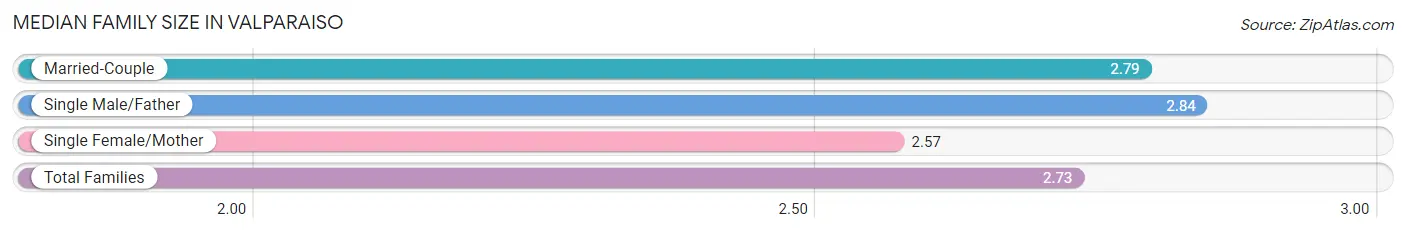
| Family Type | # Families | Family Size |
| Married-Couple | 803 (69.5%) | 2.79 |
| Single Male/Father | 31 (2.7%) | 2.84 |
| Single Female/Mother | 321 (27.8%) | 2.57 |
| Total Families | 1,155 (100.0%) | 2.73 |
Median Household Size in Valparaiso
The median household size in Valparaiso is 2.40 persons per household, with single female/mother households (321 | 18.6%) accounting for the largest median household size of 3.09 persons per household. non-family households (566 | 32.9%) represent the smallest median household size with 1.43 persons per household.
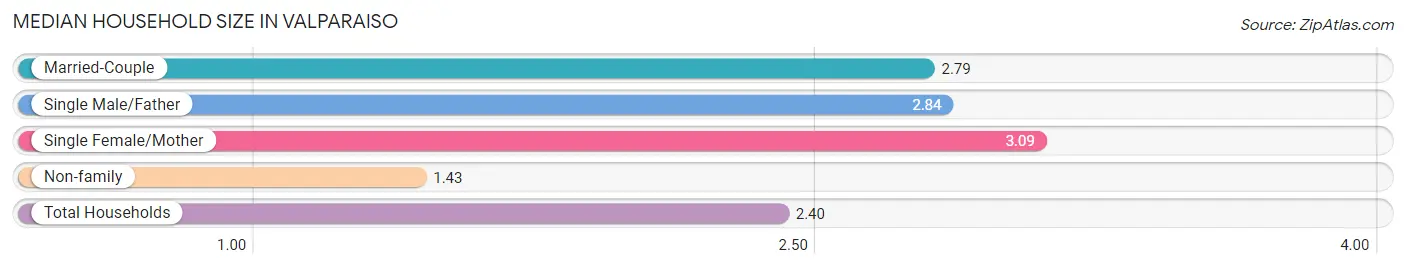
| Household Type | # Households | Household Size |
| Married-Couple | 803 (46.7%) | 2.79 |
| Single Male/Father | 31 (1.8%) | 2.84 |
| Single Female/Mother | 321 (18.6%) | 3.09 |
| Non-family | 566 (32.9%) | 1.43 |
| Total Households | 1,721 (100.0%) | 2.40 |
Household Size by Marriage Status in Valparaiso
Out of a total of 1,721 households in Valparaiso, 1,155 (67.1%) are family households, while 566 (32.9%) are nonfamily households. The most numerous type of family households are 2-person households, comprising 676, and the most common type of nonfamily households are 1-person households, comprising 428.
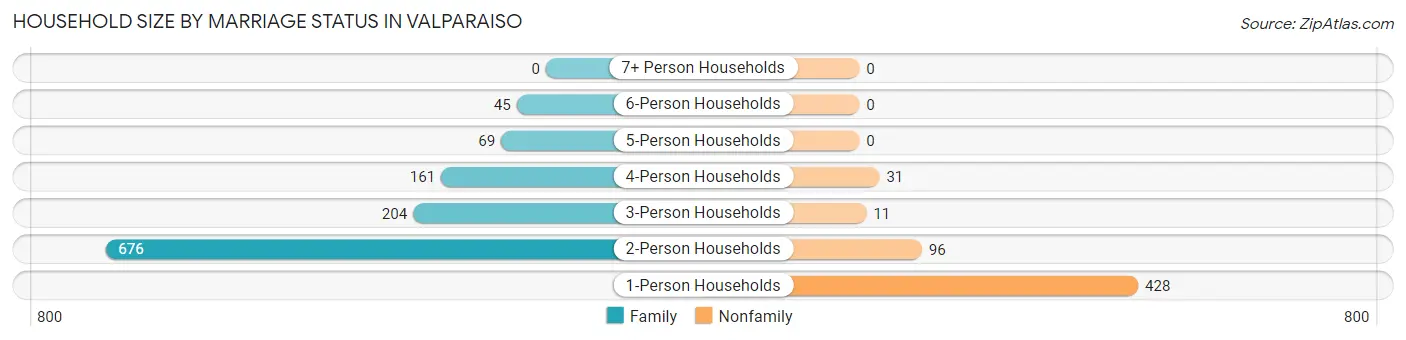
| Household Size | Family Households | Nonfamily Households |
| 1-Person Households | - | 428 (24.9%) |
| 2-Person Households | 676 (39.3%) | 96 (5.6%) |
| 3-Person Households | 204 (11.8%) | 11 (0.6%) |
| 4-Person Households | 161 (9.4%) | 31 (1.8%) |
| 5-Person Households | 69 (4.0%) | 0 (0.0%) |
| 6-Person Households | 45 (2.6%) | 0 (0.0%) |
| 7+ Person Households | 0 (0.0%) | 0 (0.0%) |
| Total | 1,155 (67.1%) | 566 (32.9%) |
Female Fertility in Valparaiso
Fertility by Age in Valparaiso
Average fertility rate in Valparaiso is 12.0 births per 1,000 women. Women in the age bracket of 20 to 34 years have the highest fertility rate with 19.0 births per 1,000 women. Women in the age bracket of 20 to 34 years acount for 100.0% of all women with births.
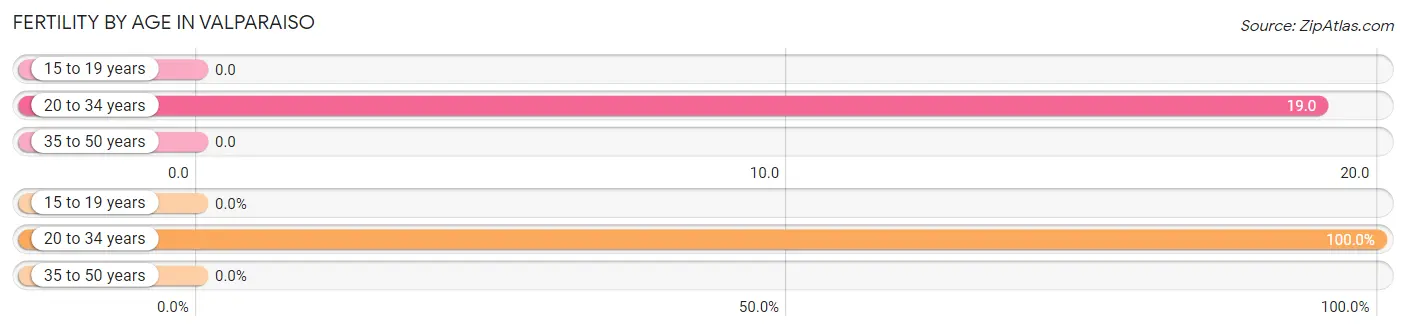
| Age Bracket | Women with Births | Births / 1,000 Women |
| 15 to 19 years | 0 (0.0%) | 0.0 |
| 20 to 34 years | 12 (100.0%) | 19.0 |
| 35 to 50 years | 0 (0.0%) | 0.0 |
| Total | 12 (100.0%) | 12.0 |
Fertility by Age by Marriage Status in Valparaiso
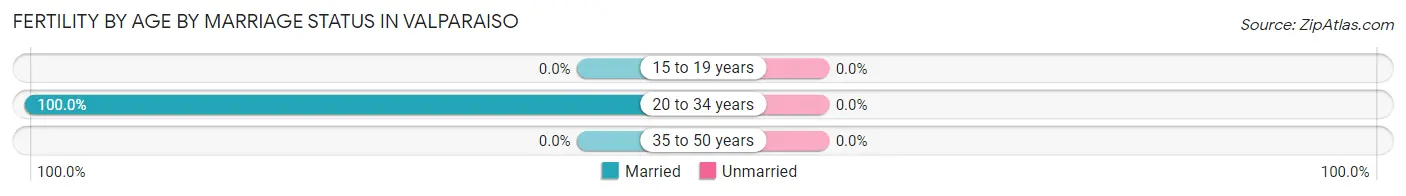
| Age Bracket | Married | Unmarried |
| 15 to 19 years | 0 (0.0%) | 0 (0.0%) |
| 20 to 34 years | 12 (100.0%) | 0 (0.0%) |
| 35 to 50 years | 0 (0.0%) | 0 (0.0%) |
| Total | 12 (100.0%) | 0 (0.0%) |
Fertility by Education in Valparaiso
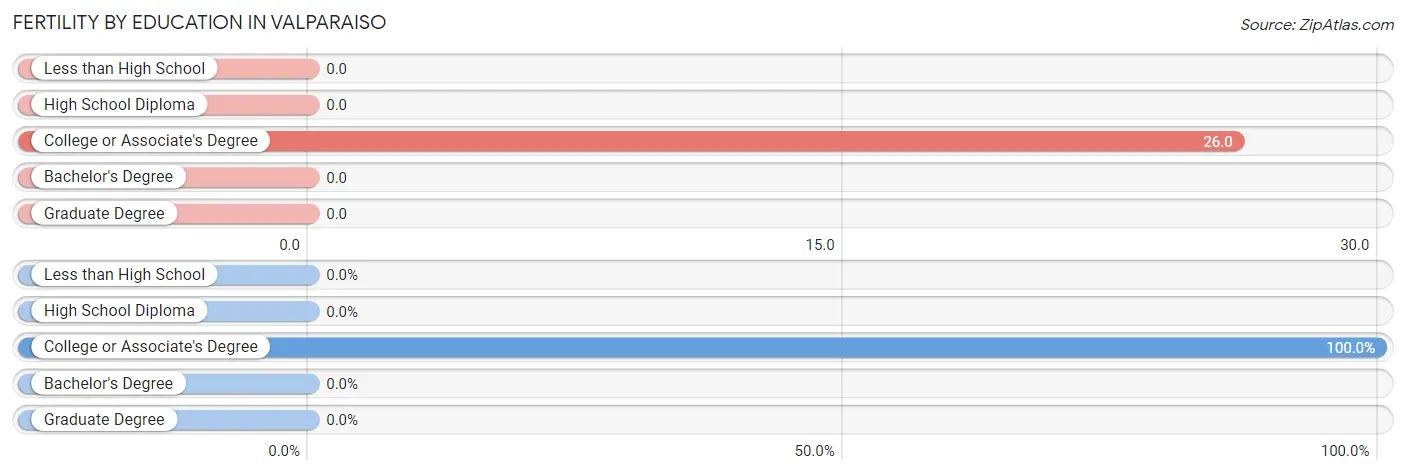
| Educational Attainment | Women with Births | Births / 1,000 Women |
| Less than High School | 0 (0.0%) | 0.0 |
| High School Diploma | 0 (0.0%) | 0.0 |
| College or Associate's Degree | 12 (100.0%) | 26.0 |
| Bachelor's Degree | 0 (0.0%) | 0.0 |
| Graduate Degree | 0 (0.0%) | 0.0 |
| Total | 12 (100.0%) | 12.0 |
Fertility by Education by Marriage Status in Valparaiso
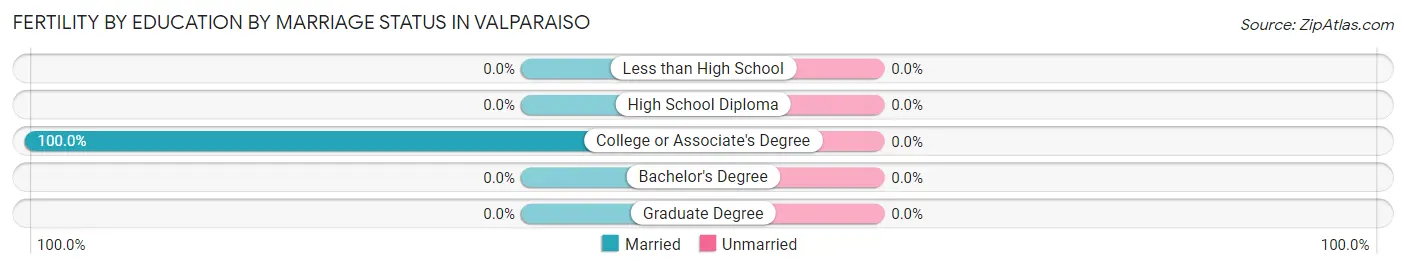
| Educational Attainment | Married | Unmarried |
| Less than High School | 0 (0.0%) | 0 (0.0%) |
| High School Diploma | 0 (0.0%) | 0 (0.0%) |
| College or Associate's Degree | 12 (100.0%) | 0 (0.0%) |
| Bachelor's Degree | 0 (0.0%) | 0 (0.0%) |
| Graduate Degree | 0 (0.0%) | 0 (0.0%) |
| Total | 12 (100.0%) | 0 (0.0%) |
Employment Characteristics in Valparaiso
Employment by Class of Employer in Valparaiso
Among the 2,856 employed individuals in Valparaiso, federal government employees (1,426 | 49.9%), private company employees (1,082 | 37.9%), and state government employees (82 | 2.9%) make up the most common classes of employment.
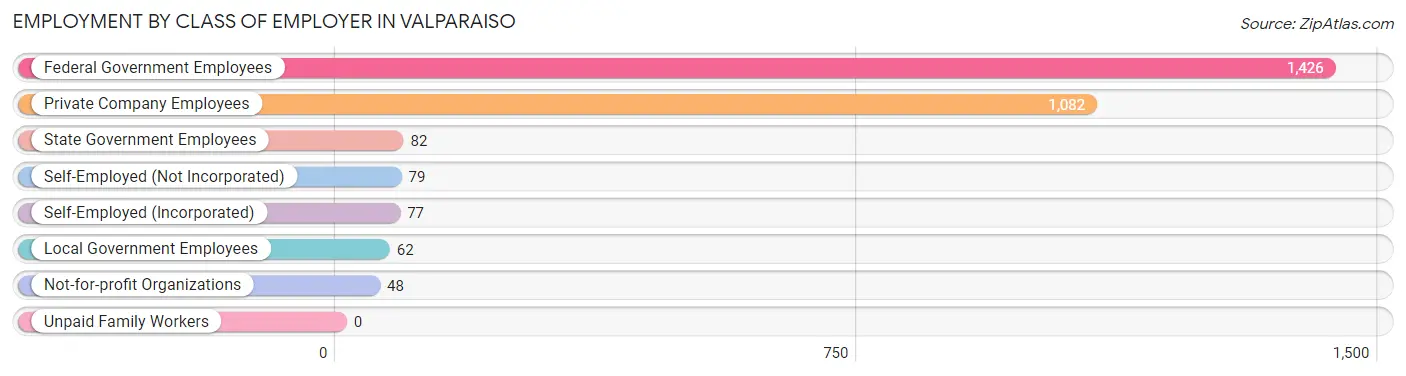
| Employer Class | # Employees | % Employees |
| Private Company Employees | 1,082 | 37.9% |
| Self-Employed (Incorporated) | 77 | 2.7% |
| Self-Employed (Not Incorporated) | 79 | 2.8% |
| Not-for-profit Organizations | 48 | 1.7% |
| Local Government Employees | 62 | 2.2% |
| State Government Employees | 82 | 2.9% |
| Federal Government Employees | 1,426 | 49.9% |
| Unpaid Family Workers | 0 | 0.0% |
| Total | 2,856 | 100.0% |
Employment Status by Age in Valparaiso
According to the labor force statistics for Valparaiso, out of the total population over 16 years of age (3,964), 74.9% or 2,969 individuals are in the labor force, with 3.0% or 89 of them unemployed. The age group with the highest labor force participation rate is 30 to 34 years, with 100.0% or 293 individuals in the labor force. Within the labor force, the 30 to 34 years age range has the highest percentage of unemployed individuals, with 17.1% or 50 of them being unemployed.
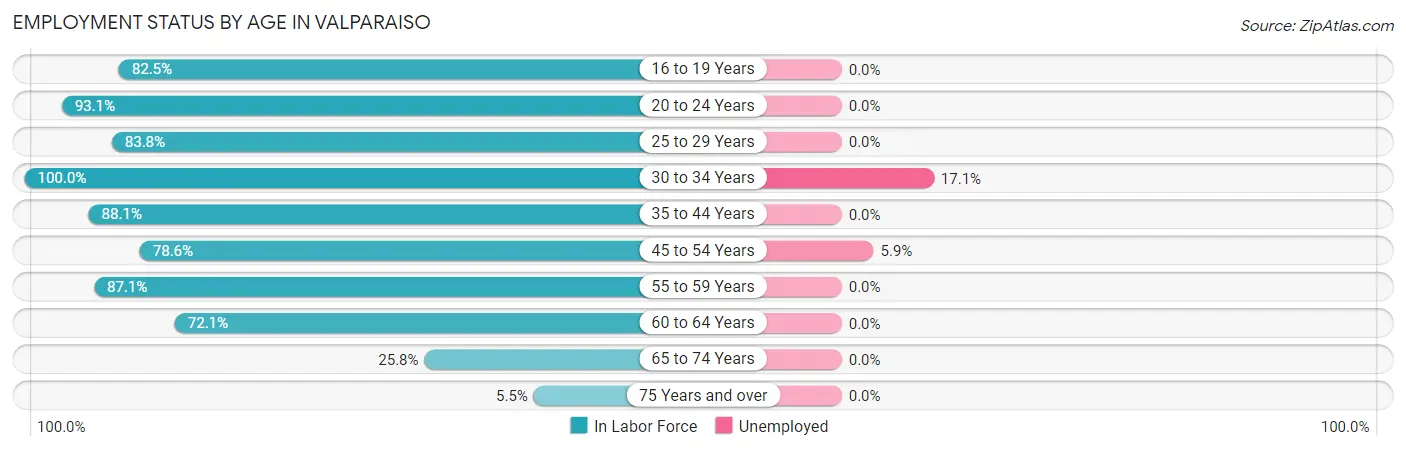
| Age Bracket | In Labor Force | Unemployed |
| 16 to 19 Years | 329 (82.5%) | 0 (0.0%) |
| 20 to 24 Years | 665 (93.1%) | 0 (0.0%) |
| 25 to 29 Years | 651 (83.8%) | 0 (0.0%) |
| 30 to 34 Years | 293 (100.0%) | 50 (17.1%) |
| 35 to 44 Years | 312 (88.1%) | 0 (0.0%) |
| 45 to 54 Years | 220 (78.6%) | 13 (5.9%) |
| 55 to 59 Years | 243 (87.1%) | 0 (0.0%) |
| 60 to 64 Years | 163 (72.1%) | 0 (0.0%) |
| 65 to 74 Years | 72 (25.8%) | 0 (0.0%) |
| 75 Years and over | 20 (5.5%) | 0 (0.0%) |
| Total | 2,969 (74.9%) | 89 (3.0%) |
Employment Status by Educational Attainment in Valparaiso
According to labor force statistics for Valparaiso, 85.2% of individuals (1,882) out of the total population between 25 and 64 years of age (2,209) are in the labor force, with 4.0% or 75 of them being unemployed. The group with the highest labor force participation rate are those with the educational attainment of bachelor's degree or higher, with 95.2% or 793 individuals in the labor force. Within the labor force, individuals with bachelor's degree or higher education have the highest percentage of unemployment, with 9.9% or 79 of them being unemployed.
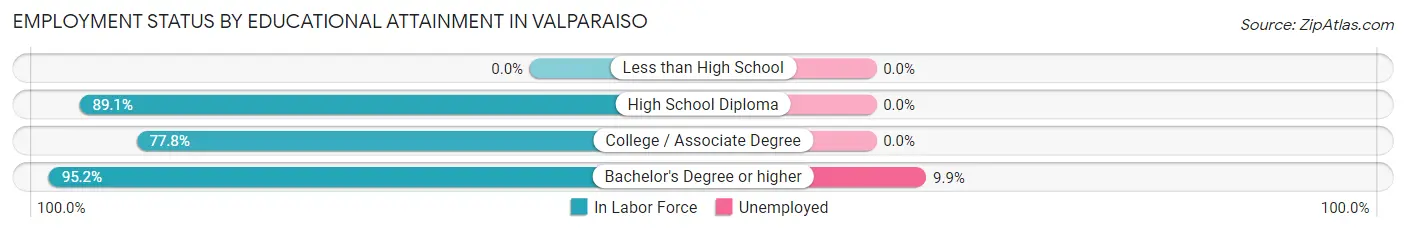
| Educational Attainment | In Labor Force | Unemployed |
| Less than High School | 0 (0.0%) | 0 (0.0%) |
| High School Diploma | 304 (89.1%) | 0 (0.0%) |
| College / Associate Degree | 785 (77.8%) | 0 (0.0%) |
| Bachelor's Degree or higher | 793 (95.2%) | 82 (9.9%) |
| Total | 1,882 (85.2%) | 88 (4.0%) |
Employment Occupations by Sex in Valparaiso
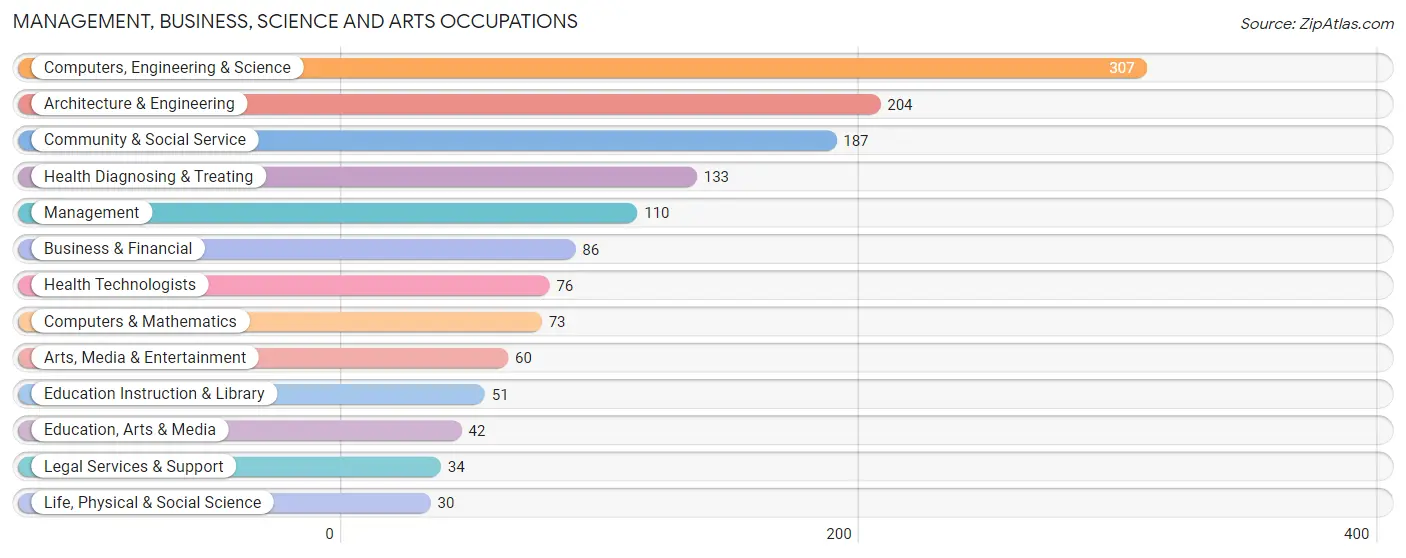
Management, Business, Science and Arts Occupations
The most common Management, Business, Science and Arts occupations in Valparaiso are Computers, Engineering & Science (307 | 16.6%), Architecture & Engineering (204 | 11.0%), Community & Social Service (187 | 10.1%), Health Diagnosing & Treating (133 | 7.2%), and Management (110 | 5.9%).
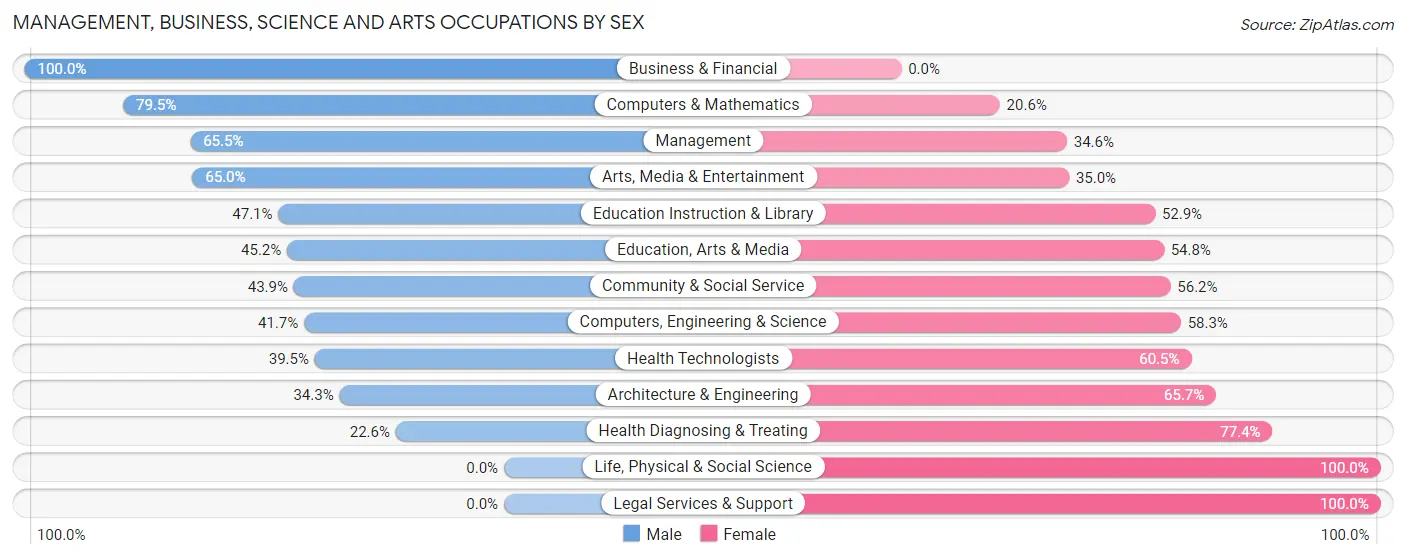
Management, Business, Science and Arts Occupations by Sex
Within the Management, Business, Science and Arts occupations in Valparaiso, the most male-oriented occupations are Business & Financial (100.0%), Computers & Mathematics (79.4%), and Management (65.4%), while the most female-oriented occupations are Life, Physical & Social Science (100.0%), Legal Services & Support (100.0%), and Health Diagnosing & Treating (77.4%).
| Occupation | Male | Female |
| Management | 72 (65.4%) | 38 (34.5%) |
| Business & Financial | 86 (100.0%) | 0 (0.0%) |
| Computers, Engineering & Science | 128 (41.7%) | 179 (58.3%) |
| Computers & Mathematics | 58 (79.4%) | 15 (20.5%) |
| Architecture & Engineering | 70 (34.3%) | 134 (65.7%) |
| Life, Physical & Social Science | 0 (0.0%) | 30 (100.0%) |
| Community & Social Service | 82 (43.9%) | 105 (56.1%) |
| Education, Arts & Media | 19 (45.2%) | 23 (54.8%) |
| Legal Services & Support | 0 (0.0%) | 34 (100.0%) |
| Education Instruction & Library | 24 (47.1%) | 27 (52.9%) |
| Arts, Media & Entertainment | 39 (65.0%) | 21 (35.0%) |
| Health Diagnosing & Treating | 30 (22.6%) | 103 (77.4%) |
| Health Technologists | 30 (39.5%) | 46 (60.5%) |
| Total (Category) | 398 (48.4%) | 425 (51.6%) |
| Total (Overall) | 1,000 (54.0%) | 853 (46.0%) |
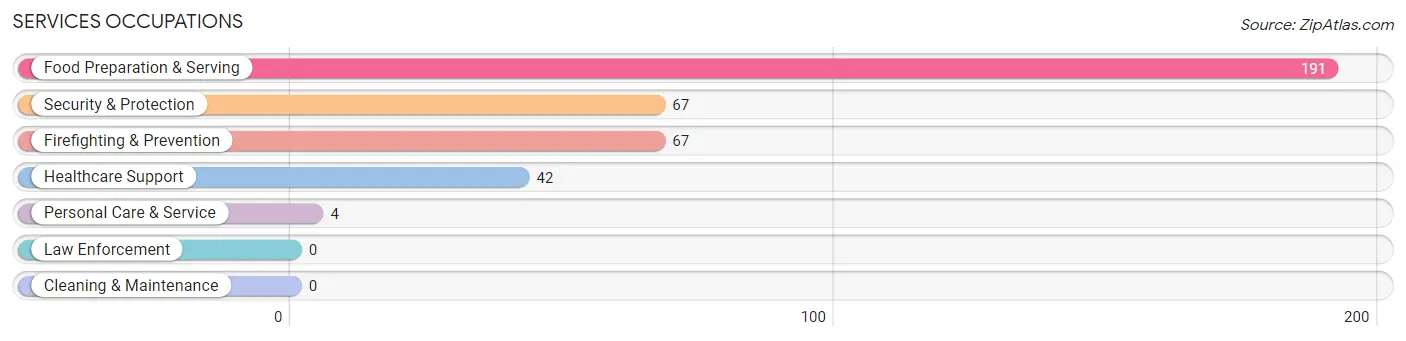
Services Occupations
The most common Services occupations in Valparaiso are Food Preparation & Serving (191 | 10.3%), Security & Protection (67 | 3.6%), Firefighting & Prevention (67 | 3.6%), Healthcare Support (42 | 2.3%), and Personal Care & Service (4 | 0.2%).
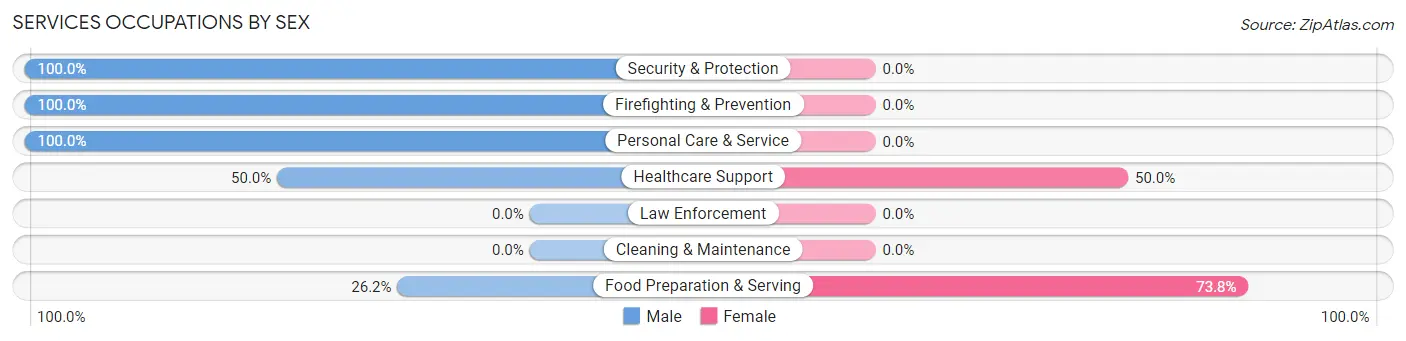
Services Occupations by Sex
Within the Services occupations in Valparaiso, the most male-oriented occupations are Security & Protection (100.0%), Firefighting & Prevention (100.0%), and Personal Care & Service (100.0%), while the most female-oriented occupations are Food Preparation & Serving (73.8%), and Healthcare Support (50.0%).
| Occupation | Male | Female |
| Healthcare Support | 21 (50.0%) | 21 (50.0%) |
| Security & Protection | 67 (100.0%) | 0 (0.0%) |
| Firefighting & Prevention | 67 (100.0%) | 0 (0.0%) |
| Law Enforcement | 0 (0.0%) | 0 (0.0%) |
| Food Preparation & Serving | 50 (26.2%) | 141 (73.8%) |
| Cleaning & Maintenance | 0 (0.0%) | 0 (0.0%) |
| Personal Care & Service | 4 (100.0%) | 0 (0.0%) |
| Total (Category) | 142 (46.7%) | 162 (53.3%) |
| Total (Overall) | 1,000 (54.0%) | 853 (46.0%) |
Sales and Office Occupations
The most common Sales and Office occupations in Valparaiso are Office & Administration (223 | 12.0%), and Sales & Related (129 | 7.0%).
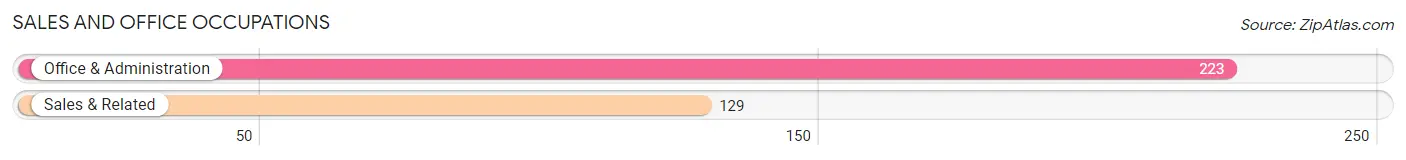
Sales and Office Occupations by Sex

| Occupation | Male | Female |
| Sales & Related | 67 (51.9%) | 62 (48.1%) |
| Office & Administration | 78 (35.0%) | 145 (65.0%) |
| Total (Category) | 145 (41.2%) | 207 (58.8%) |
| Total (Overall) | 1,000 (54.0%) | 853 (46.0%) |
Natural Resources, Construction and Maintenance Occupations
The most common Natural Resources, Construction and Maintenance occupations in Valparaiso are Construction & Extraction (138 | 7.4%), and Installation, Maintenance & Repair (68 | 3.7%).
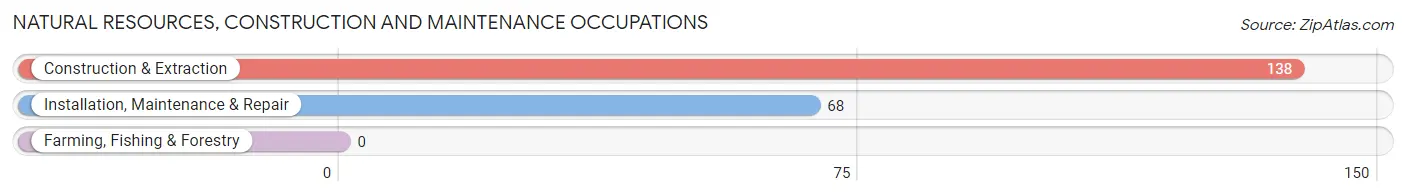
Natural Resources, Construction and Maintenance Occupations by Sex
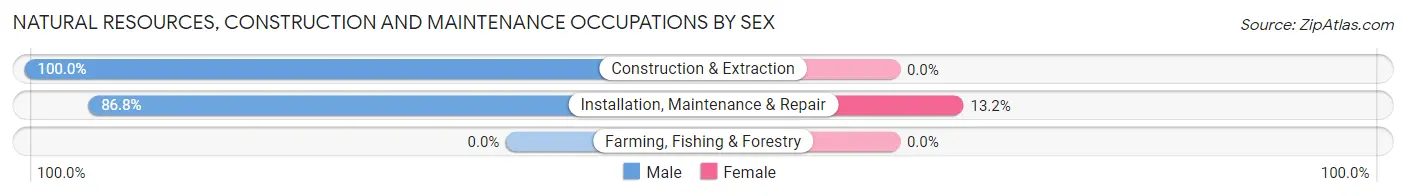
| Occupation | Male | Female |
| Farming, Fishing & Forestry | 0 (0.0%) | 0 (0.0%) |
| Construction & Extraction | 138 (100.0%) | 0 (0.0%) |
| Installation, Maintenance & Repair | 59 (86.8%) | 9 (13.2%) |
| Total (Category) | 197 (95.6%) | 9 (4.4%) |
| Total (Overall) | 1,000 (54.0%) | 853 (46.0%) |
Production, Transportation and Moving Occupations
The most common Production, Transportation and Moving occupations in Valparaiso are Transportation (97 | 5.2%), Material Moving (39 | 2.1%), and Production (32 | 1.7%).
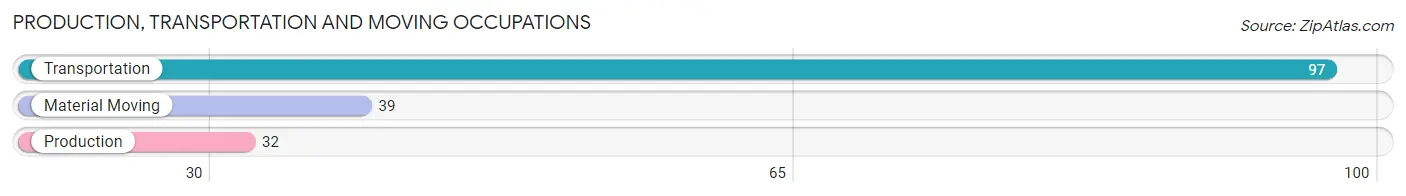
Production, Transportation and Moving Occupations by Sex
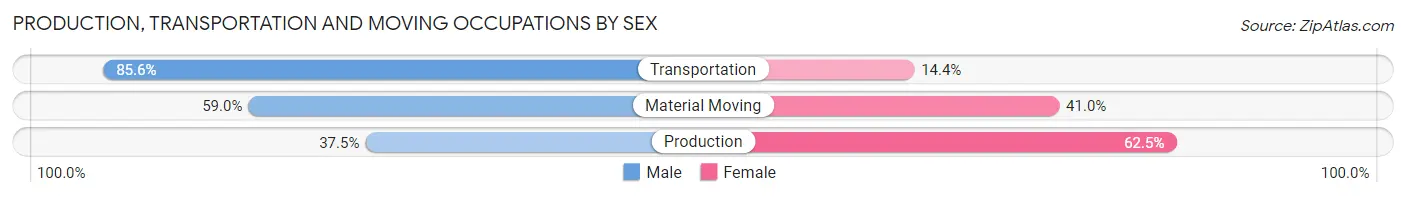
| Occupation | Male | Female |
| Production | 12 (37.5%) | 20 (62.5%) |
| Transportation | 83 (85.6%) | 14 (14.4%) |
| Material Moving | 23 (59.0%) | 16 (41.0%) |
| Total (Category) | 118 (70.2%) | 50 (29.8%) |
| Total (Overall) | 1,000 (54.0%) | 853 (46.0%) |
Employment Industries by Sex in Valparaiso
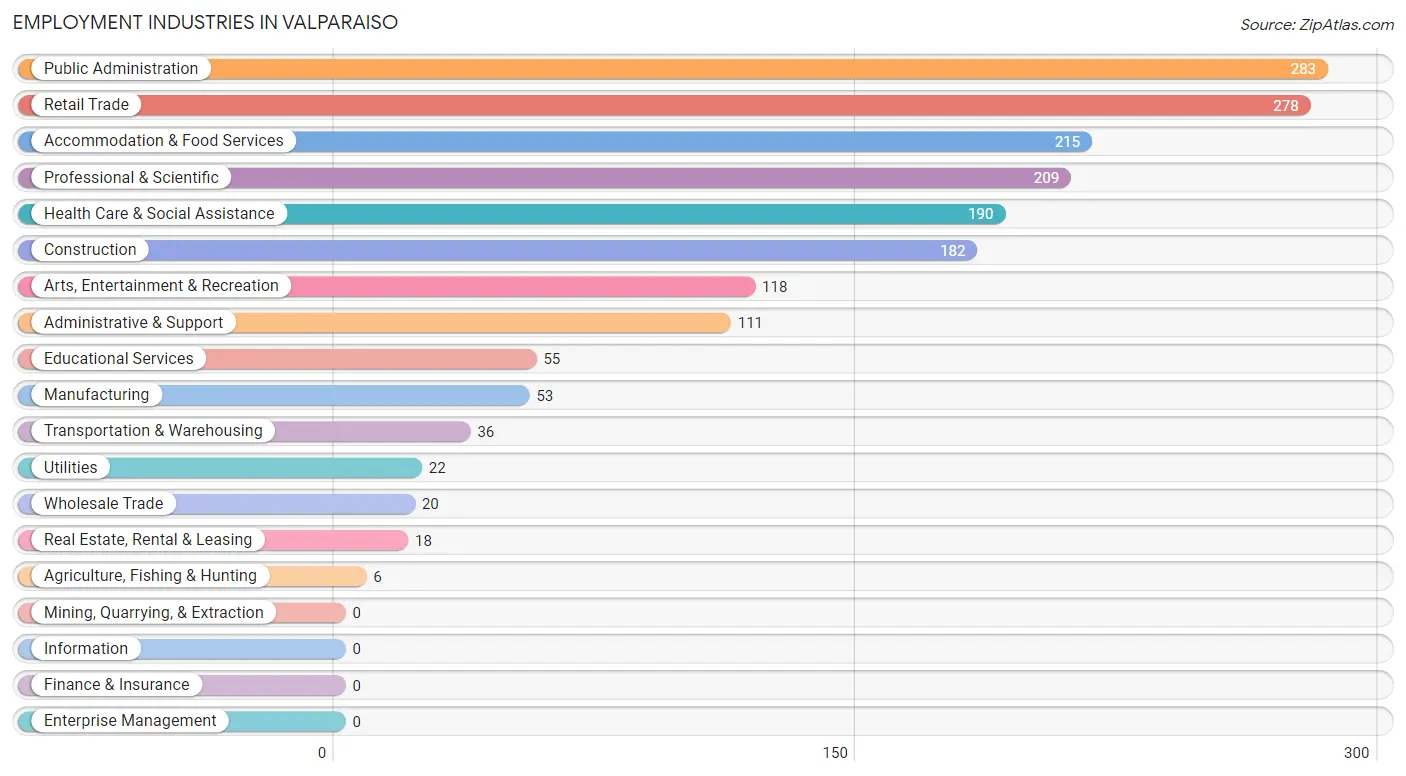
Employment Industries in Valparaiso
The major employment industries in Valparaiso include Public Administration (283 | 15.3%), Retail Trade (278 | 15.0%), Accommodation & Food Services (215 | 11.6%), Professional & Scientific (209 | 11.3%), and Health Care & Social Assistance (190 | 10.2%).
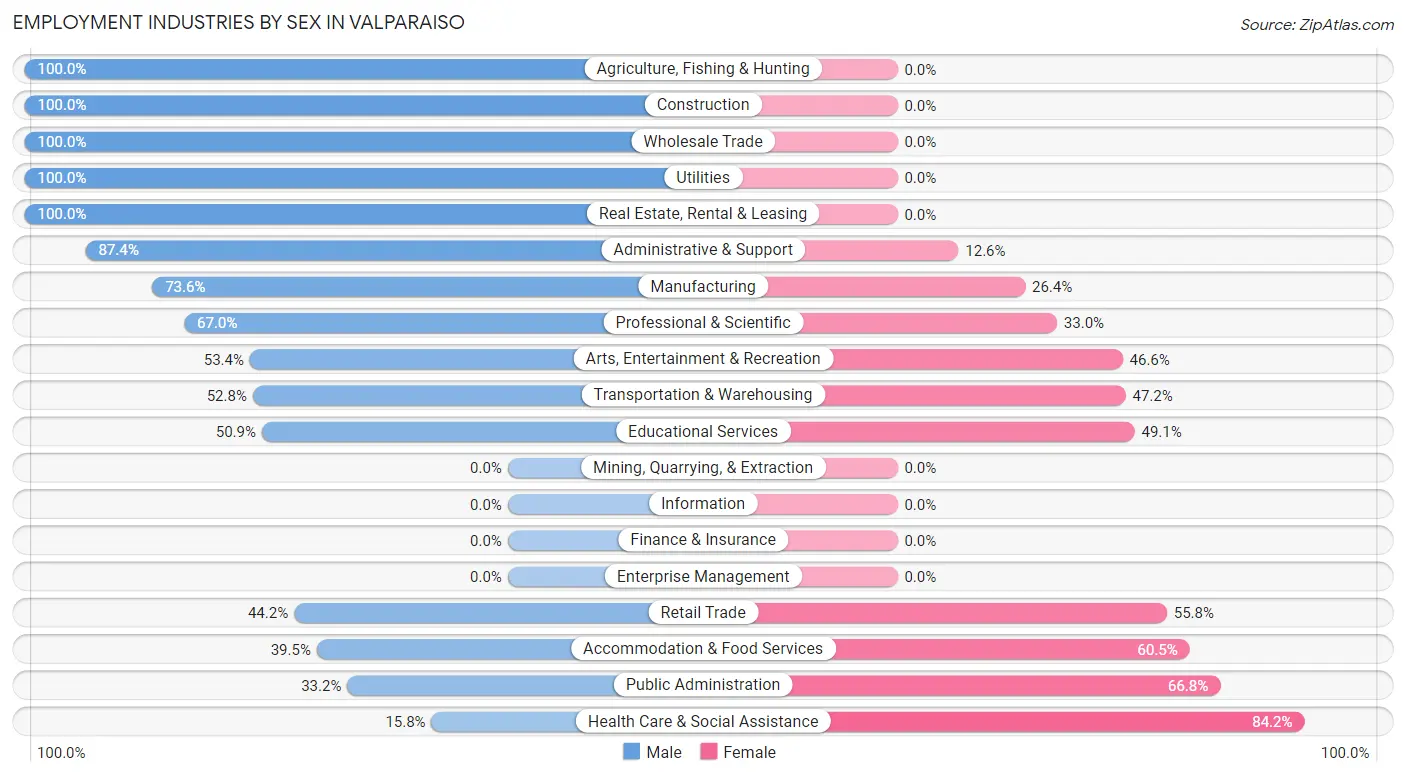
Employment Industries by Sex in Valparaiso
The Valparaiso industries that see more men than women are Agriculture, Fishing & Hunting (100.0%), Construction (100.0%), and Wholesale Trade (100.0%), whereas the industries that tend to have a higher number of women are Health Care & Social Assistance (84.2%), Public Administration (66.8%), and Accommodation & Food Services (60.5%).
| Industry | Male | Female |
| Agriculture, Fishing & Hunting | 6 (100.0%) | 0 (0.0%) |
| Mining, Quarrying, & Extraction | 0 (0.0%) | 0 (0.0%) |
| Construction | 182 (100.0%) | 0 (0.0%) |
| Manufacturing | 39 (73.6%) | 14 (26.4%) |
| Wholesale Trade | 20 (100.0%) | 0 (0.0%) |
| Retail Trade | 123 (44.2%) | 155 (55.8%) |
| Transportation & Warehousing | 19 (52.8%) | 17 (47.2%) |
| Utilities | 22 (100.0%) | 0 (0.0%) |
| Information | 0 (0.0%) | 0 (0.0%) |
| Finance & Insurance | 0 (0.0%) | 0 (0.0%) |
| Real Estate, Rental & Leasing | 18 (100.0%) | 0 (0.0%) |
| Professional & Scientific | 140 (67.0%) | 69 (33.0%) |
| Enterprise Management | 0 (0.0%) | 0 (0.0%) |
| Administrative & Support | 97 (87.4%) | 14 (12.6%) |
| Educational Services | 28 (50.9%) | 27 (49.1%) |
| Health Care & Social Assistance | 30 (15.8%) | 160 (84.2%) |
| Arts, Entertainment & Recreation | 63 (53.4%) | 55 (46.6%) |
| Accommodation & Food Services | 85 (39.5%) | 130 (60.5%) |
| Public Administration | 94 (33.2%) | 189 (66.8%) |
| Total | 1,000 (54.0%) | 853 (46.0%) |
Education in Valparaiso
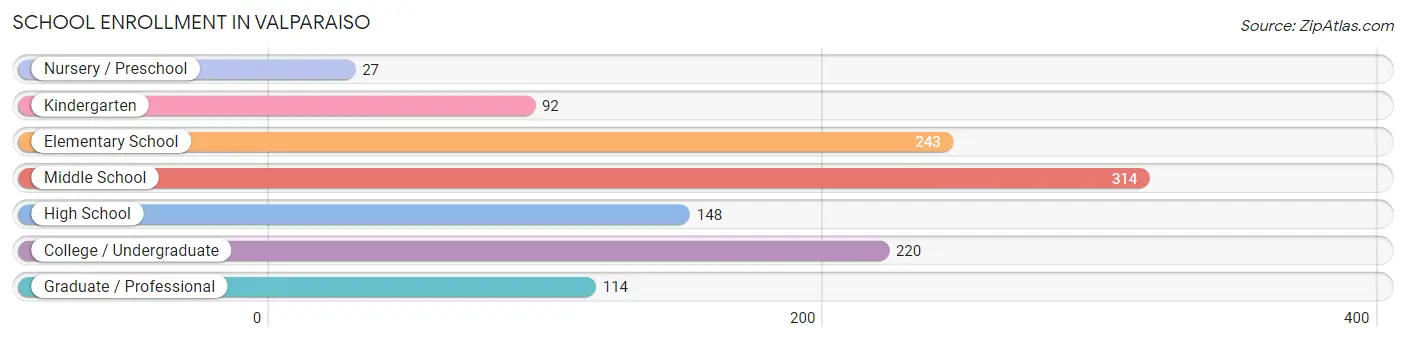
School Enrollment in Valparaiso
The most common levels of schooling among the 1,158 students in Valparaiso are middle school (314 | 27.1%), elementary school (243 | 21.0%), and college / undergraduate (220 | 19.0%).
| School Level | # Students | % Students |
| Nursery / Preschool | 27 | 2.3% |
| Kindergarten | 92 | 7.9% |
| Elementary School | 243 | 21.0% |
| Middle School | 314 | 27.1% |
| High School | 148 | 12.8% |
| College / Undergraduate | 220 | 19.0% |
| Graduate / Professional | 114 | 9.8% |
| Total | 1,158 | 100.0% |
School Enrollment by Age by Funding Source in Valparaiso
Out of a total of 1,158 students who are enrolled in schools in Valparaiso, 115 (9.9%) attend a private institution, while the remaining 1,043 (90.1%) are enrolled in public schools. The age group of 15 to 17 year olds has the highest likelihood of being enrolled in private schools, with 26 (29.2% in the age bracket) enrolled. Conversely, the age group of 3 to 4 year olds has the lowest likelihood of being enrolled in a private school, with 15 (100.0% in the age bracket) attending a public institution.
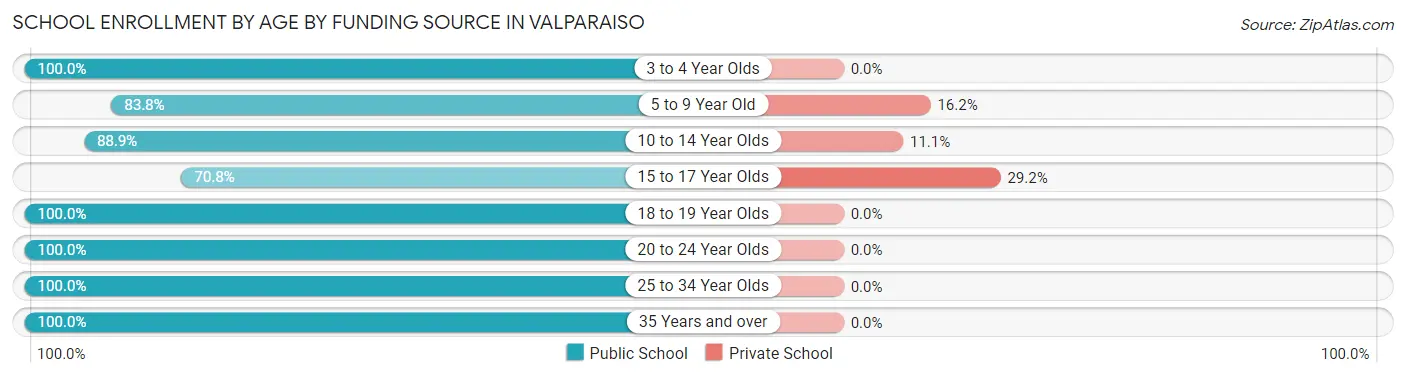
| Age Bracket | Public School | Private School |
| 3 to 4 Year Olds | 15 (100.0%) | 0 (0.0%) |
| 5 to 9 Year Old | 223 (83.8%) | 43 (16.2%) |
| 10 to 14 Year Olds | 370 (88.9%) | 46 (11.1%) |
| 15 to 17 Year Olds | 63 (70.8%) | 26 (29.2%) |
| 18 to 19 Year Olds | 42 (100.0%) | 0 (0.0%) |
| 20 to 24 Year Olds | 105 (100.0%) | 0 (0.0%) |
| 25 to 34 Year Olds | 184 (100.0%) | 0 (0.0%) |
| 35 Years and over | 41 (100.0%) | 0 (0.0%) |
| Total | 1,043 (90.1%) | 115 (9.9%) |
Educational Attainment by Field of Study in Valparaiso
Engineering (294 | 28.0%), business (168 | 16.0%), bio, nature & agricultural (109 | 10.4%), liberal arts & history (101 | 9.6%), and computers & mathematics (91 | 8.7%) are the most common fields of study among 1,050 individuals in Valparaiso who have obtained a bachelor's degree or higher.
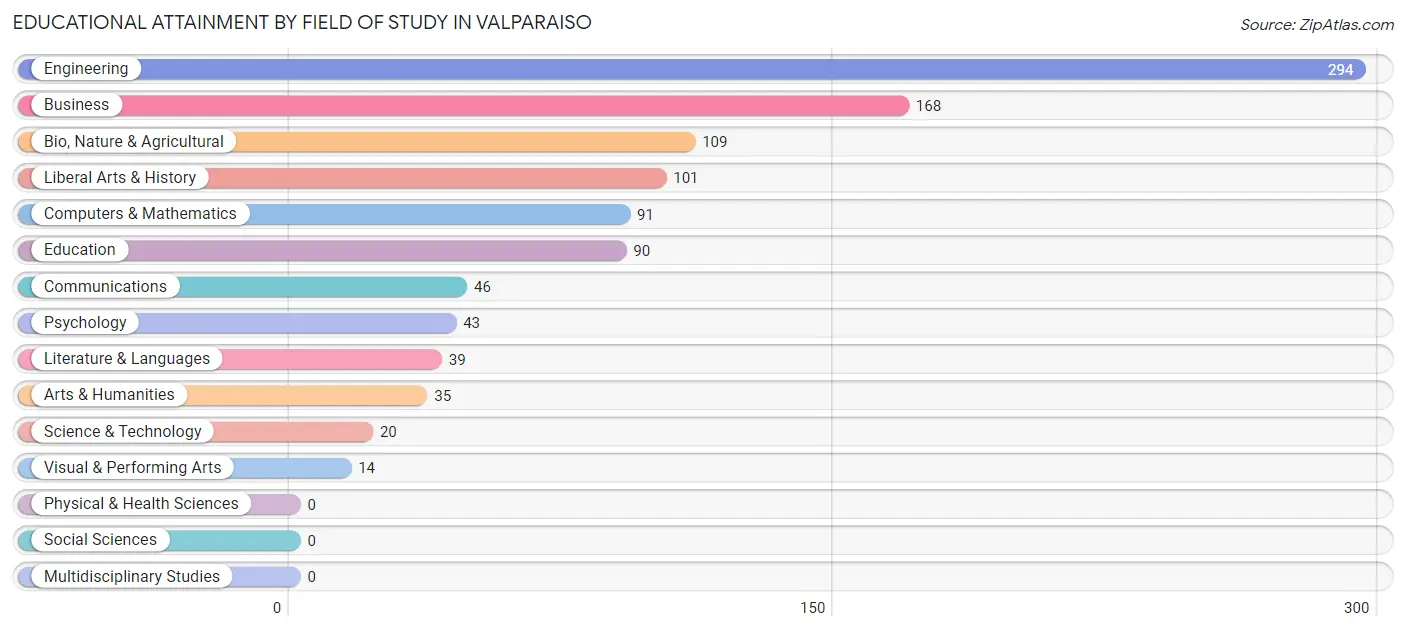
| Field of Study | # Graduates | % Graduates |
| Computers & Mathematics | 91 | 8.7% |
| Bio, Nature & Agricultural | 109 | 10.4% |
| Physical & Health Sciences | 0 | 0.0% |
| Psychology | 43 | 4.1% |
| Social Sciences | 0 | 0.0% |
| Engineering | 294 | 28.0% |
| Multidisciplinary Studies | 0 | 0.0% |
| Science & Technology | 20 | 1.9% |
| Business | 168 | 16.0% |
| Education | 90 | 8.6% |
| Literature & Languages | 39 | 3.7% |
| Liberal Arts & History | 101 | 9.6% |
| Visual & Performing Arts | 14 | 1.3% |
| Communications | 46 | 4.4% |
| Arts & Humanities | 35 | 3.3% |
| Total | 1,050 | 100.0% |
Transportation & Commute in Valparaiso
Vehicle Availability by Sex in Valparaiso
The most prevalent vehicle ownership categories in Valparaiso are males with 2 vehicles (753, accounting for 60.6%) and females with 2 vehicles (491, making up 87.1%).
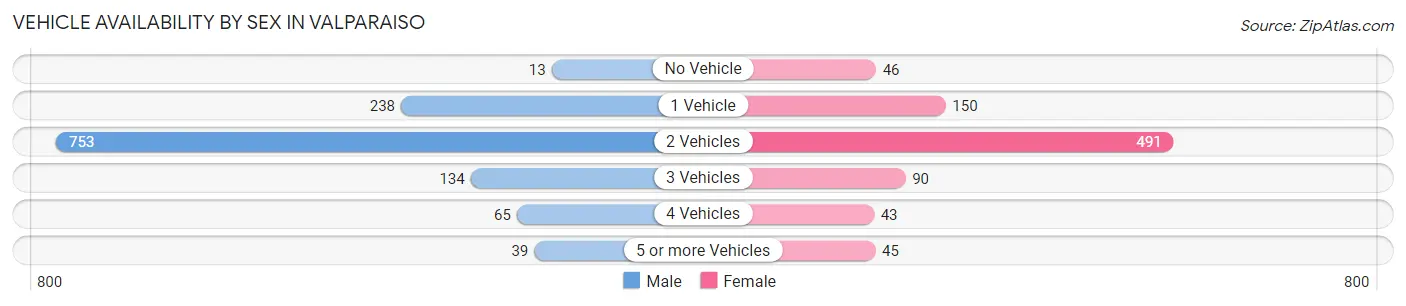
| Vehicles Available | Male | Female |
| No Vehicle | 13 (1.1%) | 46 (5.3%) |
| 1 Vehicle | 238 (19.2%) | 150 (17.3%) |
| 2 Vehicles | 753 (60.6%) | 491 (56.8%) |
| 3 Vehicles | 134 (10.8%) | 90 (10.4%) |
| 4 Vehicles | 65 (5.2%) | 43 (5.0%) |
| 5 or more Vehicles | 39 (3.1%) | 45 (5.2%) |
| Total | 1,242 (100.0%) | 865 (100.0%) |
Commute Time in Valparaiso
The most frequently occuring commute durations in Valparaiso are 5 to 9 minutes (566 commuters, 20.5%), 10 to 14 minutes (423 commuters, 15.3%), and 15 to 19 minutes (354 commuters, 12.8%).
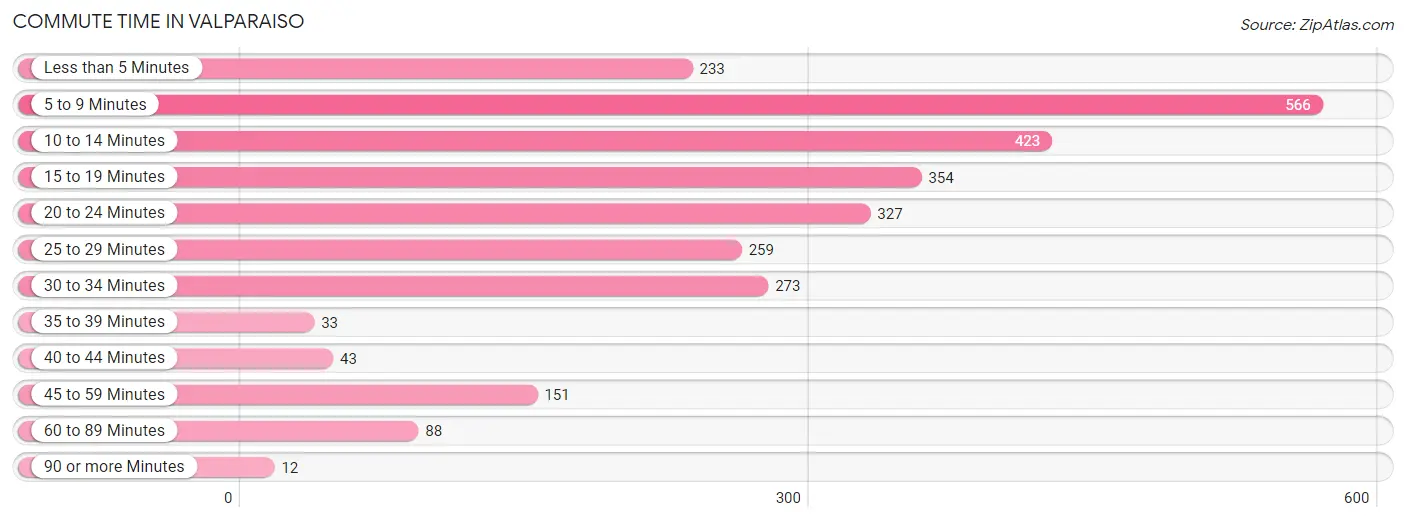
| Commute Time | # Commuters | % Commuters |
| Less than 5 Minutes | 233 | 8.4% |
| 5 to 9 Minutes | 566 | 20.5% |
| 10 to 14 Minutes | 423 | 15.3% |
| 15 to 19 Minutes | 354 | 12.8% |
| 20 to 24 Minutes | 327 | 11.8% |
| 25 to 29 Minutes | 259 | 9.4% |
| 30 to 34 Minutes | 273 | 9.9% |
| 35 to 39 Minutes | 33 | 1.2% |
| 40 to 44 Minutes | 43 | 1.6% |
| 45 to 59 Minutes | 151 | 5.5% |
| 60 to 89 Minutes | 88 | 3.2% |
| 90 or more Minutes | 12 | 0.4% |
Commute Time by Sex in Valparaiso
The most common commute times in Valparaiso are 5 to 9 minutes (484 commuters, 26.1%) for males and 15 to 19 minutes (220 commuters, 24.3%) for females.
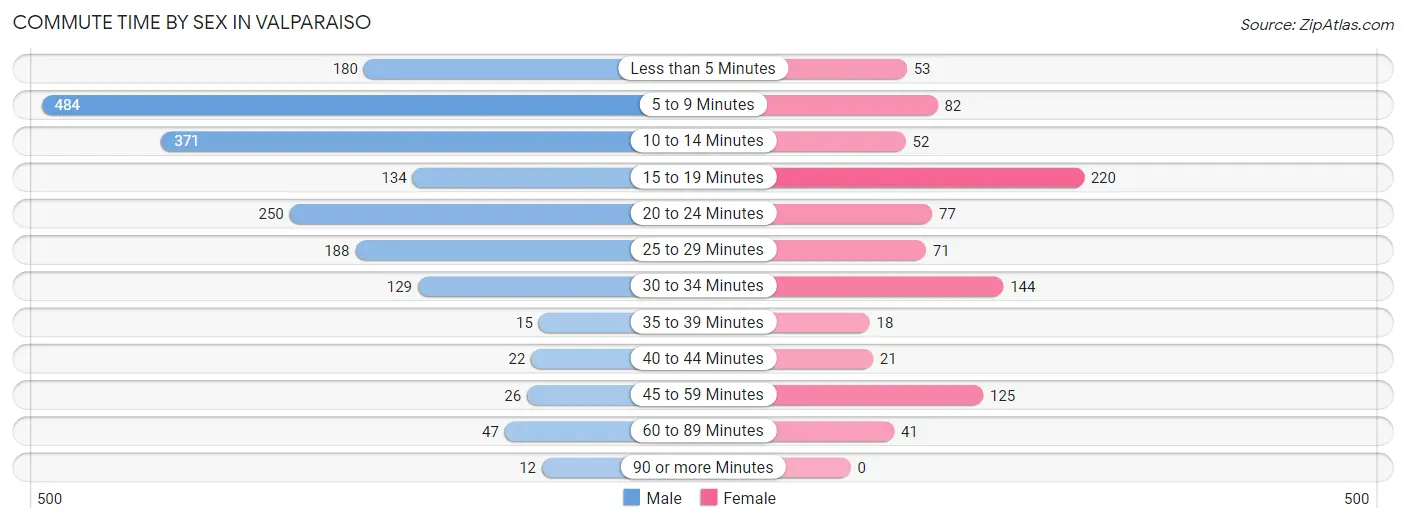
| Commute Time | Male | Female |
| Less than 5 Minutes | 180 (9.7%) | 53 (5.9%) |
| 5 to 9 Minutes | 484 (26.1%) | 82 (9.1%) |
| 10 to 14 Minutes | 371 (20.0%) | 52 (5.8%) |
| 15 to 19 Minutes | 134 (7.2%) | 220 (24.3%) |
| 20 to 24 Minutes | 250 (13.5%) | 77 (8.5%) |
| 25 to 29 Minutes | 188 (10.1%) | 71 (7.9%) |
| 30 to 34 Minutes | 129 (6.9%) | 144 (15.9%) |
| 35 to 39 Minutes | 15 (0.8%) | 18 (2.0%) |
| 40 to 44 Minutes | 22 (1.2%) | 21 (2.3%) |
| 45 to 59 Minutes | 26 (1.4%) | 125 (13.8%) |
| 60 to 89 Minutes | 47 (2.5%) | 41 (4.5%) |
| 90 or more Minutes | 12 (0.6%) | 0 (0.0%) |
Time of Departure to Work by Sex in Valparaiso
The most frequent times of departure to work in Valparaiso are 6:30 AM to 6:59 AM (400, 21.5%) for males and 7:30 AM to 7:59 AM (224, 24.8%) for females.
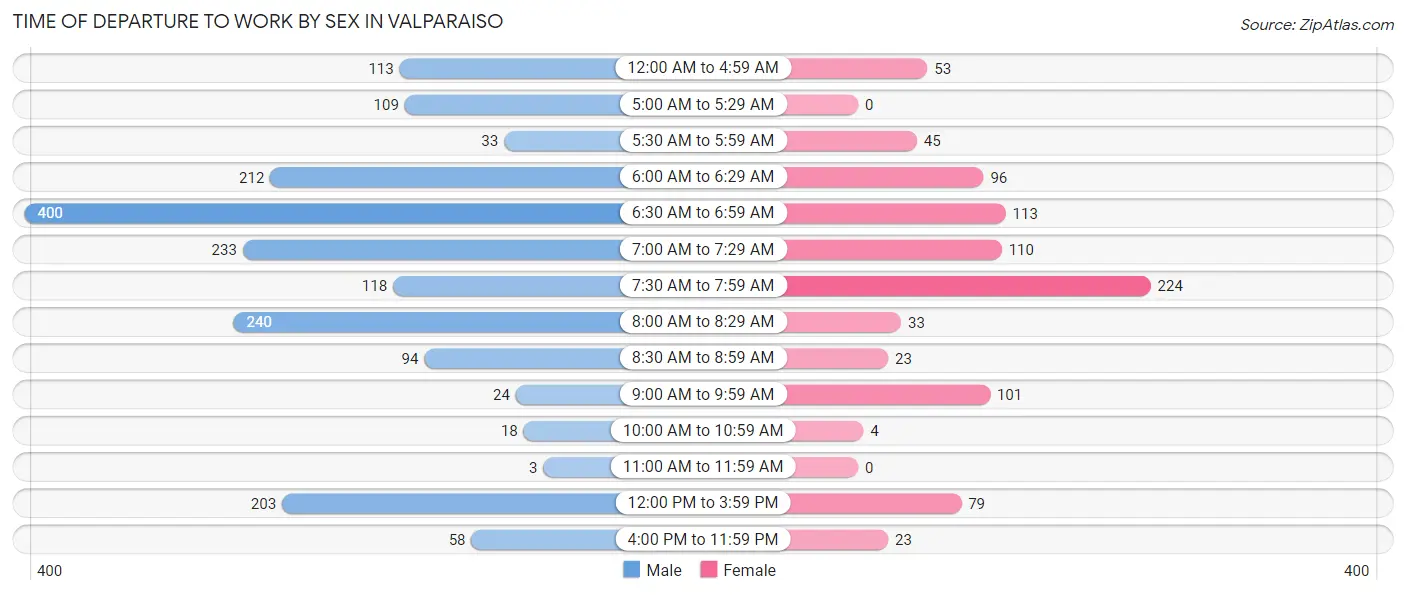
| Time of Departure | Male | Female |
| 12:00 AM to 4:59 AM | 113 (6.1%) | 53 (5.9%) |
| 5:00 AM to 5:29 AM | 109 (5.9%) | 0 (0.0%) |
| 5:30 AM to 5:59 AM | 33 (1.8%) | 45 (5.0%) |
| 6:00 AM to 6:29 AM | 212 (11.4%) | 96 (10.6%) |
| 6:30 AM to 6:59 AM | 400 (21.5%) | 113 (12.5%) |
| 7:00 AM to 7:29 AM | 233 (12.5%) | 110 (12.2%) |
| 7:30 AM to 7:59 AM | 118 (6.4%) | 224 (24.8%) |
| 8:00 AM to 8:29 AM | 240 (12.9%) | 33 (3.6%) |
| 8:30 AM to 8:59 AM | 94 (5.1%) | 23 (2.5%) |
| 9:00 AM to 9:59 AM | 24 (1.3%) | 101 (11.2%) |
| 10:00 AM to 10:59 AM | 18 (1.0%) | 4 (0.4%) |
| 11:00 AM to 11:59 AM | 3 (0.2%) | 0 (0.0%) |
| 12:00 PM to 3:59 PM | 203 (10.9%) | 79 (8.7%) |
| 4:00 PM to 11:59 PM | 58 (3.1%) | 23 (2.5%) |
| Total | 1,858 (100.0%) | 904 (100.0%) |
Housing Occupancy in Valparaiso
Occupancy by Ownership in Valparaiso
Of the total 1,721 dwellings in Valparaiso, owner-occupied units account for 1,005 (58.4%), while renter-occupied units make up 716 (41.6%).
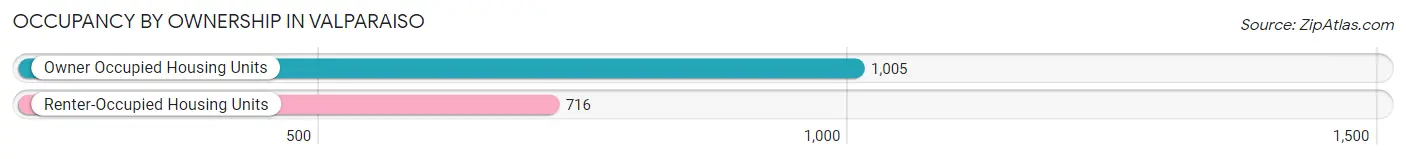
| Occupancy | # Housing Units | % Housing Units |
| Owner Occupied Housing Units | 1,005 | 58.4% |
| Renter-Occupied Housing Units | 716 | 41.6% |
| Total Occupied Housing Units | 1,721 | 100.0% |
Occupancy by Household Size in Valparaiso
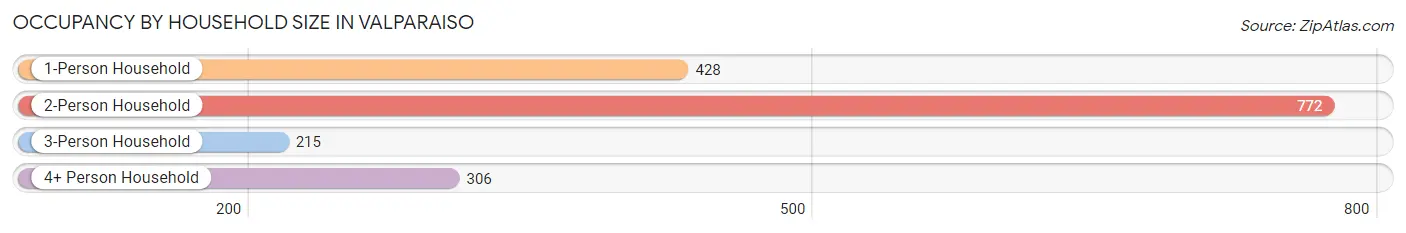
| Household Size | # Housing Units | % Housing Units |
| 1-Person Household | 428 | 24.9% |
| 2-Person Household | 772 | 44.9% |
| 3-Person Household | 215 | 12.5% |
| 4+ Person Household | 306 | 17.8% |
| Total Housing Units | 1,721 | 100.0% |
Occupancy by Ownership by Household Size in Valparaiso
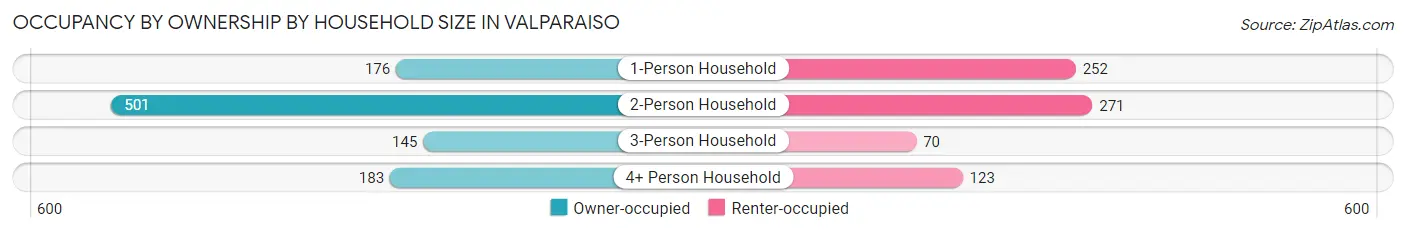
| Household Size | Owner-occupied | Renter-occupied |
| 1-Person Household | 176 (41.1%) | 252 (58.9%) |
| 2-Person Household | 501 (64.9%) | 271 (35.1%) |
| 3-Person Household | 145 (67.4%) | 70 (32.6%) |
| 4+ Person Household | 183 (59.8%) | 123 (40.2%) |
| Total Housing Units | 1,005 (58.4%) | 716 (41.6%) |
Occupancy by Educational Attainment in Valparaiso
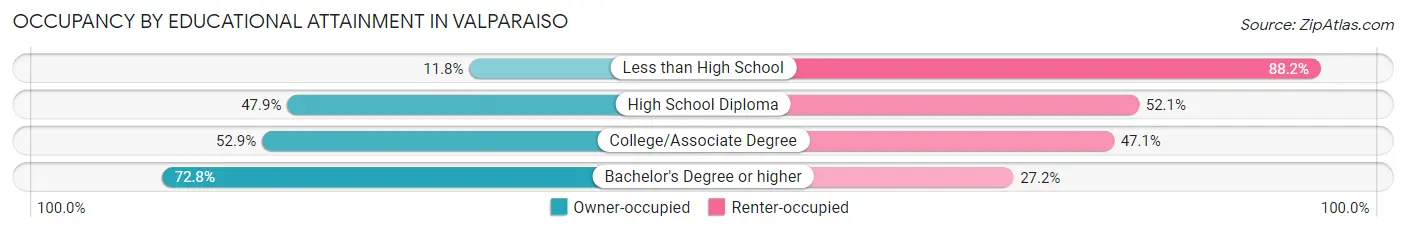
| Household Size | Owner-occupied | Renter-occupied |
| Less than High School | 9 (11.8%) | 67 (88.2%) |
| High School Diploma | 139 (47.9%) | 151 (52.1%) |
| College/Associate Degree | 345 (52.9%) | 307 (47.1%) |
| Bachelor's Degree or higher | 512 (72.8%) | 191 (27.2%) |
Occupancy by Age of Householder in Valparaiso
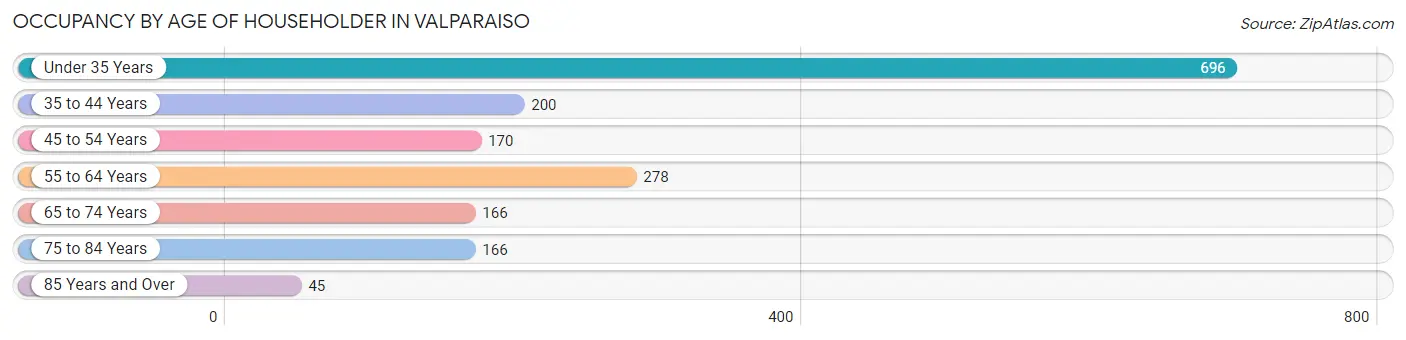
| Age Bracket | # Households | % Households |
| Under 35 Years | 696 | 40.4% |
| 35 to 44 Years | 200 | 11.6% |
| 45 to 54 Years | 170 | 9.9% |
| 55 to 64 Years | 278 | 16.2% |
| 65 to 74 Years | 166 | 9.7% |
| 75 to 84 Years | 166 | 9.7% |
| 85 Years and Over | 45 | 2.6% |
| Total | 1,721 | 100.0% |
Housing Finances in Valparaiso
Median Income by Occupancy in Valparaiso
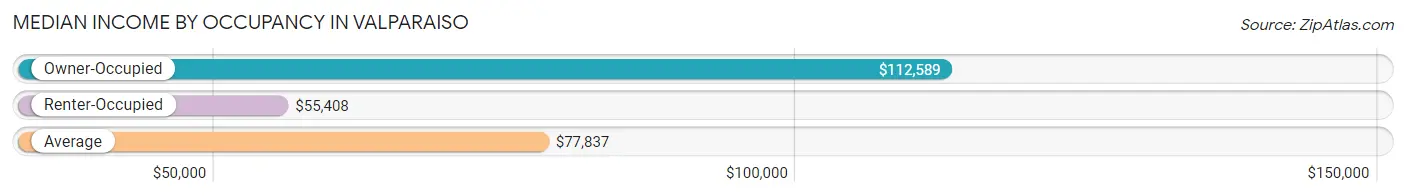
| Occupancy Type | # Households | Median Income |
| Owner-Occupied | 1,005 (58.4%) | $112,589 |
| Renter-Occupied | 716 (41.6%) | $55,408 |
| Average | 1,721 (100.0%) | $77,837 |
Occupancy by Householder Income Bracket in Valparaiso
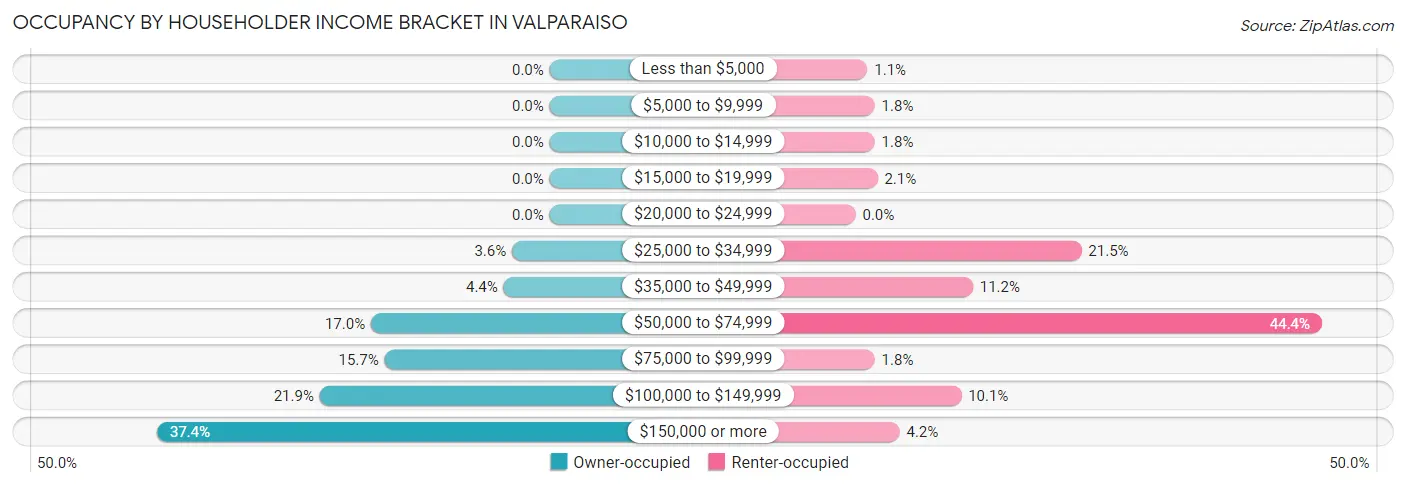
| Income Bracket | Owner-occupied | Renter-occupied |
| Less than $5,000 | 0 (0.0%) | 8 (1.1%) |
| $5,000 to $9,999 | 0 (0.0%) | 13 (1.8%) |
| $10,000 to $14,999 | 0 (0.0%) | 13 (1.8%) |
| $15,000 to $19,999 | 0 (0.0%) | 15 (2.1%) |
| $20,000 to $24,999 | 0 (0.0%) | 0 (0.0%) |
| $25,000 to $34,999 | 36 (3.6%) | 154 (21.5%) |
| $35,000 to $49,999 | 44 (4.4%) | 80 (11.2%) |
| $50,000 to $74,999 | 171 (17.0%) | 318 (44.4%) |
| $75,000 to $99,999 | 158 (15.7%) | 13 (1.8%) |
| $100,000 to $149,999 | 220 (21.9%) | 72 (10.1%) |
| $150,000 or more | 376 (37.4%) | 30 (4.2%) |
| Total | 1,005 (100.0%) | 716 (100.0%) |
Monthly Housing Cost Tiers in Valparaiso
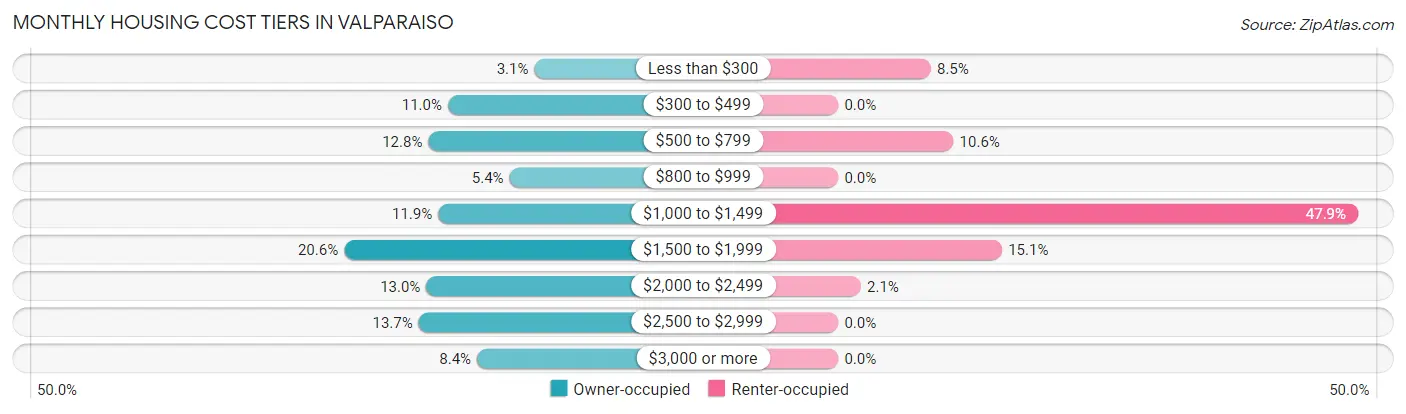
| Monthly Cost | Owner-occupied | Renter-occupied |
| Less than $300 | 31 (3.1%) | 61 (8.5%) |
| $300 to $499 | 111 (11.0%) | 0 (0.0%) |
| $500 to $799 | 129 (12.8%) | 76 (10.6%) |
| $800 to $999 | 54 (5.4%) | 0 (0.0%) |
| $1,000 to $1,499 | 120 (11.9%) | 343 (47.9%) |
| $1,500 to $1,999 | 207 (20.6%) | 108 (15.1%) |
| $2,000 to $2,499 | 131 (13.0%) | 15 (2.1%) |
| $2,500 to $2,999 | 138 (13.7%) | 0 (0.0%) |
| $3,000 or more | 84 (8.4%) | 0 (0.0%) |
| Total | 1,005 (100.0%) | 716 (100.0%) |
Physical Housing Characteristics in Valparaiso
Housing Structures in Valparaiso
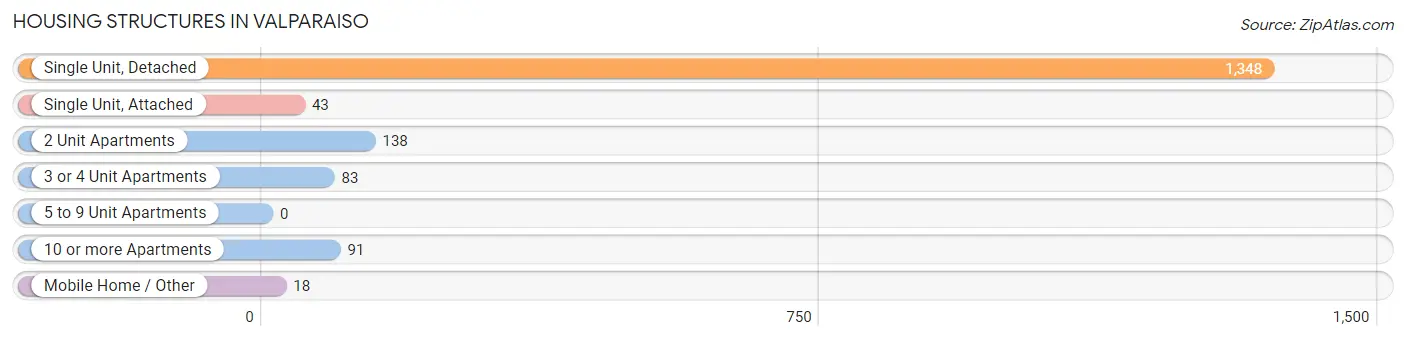
| Structure Type | # Housing Units | % Housing Units |
| Single Unit, Detached | 1,348 | 78.3% |
| Single Unit, Attached | 43 | 2.5% |
| 2 Unit Apartments | 138 | 8.0% |
| 3 or 4 Unit Apartments | 83 | 4.8% |
| 5 to 9 Unit Apartments | 0 | 0.0% |
| 10 or more Apartments | 91 | 5.3% |
| Mobile Home / Other | 18 | 1.1% |
| Total | 1,721 | 100.0% |
Housing Structures by Occupancy in Valparaiso
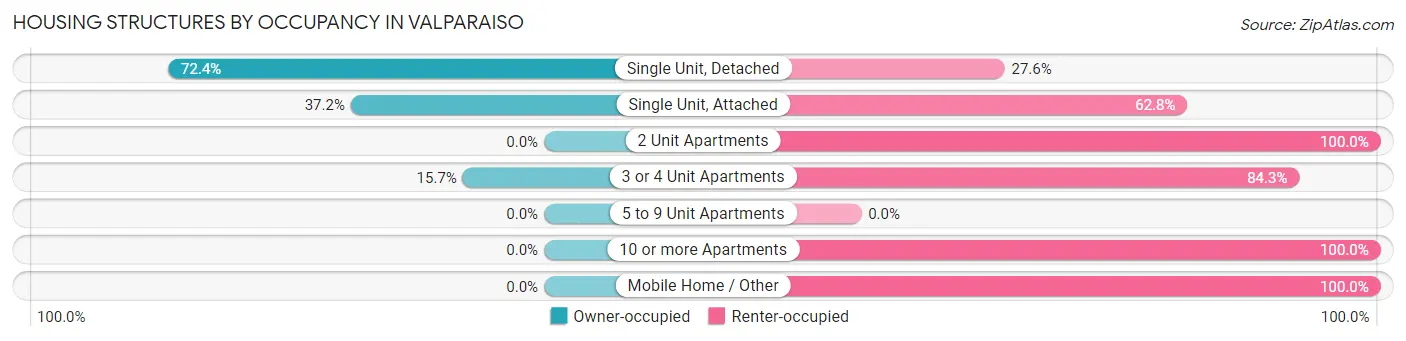
| Structure Type | Owner-occupied | Renter-occupied |
| Single Unit, Detached | 976 (72.4%) | 372 (27.6%) |
| Single Unit, Attached | 16 (37.2%) | 27 (62.8%) |
| 2 Unit Apartments | 0 (0.0%) | 138 (100.0%) |
| 3 or 4 Unit Apartments | 13 (15.7%) | 70 (84.3%) |
| 5 to 9 Unit Apartments | 0 (0.0%) | 0 (0.0%) |
| 10 or more Apartments | 0 (0.0%) | 91 (100.0%) |
| Mobile Home / Other | 0 (0.0%) | 18 (100.0%) |
| Total | 1,005 (58.4%) | 716 (41.6%) |
Housing Structures by Number of Rooms in Valparaiso
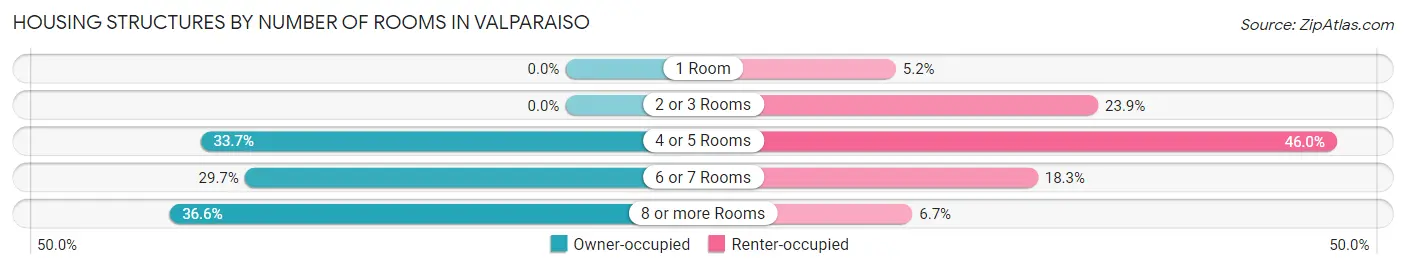
| Number of Rooms | Owner-occupied | Renter-occupied |
| 1 Room | 0 (0.0%) | 37 (5.2%) |
| 2 or 3 Rooms | 0 (0.0%) | 171 (23.9%) |
| 4 or 5 Rooms | 339 (33.7%) | 329 (46.0%) |
| 6 or 7 Rooms | 298 (29.6%) | 131 (18.3%) |
| 8 or more Rooms | 368 (36.6%) | 48 (6.7%) |
| Total | 1,005 (100.0%) | 716 (100.0%) |
Housing Structure by Heating Type in Valparaiso
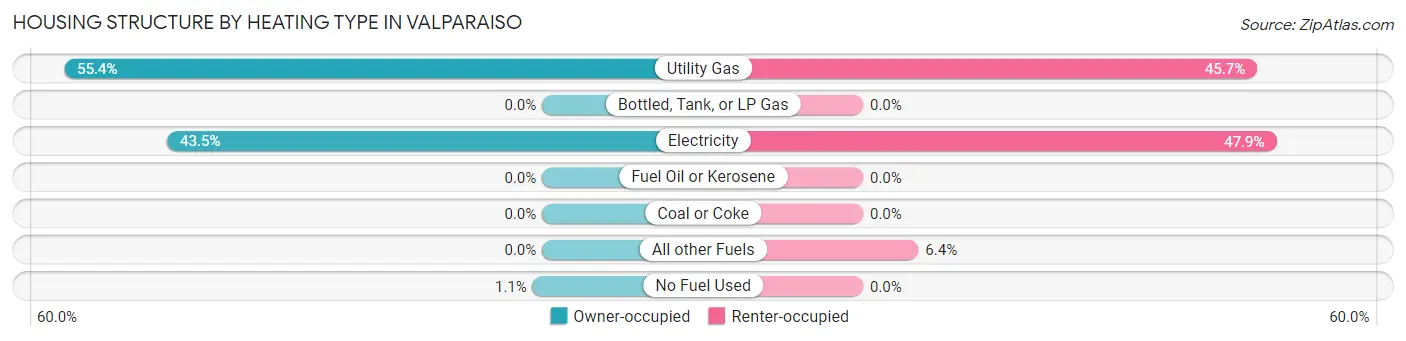
| Heating Type | Owner-occupied | Renter-occupied |
| Utility Gas | 557 (55.4%) | 327 (45.7%) |
| Bottled, Tank, or LP Gas | 0 (0.0%) | 0 (0.0%) |
| Electricity | 437 (43.5%) | 343 (47.9%) |
| Fuel Oil or Kerosene | 0 (0.0%) | 0 (0.0%) |
| Coal or Coke | 0 (0.0%) | 0 (0.0%) |
| All other Fuels | 0 (0.0%) | 46 (6.4%) |
| No Fuel Used | 11 (1.1%) | 0 (0.0%) |
| Total | 1,005 (100.0%) | 716 (100.0%) |
Household Vehicle Usage in Valparaiso
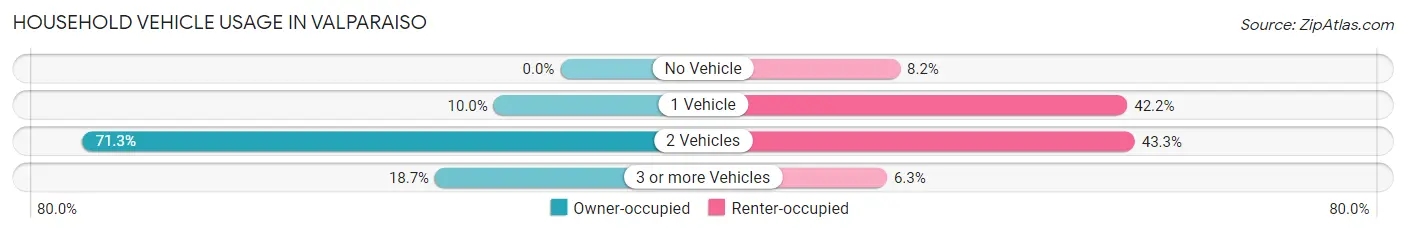
| Vehicles per Household | Owner-occupied | Renter-occupied |
| No Vehicle | 0 (0.0%) | 59 (8.2%) |
| 1 Vehicle | 100 (10.0%) | 302 (42.2%) |
| 2 Vehicles | 717 (71.3%) | 310 (43.3%) |
| 3 or more Vehicles | 188 (18.7%) | 45 (6.3%) |
| Total | 1,005 (100.0%) | 716 (100.0%) |
Real Estate & Mortgages in Valparaiso
Real Estate and Mortgage Overview in Valparaiso
| Characteristic | Without Mortgage | With Mortgage |
| Housing Units | 344 | 661 |
| Median Property Value | $300,000 | $343,200 |
| Median Household Income | $85,577 | $292 |
| Monthly Housing Costs | $567 | $71 |
| Real Estate Taxes | $1,756 | $0 |
Property Value by Mortgage Status in Valparaiso
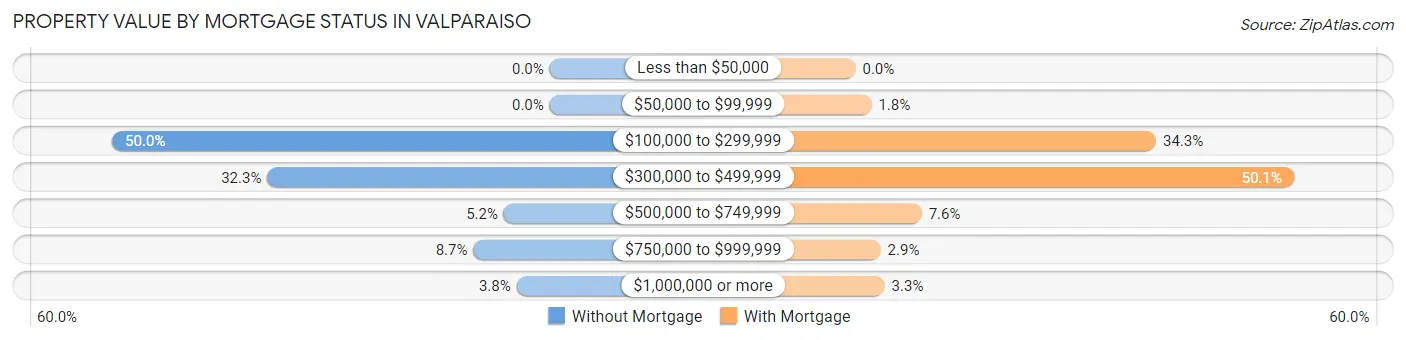
| Property Value | Without Mortgage | With Mortgage |
| Less than $50,000 | 0 (0.0%) | 0 (0.0%) |
| $50,000 to $99,999 | 0 (0.0%) | 12 (1.8%) |
| $100,000 to $299,999 | 172 (50.0%) | 227 (34.3%) |
| $300,000 to $499,999 | 111 (32.3%) | 331 (50.1%) |
| $500,000 to $749,999 | 18 (5.2%) | 50 (7.6%) |
| $750,000 to $999,999 | 30 (8.7%) | 19 (2.9%) |
| $1,000,000 or more | 13 (3.8%) | 22 (3.3%) |
| Total | 344 (100.0%) | 661 (100.0%) |
Household Income by Mortgage Status in Valparaiso
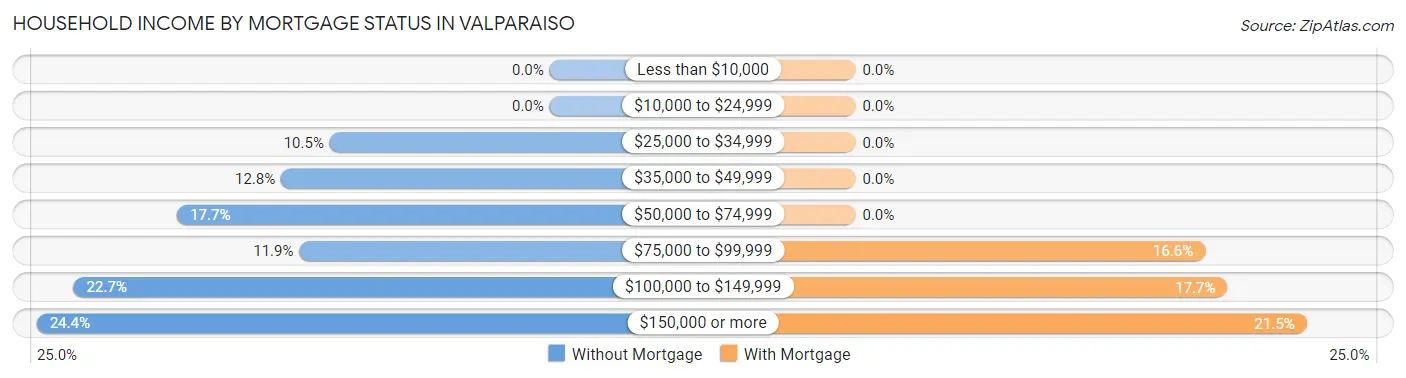
| Household Income | Without Mortgage | With Mortgage |
| Less than $10,000 | 0 (0.0%) | 0 (0.0%) |
| $10,000 to $24,999 | 0 (0.0%) | 0 (0.0%) |
| $25,000 to $34,999 | 36 (10.5%) | 0 (0.0%) |
| $35,000 to $49,999 | 44 (12.8%) | 0 (0.0%) |
| $50,000 to $74,999 | 61 (17.7%) | 0 (0.0%) |
| $75,000 to $99,999 | 41 (11.9%) | 110 (16.6%) |
| $100,000 to $149,999 | 78 (22.7%) | 117 (17.7%) |
| $150,000 or more | 84 (24.4%) | 142 (21.5%) |
| Total | 344 (100.0%) | 661 (100.0%) |
Property Value to Household Income Ratio in Valparaiso
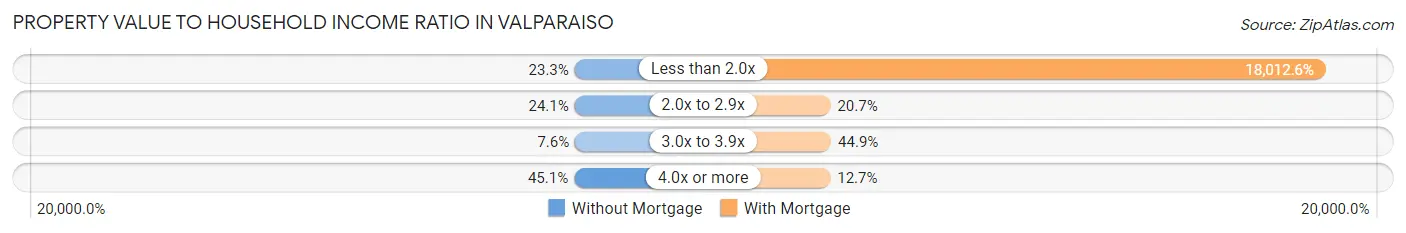
| Value-to-Income Ratio | Without Mortgage | With Mortgage |
| Less than 2.0x | 80 (23.3%) | 119,063 (18,012.6%) |
| 2.0x to 2.9x | 83 (24.1%) | 137 (20.7%) |
| 3.0x to 3.9x | 26 (7.6%) | 297 (44.9%) |
| 4.0x or more | 155 (45.1%) | 84 (12.7%) |
| Total | 344 (100.0%) | 661 (100.0%) |
Real Estate Taxes by Mortgage Status in Valparaiso
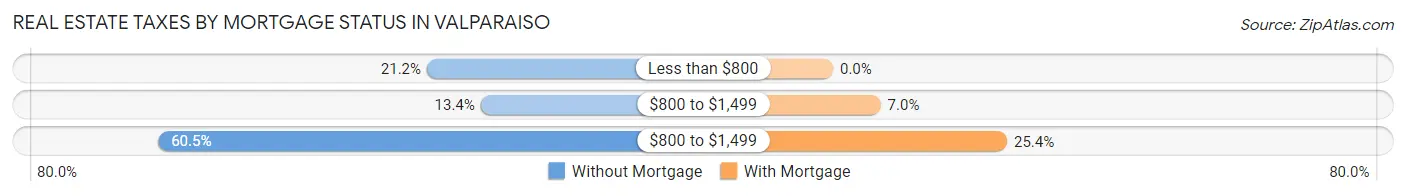
| Property Taxes | Without Mortgage | With Mortgage |
| Less than $800 | 73 (21.2%) | 0 (0.0%) |
| $800 to $1,499 | 46 (13.4%) | 46 (7.0%) |
| $800 to $1,499 | 208 (60.5%) | 168 (25.4%) |
| Total | 344 (100.0%) | 661 (100.0%) |
Health & Disability in Valparaiso
Health Insurance Coverage by Age in Valparaiso
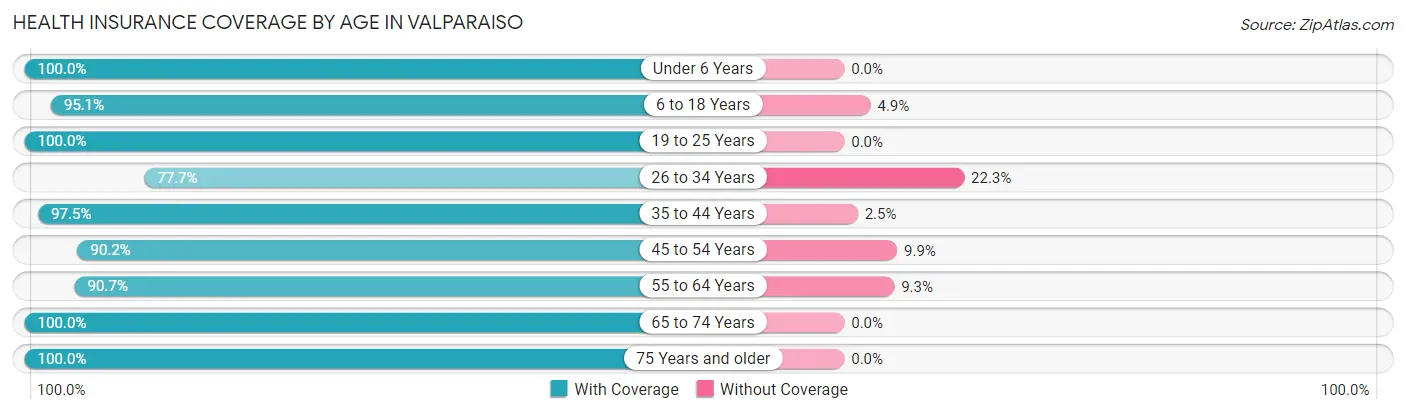
| Age Bracket | With Coverage | Without Coverage |
| Under 6 Years | 248 (100.0%) | 0 (0.0%) |
| 6 to 18 Years | 739 (95.1%) | 38 (4.9%) |
| 19 to 25 Years | 298 (100.0%) | 0 (0.0%) |
| 26 to 34 Years | 605 (77.7%) | 174 (22.3%) |
| 35 to 44 Years | 234 (97.5%) | 6 (2.5%) |
| 45 to 54 Years | 238 (90.1%) | 26 (9.9%) |
| 55 to 64 Years | 458 (90.7%) | 47 (9.3%) |
| 65 to 74 Years | 279 (100.0%) | 0 (0.0%) |
| 75 Years and older | 363 (100.0%) | 0 (0.0%) |
| Total | 3,462 (92.2%) | 291 (7.7%) |
Health Insurance Coverage by Citizenship Status in Valparaiso

| Citizenship Status | With Coverage | Without Coverage |
| Native Born | 248 (100.0%) | 0 (0.0%) |
| Foreign Born, Citizen | 739 (95.1%) | 38 (4.9%) |
| Foreign Born, not a Citizen | 298 (100.0%) | 0 (0.0%) |
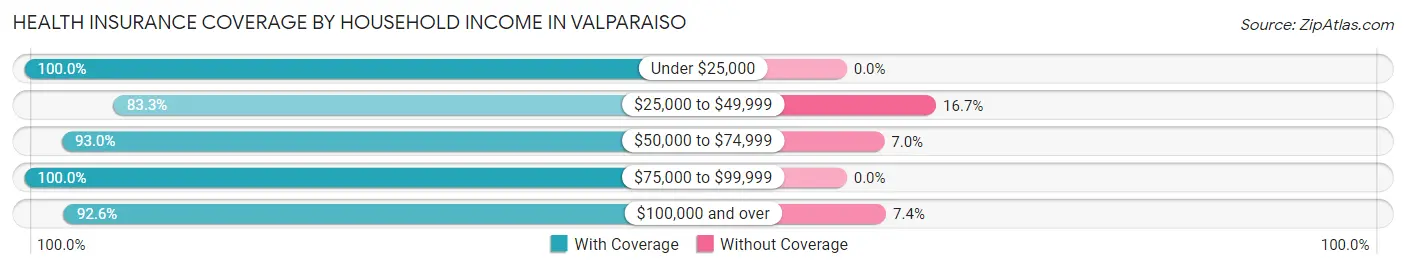
Health Insurance Coverage by Household Income in Valparaiso
| Household Income | With Coverage | Without Coverage |
| Under $25,000 | 34 (100.0%) | 0 (0.0%) |
| $25,000 to $49,999 | 567 (83.3%) | 114 (16.7%) |
| $50,000 to $74,999 | 966 (93.0%) | 73 (7.0%) |
| $75,000 to $99,999 | 588 (100.0%) | 0 (0.0%) |
| $100,000 and over | 1,307 (92.6%) | 104 (7.4%) |
Public vs Private Health Insurance Coverage by Age in Valparaiso
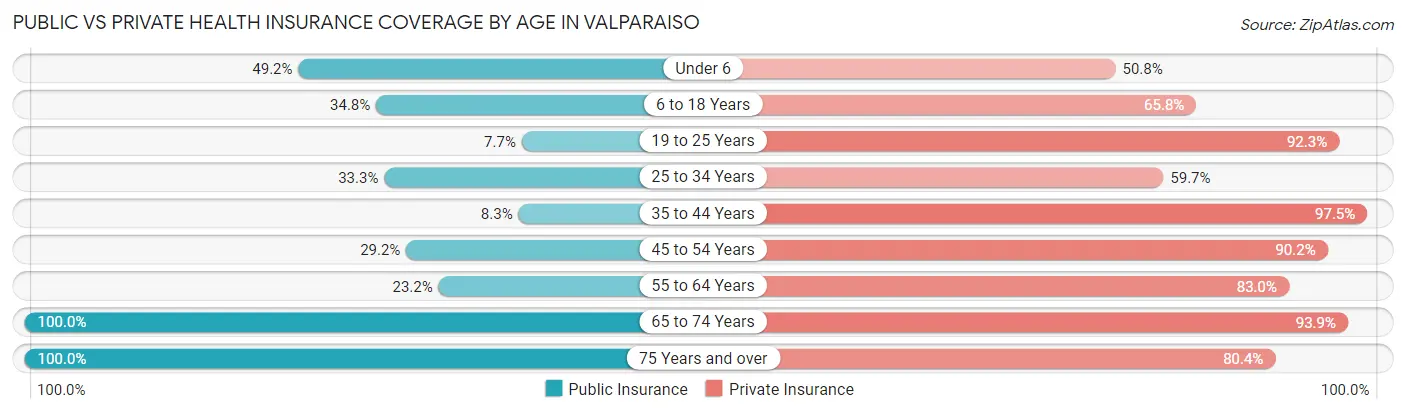
| Age Bracket | Public Insurance | Private Insurance |
| Under 6 | 122 (49.2%) | 126 (50.8%) |
| 6 to 18 Years | 270 (34.7%) | 511 (65.8%) |
| 19 to 25 Years | 23 (7.7%) | 275 (92.3%) |
| 25 to 34 Years | 259 (33.3%) | 465 (59.7%) |
| 35 to 44 Years | 20 (8.3%) | 234 (97.5%) |
| 45 to 54 Years | 77 (29.2%) | 238 (90.1%) |
| 55 to 64 Years | 117 (23.2%) | 419 (83.0%) |
| 65 to 74 Years | 279 (100.0%) | 262 (93.9%) |
| 75 Years and over | 363 (100.0%) | 292 (80.4%) |
| Total | 1,530 (40.8%) | 2,822 (75.2%) |
Disability Status by Sex by Age in Valparaiso
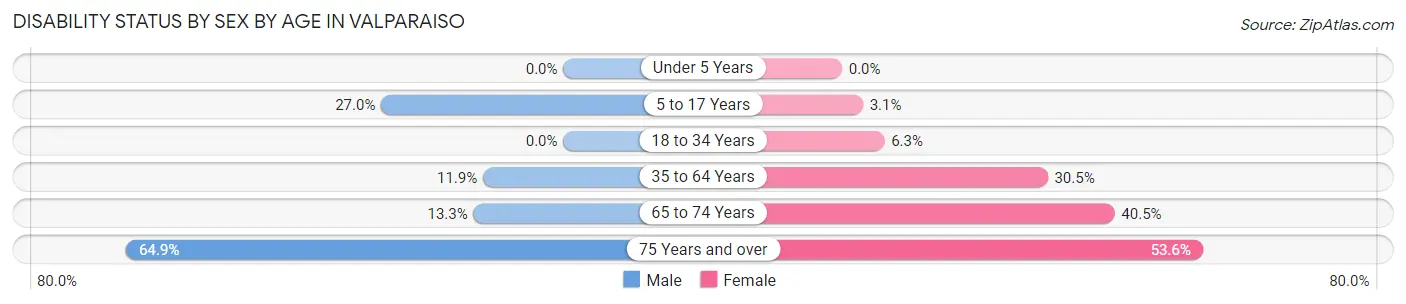
| Age Bracket | Male | Female |
| Under 5 Years | 0 (0.0%) | 0 (0.0%) |
| 5 to 17 Years | 106 (27.0%) | 13 (3.1%) |
| 18 to 34 Years | 0 (0.0%) | 38 (6.3%) |
| 35 to 64 Years | 52 (11.9%) | 175 (30.5%) |
| 65 to 74 Years | 26 (13.3%) | 34 (40.5%) |
| 75 Years and over | 100 (64.9%) | 112 (53.6%) |
Disability Class by Sex by Age in Valparaiso
Disability Class: Hearing Difficulty
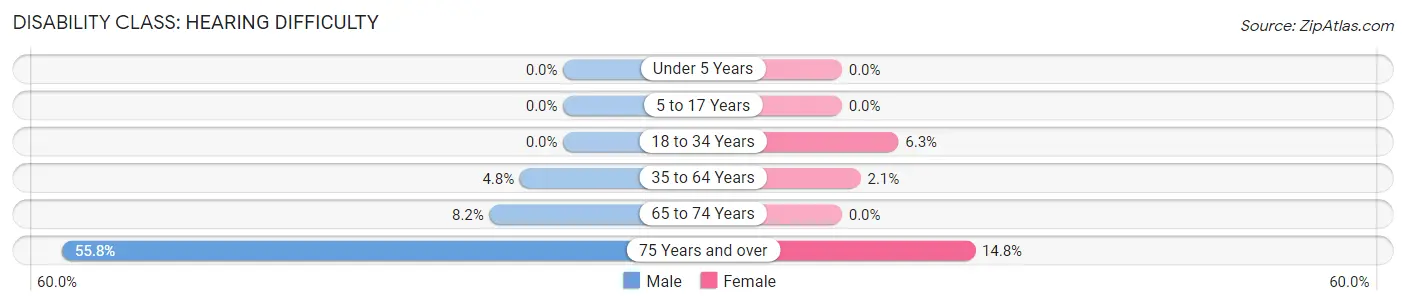
| Age Bracket | Male | Female |
| Under 5 Years | 0 (0.0%) | 0 (0.0%) |
| 5 to 17 Years | 0 (0.0%) | 0 (0.0%) |
| 18 to 34 Years | 0 (0.0%) | 38 (6.3%) |
| 35 to 64 Years | 21 (4.8%) | 12 (2.1%) |
| 65 to 74 Years | 16 (8.2%) | 0 (0.0%) |
| 75 Years and over | 86 (55.8%) | 31 (14.8%) |
Disability Class: Vision Difficulty
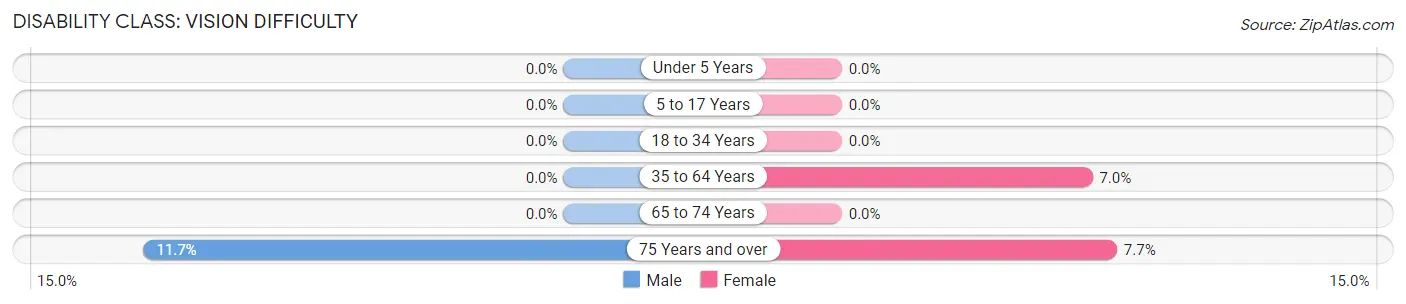
| Age Bracket | Male | Female |
| Under 5 Years | 0 (0.0%) | 0 (0.0%) |
| 5 to 17 Years | 0 (0.0%) | 0 (0.0%) |
| 18 to 34 Years | 0 (0.0%) | 0 (0.0%) |
| 35 to 64 Years | 0 (0.0%) | 40 (7.0%) |
| 65 to 74 Years | 0 (0.0%) | 0 (0.0%) |
| 75 Years and over | 18 (11.7%) | 16 (7.7%) |
Disability Class: Cognitive Difficulty
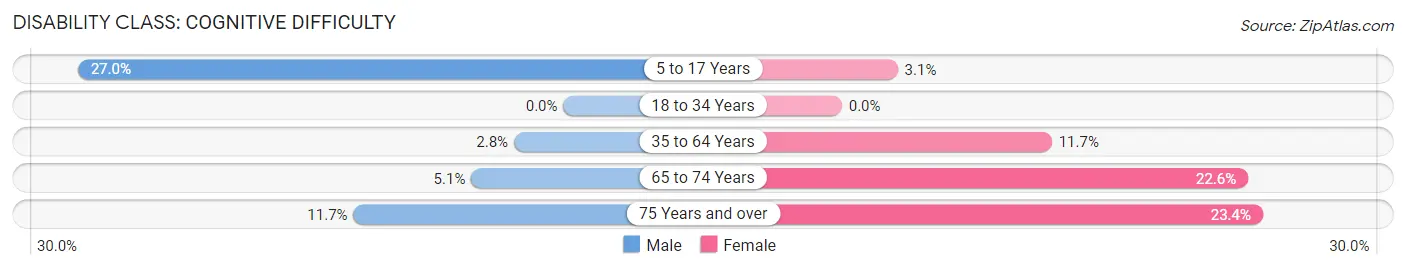
| Age Bracket | Male | Female |
| 5 to 17 Years | 106 (27.0%) | 13 (3.1%) |
| 18 to 34 Years | 0 (0.0%) | 0 (0.0%) |
| 35 to 64 Years | 12 (2.8%) | 67 (11.7%) |
| 65 to 74 Years | 10 (5.1%) | 19 (22.6%) |
| 75 Years and over | 18 (11.7%) | 49 (23.4%) |
Disability Class: Ambulatory Difficulty
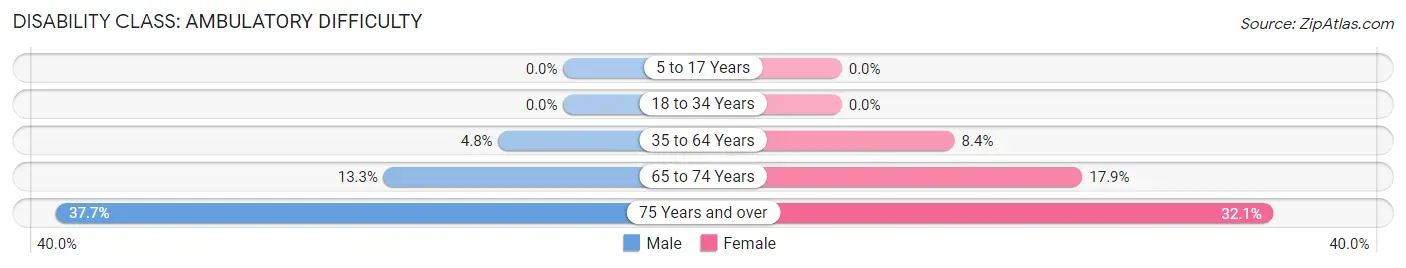
| Age Bracket | Male | Female |
| 5 to 17 Years | 0 (0.0%) | 0 (0.0%) |
| 18 to 34 Years | 0 (0.0%) | 0 (0.0%) |
| 35 to 64 Years | 21 (4.8%) | 48 (8.4%) |
| 65 to 74 Years | 26 (13.3%) | 15 (17.9%) |
| 75 Years and over | 58 (37.7%) | 67 (32.1%) |
Disability Class: Self-Care Difficulty
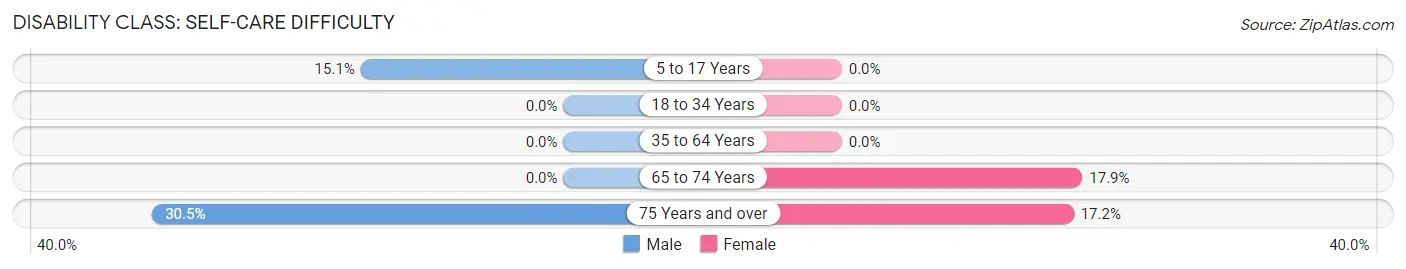
| Age Bracket | Male | Female |
| 5 to 17 Years | 59 (15.0%) | 0 (0.0%) |
| 18 to 34 Years | 0 (0.0%) | 0 (0.0%) |
| 35 to 64 Years | 0 (0.0%) | 0 (0.0%) |
| 65 to 74 Years | 0 (0.0%) | 15 (17.9%) |
| 75 Years and over | 47 (30.5%) | 36 (17.2%) |
Technology Access in Valparaiso
Computing Device Access in Valparaiso
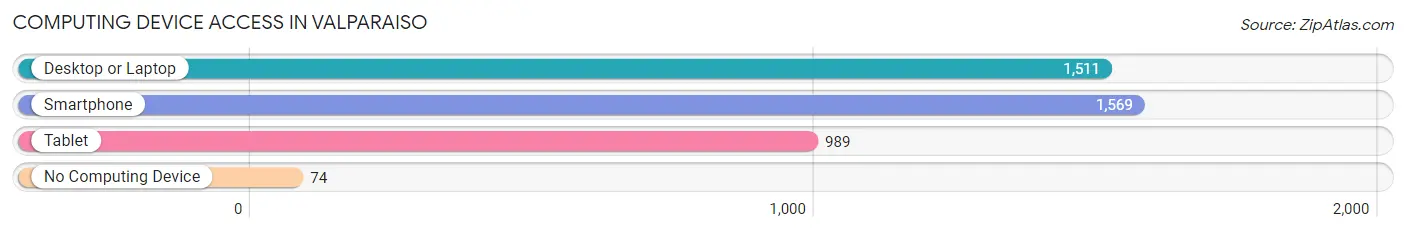
| Device Type | # Households | % Households |
| Desktop or Laptop | 1,511 | 87.8% |
| Smartphone | 1,569 | 91.2% |
| Tablet | 989 | 57.5% |
| No Computing Device | 74 | 4.3% |
| Total | 1,721 | 100.0% |
Internet Access in Valparaiso
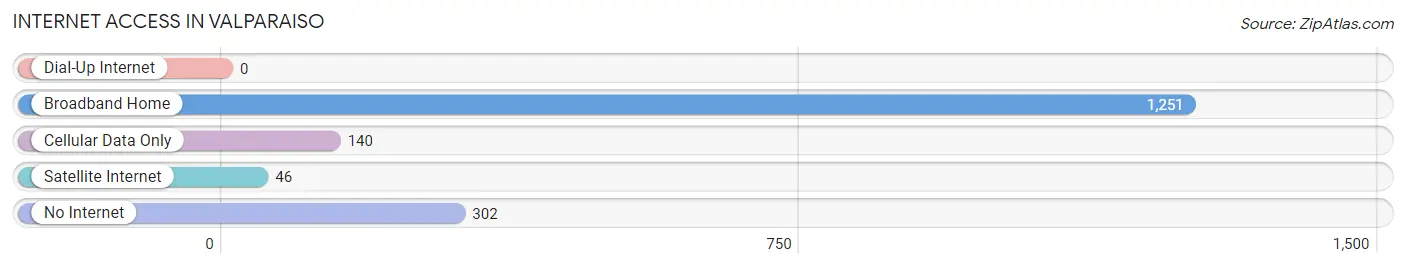
| Internet Type | # Households | % Households |
| Dial-Up Internet | 0 | 0.0% |
| Broadband Home | 1,251 | 72.7% |
| Cellular Data Only | 140 | 8.1% |
| Satellite Internet | 46 | 2.7% |
| No Internet | 302 | 17.5% |
| Total | 1,721 | 100.0% |
Valparaiso Summary
Valparaiso, Florida is a small city located in Okaloosa County, in the Florida Panhandle. It is situated on the Choctawhatchee Bay, and is part of the Fort Walton Beach-Crestview-Destin Metropolitan Statistical Area. Valparaiso is known for its small-town charm and its proximity to the beaches of the Emerald Coast.
History
Valparaiso was first settled in the late 19th century by a group of settlers from the nearby town of Niceville. The town was originally known as “Valparaiso Station”, and was named after the city of Valparaiso, Chile. The town was officially incorporated in 1925, and the name was changed to Valparaiso.
In the early 20th century, Valparaiso was a thriving agricultural community, with a large citrus industry. The town was also home to a number of sawmills and lumber companies. In the 1950s, the town began to experience a population boom, as people moved to the area to take advantage of the booming economy.
Geography
Valparaiso is located in the Florida Panhandle, in Okaloosa County. It is situated on the Choctawhatchee Bay, and is part of the Fort Walton Beach-Crestview-Destin Metropolitan Statistical Area. The city covers an area of 8.3 square miles, and has a population of approximately 5,000 people.
The city is located near the Gulf of Mexico, and is surrounded by a number of beaches and parks. The city is also home to a number of lakes, including Lake Valparaiso, Lake Stanley, and Lake Powell.
Economy
Valparaiso’s economy is largely based on tourism and the service industry. The city is home to a number of hotels, restaurants, and other businesses that cater to tourists. The city is also home to a number of manufacturing and industrial businesses, including a paper mill and a chemical plant.
The city is also home to a number of military installations, including Eglin Air Force Base and Hurlburt Field. These installations provide a significant number of jobs to the local economy.
Demographics
As of the 2010 census, Valparaiso had a population of 5,036 people. The racial makeup of the city was 79.3% White, 14.2% African American, 0.7% Native American, 0.7% Asian, 0.1% Pacific Islander, and 4.9% from other races. Hispanic or Latino of any race were 8.3% of the population.
The median household income in Valparaiso was $41,945, and the median family income was $50,945. The per capita income for the city was $20,945. About 11.2% of families and 14.2% of the population were below the poverty line, including 19.2% of those under age 18 and 8.2% of those age 65 or over.
Common Questions
What is Per Capita Income in Valparaiso?
Per Capita income in Valparaiso is $44,680.
What is the Median Family Income in Valparaiso?
Median Family Income in Valparaiso is $82,946.
What is the Median Household income in Valparaiso?
Median Household Income in Valparaiso is $77,837.
What is Income or Wage Gap in Valparaiso?
Income or Wage Gap in Valparaiso is 8.6%.
Women in Valparaiso earn 91.4 cents for every dollar earned by a man.
What is Inequality or Gini Index in Valparaiso?
Inequality or Gini Index in Valparaiso is 0.43.
What is the Total Population of Valparaiso?
Total Population of Valparaiso is 4,889.
What is the Total Male Population of Valparaiso?
Total Male Population of Valparaiso is 2,762.
What is the Total Female Population of Valparaiso?
Total Female Population of Valparaiso is 2,127.
What is the Ratio of Males per 100 Females in Valparaiso?
There are 129.85 Males per 100 Females in Valparaiso.
What is the Ratio of Females per 100 Males in Valparaiso?
There are 77.01 Females per 100 Males in Valparaiso.
What is the Median Population Age in Valparaiso?
Median Population Age in Valparaiso is 28.1 Years.
What is the Average Family Size in Valparaiso
Average Family Size in Valparaiso is 2.7 People.
What is the Average Household Size in Valparaiso
Average Household Size in Valparaiso is 2.4 People.
How Large is the Labor Force in Valparaiso?
There are 2,969 People in the Labor Forcein in Valparaiso.
What is the Percentage of People in the Labor Force in Valparaiso?
74.9% of People are in the Labor Force in Valparaiso.
What is the Unemployment Rate in Valparaiso?
Unemployment Rate in Valparaiso is 3.0%.