Titusville, FL Map & Demographics
Titusville Map
Titusville Overview
$31,887
PER CAPITA INCOME
$74,410
AVG FAMILY INCOME
$56,700
AVG HOUSEHOLD INCOME
35.8%
WAGE / INCOME GAP [ % ]
64.2¢/ $1
WAGE / INCOME GAP [ $ ]
$8,218
FAMILY INCOME DEFICIT
0.42
INEQUALITY / GINI INDEX
48,595
TOTAL POPULATION
22,820
MALE POPULATION
25,775
FEMALE POPULATION
88.54
MALES / 100 FEMALES
112.95
FEMALES / 100 MALES
43.7
MEDIAN AGE
3.1
AVG FAMILY SIZE
2.4
AVG HOUSEHOLD SIZE
22,288
LABOR FORCE [ PEOPLE ]
55.0%
PERCENT IN LABOR FORCE
6.2%
UNEMPLOYMENT RATE
Titusville Area Codes
Income in Titusville
Income Overview in Titusville
Per Capita Income in Titusville is $31,887, while median incomes of families and households are $74,410 and $56,700 respectively.
| Characteristic | Number | Measure |
| Per Capita Income | 48,595 | $31,887 |
| Median Family Income | 11,690 | $74,410 |
| Mean Family Income | 11,690 | $87,492 |
| Median Household Income | 19,883 | $56,700 |
| Mean Household Income | 19,883 | $74,331 |
| Income Deficit | 11,690 | $8,218 |
| Wage / Income Gap (%) | 48,595 | 35.76% |
| Wage / Income Gap ($) | 48,595 | 64.24¢ per $1 |
| Gini / Inequality Index | 48,595 | 0.42 |
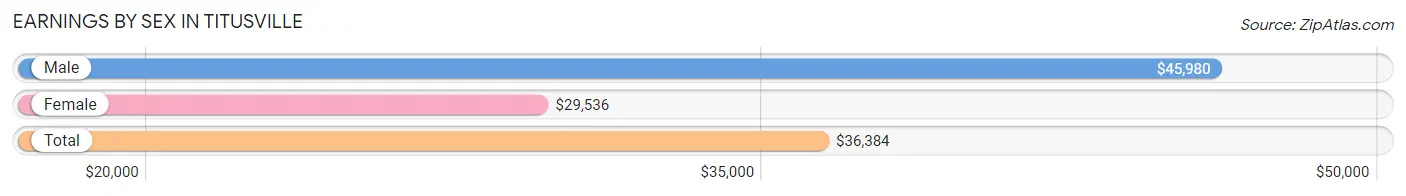
Earnings by Sex in Titusville
Average Earnings in Titusville are $36,384, $45,980 for men and $29,536 for women, a difference of 35.8%.
| Sex | Number | Average Earnings |
| Male | 11,502 (50.0%) | $45,980 |
| Female | 11,515 (50.0%) | $29,536 |
| Total | 23,017 (100.0%) | $36,384 |
Earnings by Sex by Income Bracket in Titusville
The most common earnings brackets in Titusville are $100,000+ for men (1,436 | 12.5%) and $35,000 to $39,999 for women (1,056 | 9.2%).
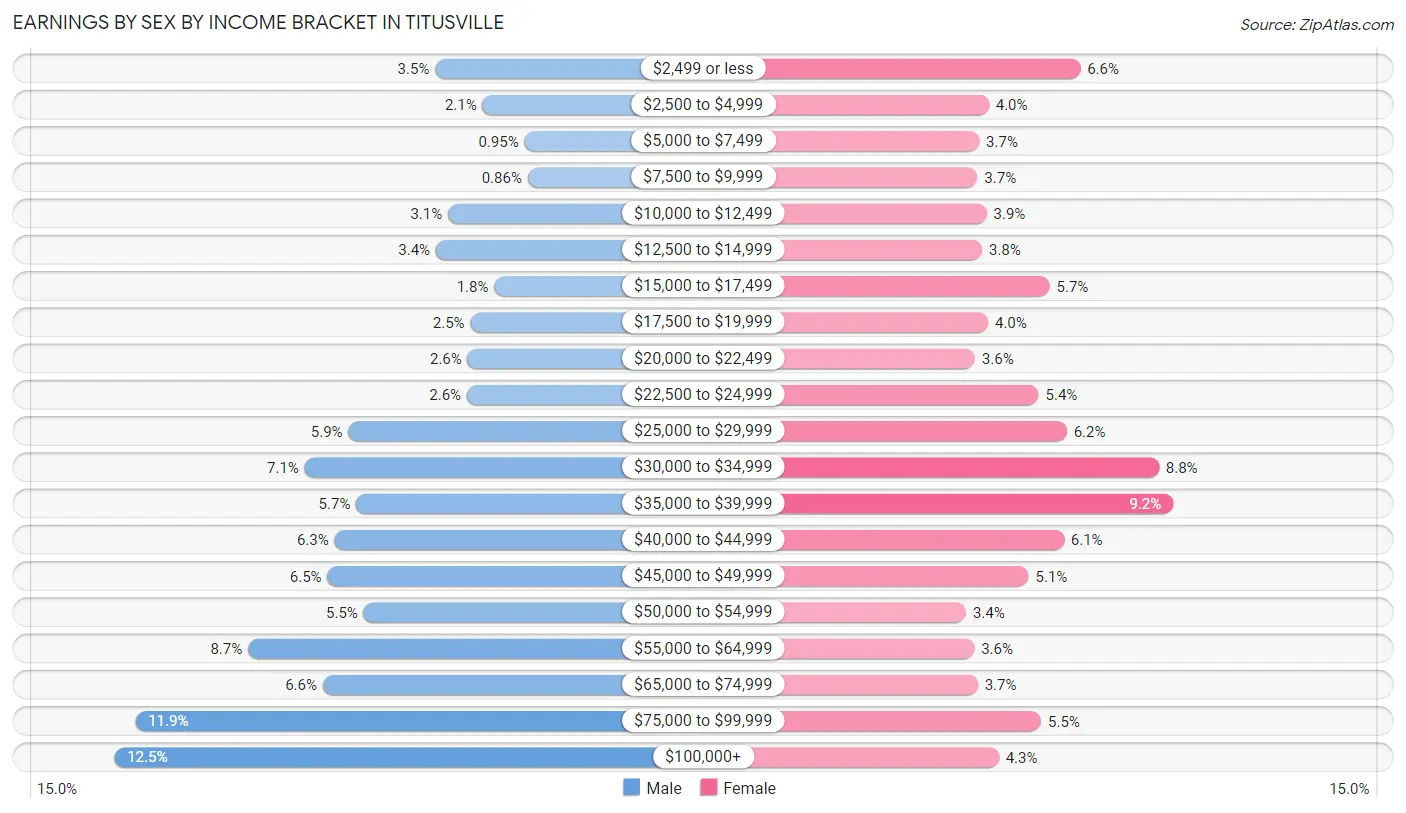
| Income | Male | Female |
| $2,499 or less | 398 (3.5%) | 755 (6.6%) |
| $2,500 to $4,999 | 245 (2.1%) | 459 (4.0%) |
| $5,000 to $7,499 | 109 (0.9%) | 428 (3.7%) |
| $7,500 to $9,999 | 99 (0.9%) | 423 (3.7%) |
| $10,000 to $12,499 | 356 (3.1%) | 453 (3.9%) |
| $12,500 to $14,999 | 396 (3.4%) | 437 (3.8%) |
| $15,000 to $17,499 | 207 (1.8%) | 656 (5.7%) |
| $17,500 to $19,999 | 284 (2.5%) | 457 (4.0%) |
| $20,000 to $22,499 | 293 (2.5%) | 415 (3.6%) |
| $22,500 to $24,999 | 296 (2.6%) | 621 (5.4%) |
| $25,000 to $29,999 | 679 (5.9%) | 712 (6.2%) |
| $30,000 to $34,999 | 820 (7.1%) | 1,010 (8.8%) |
| $35,000 to $39,999 | 653 (5.7%) | 1,056 (9.2%) |
| $40,000 to $44,999 | 724 (6.3%) | 702 (6.1%) |
| $45,000 to $49,999 | 746 (6.5%) | 588 (5.1%) |
| $50,000 to $54,999 | 629 (5.5%) | 386 (3.4%) |
| $55,000 to $64,999 | 1,003 (8.7%) | 412 (3.6%) |
| $65,000 to $74,999 | 761 (6.6%) | 424 (3.7%) |
| $75,000 to $99,999 | 1,368 (11.9%) | 629 (5.5%) |
| $100,000+ | 1,436 (12.5%) | 492 (4.3%) |
| Total | 11,502 (100.0%) | 11,515 (100.0%) |
Earnings by Sex by Educational Attainment in Titusville
Average earnings in Titusville are $50,114 for men and $33,079 for women, a difference of 34.0%. Men with an educational attainment of graduate degree enjoy the highest average annual earnings of $87,500, while those with high school diploma education earn the least with $42,517. Women with an educational attainment of graduate degree earn the most with the average annual earnings of $53,413, while those with less than high school education have the smallest earnings of $23,000.
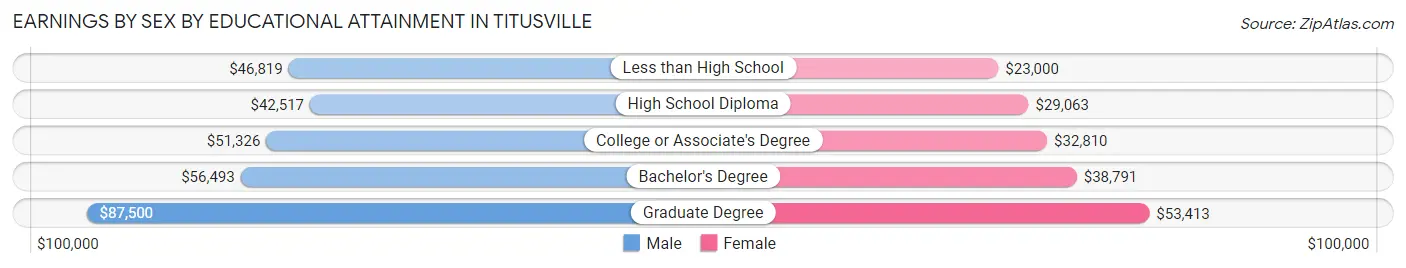
| Educational Attainment | Male Income | Female Income |
| Less than High School | $46,819 | $23,000 |
| High School Diploma | $42,517 | $29,063 |
| College or Associate's Degree | $51,326 | $32,810 |
| Bachelor's Degree | $56,493 | $38,791 |
| Graduate Degree | $87,500 | $53,413 |
| Total | $50,114 | $33,079 |
Family Income in Titusville
Family Income Brackets in Titusville
According to the Titusville family income data, there are 2,174 families falling into the $100,000 to $149,999 income range, which is the most common income bracket and makes up 18.6% of all families. Conversely, the less than $10,000 income bracket is the least frequent group with only 281 families (2.4%) belonging to this category.
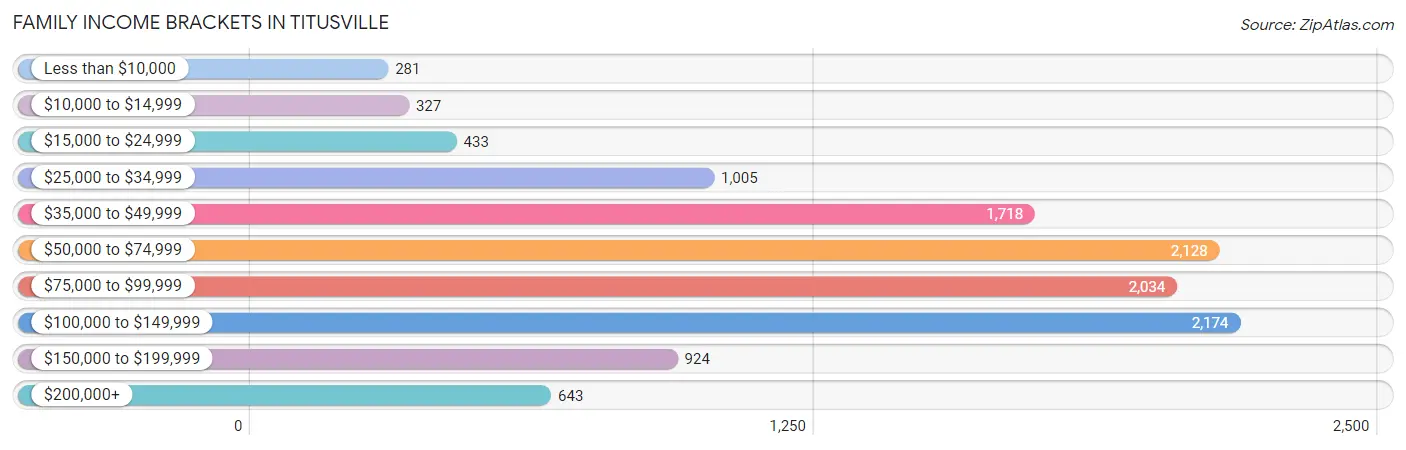
| Income Bracket | # Families | % Families |
| Less than $10,000 | 281 | 2.4% |
| $10,000 to $14,999 | 327 | 2.8% |
| $15,000 to $24,999 | 433 | 3.7% |
| $25,000 to $34,999 | 1,005 | 8.6% |
| $35,000 to $49,999 | 1,718 | 14.7% |
| $50,000 to $74,999 | 2,128 | 18.2% |
| $75,000 to $99,999 | 2,034 | 17.4% |
| $100,000 to $149,999 | 2,174 | 18.6% |
| $150,000 to $199,999 | 924 | 7.9% |
| $200,000+ | 643 | 5.5% |
Family Income by Famaliy Size in Titusville
7+ person families (103 | 0.9%) account for the highest median family income in Titusville with $165,739 per family, while 2-person families (6,372 | 54.5%) have the highest median income of $31,836 per family member.
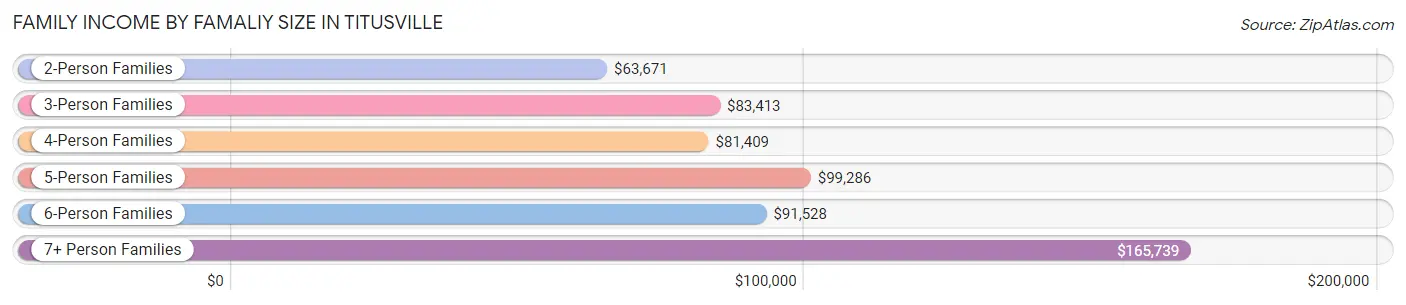
| Income Bracket | # Families | Median Income |
| 2-Person Families | 6,372 (54.5%) | $63,671 |
| 3-Person Families | 2,675 (22.9%) | $83,413 |
| 4-Person Families | 1,313 (11.2%) | $81,409 |
| 5-Person Families | 868 (7.4%) | $99,286 |
| 6-Person Families | 359 (3.1%) | $91,528 |
| 7+ Person Families | 103 (0.9%) | $165,739 |
| Total | 11,690 (100.0%) | $74,410 |
Family Income by Number of Earners in Titusville
The median family income in Titusville is $74,410, with families comprising 3+ earners (1,025) having the highest median family income of $121,055, while families with no earners (2,723) have the lowest median family income of $44,436, accounting for 8.8% and 23.3% of families, respectively.
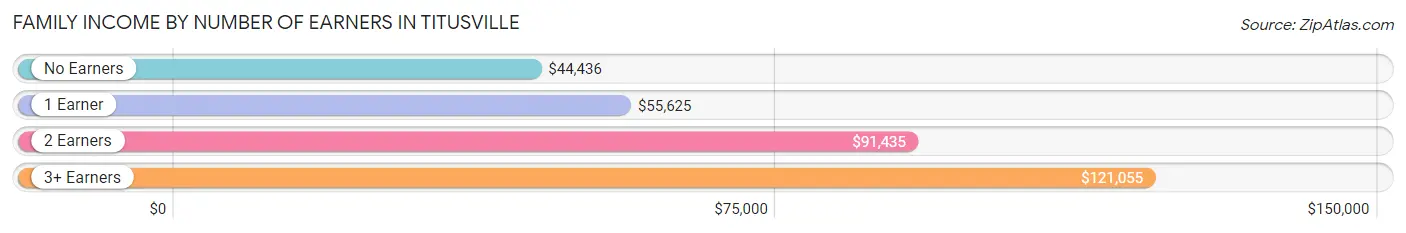
| Number of Earners | # Families | Median Income |
| No Earners | 2,723 (23.3%) | $44,436 |
| 1 Earner | 4,016 (34.4%) | $55,625 |
| 2 Earners | 3,926 (33.6%) | $91,435 |
| 3+ Earners | 1,025 (8.8%) | $121,055 |
| Total | 11,690 (100.0%) | $74,410 |
Household Income in Titusville
Household Income Brackets in Titusville
With 3,698 households falling in the category, the $50,000 to $74,999 income range is the most frequent in Titusville, accounting for 18.6% of all households. In contrast, only 835 households (4.2%) fall into the $10,000 to $14,999 income bracket, making it the least populous group.
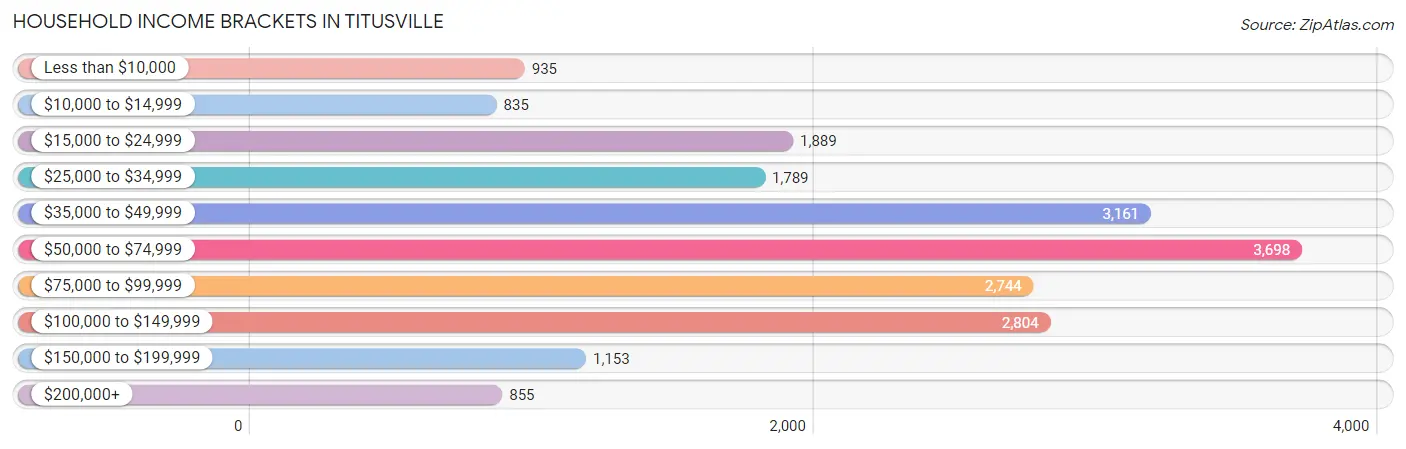
| Income Bracket | # Households | % Households |
| Less than $10,000 | 935 | 4.7% |
| $10,000 to $14,999 | 835 | 4.2% |
| $15,000 to $24,999 | 1,889 | 9.5% |
| $25,000 to $34,999 | 1,789 | 9.0% |
| $35,000 to $49,999 | 3,161 | 15.9% |
| $50,000 to $74,999 | 3,698 | 18.6% |
| $75,000 to $99,999 | 2,744 | 13.8% |
| $100,000 to $149,999 | 2,804 | 14.1% |
| $150,000 to $199,999 | 1,153 | 5.8% |
| $200,000+ | 855 | 4.3% |
Household Income by Householder Age in Titusville
The median household income in Titusville is $56,700, with the highest median household income of $71,755 found in the 45 to 64 years age bracket for the primary householder. A total of 7,061 households (35.5%) fall into this category. Meanwhile, the 15 to 24 years age bracket for the primary householder has the lowest median household income of $44,073, with 460 households (2.3%) in this group.
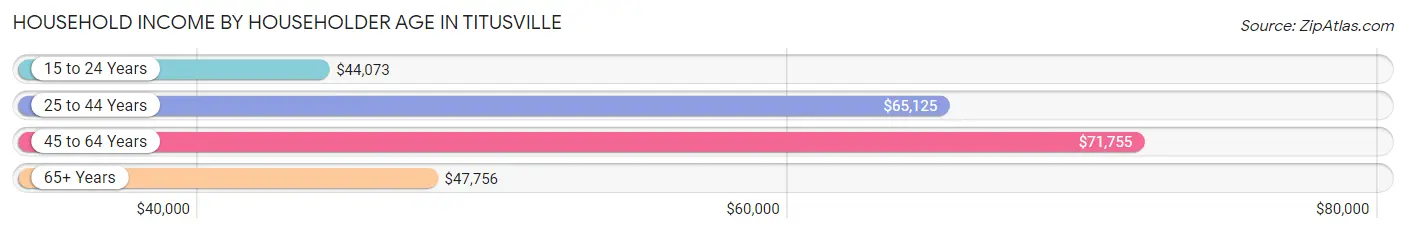
| Income Bracket | # Households | Median Income |
| 15 to 24 Years | 460 (2.3%) | $44,073 |
| 25 to 44 Years | 5,251 (26.4%) | $65,125 |
| 45 to 64 Years | 7,061 (35.5%) | $71,755 |
| 65+ Years | 7,111 (35.8%) | $47,756 |
| Total | 19,883 (100.0%) | $56,700 |
Poverty in Titusville
Income Below Poverty by Sex and Age in Titusville
With 8.7% poverty level for males and 13.2% for females among the residents of Titusville, 5 year old males and 5 year old females are the most vulnerable to poverty, with 28 males (18.8%) and 105 females (32.8%) in their respective age groups living below the poverty level.
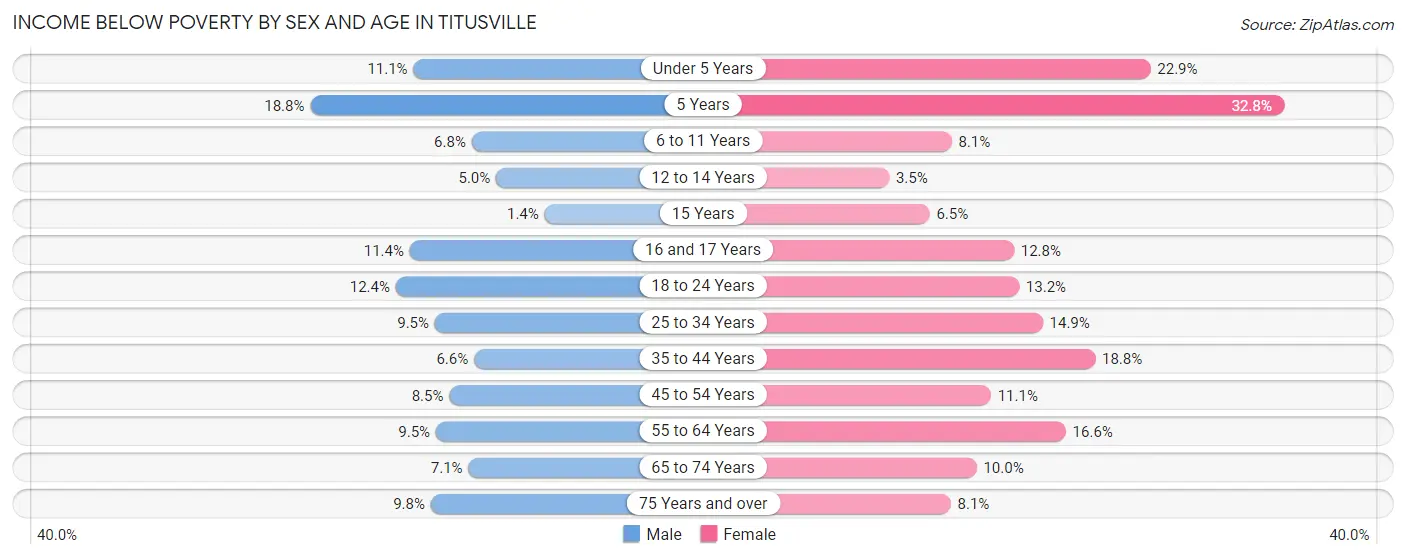
| Age Bracket | Male | Female |
| Under 5 Years | 130 (11.1%) | 228 (22.9%) |
| 5 Years | 28 (18.8%) | 105 (32.8%) |
| 6 to 11 Years | 123 (6.8%) | 106 (8.1%) |
| 12 to 14 Years | 44 (5.0%) | 24 (3.5%) |
| 15 Years | 5 (1.4%) | 19 (6.5%) |
| 16 and 17 Years | 48 (11.4%) | 89 (12.8%) |
| 18 to 24 Years | 231 (12.4%) | 277 (13.2%) |
| 25 to 34 Years | 275 (9.5%) | 552 (14.9%) |
| 35 to 44 Years | 173 (6.6%) | 500 (18.8%) |
| 45 to 54 Years | 238 (8.5%) | 308 (11.1%) |
| 55 to 64 Years | 288 (9.5%) | 566 (16.6%) |
| 65 to 74 Years | 192 (7.0%) | 353 (10.0%) |
| 75 Years and over | 188 (9.8%) | 236 (8.1%) |
| Total | 1,963 (8.7%) | 3,363 (13.2%) |
Income Above Poverty by Sex and Age in Titusville
According to the poverty statistics in Titusville, males aged 15 years and females aged 12 to 14 years are the age groups that are most secure financially, with 98.6% of males and 96.5% of females in these age groups living above the poverty line.
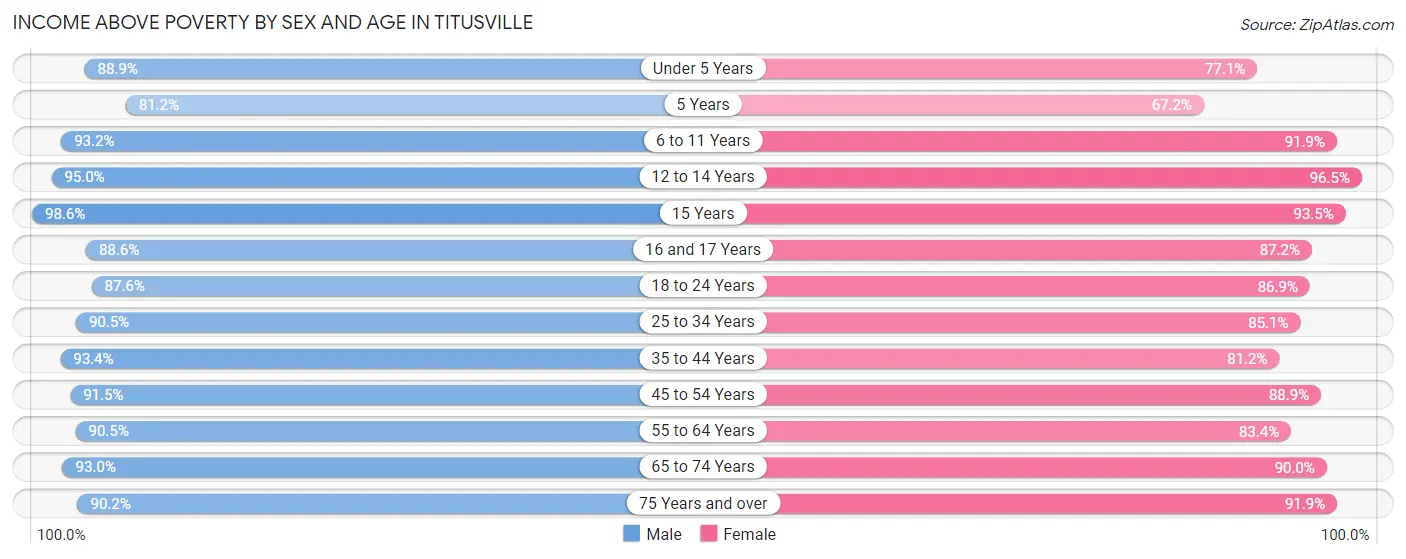
| Age Bracket | Male | Female |
| Under 5 Years | 1,038 (88.9%) | 767 (77.1%) |
| 5 Years | 121 (81.2%) | 215 (67.2%) |
| 6 to 11 Years | 1,687 (93.2%) | 1,196 (91.9%) |
| 12 to 14 Years | 837 (95.0%) | 662 (96.5%) |
| 15 Years | 355 (98.6%) | 273 (93.5%) |
| 16 and 17 Years | 373 (88.6%) | 608 (87.2%) |
| 18 to 24 Years | 1,626 (87.6%) | 1,829 (86.9%) |
| 25 to 34 Years | 2,609 (90.5%) | 3,149 (85.1%) |
| 35 to 44 Years | 2,436 (93.4%) | 2,160 (81.2%) |
| 45 to 54 Years | 2,572 (91.5%) | 2,476 (88.9%) |
| 55 to 64 Years | 2,756 (90.5%) | 2,839 (83.4%) |
| 65 to 74 Years | 2,532 (92.9%) | 3,176 (90.0%) |
| 75 Years and over | 1,722 (90.2%) | 2,686 (91.9%) |
| Total | 20,664 (91.3%) | 22,036 (86.8%) |
Income Below Poverty Among Married-Couple Families in Titusville
The poverty statistics for married-couple families in Titusville show that 4.3% or 354 of the total 8,299 families live below the poverty line. Families with 3 or 4 children have the highest poverty rate of 5.0%, comprising of 36 families. On the other hand, families with 5 or more children have the lowest poverty rate of 0.0%, which includes 0 families.
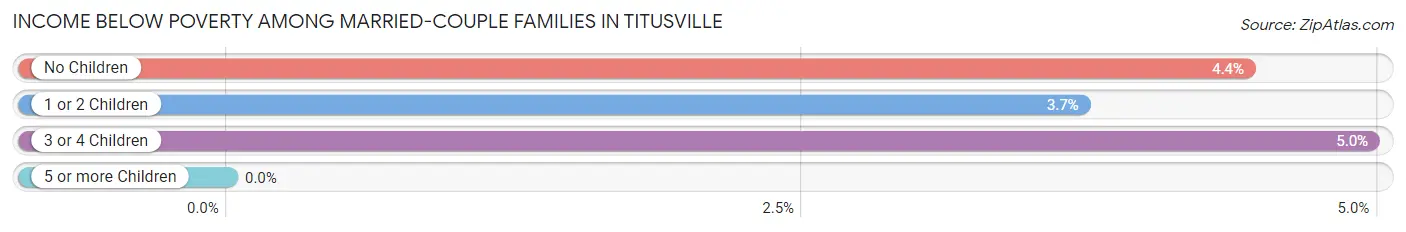
| Children | Above Poverty | Below Poverty |
| No Children | 5,270 (95.6%) | 244 (4.4%) |
| 1 or 2 Children | 1,921 (96.3%) | 74 (3.7%) |
| 3 or 4 Children | 688 (95.0%) | 36 (5.0%) |
| 5 or more Children | 66 (100.0%) | 0 (0.0%) |
| Total | 7,945 (95.7%) | 354 (4.3%) |
Income Below Poverty Among Single-Parent Households in Titusville
According to the poverty data in Titusville, 8.4% or 98 single-father households and 23.2% or 517 single-mother households are living below the poverty line. Among single-father households, those with no children have the highest poverty rate, with 59 households (15.9%) experiencing poverty. Likewise, among single-mother households, those with 3 or 4 children have the highest poverty rate, with 46 households (39.0%) falling below the poverty line.
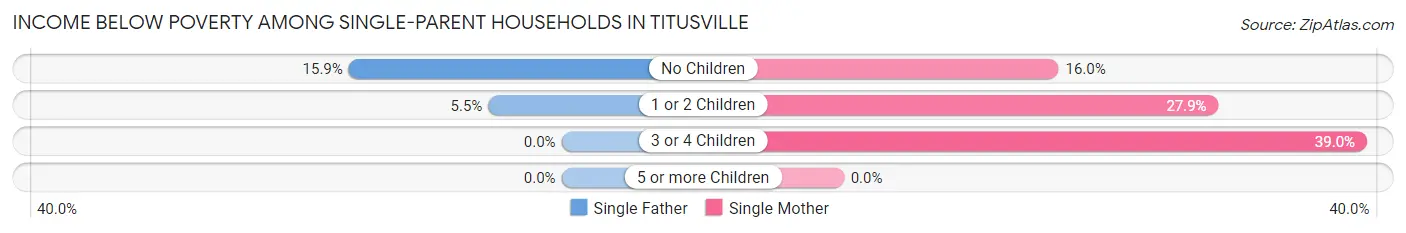
| Children | Single Father | Single Mother |
| No Children | 59 (15.9%) | 158 (16.0%) |
| 1 or 2 Children | 39 (5.5%) | 313 (27.9%) |
| 3 or 4 Children | 0 (0.0%) | 46 (39.0%) |
| 5 or more Children | 0 (0.0%) | 0 (0.0%) |
| Total | 98 (8.4%) | 517 (23.2%) |
Income Below Poverty Among Married-Couple vs Single-Parent Households in Titusville
The poverty data for Titusville shows that 354 of the married-couple family households (4.3%) and 615 of the single-parent households (18.1%) are living below the poverty level. Within the married-couple family households, those with 3 or 4 children have the highest poverty rate, with 36 households (5.0%) falling below the poverty line. Among the single-parent households, those with 3 or 4 children have the highest poverty rate, with 46 household (23.4%) living below poverty.
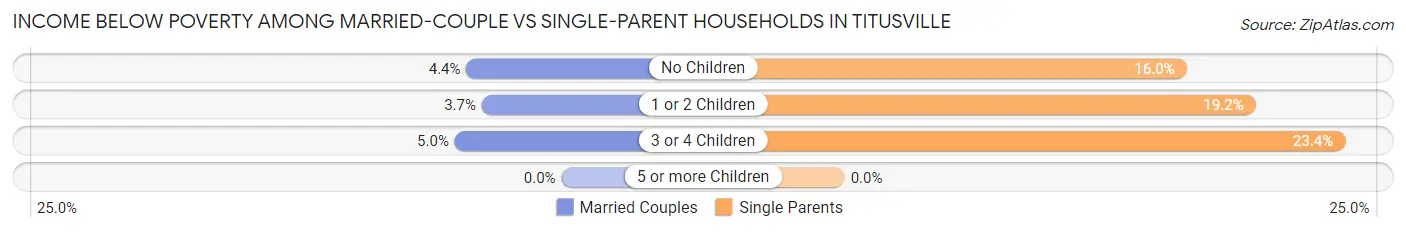
| Children | Married-Couple Families | Single-Parent Households |
| No Children | 244 (4.4%) | 217 (16.0%) |
| 1 or 2 Children | 74 (3.7%) | 352 (19.2%) |
| 3 or 4 Children | 36 (5.0%) | 46 (23.4%) |
| 5 or more Children | 0 (0.0%) | 0 (0.0%) |
| Total | 354 (4.3%) | 615 (18.1%) |
Race in Titusville
The most populous races in Titusville are White / Caucasian (35,456 | 73.0%), Black / African American (7,297 | 15.0%), and Hispanic or Latino (3,830 | 7.9%).
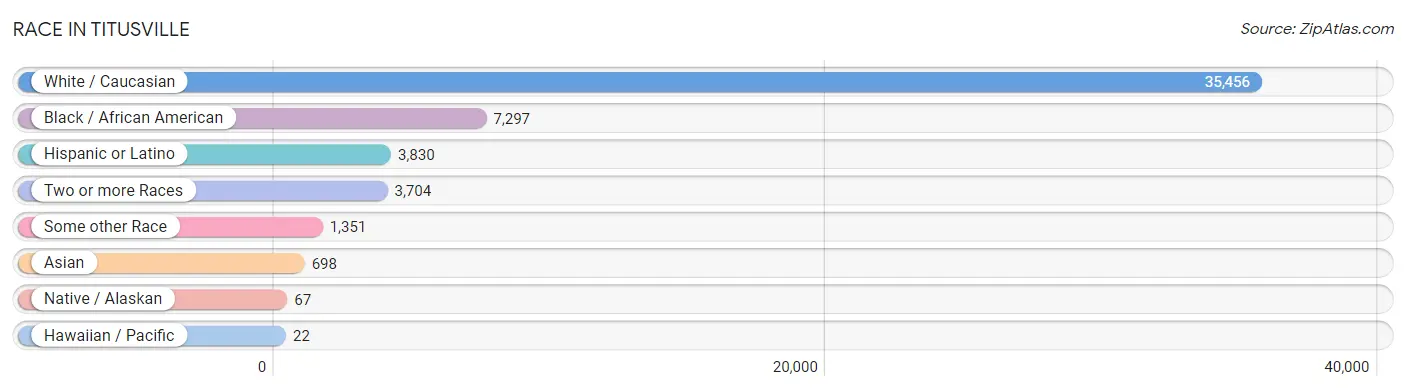
| Race | # Population | % Population |
| Asian | 698 | 1.4% |
| Black / African American | 7,297 | 15.0% |
| Hawaiian / Pacific | 22 | 0.1% |
| Hispanic or Latino | 3,830 | 7.9% |
| Native / Alaskan | 67 | 0.1% |
| White / Caucasian | 35,456 | 73.0% |
| Two or more Races | 3,704 | 7.6% |
| Some other Race | 1,351 | 2.8% |
| Total | 48,595 | 100.0% |
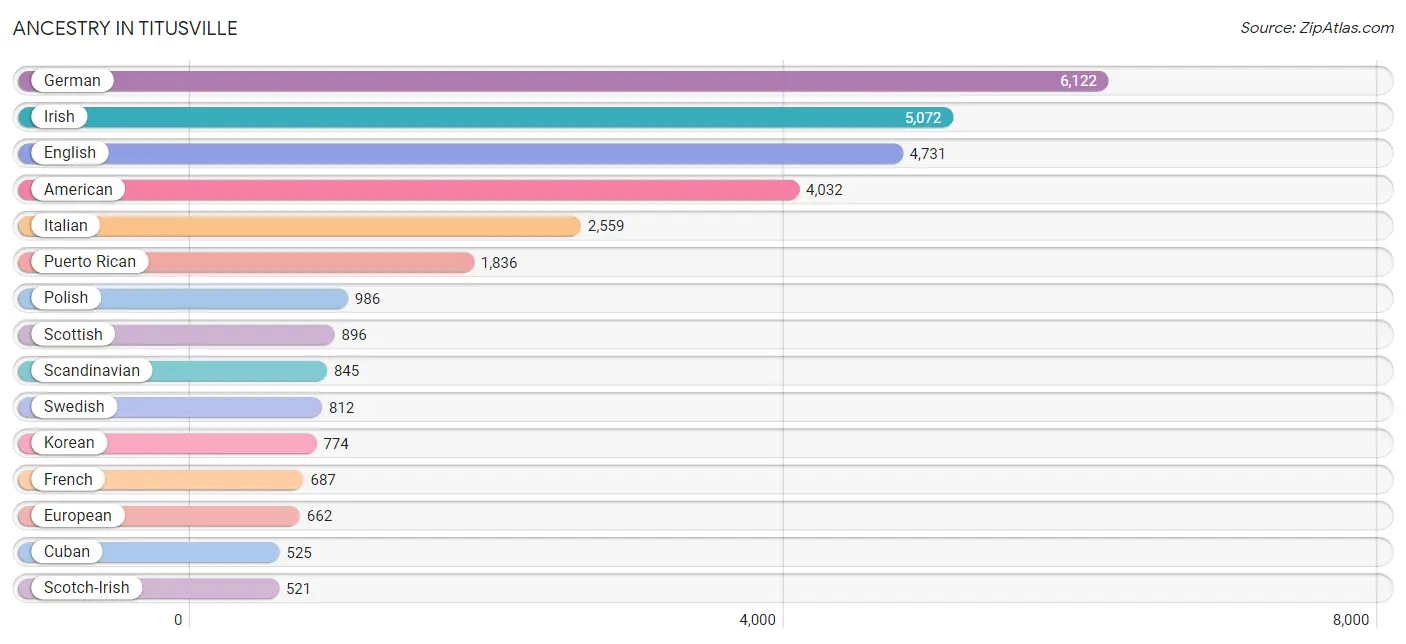
Ancestry in Titusville
The most populous ancestries reported in Titusville are German (6,122 | 12.6%), Irish (5,072 | 10.4%), English (4,731 | 9.7%), American (4,032 | 8.3%), and Italian (2,559 | 5.3%), together accounting for 46.4% of all Titusville residents.
| Ancestry | # Population | % Population |
| Afghan | 18 | 0.0% |
| African | 212 | 0.4% |
| American | 4,032 | 8.3% |
| Arab | 46 | 0.1% |
| Argentinean | 12 | 0.0% |
| Armenian | 26 | 0.1% |
| Austrian | 15 | 0.0% |
| Bahamian | 27 | 0.1% |
| Belgian | 55 | 0.1% |
| Bhutanese | 88 | 0.2% |
| Blackfeet | 73 | 0.2% |
| Bolivian | 32 | 0.1% |
| Brazilian | 86 | 0.2% |
| British | 247 | 0.5% |
| British West Indian | 28 | 0.1% |
| Bulgarian | 9 | 0.0% |
| Burmese | 30 | 0.1% |
| Canadian | 250 | 0.5% |
| Celtic | 9 | 0.0% |
| Central American | 256 | 0.5% |
| Cherokee | 59 | 0.1% |
| Chinese | 26 | 0.1% |
| Choctaw | 17 | 0.0% |
| Colombian | 41 | 0.1% |
| Comanche | 21 | 0.0% |
| Creek | 46 | 0.1% |
| Croatian | 36 | 0.1% |
| Cuban | 525 | 1.1% |
| Czech | 79 | 0.2% |
| Czechoslovakian | 26 | 0.1% |
| Danish | 53 | 0.1% |
| Dominican | 141 | 0.3% |
| Dutch | 399 | 0.8% |
| Eastern European | 116 | 0.2% |
| Ecuadorian | 20 | 0.0% |
| English | 4,731 | 9.7% |
| European | 662 | 1.4% |
| Finnish | 97 | 0.2% |
| French | 687 | 1.4% |
| French Canadian | 301 | 0.6% |
| German | 6,122 | 12.6% |
| Greek | 226 | 0.5% |
| Guamanian / Chamorro | 88 | 0.2% |
| Guatemalan | 36 | 0.1% |
| Haitian | 111 | 0.2% |
| Honduran | 67 | 0.1% |
| Hungarian | 233 | 0.5% |
| Indian (Asian) | 138 | 0.3% |
| Irish | 5,072 | 10.4% |
| Italian | 2,559 | 5.3% |
| Jamaican | 259 | 0.5% |
| Korean | 774 | 1.6% |
| Latvian | 21 | 0.0% |
| Lithuanian | 58 | 0.1% |
| Maltese | 24 | 0.1% |
| Mexican | 396 | 0.8% |
| Mexican American Indian | 11 | 0.0% |
| Native Hawaiian | 70 | 0.1% |
| Nicaraguan | 11 | 0.0% |
| Northern European | 116 | 0.2% |
| Norwegian | 293 | 0.6% |
| Pakistani | 24 | 0.1% |
| Panamanian | 53 | 0.1% |
| Peruvian | 105 | 0.2% |
| Pima | 18 | 0.0% |
| Polish | 986 | 2.0% |
| Portuguese | 134 | 0.3% |
| Puerto Rican | 1,836 | 3.8% |
| Russian | 168 | 0.4% |
| Salvadoran | 89 | 0.2% |
| Scandinavian | 845 | 1.7% |
| Scotch-Irish | 521 | 1.1% |
| Scottish | 896 | 1.8% |
| Slovak | 179 | 0.4% |
| Slovene | 10 | 0.0% |
| South American | 488 | 1.0% |
| Spaniard | 21 | 0.0% |
| Spanish | 126 | 0.3% |
| Sri Lankan | 8 | 0.0% |
| Subsaharan African | 212 | 0.4% |
| Swedish | 812 | 1.7% |
| Swiss | 160 | 0.3% |
| Syrian | 22 | 0.1% |
| Thai | 100 | 0.2% |
| Trinidadian and Tobagonian | 141 | 0.3% |
| Turkish | 160 | 0.3% |
| U.S. Virgin Islander | 48 | 0.1% |
| Ukrainian | 103 | 0.2% |
| Venezuelan | 278 | 0.6% |
| Welsh | 474 | 1.0% |
| West Indian | 101 | 0.2% |
| Yugoslavian | 14 | 0.0% | View All 92 Rows |
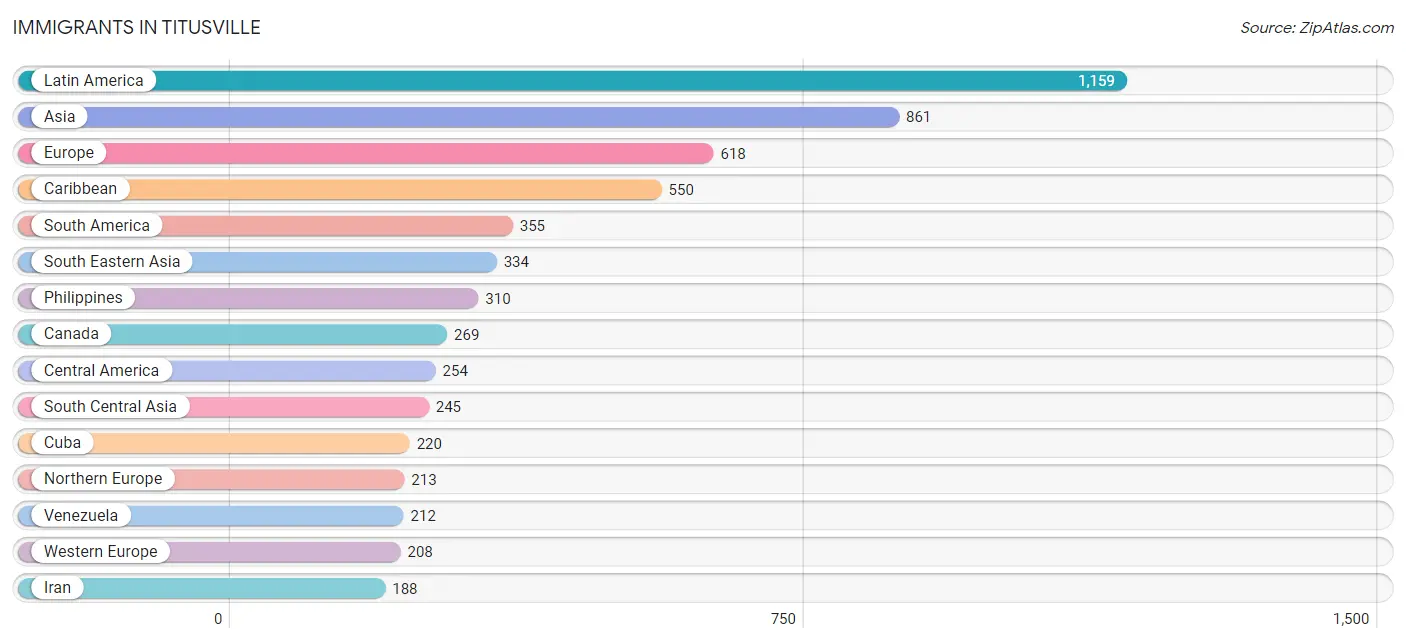
Immigrants in Titusville
The most numerous immigrant groups reported in Titusville came from Latin America (1,159 | 2.4%), Asia (861 | 1.8%), Europe (618 | 1.3%), Caribbean (550 | 1.1%), and South America (355 | 0.7%), together accounting for 7.3% of all Titusville residents.
| Immigration Origin | # Population | % Population |
| Africa | 67 | 0.1% |
| Asia | 861 | 1.8% |
| Australia | 31 | 0.1% |
| Belize | 18 | 0.0% |
| Bolivia | 12 | 0.0% |
| Brazil | 82 | 0.2% |
| Canada | 269 | 0.5% |
| Caribbean | 550 | 1.1% |
| Central America | 254 | 0.5% |
| China | 82 | 0.2% |
| Colombia | 29 | 0.1% |
| Cuba | 220 | 0.4% |
| Dominican Republic | 69 | 0.1% |
| Eastern Africa | 11 | 0.0% |
| Eastern Asia | 118 | 0.2% |
| Eastern Europe | 125 | 0.3% |
| Ecuador | 20 | 0.0% |
| El Salvador | 154 | 0.3% |
| England | 121 | 0.3% |
| Europe | 618 | 1.3% |
| Germany | 183 | 0.4% |
| Haiti | 20 | 0.0% |
| Hong Kong | 6 | 0.0% |
| Hungary | 17 | 0.0% |
| India | 20 | 0.0% |
| Iran | 188 | 0.4% |
| Jamaica | 179 | 0.4% |
| Japan | 23 | 0.1% |
| Kazakhstan | 37 | 0.1% |
| Korea | 13 | 0.0% |
| Latin America | 1,159 | 2.4% |
| Latvia | 17 | 0.0% |
| Mexico | 5 | 0.0% |
| Netherlands | 19 | 0.0% |
| Nicaragua | 11 | 0.0% |
| Northern Africa | 56 | 0.1% |
| Northern Europe | 213 | 0.4% |
| Norway | 41 | 0.1% |
| Oceania | 31 | 0.1% |
| Panama | 66 | 0.1% |
| Philippines | 310 | 0.6% |
| Poland | 19 | 0.0% |
| Portugal | 13 | 0.0% |
| Russia | 26 | 0.1% |
| Scotland | 23 | 0.1% |
| South America | 355 | 0.7% |
| South Central Asia | 245 | 0.5% |
| South Eastern Asia | 334 | 0.7% |
| Southern Europe | 72 | 0.2% |
| Spain | 59 | 0.1% |
| Sweden | 28 | 0.1% |
| Switzerland | 6 | 0.0% |
| Syria | 4 | 0.0% |
| Trinidad and Tobago | 53 | 0.1% |
| Turkey | 160 | 0.3% |
| Ukraine | 46 | 0.1% |
| Venezuela | 212 | 0.4% |
| Vietnam | 24 | 0.1% |
| Western Asia | 164 | 0.3% |
| Western Europe | 208 | 0.4% | View All 60 Rows |
Sex and Age in Titusville
Sex and Age in Titusville
The most populous age groups in Titusville are 30 to 34 Years (1,784 | 7.8%) for men and 25 to 29 Years (2,034 | 7.9%) for women.
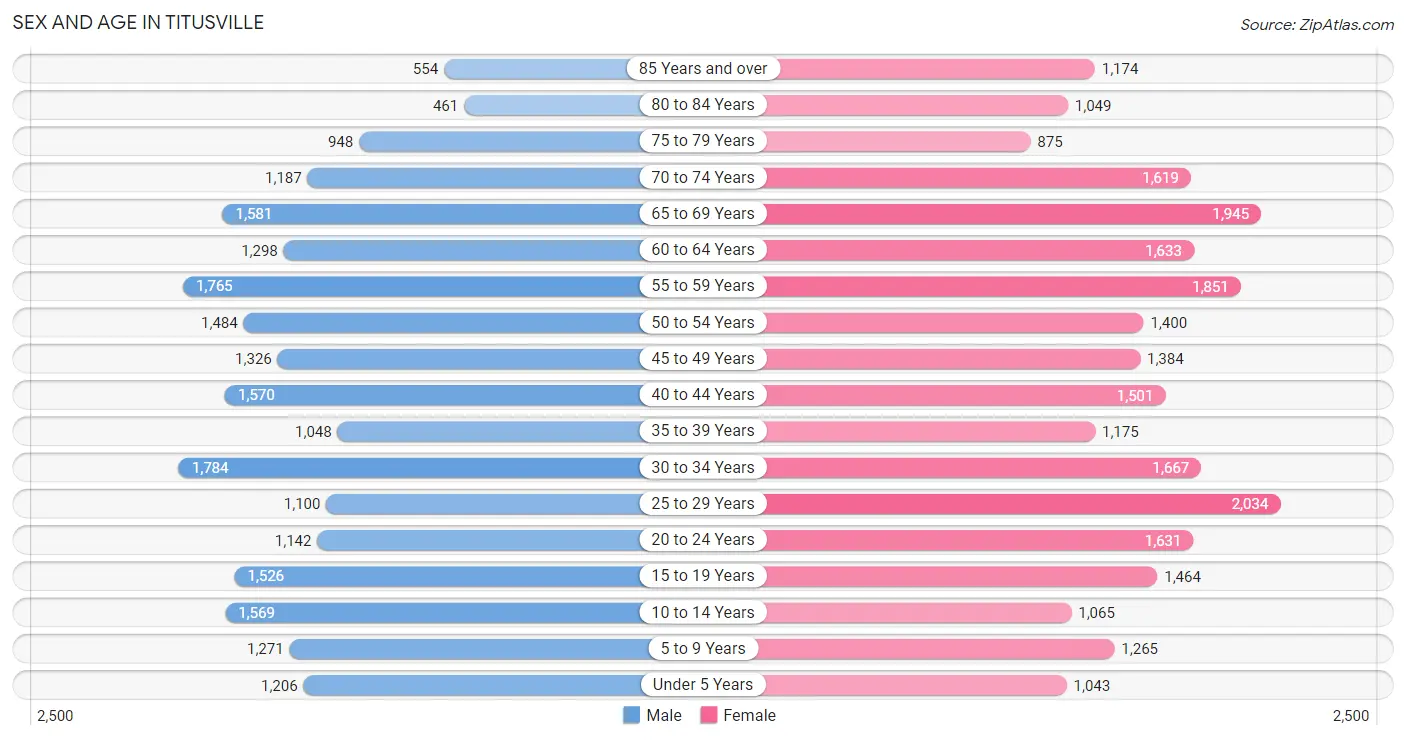
| Age Bracket | Male | Female |
| Under 5 Years | 1,206 (5.3%) | 1,043 (4.1%) |
| 5 to 9 Years | 1,271 (5.6%) | 1,265 (4.9%) |
| 10 to 14 Years | 1,569 (6.9%) | 1,065 (4.1%) |
| 15 to 19 Years | 1,526 (6.7%) | 1,464 (5.7%) |
| 20 to 24 Years | 1,142 (5.0%) | 1,631 (6.3%) |
| 25 to 29 Years | 1,100 (4.8%) | 2,034 (7.9%) |
| 30 to 34 Years | 1,784 (7.8%) | 1,667 (6.5%) |
| 35 to 39 Years | 1,048 (4.6%) | 1,175 (4.6%) |
| 40 to 44 Years | 1,570 (6.9%) | 1,501 (5.8%) |
| 45 to 49 Years | 1,326 (5.8%) | 1,384 (5.4%) |
| 50 to 54 Years | 1,484 (6.5%) | 1,400 (5.4%) |
| 55 to 59 Years | 1,765 (7.7%) | 1,851 (7.2%) |
| 60 to 64 Years | 1,298 (5.7%) | 1,633 (6.3%) |
| 65 to 69 Years | 1,581 (6.9%) | 1,945 (7.5%) |
| 70 to 74 Years | 1,187 (5.2%) | 1,619 (6.3%) |
| 75 to 79 Years | 948 (4.2%) | 875 (3.4%) |
| 80 to 84 Years | 461 (2.0%) | 1,049 (4.1%) |
| 85 Years and over | 554 (2.4%) | 1,174 (4.5%) |
| Total | 22,820 (100.0%) | 25,775 (100.0%) |
Families and Households in Titusville
Median Family Size in Titusville
The median family size in Titusville is 3.10 persons per family, with married-couple families (8,299 | 71.0%) accounting for the largest median family size of 3.14 persons per family. On the other hand, single male/father families (1,165 | 10.0%) represent the smallest median family size with 2.97 persons per family.
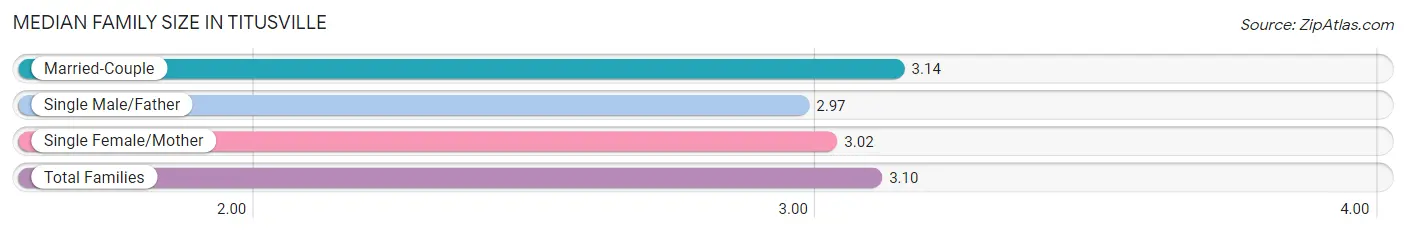
| Family Type | # Families | Family Size |
| Married-Couple | 8,299 (71.0%) | 3.14 |
| Single Male/Father | 1,165 (10.0%) | 2.97 |
| Single Female/Mother | 2,226 (19.0%) | 3.02 |
| Total Families | 11,690 (100.0%) | 3.10 |
Median Household Size in Titusville
The median household size in Titusville is 2.41 persons per household, with single male/father households (1,165 | 5.9%) accounting for the largest median household size of 3.29 persons per household. non-family households (8,193 | 41.2%) represent the smallest median household size with 1.30 persons per household.
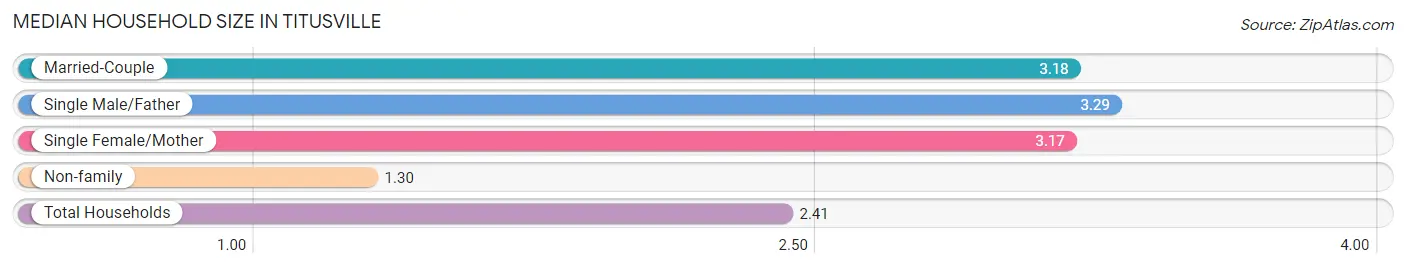
| Household Type | # Households | Household Size |
| Married-Couple | 8,299 (41.7%) | 3.18 |
| Single Male/Father | 1,165 (5.9%) | 3.29 |
| Single Female/Mother | 2,226 (11.2%) | 3.17 |
| Non-family | 8,193 (41.2%) | 1.30 |
| Total Households | 19,883 (100.0%) | 2.41 |
Household Size by Marriage Status in Titusville
Out of a total of 19,883 households in Titusville, 11,690 (58.8%) are family households, while 8,193 (41.2%) are nonfamily households. The most numerous type of family households are 2-person households, comprising 5,973, and the most common type of nonfamily households are 1-person households, comprising 6,573.
| Household Size | Family Households | Nonfamily Households |
| 1-Person Households | - | 6,573 (33.1%) |
| 2-Person Households | 5,973 (30.0%) | 1,406 (7.1%) |
| 3-Person Households | 2,868 (14.4%) | 128 (0.6%) |
| 4-Person Households | 1,339 (6.7%) | 0 (0.0%) |
| 5-Person Households | 985 (5.0%) | 86 (0.4%) |
| 6-Person Households | 400 (2.0%) | 0 (0.0%) |
| 7+ Person Households | 125 (0.6%) | 0 (0.0%) |
| Total | 11,690 (58.8%) | 8,193 (41.2%) |
Female Fertility in Titusville
Fertility by Age in Titusville
Average fertility rate in Titusville is 58.0 births per 1,000 women. Women in the age bracket of 20 to 34 years have the highest fertility rate with 84.0 births per 1,000 women. Women in the age bracket of 20 to 34 years acount for 69.0% of all women with births.
| Age Bracket | Women with Births | Births / 1,000 Women |
| 15 to 19 years | 0 (0.0%) | 0.0 |
| 20 to 34 years | 448 (69.0%) | 84.0 |
| 35 to 50 years | 201 (31.0%) | 46.0 |
| Total | 649 (100.0%) | 58.0 |
Fertility by Age by Marriage Status in Titusville
49.3% of women with births (649) in Titusville are married. The highest percentage of unmarried women with births falls into 20 to 34 years age bracket with 65.6% of them unmarried at the time of birth, while the lowest percentage of unmarried women with births belong to 35 to 50 years age bracket with 17.4% of them unmarried.
| Age Bracket | Married | Unmarried |
| 15 to 19 years | 0 (0.0%) | 0 (0.0%) |
| 20 to 34 years | 154 (34.4%) | 294 (65.6%) |
| 35 to 50 years | 166 (82.6%) | 35 (17.4%) |
| Total | 320 (49.3%) | 329 (50.7%) |
Fertility by Education in Titusville
Average fertility rate in Titusville is 58.0 births per 1,000 women. Women with the education attainment of high school diploma have the highest fertility rate of 82.0 births per 1,000 women, while women with the education attainment of less than high school have the lowest fertility at 21.0 births per 1,000 women. Women with the education attainment of college or associate's degree represent 40.1% of all women with births.
| Educational Attainment | Women with Births | Births / 1,000 Women |
| Less than High School | 41 (6.3%) | 21.0 |
| High School Diploma | 222 (34.2%) | 82.0 |
| College or Associate's Degree | 260 (40.1%) | 59.0 |
| Bachelor's Degree | 99 (15.2%) | 67.0 |
| Graduate Degree | 27 (4.2%) | 44.0 |
| Total | 649 (100.0%) | 58.0 |
Fertility by Education by Marriage Status in Titusville
50.7% of women with births in Titusville are unmarried. Women with the educational attainment of graduate degree are most likely to be married with 100.0% of them married at childbirth, while women with the educational attainment of high school diploma are least likely to be married with 79.7% of them unmarried at childbirth.
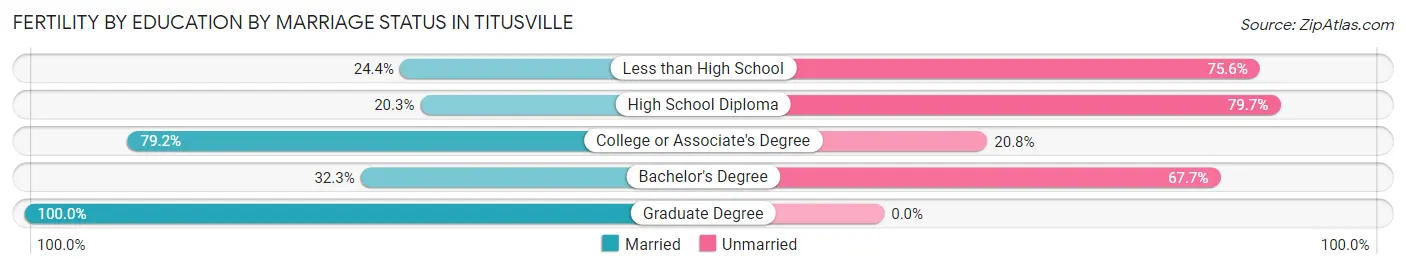
| Educational Attainment | Married | Unmarried |
| Less than High School | 10 (24.4%) | 31 (75.6%) |
| High School Diploma | 45 (20.3%) | 177 (79.7%) |
| College or Associate's Degree | 206 (79.2%) | 54 (20.8%) |
| Bachelor's Degree | 32 (32.3%) | 67 (67.7%) |
| Graduate Degree | 27 (100.0%) | 0 (0.0%) |
| Total | 320 (49.3%) | 329 (50.7%) |
Employment Characteristics in Titusville
Employment by Class of Employer in Titusville
Among the 20,730 employed individuals in Titusville, private company employees (14,574 | 70.3%), local government employees (1,704 | 8.2%), and not-for-profit organizations (1,361 | 6.6%) make up the most common classes of employment.
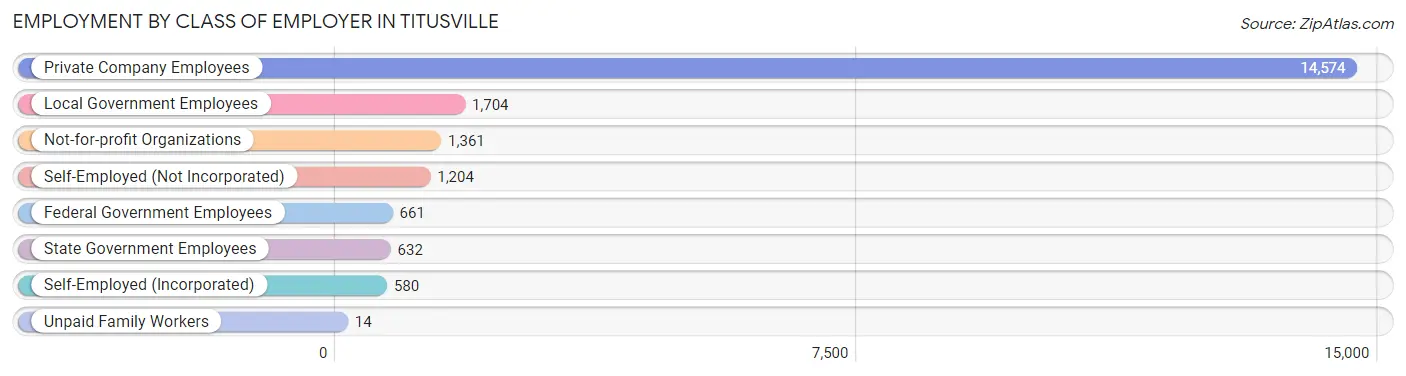
| Employer Class | # Employees | % Employees |
| Private Company Employees | 14,574 | 70.3% |
| Self-Employed (Incorporated) | 580 | 2.8% |
| Self-Employed (Not Incorporated) | 1,204 | 5.8% |
| Not-for-profit Organizations | 1,361 | 6.6% |
| Local Government Employees | 1,704 | 8.2% |
| State Government Employees | 632 | 3.0% |
| Federal Government Employees | 661 | 3.2% |
| Unpaid Family Workers | 14 | 0.1% |
| Total | 20,730 | 100.0% |
Employment Status by Age in Titusville
According to the labor force statistics for Titusville, out of the total population over 16 years of age (40,524), 55.0% or 22,288 individuals are in the labor force, with 6.2% or 1,382 of them unemployed. The age group with the highest labor force participation rate is 30 to 34 years, with 88.2% or 3,044 individuals in the labor force. Within the labor force, the 20 to 24 years age range has the highest percentage of unemployed individuals, with 13.0% or 279 of them being unemployed.
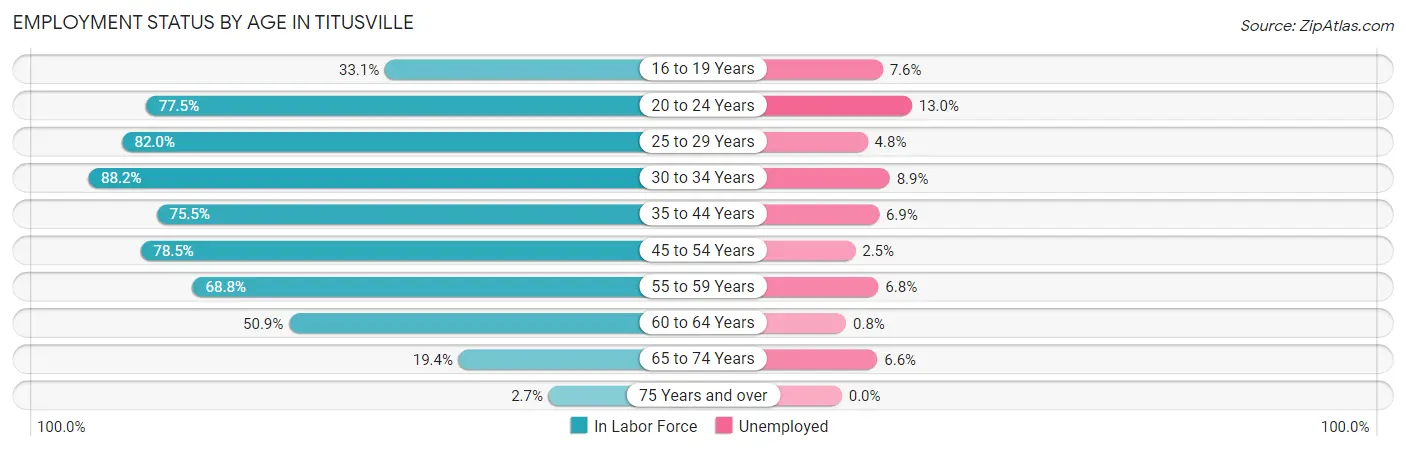
| Age Bracket | In Labor Force | Unemployed |
| 16 to 19 Years | 774 (33.1%) | 59 (7.6%) |
| 20 to 24 Years | 2,149 (77.5%) | 279 (13.0%) |
| 25 to 29 Years | 2,570 (82.0%) | 123 (4.8%) |
| 30 to 34 Years | 3,044 (88.2%) | 271 (8.9%) |
| 35 to 44 Years | 3,997 (75.5%) | 276 (6.9%) |
| 45 to 54 Years | 4,391 (78.5%) | 110 (2.5%) |
| 55 to 59 Years | 2,488 (68.8%) | 169 (6.8%) |
| 60 to 64 Years | 1,492 (50.9%) | 12 (0.8%) |
| 65 to 74 Years | 1,228 (19.4%) | 81 (6.6%) |
| 75 Years and over | 137 (2.7%) | 0 (0.0%) |
| Total | 22,288 (55.0%) | 1,382 (6.2%) |
Employment Status by Educational Attainment in Titusville
According to labor force statistics for Titusville, 74.9% of individuals (17,991) out of the total population between 25 and 64 years of age (24,020) are in the labor force, with 5.3% or 954 of them being unemployed. The group with the highest labor force participation rate are those with the educational attainment of bachelor's degree or higher, with 81.5% or 4,782 individuals in the labor force. Within the labor force, individuals with bachelor's degree or higher education have the highest percentage of unemployment, with 6.9% or 330 of them being unemployed.
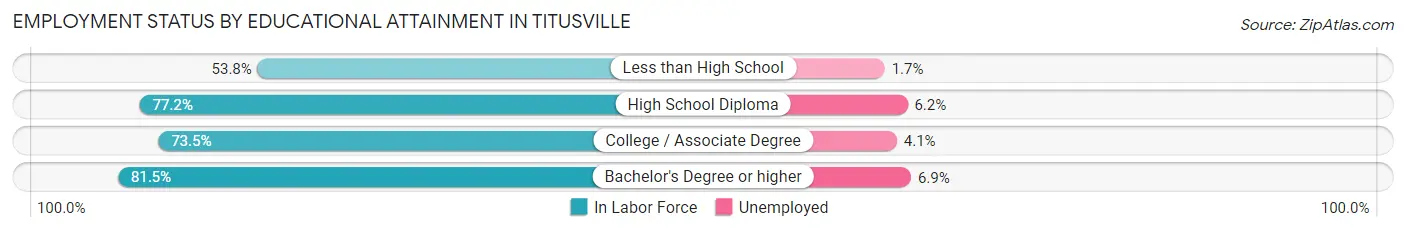
| Educational Attainment | In Labor Force | Unemployed |
| Less than High School | 1,134 (53.8%) | 36 (1.7%) |
| High School Diploma | 5,668 (77.2%) | 455 (6.2%) |
| College / Associate Degree | 6,396 (73.5%) | 357 (4.1%) |
| Bachelor's Degree or higher | 4,782 (81.5%) | 405 (6.9%) |
| Total | 17,991 (74.9%) | 1,273 (5.3%) |
Employment Occupations by Sex in Titusville
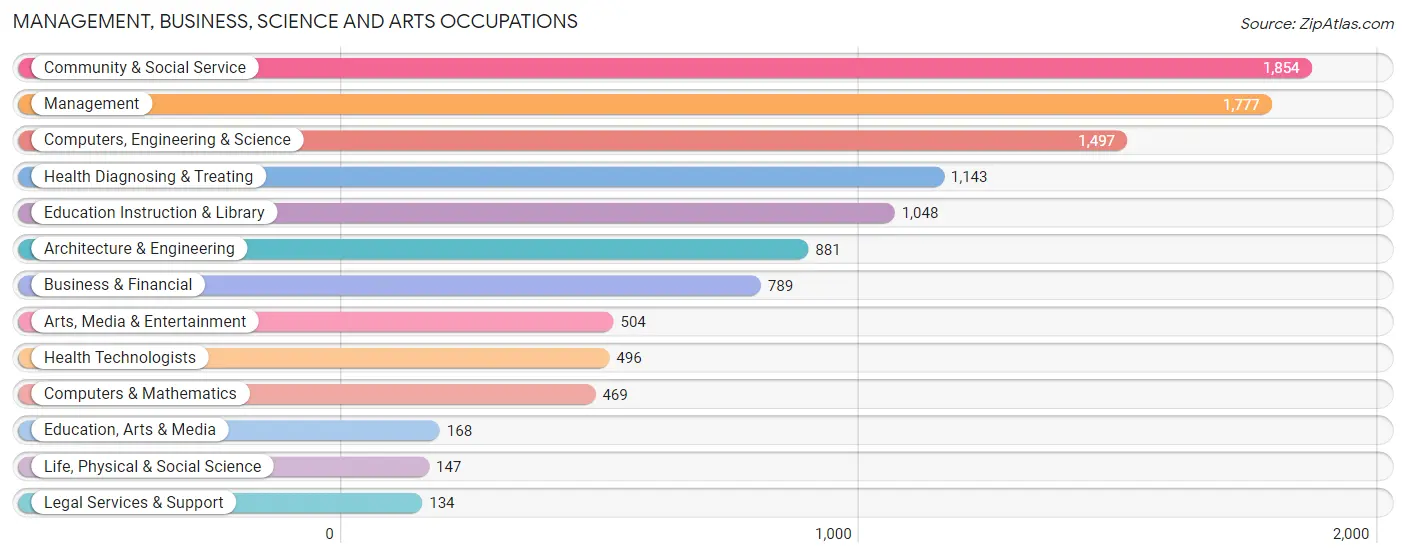
Management, Business, Science and Arts Occupations
The most common Management, Business, Science and Arts occupations in Titusville are Community & Social Service (1,854 | 8.9%), Management (1,777 | 8.5%), Computers, Engineering & Science (1,497 | 7.2%), Health Diagnosing & Treating (1,143 | 5.5%), and Education Instruction & Library (1,048 | 5.0%).
Management, Business, Science and Arts Occupations by Sex
Within the Management, Business, Science and Arts occupations in Titusville, the most male-oriented occupations are Architecture & Engineering (92.5%), Computers, Engineering & Science (85.2%), and Life, Physical & Social Science (80.3%), while the most female-oriented occupations are Legal Services & Support (82.8%), Education Instruction & Library (78.0%), and Health Diagnosing & Treating (72.6%).
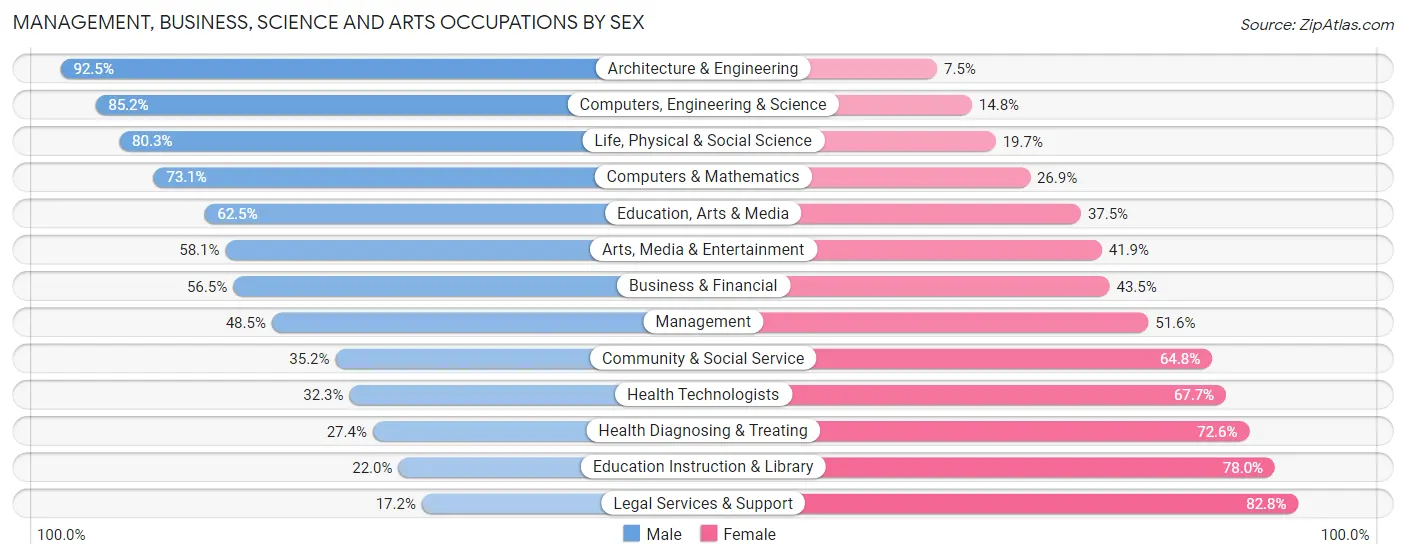
| Occupation | Male | Female |
| Management | 861 (48.4%) | 916 (51.5%) |
| Business & Financial | 446 (56.5%) | 343 (43.5%) |
| Computers, Engineering & Science | 1,276 (85.2%) | 221 (14.8%) |
| Computers & Mathematics | 343 (73.1%) | 126 (26.9%) |
| Architecture & Engineering | 815 (92.5%) | 66 (7.5%) |
| Life, Physical & Social Science | 118 (80.3%) | 29 (19.7%) |
| Community & Social Service | 652 (35.2%) | 1,202 (64.8%) |
| Education, Arts & Media | 105 (62.5%) | 63 (37.5%) |
| Legal Services & Support | 23 (17.2%) | 111 (82.8%) |
| Education Instruction & Library | 231 (22.0%) | 817 (78.0%) |
| Arts, Media & Entertainment | 293 (58.1%) | 211 (41.9%) |
| Health Diagnosing & Treating | 313 (27.4%) | 830 (72.6%) |
| Health Technologists | 160 (32.3%) | 336 (67.7%) |
| Total (Category) | 3,548 (50.2%) | 3,512 (49.7%) |
| Total (Overall) | 10,541 (50.4%) | 10,356 (49.6%) |
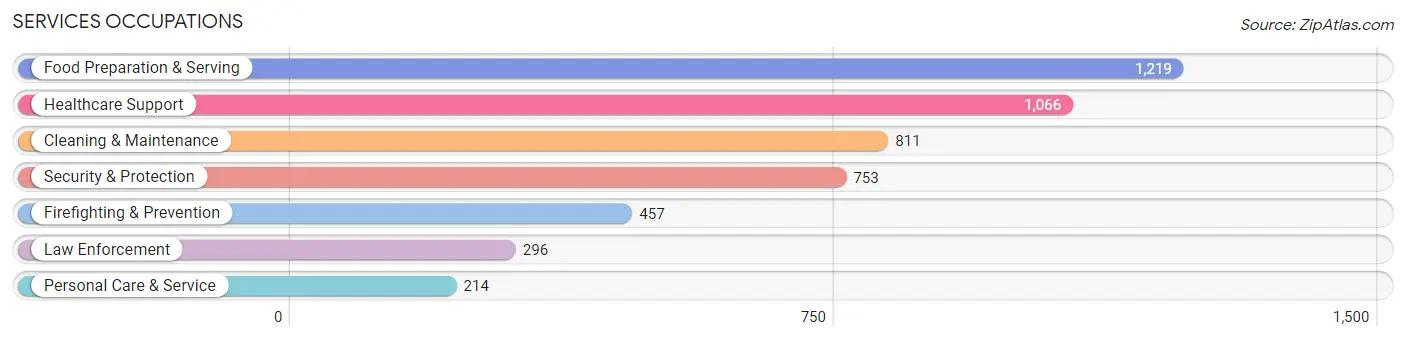
Services Occupations
The most common Services occupations in Titusville are Food Preparation & Serving (1,219 | 5.8%), Healthcare Support (1,066 | 5.1%), Cleaning & Maintenance (811 | 3.9%), Security & Protection (753 | 3.6%), and Firefighting & Prevention (457 | 2.2%).
Services Occupations by Sex
Within the Services occupations in Titusville, the most male-oriented occupations are Firefighting & Prevention (77.7%), Cleaning & Maintenance (75.5%), and Security & Protection (66.8%), while the most female-oriented occupations are Healthcare Support (97.2%), Personal Care & Service (92.1%), and Law Enforcement (50.0%).
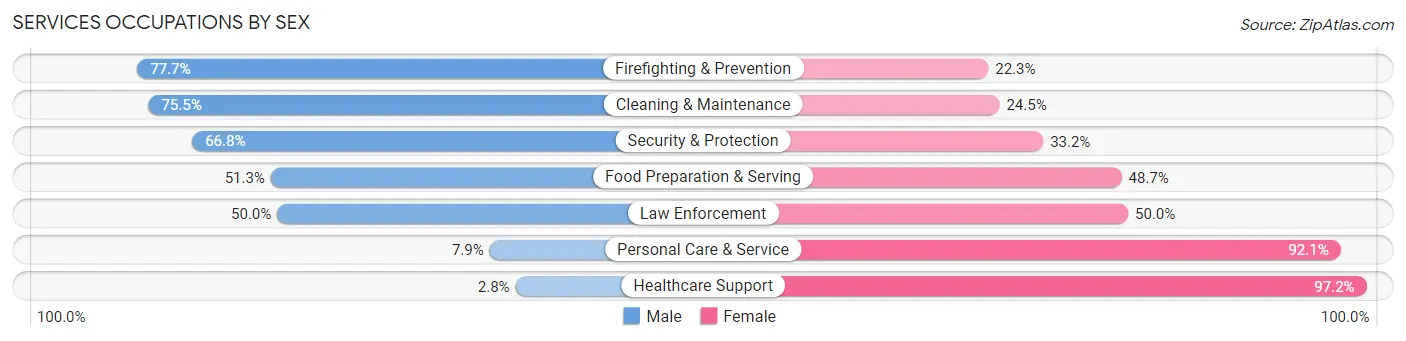
| Occupation | Male | Female |
| Healthcare Support | 30 (2.8%) | 1,036 (97.2%) |
| Security & Protection | 503 (66.8%) | 250 (33.2%) |
| Firefighting & Prevention | 355 (77.7%) | 102 (22.3%) |
| Law Enforcement | 148 (50.0%) | 148 (50.0%) |
| Food Preparation & Serving | 625 (51.3%) | 594 (48.7%) |
| Cleaning & Maintenance | 612 (75.5%) | 199 (24.5%) |
| Personal Care & Service | 17 (7.9%) | 197 (92.1%) |
| Total (Category) | 1,787 (44.0%) | 2,276 (56.0%) |
| Total (Overall) | 10,541 (50.4%) | 10,356 (49.6%) |
Sales and Office Occupations
The most common Sales and Office occupations in Titusville are Office & Administration (3,137 | 15.0%), and Sales & Related (2,163 | 10.3%).

Sales and Office Occupations by Sex

| Occupation | Male | Female |
| Sales & Related | 1,003 (46.4%) | 1,160 (53.6%) |
| Office & Administration | 463 (14.8%) | 2,674 (85.2%) |
| Total (Category) | 1,466 (27.7%) | 3,834 (72.3%) |
| Total (Overall) | 10,541 (50.4%) | 10,356 (49.6%) |
Natural Resources, Construction and Maintenance Occupations
The most common Natural Resources, Construction and Maintenance occupations in Titusville are Installation, Maintenance & Repair (1,048 | 5.0%), and Construction & Extraction (895 | 4.3%).

Natural Resources, Construction and Maintenance Occupations by Sex

| Occupation | Male | Female |
| Farming, Fishing & Forestry | 0 (0.0%) | 0 (0.0%) |
| Construction & Extraction | 808 (90.3%) | 87 (9.7%) |
| Installation, Maintenance & Repair | 1,034 (98.7%) | 14 (1.3%) |
| Total (Category) | 1,842 (94.8%) | 101 (5.2%) |
| Total (Overall) | 10,541 (50.4%) | 10,356 (49.6%) |
Production, Transportation and Moving Occupations
The most common Production, Transportation and Moving occupations in Titusville are Production (980 | 4.7%), Transportation (910 | 4.3%), and Material Moving (641 | 3.1%).
Production, Transportation and Moving Occupations by Sex
| Occupation | Male | Female |
| Production | 784 (80.0%) | 196 (20.0%) |
| Transportation | 652 (71.7%) | 258 (28.3%) |
| Material Moving | 462 (72.1%) | 179 (27.9%) |
| Total (Category) | 1,898 (75.0%) | 633 (25.0%) |
| Total (Overall) | 10,541 (50.4%) | 10,356 (49.6%) |
Employment Industries by Sex in Titusville
Employment Industries in Titusville
The major employment industries in Titusville include Retail Trade (2,894 | 13.9%), Manufacturing (2,753 | 13.2%), Health Care & Social Assistance (2,645 | 12.7%), Administrative & Support (1,612 | 7.7%), and Accommodation & Food Services (1,431 | 6.9%).
Employment Industries by Sex in Titusville
The Titusville industries that see more men than women are Enterprise Management (100.0%), Utilities (85.4%), and Real Estate, Rental & Leasing (80.0%), whereas the industries that tend to have a higher number of women are Health Care & Social Assistance (83.0%), Finance & Insurance (68.3%), and Educational Services (67.9%).
| Industry | Male | Female |
| Agriculture, Fishing & Hunting | 0 (0.0%) | 0 (0.0%) |
| Mining, Quarrying, & Extraction | 0 (0.0%) | 0 (0.0%) |
| Construction | 939 (75.2%) | 309 (24.8%) |
| Manufacturing | 1,981 (72.0%) | 772 (28.0%) |
| Wholesale Trade | 145 (46.9%) | 164 (53.1%) |
| Retail Trade | 1,431 (49.4%) | 1,463 (50.5%) |
| Transportation & Warehousing | 514 (55.6%) | 411 (44.4%) |
| Utilities | 70 (85.4%) | 12 (14.6%) |
| Information | 117 (43.3%) | 153 (56.7%) |
| Finance & Insurance | 152 (31.7%) | 327 (68.3%) |
| Real Estate, Rental & Leasing | 336 (80.0%) | 84 (20.0%) |
| Professional & Scientific | 770 (58.8%) | 539 (41.2%) |
| Enterprise Management | 77 (100.0%) | 0 (0.0%) |
| Administrative & Support | 788 (48.9%) | 824 (51.1%) |
| Educational Services | 416 (32.1%) | 880 (67.9%) |
| Health Care & Social Assistance | 450 (17.0%) | 2,195 (83.0%) |
| Arts, Entertainment & Recreation | 312 (47.8%) | 340 (52.1%) |
| Accommodation & Food Services | 607 (42.4%) | 824 (57.6%) |
| Public Administration | 867 (61.5%) | 542 (38.5%) |
| Total | 10,541 (50.4%) | 10,356 (49.6%) |
Education in Titusville
School Enrollment in Titusville
The most common levels of schooling among the 9,825 students in Titusville are high school (2,374 | 24.2%), middle school (2,242 | 22.8%), and college / undergraduate (2,010 | 20.5%).
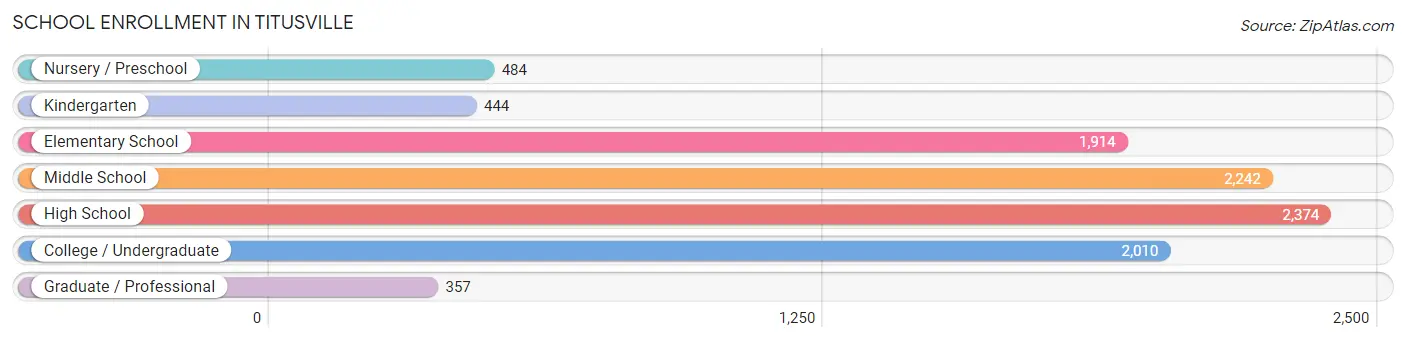
| School Level | # Students | % Students |
| Nursery / Preschool | 484 | 4.9% |
| Kindergarten | 444 | 4.5% |
| Elementary School | 1,914 | 19.5% |
| Middle School | 2,242 | 22.8% |
| High School | 2,374 | 24.2% |
| College / Undergraduate | 2,010 | 20.5% |
| Graduate / Professional | 357 | 3.6% |
| Total | 9,825 | 100.0% |
School Enrollment by Age by Funding Source in Titusville
Out of a total of 9,825 students who are enrolled in schools in Titusville, 1,739 (17.7%) attend a private institution, while the remaining 8,086 (82.3%) are enrolled in public schools. The age group of 35 years and over has the highest likelihood of being enrolled in private schools, with 414 (44.5% in the age bracket) enrolled. Conversely, the age group of 18 to 19 year olds has the lowest likelihood of being enrolled in a private school, with 677 (95.1% in the age bracket) attending a public institution.
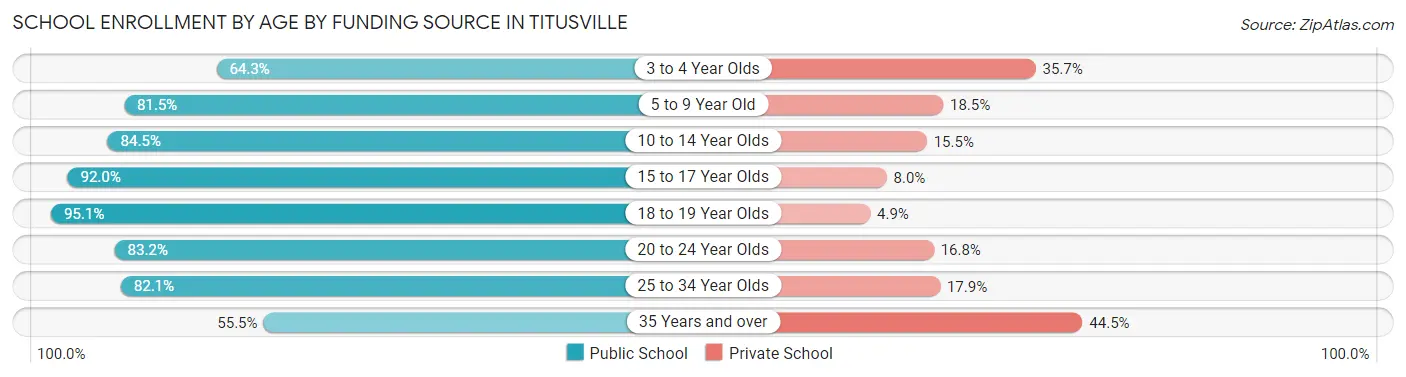
| Age Bracket | Public School | Private School |
| 3 to 4 Year Olds | 169 (64.3%) | 94 (35.7%) |
| 5 to 9 Year Old | 1,937 (81.5%) | 440 (18.5%) |
| 10 to 14 Year Olds | 2,170 (84.5%) | 397 (15.5%) |
| 15 to 17 Year Olds | 1,575 (92.0%) | 137 (8.0%) |
| 18 to 19 Year Olds | 677 (95.1%) | 35 (4.9%) |
| 20 to 24 Year Olds | 541 (83.2%) | 109 (16.8%) |
| 25 to 34 Year Olds | 503 (82.1%) | 110 (17.9%) |
| 35 Years and over | 517 (55.5%) | 414 (44.5%) |
| Total | 8,086 (82.3%) | 1,739 (17.7%) |
Educational Attainment by Field of Study in Titusville
Business (1,813 | 19.9%), engineering (1,468 | 16.1%), education (1,135 | 12.4%), arts & humanities (926 | 10.2%), and science & technology (809 | 8.9%) are the most common fields of study among 9,117 individuals in Titusville who have obtained a bachelor's degree or higher.
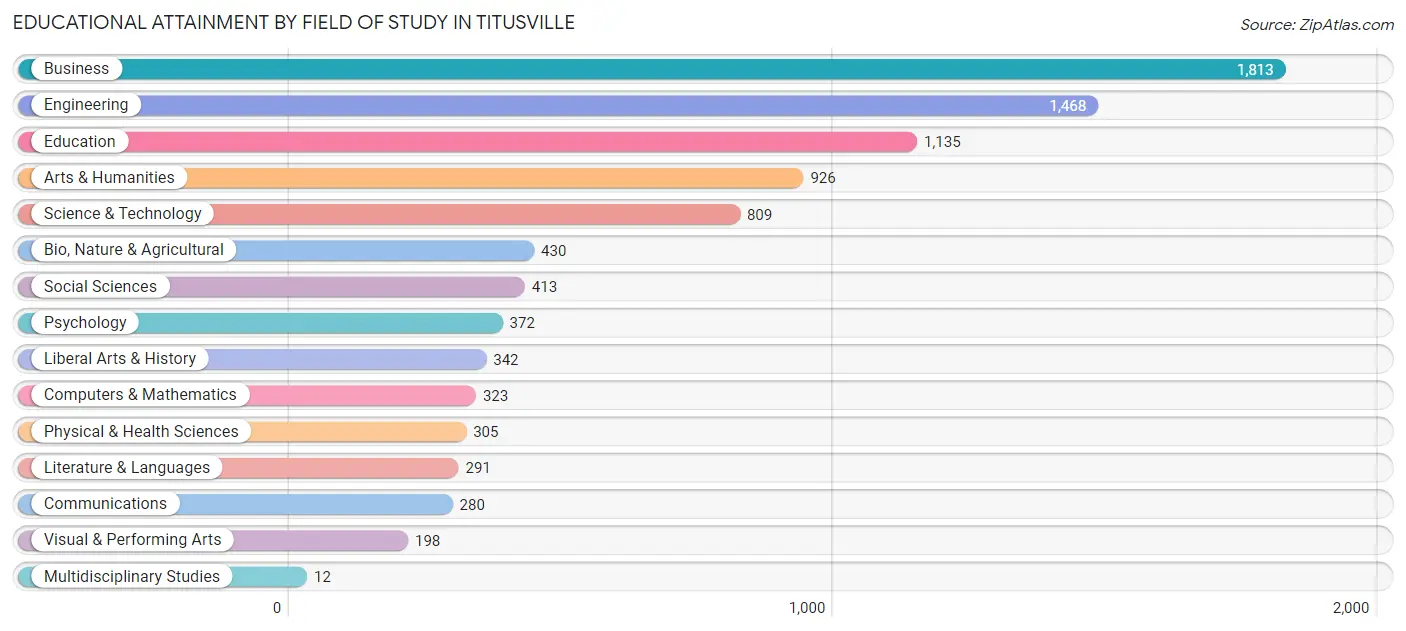
| Field of Study | # Graduates | % Graduates |
| Computers & Mathematics | 323 | 3.5% |
| Bio, Nature & Agricultural | 430 | 4.7% |
| Physical & Health Sciences | 305 | 3.4% |
| Psychology | 372 | 4.1% |
| Social Sciences | 413 | 4.5% |
| Engineering | 1,468 | 16.1% |
| Multidisciplinary Studies | 12 | 0.1% |
| Science & Technology | 809 | 8.9% |
| Business | 1,813 | 19.9% |
| Education | 1,135 | 12.4% |
| Literature & Languages | 291 | 3.2% |
| Liberal Arts & History | 342 | 3.7% |
| Visual & Performing Arts | 198 | 2.2% |
| Communications | 280 | 3.1% |
| Arts & Humanities | 926 | 10.2% |
| Total | 9,117 | 100.0% |
Transportation & Commute in Titusville
Vehicle Availability by Sex in Titusville
The most prevalent vehicle ownership categories in Titusville are males with 2 vehicles (4,655, accounting for 44.6%) and females with 2 vehicles (4,157, making up 45.3%).

| Vehicles Available | Male | Female |
| No Vehicle | 194 (1.9%) | 138 (1.3%) |
| 1 Vehicle | 1,825 (17.5%) | 2,362 (23.0%) |
| 2 Vehicles | 4,655 (44.6%) | 4,157 (40.5%) |
| 3 Vehicles | 2,276 (21.8%) | 2,173 (21.1%) |
| 4 Vehicles | 797 (7.6%) | 825 (8.0%) |
| 5 or more Vehicles | 686 (6.6%) | 617 (6.0%) |
| Total | 10,433 (100.0%) | 10,272 (100.0%) |
Commute Time in Titusville
The most frequently occuring commute durations in Titusville are 10 to 14 minutes (3,443 commuters, 18.5%), 15 to 19 minutes (3,332 commuters, 17.9%), and 30 to 34 minutes (2,152 commuters, 11.6%).
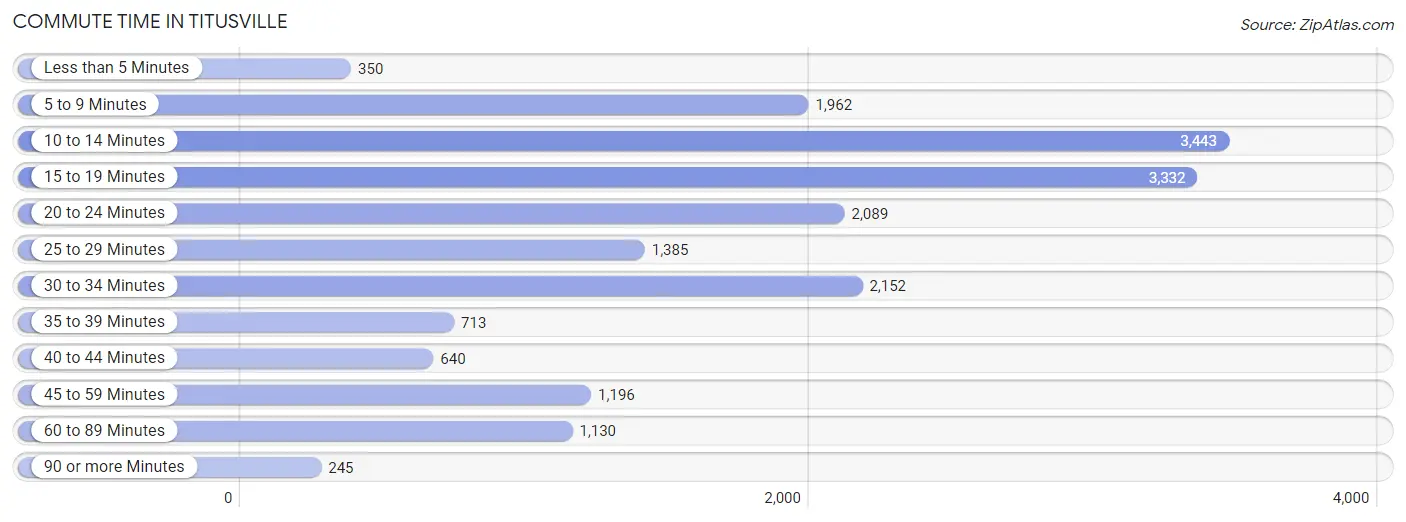
| Commute Time | # Commuters | % Commuters |
| Less than 5 Minutes | 350 | 1.9% |
| 5 to 9 Minutes | 1,962 | 10.5% |
| 10 to 14 Minutes | 3,443 | 18.5% |
| 15 to 19 Minutes | 3,332 | 17.9% |
| 20 to 24 Minutes | 2,089 | 11.2% |
| 25 to 29 Minutes | 1,385 | 7.4% |
| 30 to 34 Minutes | 2,152 | 11.6% |
| 35 to 39 Minutes | 713 | 3.8% |
| 40 to 44 Minutes | 640 | 3.4% |
| 45 to 59 Minutes | 1,196 | 6.4% |
| 60 to 89 Minutes | 1,130 | 6.1% |
| 90 or more Minutes | 245 | 1.3% |
Commute Time by Sex in Titusville
The most common commute times in Titusville are 10 to 14 minutes (1,635 commuters, 17.1%) for males and 15 to 19 minutes (2,117 commuters, 23.3%) for females.
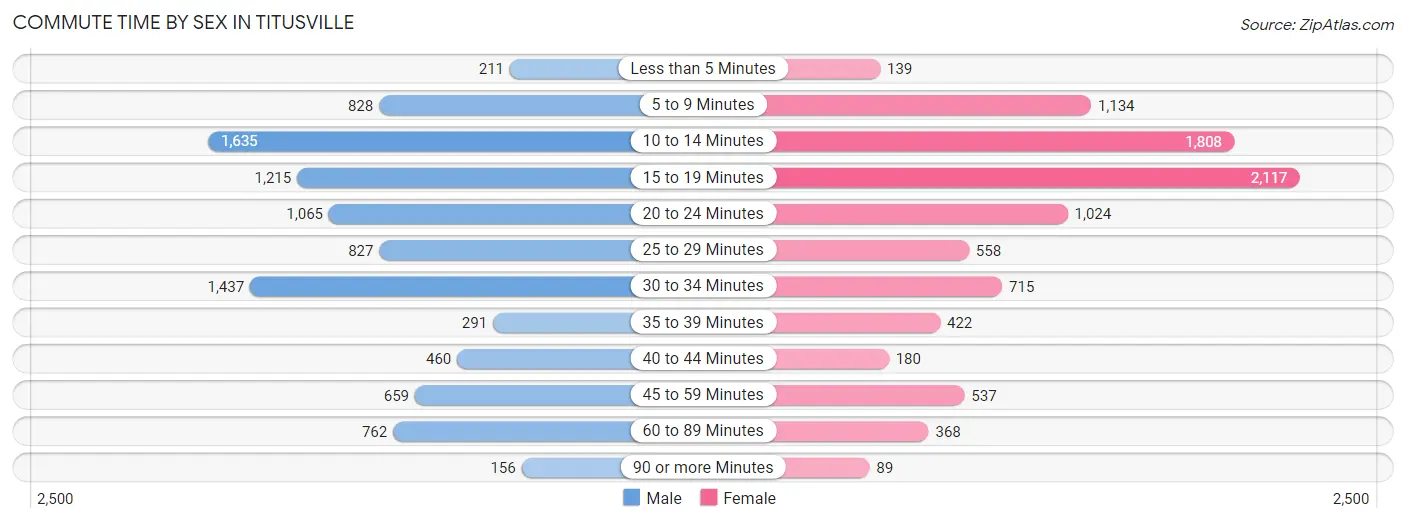
| Commute Time | Male | Female |
| Less than 5 Minutes | 211 (2.2%) | 139 (1.5%) |
| 5 to 9 Minutes | 828 (8.7%) | 1,134 (12.5%) |
| 10 to 14 Minutes | 1,635 (17.1%) | 1,808 (19.9%) |
| 15 to 19 Minutes | 1,215 (12.7%) | 2,117 (23.3%) |
| 20 to 24 Minutes | 1,065 (11.2%) | 1,024 (11.3%) |
| 25 to 29 Minutes | 827 (8.7%) | 558 (6.1%) |
| 30 to 34 Minutes | 1,437 (15.0%) | 715 (7.9%) |
| 35 to 39 Minutes | 291 (3.0%) | 422 (4.6%) |
| 40 to 44 Minutes | 460 (4.8%) | 180 (2.0%) |
| 45 to 59 Minutes | 659 (6.9%) | 537 (5.9%) |
| 60 to 89 Minutes | 762 (8.0%) | 368 (4.1%) |
| 90 or more Minutes | 156 (1.6%) | 89 (1.0%) |
Time of Departure to Work by Sex in Titusville
The most frequent times of departure to work in Titusville are 7:00 AM to 7:29 AM (1,386, 14.5%) for males and 7:00 AM to 7:29 AM (1,495, 16.4%) for females.
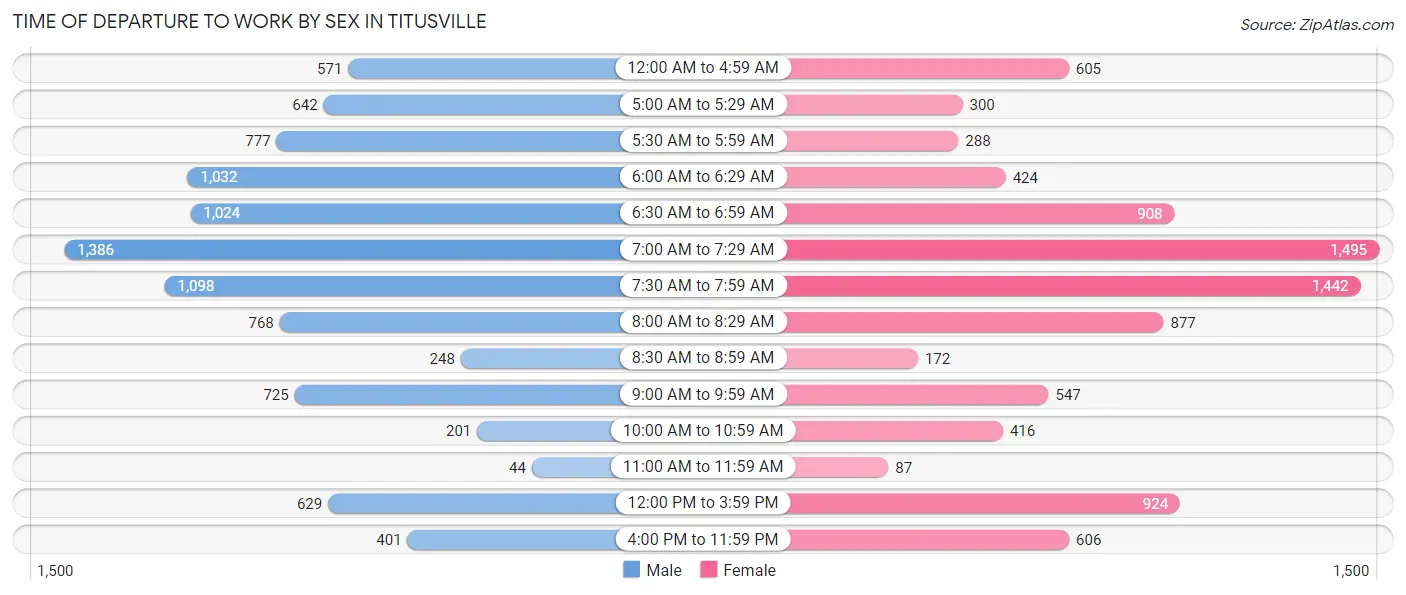
| Time of Departure | Male | Female |
| 12:00 AM to 4:59 AM | 571 (6.0%) | 605 (6.7%) |
| 5:00 AM to 5:29 AM | 642 (6.7%) | 300 (3.3%) |
| 5:30 AM to 5:59 AM | 777 (8.1%) | 288 (3.2%) |
| 6:00 AM to 6:29 AM | 1,032 (10.8%) | 424 (4.7%) |
| 6:30 AM to 6:59 AM | 1,024 (10.7%) | 908 (10.0%) |
| 7:00 AM to 7:29 AM | 1,386 (14.5%) | 1,495 (16.4%) |
| 7:30 AM to 7:59 AM | 1,098 (11.5%) | 1,442 (15.9%) |
| 8:00 AM to 8:29 AM | 768 (8.1%) | 877 (9.7%) |
| 8:30 AM to 8:59 AM | 248 (2.6%) | 172 (1.9%) |
| 9:00 AM to 9:59 AM | 725 (7.6%) | 547 (6.0%) |
| 10:00 AM to 10:59 AM | 201 (2.1%) | 416 (4.6%) |
| 11:00 AM to 11:59 AM | 44 (0.5%) | 87 (1.0%) |
| 12:00 PM to 3:59 PM | 629 (6.6%) | 924 (10.2%) |
| 4:00 PM to 11:59 PM | 401 (4.2%) | 606 (6.7%) |
| Total | 9,546 (100.0%) | 9,091 (100.0%) |
Housing Occupancy in Titusville
Occupancy by Ownership in Titusville
Of the total 19,883 dwellings in Titusville, owner-occupied units account for 14,133 (71.1%), while renter-occupied units make up 5,750 (28.9%).
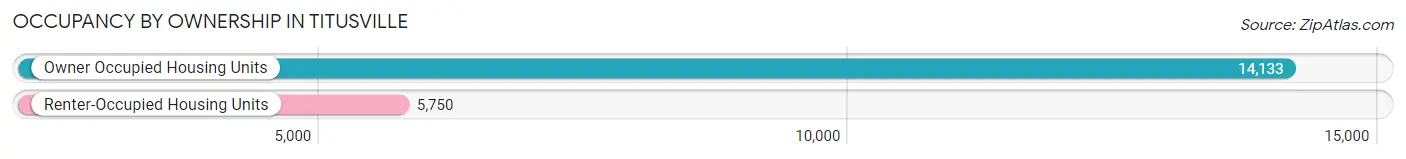
| Occupancy | # Housing Units | % Housing Units |
| Owner Occupied Housing Units | 14,133 | 71.1% |
| Renter-Occupied Housing Units | 5,750 | 28.9% |
| Total Occupied Housing Units | 19,883 | 100.0% |
Occupancy by Household Size in Titusville
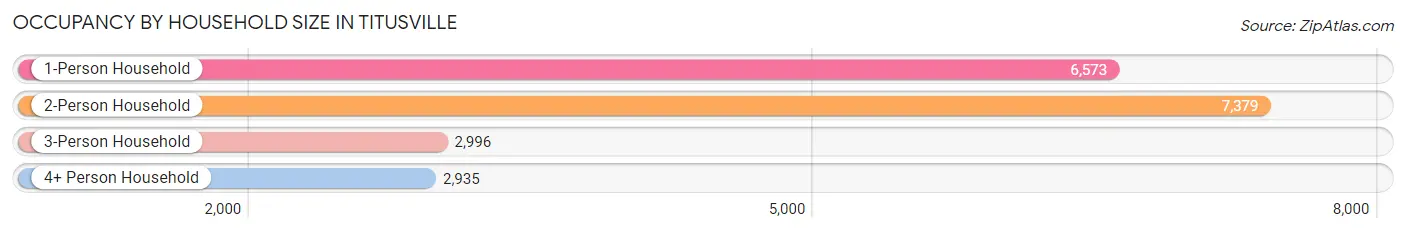
| Household Size | # Housing Units | % Housing Units |
| 1-Person Household | 6,573 | 33.1% |
| 2-Person Household | 7,379 | 37.1% |
| 3-Person Household | 2,996 | 15.1% |
| 4+ Person Household | 2,935 | 14.8% |
| Total Housing Units | 19,883 | 100.0% |
Occupancy by Ownership by Household Size in Titusville
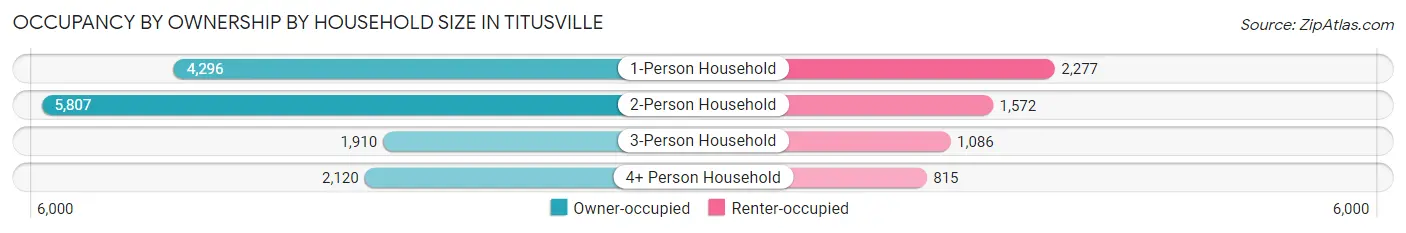
| Household Size | Owner-occupied | Renter-occupied |
| 1-Person Household | 4,296 (65.4%) | 2,277 (34.6%) |
| 2-Person Household | 5,807 (78.7%) | 1,572 (21.3%) |
| 3-Person Household | 1,910 (63.7%) | 1,086 (36.2%) |
| 4+ Person Household | 2,120 (72.2%) | 815 (27.8%) |
| Total Housing Units | 14,133 (71.1%) | 5,750 (28.9%) |
Occupancy by Educational Attainment in Titusville
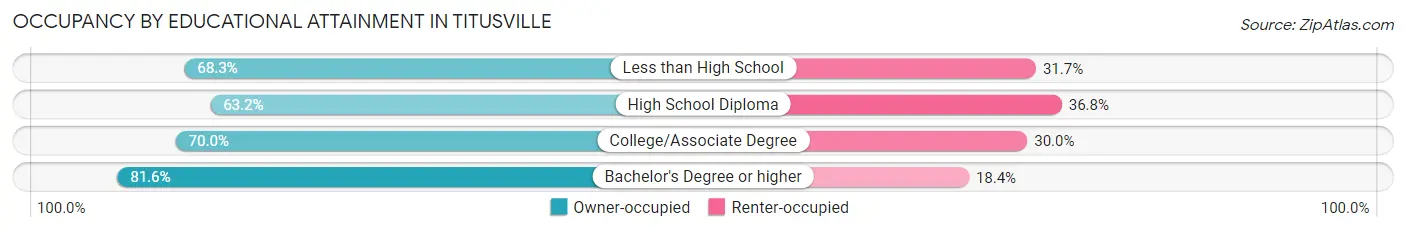
| Household Size | Owner-occupied | Renter-occupied |
| Less than High School | 1,162 (68.3%) | 539 (31.7%) |
| High School Diploma | 3,491 (63.2%) | 2,034 (36.8%) |
| College/Associate Degree | 5,143 (70.0%) | 2,200 (30.0%) |
| Bachelor's Degree or higher | 4,337 (81.6%) | 977 (18.4%) |
Occupancy by Age of Householder in Titusville
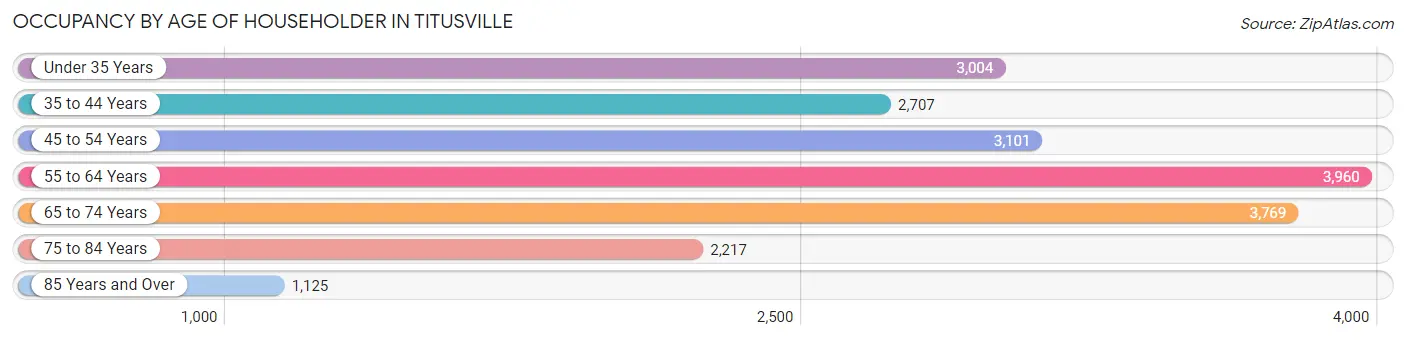
| Age Bracket | # Households | % Households |
| Under 35 Years | 3,004 | 15.1% |
| 35 to 44 Years | 2,707 | 13.6% |
| 45 to 54 Years | 3,101 | 15.6% |
| 55 to 64 Years | 3,960 | 19.9% |
| 65 to 74 Years | 3,769 | 19.0% |
| 75 to 84 Years | 2,217 | 11.2% |
| 85 Years and Over | 1,125 | 5.7% |
| Total | 19,883 | 100.0% |
Housing Finances in Titusville
Median Income by Occupancy in Titusville
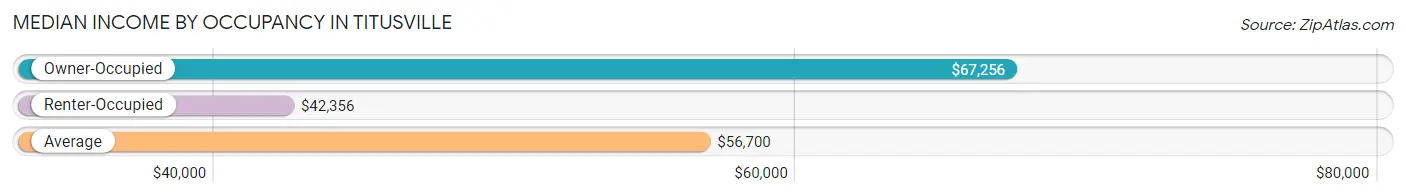
| Occupancy Type | # Households | Median Income |
| Owner-Occupied | 14,133 (71.1%) | $67,256 |
| Renter-Occupied | 5,750 (28.9%) | $42,356 |
| Average | 19,883 (100.0%) | $56,700 |
Occupancy by Householder Income Bracket in Titusville
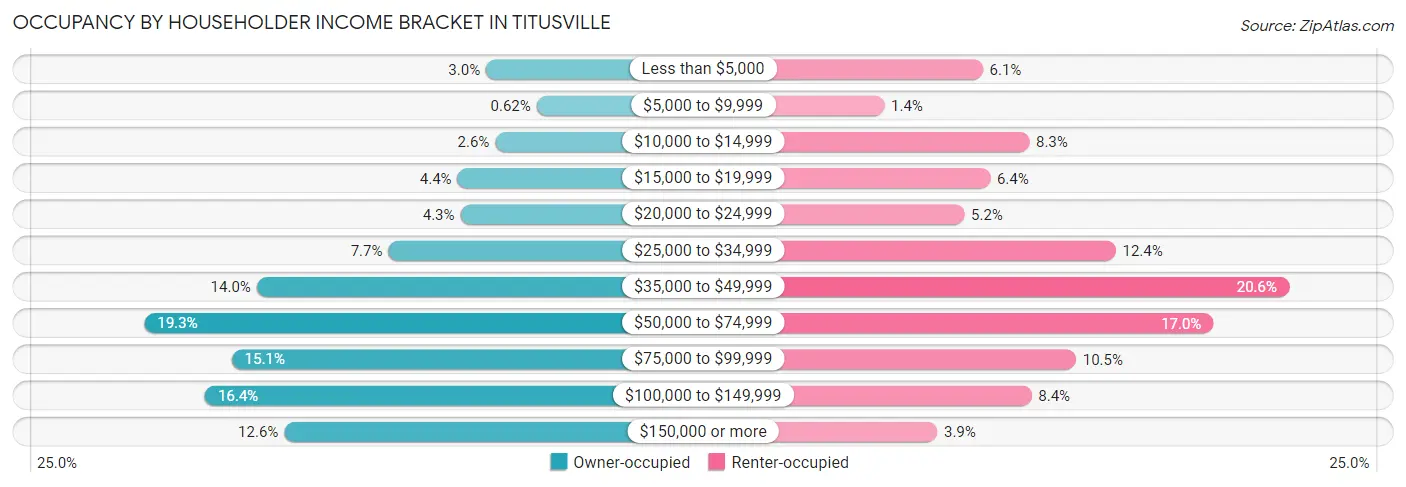
| Income Bracket | Owner-occupied | Renter-occupied |
| Less than $5,000 | 428 (3.0%) | 348 (6.0%) |
| $5,000 to $9,999 | 87 (0.6%) | 78 (1.4%) |
| $10,000 to $14,999 | 366 (2.6%) | 475 (8.3%) |
| $15,000 to $19,999 | 620 (4.4%) | 368 (6.4%) |
| $20,000 to $24,999 | 600 (4.3%) | 297 (5.2%) |
| $25,000 to $34,999 | 1,086 (7.7%) | 712 (12.4%) |
| $35,000 to $49,999 | 1,972 (14.0%) | 1,186 (20.6%) |
| $50,000 to $74,999 | 2,728 (19.3%) | 979 (17.0%) |
| $75,000 to $99,999 | 2,140 (15.1%) | 603 (10.5%) |
| $100,000 to $149,999 | 2,319 (16.4%) | 481 (8.4%) |
| $150,000 or more | 1,787 (12.6%) | 223 (3.9%) |
| Total | 14,133 (100.0%) | 5,750 (100.0%) |
Monthly Housing Cost Tiers in Titusville
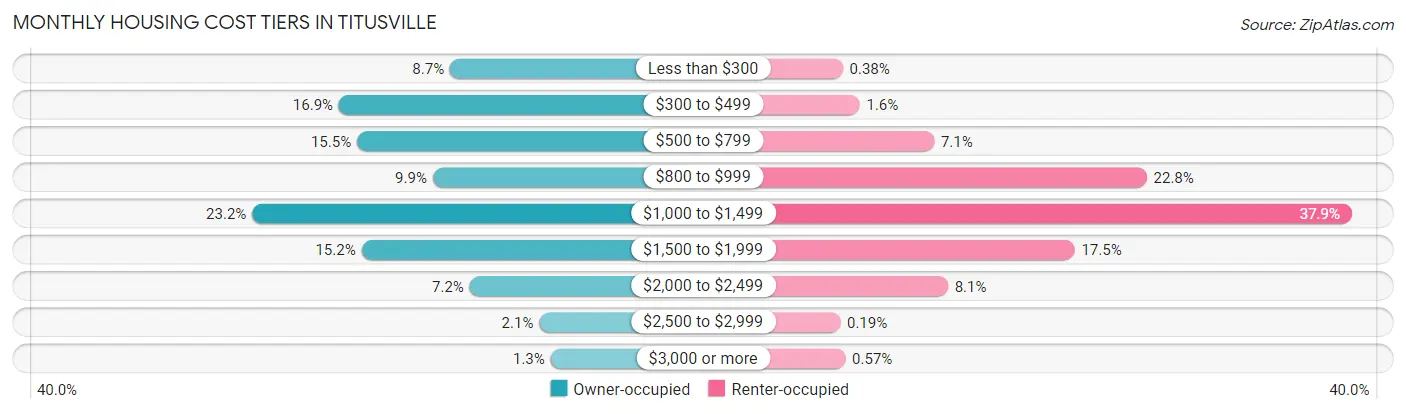
| Monthly Cost | Owner-occupied | Renter-occupied |
| Less than $300 | 1,226 (8.7%) | 22 (0.4%) |
| $300 to $499 | 2,381 (16.9%) | 94 (1.6%) |
| $500 to $799 | 2,194 (15.5%) | 409 (7.1%) |
| $800 to $999 | 1,405 (9.9%) | 1,309 (22.8%) |
| $1,000 to $1,499 | 3,285 (23.2%) | 2,178 (37.9%) |
| $1,500 to $1,999 | 2,147 (15.2%) | 1,004 (17.5%) |
| $2,000 to $2,499 | 1,020 (7.2%) | 467 (8.1%) |
| $2,500 to $2,999 | 297 (2.1%) | 11 (0.2%) |
| $3,000 or more | 178 (1.3%) | 33 (0.6%) |
| Total | 14,133 (100.0%) | 5,750 (100.0%) |
Physical Housing Characteristics in Titusville
Housing Structures in Titusville
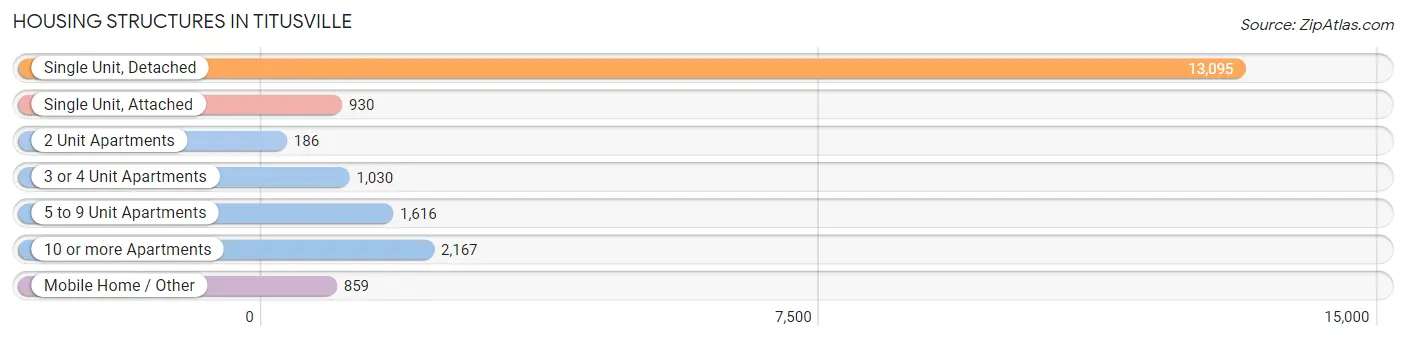
| Structure Type | # Housing Units | % Housing Units |
| Single Unit, Detached | 13,095 | 65.9% |
| Single Unit, Attached | 930 | 4.7% |
| 2 Unit Apartments | 186 | 0.9% |
| 3 or 4 Unit Apartments | 1,030 | 5.2% |
| 5 to 9 Unit Apartments | 1,616 | 8.1% |
| 10 or more Apartments | 2,167 | 10.9% |
| Mobile Home / Other | 859 | 4.3% |
| Total | 19,883 | 100.0% |
Housing Structures by Occupancy in Titusville
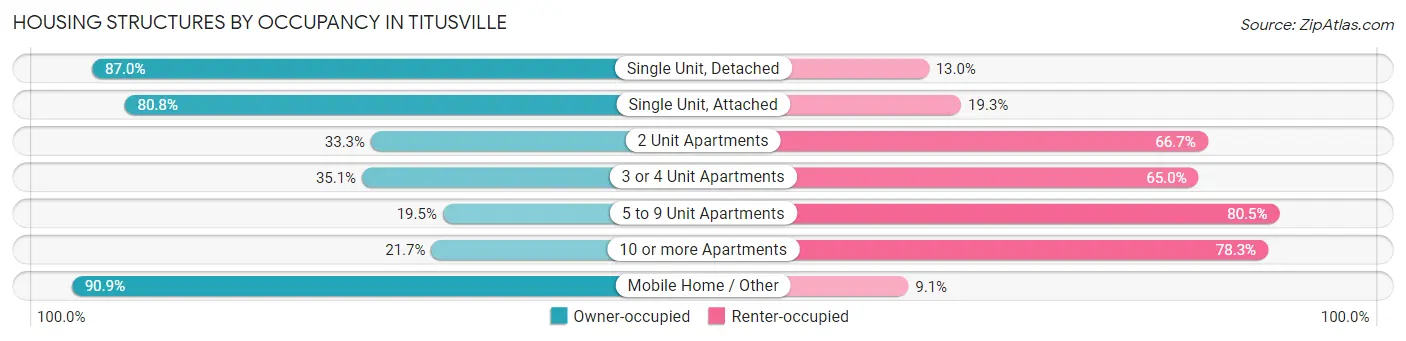
| Structure Type | Owner-occupied | Renter-occupied |
| Single Unit, Detached | 11,393 (87.0%) | 1,702 (13.0%) |
| Single Unit, Attached | 751 (80.7%) | 179 (19.3%) |
| 2 Unit Apartments | 62 (33.3%) | 124 (66.7%) |
| 3 or 4 Unit Apartments | 361 (35.0%) | 669 (64.9%) |
| 5 to 9 Unit Apartments | 315 (19.5%) | 1,301 (80.5%) |
| 10 or more Apartments | 470 (21.7%) | 1,697 (78.3%) |
| Mobile Home / Other | 781 (90.9%) | 78 (9.1%) |
| Total | 14,133 (71.1%) | 5,750 (28.9%) |
Housing Structures by Number of Rooms in Titusville
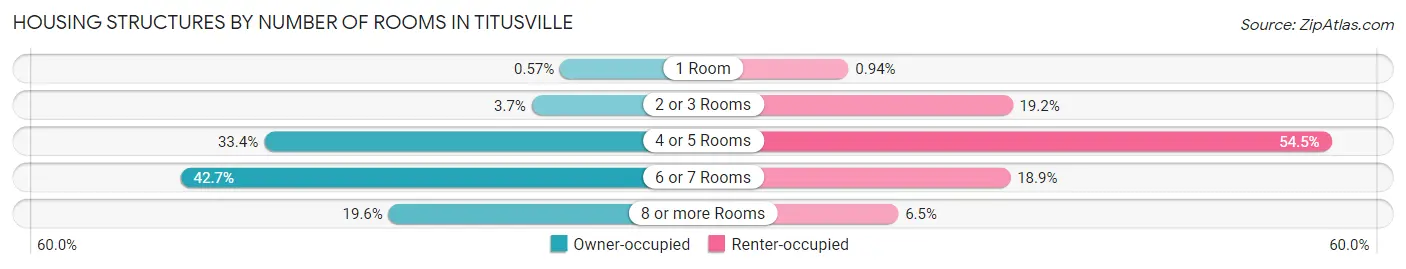
| Number of Rooms | Owner-occupied | Renter-occupied |
| 1 Room | 81 (0.6%) | 54 (0.9%) |
| 2 or 3 Rooms | 526 (3.7%) | 1,101 (19.2%) |
| 4 or 5 Rooms | 4,724 (33.4%) | 3,136 (54.5%) |
| 6 or 7 Rooms | 6,032 (42.7%) | 1,087 (18.9%) |
| 8 or more Rooms | 2,770 (19.6%) | 372 (6.5%) |
| Total | 14,133 (100.0%) | 5,750 (100.0%) |
Housing Structure by Heating Type in Titusville
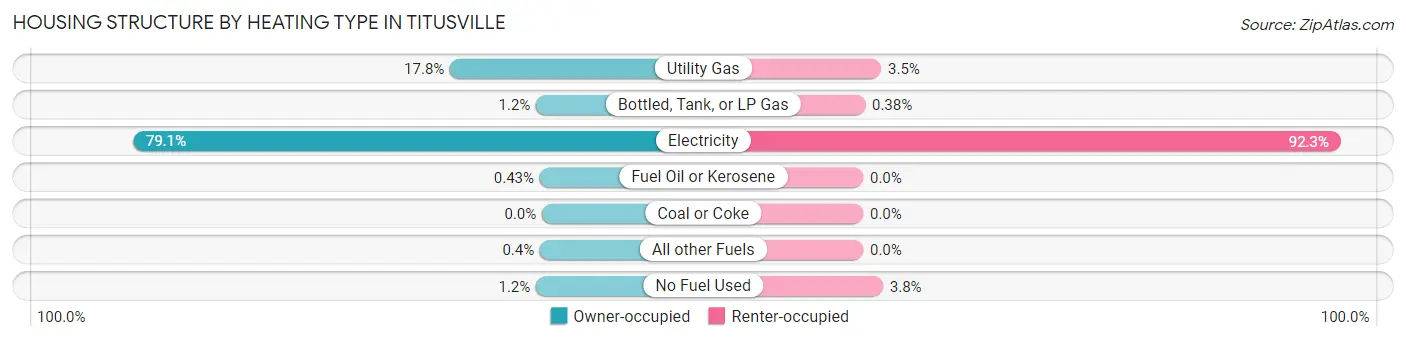
| Heating Type | Owner-occupied | Renter-occupied |
| Utility Gas | 2,511 (17.8%) | 200 (3.5%) |
| Bottled, Tank, or LP Gas | 163 (1.1%) | 22 (0.4%) |
| Electricity | 11,177 (79.1%) | 5,308 (92.3%) |
| Fuel Oil or Kerosene | 61 (0.4%) | 0 (0.0%) |
| Coal or Coke | 0 (0.0%) | 0 (0.0%) |
| All other Fuels | 57 (0.4%) | 0 (0.0%) |
| No Fuel Used | 164 (1.2%) | 220 (3.8%) |
| Total | 14,133 (100.0%) | 5,750 (100.0%) |
Household Vehicle Usage in Titusville
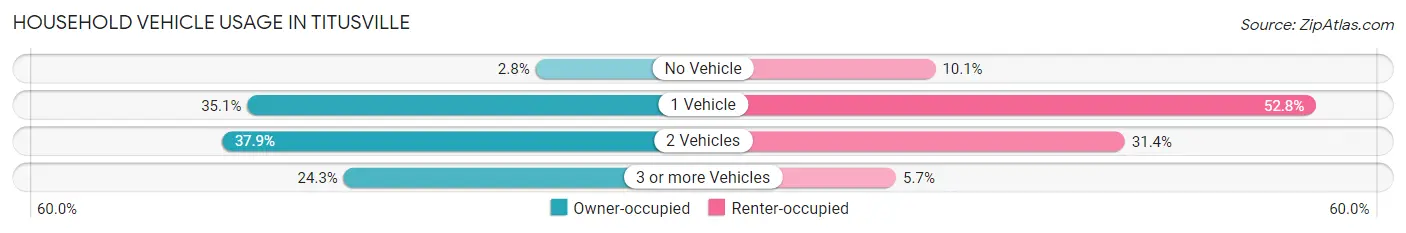
| Vehicles per Household | Owner-occupied | Renter-occupied |
| No Vehicle | 391 (2.8%) | 583 (10.1%) |
| 1 Vehicle | 4,955 (35.1%) | 3,034 (52.8%) |
| 2 Vehicles | 5,359 (37.9%) | 1,803 (31.4%) |
| 3 or more Vehicles | 3,428 (24.3%) | 330 (5.7%) |
| Total | 14,133 (100.0%) | 5,750 (100.0%) |
Real Estate & Mortgages in Titusville
Real Estate and Mortgage Overview in Titusville
| Characteristic | Without Mortgage | With Mortgage |
| Housing Units | 5,609 | 8,524 |
| Median Property Value | $184,200 | $225,400 |
| Median Household Income | $49,725 | $1,400 |
| Monthly Housing Costs | $444 | $178 |
| Real Estate Taxes | $1,057 | $329 |
Property Value by Mortgage Status in Titusville
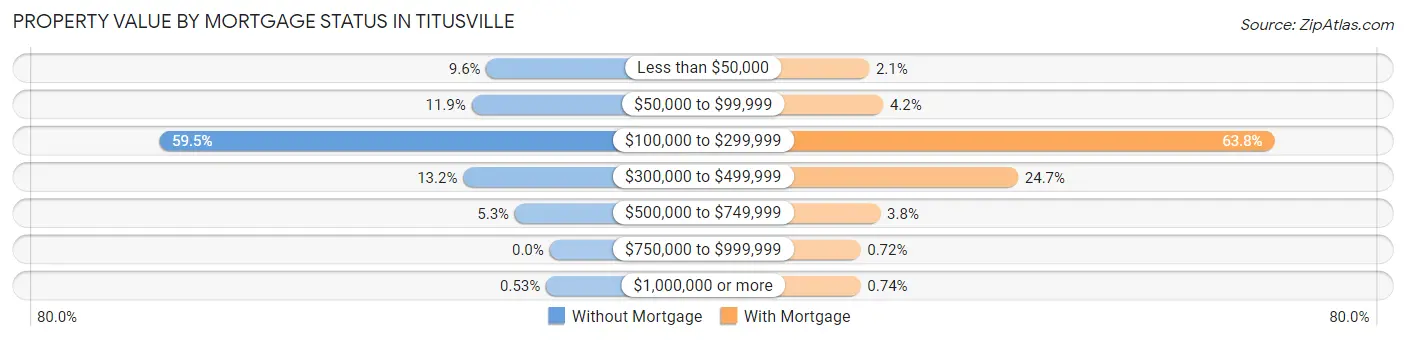
| Property Value | Without Mortgage | With Mortgage |
| Less than $50,000 | 540 (9.6%) | 175 (2.1%) |
| $50,000 to $99,999 | 667 (11.9%) | 356 (4.2%) |
| $100,000 to $299,999 | 3,338 (59.5%) | 5,441 (63.8%) |
| $300,000 to $499,999 | 738 (13.2%) | 2,108 (24.7%) |
| $500,000 to $749,999 | 296 (5.3%) | 320 (3.7%) |
| $750,000 to $999,999 | 0 (0.0%) | 61 (0.7%) |
| $1,000,000 or more | 30 (0.5%) | 63 (0.7%) |
| Total | 5,609 (100.0%) | 8,524 (100.0%) |
Household Income by Mortgage Status in Titusville
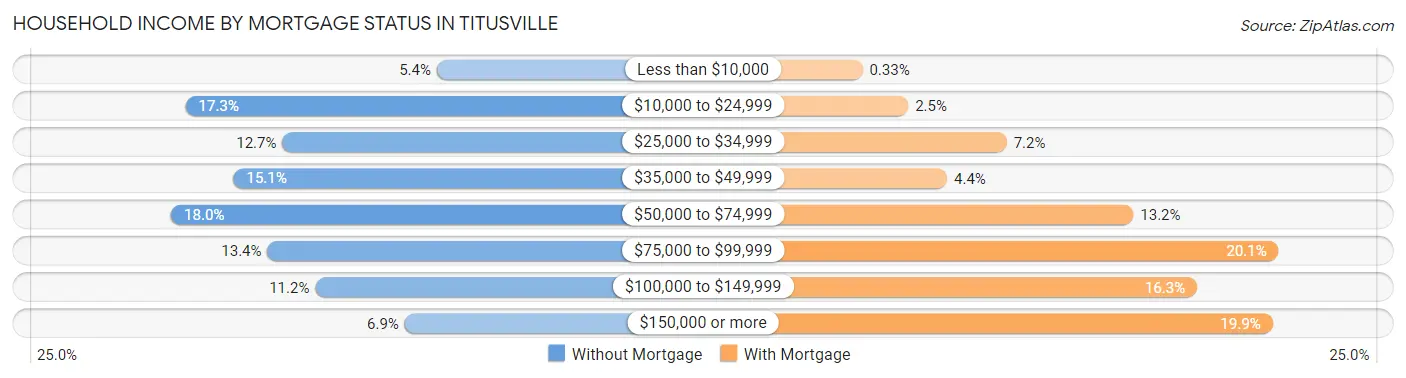
| Household Income | Without Mortgage | With Mortgage |
| Less than $10,000 | 301 (5.4%) | 28 (0.3%) |
| $10,000 to $24,999 | 972 (17.3%) | 214 (2.5%) |
| $25,000 to $34,999 | 714 (12.7%) | 614 (7.2%) |
| $35,000 to $49,999 | 844 (15.0%) | 372 (4.4%) |
| $50,000 to $74,999 | 1,011 (18.0%) | 1,128 (13.2%) |
| $75,000 to $99,999 | 754 (13.4%) | 1,717 (20.1%) |
| $100,000 to $149,999 | 626 (11.2%) | 1,386 (16.3%) |
| $150,000 or more | 387 (6.9%) | 1,693 (19.9%) |
| Total | 5,609 (100.0%) | 8,524 (100.0%) |
Property Value to Household Income Ratio in Titusville
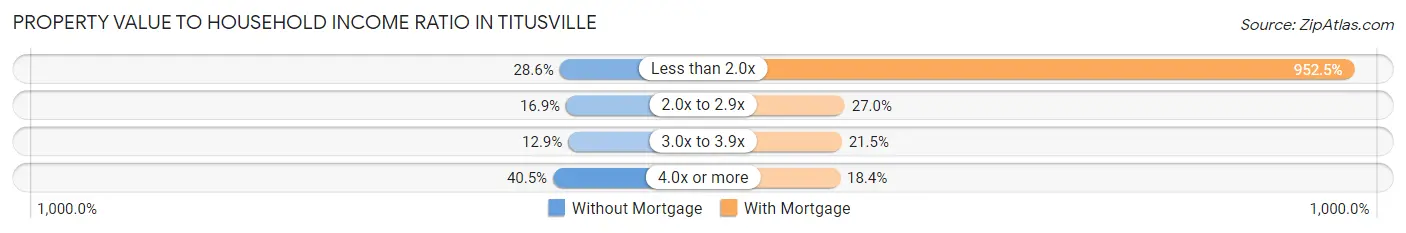
| Value-to-Income Ratio | Without Mortgage | With Mortgage |
| Less than 2.0x | 1,605 (28.6%) | 81,193 (952.5%) |
| 2.0x to 2.9x | 947 (16.9%) | 2,303 (27.0%) |
| 3.0x to 3.9x | 726 (12.9%) | 1,830 (21.5%) |
| 4.0x or more | 2,271 (40.5%) | 1,569 (18.4%) |
| Total | 5,609 (100.0%) | 8,524 (100.0%) |
Real Estate Taxes by Mortgage Status in Titusville
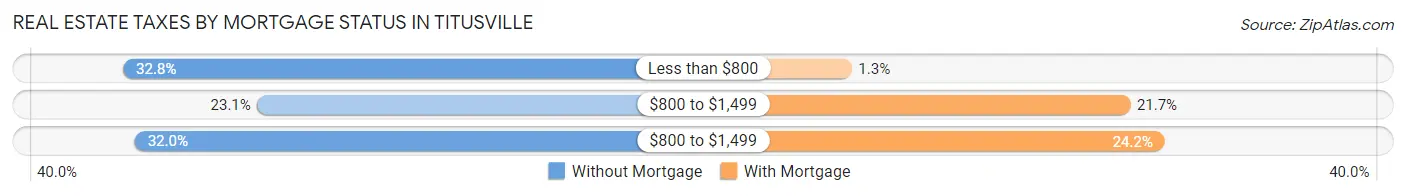
| Property Taxes | Without Mortgage | With Mortgage |
| Less than $800 | 1,840 (32.8%) | 114 (1.3%) |
| $800 to $1,499 | 1,293 (23.1%) | 1,849 (21.7%) |
| $800 to $1,499 | 1,792 (32.0%) | 2,065 (24.2%) |
| Total | 5,609 (100.0%) | 8,524 (100.0%) |
Health & Disability in Titusville
Health Insurance Coverage by Age in Titusville
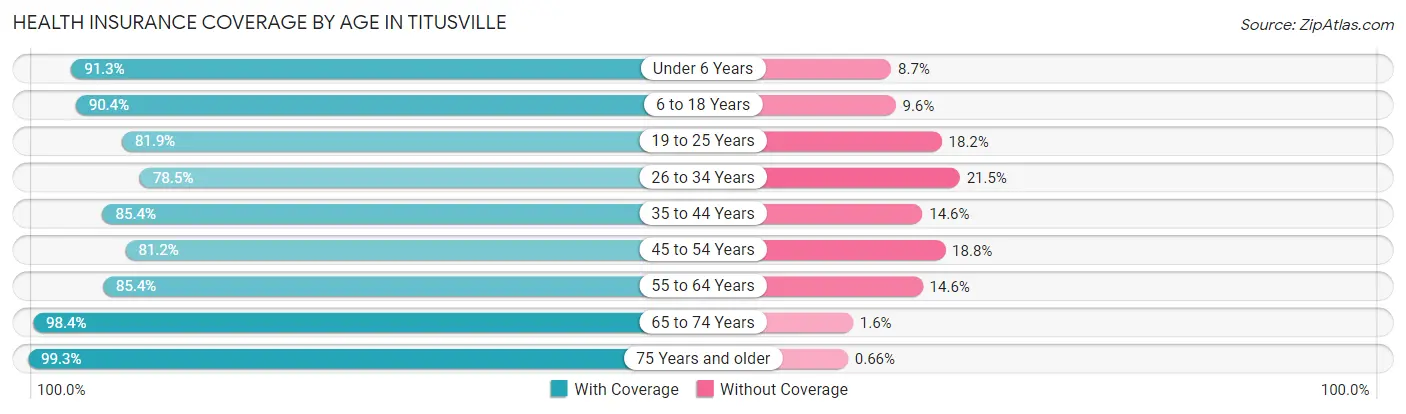
| Age Bracket | With Coverage | Without Coverage |
| Under 6 Years | 2,481 (91.3%) | 237 (8.7%) |
| 6 to 18 Years | 6,562 (90.4%) | 694 (9.6%) |
| 19 to 25 Years | 3,215 (81.9%) | 713 (18.1%) |
| 26 to 34 Years | 4,603 (78.5%) | 1,262 (21.5%) |
| 35 to 44 Years | 4,502 (85.4%) | 767 (14.6%) |
| 45 to 54 Years | 4,542 (81.2%) | 1,052 (18.8%) |
| 55 to 64 Years | 5,507 (85.4%) | 942 (14.6%) |
| 65 to 74 Years | 6,153 (98.4%) | 100 (1.6%) |
| 75 Years and older | 4,800 (99.3%) | 32 (0.7%) |
| Total | 42,365 (88.0%) | 5,799 (12.0%) |
Health Insurance Coverage by Citizenship Status in Titusville
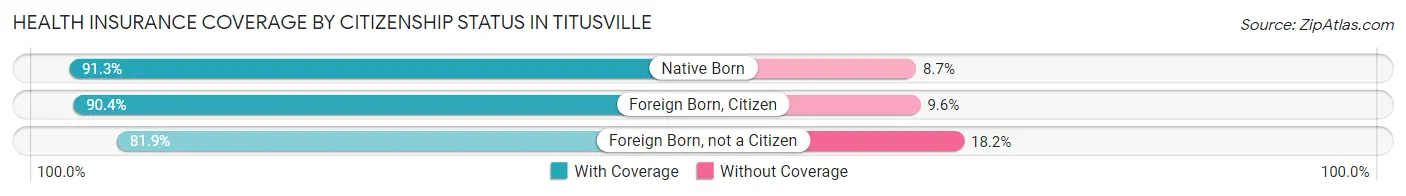
| Citizenship Status | With Coverage | Without Coverage |
| Native Born | 2,481 (91.3%) | 237 (8.7%) |
| Foreign Born, Citizen | 6,562 (90.4%) | 694 (9.6%) |
| Foreign Born, not a Citizen | 3,215 (81.9%) | 713 (18.1%) |
Health Insurance Coverage by Household Income in Titusville
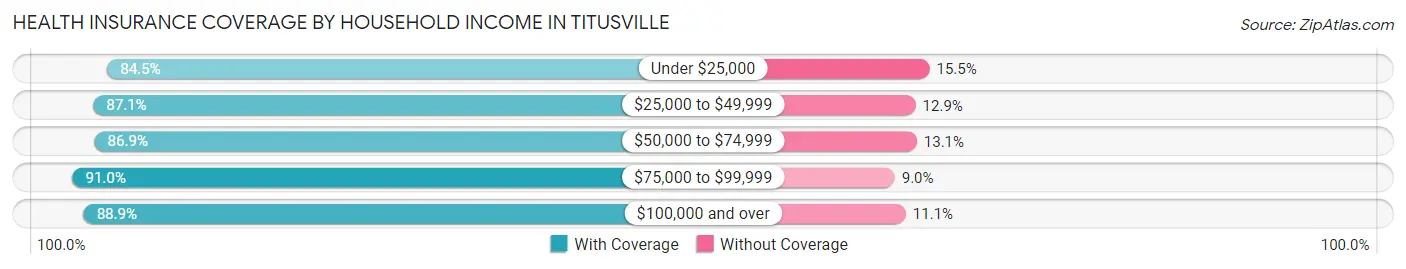
| Household Income | With Coverage | Without Coverage |
| Under $25,000 | 4,652 (84.5%) | 853 (15.5%) |
| $25,000 to $49,999 | 9,119 (87.1%) | 1,350 (12.9%) |
| $50,000 to $74,999 | 7,589 (86.9%) | 1,147 (13.1%) |
| $75,000 to $99,999 | 6,900 (91.0%) | 682 (9.0%) |
| $100,000 and over | 13,919 (88.9%) | 1,734 (11.1%) |
Public vs Private Health Insurance Coverage by Age in Titusville
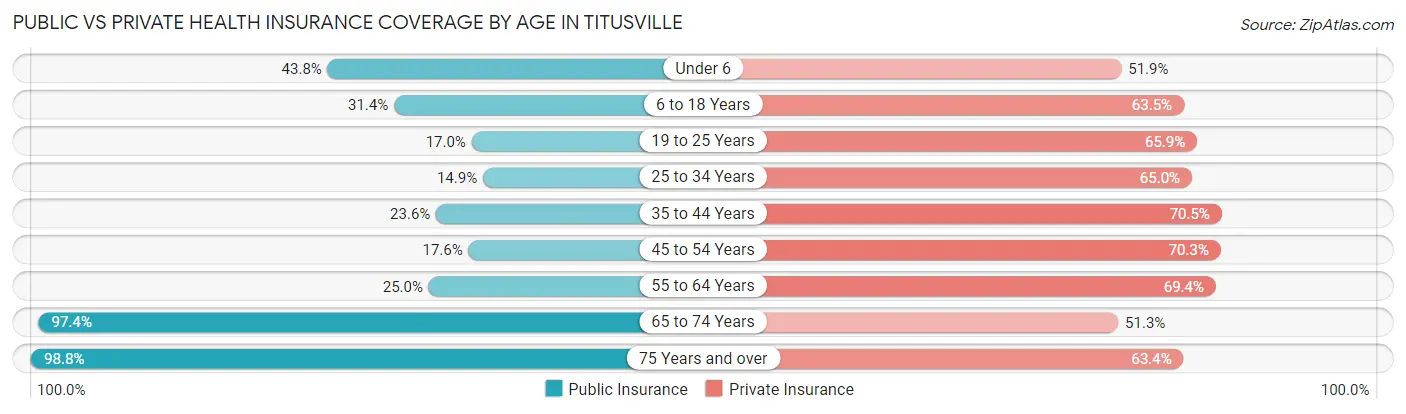
| Age Bracket | Public Insurance | Private Insurance |
| Under 6 | 1,189 (43.8%) | 1,410 (51.9%) |
| 6 to 18 Years | 2,280 (31.4%) | 4,607 (63.5%) |
| 19 to 25 Years | 668 (17.0%) | 2,590 (65.9%) |
| 25 to 34 Years | 875 (14.9%) | 3,811 (65.0%) |
| 35 to 44 Years | 1,244 (23.6%) | 3,715 (70.5%) |
| 45 to 54 Years | 984 (17.6%) | 3,934 (70.3%) |
| 55 to 64 Years | 1,610 (25.0%) | 4,476 (69.4%) |
| 65 to 74 Years | 6,091 (97.4%) | 3,208 (51.3%) |
| 75 Years and over | 4,773 (98.8%) | 3,065 (63.4%) |
| Total | 19,714 (40.9%) | 30,816 (64.0%) |
Disability Status by Sex by Age in Titusville
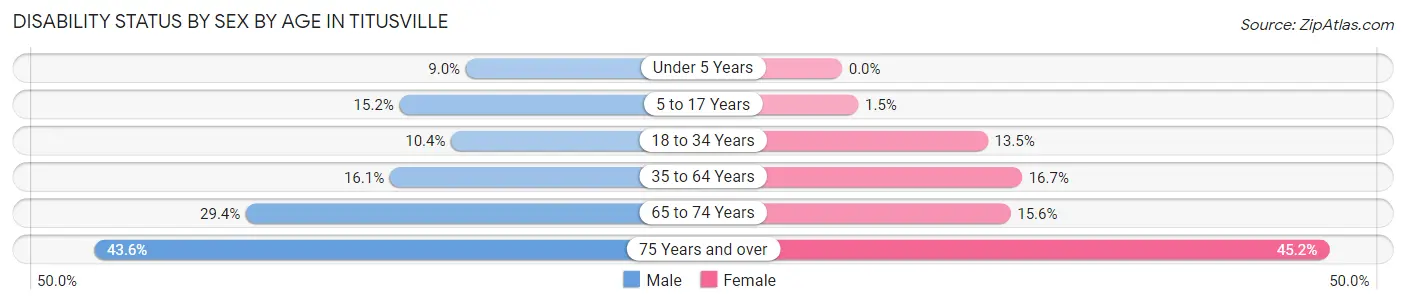
| Age Bracket | Male | Female |
| Under 5 Years | 109 (9.0%) | 0 (0.0%) |
| 5 to 17 Years | 550 (15.2%) | 50 (1.5%) |
| 18 to 34 Years | 496 (10.4%) | 785 (13.5%) |
| 35 to 64 Years | 1,362 (16.1%) | 1,478 (16.7%) |
| 65 to 74 Years | 802 (29.4%) | 552 (15.6%) |
| 75 Years and over | 832 (43.6%) | 1,321 (45.2%) |
Disability Class by Sex by Age in Titusville
Disability Class: Hearing Difficulty
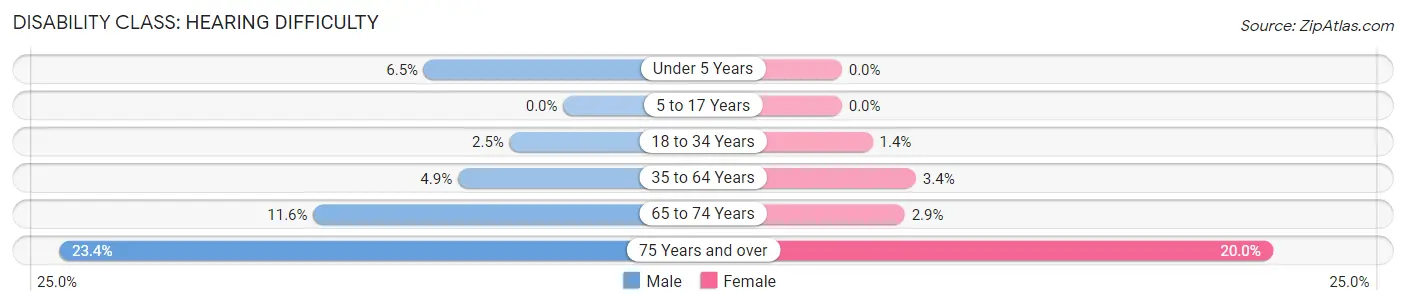
| Age Bracket | Male | Female |
| Under 5 Years | 78 (6.5%) | 0 (0.0%) |
| 5 to 17 Years | 0 (0.0%) | 0 (0.0%) |
| 18 to 34 Years | 119 (2.5%) | 83 (1.4%) |
| 35 to 64 Years | 414 (4.9%) | 304 (3.4%) |
| 65 to 74 Years | 316 (11.6%) | 103 (2.9%) |
| 75 Years and over | 447 (23.4%) | 584 (20.0%) |
Disability Class: Vision Difficulty
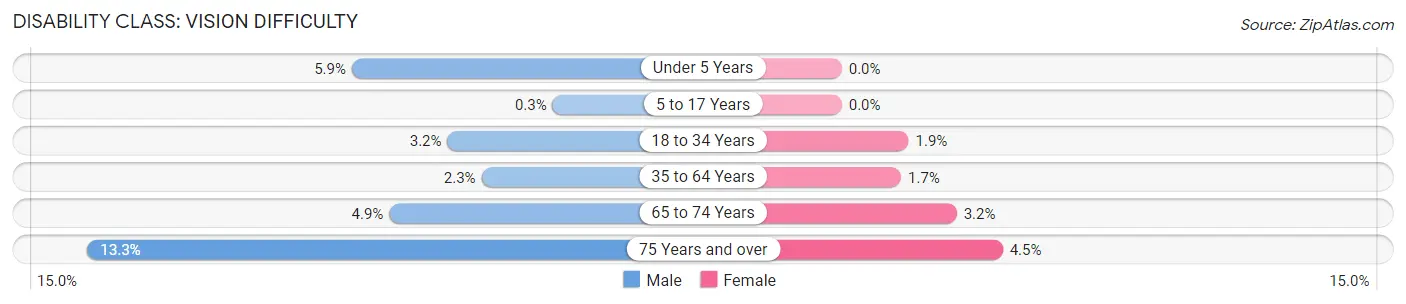
| Age Bracket | Male | Female |
| Under 5 Years | 71 (5.9%) | 0 (0.0%) |
| 5 to 17 Years | 11 (0.3%) | 0 (0.0%) |
| 18 to 34 Years | 154 (3.2%) | 108 (1.9%) |
| 35 to 64 Years | 193 (2.3%) | 146 (1.7%) |
| 65 to 74 Years | 132 (4.9%) | 113 (3.2%) |
| 75 Years and over | 253 (13.3%) | 131 (4.5%) |
Disability Class: Cognitive Difficulty
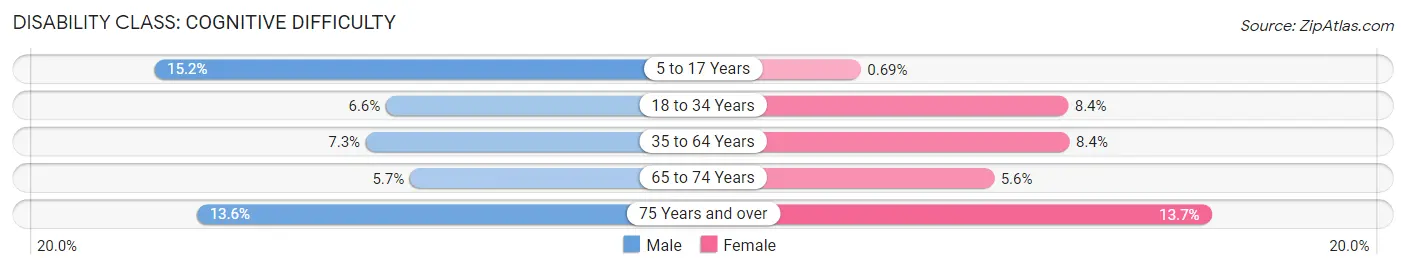
| Age Bracket | Male | Female |
| 5 to 17 Years | 550 (15.2%) | 23 (0.7%) |
| 18 to 34 Years | 314 (6.6%) | 487 (8.4%) |
| 35 to 64 Years | 620 (7.3%) | 747 (8.4%) |
| 65 to 74 Years | 155 (5.7%) | 199 (5.6%) |
| 75 Years and over | 260 (13.6%) | 401 (13.7%) |
Disability Class: Ambulatory Difficulty
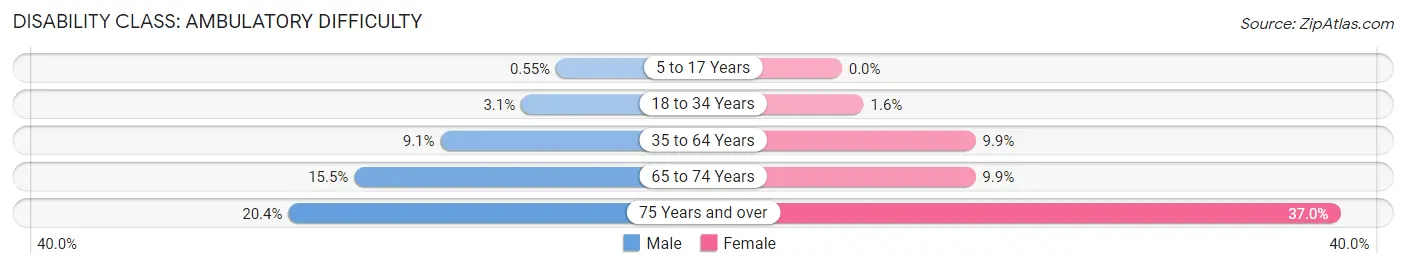
| Age Bracket | Male | Female |
| 5 to 17 Years | 20 (0.5%) | 0 (0.0%) |
| 18 to 34 Years | 150 (3.1%) | 94 (1.6%) |
| 35 to 64 Years | 773 (9.1%) | 879 (9.9%) |
| 65 to 74 Years | 423 (15.5%) | 350 (9.9%) |
| 75 Years and over | 390 (20.4%) | 1,081 (37.0%) |
Disability Class: Self-Care Difficulty
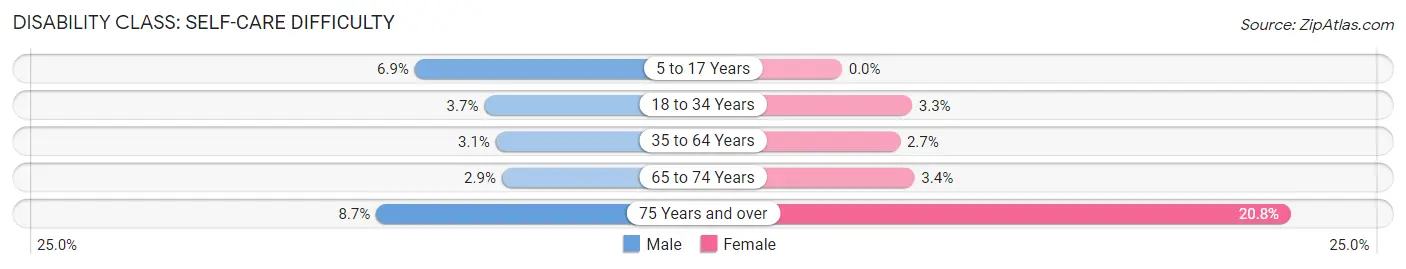
| Age Bracket | Male | Female |
| 5 to 17 Years | 250 (6.9%) | 0 (0.0%) |
| 18 to 34 Years | 175 (3.7%) | 189 (3.3%) |
| 35 to 64 Years | 266 (3.1%) | 239 (2.7%) |
| 65 to 74 Years | 78 (2.9%) | 119 (3.4%) |
| 75 Years and over | 166 (8.7%) | 609 (20.8%) |
Technology Access in Titusville
Computing Device Access in Titusville
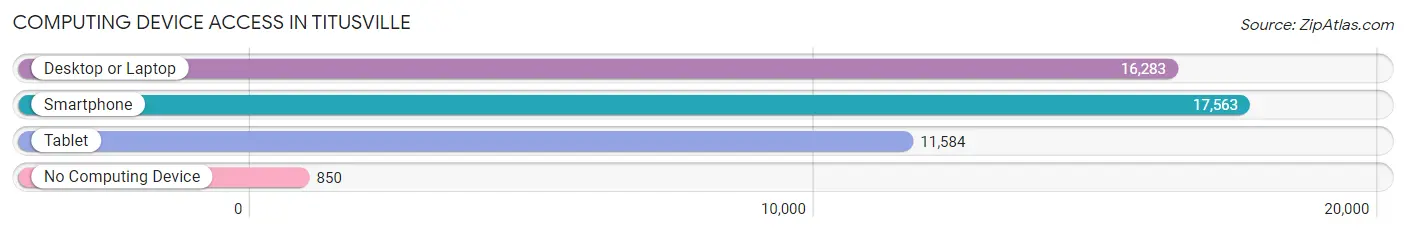
| Device Type | # Households | % Households |
| Desktop or Laptop | 16,283 | 81.9% |
| Smartphone | 17,563 | 88.3% |
| Tablet | 11,584 | 58.3% |
| No Computing Device | 850 | 4.3% |
| Total | 19,883 | 100.0% |
Internet Access in Titusville
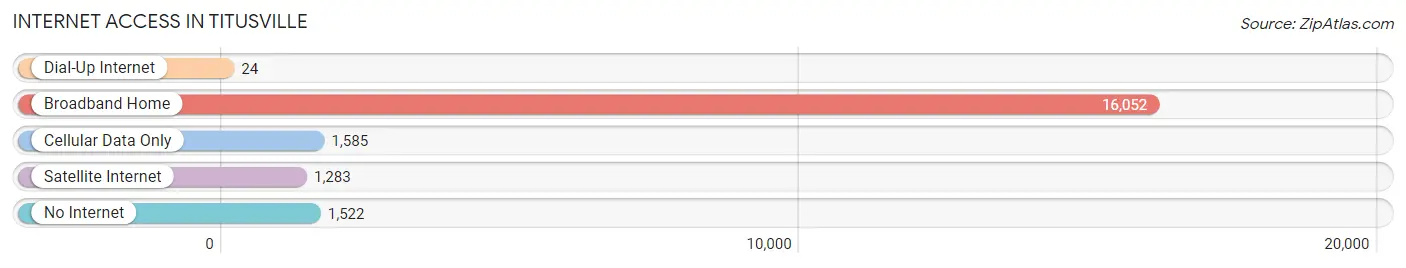
| Internet Type | # Households | % Households |
| Dial-Up Internet | 24 | 0.1% |
| Broadband Home | 16,052 | 80.7% |
| Cellular Data Only | 1,585 | 8.0% |
| Satellite Internet | 1,283 | 6.5% |
| No Internet | 1,522 | 7.6% |
| Total | 19,883 | 100.0% |
Titusville Summary
Titusville is a city located in Brevard County, Florida, United States. It is located along the Indian River, just south of the Kennedy Space Center and Cape Canaveral Air Force Station. The city is known as the "Gateway to the Space Coast" and is home to the U.S. Space Walk of Fame. As of the 2010 census, the city had a population of 43,761.
History
Titusville was founded in 1867 by Colonel Henry T Titus, a former Confederate officer. The city was named after him and was incorporated in 1887. Titusville was originally a small fishing village, but it quickly grew into a bustling town due to its proximity to the Indian River and the nearby Canaveral National Seashore.
In the early 1900s, the city began to attract tourists due to its location on the Indian River. The city was also home to a number of citrus groves and was known for its production of grapefruit.
In the 1950s, the city began to experience a population boom due to the development of the nearby Kennedy Space Center. The city was also home to a number of aerospace companies, which helped to further fuel the population growth.
Geography
Titusville is located in Brevard County, Florida, along the Indian River. The city is located just south of the Kennedy Space Center and Cape Canaveral Air Force Station. The city is bordered by the cities of Cocoa, Merritt Island, and Port St. John.
The city has a total area of 24.2 square miles, of which 22.7 square miles is land and 1.5 square miles is water. The city is located at an elevation of 24 feet above sea level.
Economy
Titusville is home to a number of aerospace companies, including Lockheed Martin, Northrop Grumman, and Boeing. The city is also home to a number of other businesses, including retail stores, restaurants, and hotels.
The city is also home to the U.S. Space Walk of Fame, which is a museum dedicated to the history of the space program. The museum is located in the downtown area and is a popular tourist attraction.
Demographics
As of the 2010 census, there were 43,761 people, 17,845 households, and 11,845 families residing in the city. The population density was 1,902.3 people per square mile. The racial makeup of the city was 77.2% White, 15.3% African American, 0.5% Native American, 1.7% Asian, 0.1% Pacific Islander, 2.7% from other races, and 2.5% from two or more races. Hispanic or Latino of any race were 8.7% of the population.
The median income for a household in the city was $37,837, and the median income for a family was $45,845. The per capita income for the city was $20,945. About 11.7% of families and 15.2% of the population were below the poverty line, including 22.2% of those under age 18 and 8.2% of those age 65 or over.
Common Questions
What is Per Capita Income in Titusville?
Per Capita income in Titusville is $31,887.
What is the Median Family Income in Titusville?
Median Family Income in Titusville is $74,410.
What is the Median Household income in Titusville?
Median Household Income in Titusville is $56,700.
What is Income or Wage Gap in Titusville?
Income or Wage Gap in Titusville is 35.8%.
Women in Titusville earn 64.2 cents for every dollar earned by a man.
What is Family Income Deficit in Titusville?
Family Income Deficit in Titusville is $8,218.
Families that are below poverty line in Titusville earn $8,218 less on average than the poverty threshold level.
What is Inequality or Gini Index in Titusville?
Inequality or Gini Index in Titusville is 0.42.
What is the Total Population of Titusville?
Total Population of Titusville is 48,595.
What is the Total Male Population of Titusville?
Total Male Population of Titusville is 22,820.
What is the Total Female Population of Titusville?
Total Female Population of Titusville is 25,775.
What is the Ratio of Males per 100 Females in Titusville?
There are 88.54 Males per 100 Females in Titusville.
What is the Ratio of Females per 100 Males in Titusville?
There are 112.95 Females per 100 Males in Titusville.
What is the Median Population Age in Titusville?
Median Population Age in Titusville is 43.7 Years.
What is the Average Family Size in Titusville
Average Family Size in Titusville is 3.1 People.
What is the Average Household Size in Titusville
Average Household Size in Titusville is 2.4 People.
How Large is the Labor Force in Titusville?
There are 22,288 People in the Labor Forcein in Titusville.
What is the Percentage of People in the Labor Force in Titusville?
55.0% of People are in the Labor Force in Titusville.
What is the Unemployment Rate in Titusville?
Unemployment Rate in Titusville is 6.2%.