Tiger Point, FL Map & Demographics
Tiger Point Map
Tiger Point Overview
$53,684
PER CAPITA INCOME
$121,667
AVG FAMILY INCOME
$116,711
AVG HOUSEHOLD INCOME
36.2%
WAGE / INCOME GAP [ % ]
63.8¢/ $1
WAGE / INCOME GAP [ $ ]
0.33
INEQUALITY / GINI INDEX
3,511
TOTAL POPULATION
1,721
MALE POPULATION
1,790
FEMALE POPULATION
96.15
MALES / 100 FEMALES
104.01
FEMALES / 100 MALES
44.7
MEDIAN AGE
3.0
AVG FAMILY SIZE
2.6
AVG HOUSEHOLD SIZE
1,553
LABOR FORCE [ PEOPLE ]
52.8%
PERCENT IN LABOR FORCE
3.5%
UNEMPLOYMENT RATE
Income in Tiger Point
Income Overview in Tiger Point
Per Capita Income in Tiger Point is $53,684, while median incomes of families and households are $121,667 and $116,711 respectively.
| Characteristic | Number | Measure |
| Per Capita Income | 3,511 | $53,684 |
| Median Family Income | 1,020 | $121,667 |
| Mean Family Income | 1,020 | $148,229 |
| Median Household Income | 1,366 | $116,711 |
| Mean Household Income | 1,366 | $138,351 |
| Income Deficit | 1,020 | $0 |
| Wage / Income Gap (%) | 3,511 | 36.22% |
| Wage / Income Gap ($) | 3,511 | 63.78¢ per $1 |
| Gini / Inequality Index | 3,511 | 0.33 |
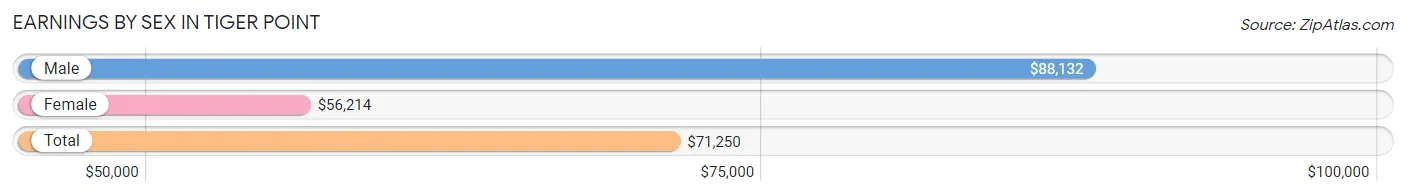
Earnings by Sex in Tiger Point
Average Earnings in Tiger Point are $71,250, $88,132 for men and $56,214 for women, a difference of 36.2%.
| Sex | Number | Average Earnings |
| Male | 911 (57.7%) | $88,132 |
| Female | 668 (42.3%) | $56,214 |
| Total | 1,579 (100.0%) | $71,250 |
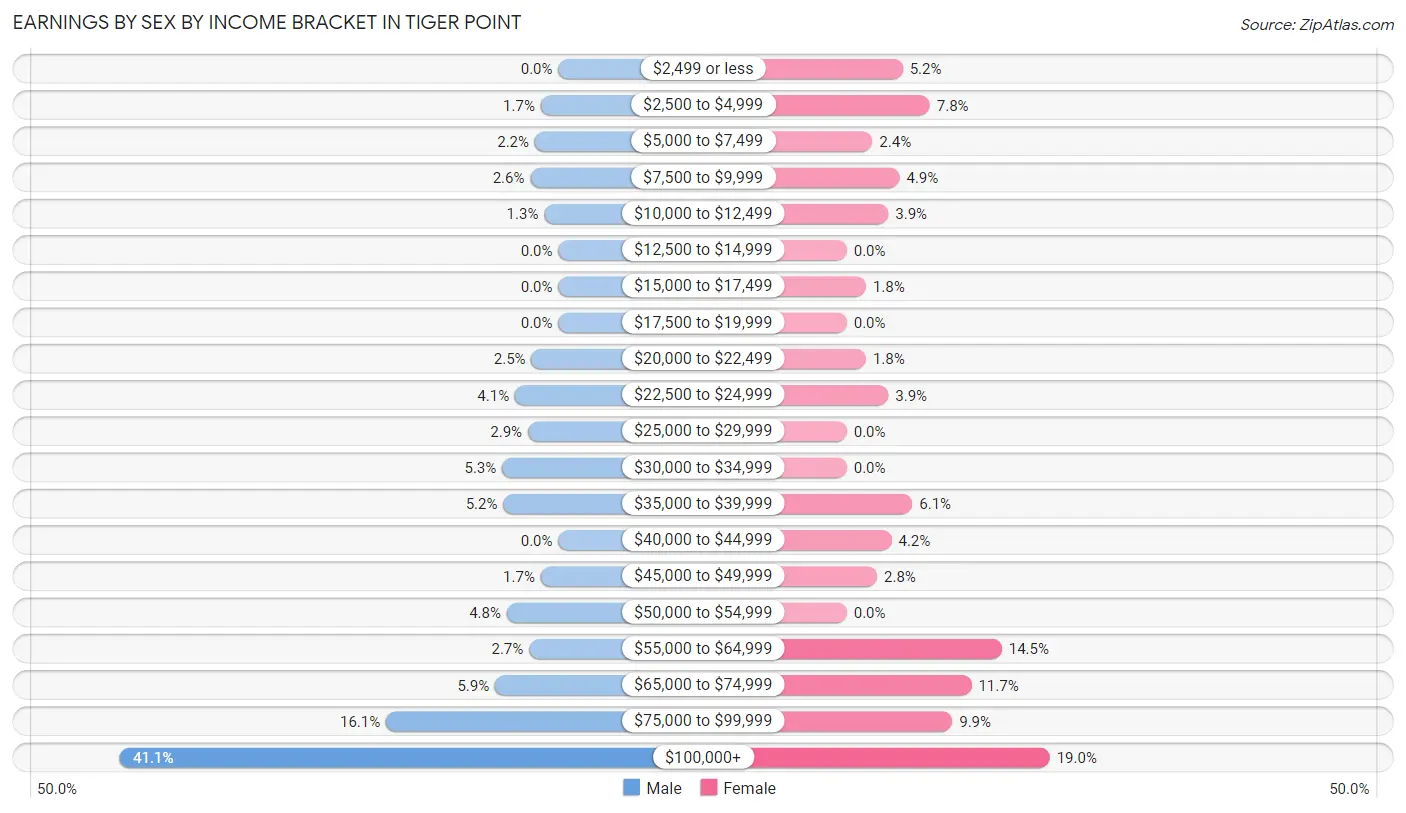
Earnings by Sex by Income Bracket in Tiger Point
The most common earnings brackets in Tiger Point are $100,000+ for men (374 | 41.0%) and $100,000+ for women (127 | 19.0%).
| Income | Male | Female |
| $2,499 or less | 0 (0.0%) | 35 (5.2%) |
| $2,500 to $4,999 | 15 (1.7%) | 52 (7.8%) |
| $5,000 to $7,499 | 20 (2.2%) | 16 (2.4%) |
| $7,500 to $9,999 | 24 (2.6%) | 33 (4.9%) |
| $10,000 to $12,499 | 12 (1.3%) | 26 (3.9%) |
| $12,500 to $14,999 | 0 (0.0%) | 0 (0.0%) |
| $15,000 to $17,499 | 0 (0.0%) | 12 (1.8%) |
| $17,500 to $19,999 | 0 (0.0%) | 0 (0.0%) |
| $20,000 to $22,499 | 23 (2.5%) | 12 (1.8%) |
| $22,500 to $24,999 | 37 (4.1%) | 26 (3.9%) |
| $25,000 to $29,999 | 26 (2.9%) | 0 (0.0%) |
| $30,000 to $34,999 | 48 (5.3%) | 0 (0.0%) |
| $35,000 to $39,999 | 47 (5.2%) | 41 (6.1%) |
| $40,000 to $44,999 | 0 (0.0%) | 28 (4.2%) |
| $45,000 to $49,999 | 15 (1.7%) | 19 (2.8%) |
| $50,000 to $54,999 | 44 (4.8%) | 0 (0.0%) |
| $55,000 to $64,999 | 25 (2.7%) | 97 (14.5%) |
| $65,000 to $74,999 | 54 (5.9%) | 78 (11.7%) |
| $75,000 to $99,999 | 147 (16.1%) | 66 (9.9%) |
| $100,000+ | 374 (41.0%) | 127 (19.0%) |
| Total | 911 (100.0%) | 668 (100.0%) |
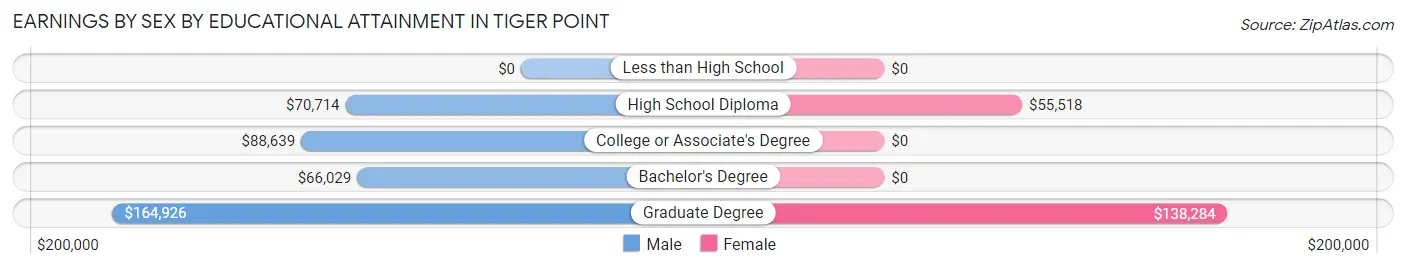
Earnings by Sex by Educational Attainment in Tiger Point
Average earnings in Tiger Point are $88,132 for men and $56,964 for women, a difference of 35.4%. Men with an educational attainment of graduate degree enjoy the highest average annual earnings of $164,926, while those with bachelor's degree education earn the least with $66,029. Women with an educational attainment of graduate degree earn the most with the average annual earnings of $138,284, while those with high school diploma education have the smallest earnings of $55,518.
| Educational Attainment | Male Income | Female Income |
| Less than High School | - | - |
| High School Diploma | $70,714 | $55,518 |
| College or Associate's Degree | $88,639 | $0 |
| Bachelor's Degree | $66,029 | $0 |
| Graduate Degree | $164,926 | $138,284 |
| Total | $88,132 | $56,964 |
Family Income in Tiger Point
Family Income Brackets in Tiger Point
According to the Tiger Point family income data, there are 252 families falling into the $100,000 to $149,999 income range, which is the most common income bracket and makes up 24.7% of all families.
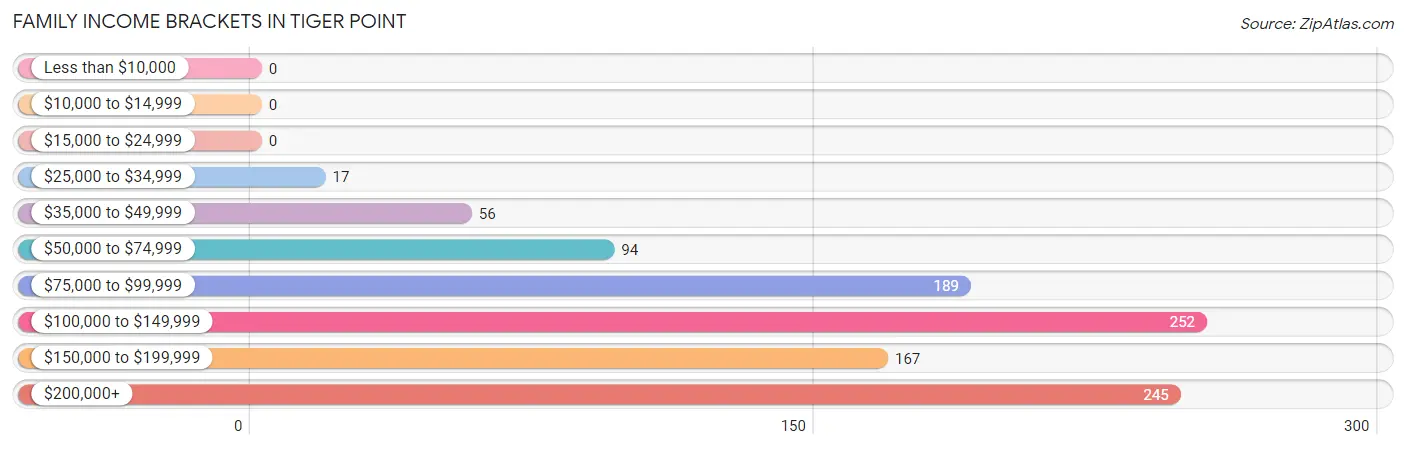
| Income Bracket | # Families | % Families |
| Less than $10,000 | 0 | 0.0% |
| $10,000 to $14,999 | 0 | 0.0% |
| $15,000 to $24,999 | 0 | 0.0% |
| $25,000 to $34,999 | 17 | 1.7% |
| $35,000 to $49,999 | 56 | 5.5% |
| $50,000 to $74,999 | 94 | 9.2% |
| $75,000 to $99,999 | 189 | 18.5% |
| $100,000 to $149,999 | 252 | 24.7% |
| $150,000 to $199,999 | 167 | 16.4% |
| $200,000+ | 245 | 24.0% |
Family Income by Famaliy Size in Tiger Point
4-person families (353 | 34.6%) account for the highest median family income in Tiger Point with $170,477 per family, while 2-person families (535 | 52.4%) have the highest median income of $57,878 per family member.
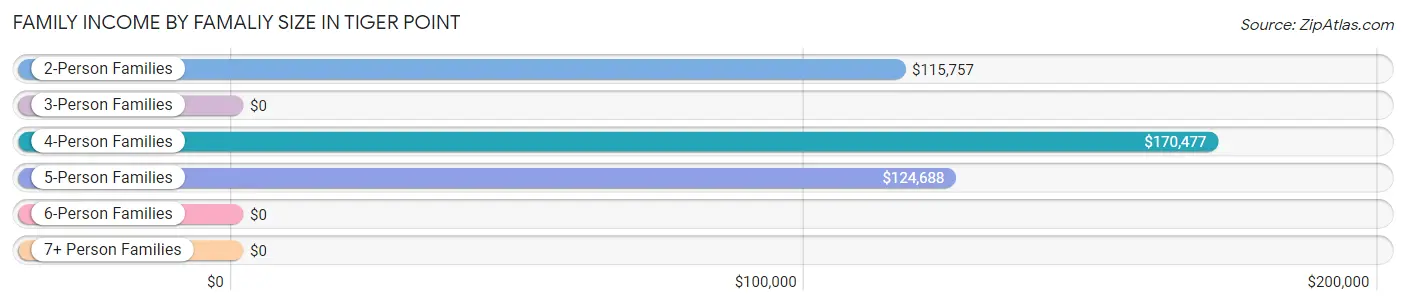
| Income Bracket | # Families | Median Income |
| 2-Person Families | 535 (52.4%) | $115,757 |
| 3-Person Families | 61 (6.0%) | $0 |
| 4-Person Families | 353 (34.6%) | $170,477 |
| 5-Person Families | 59 (5.8%) | $124,688 |
| 6-Person Families | 12 (1.2%) | $0 |
| 7+ Person Families | 0 (0.0%) | $0 |
| Total | 1,020 (100.0%) | $121,667 |
Family Income by Number of Earners in Tiger Point
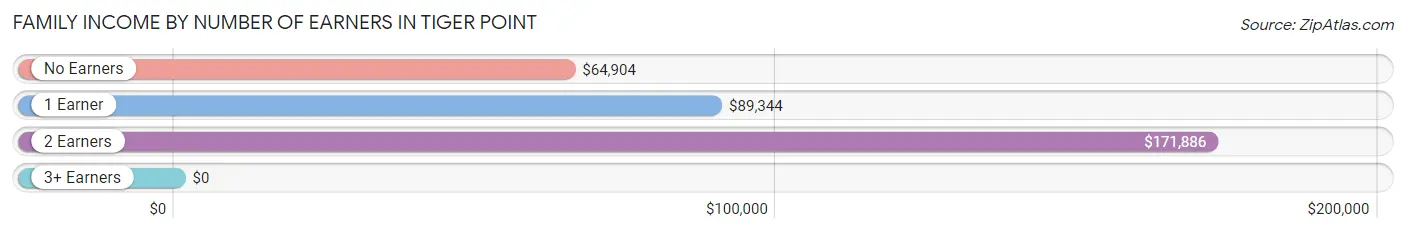
| Number of Earners | # Families | Median Income |
| No Earners | 183 (17.9%) | $64,904 |
| 1 Earner | 305 (29.9%) | $89,344 |
| 2 Earners | 495 (48.5%) | $171,886 |
| 3+ Earners | 37 (3.6%) | $0 |
| Total | 1,020 (100.0%) | $121,667 |
Household Income in Tiger Point
Household Income Brackets in Tiger Point
With 310 households falling in the category, the $100,000 to $149,999 income range is the most frequent in Tiger Point, accounting for 22.7% of all households.
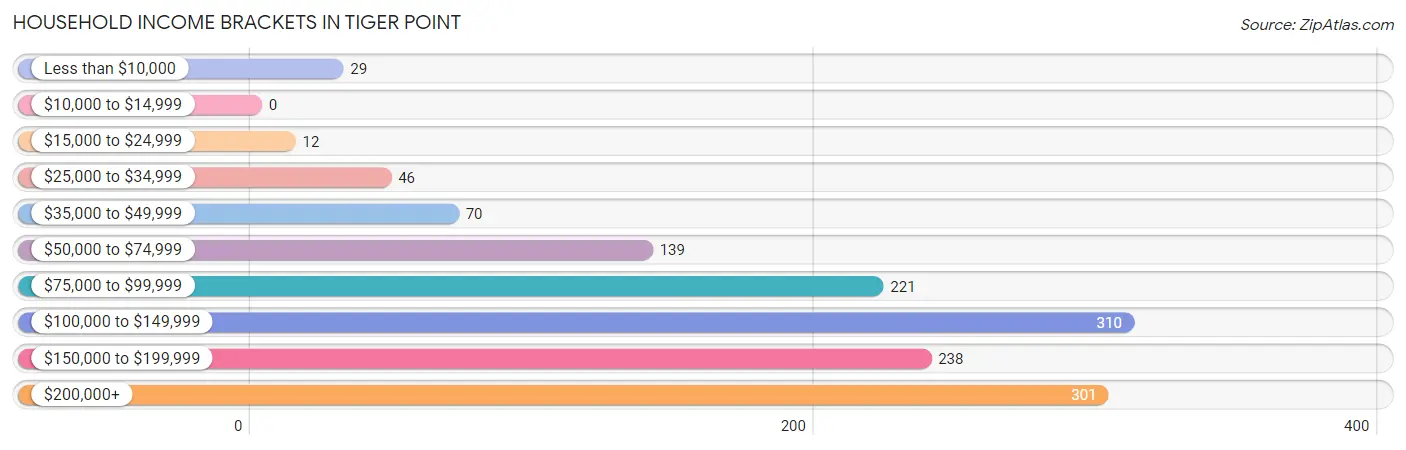
| Income Bracket | # Households | % Households |
| Less than $10,000 | 29 | 2.1% |
| $10,000 to $14,999 | 0 | 0.0% |
| $15,000 to $24,999 | 12 | 0.9% |
| $25,000 to $34,999 | 46 | 3.4% |
| $35,000 to $49,999 | 70 | 5.1% |
| $50,000 to $74,999 | 139 | 10.2% |
| $75,000 to $99,999 | 221 | 16.2% |
| $100,000 to $149,999 | 310 | 22.7% |
| $150,000 to $199,999 | 238 | 17.4% |
| $200,000+ | 301 | 22.0% |
Household Income by Householder Age in Tiger Point
The median household income in Tiger Point is $116,711, with the highest median household income of $174,779 found in the 45 to 64 years age bracket for the primary householder. A total of 381 households (27.9%) fall into this category. Meanwhile, the 15 to 24 years age bracket for the primary householder has the lowest median household income of $0, with 12 households (0.9%) in this group.
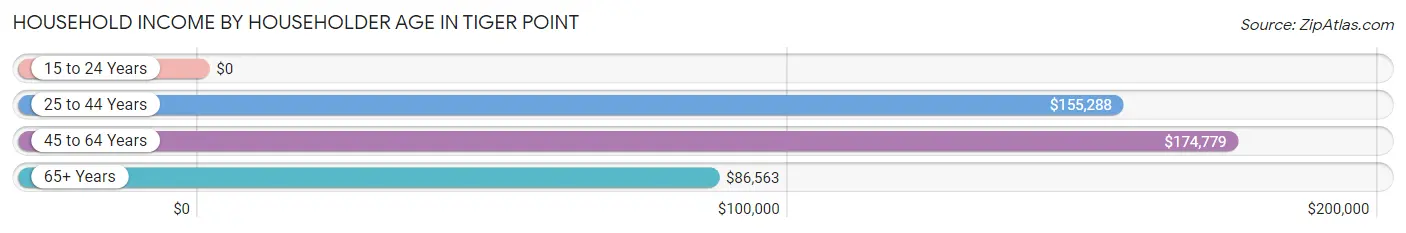
| Income Bracket | # Households | Median Income |
| 15 to 24 Years | 12 (0.9%) | $0 |
| 25 to 44 Years | 411 (30.1%) | $155,288 |
| 45 to 64 Years | 381 (27.9%) | $174,779 |
| 65+ Years | 562 (41.1%) | $86,563 |
| Total | 1,366 (100.0%) | $116,711 |
Poverty in Tiger Point
Income Below Poverty by Sex and Age in Tiger Point
With 0.7% poverty level for males and 2.0% for females among the residents of Tiger Point, 25 to 34 year old males and 18 to 24 year old females are the most vulnerable to poverty, with 12 males (8.3%) and 19 females (38.8%) in their respective age groups living below the poverty level.
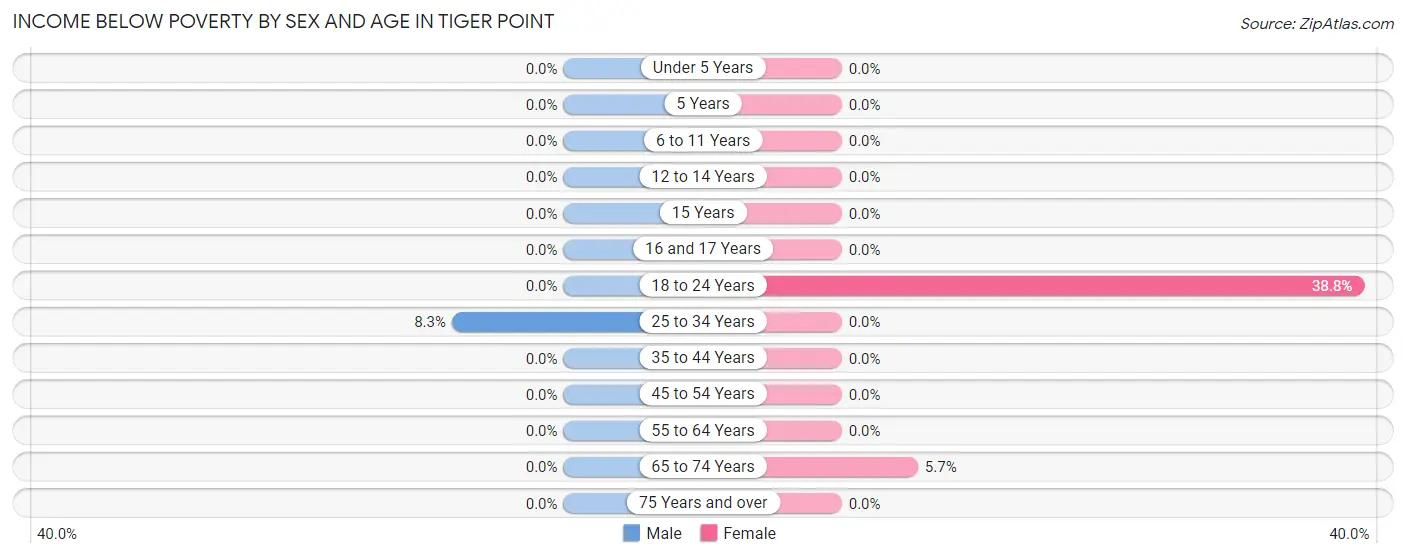
| Age Bracket | Male | Female |
| Under 5 Years | 0 (0.0%) | 0 (0.0%) |
| 5 Years | 0 (0.0%) | 0 (0.0%) |
| 6 to 11 Years | 0 (0.0%) | 0 (0.0%) |
| 12 to 14 Years | 0 (0.0%) | 0 (0.0%) |
| 15 Years | 0 (0.0%) | 0 (0.0%) |
| 16 and 17 Years | 0 (0.0%) | 0 (0.0%) |
| 18 to 24 Years | 0 (0.0%) | 19 (38.8%) |
| 25 to 34 Years | 12 (8.3%) | 0 (0.0%) |
| 35 to 44 Years | 0 (0.0%) | 0 (0.0%) |
| 45 to 54 Years | 0 (0.0%) | 0 (0.0%) |
| 55 to 64 Years | 0 (0.0%) | 0 (0.0%) |
| 65 to 74 Years | 0 (0.0%) | 17 (5.7%) |
| 75 Years and over | 0 (0.0%) | 0 (0.0%) |
| Total | 12 (0.7%) | 36 (2.0%) |
Income Above Poverty by Sex and Age in Tiger Point
According to the poverty statistics in Tiger Point, males aged under 5 years and females aged under 5 years are the age groups that are most secure financially, with 100.0% of males and 100.0% of females in these age groups living above the poverty line.
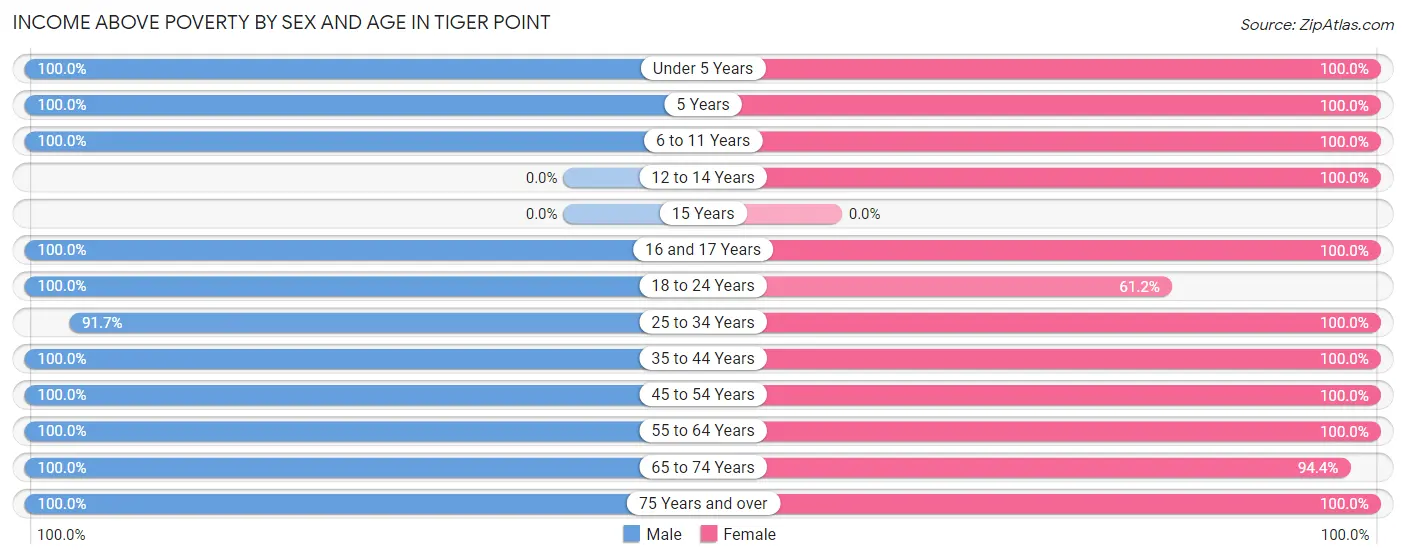
| Age Bracket | Male | Female |
| Under 5 Years | 57 (100.0%) | 109 (100.0%) |
| 5 Years | 17 (100.0%) | 14 (100.0%) |
| 6 to 11 Years | 137 (100.0%) | 124 (100.0%) |
| 12 to 14 Years | 0 (0.0%) | 111 (100.0%) |
| 15 Years | 0 (0.0%) | 0 (0.0%) |
| 16 and 17 Years | 198 (100.0%) | 32 (100.0%) |
| 18 to 24 Years | 74 (100.0%) | 30 (61.2%) |
| 25 to 34 Years | 133 (91.7%) | 84 (100.0%) |
| 35 to 44 Years | 349 (100.0%) | 343 (100.0%) |
| 45 to 54 Years | 162 (100.0%) | 123 (100.0%) |
| 55 to 64 Years | 157 (100.0%) | 256 (100.0%) |
| 65 to 74 Years | 200 (100.0%) | 284 (94.4%) |
| 75 Years and over | 225 (100.0%) | 244 (100.0%) |
| Total | 1,709 (99.3%) | 1,754 (98.0%) |
Income Below Poverty Among Married-Couple Families in Tiger Point
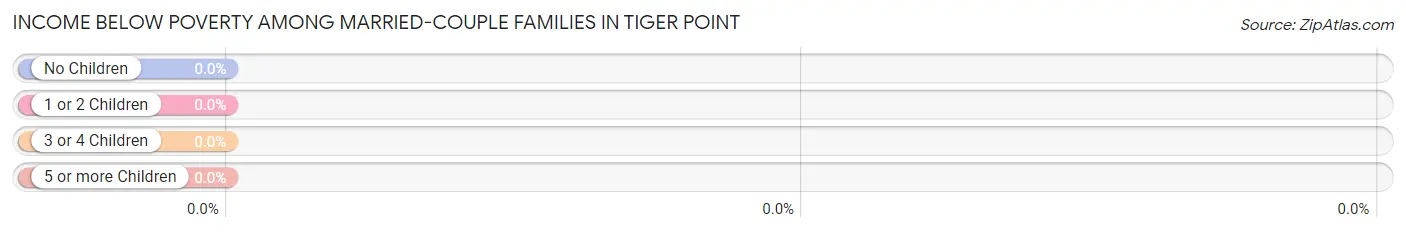
| Children | Above Poverty | Below Poverty |
| No Children | 546 (100.0%) | 0 (0.0%) |
| 1 or 2 Children | 337 (100.0%) | 0 (0.0%) |
| 3 or 4 Children | 71 (100.0%) | 0 (0.0%) |
| 5 or more Children | 0 (0.0%) | 0 (0.0%) |
| Total | 954 (100.0%) | 0 (0.0%) |
Income Below Poverty Among Single-Parent Households in Tiger Point
| Children | Single Father | Single Mother |
| No Children | 0 (0.0%) | 0 (0.0%) |
| 1 or 2 Children | 0 (0.0%) | 0 (0.0%) |
| 3 or 4 Children | 0 (0.0%) | 0 (0.0%) |
| 5 or more Children | 0 (0.0%) | 0 (0.0%) |
| Total | 0 (0.0%) | 0 (0.0%) |
Income Below Poverty Among Married-Couple vs Single-Parent Households in Tiger Point
| Children | Married-Couple Families | Single-Parent Households |
| No Children | 0 (0.0%) | 0 (0.0%) |
| 1 or 2 Children | 0 (0.0%) | 0 (0.0%) |
| 3 or 4 Children | 0 (0.0%) | 0 (0.0%) |
| 5 or more Children | 0 (0.0%) | 0 (0.0%) |
| Total | 0 (0.0%) | 0 (0.0%) |
Race in Tiger Point
The most populous races in Tiger Point are White / Caucasian (3,309 | 94.3%), Two or more Races (89 | 2.5%), and Some other Race (74 | 2.1%).
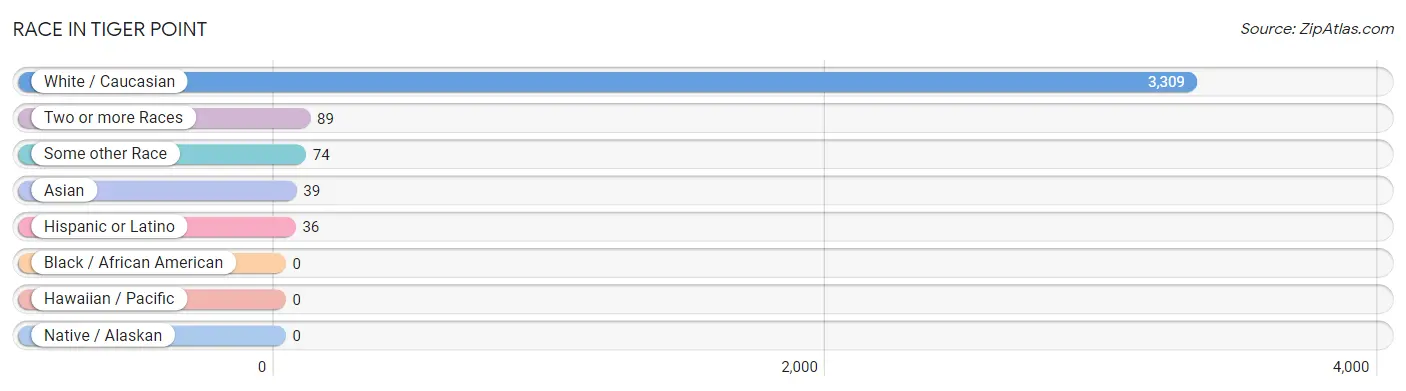
| Race | # Population | % Population |
| Asian | 39 | 1.1% |
| Black / African American | 0 | 0.0% |
| Hawaiian / Pacific | 0 | 0.0% |
| Hispanic or Latino | 36 | 1.0% |
| Native / Alaskan | 0 | 0.0% |
| White / Caucasian | 3,309 | 94.3% |
| Two or more Races | 89 | 2.5% |
| Some other Race | 74 | 2.1% |
| Total | 3,511 | 100.0% |
Ancestry in Tiger Point
The most populous ancestries reported in Tiger Point are Irish (781 | 22.2%), English (678 | 19.3%), German (484 | 13.8%), American (154 | 4.4%), and European (142 | 4.0%), together accounting for 63.8% of all Tiger Point residents.
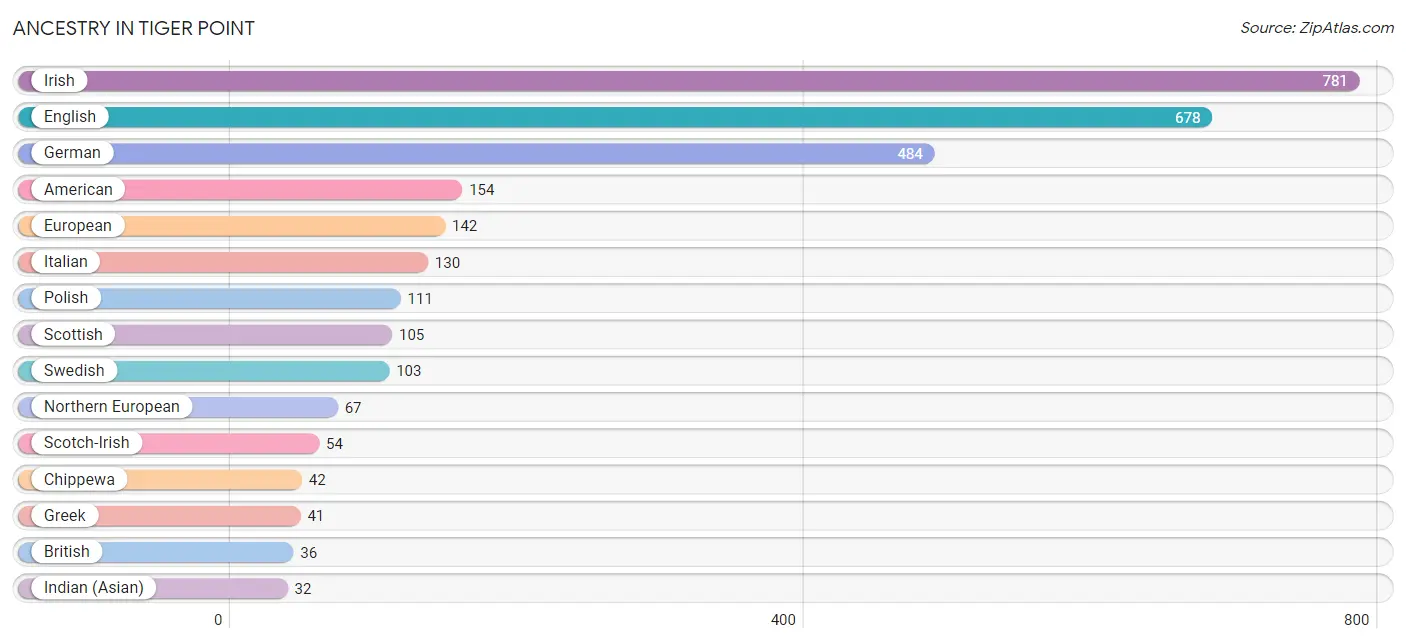
| Ancestry | # Population | % Population |
| American | 154 | 4.4% |
| British | 36 | 1.0% |
| Chippewa | 42 | 1.2% |
| Danish | 17 | 0.5% |
| Dutch | 15 | 0.4% |
| English | 678 | 19.3% |
| European | 142 | 4.0% |
| French | 28 | 0.8% |
| German | 484 | 13.8% |
| Greek | 41 | 1.2% |
| Indian (Asian) | 32 | 0.9% |
| Irish | 781 | 22.2% |
| Italian | 130 | 3.7% |
| Jamaican | 12 | 0.3% |
| Mexican | 28 | 0.8% |
| Northern European | 67 | 1.9% |
| Polish | 111 | 3.2% |
| Pueblo | 12 | 0.3% |
| Russian | 29 | 0.8% |
| Scotch-Irish | 54 | 1.5% |
| Scottish | 105 | 3.0% |
| Spanish | 8 | 0.2% |
| Sri Lankan | 7 | 0.2% |
| Swedish | 103 | 2.9% |
| Turkish | 6 | 0.2% |
| Welsh | 11 | 0.3% | View All 26 Rows |
Immigrants in Tiger Point
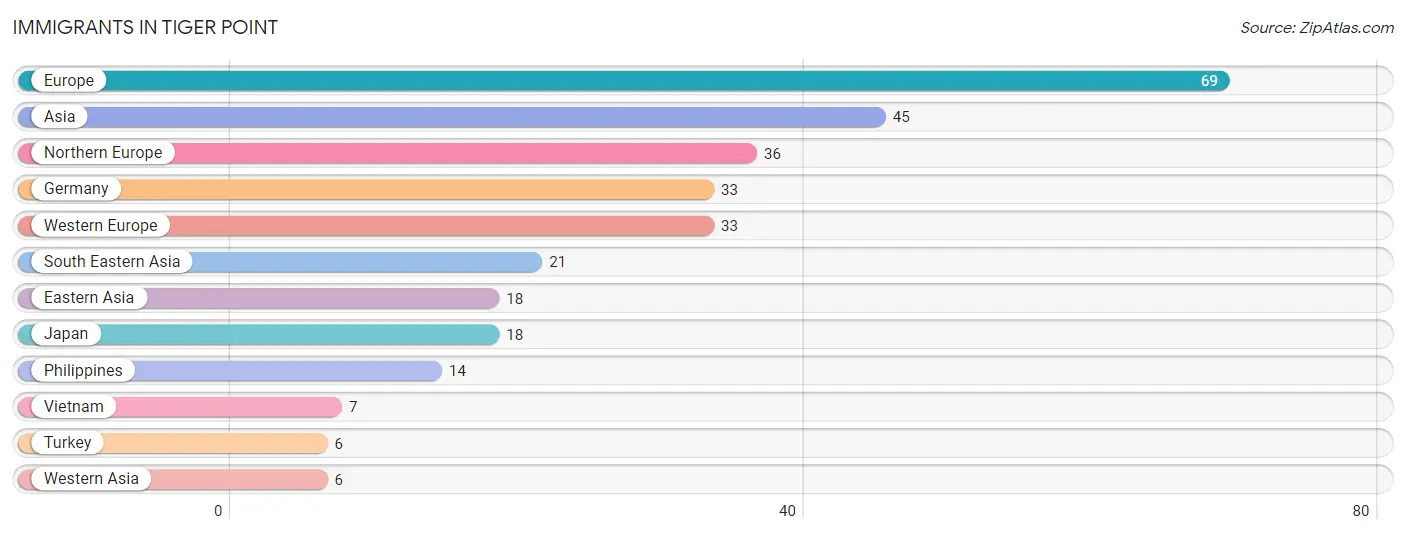
The most numerous immigrant groups reported in Tiger Point came from Europe (69 | 2.0%), Asia (45 | 1.3%), Northern Europe (36 | 1.0%), Germany (33 | 0.9%), and Western Europe (33 | 0.9%), together accounting for 6.2% of all Tiger Point residents.
| Immigration Origin | # Population | % Population |
| Asia | 45 | 1.3% |
| Eastern Asia | 18 | 0.5% |
| Europe | 69 | 2.0% |
| Germany | 33 | 0.9% |
| Japan | 18 | 0.5% |
| Northern Europe | 36 | 1.0% |
| Philippines | 14 | 0.4% |
| South Eastern Asia | 21 | 0.6% |
| Turkey | 6 | 0.2% |
| Vietnam | 7 | 0.2% |
| Western Asia | 6 | 0.2% |
| Western Europe | 33 | 0.9% | View All 12 Rows |
Sex and Age in Tiger Point
Sex and Age in Tiger Point
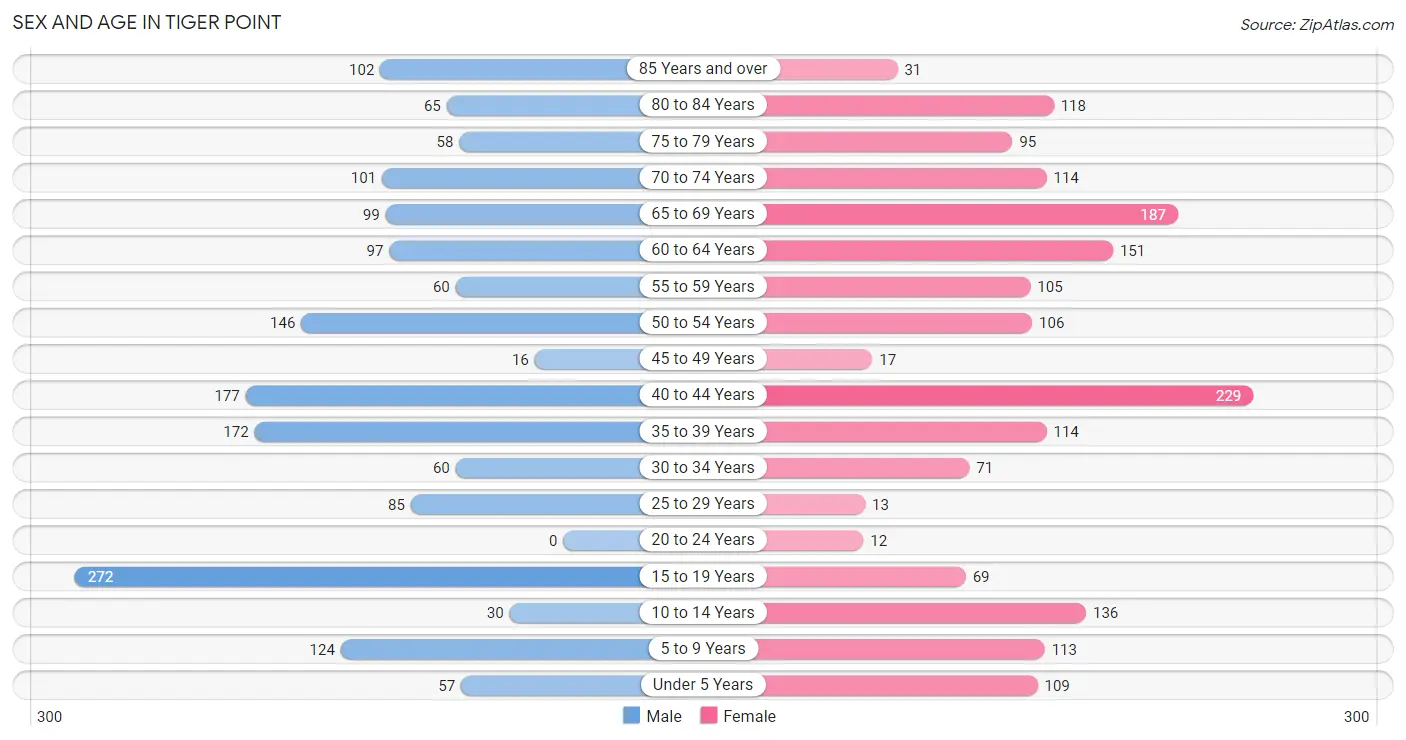
The most populous age groups in Tiger Point are 15 to 19 Years (272 | 15.8%) for men and 40 to 44 Years (229 | 12.8%) for women.
| Age Bracket | Male | Female |
| Under 5 Years | 57 (3.3%) | 109 (6.1%) |
| 5 to 9 Years | 124 (7.2%) | 113 (6.3%) |
| 10 to 14 Years | 30 (1.7%) | 136 (7.6%) |
| 15 to 19 Years | 272 (15.8%) | 69 (3.8%) |
| 20 to 24 Years | 0 (0.0%) | 12 (0.7%) |
| 25 to 29 Years | 85 (4.9%) | 13 (0.7%) |
| 30 to 34 Years | 60 (3.5%) | 71 (4.0%) |
| 35 to 39 Years | 172 (10.0%) | 114 (6.4%) |
| 40 to 44 Years | 177 (10.3%) | 229 (12.8%) |
| 45 to 49 Years | 16 (0.9%) | 17 (0.9%) |
| 50 to 54 Years | 146 (8.5%) | 106 (5.9%) |
| 55 to 59 Years | 60 (3.5%) | 105 (5.9%) |
| 60 to 64 Years | 97 (5.6%) | 151 (8.4%) |
| 65 to 69 Years | 99 (5.8%) | 187 (10.4%) |
| 70 to 74 Years | 101 (5.9%) | 114 (6.4%) |
| 75 to 79 Years | 58 (3.4%) | 95 (5.3%) |
| 80 to 84 Years | 65 (3.8%) | 118 (6.6%) |
| 85 Years and over | 102 (5.9%) | 31 (1.7%) |
| Total | 1,721 (100.0%) | 1,790 (100.0%) |
Families and Households in Tiger Point
Median Family Size in Tiger Point
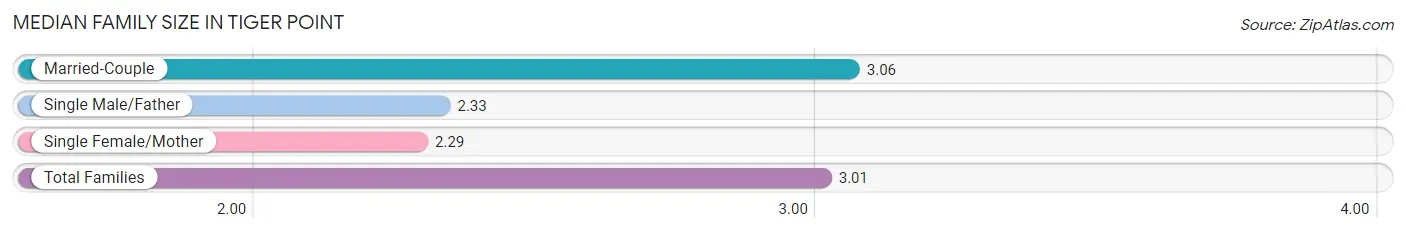
The median family size in Tiger Point is 3.01 persons per family, with married-couple families (954 | 93.5%) accounting for the largest median family size of 3.06 persons per family. On the other hand, single female/mother families (51 | 5.0%) represent the smallest median family size with 2.29 persons per family.
| Family Type | # Families | Family Size |
| Married-Couple | 954 (93.5%) | 3.06 |
| Single Male/Father | 15 (1.5%) | 2.33 |
| Single Female/Mother | 51 (5.0%) | 2.29 |
| Total Families | 1,020 (100.0%) | 3.01 |
Median Household Size in Tiger Point
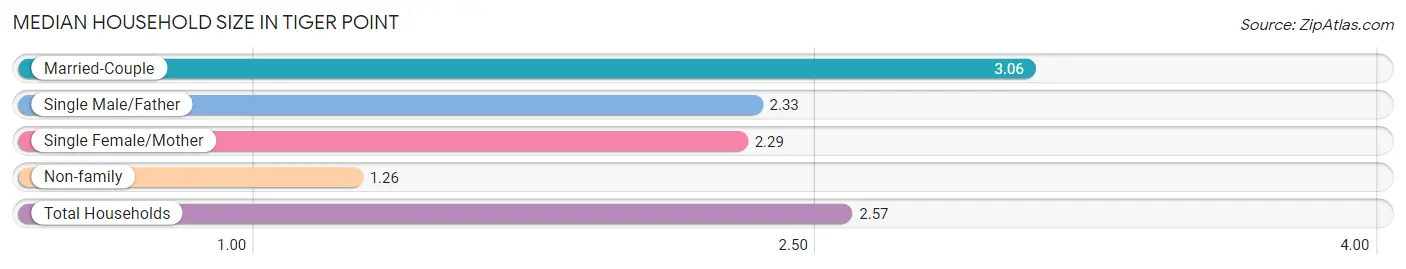
The median household size in Tiger Point is 2.57 persons per household, with married-couple households (954 | 69.8%) accounting for the largest median household size of 3.06 persons per household. non-family households (346 | 25.3%) represent the smallest median household size with 1.26 persons per household.
| Household Type | # Households | Household Size |
| Married-Couple | 954 (69.8%) | 3.06 |
| Single Male/Father | 15 (1.1%) | 2.33 |
| Single Female/Mother | 51 (3.7%) | 2.29 |
| Non-family | 346 (25.3%) | 1.26 |
| Total Households | 1,366 (100.0%) | 2.57 |
Household Size by Marriage Status in Tiger Point
Out of a total of 1,366 households in Tiger Point, 1,020 (74.7%) are family households, while 346 (25.3%) are nonfamily households. The most numerous type of family households are 2-person households, comprising 535, and the most common type of nonfamily households are 1-person households, comprising 271.
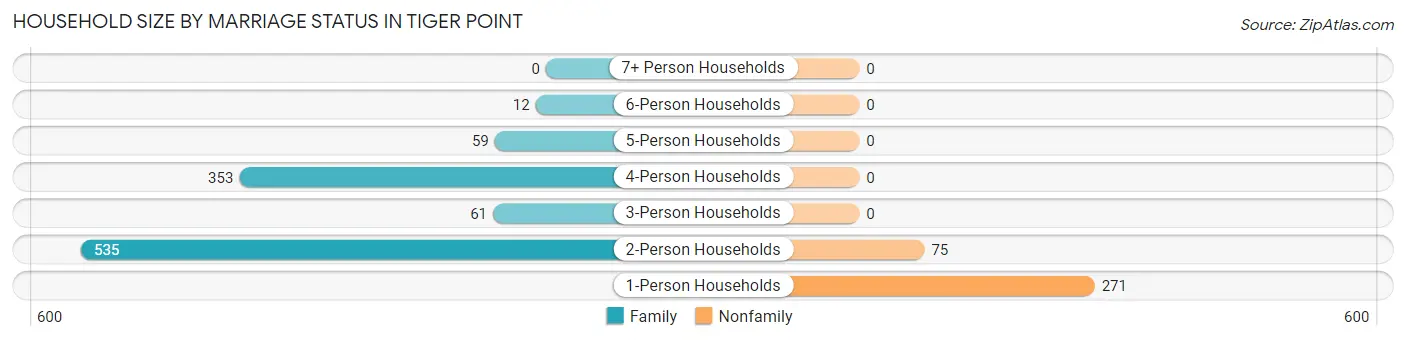
| Household Size | Family Households | Nonfamily Households |
| 1-Person Households | - | 271 (19.8%) |
| 2-Person Households | 535 (39.2%) | 75 (5.5%) |
| 3-Person Households | 61 (4.5%) | 0 (0.0%) |
| 4-Person Households | 353 (25.8%) | 0 (0.0%) |
| 5-Person Households | 59 (4.3%) | 0 (0.0%) |
| 6-Person Households | 12 (0.9%) | 0 (0.0%) |
| 7+ Person Households | 0 (0.0%) | 0 (0.0%) |
| Total | 1,020 (74.7%) | 346 (25.3%) |
Female Fertility in Tiger Point
Fertility by Age in Tiger Point
Average fertility rate in Tiger Point is 48.0 births per 1,000 women. Women in the age bracket of 20 to 34 years have the highest fertility rate with 156.0 births per 1,000 women. Women in the age bracket of 20 to 34 years acount for 57.7% of all women with births.
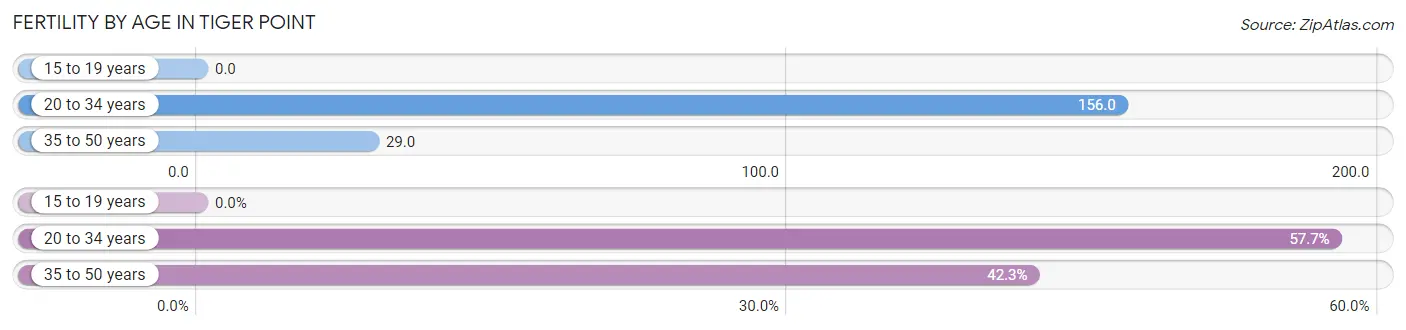
| Age Bracket | Women with Births | Births / 1,000 Women |
| 15 to 19 years | 0 (0.0%) | 0.0 |
| 20 to 34 years | 15 (57.7%) | 156.0 |
| 35 to 50 years | 11 (42.3%) | 29.0 |
| Total | 26 (100.0%) | 48.0 |
Fertility by Age by Marriage Status in Tiger Point
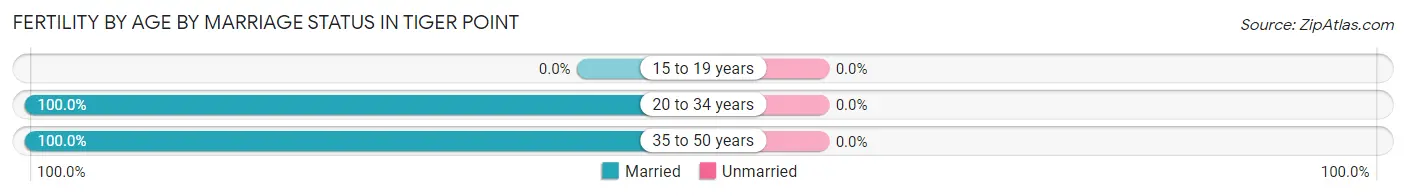
| Age Bracket | Married | Unmarried |
| 15 to 19 years | 0 (0.0%) | 0 (0.0%) |
| 20 to 34 years | 15 (100.0%) | 0 (0.0%) |
| 35 to 50 years | 11 (100.0%) | 0 (0.0%) |
| Total | 26 (100.0%) | 0 (0.0%) |
Fertility by Education in Tiger Point
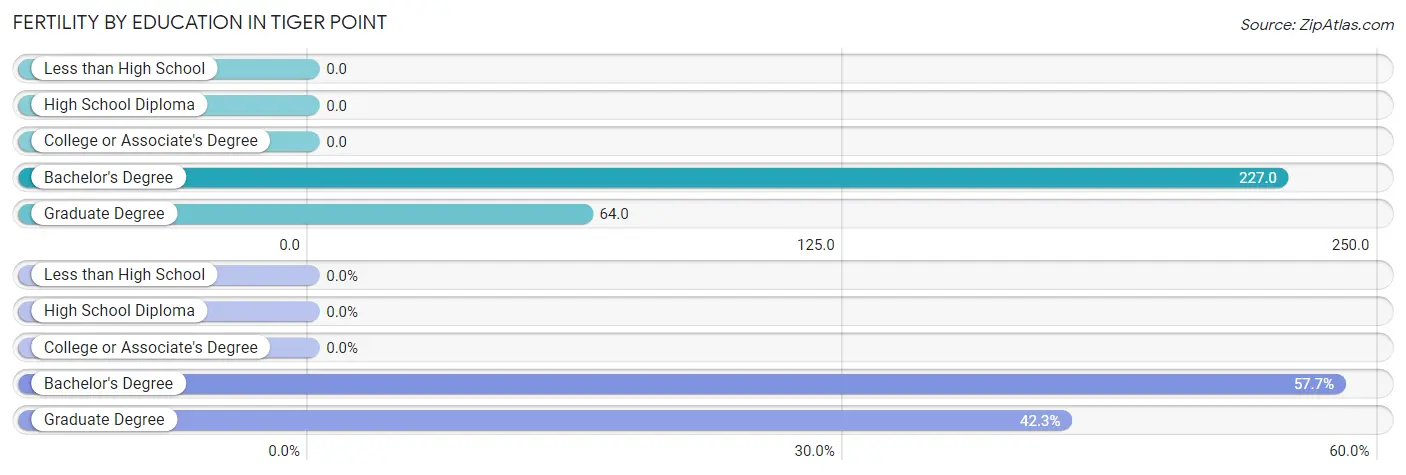
| Educational Attainment | Women with Births | Births / 1,000 Women |
| Less than High School | 0 (0.0%) | 0.0 |
| High School Diploma | 0 (0.0%) | 0.0 |
| College or Associate's Degree | 0 (0.0%) | 0.0 |
| Bachelor's Degree | 15 (57.7%) | 227.0 |
| Graduate Degree | 11 (42.3%) | 64.0 |
| Total | 26 (100.0%) | 48.0 |
Fertility by Education by Marriage Status in Tiger Point
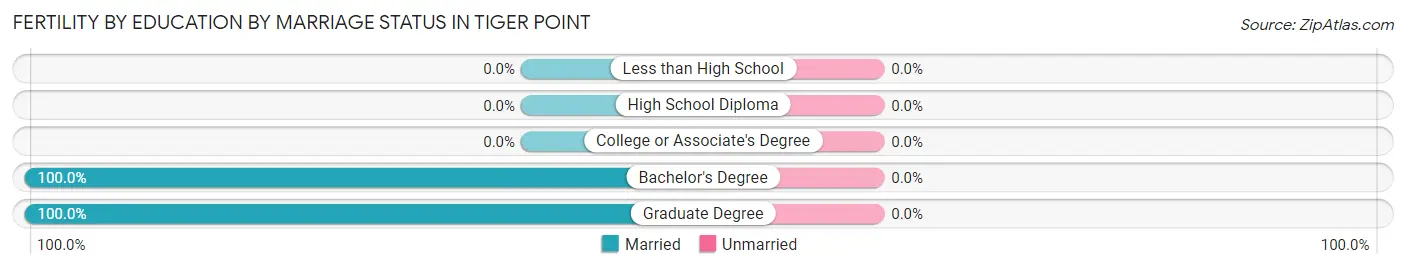
| Educational Attainment | Married | Unmarried |
| Less than High School | 0 (0.0%) | 0 (0.0%) |
| High School Diploma | 0 (0.0%) | 0 (0.0%) |
| College or Associate's Degree | 0 (0.0%) | 0 (0.0%) |
| Bachelor's Degree | 15 (100.0%) | 0 (0.0%) |
| Graduate Degree | 11 (100.0%) | 0 (0.0%) |
| Total | 26 (100.0%) | 0 (0.0%) |
Employment Characteristics in Tiger Point
Employment by Class of Employer in Tiger Point
Among the 1,488 employed individuals in Tiger Point, private company employees (842 | 56.6%), federal government employees (252 | 16.9%), and not-for-profit organizations (153 | 10.3%) make up the most common classes of employment.
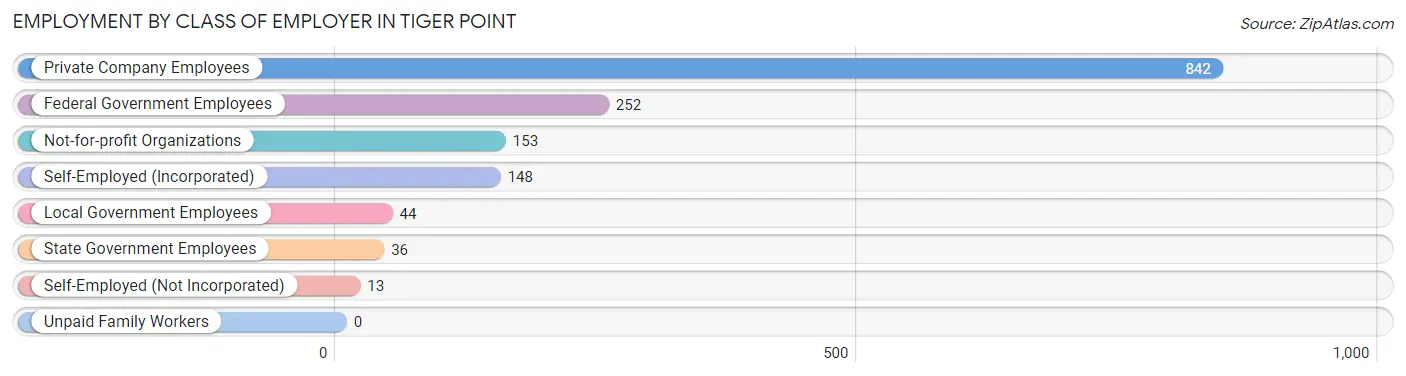
| Employer Class | # Employees | % Employees |
| Private Company Employees | 842 | 56.6% |
| Self-Employed (Incorporated) | 148 | 10.0% |
| Self-Employed (Not Incorporated) | 13 | 0.9% |
| Not-for-profit Organizations | 153 | 10.3% |
| Local Government Employees | 44 | 3.0% |
| State Government Employees | 36 | 2.4% |
| Federal Government Employees | 252 | 16.9% |
| Unpaid Family Workers | 0 | 0.0% |
| Total | 1,488 | 100.0% |
Employment Status by Age in Tiger Point
According to the labor force statistics for Tiger Point, out of the total population over 16 years of age (2,942), 52.8% or 1,553 individuals are in the labor force, with 3.5% or 54 of them unemployed. The age group with the highest labor force participation rate is 20 to 24 years, with 100.0% or 12 individuals in the labor force. Within the labor force, the 16 to 19 years age range has the highest percentage of unemployed individuals, with 38.8% or 19 of them being unemployed.
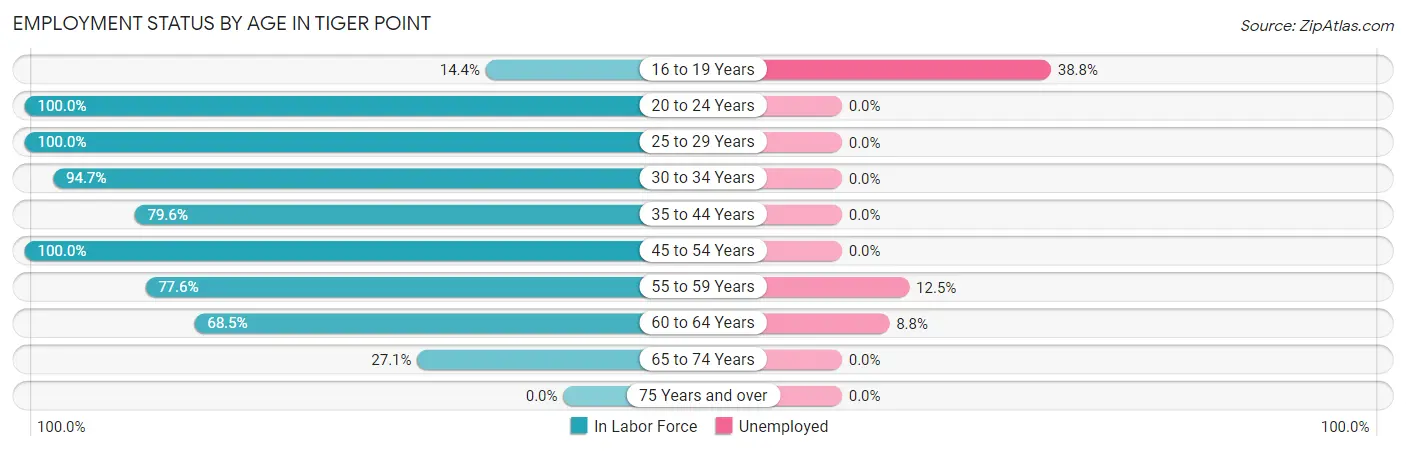
| Age Bracket | In Labor Force | Unemployed |
| 16 to 19 Years | 49 (14.4%) | 19 (38.8%) |
| 20 to 24 Years | 12 (100.0%) | 0 (0.0%) |
| 25 to 29 Years | 98 (100.0%) | 0 (0.0%) |
| 30 to 34 Years | 124 (94.7%) | 0 (0.0%) |
| 35 to 44 Years | 551 (79.6%) | 0 (0.0%) |
| 45 to 54 Years | 285 (100.0%) | 0 (0.0%) |
| 55 to 59 Years | 128 (77.6%) | 16 (12.5%) |
| 60 to 64 Years | 170 (68.5%) | 15 (8.8%) |
| 65 to 74 Years | 136 (27.1%) | 0 (0.0%) |
| 75 Years and over | 0 (0.0%) | 0 (0.0%) |
| Total | 1,553 (52.8%) | 54 (3.5%) |
Employment Status by Educational Attainment in Tiger Point
According to labor force statistics for Tiger Point, 83.8% of individuals (1,357) out of the total population between 25 and 64 years of age (1,619) are in the labor force, with 2.5% or 34 of them being unemployed. The group with the highest labor force participation rate are those with the educational attainment of high school diploma, with 95.3% or 141 individuals in the labor force. Within the labor force, individuals with college / associate degree education have the highest percentage of unemployment, with 7.2% or 22 of them being unemployed.
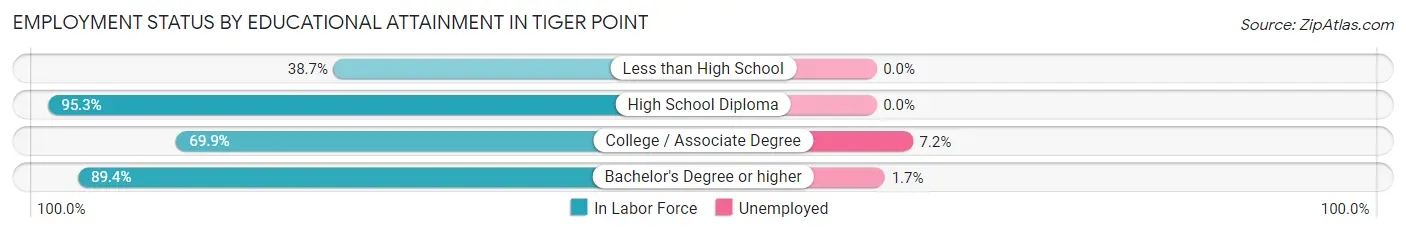
| Educational Attainment | In Labor Force | Unemployed |
| Less than High School | 12 (38.7%) | 0 (0.0%) |
| High School Diploma | 141 (95.3%) | 0 (0.0%) |
| College / Associate Degree | 302 (69.9%) | 31 (7.2%) |
| Bachelor's Degree or higher | 901 (89.4%) | 17 (1.7%) |
| Total | 1,357 (83.8%) | 40 (2.5%) |
Employment Occupations by Sex in Tiger Point
Management, Business, Science and Arts Occupations
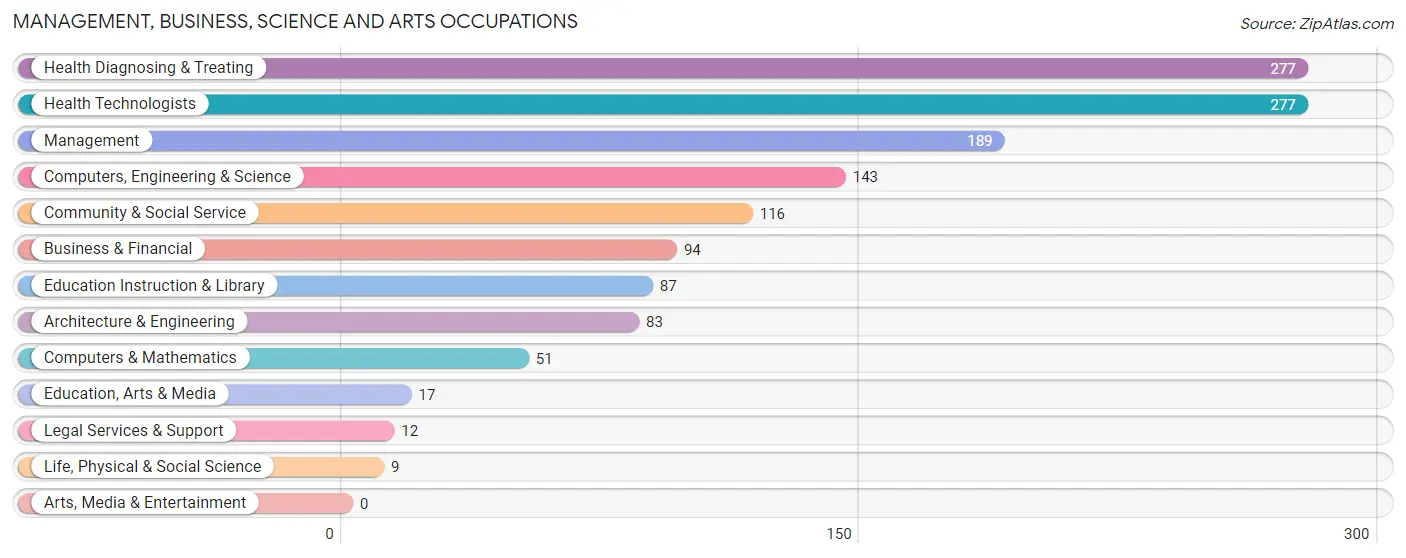
The most common Management, Business, Science and Arts occupations in Tiger Point are Health Diagnosing & Treating (277 | 20.0%), Health Technologists (277 | 20.0%), Management (189 | 13.7%), Computers, Engineering & Science (143 | 10.3%), and Community & Social Service (116 | 8.4%).
Management, Business, Science and Arts Occupations by Sex
Within the Management, Business, Science and Arts occupations in Tiger Point, the most male-oriented occupations are Computers, Engineering & Science (100.0%), Computers & Mathematics (100.0%), and Architecture & Engineering (100.0%), while the most female-oriented occupations are Legal Services & Support (100.0%), Education Instruction & Library (91.9%), and Community & Social Service (79.3%).
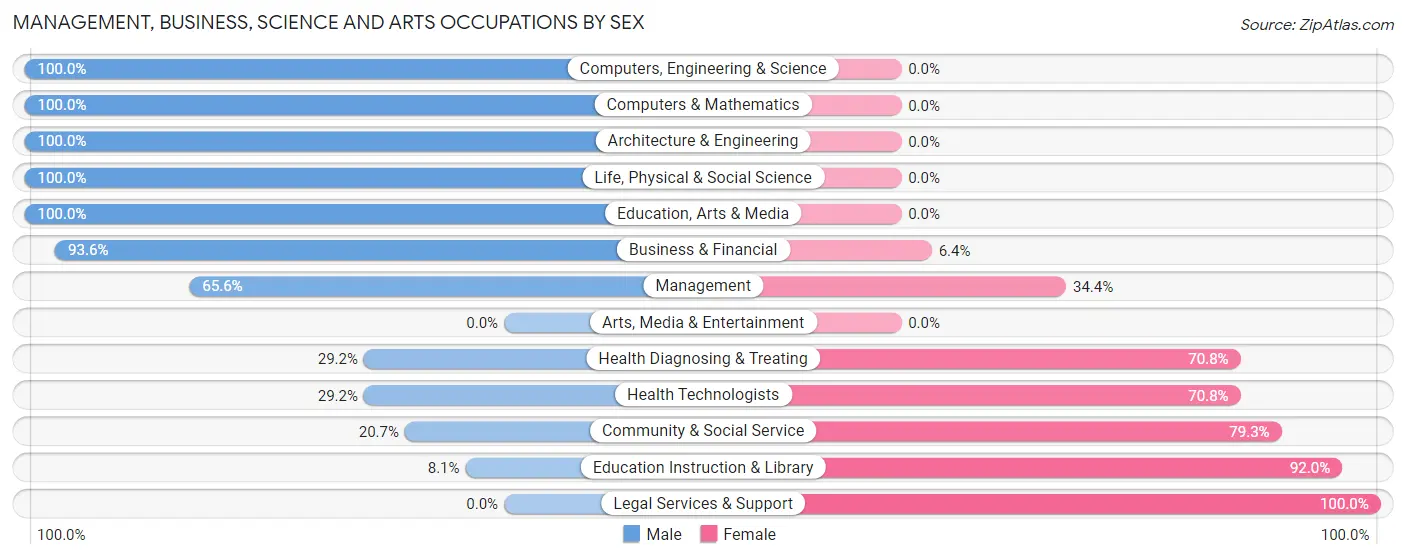
| Occupation | Male | Female |
| Management | 124 (65.6%) | 65 (34.4%) |
| Business & Financial | 88 (93.6%) | 6 (6.4%) |
| Computers, Engineering & Science | 143 (100.0%) | 0 (0.0%) |
| Computers & Mathematics | 51 (100.0%) | 0 (0.0%) |
| Architecture & Engineering | 83 (100.0%) | 0 (0.0%) |
| Life, Physical & Social Science | 9 (100.0%) | 0 (0.0%) |
| Community & Social Service | 24 (20.7%) | 92 (79.3%) |
| Education, Arts & Media | 17 (100.0%) | 0 (0.0%) |
| Legal Services & Support | 0 (0.0%) | 12 (100.0%) |
| Education Instruction & Library | 7 (8.1%) | 80 (91.9%) |
| Arts, Media & Entertainment | 0 (0.0%) | 0 (0.0%) |
| Health Diagnosing & Treating | 81 (29.2%) | 196 (70.8%) |
| Health Technologists | 81 (29.2%) | 196 (70.8%) |
| Total (Category) | 460 (56.2%) | 359 (43.8%) |
| Total (Overall) | 768 (55.5%) | 615 (44.5%) |
Services Occupations
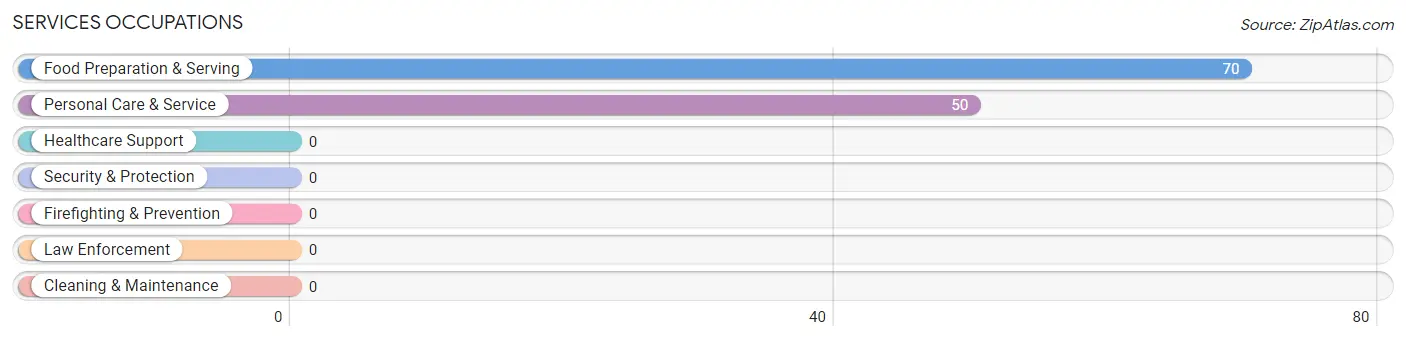
The most common Services occupations in Tiger Point are Food Preparation & Serving (70 | 5.1%), and Personal Care & Service (50 | 3.6%).
Services Occupations by Sex
Within the Services occupations in Tiger Point, the most male-oriented occupations are Personal Care & Service (74.0%), and Food Preparation & Serving (37.1%), while the most female-oriented occupations are Food Preparation & Serving (62.9%), and Personal Care & Service (26.0%).
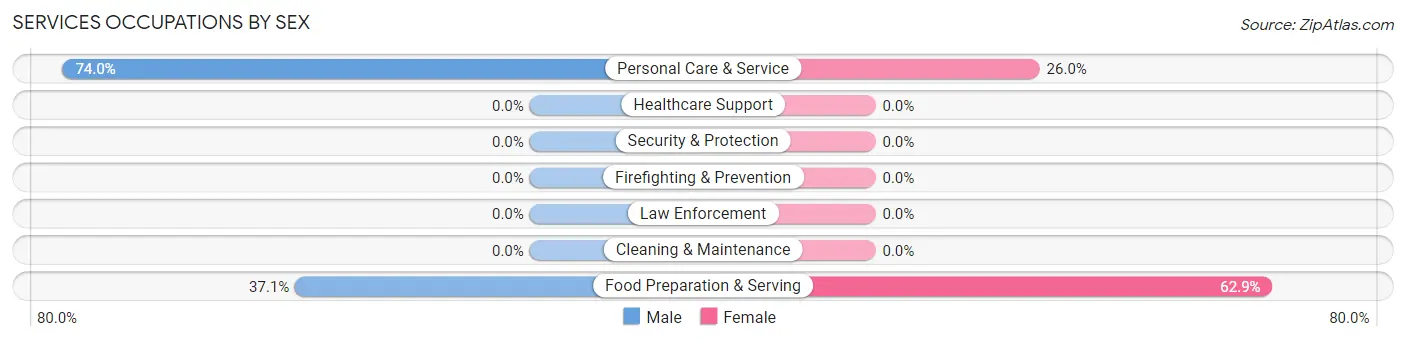
| Occupation | Male | Female |
| Healthcare Support | 0 (0.0%) | 0 (0.0%) |
| Security & Protection | 0 (0.0%) | 0 (0.0%) |
| Firefighting & Prevention | 0 (0.0%) | 0 (0.0%) |
| Law Enforcement | 0 (0.0%) | 0 (0.0%) |
| Food Preparation & Serving | 26 (37.1%) | 44 (62.9%) |
| Cleaning & Maintenance | 0 (0.0%) | 0 (0.0%) |
| Personal Care & Service | 37 (74.0%) | 13 (26.0%) |
| Total (Category) | 63 (52.5%) | 57 (47.5%) |
| Total (Overall) | 768 (55.5%) | 615 (44.5%) |
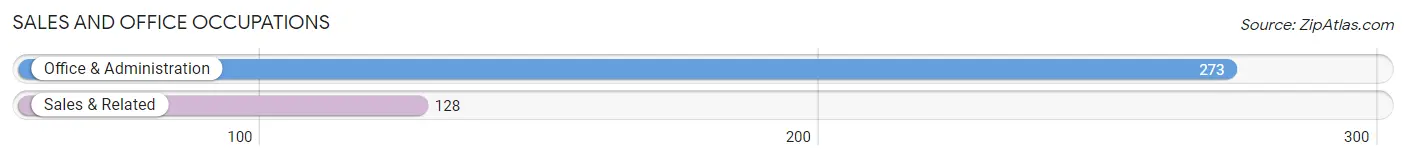
Sales and Office Occupations
The most common Sales and Office occupations in Tiger Point are Office & Administration (273 | 19.7%), and Sales & Related (128 | 9.3%).
Sales and Office Occupations by Sex
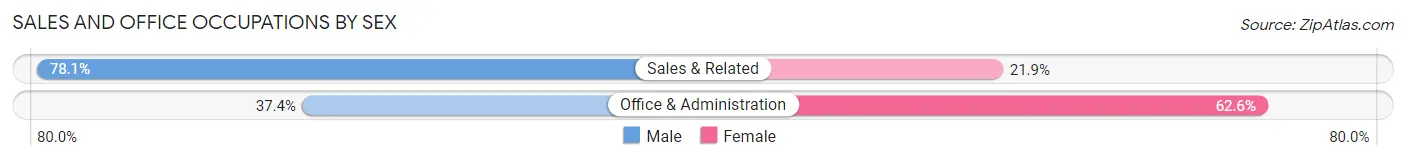
| Occupation | Male | Female |
| Sales & Related | 100 (78.1%) | 28 (21.9%) |
| Office & Administration | 102 (37.4%) | 171 (62.6%) |
| Total (Category) | 202 (50.4%) | 199 (49.6%) |
| Total (Overall) | 768 (55.5%) | 615 (44.5%) |
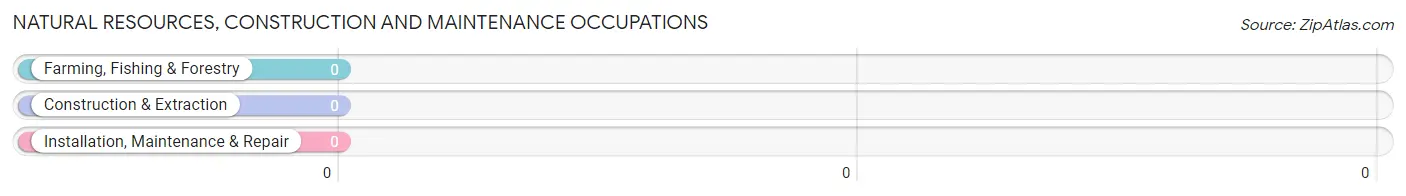
Natural Resources, Construction and Maintenance Occupations
Natural Resources, Construction and Maintenance Occupations by Sex
| Occupation | Male | Female |
| Farming, Fishing & Forestry | 0 (0.0%) | 0 (0.0%) |
| Construction & Extraction | 0 (0.0%) | 0 (0.0%) |
| Installation, Maintenance & Repair | 0 (0.0%) | 0 (0.0%) |
| Total (Category) | 0 (0.0%) | 0 (0.0%) |
| Total (Overall) | 768 (55.5%) | 615 (44.5%) |
Production, Transportation and Moving Occupations
The most common Production, Transportation and Moving occupations in Tiger Point are Production (27 | 1.9%), and Transportation (16 | 1.2%).
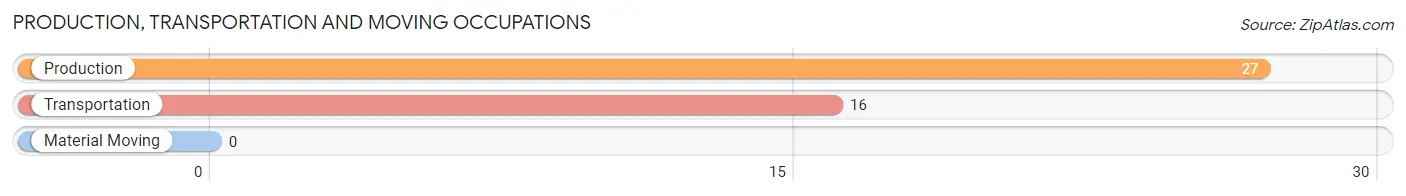
Production, Transportation and Moving Occupations by Sex
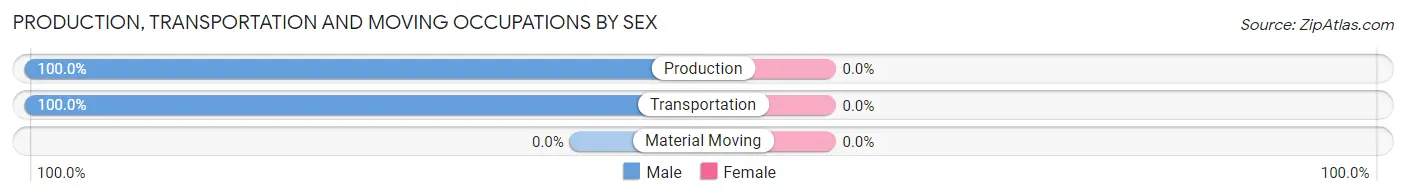
| Occupation | Male | Female |
| Production | 27 (100.0%) | 0 (0.0%) |
| Transportation | 16 (100.0%) | 0 (0.0%) |
| Material Moving | 0 (0.0%) | 0 (0.0%) |
| Total (Category) | 43 (100.0%) | 0 (0.0%) |
| Total (Overall) | 768 (55.5%) | 615 (44.5%) |
Employment Industries by Sex in Tiger Point
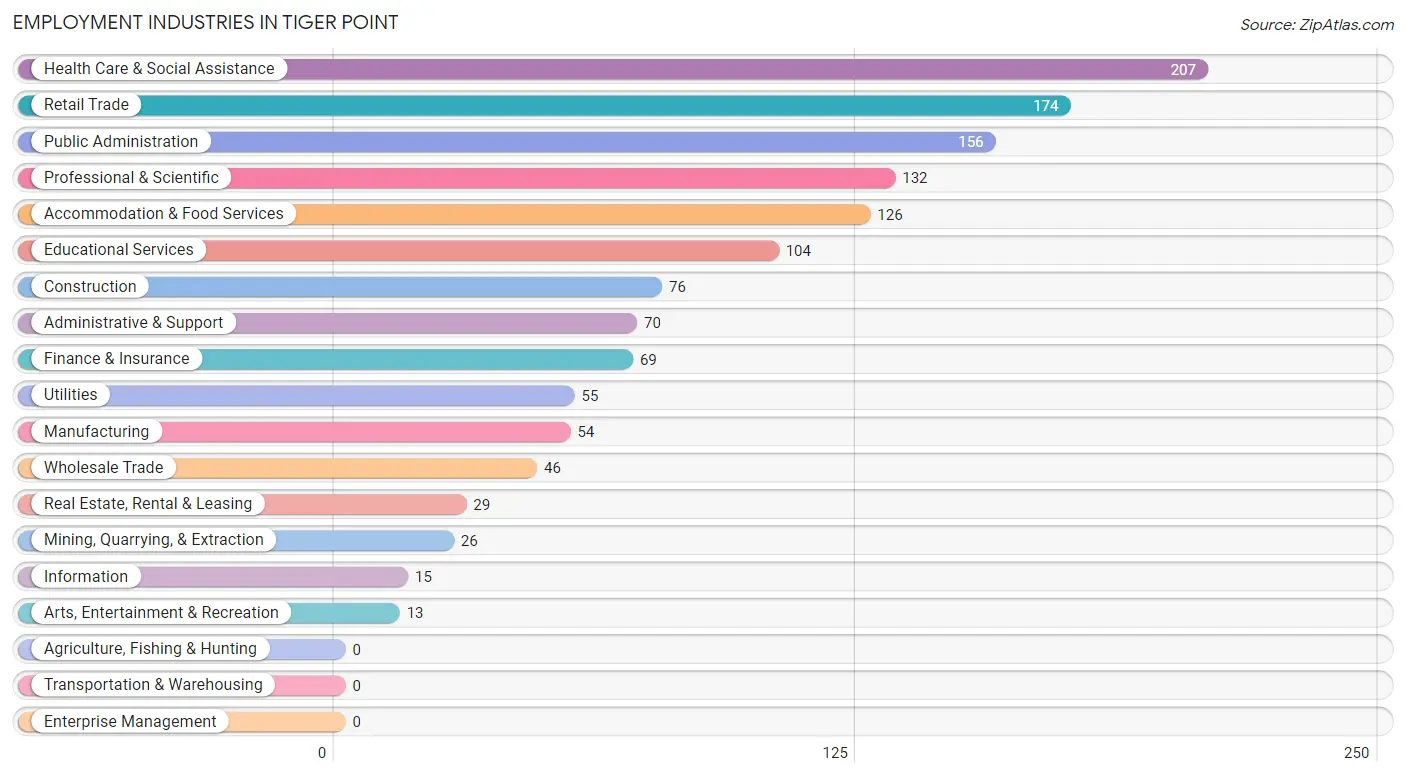
Employment Industries in Tiger Point
The major employment industries in Tiger Point include Health Care & Social Assistance (207 | 15.0%), Retail Trade (174 | 12.6%), Public Administration (156 | 11.3%), Professional & Scientific (132 | 9.5%), and Accommodation & Food Services (126 | 9.1%).
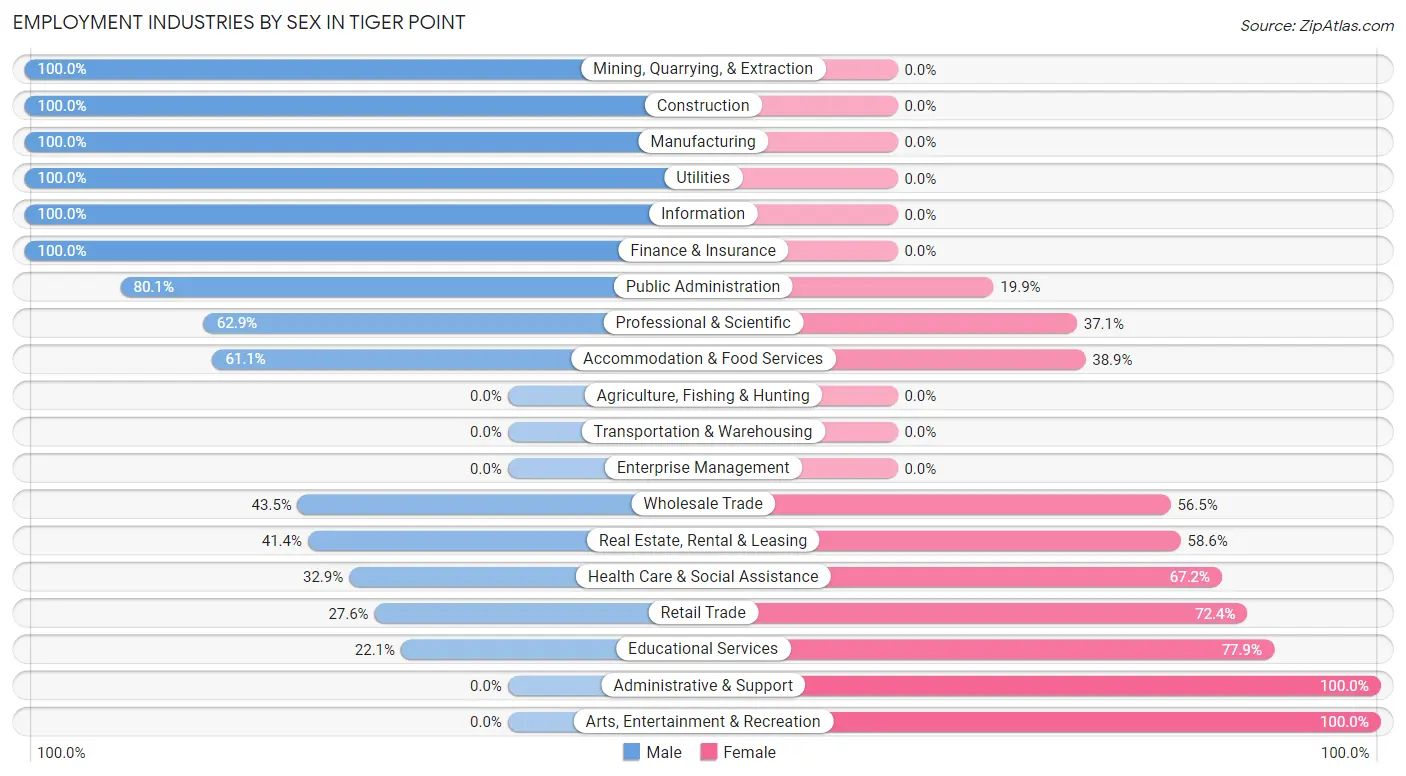
Employment Industries by Sex in Tiger Point
The Tiger Point industries that see more men than women are Mining, Quarrying, & Extraction (100.0%), Construction (100.0%), and Manufacturing (100.0%), whereas the industries that tend to have a higher number of women are Administrative & Support (100.0%), Arts, Entertainment & Recreation (100.0%), and Educational Services (77.9%).
| Industry | Male | Female |
| Agriculture, Fishing & Hunting | 0 (0.0%) | 0 (0.0%) |
| Mining, Quarrying, & Extraction | 26 (100.0%) | 0 (0.0%) |
| Construction | 76 (100.0%) | 0 (0.0%) |
| Manufacturing | 54 (100.0%) | 0 (0.0%) |
| Wholesale Trade | 20 (43.5%) | 26 (56.5%) |
| Retail Trade | 48 (27.6%) | 126 (72.4%) |
| Transportation & Warehousing | 0 (0.0%) | 0 (0.0%) |
| Utilities | 55 (100.0%) | 0 (0.0%) |
| Information | 15 (100.0%) | 0 (0.0%) |
| Finance & Insurance | 69 (100.0%) | 0 (0.0%) |
| Real Estate, Rental & Leasing | 12 (41.4%) | 17 (58.6%) |
| Professional & Scientific | 83 (62.9%) | 49 (37.1%) |
| Enterprise Management | 0 (0.0%) | 0 (0.0%) |
| Administrative & Support | 0 (0.0%) | 70 (100.0%) |
| Educational Services | 23 (22.1%) | 81 (77.9%) |
| Health Care & Social Assistance | 68 (32.9%) | 139 (67.1%) |
| Arts, Entertainment & Recreation | 0 (0.0%) | 13 (100.0%) |
| Accommodation & Food Services | 77 (61.1%) | 49 (38.9%) |
| Public Administration | 125 (80.1%) | 31 (19.9%) |
| Total | 768 (55.5%) | 615 (44.5%) |
Education in Tiger Point
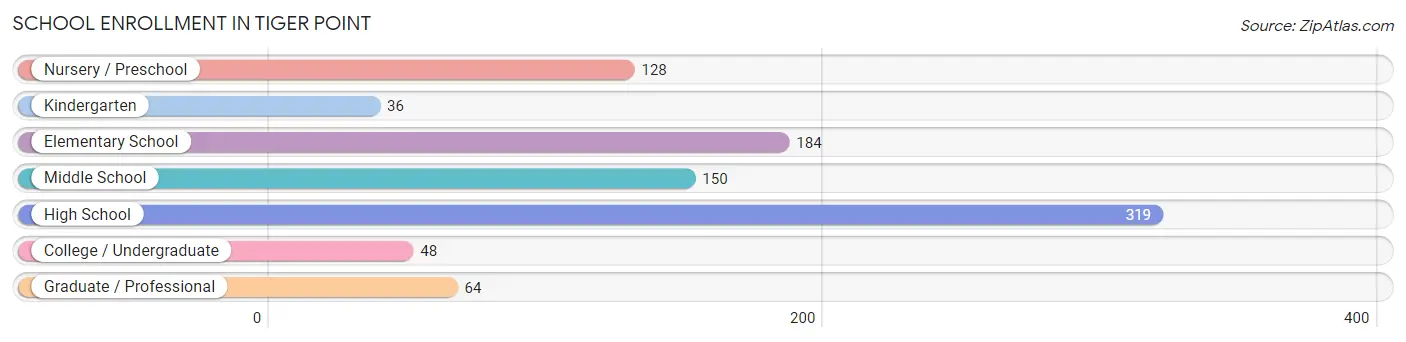
School Enrollment in Tiger Point
The most common levels of schooling among the 929 students in Tiger Point are high school (319 | 34.3%), elementary school (184 | 19.8%), and middle school (150 | 16.2%).
| School Level | # Students | % Students |
| Nursery / Preschool | 128 | 13.8% |
| Kindergarten | 36 | 3.9% |
| Elementary School | 184 | 19.8% |
| Middle School | 150 | 16.2% |
| High School | 319 | 34.3% |
| College / Undergraduate | 48 | 5.2% |
| Graduate / Professional | 64 | 6.9% |
| Total | 929 | 100.0% |
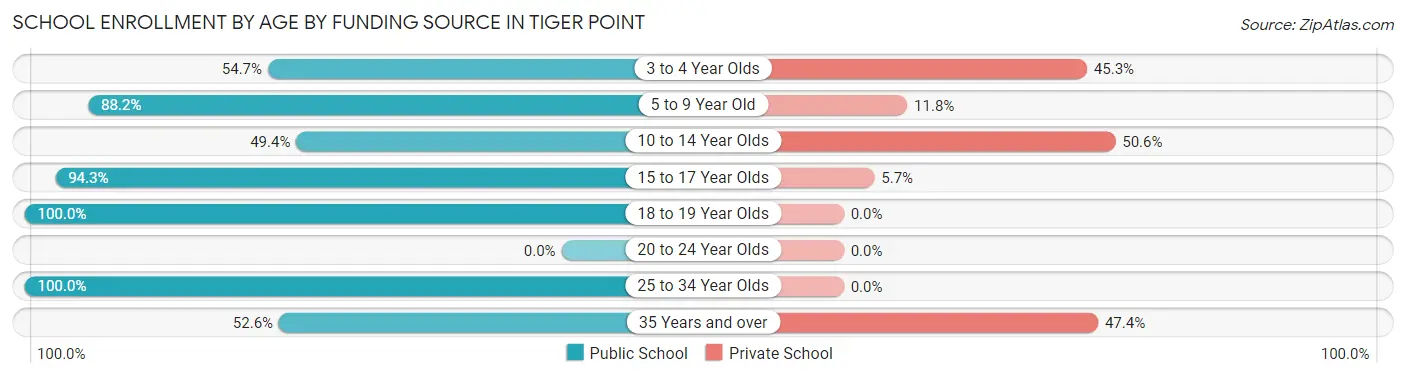
School Enrollment by Age by Funding Source in Tiger Point
Out of a total of 929 students who are enrolled in schools in Tiger Point, 207 (22.3%) attend a private institution, while the remaining 722 (77.7%) are enrolled in public schools. The age group of 10 to 14 year olds has the highest likelihood of being enrolled in private schools, with 84 (50.6% in the age bracket) enrolled. Conversely, the age group of 18 to 19 year olds has the lowest likelihood of being enrolled in a private school, with 111 (100.0% in the age bracket) attending a public institution.
| Age Bracket | Public School | Private School |
| 3 to 4 Year Olds | 70 (54.7%) | 58 (45.3%) |
| 5 to 9 Year Old | 194 (88.2%) | 26 (11.8%) |
| 10 to 14 Year Olds | 82 (49.4%) | 84 (50.6%) |
| 15 to 17 Year Olds | 198 (94.3%) | 12 (5.7%) |
| 18 to 19 Year Olds | 111 (100.0%) | 0 (0.0%) |
| 20 to 24 Year Olds | 0 (0.0%) | 0 (0.0%) |
| 25 to 34 Year Olds | 37 (100.0%) | 0 (0.0%) |
| 35 Years and over | 30 (52.6%) | 27 (47.4%) |
| Total | 722 (77.7%) | 207 (22.3%) |
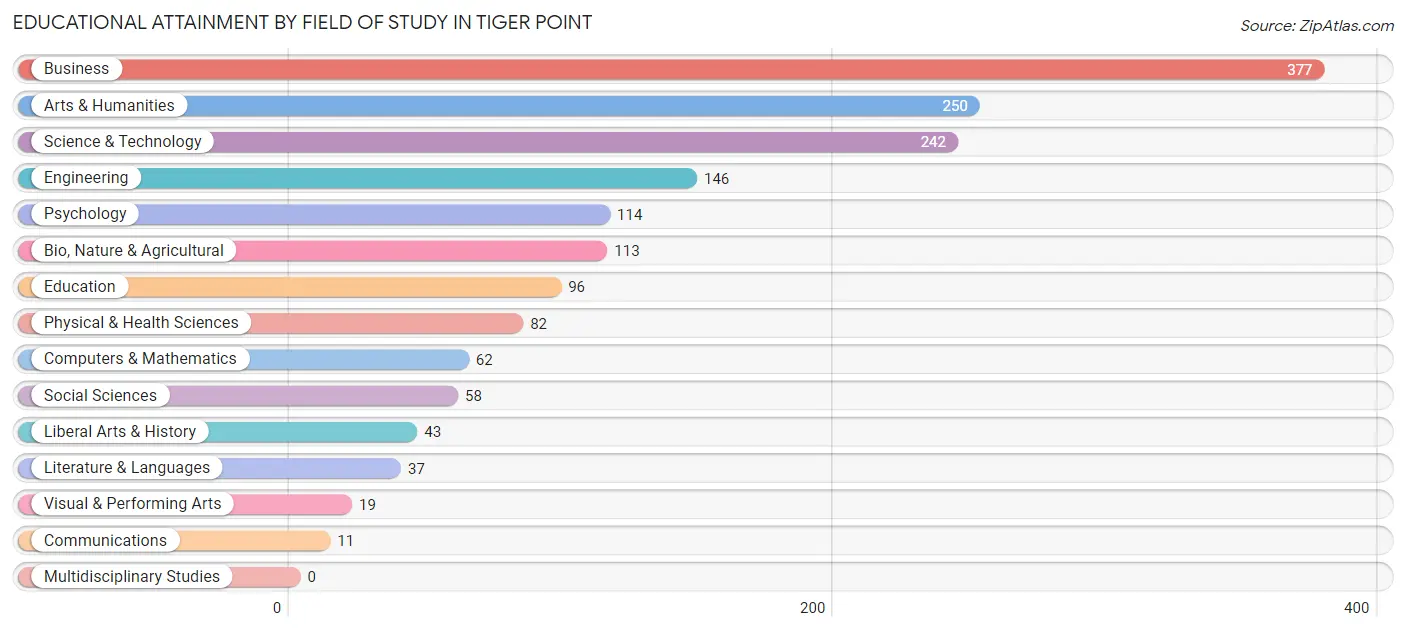
Educational Attainment by Field of Study in Tiger Point
Business (377 | 22.9%), arts & humanities (250 | 15.1%), science & technology (242 | 14.7%), engineering (146 | 8.8%), and psychology (114 | 6.9%) are the most common fields of study among 1,650 individuals in Tiger Point who have obtained a bachelor's degree or higher.
| Field of Study | # Graduates | % Graduates |
| Computers & Mathematics | 62 | 3.8% |
| Bio, Nature & Agricultural | 113 | 6.9% |
| Physical & Health Sciences | 82 | 5.0% |
| Psychology | 114 | 6.9% |
| Social Sciences | 58 | 3.5% |
| Engineering | 146 | 8.8% |
| Multidisciplinary Studies | 0 | 0.0% |
| Science & Technology | 242 | 14.7% |
| Business | 377 | 22.9% |
| Education | 96 | 5.8% |
| Literature & Languages | 37 | 2.2% |
| Liberal Arts & History | 43 | 2.6% |
| Visual & Performing Arts | 19 | 1.1% |
| Communications | 11 | 0.7% |
| Arts & Humanities | 250 | 15.1% |
| Total | 1,650 | 100.0% |
Transportation & Commute in Tiger Point
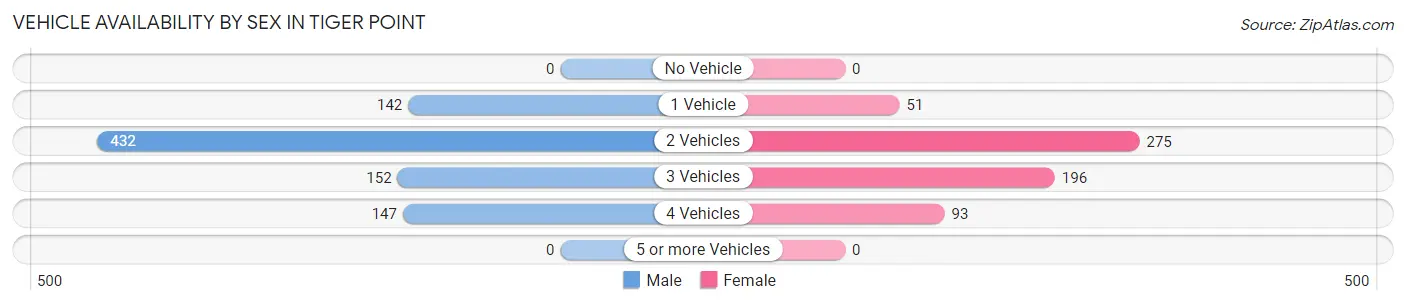
Vehicle Availability by Sex in Tiger Point
The most prevalent vehicle ownership categories in Tiger Point are males with 2 vehicles (432, accounting for 49.5%) and females with 2 vehicles (275, making up 70.2%).
| Vehicles Available | Male | Female |
| No Vehicle | 0 (0.0%) | 0 (0.0%) |
| 1 Vehicle | 142 (16.3%) | 51 (8.3%) |
| 2 Vehicles | 432 (49.5%) | 275 (44.7%) |
| 3 Vehicles | 152 (17.4%) | 196 (31.9%) |
| 4 Vehicles | 147 (16.8%) | 93 (15.1%) |
| 5 or more Vehicles | 0 (0.0%) | 0 (0.0%) |
| Total | 873 (100.0%) | 615 (100.0%) |
Commute Time in Tiger Point
The most frequently occuring commute durations in Tiger Point are 30 to 34 minutes (222 commuters, 16.7%), 45 to 59 minutes (184 commuters, 13.8%), and 5 to 9 minutes (175 commuters, 13.2%).
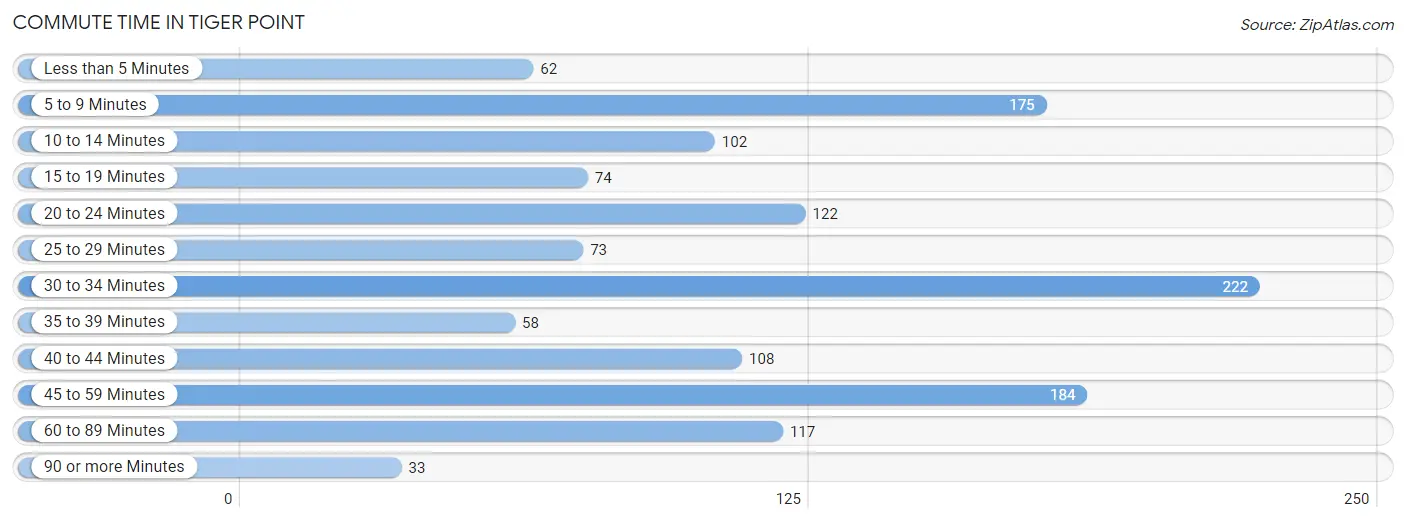
| Commute Time | # Commuters | % Commuters |
| Less than 5 Minutes | 62 | 4.7% |
| 5 to 9 Minutes | 175 | 13.2% |
| 10 to 14 Minutes | 102 | 7.7% |
| 15 to 19 Minutes | 74 | 5.6% |
| 20 to 24 Minutes | 122 | 9.2% |
| 25 to 29 Minutes | 73 | 5.5% |
| 30 to 34 Minutes | 222 | 16.7% |
| 35 to 39 Minutes | 58 | 4.4% |
| 40 to 44 Minutes | 108 | 8.1% |
| 45 to 59 Minutes | 184 | 13.8% |
| 60 to 89 Minutes | 117 | 8.8% |
| 90 or more Minutes | 33 | 2.5% |
Commute Time by Sex in Tiger Point
The most common commute times in Tiger Point are 30 to 34 minutes (152 commuters, 20.8%) for males and 5 to 9 minutes (121 commuters, 20.2%) for females.
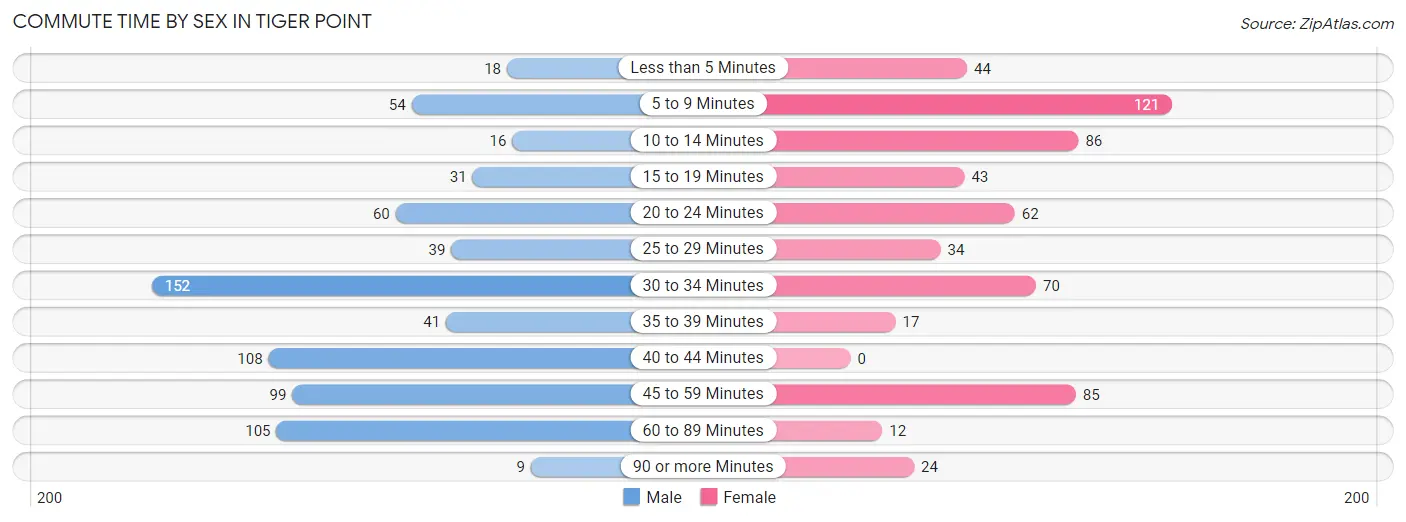
| Commute Time | Male | Female |
| Less than 5 Minutes | 18 (2.5%) | 44 (7.4%) |
| 5 to 9 Minutes | 54 (7.4%) | 121 (20.2%) |
| 10 to 14 Minutes | 16 (2.2%) | 86 (14.4%) |
| 15 to 19 Minutes | 31 (4.2%) | 43 (7.2%) |
| 20 to 24 Minutes | 60 (8.2%) | 62 (10.4%) |
| 25 to 29 Minutes | 39 (5.3%) | 34 (5.7%) |
| 30 to 34 Minutes | 152 (20.8%) | 70 (11.7%) |
| 35 to 39 Minutes | 41 (5.6%) | 17 (2.8%) |
| 40 to 44 Minutes | 108 (14.7%) | 0 (0.0%) |
| 45 to 59 Minutes | 99 (13.5%) | 85 (14.2%) |
| 60 to 89 Minutes | 105 (14.3%) | 12 (2.0%) |
| 90 or more Minutes | 9 (1.2%) | 24 (4.0%) |
Time of Departure to Work by Sex in Tiger Point
The most frequent times of departure to work in Tiger Point are 6:00 AM to 6:29 AM (139, 19.0%) for males and 7:30 AM to 7:59 AM (153, 25.6%) for females.
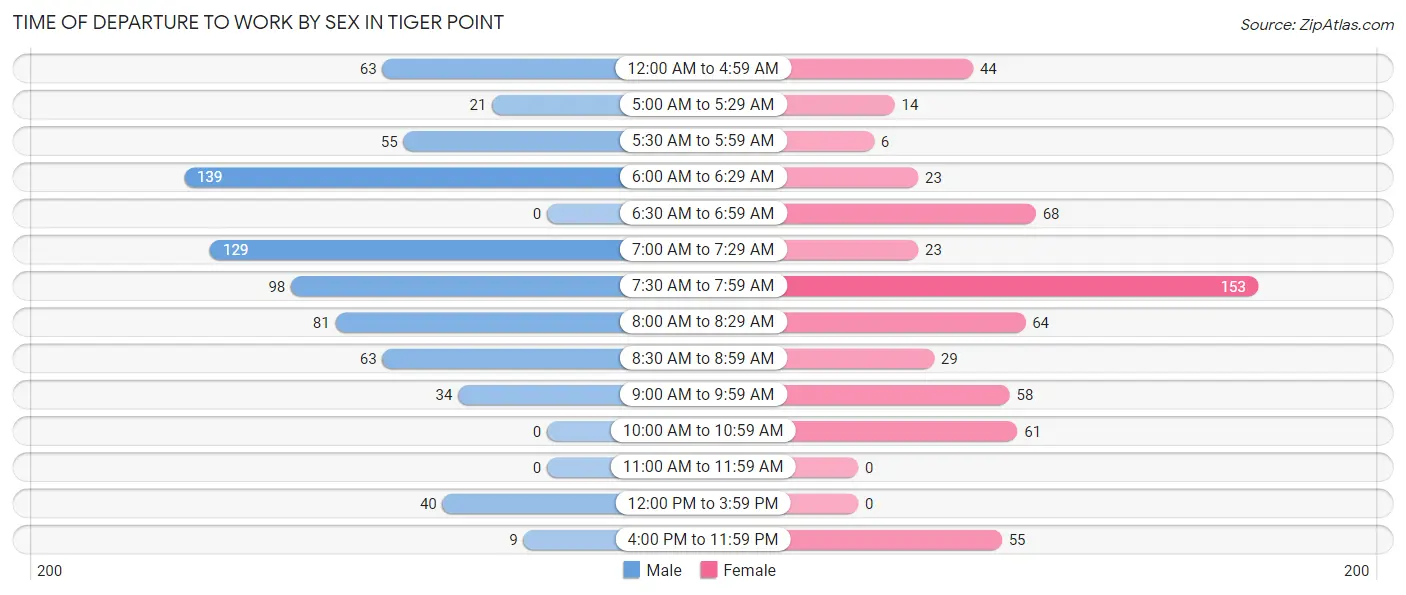
| Time of Departure | Male | Female |
| 12:00 AM to 4:59 AM | 63 (8.6%) | 44 (7.4%) |
| 5:00 AM to 5:29 AM | 21 (2.9%) | 14 (2.3%) |
| 5:30 AM to 5:59 AM | 55 (7.5%) | 6 (1.0%) |
| 6:00 AM to 6:29 AM | 139 (19.0%) | 23 (3.8%) |
| 6:30 AM to 6:59 AM | 0 (0.0%) | 68 (11.4%) |
| 7:00 AM to 7:29 AM | 129 (17.6%) | 23 (3.8%) |
| 7:30 AM to 7:59 AM | 98 (13.4%) | 153 (25.6%) |
| 8:00 AM to 8:29 AM | 81 (11.1%) | 64 (10.7%) |
| 8:30 AM to 8:59 AM | 63 (8.6%) | 29 (4.9%) |
| 9:00 AM to 9:59 AM | 34 (4.6%) | 58 (9.7%) |
| 10:00 AM to 10:59 AM | 0 (0.0%) | 61 (10.2%) |
| 11:00 AM to 11:59 AM | 0 (0.0%) | 0 (0.0%) |
| 12:00 PM to 3:59 PM | 40 (5.5%) | 0 (0.0%) |
| 4:00 PM to 11:59 PM | 9 (1.2%) | 55 (9.2%) |
| Total | 732 (100.0%) | 598 (100.0%) |
Housing Occupancy in Tiger Point
Occupancy by Ownership in Tiger Point
Of the total 1,366 dwellings in Tiger Point, owner-occupied units account for 1,297 (95.0%), while renter-occupied units make up 69 (5.1%).
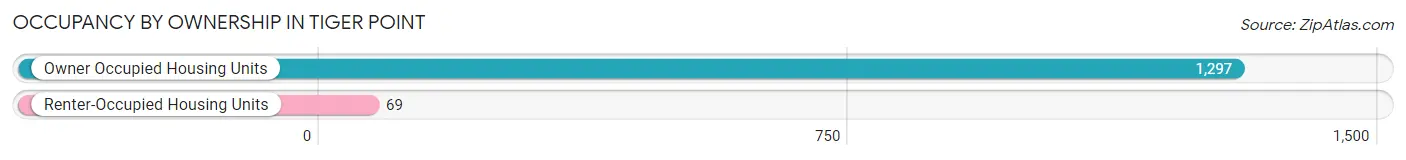
| Occupancy | # Housing Units | % Housing Units |
| Owner Occupied Housing Units | 1,297 | 95.0% |
| Renter-Occupied Housing Units | 69 | 5.1% |
| Total Occupied Housing Units | 1,366 | 100.0% |
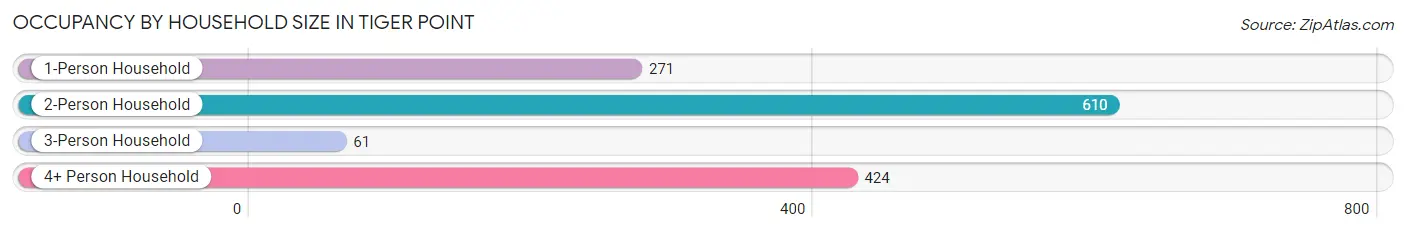
Occupancy by Household Size in Tiger Point
| Household Size | # Housing Units | % Housing Units |
| 1-Person Household | 271 | 19.8% |
| 2-Person Household | 610 | 44.7% |
| 3-Person Household | 61 | 4.5% |
| 4+ Person Household | 424 | 31.0% |
| Total Housing Units | 1,366 | 100.0% |
Occupancy by Ownership by Household Size in Tiger Point
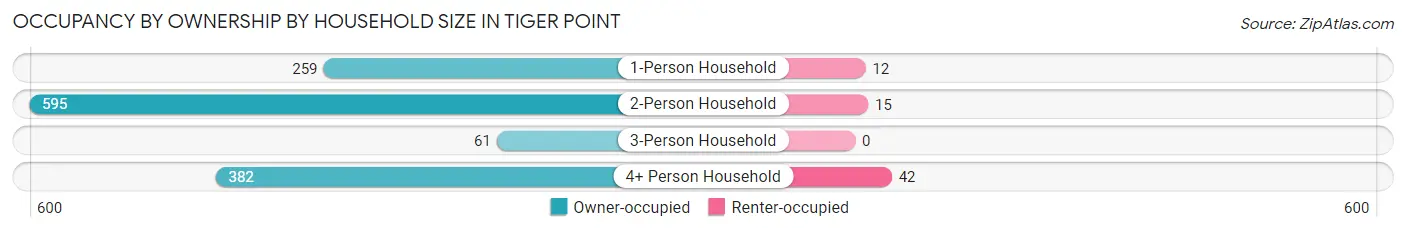
| Household Size | Owner-occupied | Renter-occupied |
| 1-Person Household | 259 (95.6%) | 12 (4.4%) |
| 2-Person Household | 595 (97.5%) | 15 (2.5%) |
| 3-Person Household | 61 (100.0%) | 0 (0.0%) |
| 4+ Person Household | 382 (90.1%) | 42 (9.9%) |
| Total Housing Units | 1,297 (95.0%) | 69 (5.1%) |
Occupancy by Educational Attainment in Tiger Point
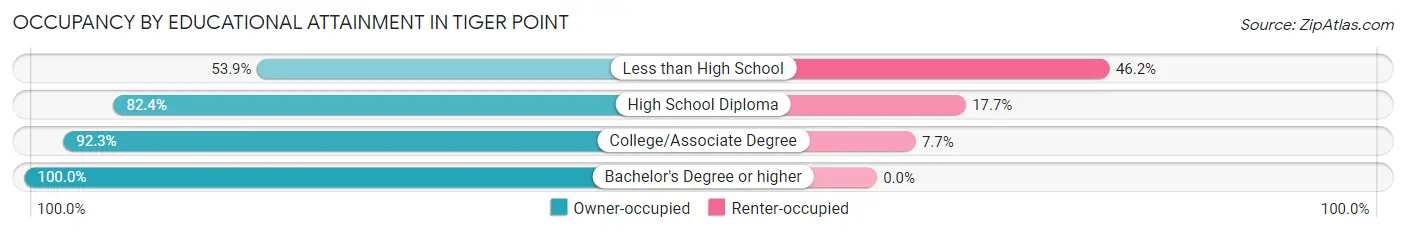
| Household Size | Owner-occupied | Renter-occupied |
| Less than High School | 14 (53.8%) | 12 (46.2%) |
| High School Diploma | 140 (82.4%) | 30 (17.6%) |
| College/Associate Degree | 324 (92.3%) | 27 (7.7%) |
| Bachelor's Degree or higher | 819 (100.0%) | 0 (0.0%) |
Occupancy by Age of Householder in Tiger Point
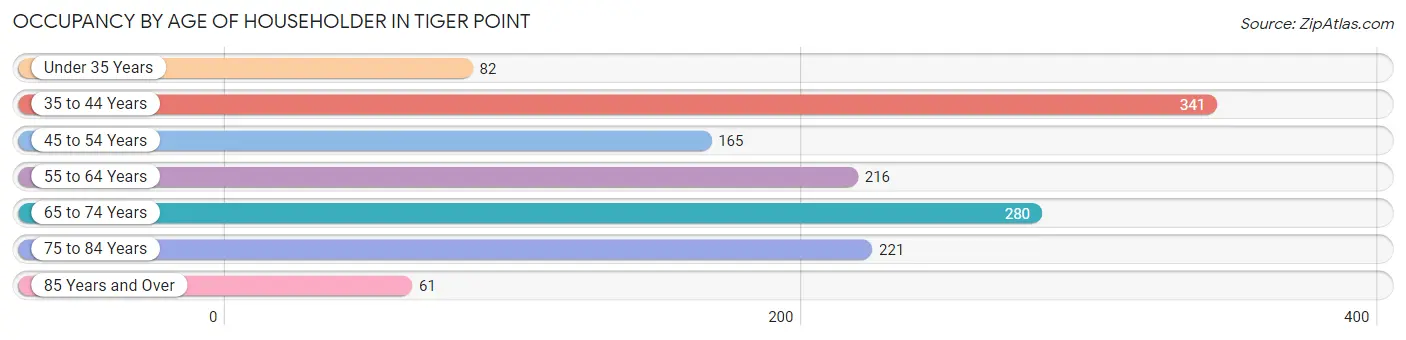
| Age Bracket | # Households | % Households |
| Under 35 Years | 82 | 6.0% |
| 35 to 44 Years | 341 | 25.0% |
| 45 to 54 Years | 165 | 12.1% |
| 55 to 64 Years | 216 | 15.8% |
| 65 to 74 Years | 280 | 20.5% |
| 75 to 84 Years | 221 | 16.2% |
| 85 Years and Over | 61 | 4.5% |
| Total | 1,366 | 100.0% |
Housing Finances in Tiger Point
Median Income by Occupancy in Tiger Point
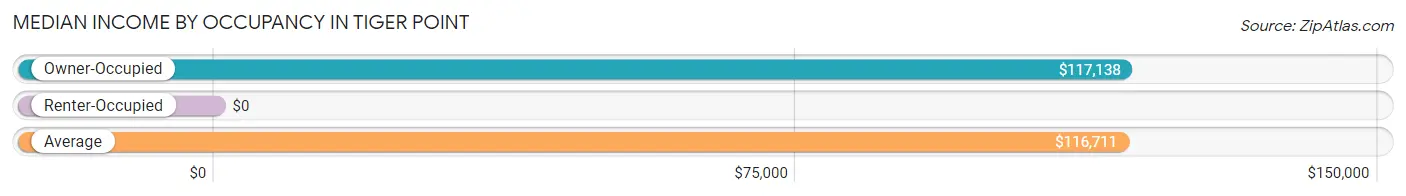
| Occupancy Type | # Households | Median Income |
| Owner-Occupied | 1,297 (95.0%) | $117,138 |
| Renter-Occupied | 69 (5.1%) | $0 |
| Average | 1,366 (100.0%) | $116,711 |
Occupancy by Householder Income Bracket in Tiger Point
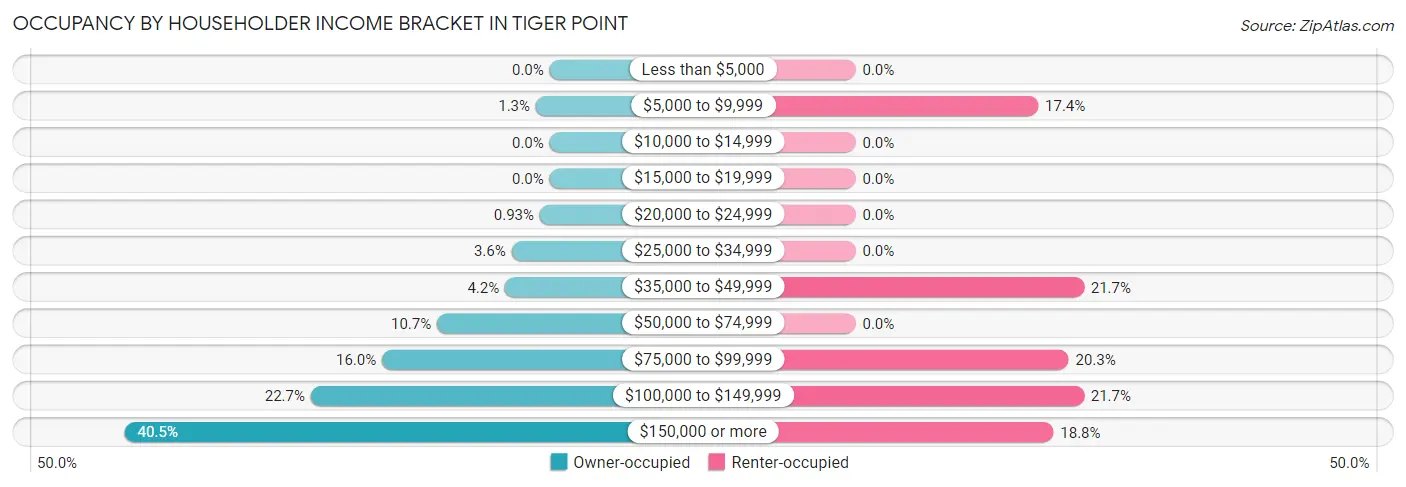
| Income Bracket | Owner-occupied | Renter-occupied |
| Less than $5,000 | 0 (0.0%) | 0 (0.0%) |
| $5,000 to $9,999 | 17 (1.3%) | 12 (17.4%) |
| $10,000 to $14,999 | 0 (0.0%) | 0 (0.0%) |
| $15,000 to $19,999 | 0 (0.0%) | 0 (0.0%) |
| $20,000 to $24,999 | 12 (0.9%) | 0 (0.0%) |
| $25,000 to $34,999 | 47 (3.6%) | 0 (0.0%) |
| $35,000 to $49,999 | 55 (4.2%) | 15 (21.7%) |
| $50,000 to $74,999 | 139 (10.7%) | 0 (0.0%) |
| $75,000 to $99,999 | 207 (16.0%) | 14 (20.3%) |
| $100,000 to $149,999 | 295 (22.7%) | 15 (21.7%) |
| $150,000 or more | 525 (40.5%) | 13 (18.8%) |
| Total | 1,297 (100.0%) | 69 (100.0%) |
Monthly Housing Cost Tiers in Tiger Point
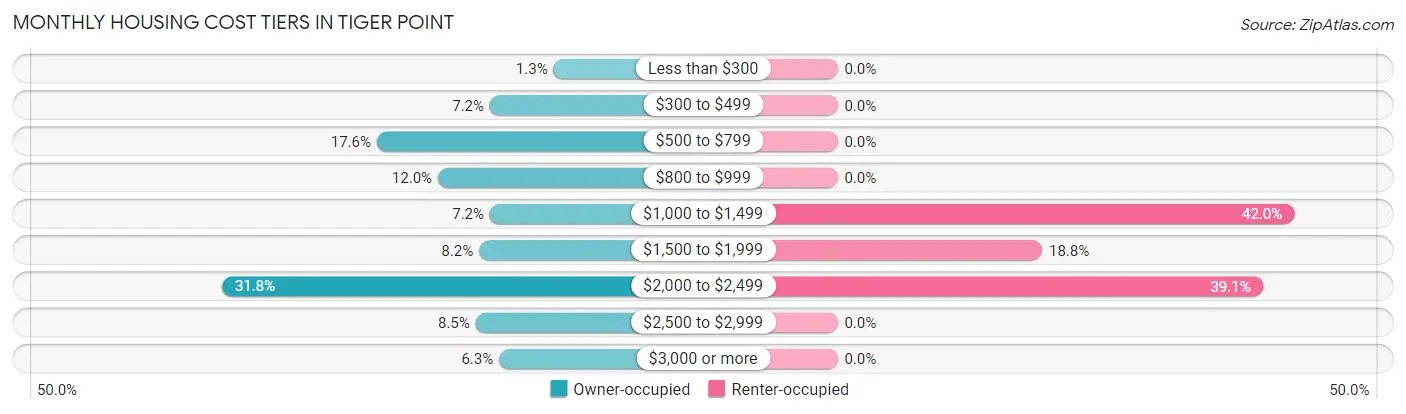
| Monthly Cost | Owner-occupied | Renter-occupied |
| Less than $300 | 17 (1.3%) | 0 (0.0%) |
| $300 to $499 | 93 (7.2%) | 0 (0.0%) |
| $500 to $799 | 228 (17.6%) | 0 (0.0%) |
| $800 to $999 | 155 (11.9%) | 0 (0.0%) |
| $1,000 to $1,499 | 93 (7.2%) | 29 (42.0%) |
| $1,500 to $1,999 | 106 (8.2%) | 13 (18.8%) |
| $2,000 to $2,499 | 413 (31.8%) | 27 (39.1%) |
| $2,500 to $2,999 | 110 (8.5%) | 0 (0.0%) |
| $3,000 or more | 82 (6.3%) | 0 (0.0%) |
| Total | 1,297 (100.0%) | 69 (100.0%) |
Physical Housing Characteristics in Tiger Point
Housing Structures in Tiger Point
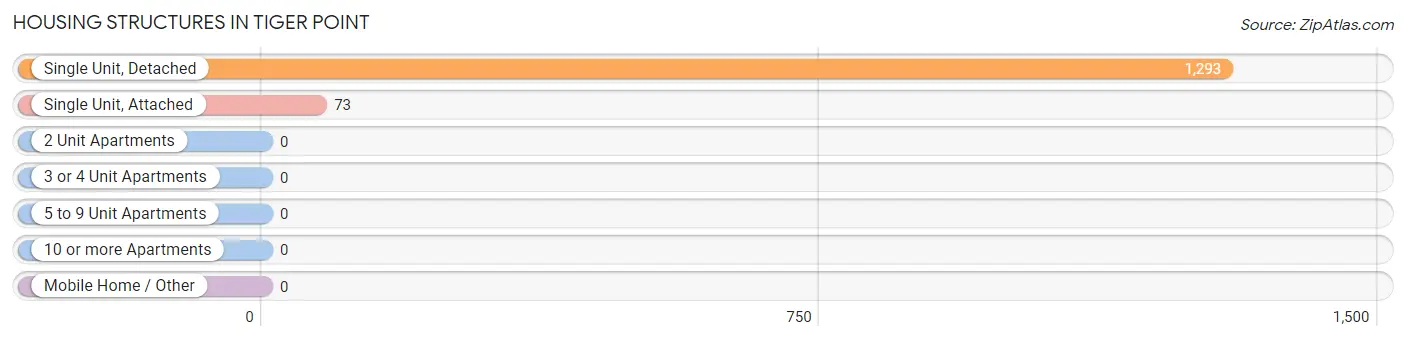
| Structure Type | # Housing Units | % Housing Units |
| Single Unit, Detached | 1,293 | 94.7% |
| Single Unit, Attached | 73 | 5.3% |
| 2 Unit Apartments | 0 | 0.0% |
| 3 or 4 Unit Apartments | 0 | 0.0% |
| 5 to 9 Unit Apartments | 0 | 0.0% |
| 10 or more Apartments | 0 | 0.0% |
| Mobile Home / Other | 0 | 0.0% |
| Total | 1,366 | 100.0% |
Housing Structures by Occupancy in Tiger Point
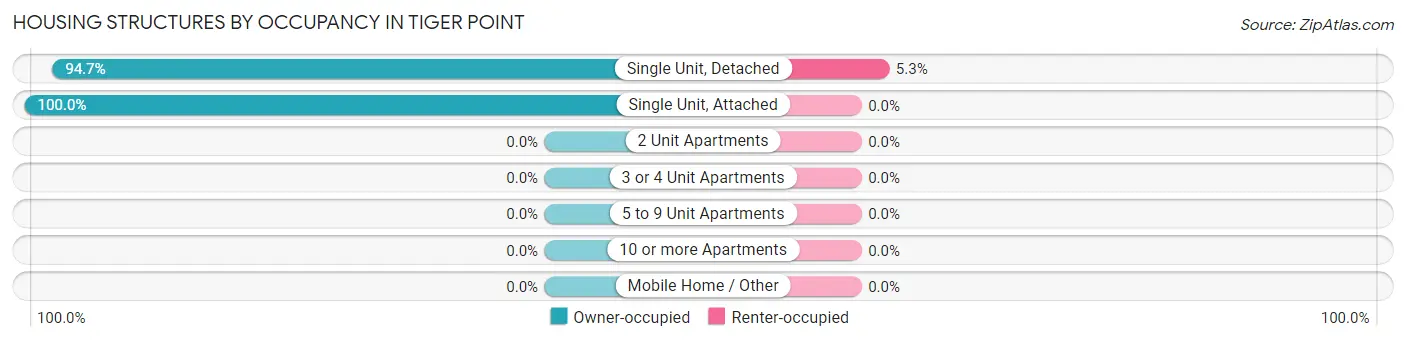
| Structure Type | Owner-occupied | Renter-occupied |
| Single Unit, Detached | 1,224 (94.7%) | 69 (5.3%) |
| Single Unit, Attached | 73 (100.0%) | 0 (0.0%) |
| 2 Unit Apartments | 0 (0.0%) | 0 (0.0%) |
| 3 or 4 Unit Apartments | 0 (0.0%) | 0 (0.0%) |
| 5 to 9 Unit Apartments | 0 (0.0%) | 0 (0.0%) |
| 10 or more Apartments | 0 (0.0%) | 0 (0.0%) |
| Mobile Home / Other | 0 (0.0%) | 0 (0.0%) |
| Total | 1,297 (95.0%) | 69 (5.1%) |
Housing Structures by Number of Rooms in Tiger Point
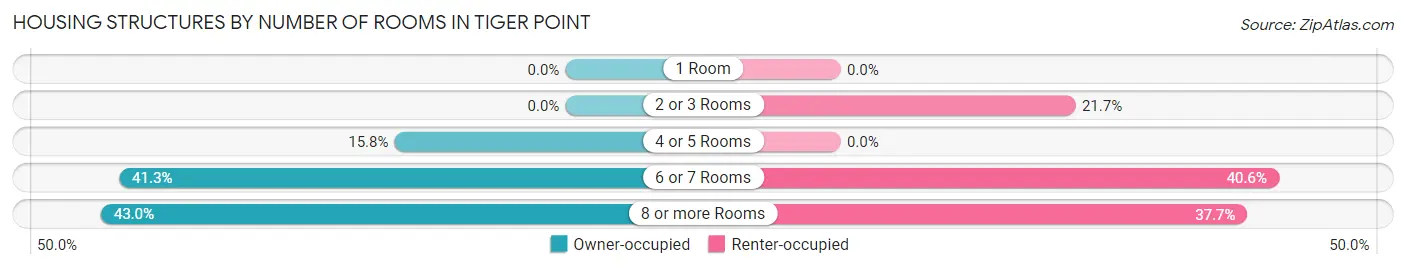
| Number of Rooms | Owner-occupied | Renter-occupied |
| 1 Room | 0 (0.0%) | 0 (0.0%) |
| 2 or 3 Rooms | 0 (0.0%) | 15 (21.7%) |
| 4 or 5 Rooms | 205 (15.8%) | 0 (0.0%) |
| 6 or 7 Rooms | 535 (41.2%) | 28 (40.6%) |
| 8 or more Rooms | 557 (42.9%) | 26 (37.7%) |
| Total | 1,297 (100.0%) | 69 (100.0%) |
Housing Structure by Heating Type in Tiger Point
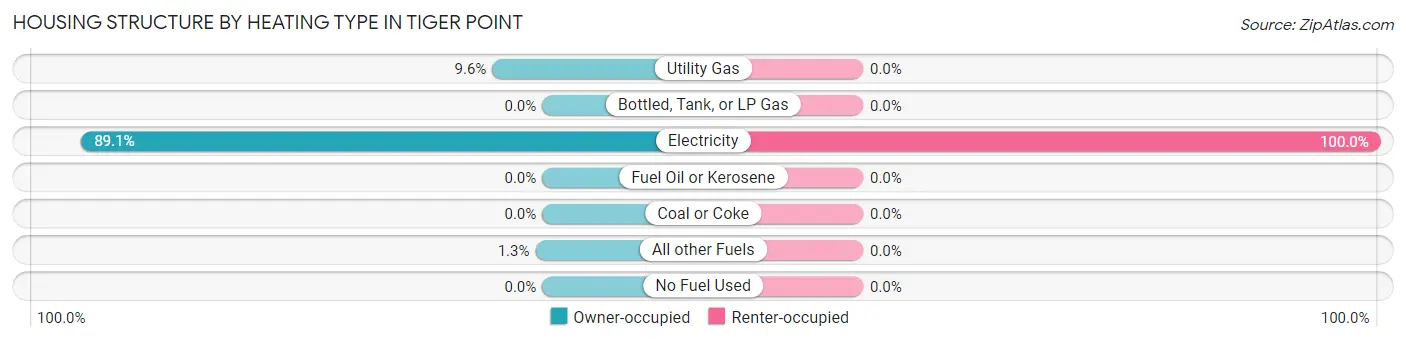
| Heating Type | Owner-occupied | Renter-occupied |
| Utility Gas | 125 (9.6%) | 0 (0.0%) |
| Bottled, Tank, or LP Gas | 0 (0.0%) | 0 (0.0%) |
| Electricity | 1,155 (89.0%) | 69 (100.0%) |
| Fuel Oil or Kerosene | 0 (0.0%) | 0 (0.0%) |
| Coal or Coke | 0 (0.0%) | 0 (0.0%) |
| All other Fuels | 17 (1.3%) | 0 (0.0%) |
| No Fuel Used | 0 (0.0%) | 0 (0.0%) |
| Total | 1,297 (100.0%) | 69 (100.0%) |
Household Vehicle Usage in Tiger Point
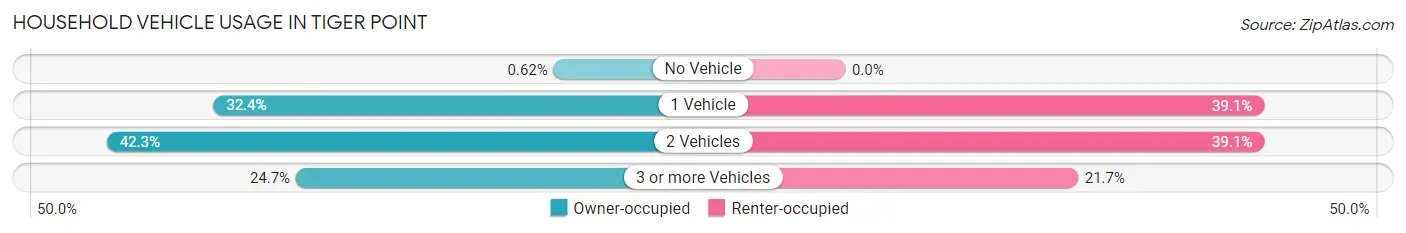
| Vehicles per Household | Owner-occupied | Renter-occupied |
| No Vehicle | 8 (0.6%) | 0 (0.0%) |
| 1 Vehicle | 420 (32.4%) | 27 (39.1%) |
| 2 Vehicles | 549 (42.3%) | 27 (39.1%) |
| 3 or more Vehicles | 320 (24.7%) | 15 (21.7%) |
| Total | 1,297 (100.0%) | 69 (100.0%) |
Real Estate & Mortgages in Tiger Point
Real Estate and Mortgage Overview in Tiger Point
| Characteristic | Without Mortgage | With Mortgage |
| Housing Units | 539 | 758 |
| Median Property Value | $316,400 | $371,800 |
| Median Household Income | $120,221 | $332 |
| Monthly Housing Costs | $757 | $82 |
| Real Estate Taxes | $2,347 | $14 |
Property Value by Mortgage Status in Tiger Point
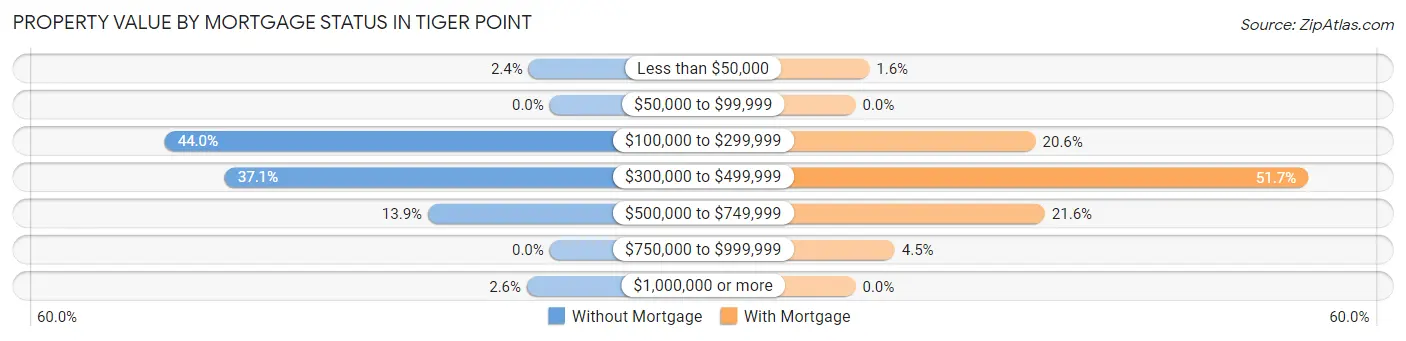
| Property Value | Without Mortgage | With Mortgage |
| Less than $50,000 | 13 (2.4%) | 12 (1.6%) |
| $50,000 to $99,999 | 0 (0.0%) | 0 (0.0%) |
| $100,000 to $299,999 | 237 (44.0%) | 156 (20.6%) |
| $300,000 to $499,999 | 200 (37.1%) | 392 (51.7%) |
| $500,000 to $749,999 | 75 (13.9%) | 164 (21.6%) |
| $750,000 to $999,999 | 0 (0.0%) | 34 (4.5%) |
| $1,000,000 or more | 14 (2.6%) | 0 (0.0%) |
| Total | 539 (100.0%) | 758 (100.0%) |
Household Income by Mortgage Status in Tiger Point
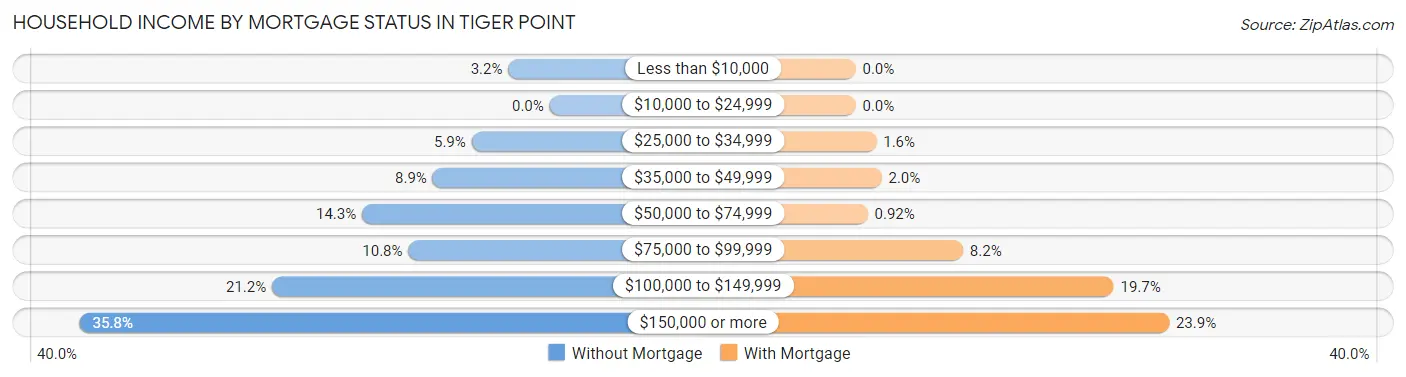
| Household Income | Without Mortgage | With Mortgage |
| Less than $10,000 | 17 (3.2%) | 0 (0.0%) |
| $10,000 to $24,999 | 0 (0.0%) | 0 (0.0%) |
| $25,000 to $34,999 | 32 (5.9%) | 12 (1.6%) |
| $35,000 to $49,999 | 48 (8.9%) | 15 (2.0%) |
| $50,000 to $74,999 | 77 (14.3%) | 7 (0.9%) |
| $75,000 to $99,999 | 58 (10.8%) | 62 (8.2%) |
| $100,000 to $149,999 | 114 (21.1%) | 149 (19.7%) |
| $150,000 or more | 193 (35.8%) | 181 (23.9%) |
| Total | 539 (100.0%) | 758 (100.0%) |
Property Value to Household Income Ratio in Tiger Point
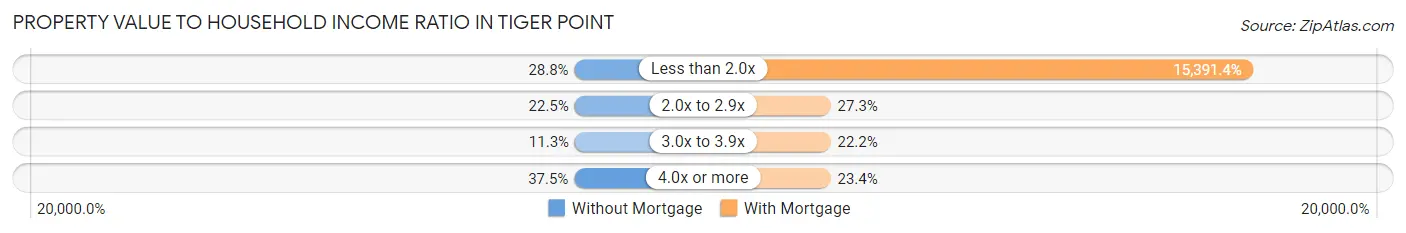
| Value-to-Income Ratio | Without Mortgage | With Mortgage |
| Less than 2.0x | 155 (28.8%) | 116,667 (15,391.4%) |
| 2.0x to 2.9x | 121 (22.5%) | 207 (27.3%) |
| 3.0x to 3.9x | 61 (11.3%) | 168 (22.2%) |
| 4.0x or more | 202 (37.5%) | 177 (23.4%) |
| Total | 539 (100.0%) | 758 (100.0%) |
Real Estate Taxes by Mortgage Status in Tiger Point
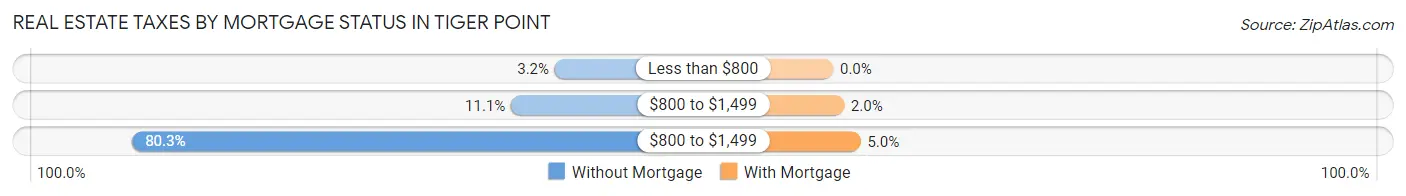
| Property Taxes | Without Mortgage | With Mortgage |
| Less than $800 | 17 (3.2%) | 0 (0.0%) |
| $800 to $1,499 | 60 (11.1%) | 15 (2.0%) |
| $800 to $1,499 | 433 (80.3%) | 38 (5.0%) |
| Total | 539 (100.0%) | 758 (100.0%) |
Health & Disability in Tiger Point
Health Insurance Coverage by Age in Tiger Point
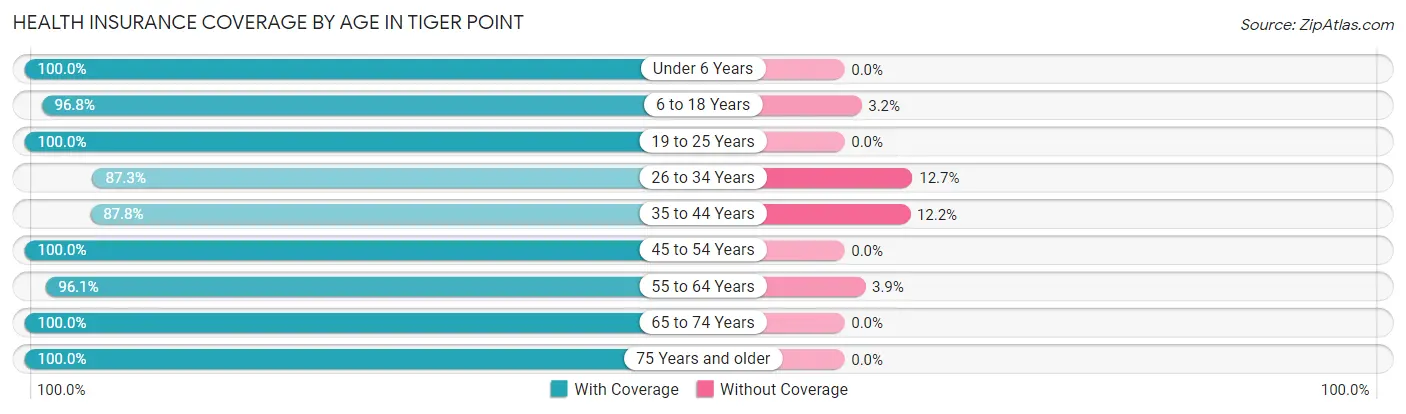
| Age Bracket | With Coverage | Without Coverage |
| Under 6 Years | 197 (100.0%) | 0 (0.0%) |
| 6 to 18 Years | 672 (96.8%) | 22 (3.2%) |
| 19 to 25 Years | 55 (100.0%) | 0 (0.0%) |
| 26 to 34 Years | 179 (87.3%) | 26 (12.7%) |
| 35 to 44 Years | 502 (87.8%) | 70 (12.2%) |
| 45 to 54 Years | 285 (100.0%) | 0 (0.0%) |
| 55 to 64 Years | 397 (96.1%) | 16 (3.9%) |
| 65 to 74 Years | 501 (100.0%) | 0 (0.0%) |
| 75 Years and older | 469 (100.0%) | 0 (0.0%) |
| Total | 3,257 (96.1%) | 134 (4.0%) |
Health Insurance Coverage by Citizenship Status in Tiger Point
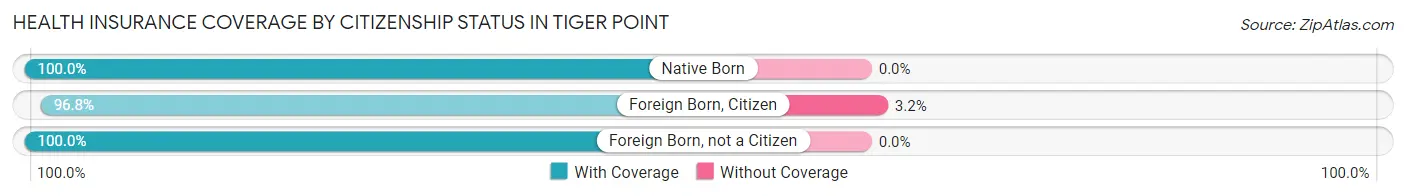
| Citizenship Status | With Coverage | Without Coverage |
| Native Born | 197 (100.0%) | 0 (0.0%) |
| Foreign Born, Citizen | 672 (96.8%) | 22 (3.2%) |
| Foreign Born, not a Citizen | 55 (100.0%) | 0 (0.0%) |
Health Insurance Coverage by Household Income in Tiger Point
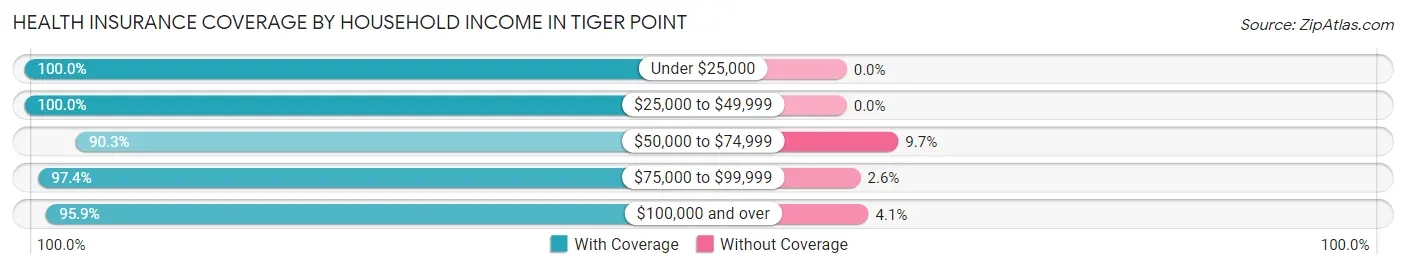
| Household Income | With Coverage | Without Coverage |
| Under $25,000 | 60 (100.0%) | 0 (0.0%) |
| $25,000 to $49,999 | 188 (100.0%) | 0 (0.0%) |
| $50,000 to $74,999 | 243 (90.3%) | 26 (9.7%) |
| $75,000 to $99,999 | 601 (97.4%) | 16 (2.6%) |
| $100,000 and over | 2,165 (95.9%) | 92 (4.1%) |
Public vs Private Health Insurance Coverage by Age in Tiger Point
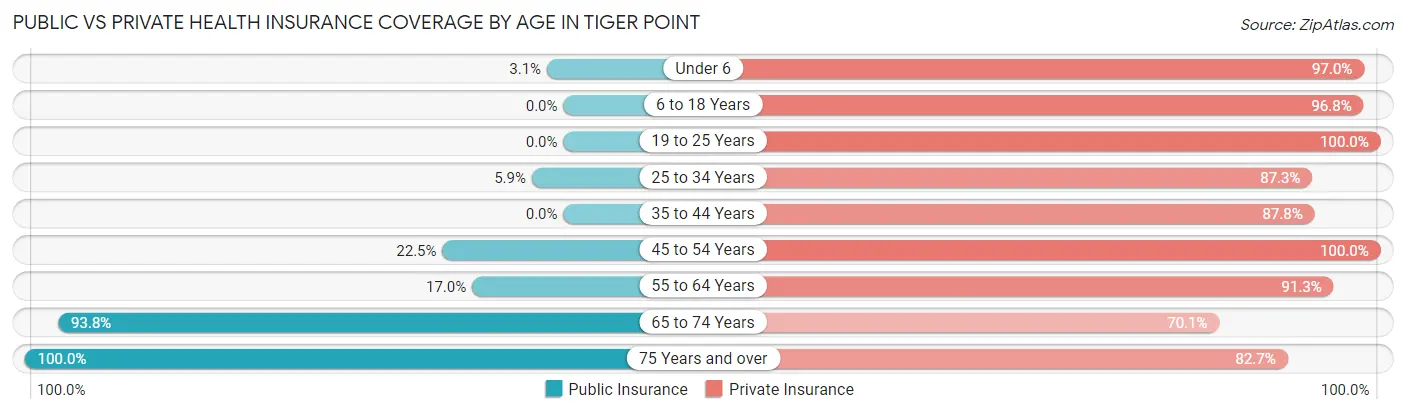
| Age Bracket | Public Insurance | Private Insurance |
| Under 6 | 6 (3.0%) | 191 (97.0%) |
| 6 to 18 Years | 0 (0.0%) | 672 (96.8%) |
| 19 to 25 Years | 0 (0.0%) | 55 (100.0%) |
| 25 to 34 Years | 12 (5.9%) | 179 (87.3%) |
| 35 to 44 Years | 0 (0.0%) | 502 (87.8%) |
| 45 to 54 Years | 64 (22.5%) | 285 (100.0%) |
| 55 to 64 Years | 70 (17.0%) | 377 (91.3%) |
| 65 to 74 Years | 470 (93.8%) | 351 (70.1%) |
| 75 Years and over | 469 (100.0%) | 388 (82.7%) |
| Total | 1,091 (32.2%) | 3,000 (88.5%) |
Disability Status by Sex by Age in Tiger Point
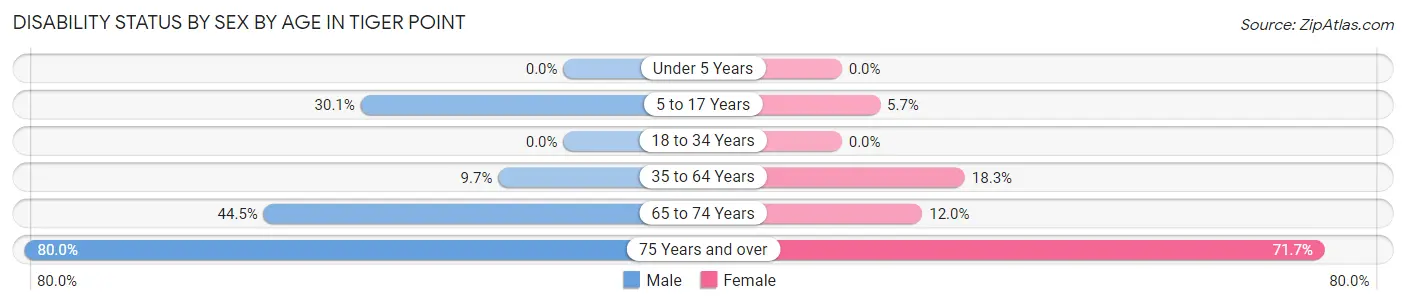
| Age Bracket | Male | Female |
| Under 5 Years | 0 (0.0%) | 0 (0.0%) |
| 5 to 17 Years | 106 (30.1%) | 16 (5.7%) |
| 18 to 34 Years | 0 (0.0%) | 0 (0.0%) |
| 35 to 64 Years | 53 (9.7%) | 132 (18.3%) |
| 65 to 74 Years | 89 (44.5%) | 36 (12.0%) |
| 75 Years and over | 180 (80.0%) | 175 (71.7%) |
Disability Class by Sex by Age in Tiger Point
Disability Class: Hearing Difficulty
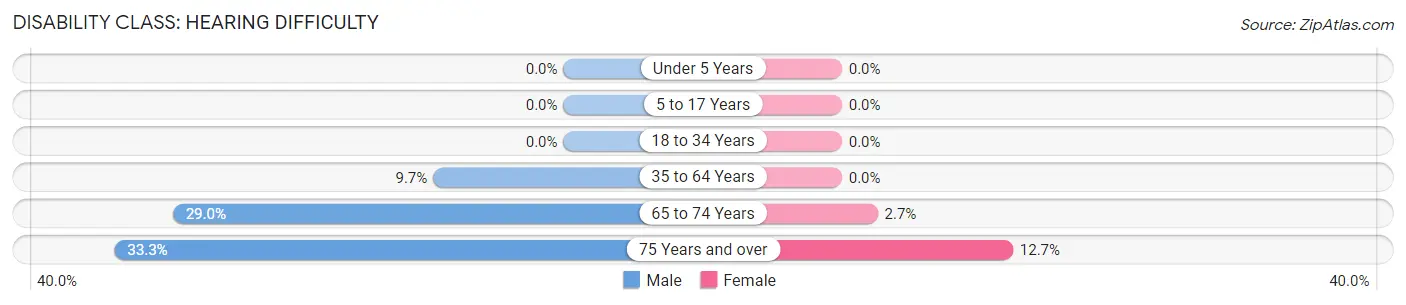
| Age Bracket | Male | Female |
| Under 5 Years | 0 (0.0%) | 0 (0.0%) |
| 5 to 17 Years | 0 (0.0%) | 0 (0.0%) |
| 18 to 34 Years | 0 (0.0%) | 0 (0.0%) |
| 35 to 64 Years | 53 (9.7%) | 0 (0.0%) |
| 65 to 74 Years | 58 (29.0%) | 8 (2.7%) |
| 75 Years and over | 75 (33.3%) | 31 (12.7%) |
Disability Class: Vision Difficulty
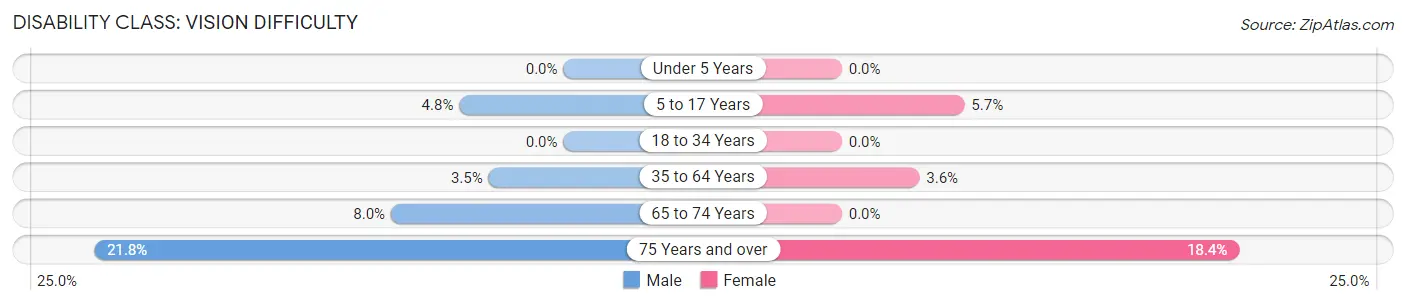
| Age Bracket | Male | Female |
| Under 5 Years | 0 (0.0%) | 0 (0.0%) |
| 5 to 17 Years | 17 (4.8%) | 16 (5.7%) |
| 18 to 34 Years | 0 (0.0%) | 0 (0.0%) |
| 35 to 64 Years | 19 (3.5%) | 26 (3.6%) |
| 65 to 74 Years | 16 (8.0%) | 0 (0.0%) |
| 75 Years and over | 49 (21.8%) | 45 (18.4%) |
Disability Class: Cognitive Difficulty
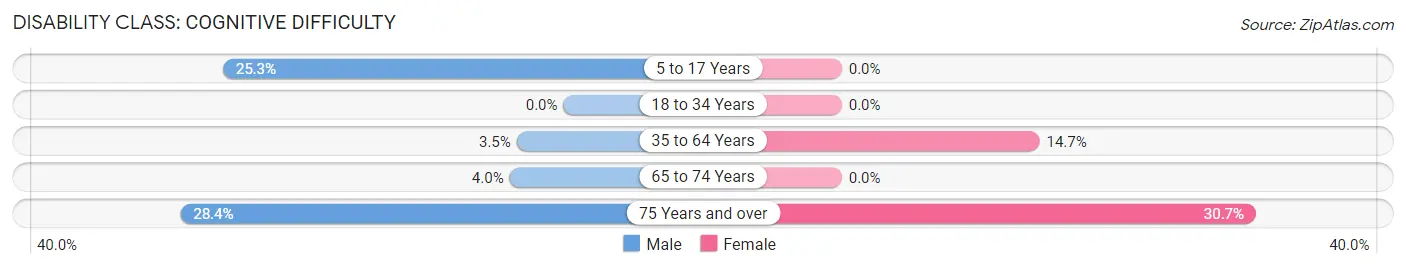
| Age Bracket | Male | Female |
| 5 to 17 Years | 89 (25.3%) | 0 (0.0%) |
| 18 to 34 Years | 0 (0.0%) | 0 (0.0%) |
| 35 to 64 Years | 19 (3.5%) | 106 (14.7%) |
| 65 to 74 Years | 8 (4.0%) | 0 (0.0%) |
| 75 Years and over | 64 (28.4%) | 75 (30.7%) |
Disability Class: Ambulatory Difficulty
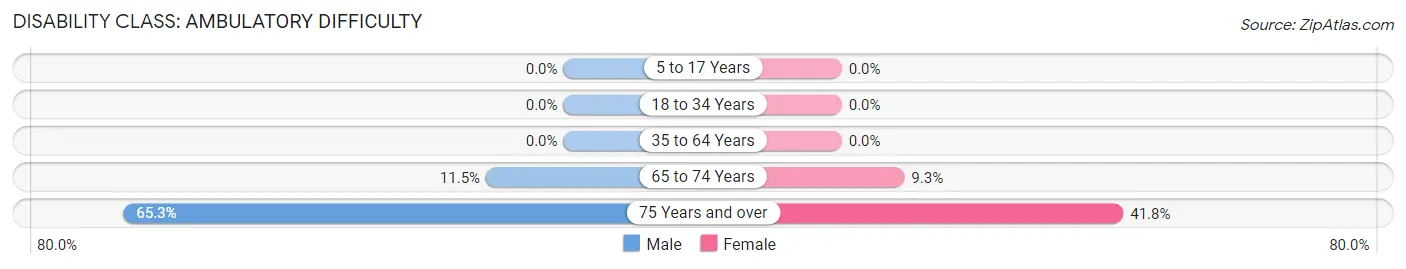
| Age Bracket | Male | Female |
| 5 to 17 Years | 0 (0.0%) | 0 (0.0%) |
| 18 to 34 Years | 0 (0.0%) | 0 (0.0%) |
| 35 to 64 Years | 0 (0.0%) | 0 (0.0%) |
| 65 to 74 Years | 23 (11.5%) | 28 (9.3%) |
| 75 Years and over | 147 (65.3%) | 102 (41.8%) |
Disability Class: Self-Care Difficulty
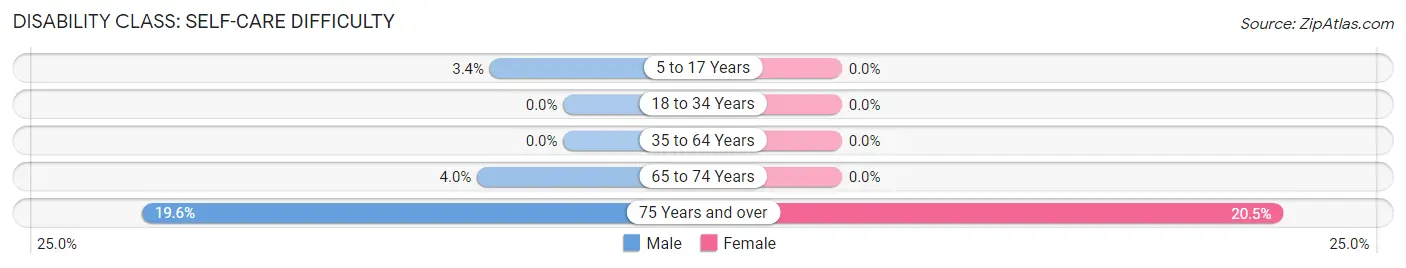
| Age Bracket | Male | Female |
| 5 to 17 Years | 12 (3.4%) | 0 (0.0%) |
| 18 to 34 Years | 0 (0.0%) | 0 (0.0%) |
| 35 to 64 Years | 0 (0.0%) | 0 (0.0%) |
| 65 to 74 Years | 8 (4.0%) | 0 (0.0%) |
| 75 Years and over | 44 (19.6%) | 50 (20.5%) |
Technology Access in Tiger Point
Computing Device Access in Tiger Point
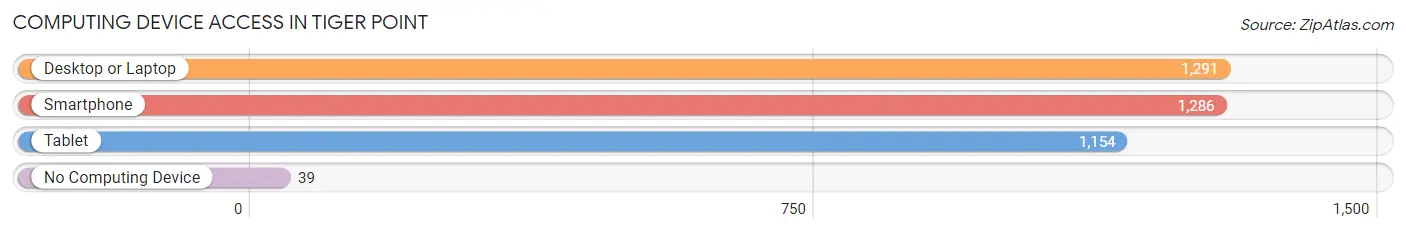
| Device Type | # Households | % Households |
| Desktop or Laptop | 1,291 | 94.5% |
| Smartphone | 1,286 | 94.1% |
| Tablet | 1,154 | 84.5% |
| No Computing Device | 39 | 2.9% |
| Total | 1,366 | 100.0% |
Internet Access in Tiger Point
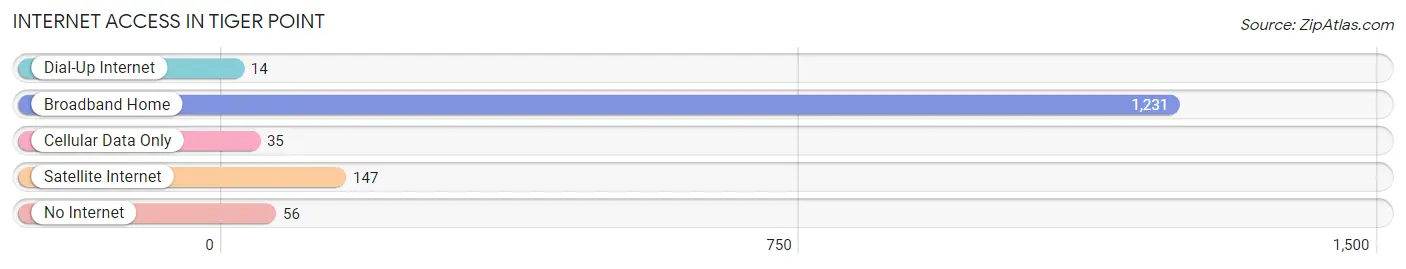
| Internet Type | # Households | % Households |
| Dial-Up Internet | 14 | 1.0% |
| Broadband Home | 1,231 | 90.1% |
| Cellular Data Only | 35 | 2.6% |
| Satellite Internet | 147 | 10.8% |
| No Internet | 56 | 4.1% |
| Total | 1,366 | 100.0% |
Tiger Point Summary
Tiger Point is an unincorporated community located in the western part of Santa Rosa County, Florida. It is situated on the northern shore of East Bay, a part of the larger Pensacola Bay. The community is bordered by the city of Gulf Breeze to the east and the city of Pensacola to the west. Tiger Point is home to a variety of businesses, including a golf course, a marina, and a variety of restaurants and shops.
History
The area that is now known as Tiger Point was originally inhabited by Native American tribes, including the Muscogee and Choctaw. The first European settlers arrived in the area in the early 19th century, and the area was eventually incorporated into Santa Rosa County in 1842.
The community of Tiger Point was established in the late 19th century, and was named after a nearby creek. The creek was named after a large tiger that was said to have been seen in the area. The community grew slowly over the years, and by the early 20th century, it had become a popular destination for fishing and boating.
Geography
Tiger Point is located in the western part of Santa Rosa County, Florida. It is situated on the northern shore of East Bay, a part of the larger Pensacola Bay. The community is bordered by the city of Gulf Breeze to the east and the city of Pensacola to the west.
The terrain of Tiger Point is mostly flat, with some areas of low hills. The climate is humid subtropical, with hot, humid summers and mild winters. The average annual temperature is around 70 degrees Fahrenheit.
Economy
Tiger Point is home to a variety of businesses, including a golf course, a marina, and a variety of restaurants and shops. The community is also home to a number of small businesses, including a grocery store, a hardware store, and a gas station.
The economy of Tiger Point is largely driven by tourism. The community is a popular destination for fishing and boating, and it is also home to a number of popular restaurants and shops.
Demographics
As of the 2010 census, the population of Tiger Point was 2,845. The racial makeup of the community was 94.3% White, 2.2% African American, 0.7% Native American, 0.7% Asian, 0.2% Pacific Islander, and 1.9% from other races. The median household income was $45,938, and the median family income was $51,938.
Tiger Point is served by the Santa Rosa County School District. The community is home to one elementary school, one middle school, and one high school. The community is also home to a number of private schools, including a Catholic school and a Montessori school.
Common Questions
What is Per Capita Income in Tiger Point?
Per Capita income in Tiger Point is $53,684.
What is the Median Family Income in Tiger Point?
Median Family Income in Tiger Point is $121,667.
What is the Median Household income in Tiger Point?
Median Household Income in Tiger Point is $116,711.
What is Income or Wage Gap in Tiger Point?
Income or Wage Gap in Tiger Point is 36.2%.
Women in Tiger Point earn 63.8 cents for every dollar earned by a man.
What is Inequality or Gini Index in Tiger Point?
Inequality or Gini Index in Tiger Point is 0.33.
What is the Total Population of Tiger Point?
Total Population of Tiger Point is 3,511.
What is the Total Male Population of Tiger Point?
Total Male Population of Tiger Point is 1,721.
What is the Total Female Population of Tiger Point?
Total Female Population of Tiger Point is 1,790.
What is the Ratio of Males per 100 Females in Tiger Point?
There are 96.15 Males per 100 Females in Tiger Point.
What is the Ratio of Females per 100 Males in Tiger Point?
There are 104.01 Females per 100 Males in Tiger Point.
What is the Median Population Age in Tiger Point?
Median Population Age in Tiger Point is 44.7 Years.
What is the Average Family Size in Tiger Point
Average Family Size in Tiger Point is 3.0 People.
What is the Average Household Size in Tiger Point
Average Household Size in Tiger Point is 2.6 People.
How Large is the Labor Force in Tiger Point?
There are 1,553 People in the Labor Forcein in Tiger Point.
What is the Percentage of People in the Labor Force in Tiger Point?
52.8% of People are in the Labor Force in Tiger Point.
What is the Unemployment Rate in Tiger Point?
Unemployment Rate in Tiger Point is 3.5%.