Stuart, FL Map & Demographics
Stuart Map
Stuart Overview
$41,029
PER CAPITA INCOME
$84,080
AVG FAMILY INCOME
$61,878
AVG HOUSEHOLD INCOME
34.9%
WAGE / INCOME GAP [ % ]
65.1¢/ $1
WAGE / INCOME GAP [ $ ]
0.49
INEQUALITY / GINI INDEX
17,639
TOTAL POPULATION
8,530
MALE POPULATION
9,109
FEMALE POPULATION
93.64
MALES / 100 FEMALES
106.79
FEMALES / 100 MALES
51.8
MEDIAN AGE
2.8
AVG FAMILY SIZE
2.2
AVG HOUSEHOLD SIZE
8,595
LABOR FORCE [ PEOPLE ]
57.0%
PERCENT IN LABOR FORCE
4.4%
UNEMPLOYMENT RATE
Stuart Area Codes
Income in Stuart
Income Overview in Stuart
Per Capita Income in Stuart is $41,029, while median incomes of families and households are $84,080 and $61,878 respectively.
| Characteristic | Number | Measure |
| Per Capita Income | 17,639 | $41,029 |
| Median Family Income | 4,175 | $84,080 |
| Mean Family Income | 4,175 | $104,882 |
| Median Household Income | 7,852 | $61,878 |
| Mean Household Income | 7,852 | $88,780 |
| Income Deficit | 4,175 | $0 |
| Wage / Income Gap (%) | 17,639 | 34.93% |
| Wage / Income Gap ($) | 17,639 | 65.07¢ per $1 |
| Gini / Inequality Index | 17,639 | 0.49 |
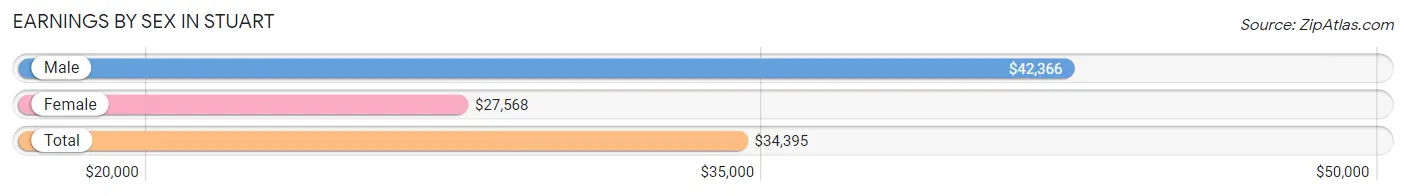
Earnings by Sex in Stuart
Average Earnings in Stuart are $34,395, $42,366 for men and $27,568 for women, a difference of 34.9%.
| Sex | Number | Average Earnings |
| Male | 4,549 (51.2%) | $42,366 |
| Female | 4,340 (48.8%) | $27,568 |
| Total | 8,889 (100.0%) | $34,395 |
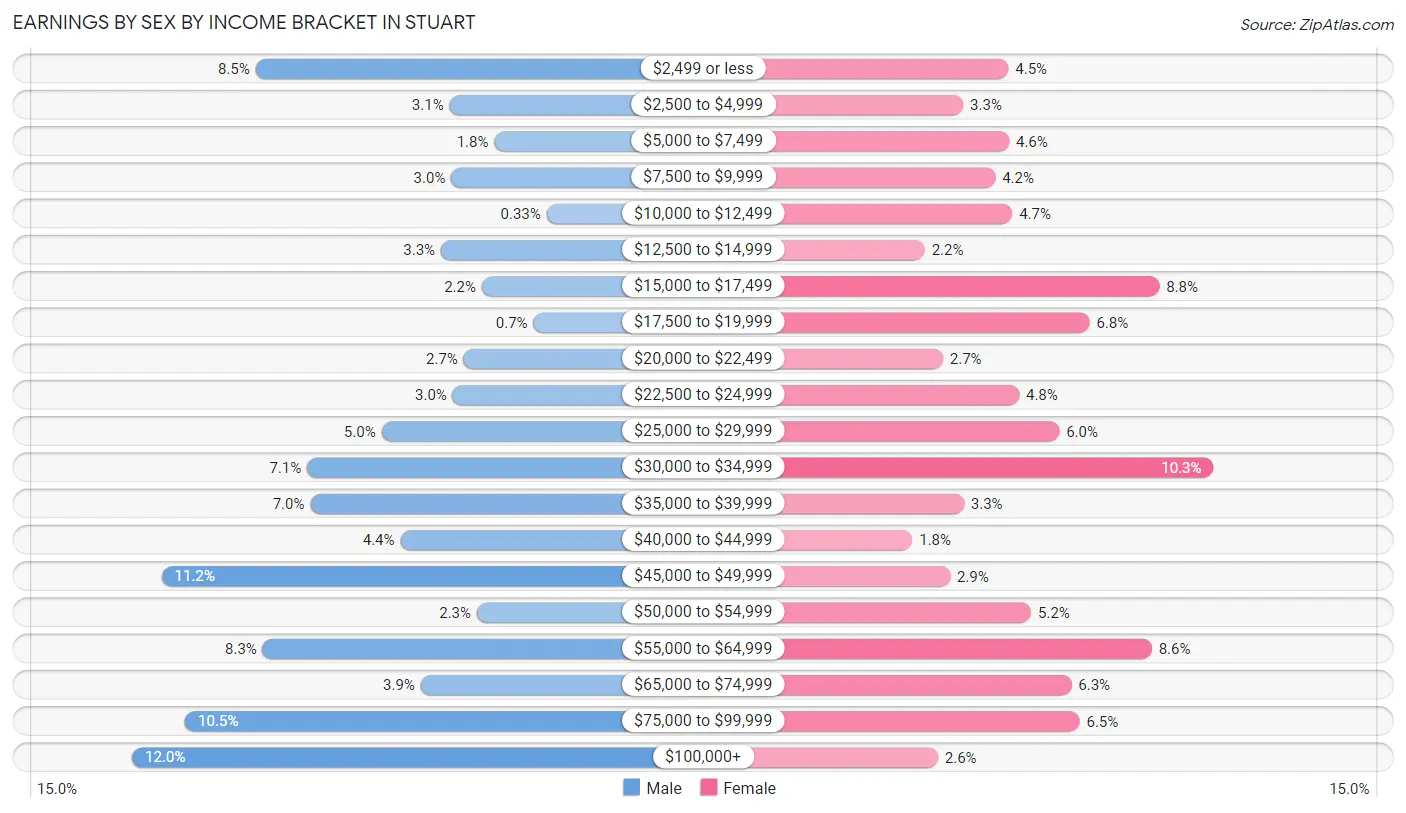
Earnings by Sex by Income Bracket in Stuart
The most common earnings brackets in Stuart are $100,000+ for men (545 | 12.0%) and $30,000 to $34,999 for women (447 | 10.3%).
| Income | Male | Female |
| $2,499 or less | 387 (8.5%) | 197 (4.5%) |
| $2,500 to $4,999 | 139 (3.1%) | 142 (3.3%) |
| $5,000 to $7,499 | 82 (1.8%) | 198 (4.6%) |
| $7,500 to $9,999 | 137 (3.0%) | 181 (4.2%) |
| $10,000 to $12,499 | 15 (0.3%) | 202 (4.6%) |
| $12,500 to $14,999 | 150 (3.3%) | 95 (2.2%) |
| $15,000 to $17,499 | 98 (2.1%) | 381 (8.8%) |
| $17,500 to $19,999 | 32 (0.7%) | 296 (6.8%) |
| $20,000 to $22,499 | 121 (2.7%) | 117 (2.7%) |
| $22,500 to $24,999 | 135 (3.0%) | 210 (4.8%) |
| $25,000 to $29,999 | 226 (5.0%) | 259 (6.0%) |
| $30,000 to $34,999 | 321 (7.1%) | 447 (10.3%) |
| $35,000 to $39,999 | 317 (7.0%) | 143 (3.3%) |
| $40,000 to $44,999 | 202 (4.4%) | 80 (1.8%) |
| $45,000 to $49,999 | 507 (11.2%) | 126 (2.9%) |
| $50,000 to $54,999 | 104 (2.3%) | 225 (5.2%) |
| $55,000 to $64,999 | 378 (8.3%) | 372 (8.6%) |
| $65,000 to $74,999 | 176 (3.9%) | 274 (6.3%) |
| $75,000 to $99,999 | 477 (10.5%) | 284 (6.5%) |
| $100,000+ | 545 (12.0%) | 111 (2.6%) |
| Total | 4,549 (100.0%) | 4,340 (100.0%) |
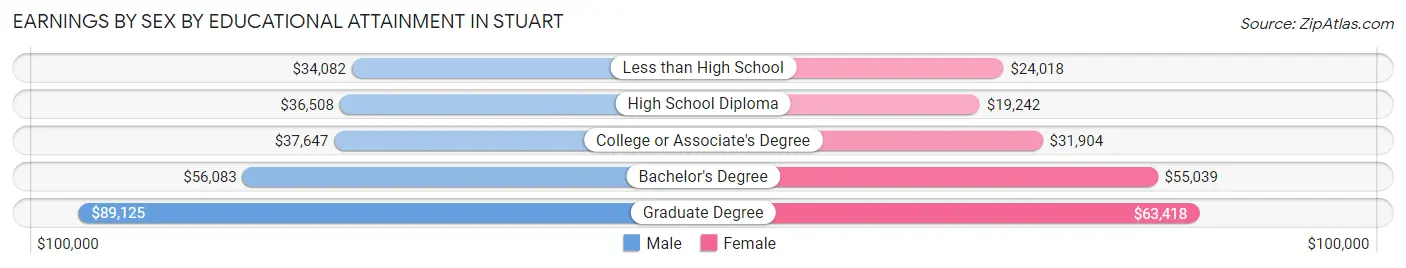
Earnings by Sex by Educational Attainment in Stuart
Average earnings in Stuart are $45,471 for men and $30,759 for women, a difference of 32.4%. Men with an educational attainment of graduate degree enjoy the highest average annual earnings of $89,125, while those with less than high school education earn the least with $34,082. Women with an educational attainment of graduate degree earn the most with the average annual earnings of $63,418, while those with high school diploma education have the smallest earnings of $19,242.
| Educational Attainment | Male Income | Female Income |
| Less than High School | $34,082 | $24,018 |
| High School Diploma | $36,508 | $19,242 |
| College or Associate's Degree | $37,647 | $31,904 |
| Bachelor's Degree | $56,083 | $55,039 |
| Graduate Degree | $89,125 | $63,418 |
| Total | $45,471 | $30,759 |
Family Income in Stuart
Family Income Brackets in Stuart
According to the Stuart family income data, there are 973 families falling into the $100,000 to $149,999 income range, which is the most common income bracket and makes up 23.3% of all families. Conversely, the $10,000 to $14,999 income bracket is the least frequent group with only 50 families (1.2%) belonging to this category.
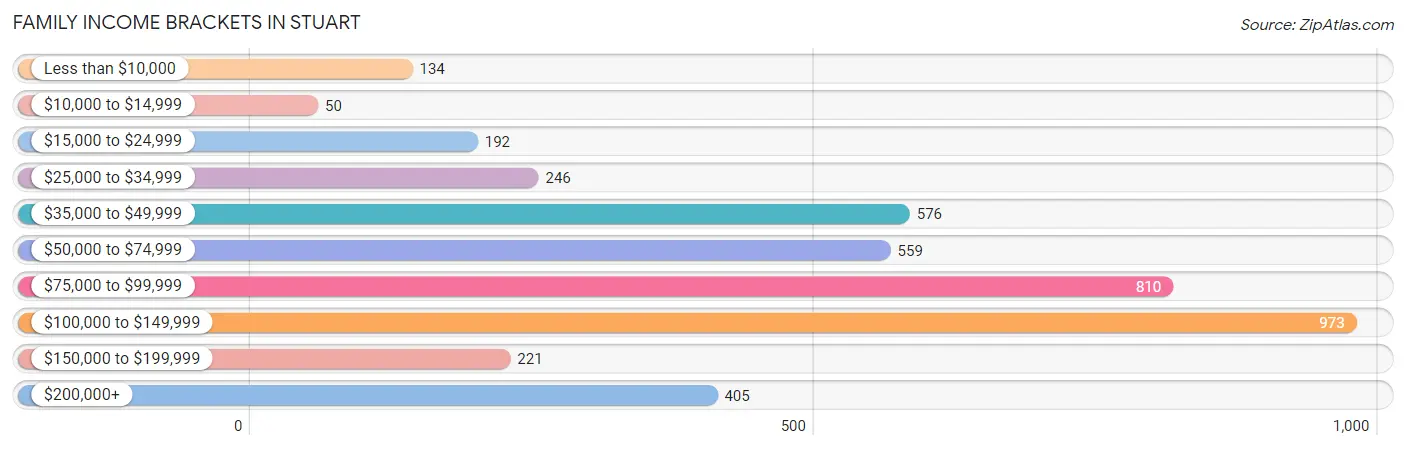
| Income Bracket | # Families | % Families |
| Less than $10,000 | 134 | 3.2% |
| $10,000 to $14,999 | 50 | 1.2% |
| $15,000 to $24,999 | 192 | 4.6% |
| $25,000 to $34,999 | 246 | 5.9% |
| $35,000 to $49,999 | 576 | 13.8% |
| $50,000 to $74,999 | 559 | 13.4% |
| $75,000 to $99,999 | 810 | 19.4% |
| $100,000 to $149,999 | 973 | 23.3% |
| $150,000 to $199,999 | 221 | 5.3% |
| $200,000+ | 405 | 9.7% |
Family Income by Famaliy Size in Stuart
6-person families (27 | 0.6%) account for the highest median family income in Stuart with $101,688 per family, while 2-person families (2,757 | 66.0%) have the highest median income of $43,588 per family member.
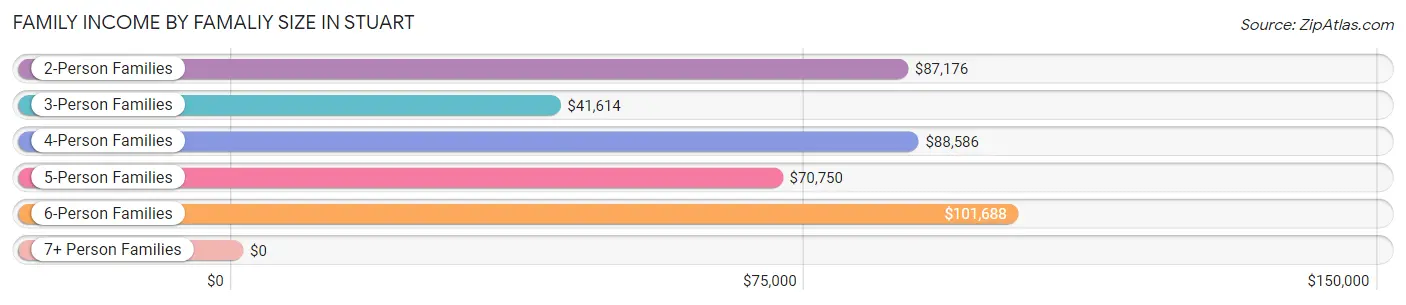
| Income Bracket | # Families | Median Income |
| 2-Person Families | 2,757 (66.0%) | $87,176 |
| 3-Person Families | 616 (14.7%) | $41,614 |
| 4-Person Families | 529 (12.7%) | $88,586 |
| 5-Person Families | 171 (4.1%) | $70,750 |
| 6-Person Families | 27 (0.6%) | $101,688 |
| 7+ Person Families | 75 (1.8%) | $0 |
| Total | 4,175 (100.0%) | $84,080 |
Family Income by Number of Earners in Stuart
The median family income in Stuart is $84,080, with families comprising 3+ earners (230) having the highest median family income of $101,500, while families with 1 earner (1,078) have the lowest median family income of $48,071, accounting for 5.5% and 25.8% of families, respectively.
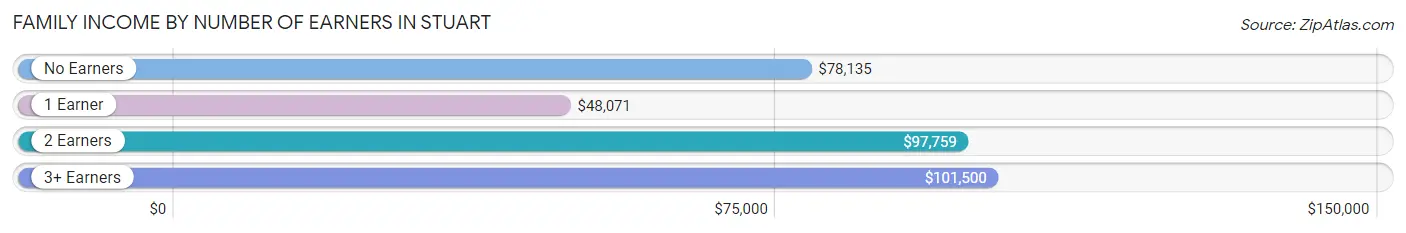
| Number of Earners | # Families | Median Income |
| No Earners | 1,021 (24.5%) | $78,135 |
| 1 Earner | 1,078 (25.8%) | $48,071 |
| 2 Earners | 1,846 (44.2%) | $97,759 |
| 3+ Earners | 230 (5.5%) | $101,500 |
| Total | 4,175 (100.0%) | $84,080 |
Household Income in Stuart
Household Income Brackets in Stuart
With 1,460 households falling in the category, the $75,000 to $99,999 income range is the most frequent in Stuart, accounting for 18.6% of all households. In contrast, only 306 households (3.9%) fall into the $10,000 to $14,999 income bracket, making it the least populous group.
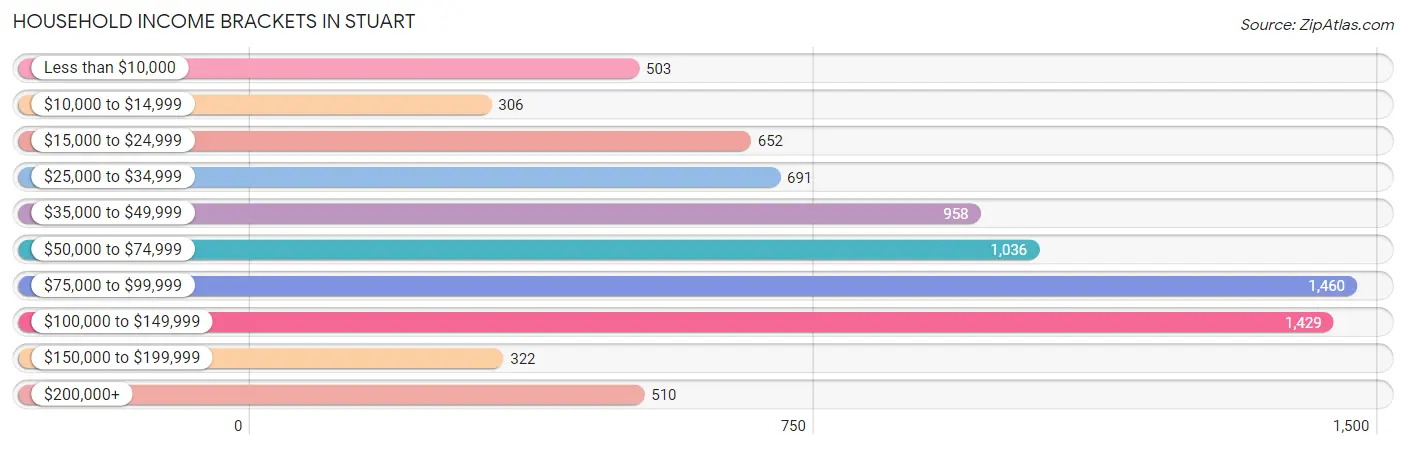
| Income Bracket | # Households | % Households |
| Less than $10,000 | 503 | 6.4% |
| $10,000 to $14,999 | 306 | 3.9% |
| $15,000 to $24,999 | 652 | 8.3% |
| $25,000 to $34,999 | 691 | 8.8% |
| $35,000 to $49,999 | 958 | 12.2% |
| $50,000 to $74,999 | 1,036 | 13.2% |
| $75,000 to $99,999 | 1,460 | 18.6% |
| $100,000 to $149,999 | 1,429 | 18.2% |
| $150,000 to $199,999 | 322 | 4.1% |
| $200,000+ | 510 | 6.5% |
Household Income by Householder Age in Stuart
The median household income in Stuart is $61,878, with the highest median household income of $80,816 found in the 45 to 64 years age bracket for the primary householder. A total of 3,098 households (39.5%) fall into this category. Meanwhile, the 15 to 24 years age bracket for the primary householder has the lowest median household income of $37,241, with 216 households (2.8%) in this group.
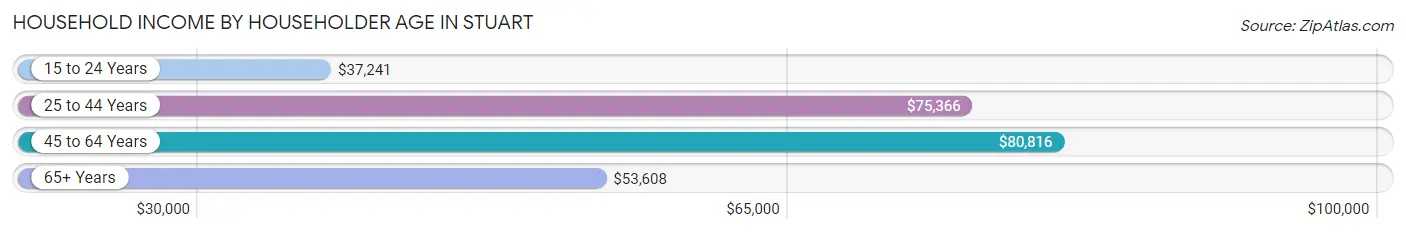
| Income Bracket | # Households | Median Income |
| 15 to 24 Years | 216 (2.8%) | $37,241 |
| 25 to 44 Years | 1,302 (16.6%) | $75,366 |
| 45 to 64 Years | 3,098 (39.5%) | $80,816 |
| 65+ Years | 3,236 (41.2%) | $53,608 |
| Total | 7,852 (100.0%) | $61,878 |
Poverty in Stuart
Income Below Poverty by Sex and Age in Stuart
With 14.2% poverty level for males and 13.7% for females among the residents of Stuart, 12 to 14 year old males and 15 year old females are the most vulnerable to poverty, with 105 males (70.0%) and 194 females (81.9%) in their respective age groups living below the poverty level.
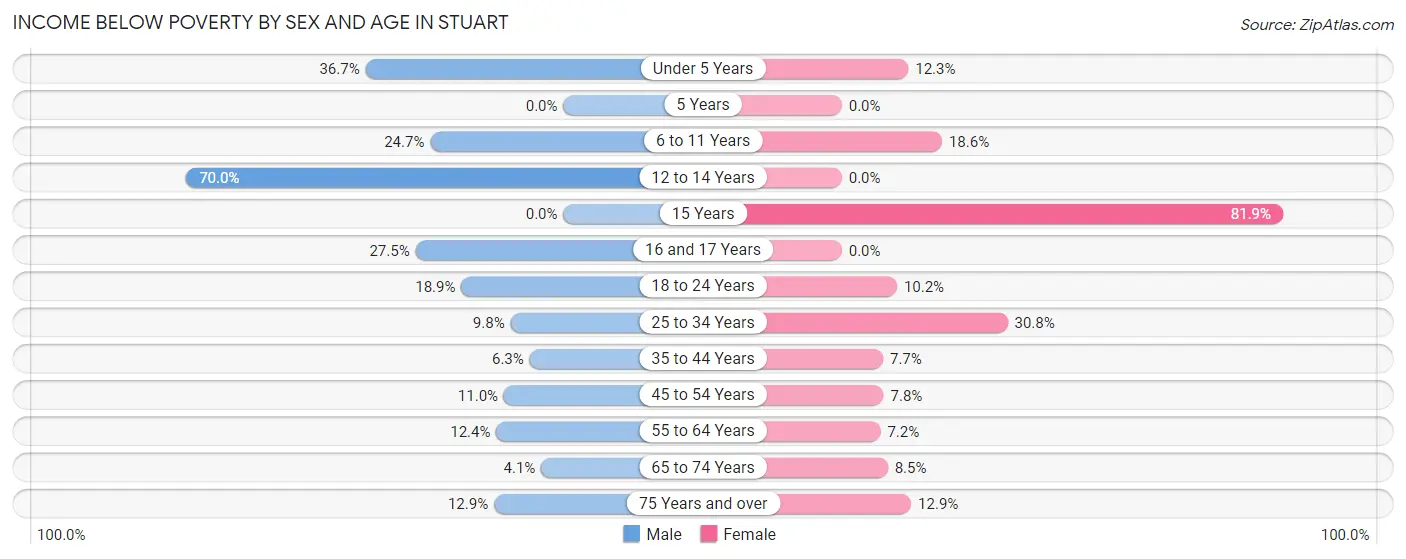
| Age Bracket | Male | Female |
| Under 5 Years | 209 (36.7%) | 49 (12.3%) |
| 5 Years | 0 (0.0%) | 0 (0.0%) |
| 6 to 11 Years | 105 (24.7%) | 98 (18.6%) |
| 12 to 14 Years | 105 (70.0%) | 0 (0.0%) |
| 15 Years | 0 (0.0%) | 194 (81.9%) |
| 16 and 17 Years | 42 (27.5%) | 0 (0.0%) |
| 18 to 24 Years | 86 (18.9%) | 51 (10.2%) |
| 25 to 34 Years | 120 (9.8%) | 264 (30.8%) |
| 35 to 44 Years | 53 (6.3%) | 58 (7.6%) |
| 45 to 54 Years | 91 (11.0%) | 107 (7.8%) |
| 55 to 64 Years | 198 (12.4%) | 101 (7.2%) |
| 65 to 74 Years | 44 (4.1%) | 101 (8.5%) |
| 75 Years and over | 129 (12.9%) | 178 (12.9%) |
| Total | 1,182 (14.2%) | 1,201 (13.7%) |
Income Above Poverty by Sex and Age in Stuart
According to the poverty statistics in Stuart, males aged 5 years and females aged 5 years are the age groups that are most secure financially, with 100.0% of males and 100.0% of females in these age groups living above the poverty line.
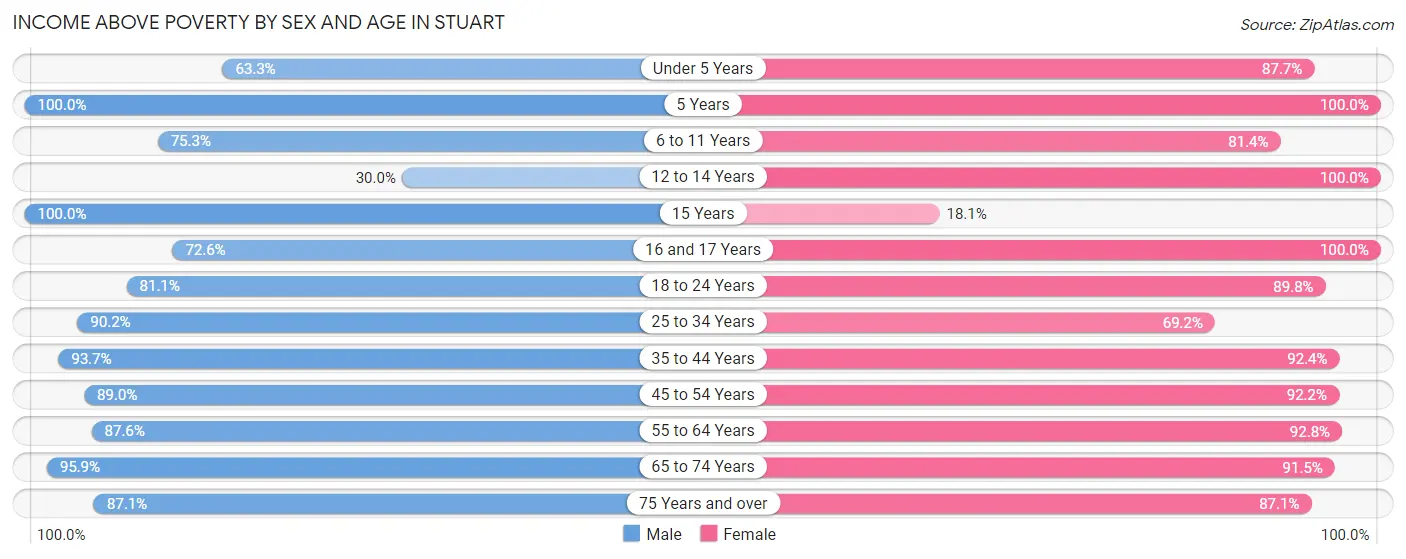
| Age Bracket | Male | Female |
| Under 5 Years | 360 (63.3%) | 348 (87.7%) |
| 5 Years | 14 (100.0%) | 95 (100.0%) |
| 6 to 11 Years | 320 (75.3%) | 429 (81.4%) |
| 12 to 14 Years | 45 (30.0%) | 1 (100.0%) |
| 15 Years | 17 (100.0%) | 43 (18.1%) |
| 16 and 17 Years | 111 (72.6%) | 50 (100.0%) |
| 18 to 24 Years | 368 (81.1%) | 447 (89.8%) |
| 25 to 34 Years | 1,103 (90.2%) | 594 (69.2%) |
| 35 to 44 Years | 794 (93.7%) | 700 (92.3%) |
| 45 to 54 Years | 734 (89.0%) | 1,272 (92.2%) |
| 55 to 64 Years | 1,394 (87.6%) | 1,306 (92.8%) |
| 65 to 74 Years | 1,023 (95.9%) | 1,084 (91.5%) |
| 75 Years and over | 873 (87.1%) | 1,205 (87.1%) |
| Total | 7,156 (85.8%) | 7,574 (86.3%) |
Income Below Poverty Among Married-Couple Families in Stuart
The poverty statistics for married-couple families in Stuart show that 1.1% or 35 of the total 3,040 families live below the poverty line. Families with no children have the highest poverty rate of 1.5%, comprising of 35 families. On the other hand, families with 1 or 2 children have the lowest poverty rate of 0.0%, which includes 0 families.
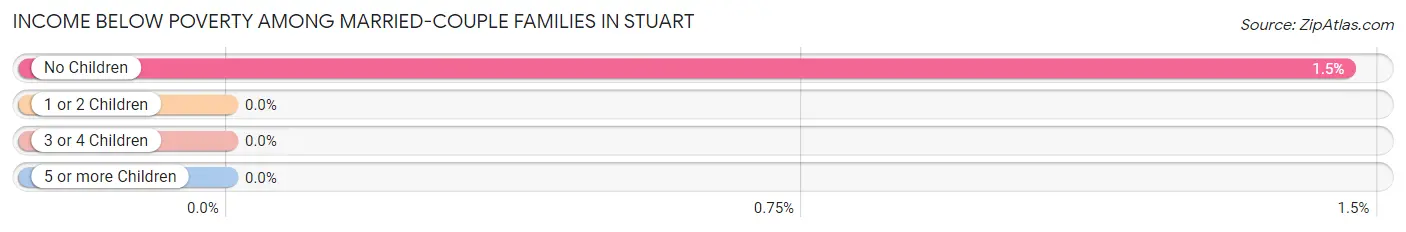
| Children | Above Poverty | Below Poverty |
| No Children | 2,365 (98.5%) | 35 (1.5%) |
| 1 or 2 Children | 516 (100.0%) | 0 (0.0%) |
| 3 or 4 Children | 124 (100.0%) | 0 (0.0%) |
| 5 or more Children | 0 (0.0%) | 0 (0.0%) |
| Total | 3,005 (98.9%) | 35 (1.1%) |
Income Below Poverty Among Single-Parent Households in Stuart
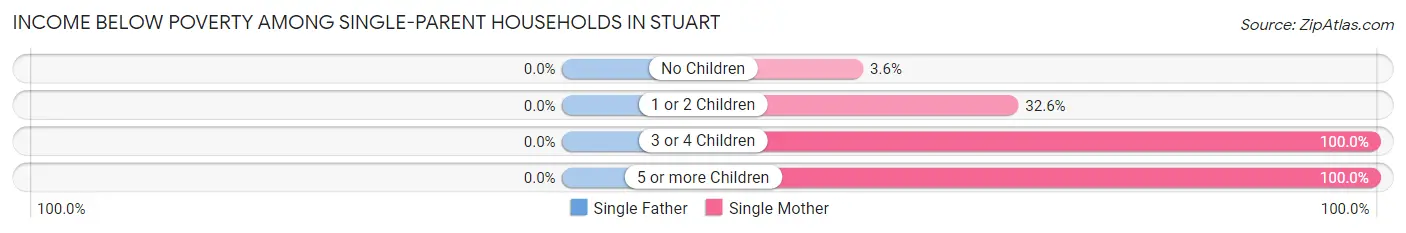
| Children | Single Father | Single Mother |
| No Children | 0 (0.0%) | 14 (3.6%) |
| 1 or 2 Children | 0 (0.0%) | 125 (32.6%) |
| 3 or 4 Children | 0 (0.0%) | 67 (100.0%) |
| 5 or more Children | 0 (0.0%) | 35 (100.0%) |
| Total | 0 (0.0%) | 241 (27.6%) |
Income Below Poverty Among Married-Couple vs Single-Parent Households in Stuart
The poverty data for Stuart shows that 35 of the married-couple family households (1.1%) and 241 of the single-parent households (21.2%) are living below the poverty level. Within the married-couple family households, those with no children have the highest poverty rate, with 35 households (1.5%) falling below the poverty line. Among the single-parent households, those with 3 or 4 children have the highest poverty rate, with 67 household (100.0%) living below poverty.
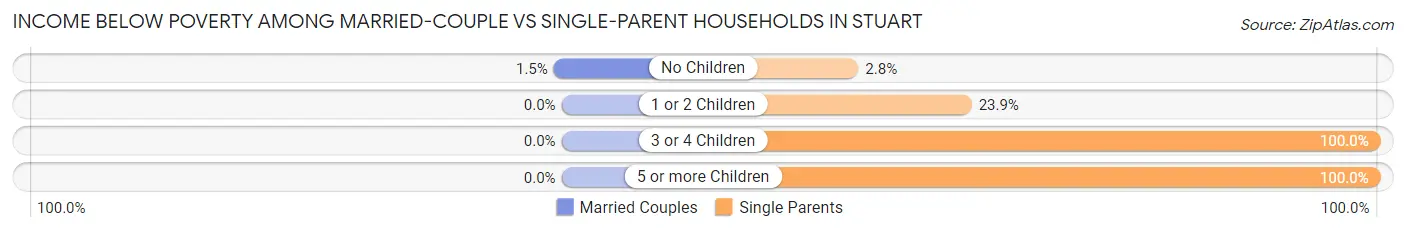
| Children | Married-Couple Families | Single-Parent Households |
| No Children | 35 (1.5%) | 14 (2.8%) |
| 1 or 2 Children | 0 (0.0%) | 125 (23.8%) |
| 3 or 4 Children | 0 (0.0%) | 67 (100.0%) |
| 5 or more Children | 0 (0.0%) | 35 (100.0%) |
| Total | 35 (1.1%) | 241 (21.2%) |
Race in Stuart
The most populous races in Stuart are White / Caucasian (12,727 | 72.2%), Hispanic or Latino (3,030 | 17.2%), and Black / African American (2,549 | 14.4%).
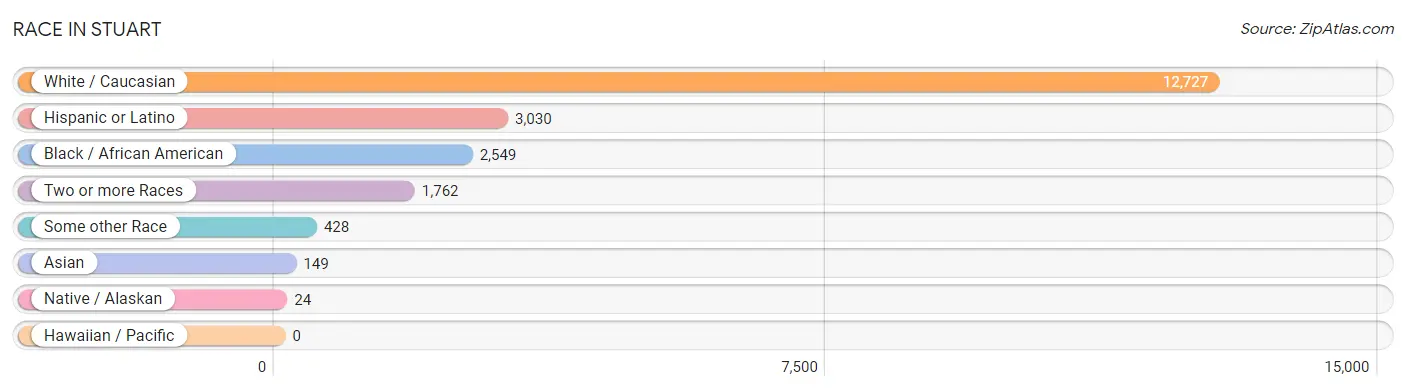
| Race | # Population | % Population |
| Asian | 149 | 0.8% |
| Black / African American | 2,549 | 14.4% |
| Hawaiian / Pacific | 0 | 0.0% |
| Hispanic or Latino | 3,030 | 17.2% |
| Native / Alaskan | 24 | 0.1% |
| White / Caucasian | 12,727 | 72.2% |
| Two or more Races | 1,762 | 10.0% |
| Some other Race | 428 | 2.4% |
| Total | 17,639 | 100.0% |
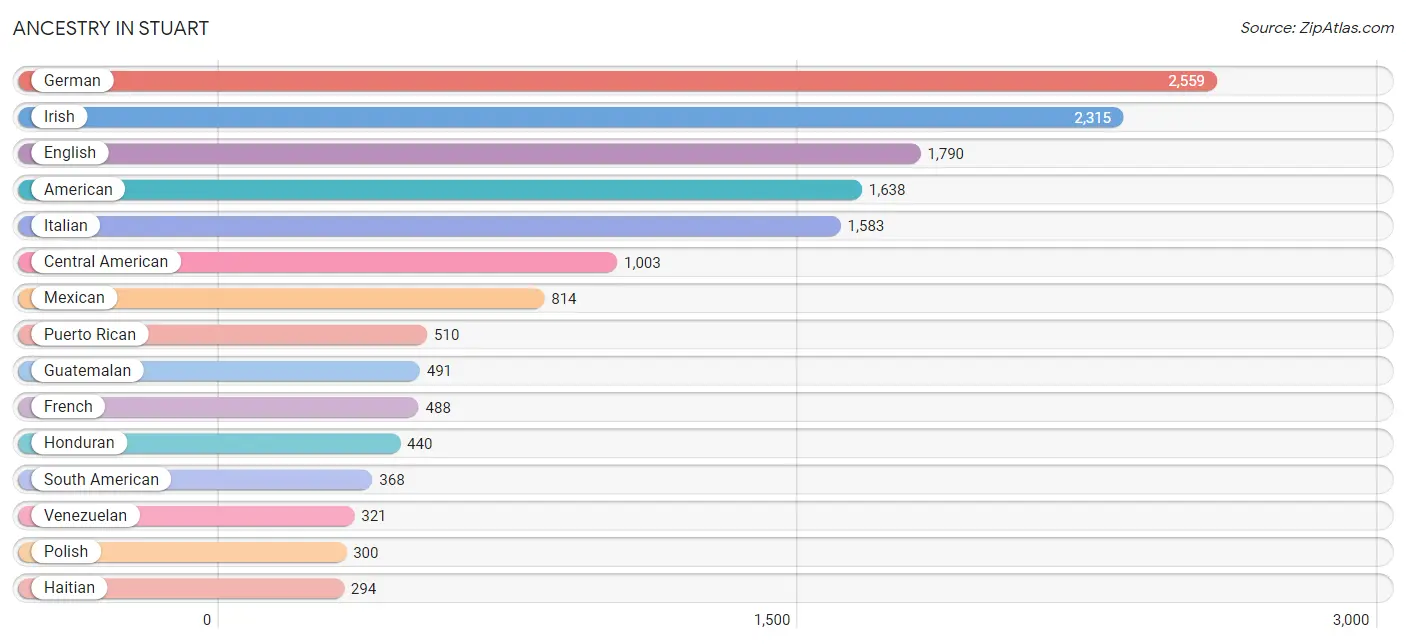
Ancestry in Stuart
The most populous ancestries reported in Stuart are German (2,559 | 14.5%), Irish (2,315 | 13.1%), English (1,790 | 10.2%), American (1,638 | 9.3%), and Italian (1,583 | 9.0%), together accounting for 56.0% of all Stuart residents.
| Ancestry | # Population | % Population |
| African | 6 | 0.0% |
| American | 1,638 | 9.3% |
| Arab | 157 | 0.9% |
| Austrian | 49 | 0.3% |
| Bahamian | 17 | 0.1% |
| Brazilian | 48 | 0.3% |
| British | 127 | 0.7% |
| Burmese | 19 | 0.1% |
| Cajun | 9 | 0.1% |
| Canadian | 10 | 0.1% |
| Central American | 1,003 | 5.7% |
| Cherokee | 63 | 0.4% |
| Colombian | 43 | 0.2% |
| Comanche | 15 | 0.1% |
| Costa Rican | 49 | 0.3% |
| Cuban | 178 | 1.0% |
| Czech | 121 | 0.7% |
| Czechoslovakian | 42 | 0.2% |
| Danish | 35 | 0.2% |
| Dominican | 49 | 0.3% |
| Dutch | 176 | 1.0% |
| Eastern European | 95 | 0.5% |
| Ecuadorian | 4 | 0.0% |
| English | 1,790 | 10.2% |
| European | 205 | 1.2% |
| French | 488 | 2.8% |
| French Canadian | 73 | 0.4% |
| German | 2,559 | 14.5% |
| Greek | 165 | 0.9% |
| Guatemalan | 491 | 2.8% |
| Haitian | 294 | 1.7% |
| Honduran | 440 | 2.5% |
| Hopi | 19 | 0.1% |
| Hungarian | 183 | 1.0% |
| Indian (Asian) | 45 | 0.3% |
| Iranian | 10 | 0.1% |
| Irish | 2,315 | 13.1% |
| Iroquois | 16 | 0.1% |
| Italian | 1,583 | 9.0% |
| Jamaican | 206 | 1.2% |
| Korean | 54 | 0.3% |
| Lebanese | 155 | 0.9% |
| Lithuanian | 137 | 0.8% |
| Mexican | 814 | 4.6% |
| Norwegian | 203 | 1.1% |
| Polish | 300 | 1.7% |
| Portuguese | 26 | 0.2% |
| Puerto Rican | 510 | 2.9% |
| Romanian | 14 | 0.1% |
| Russian | 218 | 1.2% |
| Salvadoran | 23 | 0.1% |
| Scandinavian | 29 | 0.2% |
| Scotch-Irish | 90 | 0.5% |
| Scottish | 200 | 1.1% |
| Seminole | 17 | 0.1% |
| Slovak | 49 | 0.3% |
| Slovene | 10 | 0.1% |
| South American | 368 | 2.1% |
| Spanish | 93 | 0.5% |
| Subsaharan African | 6 | 0.0% |
| Swedish | 141 | 0.8% |
| Swiss | 72 | 0.4% |
| Thai | 117 | 0.7% |
| Trinidadian and Tobagonian | 14 | 0.1% |
| Ukrainian | 59 | 0.3% |
| Venezuelan | 321 | 1.8% |
| Welsh | 119 | 0.7% |
| West Indian | 89 | 0.5% |
| Yuman | 19 | 0.1% | View All 69 Rows |
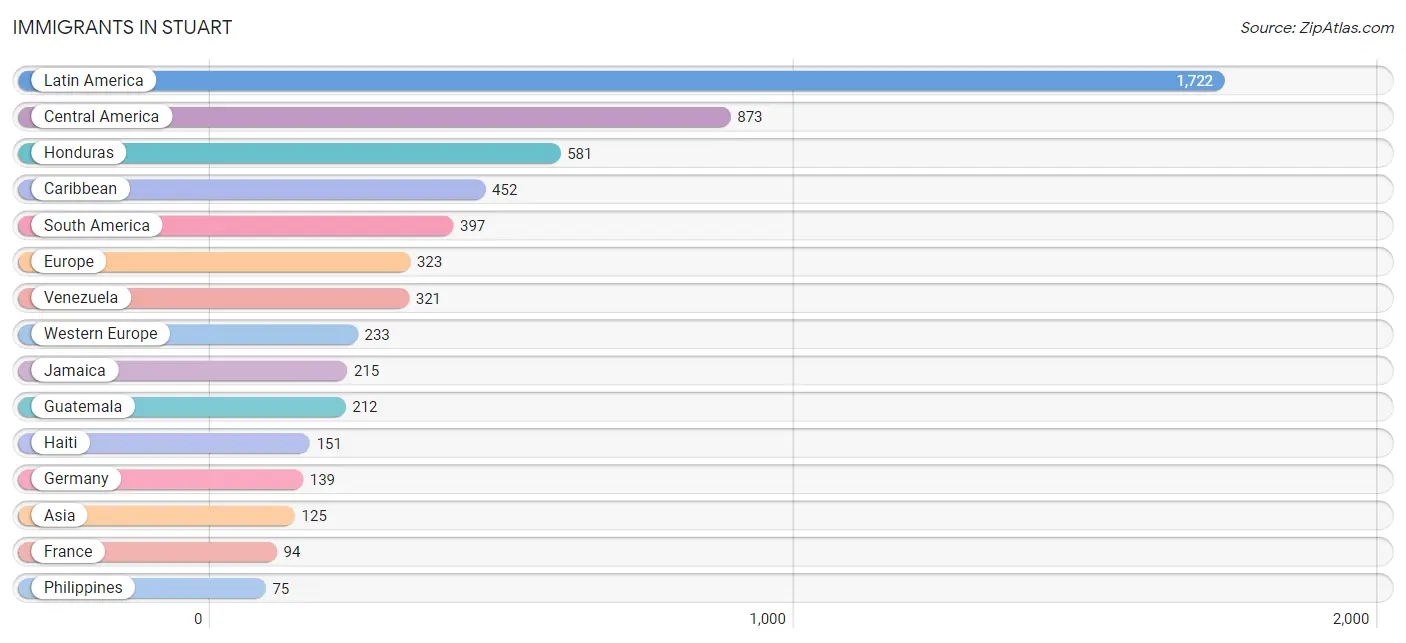
Immigrants in Stuart
The most numerous immigrant groups reported in Stuart came from Latin America (1,722 | 9.8%), Central America (873 | 5.0%), Honduras (581 | 3.3%), Caribbean (452 | 2.6%), and South America (397 | 2.2%), together accounting for 22.8% of all Stuart residents.
| Immigration Origin | # Population | % Population |
| Africa | 38 | 0.2% |
| Asia | 125 | 0.7% |
| Brazil | 48 | 0.3% |
| Canada | 30 | 0.2% |
| Caribbean | 452 | 2.6% |
| Central America | 873 | 5.0% |
| China | 3 | 0.0% |
| Colombia | 17 | 0.1% |
| Costa Rica | 26 | 0.2% |
| Cuba | 72 | 0.4% |
| Czechoslovakia | 6 | 0.0% |
| Eastern Asia | 3 | 0.0% |
| Eastern Europe | 32 | 0.2% |
| El Salvador | 23 | 0.1% |
| England | 20 | 0.1% |
| Europe | 323 | 1.8% |
| France | 94 | 0.5% |
| Germany | 139 | 0.8% |
| Guatemala | 212 | 1.2% |
| Guyana | 4 | 0.0% |
| Haiti | 151 | 0.9% |
| Honduras | 581 | 3.3% |
| India | 37 | 0.2% |
| Iran | 10 | 0.1% |
| Italy | 38 | 0.2% |
| Jamaica | 215 | 1.2% |
| Latin America | 1,722 | 9.8% |
| Mexico | 31 | 0.2% |
| Northern Europe | 20 | 0.1% |
| Peru | 7 | 0.0% |
| Philippines | 75 | 0.4% |
| Poland | 17 | 0.1% |
| Russia | 9 | 0.1% |
| South Africa | 38 | 0.2% |
| South America | 397 | 2.2% |
| South Central Asia | 47 | 0.3% |
| South Eastern Asia | 75 | 0.4% |
| Southern Europe | 38 | 0.2% |
| Taiwan | 3 | 0.0% |
| Trinidad and Tobago | 14 | 0.1% |
| Venezuela | 321 | 1.8% |
| Western Europe | 233 | 1.3% | View All 42 Rows |
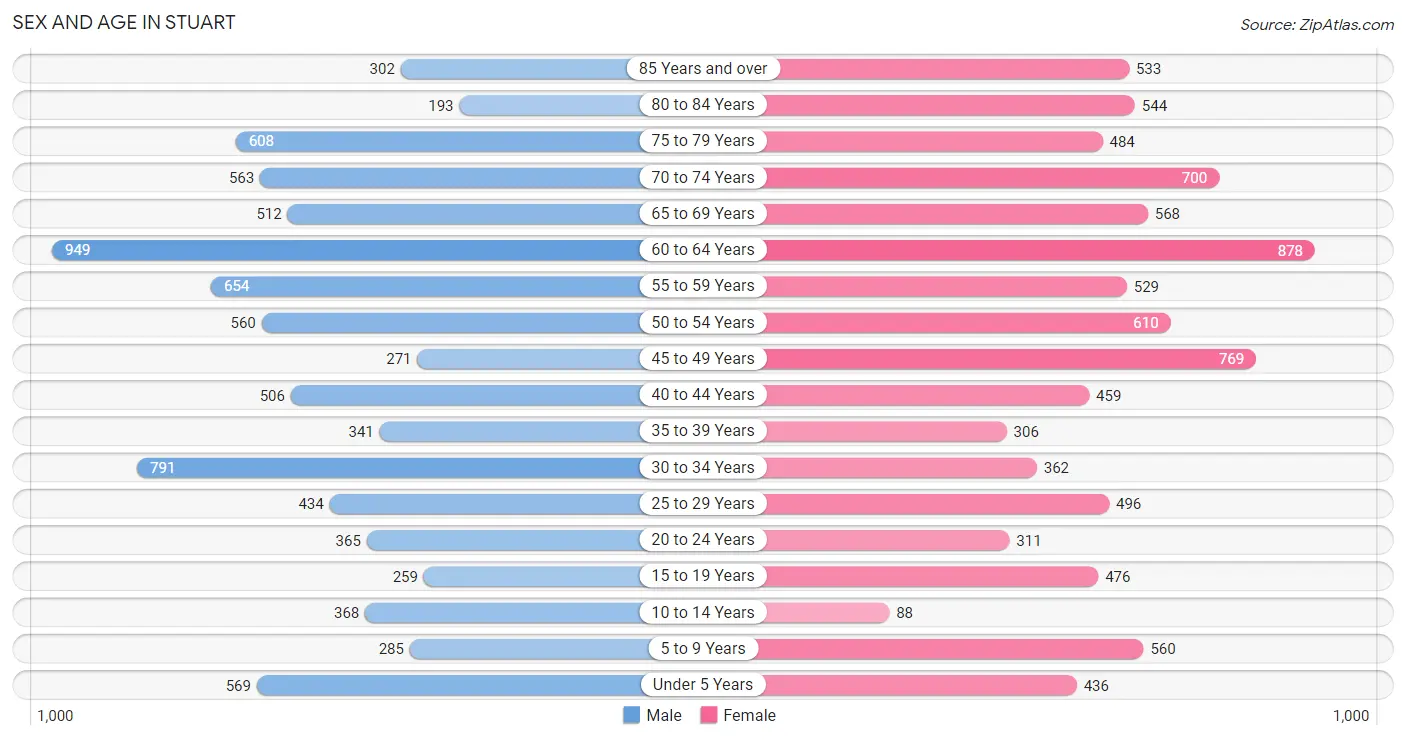
Sex and Age in Stuart
Sex and Age in Stuart
The most populous age groups in Stuart are 60 to 64 Years (949 | 11.1%) for men and 60 to 64 Years (878 | 9.6%) for women.
| Age Bracket | Male | Female |
| Under 5 Years | 569 (6.7%) | 436 (4.8%) |
| 5 to 9 Years | 285 (3.3%) | 560 (6.1%) |
| 10 to 14 Years | 368 (4.3%) | 88 (1.0%) |
| 15 to 19 Years | 259 (3.0%) | 476 (5.2%) |
| 20 to 24 Years | 365 (4.3%) | 311 (3.4%) |
| 25 to 29 Years | 434 (5.1%) | 496 (5.4%) |
| 30 to 34 Years | 791 (9.3%) | 362 (4.0%) |
| 35 to 39 Years | 341 (4.0%) | 306 (3.4%) |
| 40 to 44 Years | 506 (5.9%) | 459 (5.0%) |
| 45 to 49 Years | 271 (3.2%) | 769 (8.4%) |
| 50 to 54 Years | 560 (6.6%) | 610 (6.7%) |
| 55 to 59 Years | 654 (7.7%) | 529 (5.8%) |
| 60 to 64 Years | 949 (11.1%) | 878 (9.6%) |
| 65 to 69 Years | 512 (6.0%) | 568 (6.2%) |
| 70 to 74 Years | 563 (6.6%) | 700 (7.7%) |
| 75 to 79 Years | 608 (7.1%) | 484 (5.3%) |
| 80 to 84 Years | 193 (2.3%) | 544 (6.0%) |
| 85 Years and over | 302 (3.5%) | 533 (5.9%) |
| Total | 8,530 (100.0%) | 9,109 (100.0%) |
Families and Households in Stuart
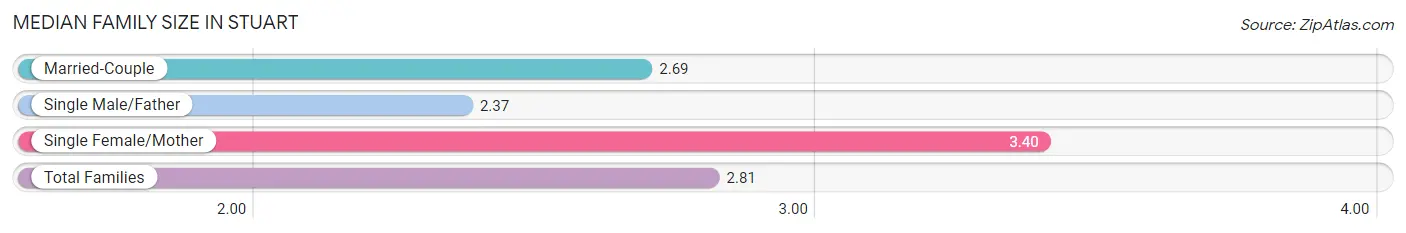
Median Family Size in Stuart
The median family size in Stuart is 2.81 persons per family, with single female/mother families (872 | 20.9%) accounting for the largest median family size of 3.4 persons per family. On the other hand, single male/father families (263 | 6.3%) represent the smallest median family size with 2.37 persons per family.
| Family Type | # Families | Family Size |
| Married-Couple | 3,040 (72.8%) | 2.69 |
| Single Male/Father | 263 (6.3%) | 2.37 |
| Single Female/Mother | 872 (20.9%) | 3.40 |
| Total Families | 4,175 (100.0%) | 2.81 |
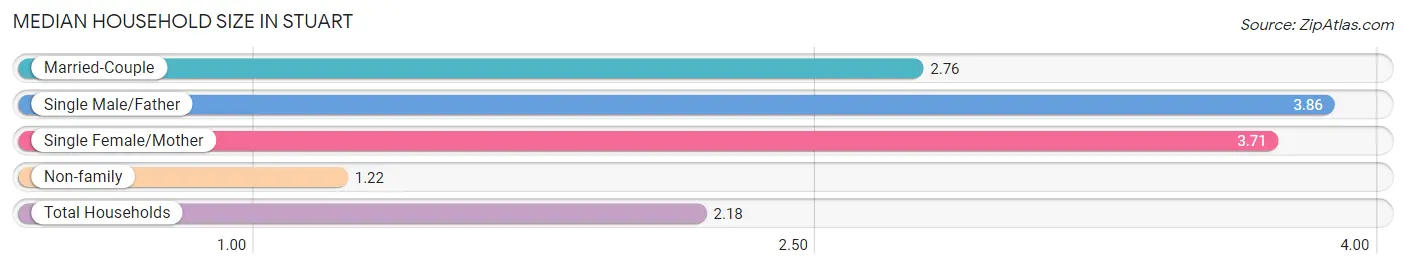
Median Household Size in Stuart
The median household size in Stuart is 2.18 persons per household, with single male/father households (263 | 3.4%) accounting for the largest median household size of 3.86 persons per household. non-family households (3,677 | 46.8%) represent the smallest median household size with 1.22 persons per household.
| Household Type | # Households | Household Size |
| Married-Couple | 3,040 (38.7%) | 2.76 |
| Single Male/Father | 263 (3.4%) | 3.86 |
| Single Female/Mother | 872 (11.1%) | 3.71 |
| Non-family | 3,677 (46.8%) | 1.22 |
| Total Households | 7,852 (100.0%) | 2.18 |
Household Size by Marriage Status in Stuart
Out of a total of 7,852 households in Stuart, 4,175 (53.2%) are family households, while 3,677 (46.8%) are nonfamily households. The most numerous type of family households are 2-person households, comprising 2,442, and the most common type of nonfamily households are 1-person households, comprising 3,147.
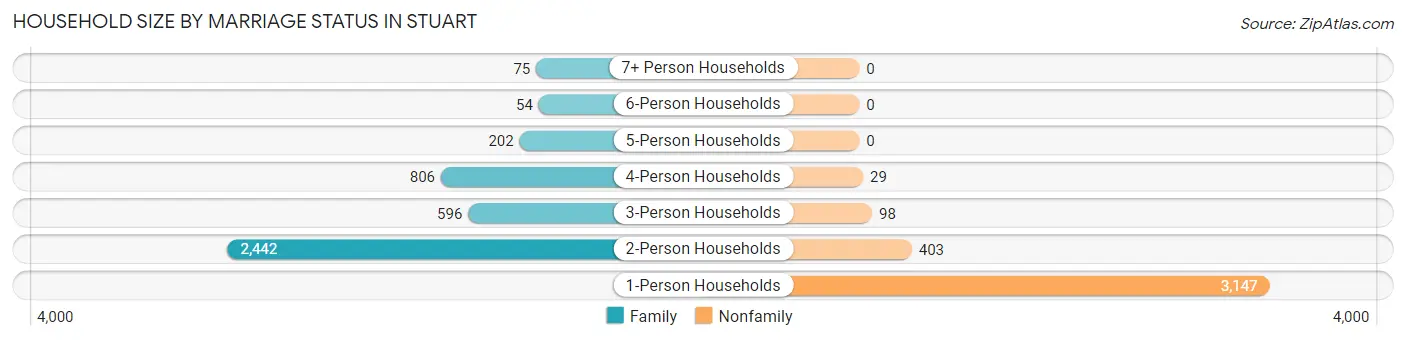
| Household Size | Family Households | Nonfamily Households |
| 1-Person Households | - | 3,147 (40.1%) |
| 2-Person Households | 2,442 (31.1%) | 403 (5.1%) |
| 3-Person Households | 596 (7.6%) | 98 (1.3%) |
| 4-Person Households | 806 (10.3%) | 29 (0.4%) |
| 5-Person Households | 202 (2.6%) | 0 (0.0%) |
| 6-Person Households | 54 (0.7%) | 0 (0.0%) |
| 7+ Person Households | 75 (1.0%) | 0 (0.0%) |
| Total | 4,175 (53.2%) | 3,677 (46.8%) |
Female Fertility in Stuart
Fertility by Age in Stuart
Average fertility rate in Stuart is 34.0 births per 1,000 women. Women in the age bracket of 20 to 34 years have the highest fertility rate with 80.0 births per 1,000 women. Women in the age bracket of 20 to 34 years acount for 87.8% of all women with births.
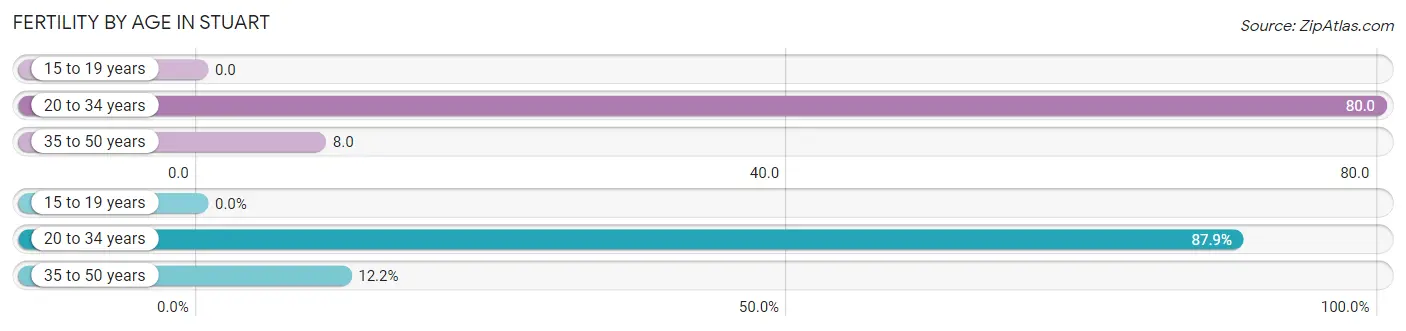
| Age Bracket | Women with Births | Births / 1,000 Women |
| 15 to 19 years | 0 (0.0%) | 0.0 |
| 20 to 34 years | 94 (87.8%) | 80.0 |
| 35 to 50 years | 13 (12.1%) | 8.0 |
| Total | 107 (100.0%) | 34.0 |
Fertility by Age by Marriage Status in Stuart
56.1% of women with births (107) in Stuart are married. The highest percentage of unmarried women with births falls into 35 to 50 years age bracket with 53.8% of them unmarried at the time of birth, while the lowest percentage of unmarried women with births belong to 20 to 34 years age bracket with 42.5% of them unmarried.
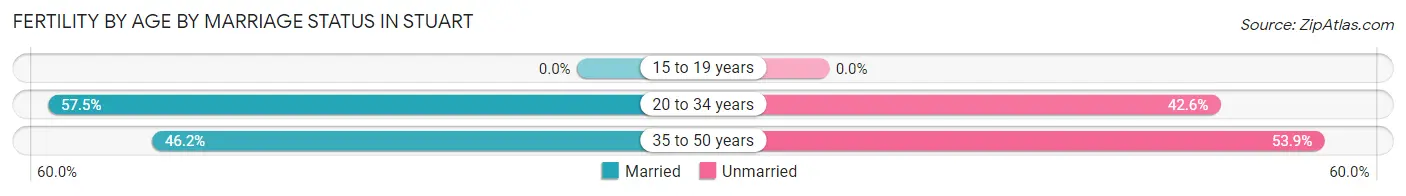
| Age Bracket | Married | Unmarried |
| 15 to 19 years | 0 (0.0%) | 0 (0.0%) |
| 20 to 34 years | 54 (57.5%) | 40 (42.5%) |
| 35 to 50 years | 6 (46.2%) | 7 (53.8%) |
| Total | 60 (56.1%) | 47 (43.9%) |
Fertility by Education in Stuart
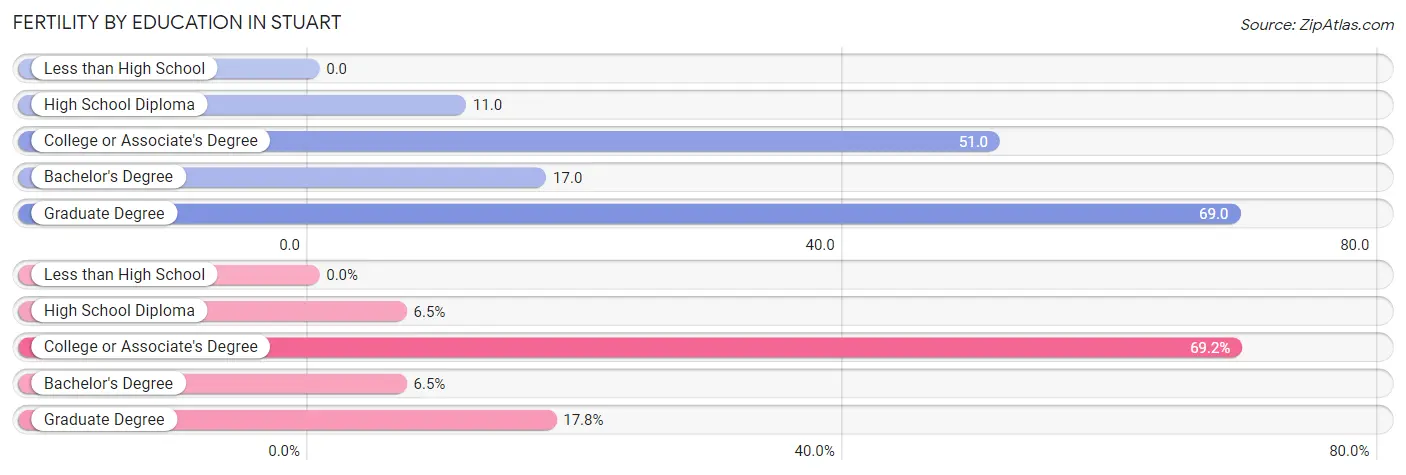
| Educational Attainment | Women with Births | Births / 1,000 Women |
| Less than High School | 0 (0.0%) | 0.0 |
| High School Diploma | 7 (6.5%) | 11.0 |
| College or Associate's Degree | 74 (69.2%) | 51.0 |
| Bachelor's Degree | 7 (6.5%) | 17.0 |
| Graduate Degree | 19 (17.8%) | 69.0 |
| Total | 107 (100.0%) | 34.0 |
Fertility by Education by Marriage Status in Stuart
43.9% of women with births in Stuart are unmarried. Women with the educational attainment of graduate degree are most likely to be married with 100.0% of them married at childbirth, while women with the educational attainment of high school diploma are least likely to be married with 100.0% of them unmarried at childbirth.
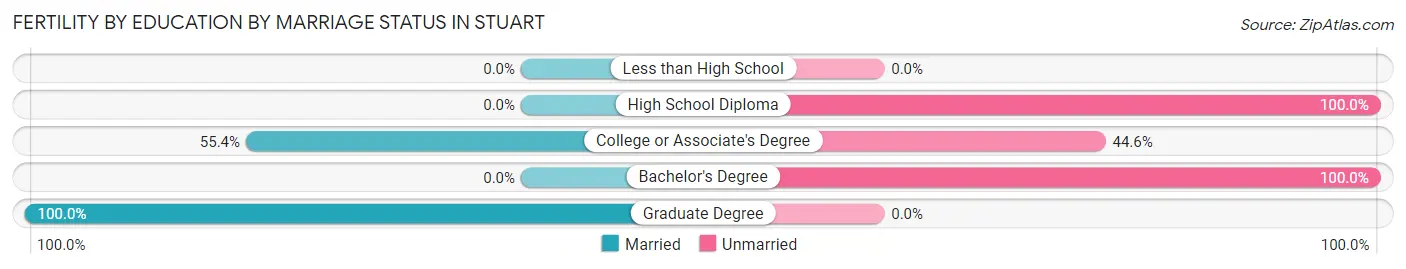
| Educational Attainment | Married | Unmarried |
| Less than High School | 0 (0.0%) | 0 (0.0%) |
| High School Diploma | 0 (0.0%) | 7 (100.0%) |
| College or Associate's Degree | 41 (55.4%) | 33 (44.6%) |
| Bachelor's Degree | 0 (0.0%) | 7 (100.0%) |
| Graduate Degree | 19 (100.0%) | 0 (0.0%) |
| Total | 60 (56.1%) | 47 (43.9%) |
Employment Characteristics in Stuart
Employment by Class of Employer in Stuart
Among the 7,835 employed individuals in Stuart, private company employees (4,989 | 63.7%), self-employed (not incorporated) (857 | 10.9%), and self-employed (incorporated) (643 | 8.2%) make up the most common classes of employment.
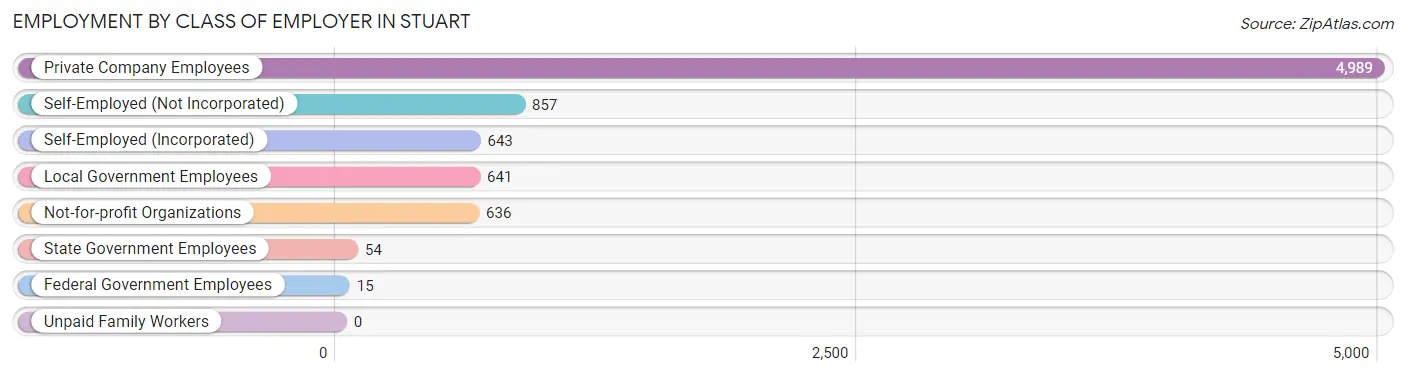
| Employer Class | # Employees | % Employees |
| Private Company Employees | 4,989 | 63.7% |
| Self-Employed (Incorporated) | 643 | 8.2% |
| Self-Employed (Not Incorporated) | 857 | 10.9% |
| Not-for-profit Organizations | 636 | 8.1% |
| Local Government Employees | 641 | 8.2% |
| State Government Employees | 54 | 0.7% |
| Federal Government Employees | 15 | 0.2% |
| Unpaid Family Workers | 0 | 0.0% |
| Total | 7,835 | 100.0% |
Employment Status by Age in Stuart
According to the labor force statistics for Stuart, out of the total population over 16 years of age (15,079), 57.0% or 8,595 individuals are in the labor force, with 4.4% or 378 of them unemployed. The age group with the highest labor force participation rate is 20 to 24 years, with 85.7% or 579 individuals in the labor force. Within the labor force, the 20 to 24 years age range has the highest percentage of unemployed individuals, with 16.4% or 95 of them being unemployed.
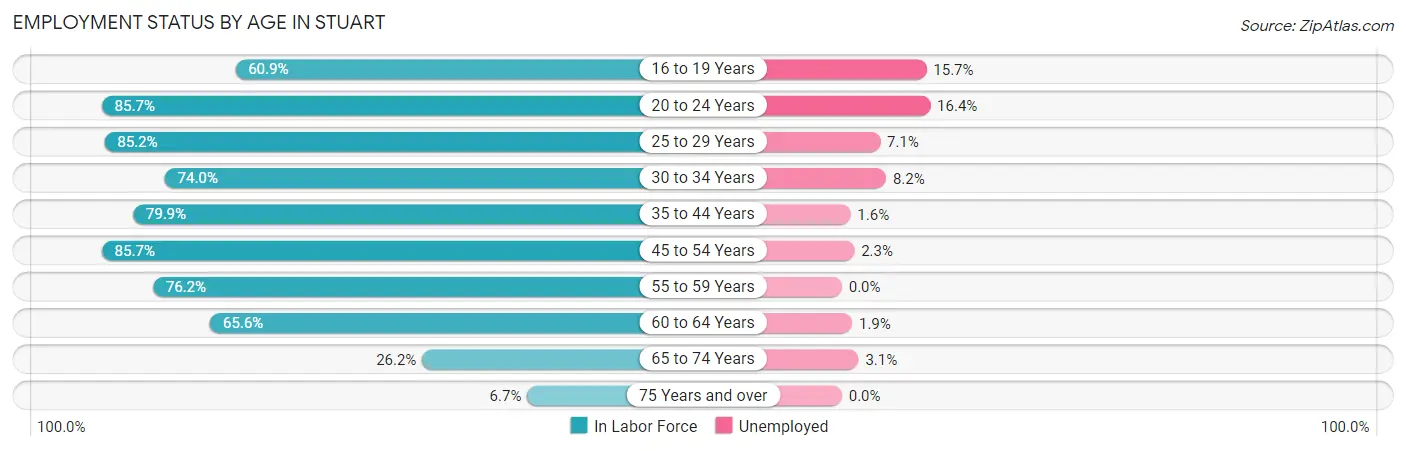
| Age Bracket | In Labor Force | Unemployed |
| 16 to 19 Years | 293 (60.9%) | 46 (15.7%) |
| 20 to 24 Years | 579 (85.7%) | 95 (16.4%) |
| 25 to 29 Years | 792 (85.2%) | 56 (7.1%) |
| 30 to 34 Years | 853 (74.0%) | 70 (8.2%) |
| 35 to 44 Years | 1,288 (79.9%) | 21 (1.6%) |
| 45 to 54 Years | 1,894 (85.7%) | 44 (2.3%) |
| 55 to 59 Years | 901 (76.2%) | 0 (0.0%) |
| 60 to 64 Years | 1,199 (65.6%) | 23 (1.9%) |
| 65 to 74 Years | 614 (26.2%) | 19 (3.1%) |
| 75 Years and over | 178 (6.7%) | 0 (0.0%) |
| Total | 8,595 (57.0%) | 378 (4.4%) |
Employment Status by Educational Attainment in Stuart
According to labor force statistics for Stuart, 77.7% of individuals (6,927) out of the total population between 25 and 64 years of age (8,915) are in the labor force, with 3.1% or 215 of them being unemployed. The group with the highest labor force participation rate are those with the educational attainment of bachelor's degree or higher, with 83.2% or 2,220 individuals in the labor force. Within the labor force, individuals with less than high school education have the highest percentage of unemployment, with 6.8% or 35 of them being unemployed.
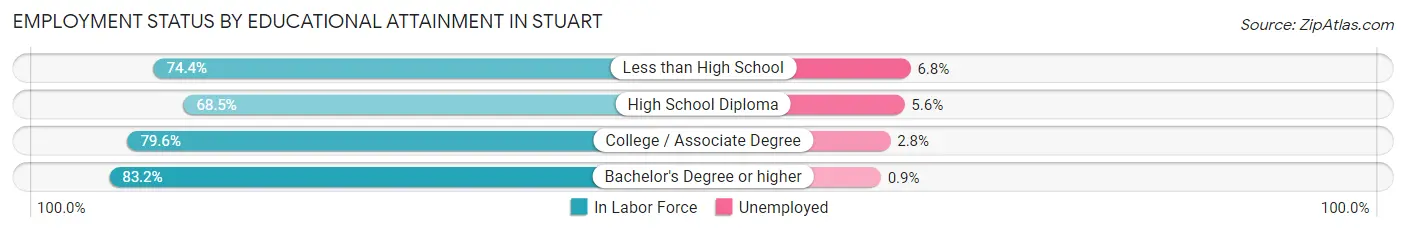
| Educational Attainment | In Labor Force | Unemployed |
| Less than High School | 512 (74.4%) | 47 (6.8%) |
| High School Diploma | 1,403 (68.5%) | 115 (5.6%) |
| College / Associate Degree | 2,795 (79.6%) | 98 (2.8%) |
| Bachelor's Degree or higher | 2,220 (83.2%) | 24 (0.9%) |
| Total | 6,927 (77.7%) | 276 (3.1%) |
Employment Occupations by Sex in Stuart
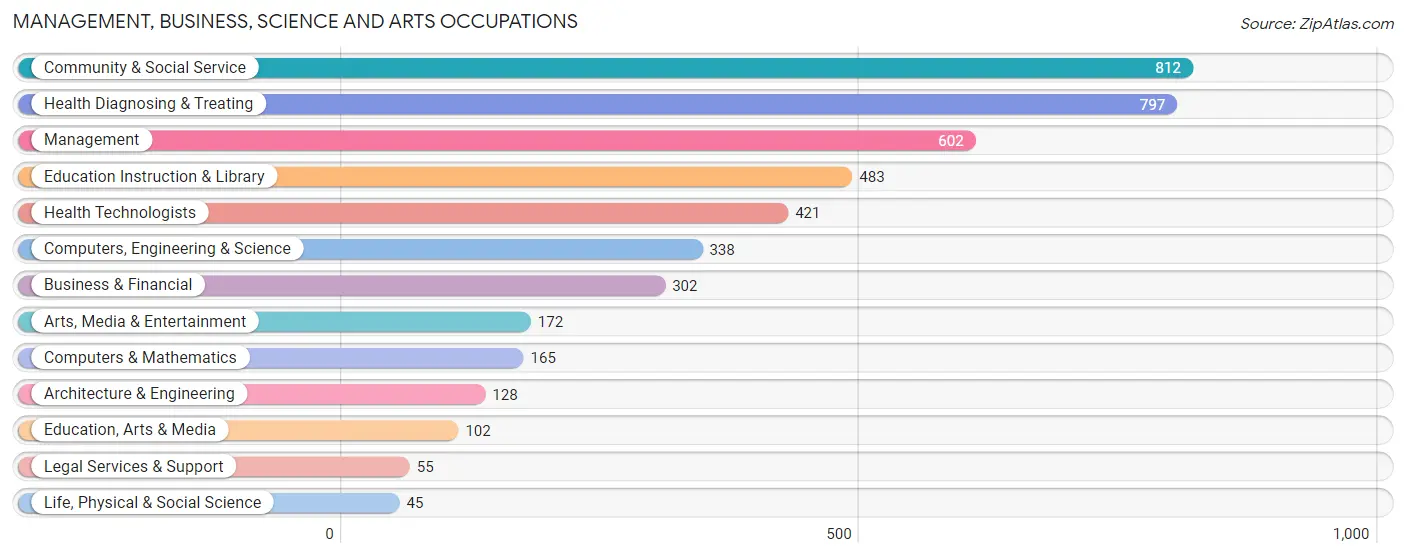
Management, Business, Science and Arts Occupations
The most common Management, Business, Science and Arts occupations in Stuart are Community & Social Service (812 | 9.9%), Health Diagnosing & Treating (797 | 9.7%), Management (602 | 7.3%), Education Instruction & Library (483 | 5.9%), and Health Technologists (421 | 5.1%).
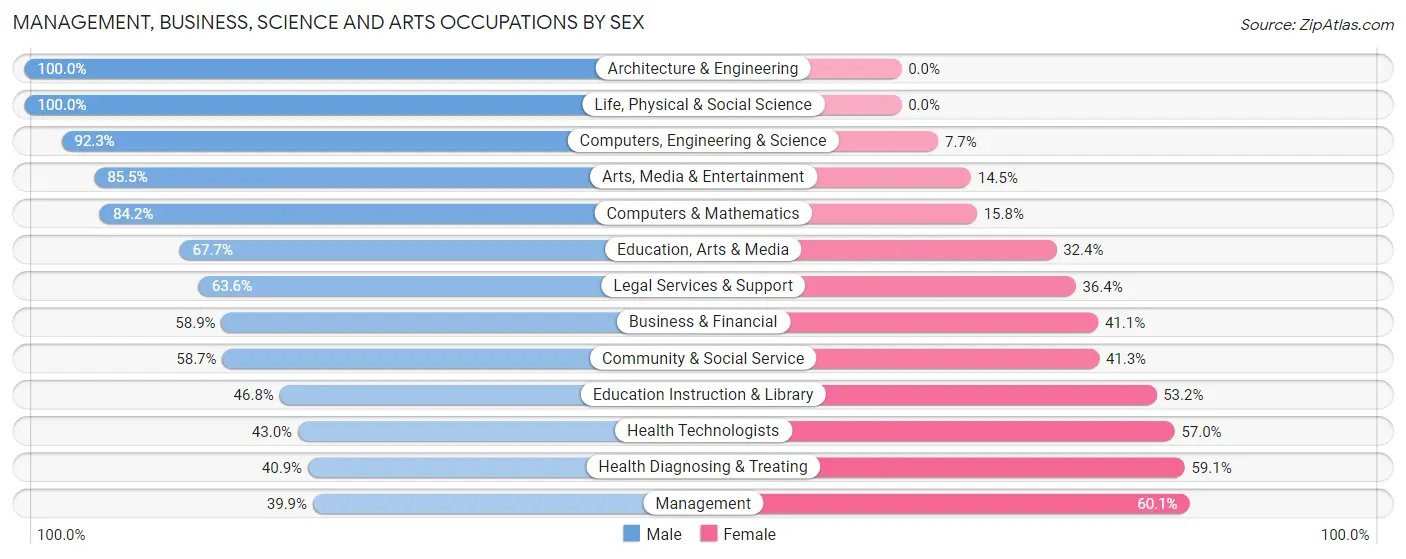
Management, Business, Science and Arts Occupations by Sex
Within the Management, Business, Science and Arts occupations in Stuart, the most male-oriented occupations are Architecture & Engineering (100.0%), Life, Physical & Social Science (100.0%), and Computers, Engineering & Science (92.3%), while the most female-oriented occupations are Management (60.1%), Health Diagnosing & Treating (59.1%), and Health Technologists (57.0%).
| Occupation | Male | Female |
| Management | 240 (39.9%) | 362 (60.1%) |
| Business & Financial | 178 (58.9%) | 124 (41.1%) |
| Computers, Engineering & Science | 312 (92.3%) | 26 (7.7%) |
| Computers & Mathematics | 139 (84.2%) | 26 (15.8%) |
| Architecture & Engineering | 128 (100.0%) | 0 (0.0%) |
| Life, Physical & Social Science | 45 (100.0%) | 0 (0.0%) |
| Community & Social Service | 477 (58.7%) | 335 (41.3%) |
| Education, Arts & Media | 69 (67.6%) | 33 (32.4%) |
| Legal Services & Support | 35 (63.6%) | 20 (36.4%) |
| Education Instruction & Library | 226 (46.8%) | 257 (53.2%) |
| Arts, Media & Entertainment | 147 (85.5%) | 25 (14.5%) |
| Health Diagnosing & Treating | 326 (40.9%) | 471 (59.1%) |
| Health Technologists | 181 (43.0%) | 240 (57.0%) |
| Total (Category) | 1,533 (53.8%) | 1,318 (46.2%) |
| Total (Overall) | 4,230 (51.5%) | 3,989 (48.5%) |
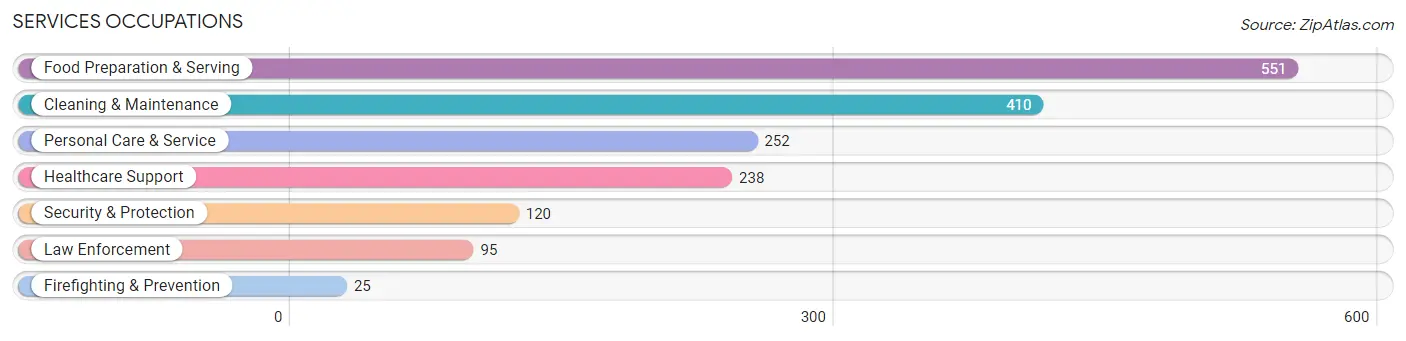
Services Occupations
The most common Services occupations in Stuart are Food Preparation & Serving (551 | 6.7%), Cleaning & Maintenance (410 | 5.0%), Personal Care & Service (252 | 3.1%), Healthcare Support (238 | 2.9%), and Security & Protection (120 | 1.5%).
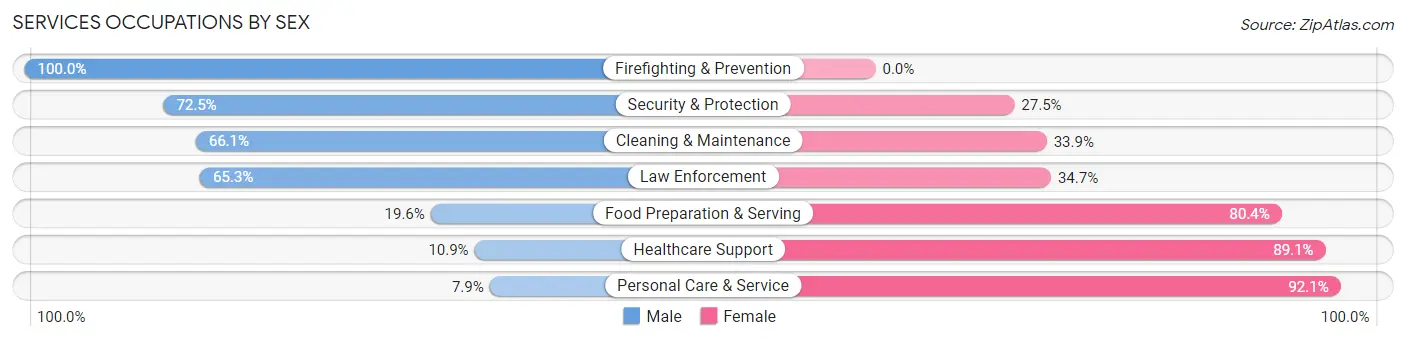
Services Occupations by Sex
Within the Services occupations in Stuart, the most male-oriented occupations are Firefighting & Prevention (100.0%), Security & Protection (72.5%), and Cleaning & Maintenance (66.1%), while the most female-oriented occupations are Personal Care & Service (92.1%), Healthcare Support (89.1%), and Food Preparation & Serving (80.4%).
| Occupation | Male | Female |
| Healthcare Support | 26 (10.9%) | 212 (89.1%) |
| Security & Protection | 87 (72.5%) | 33 (27.5%) |
| Firefighting & Prevention | 25 (100.0%) | 0 (0.0%) |
| Law Enforcement | 62 (65.3%) | 33 (34.7%) |
| Food Preparation & Serving | 108 (19.6%) | 443 (80.4%) |
| Cleaning & Maintenance | 271 (66.1%) | 139 (33.9%) |
| Personal Care & Service | 20 (7.9%) | 232 (92.1%) |
| Total (Category) | 512 (32.6%) | 1,059 (67.4%) |
| Total (Overall) | 4,230 (51.5%) | 3,989 (48.5%) |
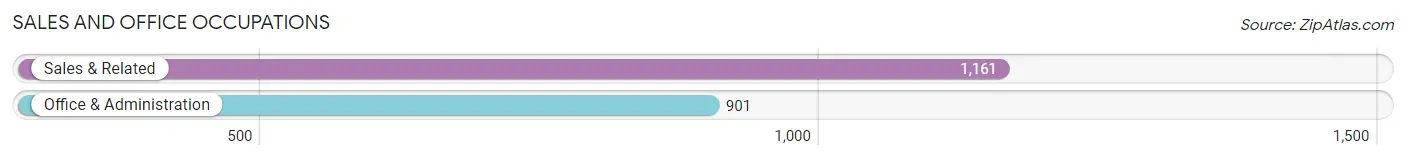
Sales and Office Occupations
The most common Sales and Office occupations in Stuart are Sales & Related (1,161 | 14.1%), and Office & Administration (901 | 11.0%).
Sales and Office Occupations by Sex
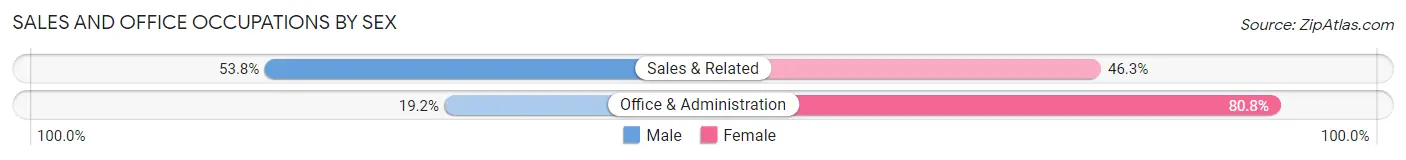
| Occupation | Male | Female |
| Sales & Related | 624 (53.7%) | 537 (46.3%) |
| Office & Administration | 173 (19.2%) | 728 (80.8%) |
| Total (Category) | 797 (38.7%) | 1,265 (61.4%) |
| Total (Overall) | 4,230 (51.5%) | 3,989 (48.5%) |
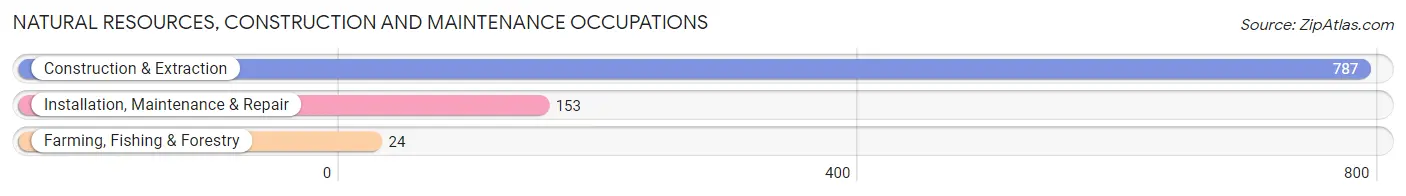
Natural Resources, Construction and Maintenance Occupations
The most common Natural Resources, Construction and Maintenance occupations in Stuart are Construction & Extraction (787 | 9.6%), Installation, Maintenance & Repair (153 | 1.9%), and Farming, Fishing & Forestry (24 | 0.3%).
Natural Resources, Construction and Maintenance Occupations by Sex
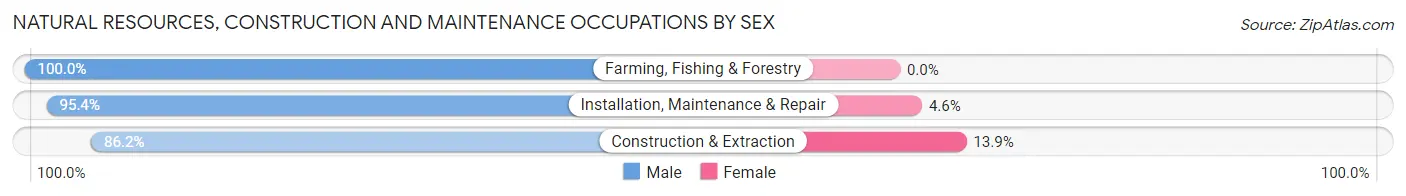
| Occupation | Male | Female |
| Farming, Fishing & Forestry | 24 (100.0%) | 0 (0.0%) |
| Construction & Extraction | 678 (86.2%) | 109 (13.9%) |
| Installation, Maintenance & Repair | 146 (95.4%) | 7 (4.6%) |
| Total (Category) | 848 (88.0%) | 116 (12.0%) |
| Total (Overall) | 4,230 (51.5%) | 3,989 (48.5%) |
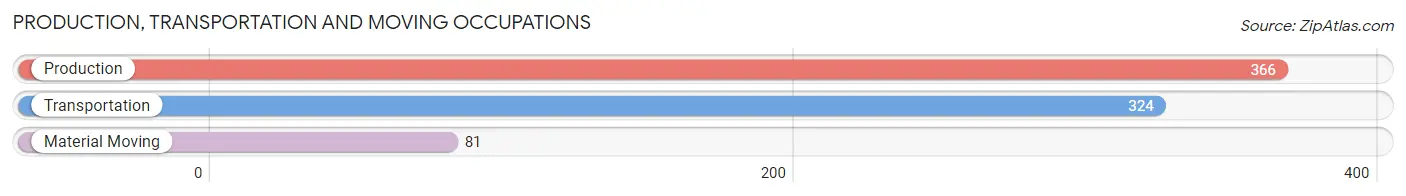
Production, Transportation and Moving Occupations
The most common Production, Transportation and Moving occupations in Stuart are Production (366 | 4.4%), Transportation (324 | 3.9%), and Material Moving (81 | 1.0%).
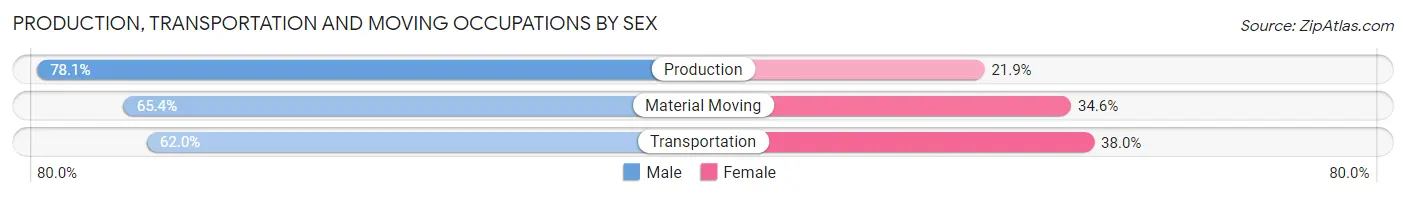
Production, Transportation and Moving Occupations by Sex
| Occupation | Male | Female |
| Production | 286 (78.1%) | 80 (21.9%) |
| Transportation | 201 (62.0%) | 123 (38.0%) |
| Material Moving | 53 (65.4%) | 28 (34.6%) |
| Total (Category) | 540 (70.0%) | 231 (30.0%) |
| Total (Overall) | 4,230 (51.5%) | 3,989 (48.5%) |
Employment Industries by Sex in Stuart
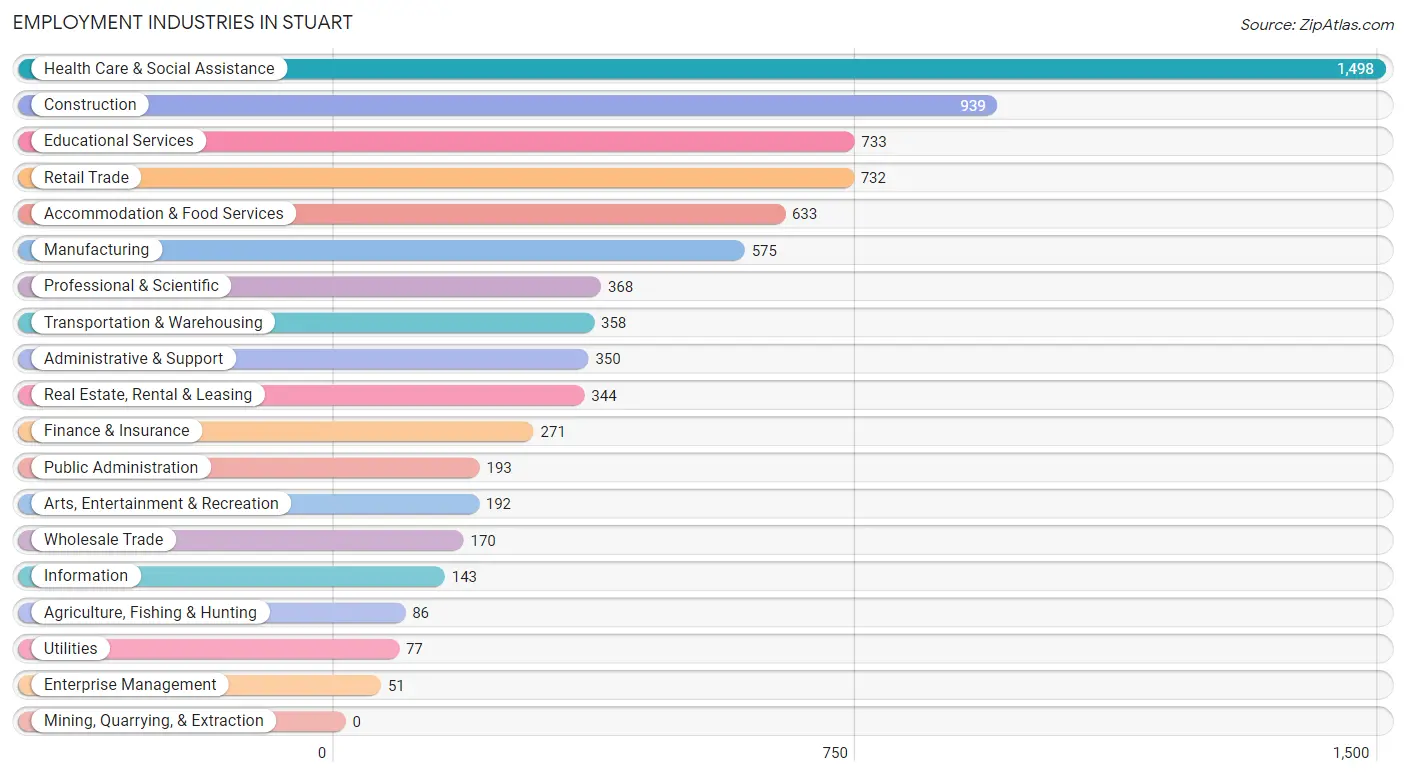
Employment Industries in Stuart
The major employment industries in Stuart include Health Care & Social Assistance (1,498 | 18.2%), Construction (939 | 11.4%), Educational Services (733 | 8.9%), Retail Trade (732 | 8.9%), and Accommodation & Food Services (633 | 7.7%).
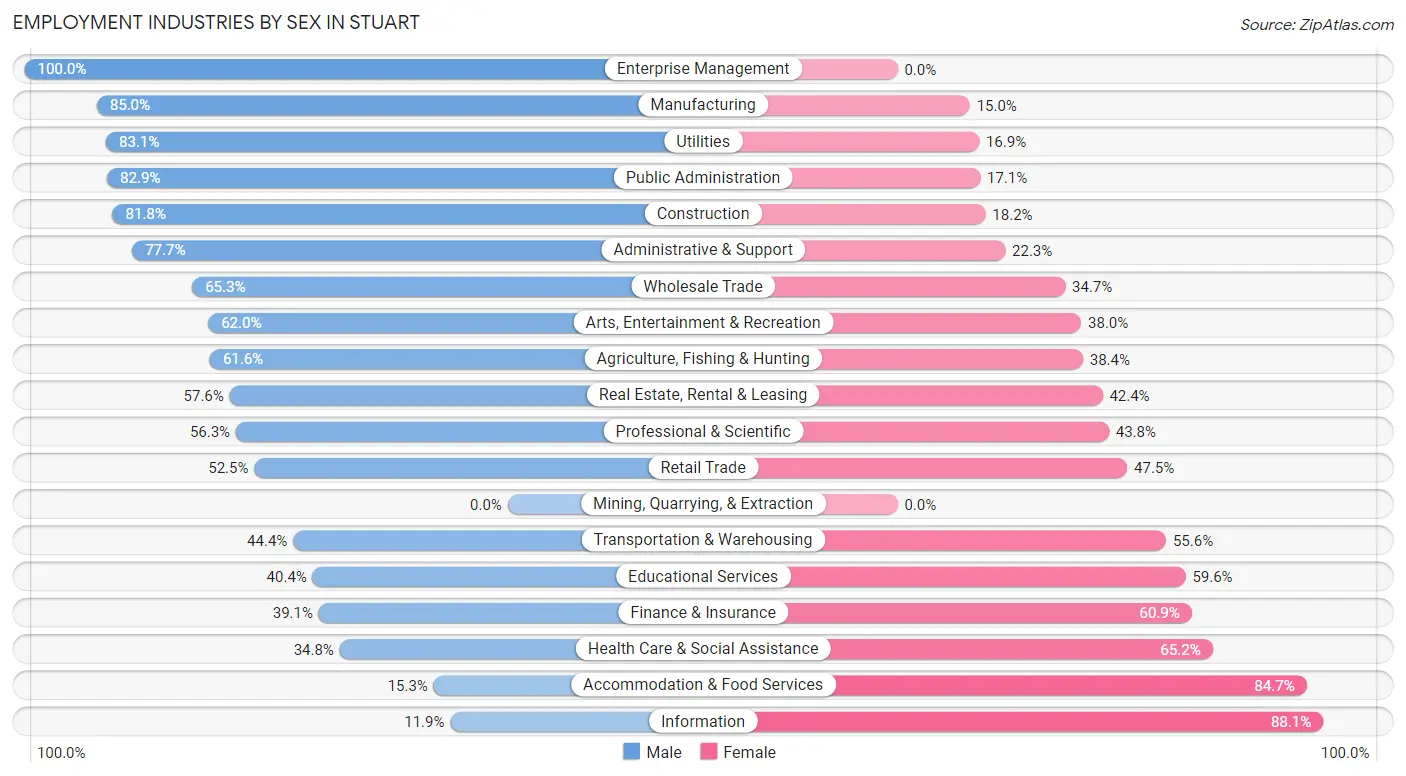
Employment Industries by Sex in Stuart
The Stuart industries that see more men than women are Enterprise Management (100.0%), Manufacturing (85.0%), and Utilities (83.1%), whereas the industries that tend to have a higher number of women are Information (88.1%), Accommodation & Food Services (84.7%), and Health Care & Social Assistance (65.2%).
| Industry | Male | Female |
| Agriculture, Fishing & Hunting | 53 (61.6%) | 33 (38.4%) |
| Mining, Quarrying, & Extraction | 0 (0.0%) | 0 (0.0%) |
| Construction | 768 (81.8%) | 171 (18.2%) |
| Manufacturing | 489 (85.0%) | 86 (15.0%) |
| Wholesale Trade | 111 (65.3%) | 59 (34.7%) |
| Retail Trade | 384 (52.5%) | 348 (47.5%) |
| Transportation & Warehousing | 159 (44.4%) | 199 (55.6%) |
| Utilities | 64 (83.1%) | 13 (16.9%) |
| Information | 17 (11.9%) | 126 (88.1%) |
| Finance & Insurance | 106 (39.1%) | 165 (60.9%) |
| Real Estate, Rental & Leasing | 198 (57.6%) | 146 (42.4%) |
| Professional & Scientific | 207 (56.2%) | 161 (43.8%) |
| Enterprise Management | 51 (100.0%) | 0 (0.0%) |
| Administrative & Support | 272 (77.7%) | 78 (22.3%) |
| Educational Services | 296 (40.4%) | 437 (59.6%) |
| Health Care & Social Assistance | 521 (34.8%) | 977 (65.2%) |
| Arts, Entertainment & Recreation | 119 (62.0%) | 73 (38.0%) |
| Accommodation & Food Services | 97 (15.3%) | 536 (84.7%) |
| Public Administration | 160 (82.9%) | 33 (17.1%) |
| Total | 4,230 (51.5%) | 3,989 (48.5%) |
Education in Stuart
School Enrollment in Stuart
The most common levels of schooling among the 2,742 students in Stuart are college / undergraduate (722 | 26.3%), elementary school (647 | 23.6%), and high school (493 | 18.0%).
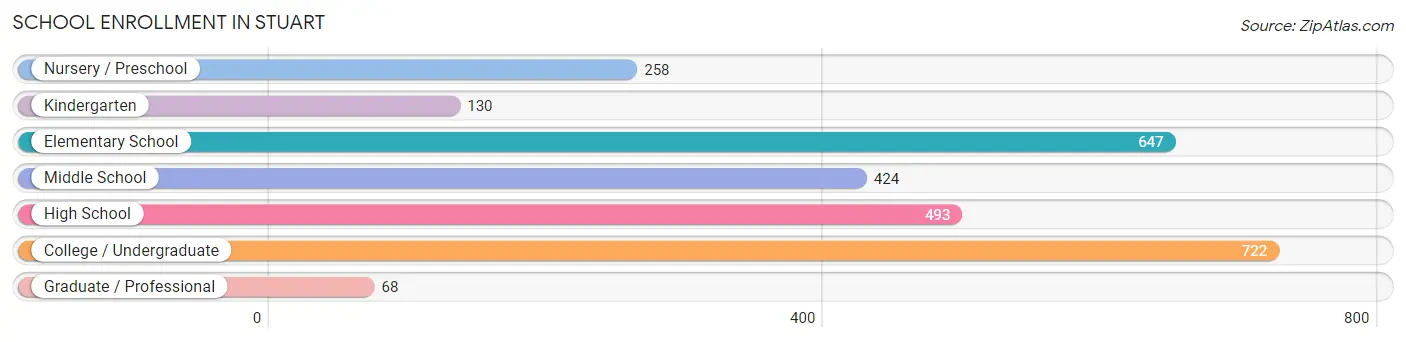
| School Level | # Students | % Students |
| Nursery / Preschool | 258 | 9.4% |
| Kindergarten | 130 | 4.7% |
| Elementary School | 647 | 23.6% |
| Middle School | 424 | 15.5% |
| High School | 493 | 18.0% |
| College / Undergraduate | 722 | 26.3% |
| Graduate / Professional | 68 | 2.5% |
| Total | 2,742 | 100.0% |
School Enrollment by Age by Funding Source in Stuart
Out of a total of 2,742 students who are enrolled in schools in Stuart, 296 (10.8%) attend a private institution, while the remaining 2,446 (89.2%) are enrolled in public schools. The age group of 3 to 4 year olds has the highest likelihood of being enrolled in private schools, with 94 (36.6% in the age bracket) enrolled. Conversely, the age group of 18 to 19 year olds has the lowest likelihood of being enrolled in a private school, with 153 (100.0% in the age bracket) attending a public institution.
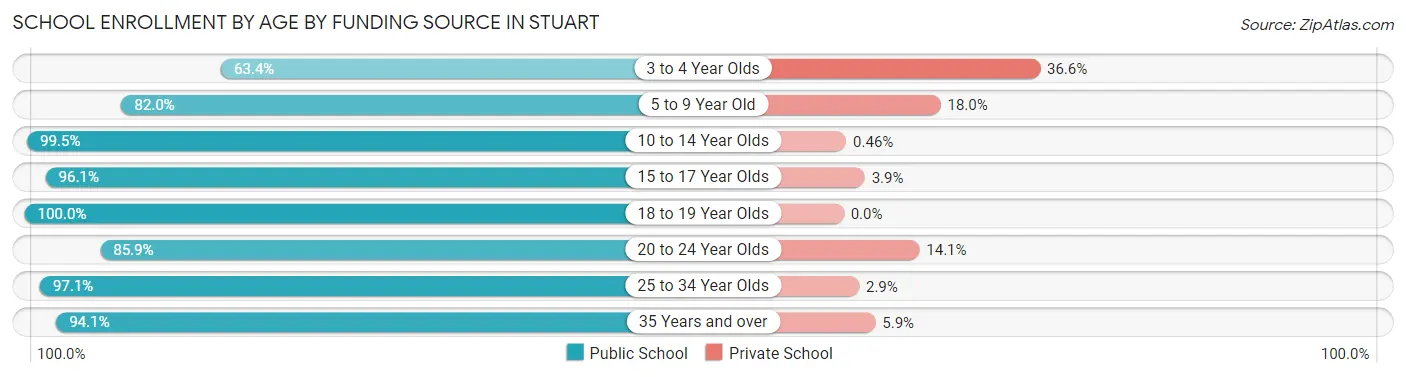
| Age Bracket | Public School | Private School |
| 3 to 4 Year Olds | 163 (63.4%) | 94 (36.6%) |
| 5 to 9 Year Old | 586 (82.0%) | 129 (18.0%) |
| 10 to 14 Year Olds | 437 (99.5%) | 2 (0.5%) |
| 15 to 17 Year Olds | 441 (96.1%) | 18 (3.9%) |
| 18 to 19 Year Olds | 153 (100.0%) | 0 (0.0%) |
| 20 to 24 Year Olds | 134 (85.9%) | 22 (14.1%) |
| 25 to 34 Year Olds | 102 (97.1%) | 3 (2.9%) |
| 35 Years and over | 431 (94.1%) | 27 (5.9%) |
| Total | 2,446 (89.2%) | 296 (10.8%) |
Educational Attainment by Field of Study in Stuart
Business (1,176 | 24.6%), education (635 | 13.3%), engineering (432 | 9.0%), science & technology (432 | 9.0%), and liberal arts & history (368 | 7.7%) are the most common fields of study among 4,780 individuals in Stuart who have obtained a bachelor's degree or higher.
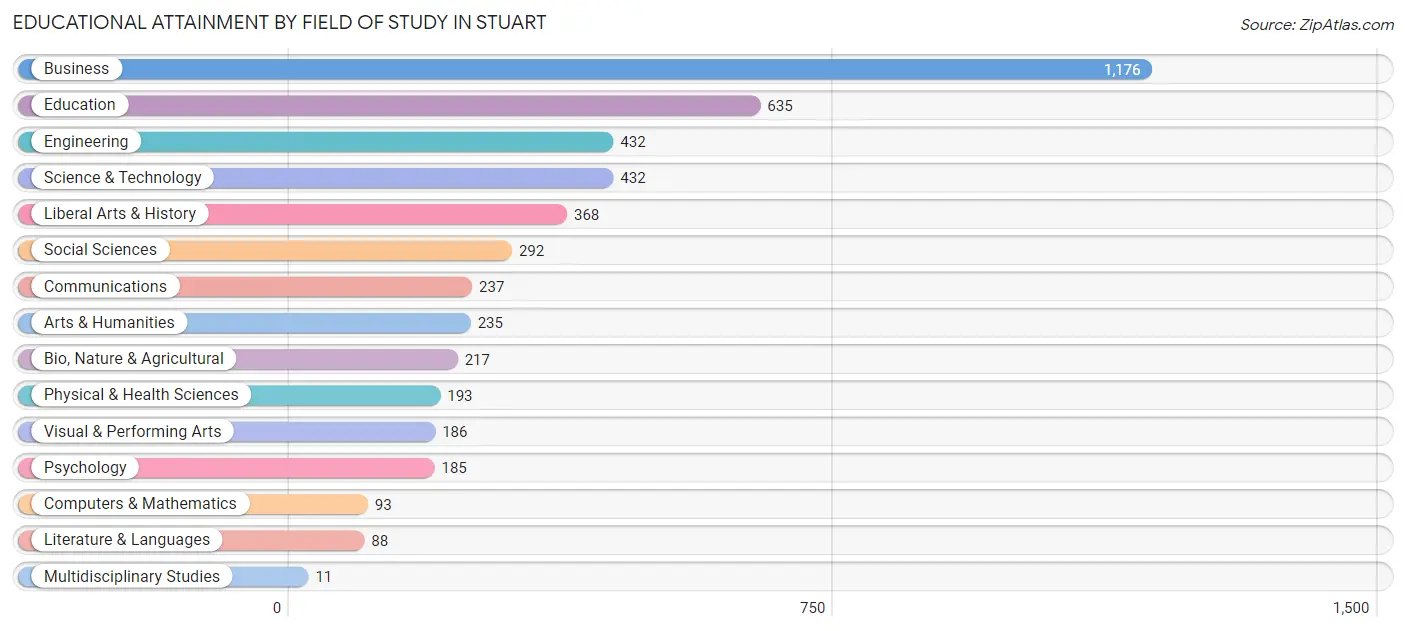
| Field of Study | # Graduates | % Graduates |
| Computers & Mathematics | 93 | 1.9% |
| Bio, Nature & Agricultural | 217 | 4.5% |
| Physical & Health Sciences | 193 | 4.0% |
| Psychology | 185 | 3.9% |
| Social Sciences | 292 | 6.1% |
| Engineering | 432 | 9.0% |
| Multidisciplinary Studies | 11 | 0.2% |
| Science & Technology | 432 | 9.0% |
| Business | 1,176 | 24.6% |
| Education | 635 | 13.3% |
| Literature & Languages | 88 | 1.8% |
| Liberal Arts & History | 368 | 7.7% |
| Visual & Performing Arts | 186 | 3.9% |
| Communications | 237 | 5.0% |
| Arts & Humanities | 235 | 4.9% |
| Total | 4,780 | 100.0% |
Transportation & Commute in Stuart
Vehicle Availability by Sex in Stuart
The most prevalent vehicle ownership categories in Stuart are males with 2 vehicles (1,886, accounting for 47.0%) and females with 2 vehicles (1,508, making up 49.4%).
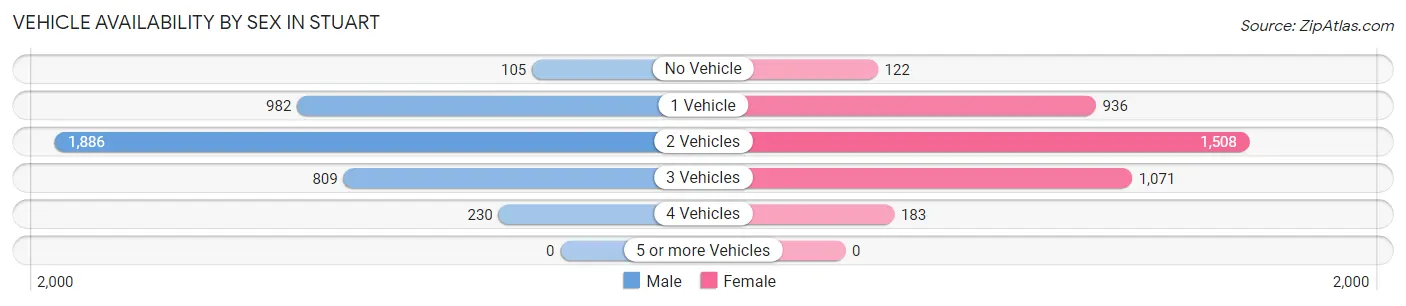
| Vehicles Available | Male | Female |
| No Vehicle | 105 (2.6%) | 122 (3.2%) |
| 1 Vehicle | 982 (24.5%) | 936 (24.5%) |
| 2 Vehicles | 1,886 (47.0%) | 1,508 (39.5%) |
| 3 Vehicles | 809 (20.2%) | 1,071 (28.0%) |
| 4 Vehicles | 230 (5.7%) | 183 (4.8%) |
| 5 or more Vehicles | 0 (0.0%) | 0 (0.0%) |
| Total | 4,012 (100.0%) | 3,820 (100.0%) |
Commute Time in Stuart
The most frequently occuring commute durations in Stuart are 10 to 14 minutes (1,435 commuters, 20.5%), 15 to 19 minutes (1,301 commuters, 18.6%), and 20 to 24 minutes (874 commuters, 12.5%).
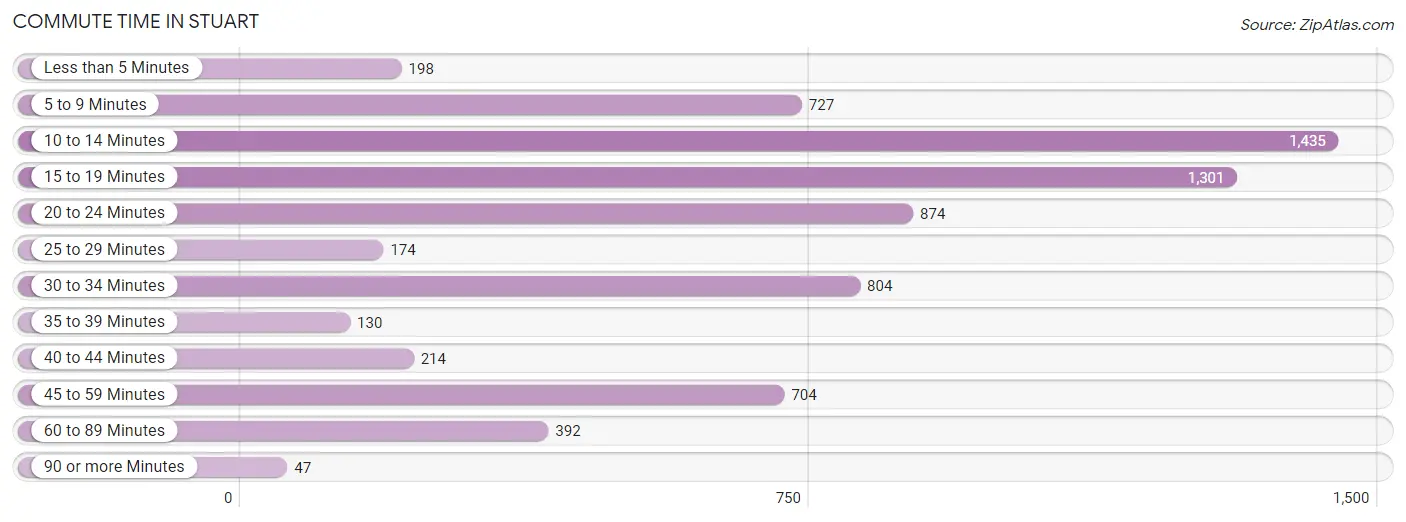
| Commute Time | # Commuters | % Commuters |
| Less than 5 Minutes | 198 | 2.8% |
| 5 to 9 Minutes | 727 | 10.4% |
| 10 to 14 Minutes | 1,435 | 20.5% |
| 15 to 19 Minutes | 1,301 | 18.6% |
| 20 to 24 Minutes | 874 | 12.5% |
| 25 to 29 Minutes | 174 | 2.5% |
| 30 to 34 Minutes | 804 | 11.5% |
| 35 to 39 Minutes | 130 | 1.9% |
| 40 to 44 Minutes | 214 | 3.1% |
| 45 to 59 Minutes | 704 | 10.1% |
| 60 to 89 Minutes | 392 | 5.6% |
| 90 or more Minutes | 47 | 0.7% |
Commute Time by Sex in Stuart
The most common commute times in Stuart are 15 to 19 minutes (750 commuters, 20.6%) for males and 10 to 14 minutes (695 commuters, 20.7%) for females.
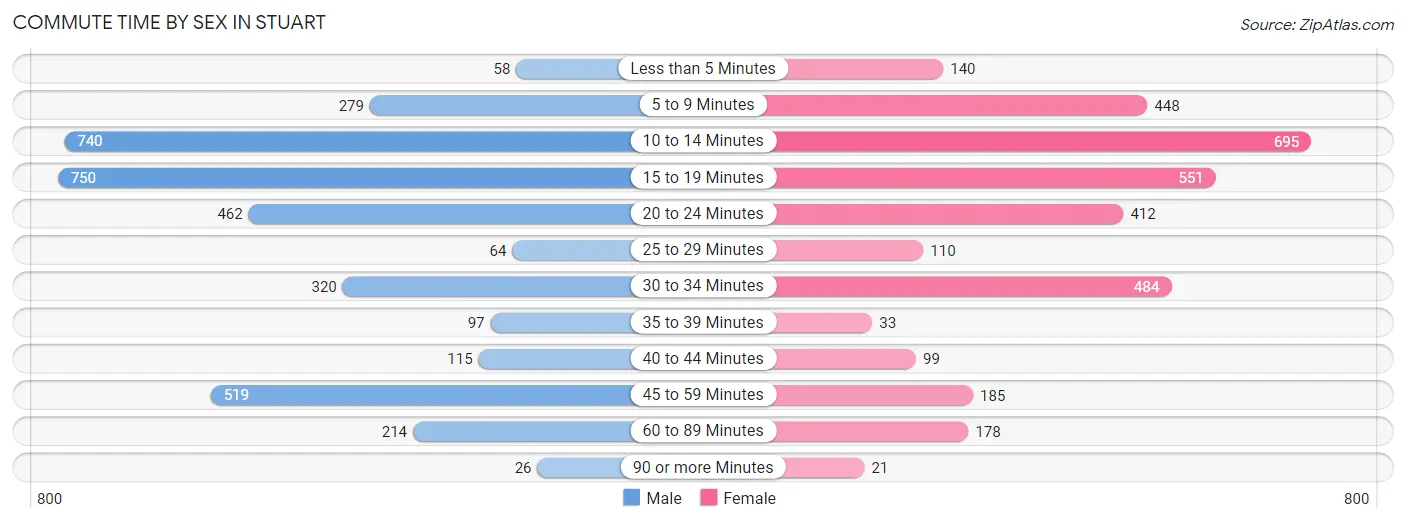
| Commute Time | Male | Female |
| Less than 5 Minutes | 58 (1.6%) | 140 (4.2%) |
| 5 to 9 Minutes | 279 (7.7%) | 448 (13.4%) |
| 10 to 14 Minutes | 740 (20.3%) | 695 (20.7%) |
| 15 to 19 Minutes | 750 (20.6%) | 551 (16.4%) |
| 20 to 24 Minutes | 462 (12.7%) | 412 (12.3%) |
| 25 to 29 Minutes | 64 (1.8%) | 110 (3.3%) |
| 30 to 34 Minutes | 320 (8.8%) | 484 (14.4%) |
| 35 to 39 Minutes | 97 (2.7%) | 33 (1.0%) |
| 40 to 44 Minutes | 115 (3.2%) | 99 (2.9%) |
| 45 to 59 Minutes | 519 (14.2%) | 185 (5.5%) |
| 60 to 89 Minutes | 214 (5.9%) | 178 (5.3%) |
| 90 or more Minutes | 26 (0.7%) | 21 (0.6%) |
Time of Departure to Work by Sex in Stuart
The most frequent times of departure to work in Stuart are 7:00 AM to 7:29 AM (906, 24.9%) for males and 9:00 AM to 9:59 AM (683, 20.3%) for females.
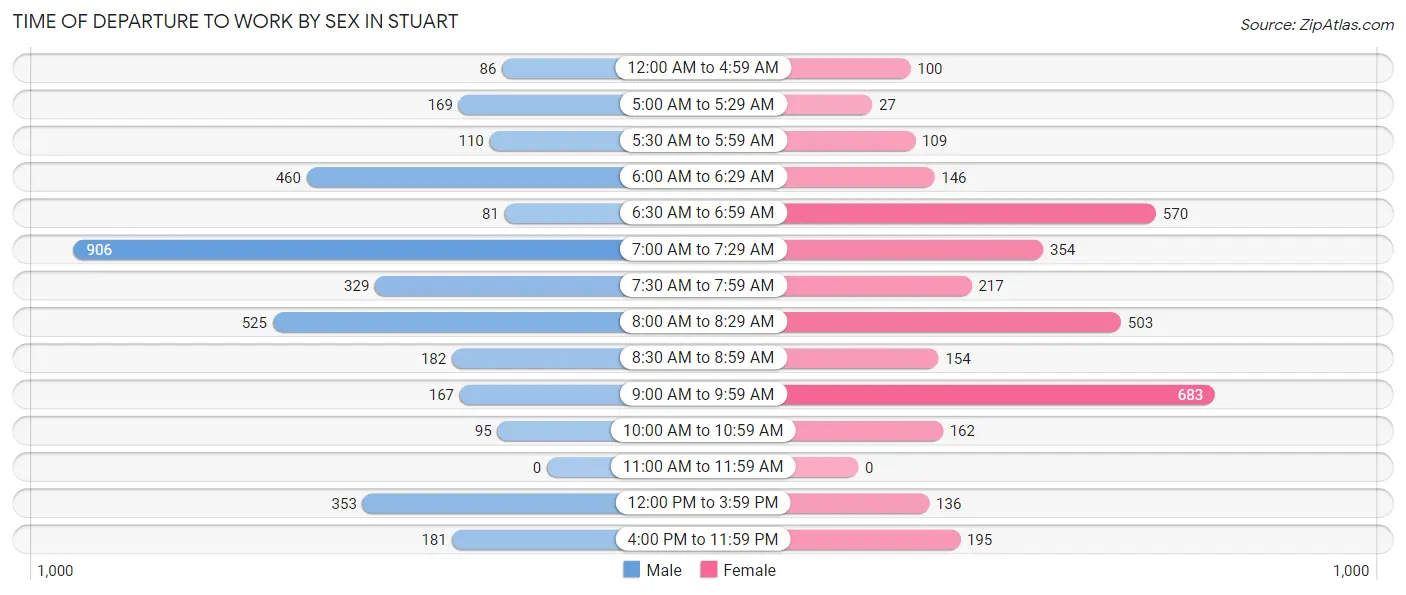
| Time of Departure | Male | Female |
| 12:00 AM to 4:59 AM | 86 (2.4%) | 100 (3.0%) |
| 5:00 AM to 5:29 AM | 169 (4.6%) | 27 (0.8%) |
| 5:30 AM to 5:59 AM | 110 (3.0%) | 109 (3.3%) |
| 6:00 AM to 6:29 AM | 460 (12.6%) | 146 (4.3%) |
| 6:30 AM to 6:59 AM | 81 (2.2%) | 570 (17.0%) |
| 7:00 AM to 7:29 AM | 906 (24.9%) | 354 (10.5%) |
| 7:30 AM to 7:59 AM | 329 (9.0%) | 217 (6.5%) |
| 8:00 AM to 8:29 AM | 525 (14.4%) | 503 (15.0%) |
| 8:30 AM to 8:59 AM | 182 (5.0%) | 154 (4.6%) |
| 9:00 AM to 9:59 AM | 167 (4.6%) | 683 (20.3%) |
| 10:00 AM to 10:59 AM | 95 (2.6%) | 162 (4.8%) |
| 11:00 AM to 11:59 AM | 0 (0.0%) | 0 (0.0%) |
| 12:00 PM to 3:59 PM | 353 (9.7%) | 136 (4.1%) |
| 4:00 PM to 11:59 PM | 181 (5.0%) | 195 (5.8%) |
| Total | 3,644 (100.0%) | 3,356 (100.0%) |
Housing Occupancy in Stuart
Occupancy by Ownership in Stuart
Of the total 7,852 dwellings in Stuart, owner-occupied units account for 4,602 (58.6%), while renter-occupied units make up 3,250 (41.4%).
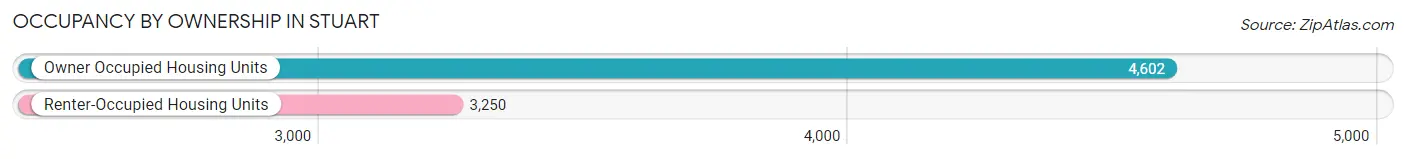
| Occupancy | # Housing Units | % Housing Units |
| Owner Occupied Housing Units | 4,602 | 58.6% |
| Renter-Occupied Housing Units | 3,250 | 41.4% |
| Total Occupied Housing Units | 7,852 | 100.0% |
Occupancy by Household Size in Stuart
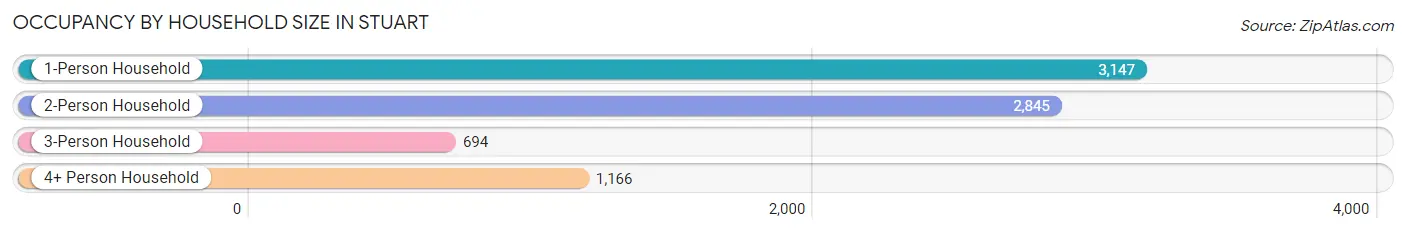
| Household Size | # Housing Units | % Housing Units |
| 1-Person Household | 3,147 | 40.1% |
| 2-Person Household | 2,845 | 36.2% |
| 3-Person Household | 694 | 8.8% |
| 4+ Person Household | 1,166 | 14.8% |
| Total Housing Units | 7,852 | 100.0% |
Occupancy by Ownership by Household Size in Stuart
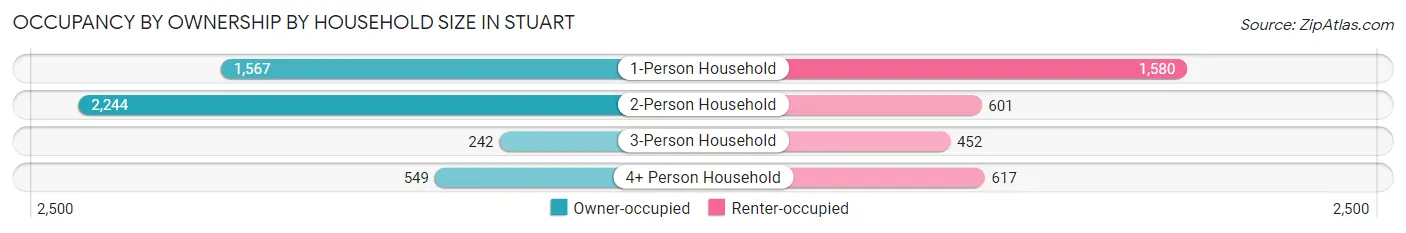
| Household Size | Owner-occupied | Renter-occupied |
| 1-Person Household | 1,567 (49.8%) | 1,580 (50.2%) |
| 2-Person Household | 2,244 (78.9%) | 601 (21.1%) |
| 3-Person Household | 242 (34.9%) | 452 (65.1%) |
| 4+ Person Household | 549 (47.1%) | 617 (52.9%) |
| Total Housing Units | 4,602 (58.6%) | 3,250 (41.4%) |
Occupancy by Educational Attainment in Stuart
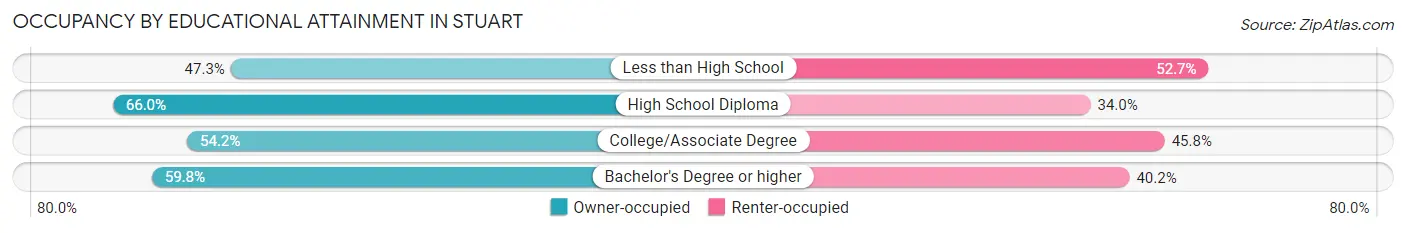
| Household Size | Owner-occupied | Renter-occupied |
| Less than High School | 203 (47.3%) | 226 (52.7%) |
| High School Diploma | 1,130 (66.0%) | 582 (34.0%) |
| College/Associate Degree | 1,430 (54.2%) | 1,207 (45.8%) |
| Bachelor's Degree or higher | 1,839 (59.8%) | 1,235 (40.2%) |
Occupancy by Age of Householder in Stuart
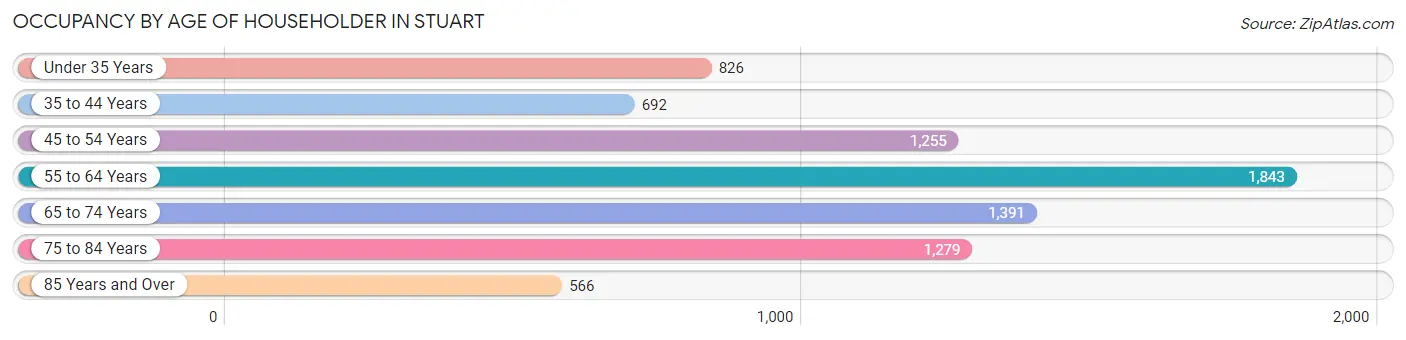
| Age Bracket | # Households | % Households |
| Under 35 Years | 826 | 10.5% |
| 35 to 44 Years | 692 | 8.8% |
| 45 to 54 Years | 1,255 | 16.0% |
| 55 to 64 Years | 1,843 | 23.5% |
| 65 to 74 Years | 1,391 | 17.7% |
| 75 to 84 Years | 1,279 | 16.3% |
| 85 Years and Over | 566 | 7.2% |
| Total | 7,852 | 100.0% |
Housing Finances in Stuart
Median Income by Occupancy in Stuart
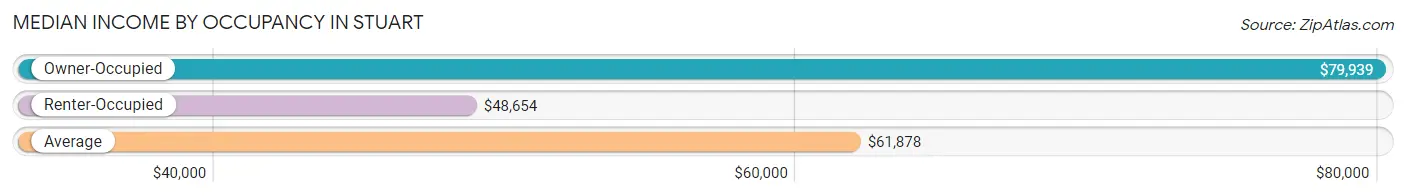
| Occupancy Type | # Households | Median Income |
| Owner-Occupied | 4,602 (58.6%) | $79,939 |
| Renter-Occupied | 3,250 (41.4%) | $48,654 |
| Average | 7,852 (100.0%) | $61,878 |
Occupancy by Householder Income Bracket in Stuart
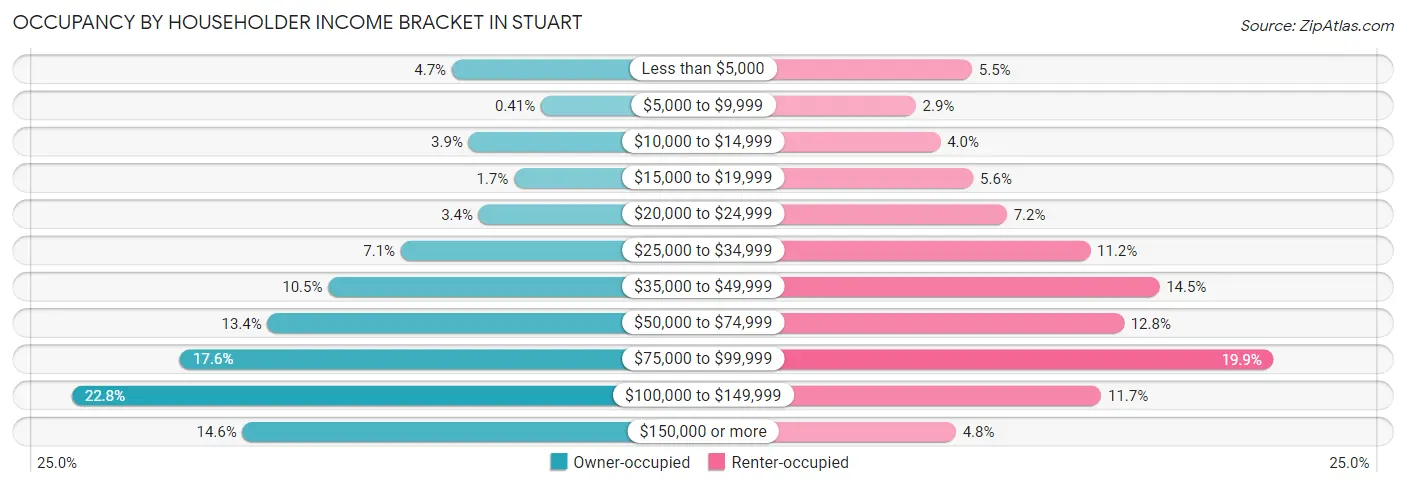
| Income Bracket | Owner-occupied | Renter-occupied |
| Less than $5,000 | 214 (4.6%) | 180 (5.5%) |
| $5,000 to $9,999 | 19 (0.4%) | 93 (2.9%) |
| $10,000 to $14,999 | 177 (3.8%) | 131 (4.0%) |
| $15,000 to $19,999 | 78 (1.7%) | 182 (5.6%) |
| $20,000 to $24,999 | 155 (3.4%) | 234 (7.2%) |
| $25,000 to $34,999 | 326 (7.1%) | 363 (11.2%) |
| $35,000 to $49,999 | 485 (10.5%) | 470 (14.5%) |
| $50,000 to $74,999 | 618 (13.4%) | 415 (12.8%) |
| $75,000 to $99,999 | 810 (17.6%) | 647 (19.9%) |
| $100,000 to $149,999 | 1,047 (22.8%) | 380 (11.7%) |
| $150,000 or more | 673 (14.6%) | 155 (4.8%) |
| Total | 4,602 (100.0%) | 3,250 (100.0%) |
Monthly Housing Cost Tiers in Stuart
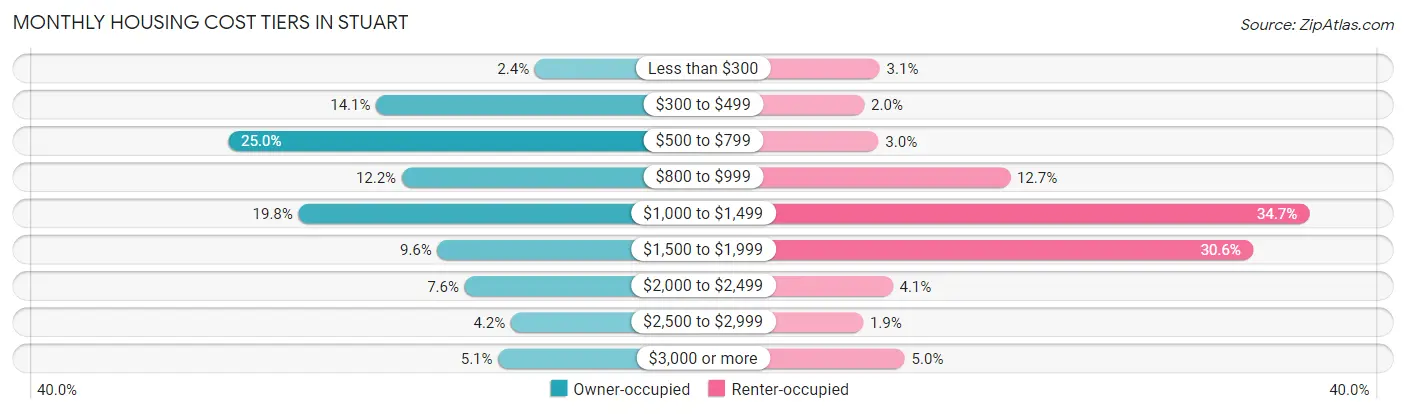
| Monthly Cost | Owner-occupied | Renter-occupied |
| Less than $300 | 111 (2.4%) | 101 (3.1%) |
| $300 to $499 | 649 (14.1%) | 64 (2.0%) |
| $500 to $799 | 1,151 (25.0%) | 98 (3.0%) |
| $800 to $999 | 562 (12.2%) | 413 (12.7%) |
| $1,000 to $1,499 | 912 (19.8%) | 1,129 (34.7%) |
| $1,500 to $1,999 | 441 (9.6%) | 994 (30.6%) |
| $2,000 to $2,499 | 349 (7.6%) | 132 (4.1%) |
| $2,500 to $2,999 | 192 (4.2%) | 61 (1.9%) |
| $3,000 or more | 235 (5.1%) | 161 (5.0%) |
| Total | 4,602 (100.0%) | 3,250 (100.0%) |
Physical Housing Characteristics in Stuart
Housing Structures in Stuart
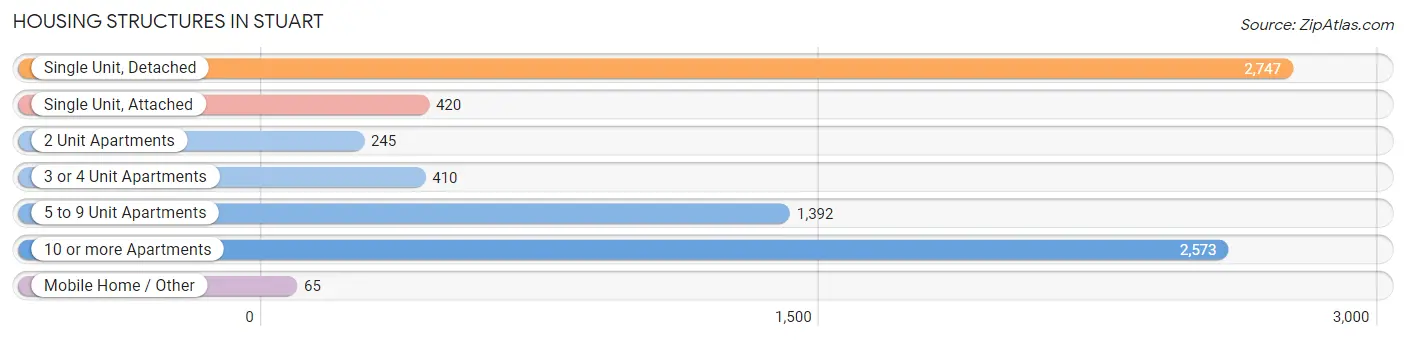
| Structure Type | # Housing Units | % Housing Units |
| Single Unit, Detached | 2,747 | 35.0% |
| Single Unit, Attached | 420 | 5.3% |
| 2 Unit Apartments | 245 | 3.1% |
| 3 or 4 Unit Apartments | 410 | 5.2% |
| 5 to 9 Unit Apartments | 1,392 | 17.7% |
| 10 or more Apartments | 2,573 | 32.8% |
| Mobile Home / Other | 65 | 0.8% |
| Total | 7,852 | 100.0% |
Housing Structures by Occupancy in Stuart
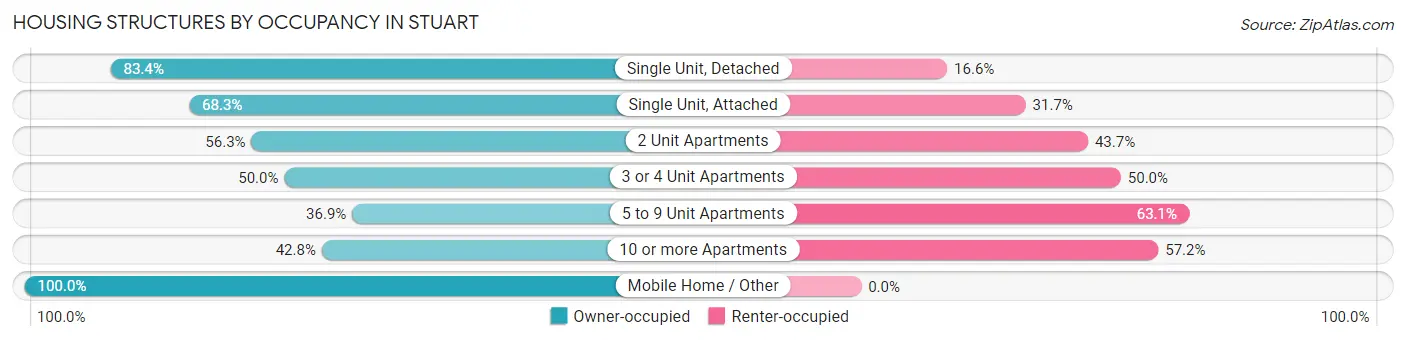
| Structure Type | Owner-occupied | Renter-occupied |
| Single Unit, Detached | 2,292 (83.4%) | 455 (16.6%) |
| Single Unit, Attached | 287 (68.3%) | 133 (31.7%) |
| 2 Unit Apartments | 138 (56.3%) | 107 (43.7%) |
| 3 or 4 Unit Apartments | 205 (50.0%) | 205 (50.0%) |
| 5 to 9 Unit Apartments | 514 (36.9%) | 878 (63.1%) |
| 10 or more Apartments | 1,101 (42.8%) | 1,472 (57.2%) |
| Mobile Home / Other | 65 (100.0%) | 0 (0.0%) |
| Total | 4,602 (58.6%) | 3,250 (41.4%) |
Housing Structures by Number of Rooms in Stuart
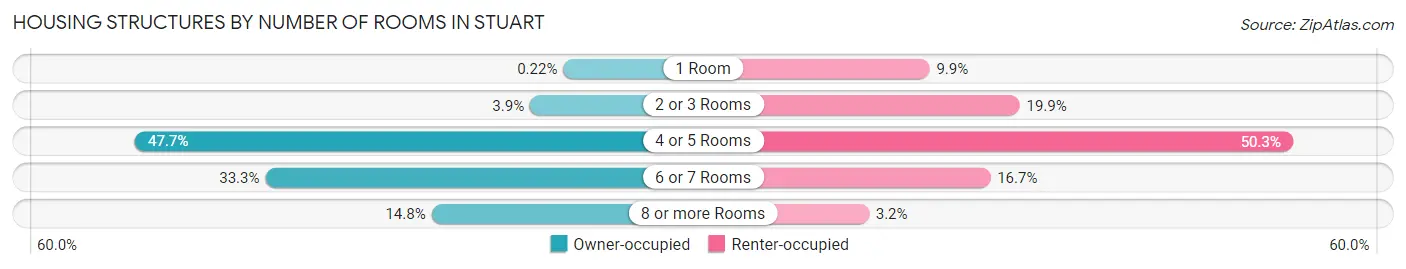
| Number of Rooms | Owner-occupied | Renter-occupied |
| 1 Room | 10 (0.2%) | 323 (9.9%) |
| 2 or 3 Rooms | 180 (3.9%) | 648 (19.9%) |
| 4 or 5 Rooms | 2,197 (47.7%) | 1,633 (50.2%) |
| 6 or 7 Rooms | 1,532 (33.3%) | 542 (16.7%) |
| 8 or more Rooms | 683 (14.8%) | 104 (3.2%) |
| Total | 4,602 (100.0%) | 3,250 (100.0%) |
Housing Structure by Heating Type in Stuart
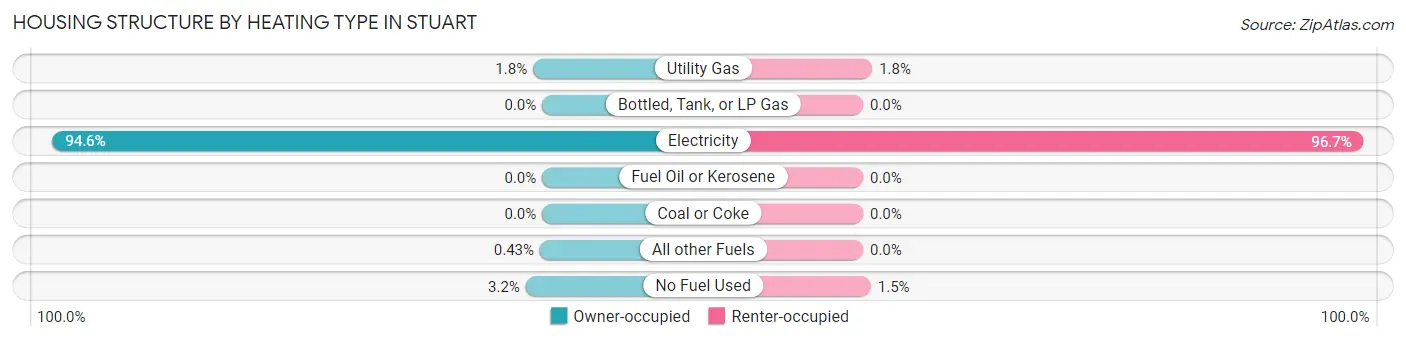
| Heating Type | Owner-occupied | Renter-occupied |
| Utility Gas | 81 (1.8%) | 58 (1.8%) |
| Bottled, Tank, or LP Gas | 0 (0.0%) | 0 (0.0%) |
| Electricity | 4,355 (94.6%) | 3,143 (96.7%) |
| Fuel Oil or Kerosene | 0 (0.0%) | 0 (0.0%) |
| Coal or Coke | 0 (0.0%) | 0 (0.0%) |
| All other Fuels | 20 (0.4%) | 0 (0.0%) |
| No Fuel Used | 146 (3.2%) | 49 (1.5%) |
| Total | 4,602 (100.0%) | 3,250 (100.0%) |
Household Vehicle Usage in Stuart
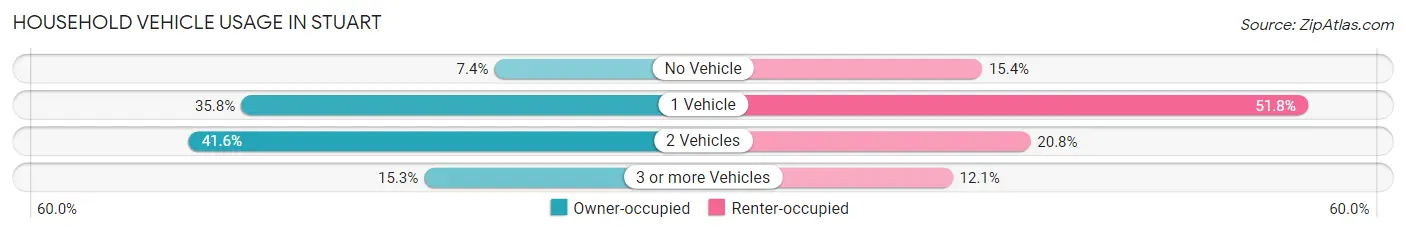
| Vehicles per Household | Owner-occupied | Renter-occupied |
| No Vehicle | 340 (7.4%) | 499 (15.3%) |
| 1 Vehicle | 1,645 (35.7%) | 1,684 (51.8%) |
| 2 Vehicles | 1,915 (41.6%) | 675 (20.8%) |
| 3 or more Vehicles | 702 (15.2%) | 392 (12.1%) |
| Total | 4,602 (100.0%) | 3,250 (100.0%) |
Real Estate & Mortgages in Stuart
Real Estate and Mortgage Overview in Stuart
| Characteristic | Without Mortgage | With Mortgage |
| Housing Units | 2,668 | 1,934 |
| Median Property Value | $242,400 | $335,900 |
| Median Household Income | $70,806 | $433 |
| Monthly Housing Costs | $642 | $213 |
| Real Estate Taxes | $1,475 | $117 |
Property Value by Mortgage Status in Stuart
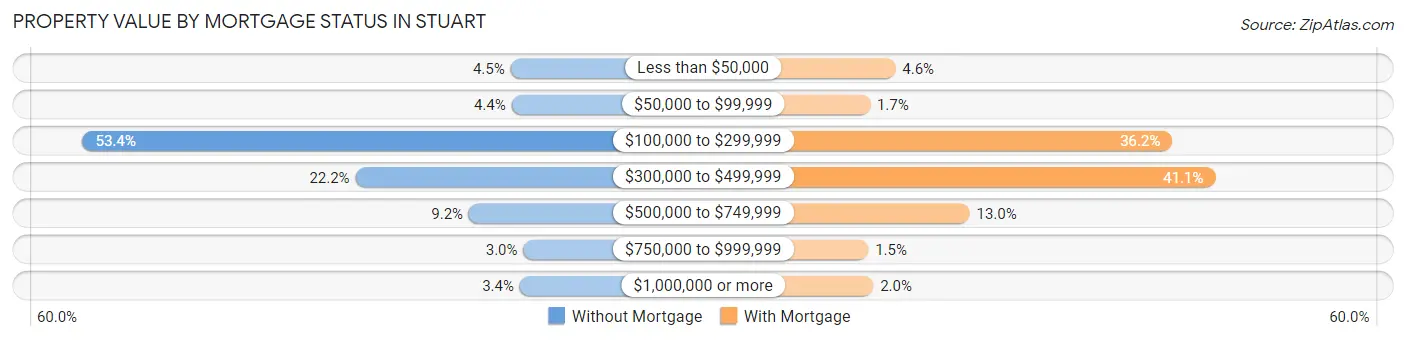
| Property Value | Without Mortgage | With Mortgage |
| Less than $50,000 | 119 (4.5%) | 88 (4.5%) |
| $50,000 to $99,999 | 116 (4.3%) | 32 (1.7%) |
| $100,000 to $299,999 | 1,424 (53.4%) | 700 (36.2%) |
| $300,000 to $499,999 | 592 (22.2%) | 795 (41.1%) |
| $500,000 to $749,999 | 246 (9.2%) | 252 (13.0%) |
| $750,000 to $999,999 | 80 (3.0%) | 28 (1.5%) |
| $1,000,000 or more | 91 (3.4%) | 39 (2.0%) |
| Total | 2,668 (100.0%) | 1,934 (100.0%) |
Household Income by Mortgage Status in Stuart
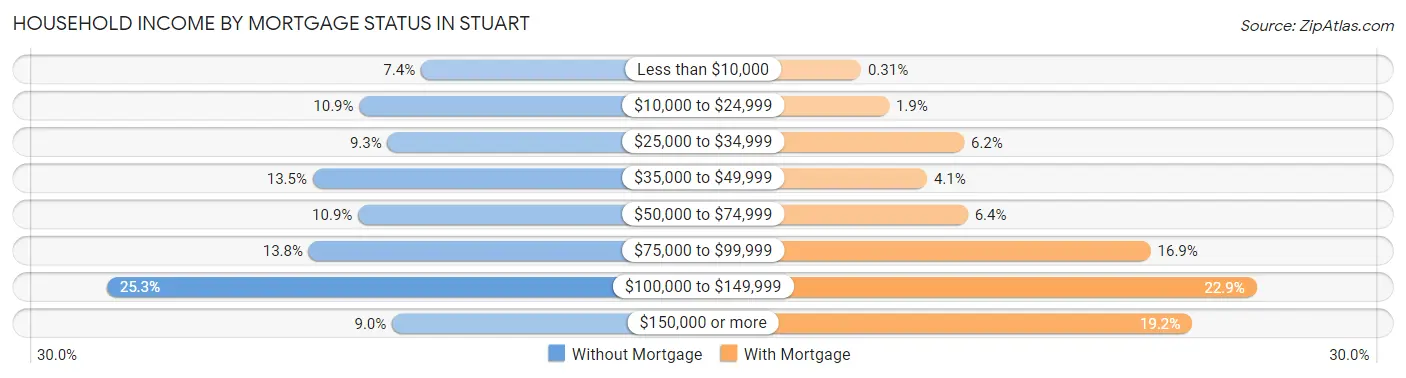
| Household Income | Without Mortgage | With Mortgage |
| Less than $10,000 | 196 (7.3%) | 6 (0.3%) |
| $10,000 to $24,999 | 290 (10.9%) | 37 (1.9%) |
| $25,000 to $34,999 | 247 (9.3%) | 120 (6.2%) |
| $35,000 to $49,999 | 361 (13.5%) | 79 (4.1%) |
| $50,000 to $74,999 | 292 (10.9%) | 124 (6.4%) |
| $75,000 to $99,999 | 367 (13.8%) | 326 (16.9%) |
| $100,000 to $149,999 | 675 (25.3%) | 443 (22.9%) |
| $150,000 or more | 240 (9.0%) | 372 (19.2%) |
| Total | 2,668 (100.0%) | 1,934 (100.0%) |
Property Value to Household Income Ratio in Stuart
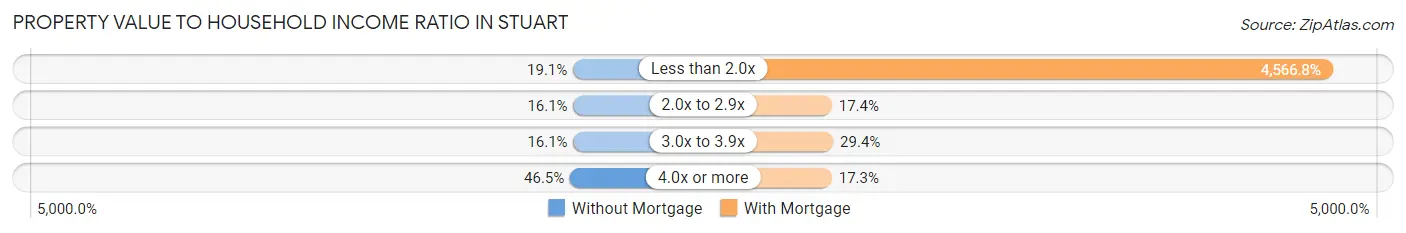
| Value-to-Income Ratio | Without Mortgage | With Mortgage |
| Less than 2.0x | 509 (19.1%) | 88,321 (4,566.7%) |
| 2.0x to 2.9x | 429 (16.1%) | 336 (17.4%) |
| 3.0x to 3.9x | 430 (16.1%) | 568 (29.4%) |
| 4.0x or more | 1,240 (46.5%) | 335 (17.3%) |
| Total | 2,668 (100.0%) | 1,934 (100.0%) |
Real Estate Taxes by Mortgage Status in Stuart
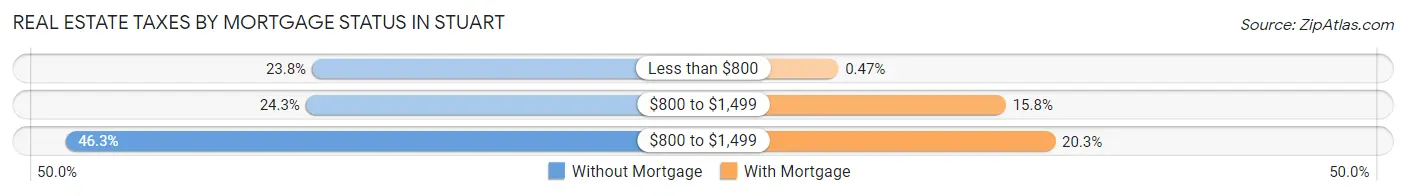
| Property Taxes | Without Mortgage | With Mortgage |
| Less than $800 | 634 (23.8%) | 9 (0.5%) |
| $800 to $1,499 | 649 (24.3%) | 305 (15.8%) |
| $800 to $1,499 | 1,235 (46.3%) | 392 (20.3%) |
| Total | 2,668 (100.0%) | 1,934 (100.0%) |
Health & Disability in Stuart
Health Insurance Coverage by Age in Stuart
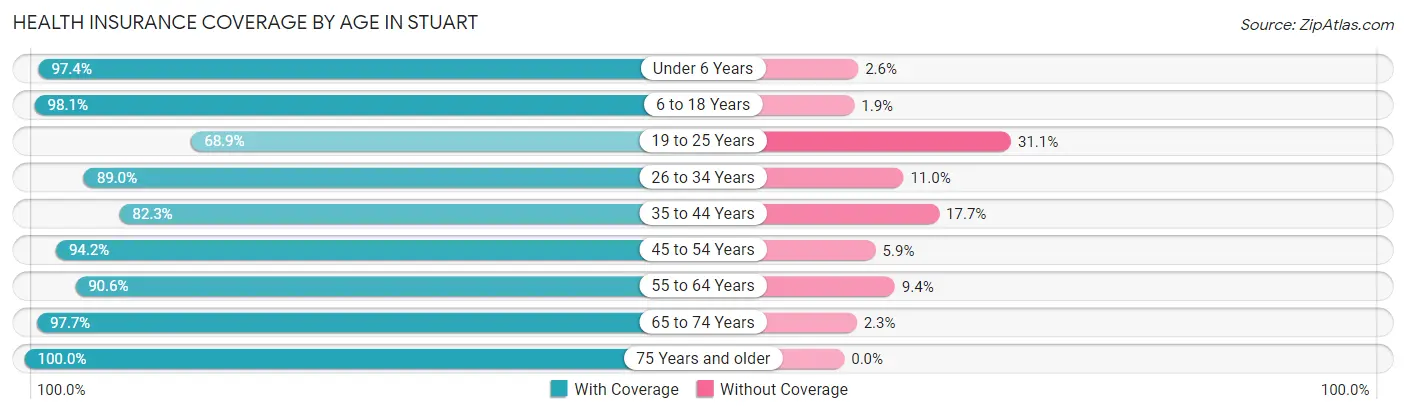
| Age Bracket | With Coverage | Without Coverage |
| Under 6 Years | 1,085 (97.4%) | 29 (2.6%) |
| 6 to 18 Years | 1,770 (98.1%) | 34 (1.9%) |
| 19 to 25 Years | 716 (68.9%) | 323 (31.1%) |
| 26 to 34 Years | 1,636 (89.0%) | 203 (11.0%) |
| 35 to 44 Years | 1,321 (82.3%) | 284 (17.7%) |
| 45 to 54 Years | 2,075 (94.2%) | 129 (5.9%) |
| 55 to 64 Years | 2,716 (90.6%) | 283 (9.4%) |
| 65 to 74 Years | 2,200 (97.7%) | 52 (2.3%) |
| 75 Years and older | 2,385 (100.0%) | 0 (0.0%) |
| Total | 15,904 (92.2%) | 1,337 (7.7%) |
Health Insurance Coverage by Citizenship Status in Stuart
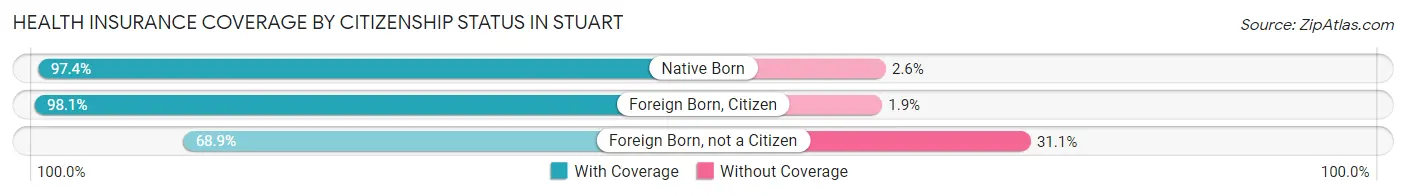
| Citizenship Status | With Coverage | Without Coverage |
| Native Born | 1,085 (97.4%) | 29 (2.6%) |
| Foreign Born, Citizen | 1,770 (98.1%) | 34 (1.9%) |
| Foreign Born, not a Citizen | 716 (68.9%) | 323 (31.1%) |
Health Insurance Coverage by Household Income in Stuart
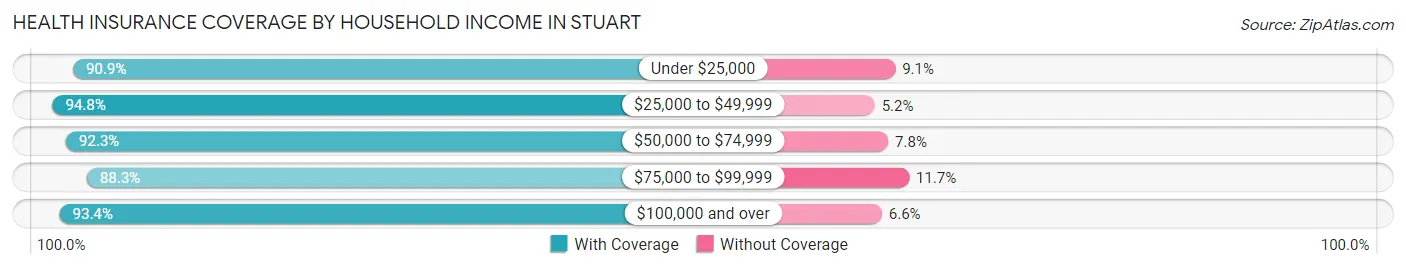
| Household Income | With Coverage | Without Coverage |
| Under $25,000 | 1,936 (90.9%) | 193 (9.1%) |
| $25,000 to $49,999 | 3,240 (94.8%) | 179 (5.2%) |
| $50,000 to $74,999 | 2,310 (92.2%) | 194 (7.7%) |
| $75,000 to $99,999 | 2,912 (88.3%) | 385 (11.7%) |
| $100,000 and over | 5,407 (93.4%) | 380 (6.6%) |
Public vs Private Health Insurance Coverage by Age in Stuart
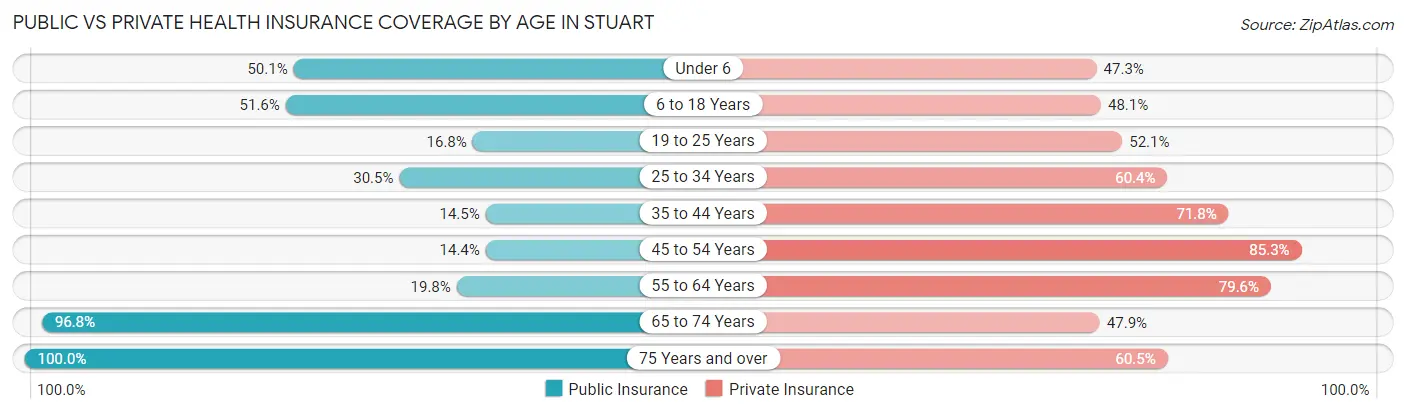
| Age Bracket | Public Insurance | Private Insurance |
| Under 6 | 558 (50.1%) | 527 (47.3%) |
| 6 to 18 Years | 930 (51.5%) | 868 (48.1%) |
| 19 to 25 Years | 175 (16.8%) | 541 (52.1%) |
| 25 to 34 Years | 560 (30.4%) | 1,111 (60.4%) |
| 35 to 44 Years | 232 (14.4%) | 1,152 (71.8%) |
| 45 to 54 Years | 318 (14.4%) | 1,880 (85.3%) |
| 55 to 64 Years | 594 (19.8%) | 2,388 (79.6%) |
| 65 to 74 Years | 2,180 (96.8%) | 1,079 (47.9%) |
| 75 Years and over | 2,385 (100.0%) | 1,442 (60.5%) |
| Total | 7,932 (46.0%) | 10,988 (63.7%) |
Disability Status by Sex by Age in Stuart
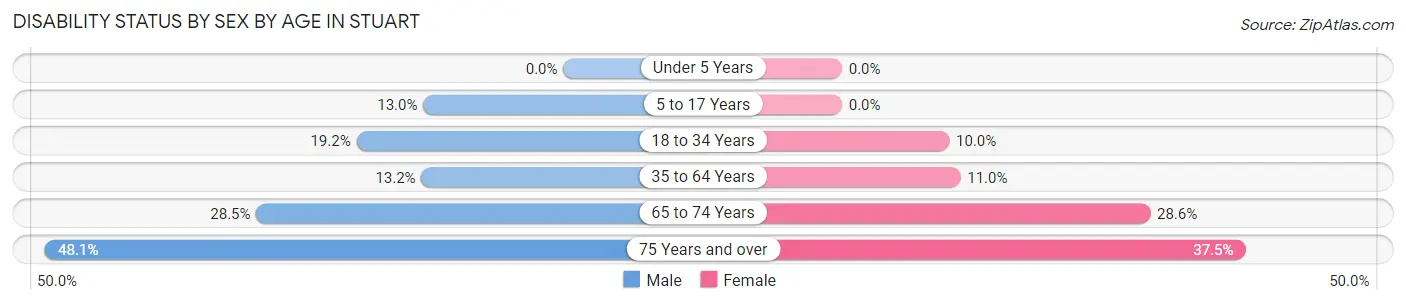
| Age Bracket | Male | Female |
| Under 5 Years | 0 (0.0%) | 0 (0.0%) |
| 5 to 17 Years | 107 (13.0%) | 0 (0.0%) |
| 18 to 34 Years | 322 (19.2%) | 135 (10.0%) |
| 35 to 64 Years | 430 (13.2%) | 390 (11.0%) |
| 65 to 74 Years | 304 (28.5%) | 339 (28.6%) |
| 75 Years and over | 482 (48.1%) | 518 (37.4%) |
Disability Class by Sex by Age in Stuart
Disability Class: Hearing Difficulty
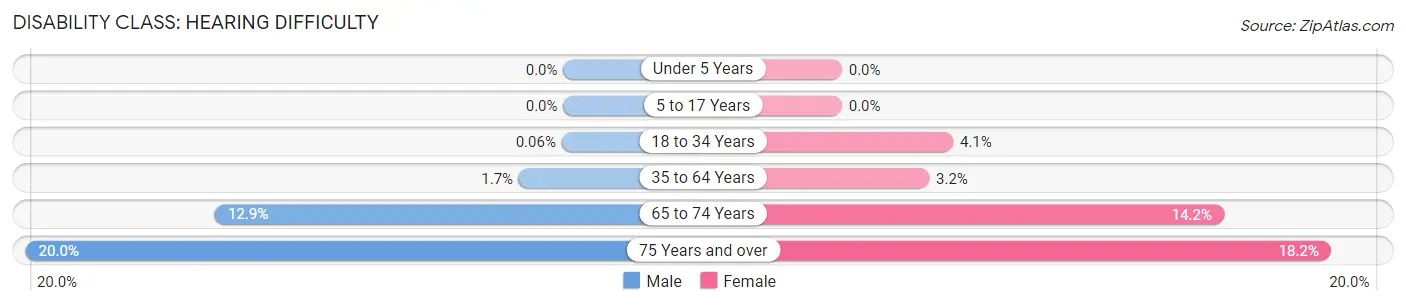
| Age Bracket | Male | Female |
| Under 5 Years | 0 (0.0%) | 0 (0.0%) |
| 5 to 17 Years | 0 (0.0%) | 0 (0.0%) |
| 18 to 34 Years | 1 (0.1%) | 56 (4.1%) |
| 35 to 64 Years | 54 (1.7%) | 115 (3.2%) |
| 65 to 74 Years | 138 (12.9%) | 168 (14.2%) |
| 75 Years and over | 200 (20.0%) | 251 (18.1%) |
Disability Class: Vision Difficulty
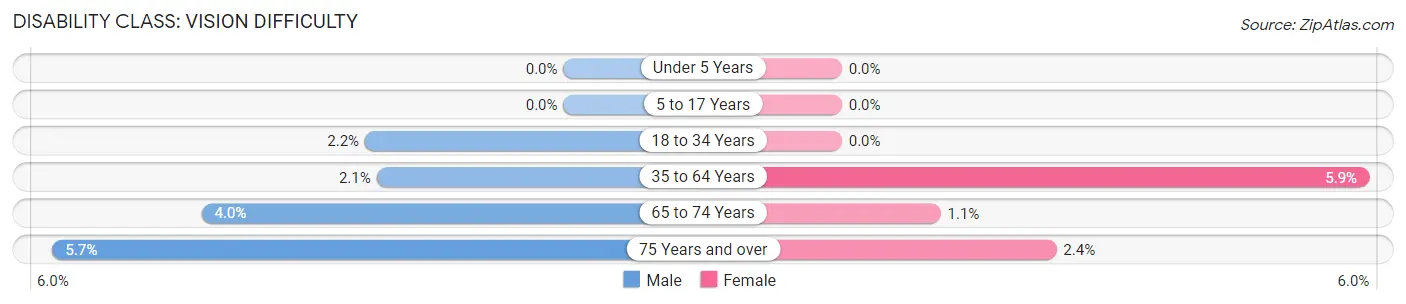
| Age Bracket | Male | Female |
| Under 5 Years | 0 (0.0%) | 0 (0.0%) |
| 5 to 17 Years | 0 (0.0%) | 0 (0.0%) |
| 18 to 34 Years | 37 (2.2%) | 0 (0.0%) |
| 35 to 64 Years | 68 (2.1%) | 208 (5.9%) |
| 65 to 74 Years | 43 (4.0%) | 13 (1.1%) |
| 75 Years and over | 57 (5.7%) | 33 (2.4%) |
Disability Class: Cognitive Difficulty
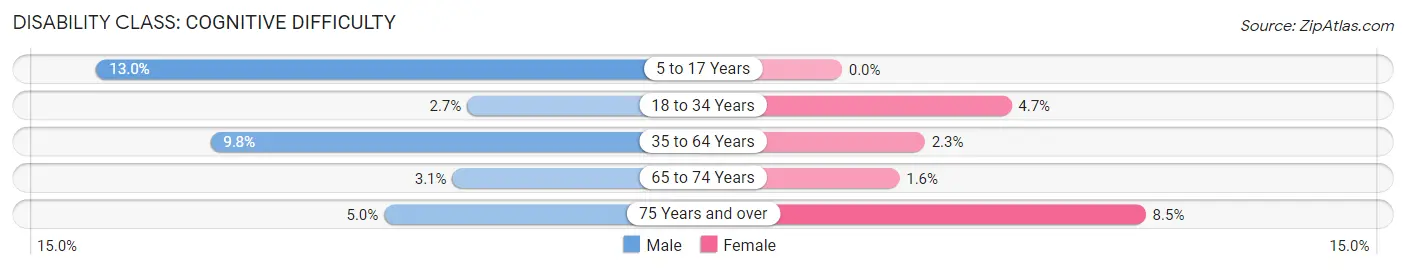
| Age Bracket | Male | Female |
| 5 to 17 Years | 107 (13.0%) | 0 (0.0%) |
| 18 to 34 Years | 45 (2.7%) | 64 (4.7%) |
| 35 to 64 Years | 321 (9.8%) | 82 (2.3%) |
| 65 to 74 Years | 33 (3.1%) | 19 (1.6%) |
| 75 Years and over | 50 (5.0%) | 117 (8.5%) |
Disability Class: Ambulatory Difficulty
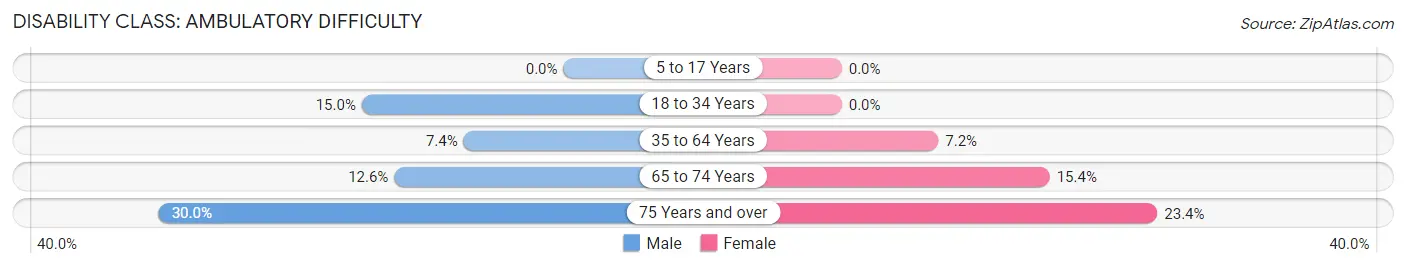
| Age Bracket | Male | Female |
| 5 to 17 Years | 0 (0.0%) | 0 (0.0%) |
| 18 to 34 Years | 251 (15.0%) | 0 (0.0%) |
| 35 to 64 Years | 242 (7.4%) | 254 (7.2%) |
| 65 to 74 Years | 134 (12.6%) | 183 (15.4%) |
| 75 Years and over | 301 (30.0%) | 324 (23.4%) |
Disability Class: Self-Care Difficulty
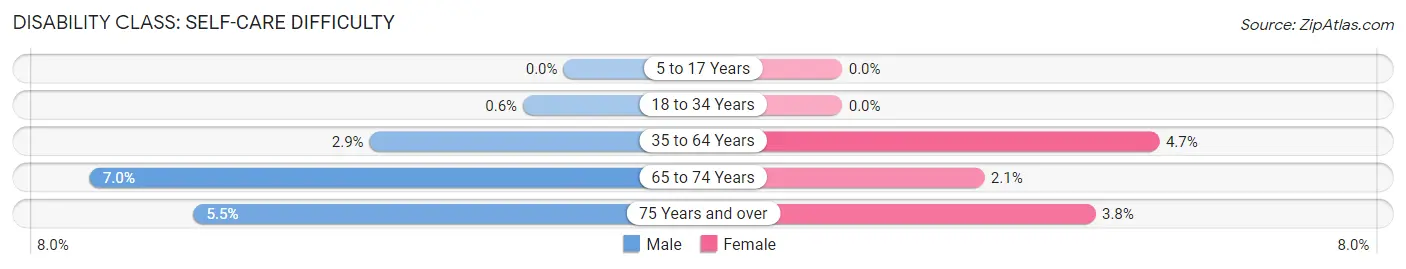
| Age Bracket | Male | Female |
| 5 to 17 Years | 0 (0.0%) | 0 (0.0%) |
| 18 to 34 Years | 10 (0.6%) | 0 (0.0%) |
| 35 to 64 Years | 94 (2.9%) | 167 (4.7%) |
| 65 to 74 Years | 75 (7.0%) | 25 (2.1%) |
| 75 Years and over | 55 (5.5%) | 52 (3.8%) |
Technology Access in Stuart
Computing Device Access in Stuart
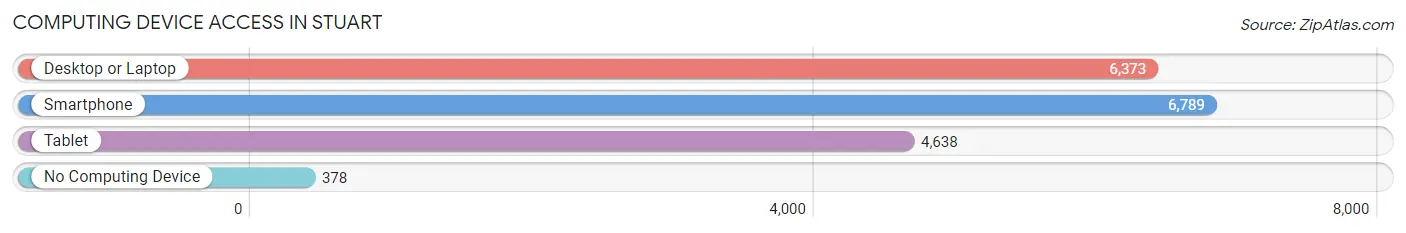
| Device Type | # Households | % Households |
| Desktop or Laptop | 6,373 | 81.2% |
| Smartphone | 6,789 | 86.5% |
| Tablet | 4,638 | 59.1% |
| No Computing Device | 378 | 4.8% |
| Total | 7,852 | 100.0% |
Internet Access in Stuart
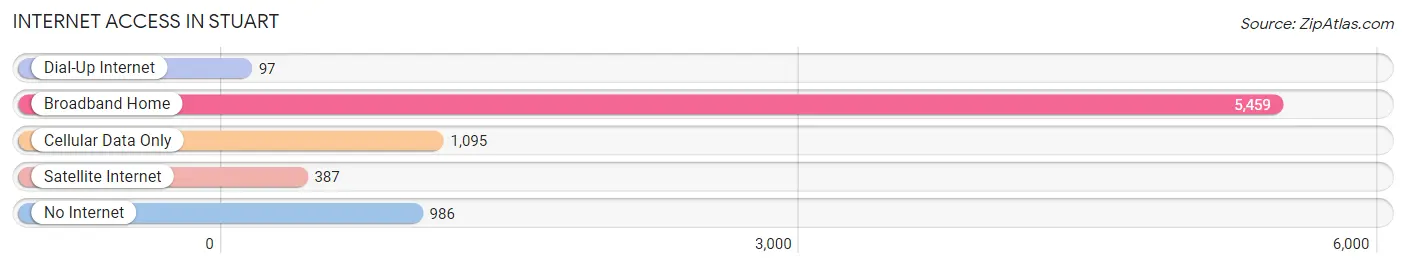
| Internet Type | # Households | % Households |
| Dial-Up Internet | 97 | 1.2% |
| Broadband Home | 5,459 | 69.5% |
| Cellular Data Only | 1,095 | 14.0% |
| Satellite Internet | 387 | 4.9% |
| No Internet | 986 | 12.6% |
| Total | 7,852 | 100.0% |
Stuart Summary
Stuart, Florida is a city located in Martin County, Florida, United States. It is the county seat of Martin County and is part of the Port St. Lucie Metropolitan Statistical Area. The population of Stuart was 15,593 at the 2010 census, making it the ninth-largest city in the state of Florida.
Geography
Stuart is located at 27°11'25" North, 80°13'48" West (27.1902, -80.2301). According to the United States Census Bureau, the city has a total area of 8.3 square miles (21.5 km2), of which 8.2 square miles (21.3 km2) is land and 0.1 square miles (0.2 km2) is water.
Stuart is located on the Atlantic coast of Florida, about halfway between West Palm Beach and Fort Pierce. It is bordered by the St. Lucie River to the north, the Indian River Lagoon to the east, and the Atlantic Ocean to the south.
Economy
Stuart is a major center for commercial fishing, and is home to several seafood processing plants. The city is also a popular destination for sport fishing, and is home to several marinas and boatyards.
The city is also home to several large employers, including Martin Memorial Medical Center, the largest employer in the county, and the Martin County School District. Other major employers include the Martin County Sheriff's Office, the Martin County Fire Rescue, and the Martin County Tax Collector.
Demographics
As of the 2010 census, there were 15,593 people, 6,845 households, and 4,072 families residing in the city. The population density was 1,890.3 people per square mile (731.2/km2). There were 7,845 housing units at an average density of 955.3 per square mile (369.2/km2). The racial makeup of the city was 79.2% White, 11.3% African American, 0.3% Native American, 1.2% Asian, 0.1% Pacific Islander, 5.7% from other races, and 2.4% from two or more races. Hispanic or Latino of any race were 16.2% of the population.
There were 6,845 households, out of which 22.2% had children under the age of 18 living with them, 43.2% were married couples living together, 12.7% had a female householder with no husband present, and 39.7% were non-families. 32.2% of all households were made up of individuals, and 14.2% had someone living alone who was 65 years of age or older. The average household size was 2.27 and the average family size was 2.86.
In the city, the population was spread out, with 20.2% under the age of 18, 7.2% from 18 to 24, 25.2% from 25 to 44, 25.3% from 45 to 64, and 22.1% who were 65 years of age or older. The median age was 42 years. For every 100 females, there were 92.2 males. For every 100 females age 18 and over, there were 88.7 males.
The median income for a household in the city was $37,890, and the median income for a family was $45,945. Males had a median income of $31,945 versus $25,890 for females. The per capita income for the city was $21,945. About 10.2% of families and 13.3% of the population were below the poverty line, including 19.2% of those under age 18 and 8.2% of those age 65 or over.
Common Questions
What is Per Capita Income in Stuart?
Per Capita income in Stuart is $41,029.
What is the Median Family Income in Stuart?
Median Family Income in Stuart is $84,080.
What is the Median Household income in Stuart?
Median Household Income in Stuart is $61,878.
What is Income or Wage Gap in Stuart?
Income or Wage Gap in Stuart is 34.9%.
Women in Stuart earn 65.1 cents for every dollar earned by a man.
What is Inequality or Gini Index in Stuart?
Inequality or Gini Index in Stuart is 0.49.
What is the Total Population of Stuart?
Total Population of Stuart is 17,639.
What is the Total Male Population of Stuart?
Total Male Population of Stuart is 8,530.
What is the Total Female Population of Stuart?
Total Female Population of Stuart is 9,109.
What is the Ratio of Males per 100 Females in Stuart?
There are 93.64 Males per 100 Females in Stuart.
What is the Ratio of Females per 100 Males in Stuart?
There are 106.79 Females per 100 Males in Stuart.
What is the Median Population Age in Stuart?
Median Population Age in Stuart is 51.8 Years.
What is the Average Family Size in Stuart
Average Family Size in Stuart is 2.8 People.
What is the Average Household Size in Stuart
Average Household Size in Stuart is 2.2 People.
How Large is the Labor Force in Stuart?
There are 8,595 People in the Labor Forcein in Stuart.
What is the Percentage of People in the Labor Force in Stuart?
57.0% of People are in the Labor Force in Stuart.
What is the Unemployment Rate in Stuart?
Unemployment Rate in Stuart is 4.4%.