Sneads, FL Map & Demographics
Sneads Map
Sneads Overview
$30,366
PER CAPITA INCOME
$64,000
AVG FAMILY INCOME
$41,827
AVG HOUSEHOLD INCOME
5.0%
WAGE / INCOME GAP [ % ]
95.0¢/ $1
WAGE / INCOME GAP [ $ ]
0.46
INEQUALITY / GINI INDEX
1,744
TOTAL POPULATION
807
MALE POPULATION
937
FEMALE POPULATION
86.13
MALES / 100 FEMALES
116.11
FEMALES / 100 MALES
38.8
MEDIAN AGE
2.8
AVG FAMILY SIZE
2.2
AVG HOUSEHOLD SIZE
799
LABOR FORCE [ PEOPLE ]
58.0%
PERCENT IN LABOR FORCE
5.9%
UNEMPLOYMENT RATE
Sneads Zip Codes
Sneads Area Codes
Income in Sneads
Income Overview in Sneads
Per Capita Income in Sneads is $30,366, while median incomes of families and households are $64,000 and $41,827 respectively.
| Characteristic | Number | Measure |
| Per Capita Income | 1,744 | $30,366 |
| Median Family Income | 486 | $64,000 |
| Mean Family Income | 486 | $82,640 |
| Median Household Income | 806 | $41,827 |
| Mean Household Income | 806 | $66,368 |
| Income Deficit | 486 | $0 |
| Wage / Income Gap (%) | 1,744 | 5.05% |
| Wage / Income Gap ($) | 1,744 | 94.95¢ per $1 |
| Gini / Inequality Index | 1,744 | 0.46 |
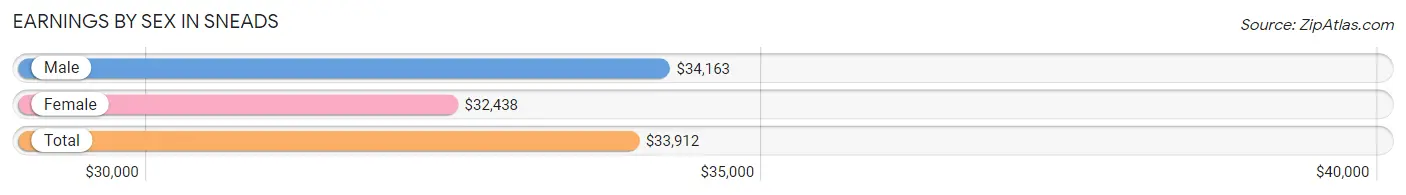
Earnings by Sex in Sneads
Average Earnings in Sneads are $33,912, $34,163 for men and $32,438 for women, a difference of 5.1%.
| Sex | Number | Average Earnings |
| Male | 379 (47.3%) | $34,163 |
| Female | 422 (52.7%) | $32,438 |
| Total | 801 (100.0%) | $33,912 |
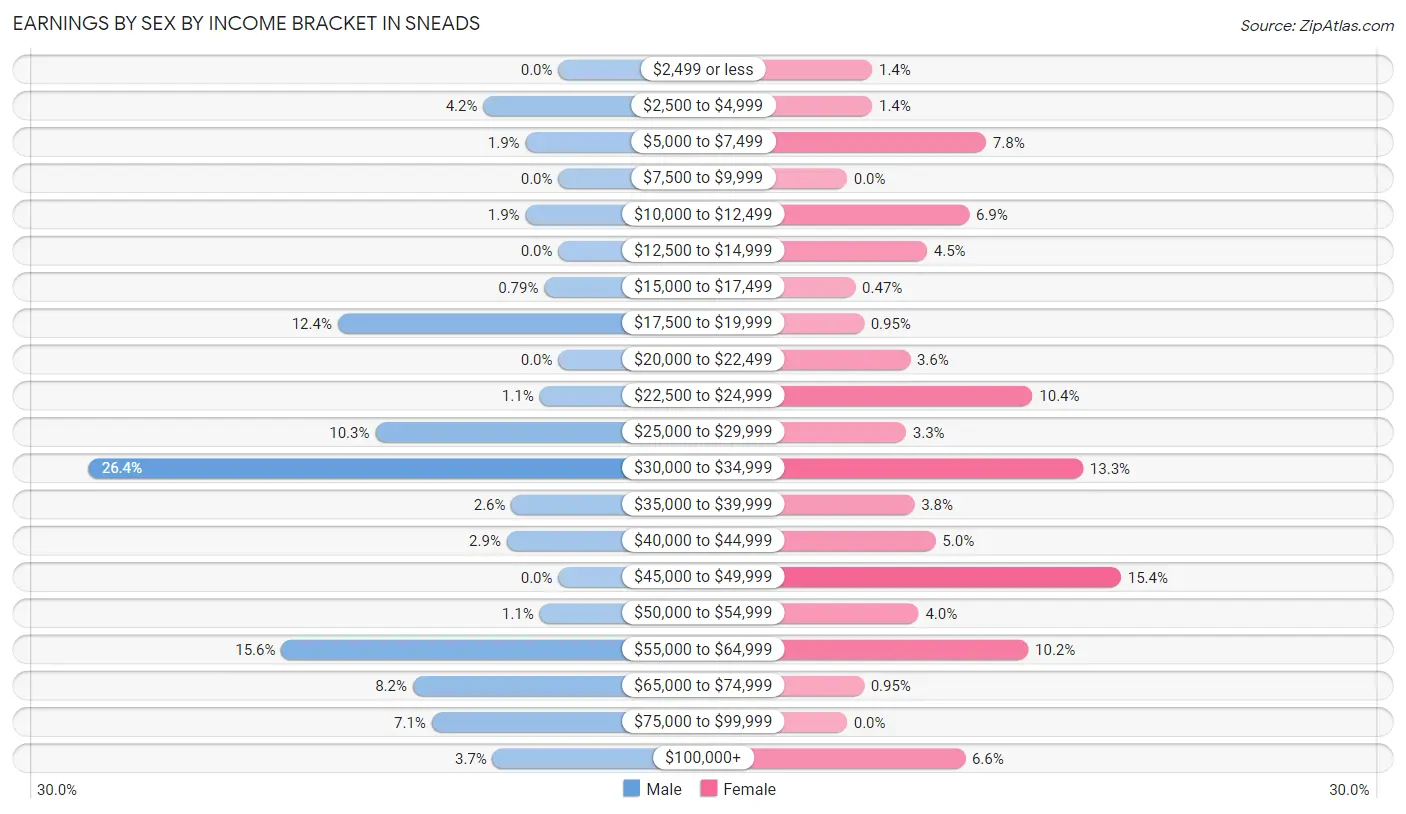
Earnings by Sex by Income Bracket in Sneads
The most common earnings brackets in Sneads are $30,000 to $34,999 for men (100 | 26.4%) and $45,000 to $49,999 for women (65 | 15.4%).
| Income | Male | Female |
| $2,499 or less | 0 (0.0%) | 6 (1.4%) |
| $2,500 to $4,999 | 16 (4.2%) | 6 (1.4%) |
| $5,000 to $7,499 | 7 (1.8%) | 33 (7.8%) |
| $7,500 to $9,999 | 0 (0.0%) | 0 (0.0%) |
| $10,000 to $12,499 | 7 (1.8%) | 29 (6.9%) |
| $12,500 to $14,999 | 0 (0.0%) | 19 (4.5%) |
| $15,000 to $17,499 | 3 (0.8%) | 2 (0.5%) |
| $17,500 to $19,999 | 47 (12.4%) | 4 (0.9%) |
| $20,000 to $22,499 | 0 (0.0%) | 15 (3.5%) |
| $22,500 to $24,999 | 4 (1.1%) | 44 (10.4%) |
| $25,000 to $29,999 | 39 (10.3%) | 14 (3.3%) |
| $30,000 to $34,999 | 100 (26.4%) | 56 (13.3%) |
| $35,000 to $39,999 | 10 (2.6%) | 16 (3.8%) |
| $40,000 to $44,999 | 11 (2.9%) | 21 (5.0%) |
| $45,000 to $49,999 | 0 (0.0%) | 65 (15.4%) |
| $50,000 to $54,999 | 4 (1.1%) | 17 (4.0%) |
| $55,000 to $64,999 | 59 (15.6%) | 43 (10.2%) |
| $65,000 to $74,999 | 31 (8.2%) | 4 (0.9%) |
| $75,000 to $99,999 | 27 (7.1%) | 0 (0.0%) |
| $100,000+ | 14 (3.7%) | 28 (6.6%) |
| Total | 379 (100.0%) | 422 (100.0%) |
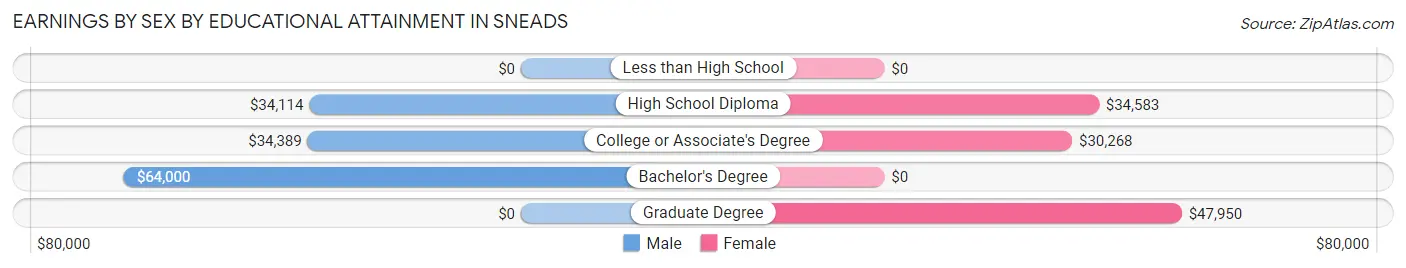
Earnings by Sex by Educational Attainment in Sneads
Average earnings in Sneads are $34,275 for men and $32,344 for women, a difference of 5.6%. Men with an educational attainment of bachelor's degree enjoy the highest average annual earnings of $64,000, while those with high school diploma education earn the least with $34,114. Women with an educational attainment of graduate degree earn the most with the average annual earnings of $47,950, while those with college or associate's degree education have the smallest earnings of $30,268.
| Educational Attainment | Male Income | Female Income |
| Less than High School | - | - |
| High School Diploma | $34,114 | $34,583 |
| College or Associate's Degree | $34,389 | $30,268 |
| Bachelor's Degree | $64,000 | $0 |
| Graduate Degree | - | - |
| Total | $34,275 | $32,344 |
Family Income in Sneads
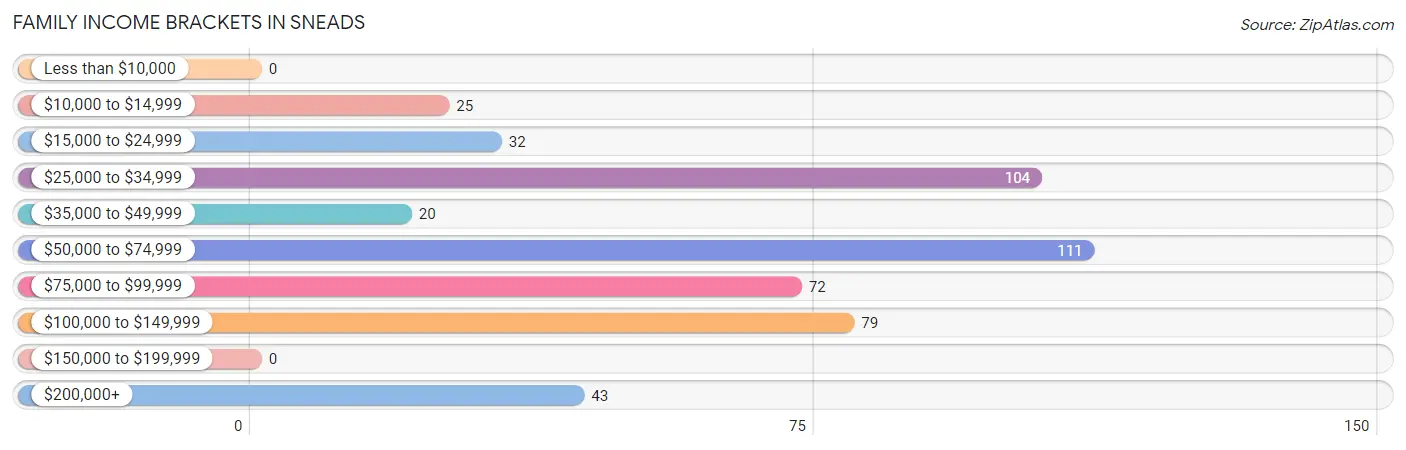
Family Income Brackets in Sneads
According to the Sneads family income data, there are 111 families falling into the $50,000 to $74,999 income range, which is the most common income bracket and makes up 22.8% of all families.
| Income Bracket | # Families | % Families |
| Less than $10,000 | 0 | 0.0% |
| $10,000 to $14,999 | 25 | 5.1% |
| $15,000 to $24,999 | 32 | 6.6% |
| $25,000 to $34,999 | 104 | 21.4% |
| $35,000 to $49,999 | 20 | 4.1% |
| $50,000 to $74,999 | 111 | 22.8% |
| $75,000 to $99,999 | 72 | 14.8% |
| $100,000 to $149,999 | 79 | 16.3% |
| $150,000 to $199,999 | 0 | 0.0% |
| $200,000+ | 43 | 8.8% |
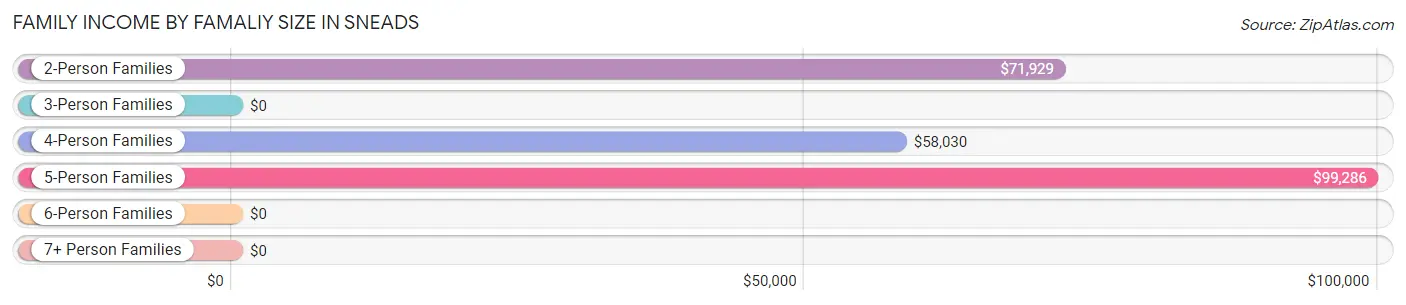
Family Income by Famaliy Size in Sneads
5-person families (32 | 6.6%) account for the highest median family income in Sneads with $99,286 per family, while 2-person families (258 | 53.1%) have the highest median income of $35,964 per family member.
| Income Bracket | # Families | Median Income |
| 2-Person Families | 258 (53.1%) | $71,929 |
| 3-Person Families | 100 (20.6%) | $0 |
| 4-Person Families | 96 (19.8%) | $58,030 |
| 5-Person Families | 32 (6.6%) | $99,286 |
| 6-Person Families | 0 (0.0%) | $0 |
| 7+ Person Families | 0 (0.0%) | $0 |
| Total | 486 (100.0%) | $64,000 |
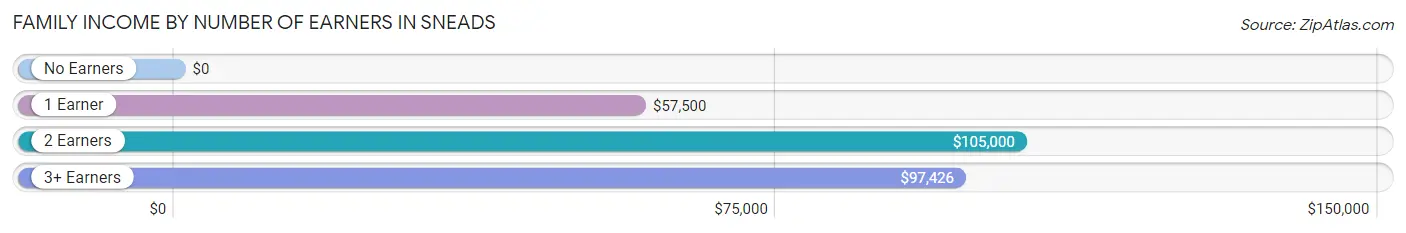
Family Income by Number of Earners in Sneads
| Number of Earners | # Families | Median Income |
| No Earners | 91 (18.7%) | $0 |
| 1 Earner | 252 (51.8%) | $57,500 |
| 2 Earners | 108 (22.2%) | $105,000 |
| 3+ Earners | 35 (7.2%) | $97,426 |
| Total | 486 (100.0%) | $64,000 |
Household Income in Sneads
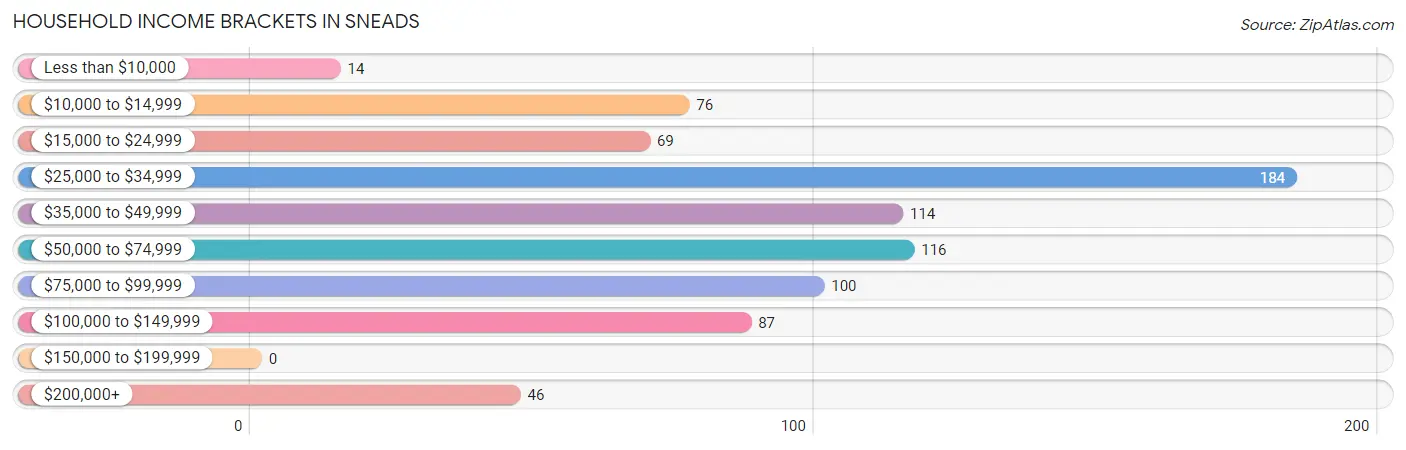
Household Income Brackets in Sneads
With 184 households falling in the category, the $25,000 to $34,999 income range is the most frequent in Sneads, accounting for 22.8% of all households.
| Income Bracket | # Households | % Households |
| Less than $10,000 | 14 | 1.7% |
| $10,000 to $14,999 | 76 | 9.4% |
| $15,000 to $24,999 | 69 | 8.6% |
| $25,000 to $34,999 | 184 | 22.8% |
| $35,000 to $49,999 | 114 | 14.1% |
| $50,000 to $74,999 | 116 | 14.4% |
| $75,000 to $99,999 | 100 | 12.4% |
| $100,000 to $149,999 | 87 | 10.8% |
| $150,000 to $199,999 | 0 | 0.0% |
| $200,000+ | 46 | 5.7% |
Household Income by Householder Age in Sneads
The median household income in Sneads is $41,827, with the highest median household income of $51,250 found in the 45 to 64 years age bracket for the primary householder. A total of 296 households (36.7%) fall into this category. Meanwhile, the 15 to 24 years age bracket for the primary householder has the lowest median household income of $0, with 19 households (2.4%) in this group.
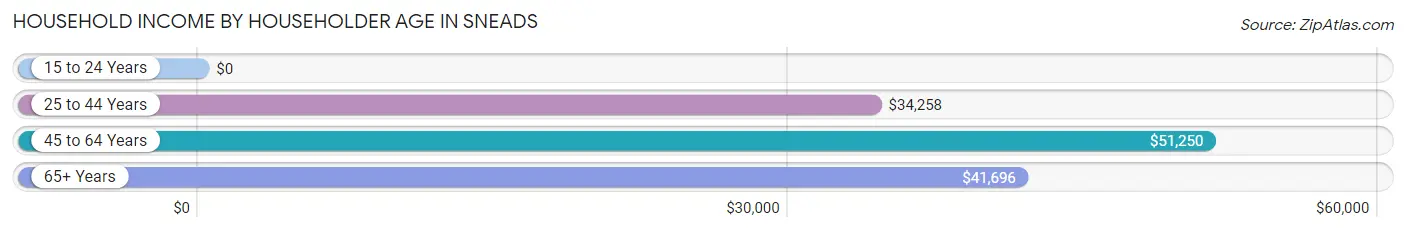
| Income Bracket | # Households | Median Income |
| 15 to 24 Years | 19 (2.4%) | $0 |
| 25 to 44 Years | 274 (34.0%) | $34,258 |
| 45 to 64 Years | 296 (36.7%) | $51,250 |
| 65+ Years | 217 (26.9%) | $41,696 |
| Total | 806 (100.0%) | $41,827 |
Poverty in Sneads
Income Below Poverty by Sex and Age in Sneads
With 9.4% poverty level for males and 20.0% for females among the residents of Sneads, 6 to 11 year old males and 5 year old females are the most vulnerable to poverty, with 21 males (35.6%) and 6 females (100.0%) in their respective age groups living below the poverty level.
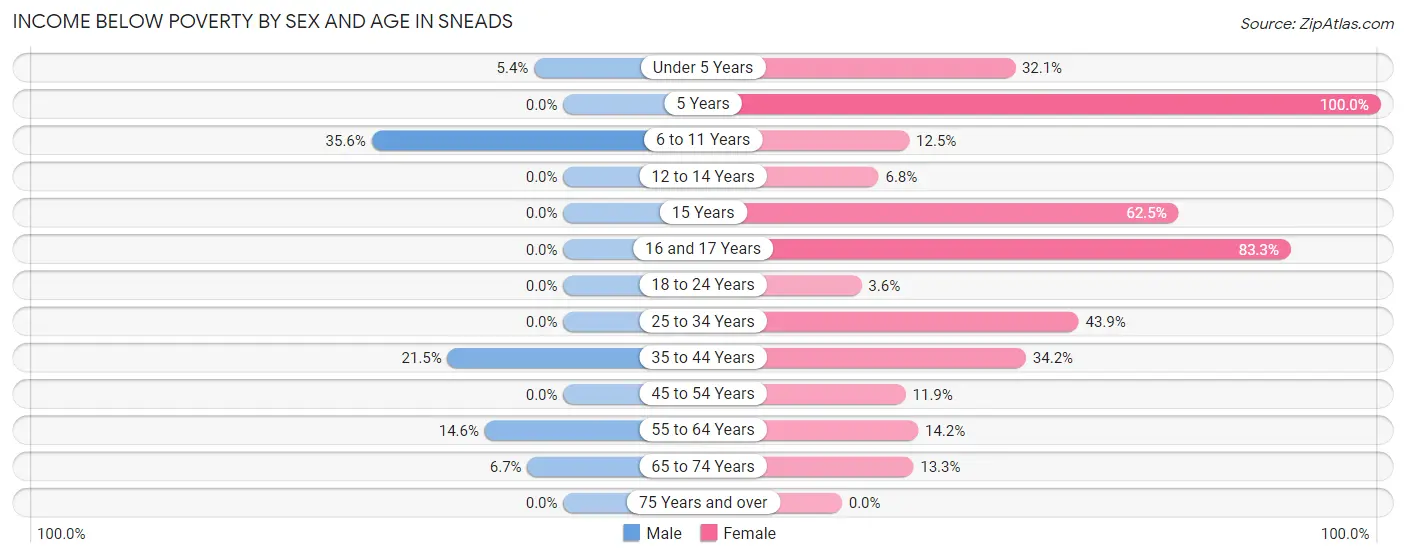
| Age Bracket | Male | Female |
| Under 5 Years | 6 (5.4%) | 9 (32.1%) |
| 5 Years | 0 (0.0%) | 6 (100.0%) |
| 6 to 11 Years | 21 (35.6%) | 11 (12.5%) |
| 12 to 14 Years | 0 (0.0%) | 3 (6.8%) |
| 15 Years | 0 (0.0%) | 5 (62.5%) |
| 16 and 17 Years | 0 (0.0%) | 5 (83.3%) |
| 18 to 24 Years | 0 (0.0%) | 2 (3.6%) |
| 25 to 34 Years | 0 (0.0%) | 58 (43.9%) |
| 35 to 44 Years | 32 (21.5%) | 41 (34.2%) |
| 45 to 54 Years | 0 (0.0%) | 16 (11.8%) |
| 55 to 64 Years | 14 (14.6%) | 16 (14.2%) |
| 65 to 74 Years | 3 (6.7%) | 15 (13.3%) |
| 75 Years and over | 0 (0.0%) | 0 (0.0%) |
| Total | 76 (9.4%) | 187 (20.0%) |
Income Above Poverty by Sex and Age in Sneads
According to the poverty statistics in Sneads, males aged 5 years and females aged 75 years and over are the age groups that are most secure financially, with 100.0% of males and 100.0% of females in these age groups living above the poverty line.
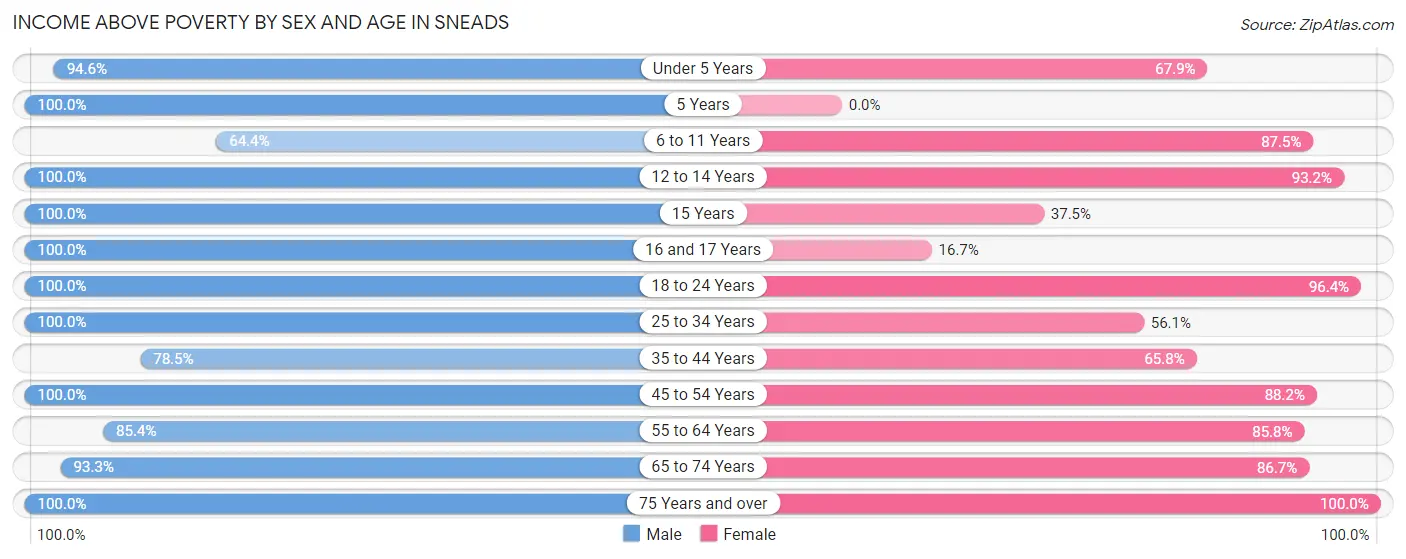
| Age Bracket | Male | Female |
| Under 5 Years | 105 (94.6%) | 19 (67.9%) |
| 5 Years | 5 (100.0%) | 0 (0.0%) |
| 6 to 11 Years | 38 (64.4%) | 77 (87.5%) |
| 12 to 14 Years | 13 (100.0%) | 41 (93.2%) |
| 15 Years | 5 (100.0%) | 3 (37.5%) |
| 16 and 17 Years | 13 (100.0%) | 1 (16.7%) |
| 18 to 24 Years | 52 (100.0%) | 53 (96.4%) |
| 25 to 34 Years | 110 (100.0%) | 74 (56.1%) |
| 35 to 44 Years | 117 (78.5%) | 79 (65.8%) |
| 45 to 54 Years | 59 (100.0%) | 119 (88.1%) |
| 55 to 64 Years | 82 (85.4%) | 97 (85.8%) |
| 65 to 74 Years | 42 (93.3%) | 98 (86.7%) |
| 75 Years and over | 90 (100.0%) | 89 (100.0%) |
| Total | 731 (90.6%) | 750 (80.0%) |
Income Below Poverty Among Married-Couple Families in Sneads
The poverty statistics for married-couple families in Sneads show that 0.6% or 2 of the total 347 families live below the poverty line. Families with 3 or 4 children have the highest poverty rate of 28.6%, comprising of 2 families. On the other hand, families with no children have the lowest poverty rate of 0.0%, which includes 0 families.
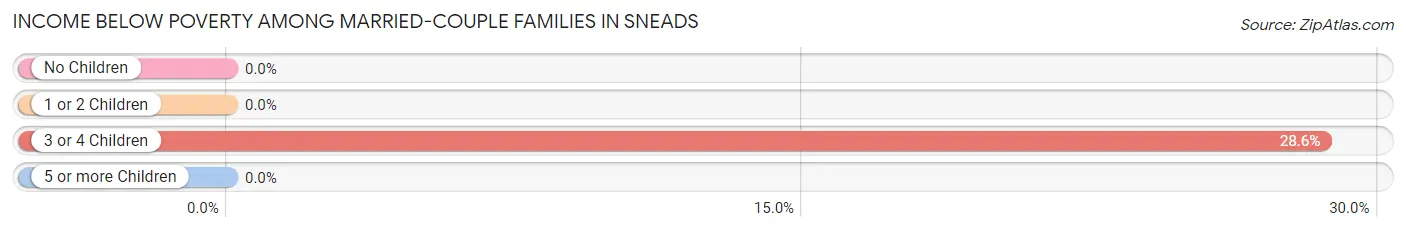
| Children | Above Poverty | Below Poverty |
| No Children | 223 (100.0%) | 0 (0.0%) |
| 1 or 2 Children | 117 (100.0%) | 0 (0.0%) |
| 3 or 4 Children | 5 (71.4%) | 2 (28.6%) |
| 5 or more Children | 0 (0.0%) | 0 (0.0%) |
| Total | 345 (99.4%) | 2 (0.6%) |
Income Below Poverty Among Single-Parent Households in Sneads
According to the poverty data in Sneads, 47.8% or 32 single-father households and 31.9% or 23 single-mother households are living below the poverty line. Among single-father households, those with 1 or 2 children have the highest poverty rate, with 32 households (50.0%) experiencing poverty. Likewise, among single-mother households, those with 1 or 2 children have the highest poverty rate, with 23 households (45.1%) falling below the poverty line.
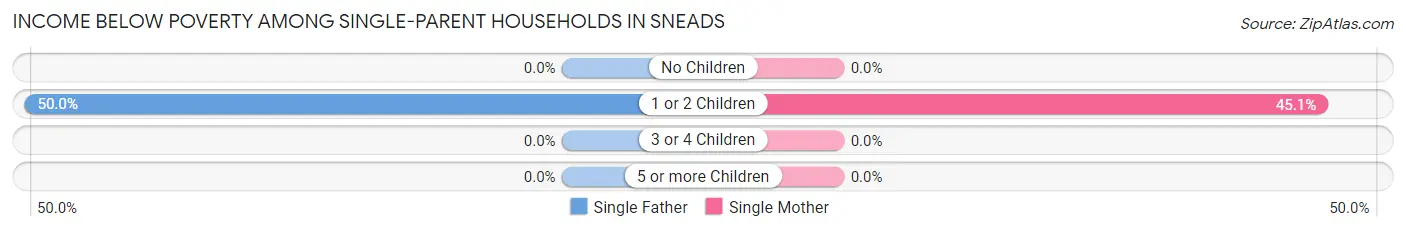
| Children | Single Father | Single Mother |
| No Children | 0 (0.0%) | 0 (0.0%) |
| 1 or 2 Children | 32 (50.0%) | 23 (45.1%) |
| 3 or 4 Children | 0 (0.0%) | 0 (0.0%) |
| 5 or more Children | 0 (0.0%) | 0 (0.0%) |
| Total | 32 (47.8%) | 23 (31.9%) |
Income Below Poverty Among Married-Couple vs Single-Parent Households in Sneads
The poverty data for Sneads shows that 2 of the married-couple family households (0.6%) and 55 of the single-parent households (39.6%) are living below the poverty level. Within the married-couple family households, those with 3 or 4 children have the highest poverty rate, with 2 households (28.6%) falling below the poverty line. Among the single-parent households, those with 1 or 2 children have the highest poverty rate, with 55 household (47.8%) living below poverty.
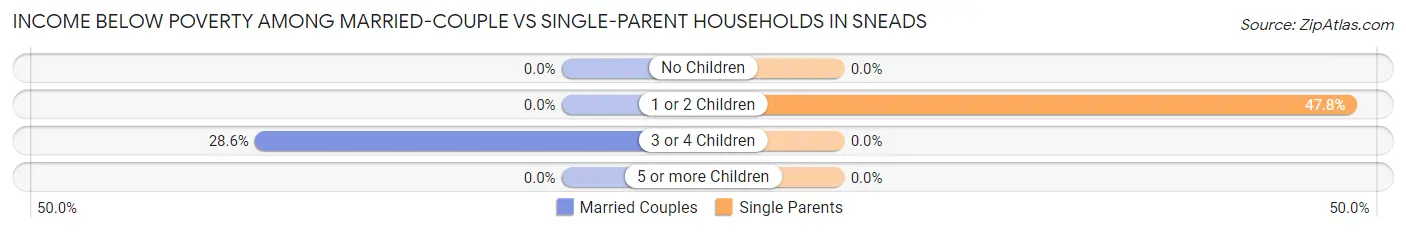
| Children | Married-Couple Families | Single-Parent Households |
| No Children | 0 (0.0%) | 0 (0.0%) |
| 1 or 2 Children | 0 (0.0%) | 55 (47.8%) |
| 3 or 4 Children | 2 (28.6%) | 0 (0.0%) |
| 5 or more Children | 0 (0.0%) | 0 (0.0%) |
| Total | 2 (0.6%) | 55 (39.6%) |
Race in Sneads
The most populous races in Sneads are White / Caucasian (1,350 | 77.4%), Black / African American (327 | 18.8%), and Asian (48 | 2.8%).
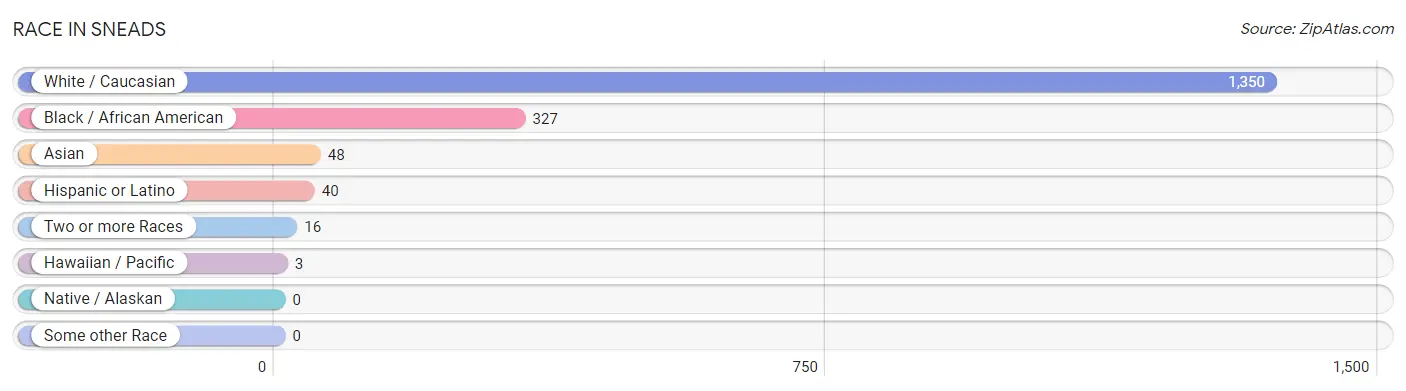
| Race | # Population | % Population |
| Asian | 48 | 2.8% |
| Black / African American | 327 | 18.8% |
| Hawaiian / Pacific | 3 | 0.2% |
| Hispanic or Latino | 40 | 2.3% |
| Native / Alaskan | 0 | 0.0% |
| White / Caucasian | 1,350 | 77.4% |
| Two or more Races | 16 | 0.9% |
| Some other Race | 0 | 0.0% |
| Total | 1,744 | 100.0% |
Ancestry in Sneads
The most populous ancestries reported in Sneads are American (349 | 20.0%), English (162 | 9.3%), French (73 | 4.2%), Thai (48 | 2.8%), and Irish (43 | 2.5%), together accounting for 38.7% of all Sneads residents.
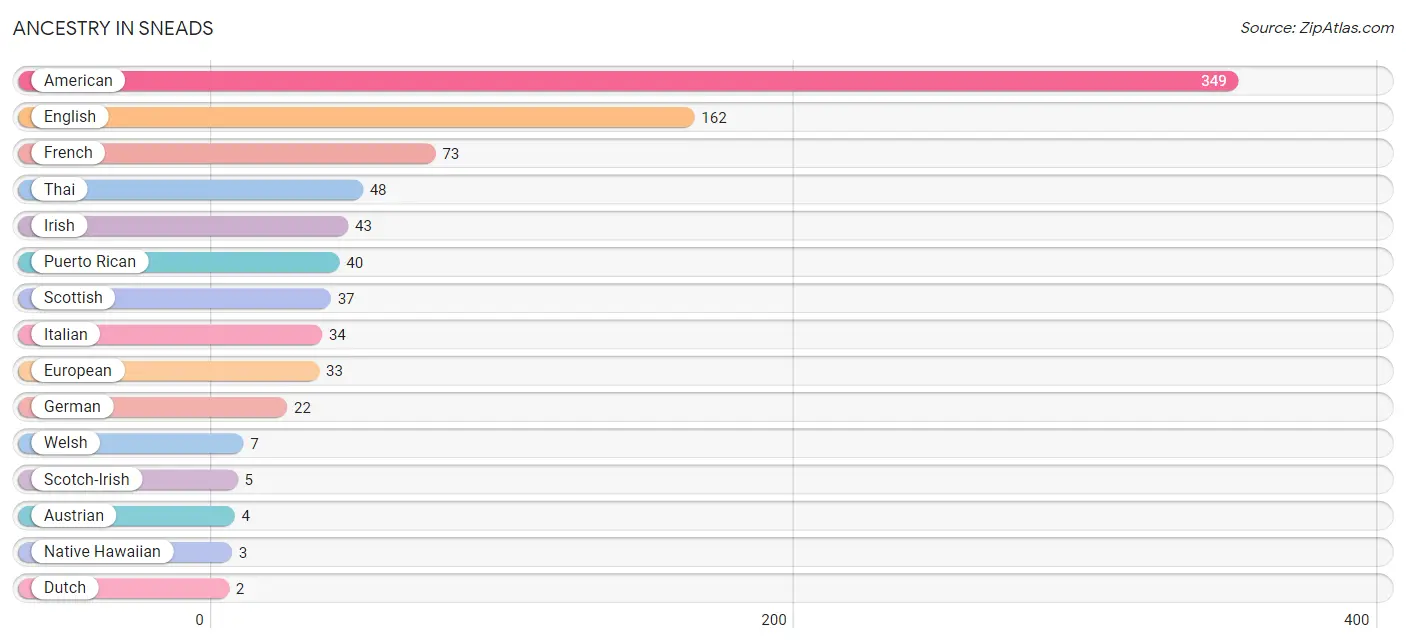
| Ancestry | # Population | % Population |
| American | 349 | 20.0% |
| Austrian | 4 | 0.2% |
| Dutch | 2 | 0.1% |
| English | 162 | 9.3% |
| European | 33 | 1.9% |
| French | 73 | 4.2% |
| German | 22 | 1.3% |
| Irish | 43 | 2.5% |
| Italian | 34 | 1.9% |
| Native Hawaiian | 3 | 0.2% |
| Puerto Rican | 40 | 2.3% |
| Scotch-Irish | 5 | 0.3% |
| Scottish | 37 | 2.1% |
| Thai | 48 | 2.8% |
| Welsh | 7 | 0.4% | View All 15 Rows |
Immigrants in Sneads
The most numerous immigrant groups reported in Sneads came from Asia (48 | 2.8%), India (48 | 2.8%), and South Central Asia (48 | 2.8%), together accounting for 8.3% of all Sneads residents.
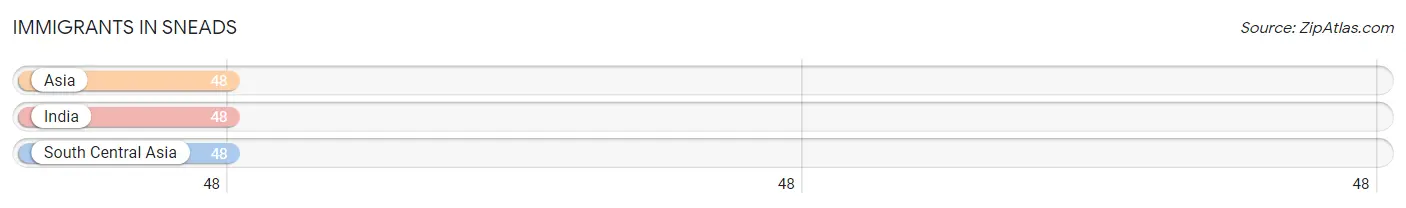
| Immigration Origin | # Population | % Population |
| Asia | 48 | 2.8% |
| India | 48 | 2.8% |
| South Central Asia | 48 | 2.8% | View All 3 Rows |
Sex and Age in Sneads
Sex and Age in Sneads
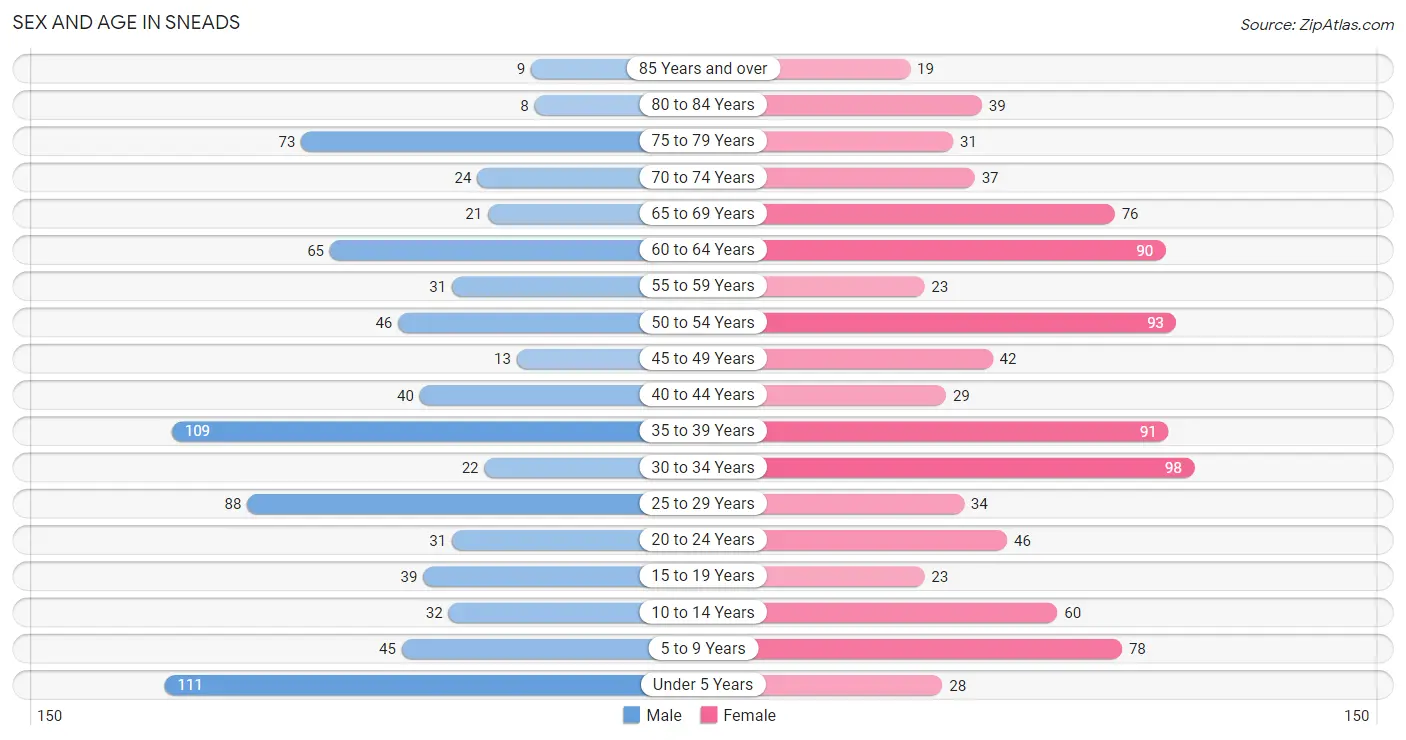
The most populous age groups in Sneads are Under 5 Years (111 | 13.8%) for men and 30 to 34 Years (98 | 10.5%) for women.
| Age Bracket | Male | Female |
| Under 5 Years | 111 (13.8%) | 28 (3.0%) |
| 5 to 9 Years | 45 (5.6%) | 78 (8.3%) |
| 10 to 14 Years | 32 (4.0%) | 60 (6.4%) |
| 15 to 19 Years | 39 (4.8%) | 23 (2.5%) |
| 20 to 24 Years | 31 (3.8%) | 46 (4.9%) |
| 25 to 29 Years | 88 (10.9%) | 34 (3.6%) |
| 30 to 34 Years | 22 (2.7%) | 98 (10.5%) |
| 35 to 39 Years | 109 (13.5%) | 91 (9.7%) |
| 40 to 44 Years | 40 (5.0%) | 29 (3.1%) |
| 45 to 49 Years | 13 (1.6%) | 42 (4.5%) |
| 50 to 54 Years | 46 (5.7%) | 93 (9.9%) |
| 55 to 59 Years | 31 (3.8%) | 23 (2.5%) |
| 60 to 64 Years | 65 (8.1%) | 90 (9.6%) |
| 65 to 69 Years | 21 (2.6%) | 76 (8.1%) |
| 70 to 74 Years | 24 (3.0%) | 37 (4.0%) |
| 75 to 79 Years | 73 (9.0%) | 31 (3.3%) |
| 80 to 84 Years | 8 (1.0%) | 39 (4.2%) |
| 85 Years and over | 9 (1.1%) | 19 (2.0%) |
| Total | 807 (100.0%) | 937 (100.0%) |
Families and Households in Sneads
Median Family Size in Sneads
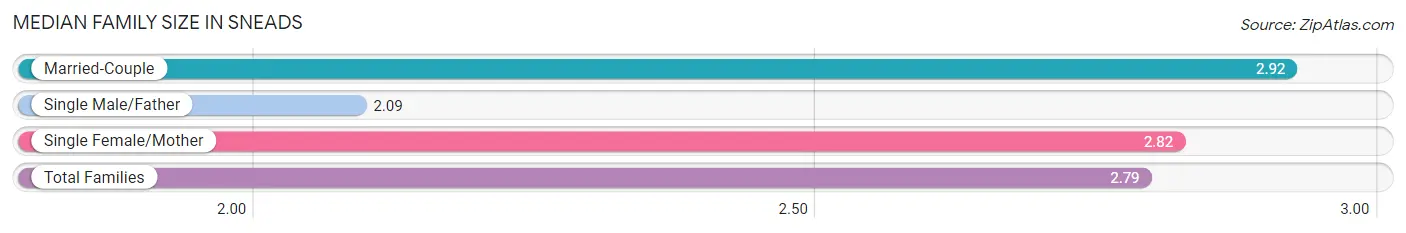
The median family size in Sneads is 2.79 persons per family, with married-couple families (347 | 71.4%) accounting for the largest median family size of 2.92 persons per family. On the other hand, single male/father families (67 | 13.8%) represent the smallest median family size with 2.09 persons per family.
| Family Type | # Families | Family Size |
| Married-Couple | 347 (71.4%) | 2.92 |
| Single Male/Father | 67 (13.8%) | 2.09 |
| Single Female/Mother | 72 (14.8%) | 2.82 |
| Total Families | 486 (100.0%) | 2.79 |
Median Household Size in Sneads
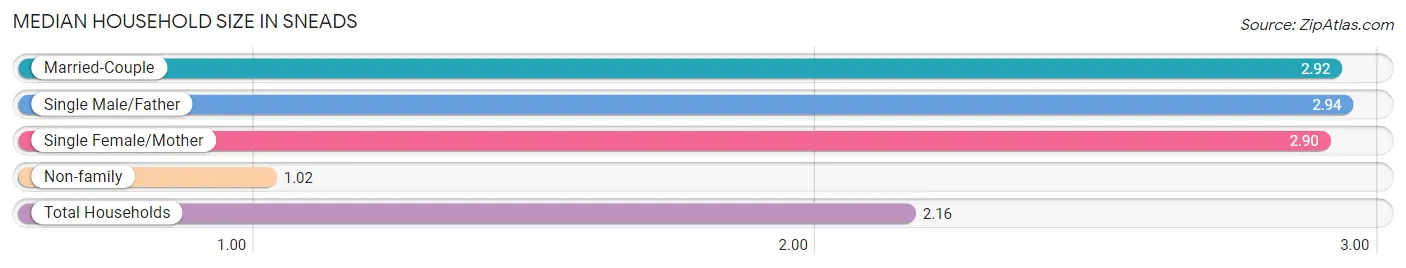
The median household size in Sneads is 2.16 persons per household, with single male/father households (67 | 8.3%) accounting for the largest median household size of 2.94 persons per household. non-family households (320 | 39.7%) represent the smallest median household size with 1.02 persons per household.
| Household Type | # Households | Household Size |
| Married-Couple | 347 (43.0%) | 2.92 |
| Single Male/Father | 67 (8.3%) | 2.94 |
| Single Female/Mother | 72 (8.9%) | 2.90 |
| Non-family | 320 (39.7%) | 1.02 |
| Total Households | 806 (100.0%) | 2.16 |
Household Size by Marriage Status in Sneads
Out of a total of 806 households in Sneads, 486 (60.3%) are family households, while 320 (39.7%) are nonfamily households. The most numerous type of family households are 2-person households, comprising 229, and the most common type of nonfamily households are 1-person households, comprising 313.
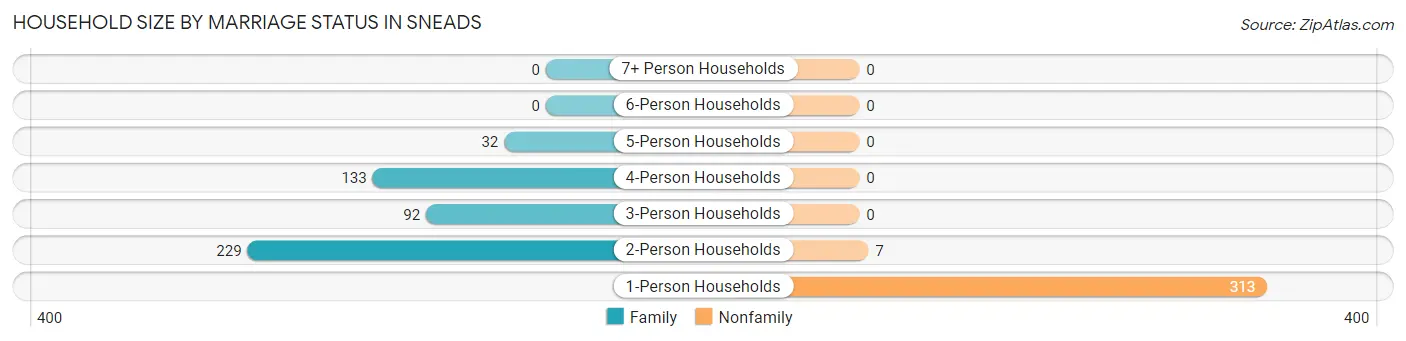
| Household Size | Family Households | Nonfamily Households |
| 1-Person Households | - | 313 (38.8%) |
| 2-Person Households | 229 (28.4%) | 7 (0.9%) |
| 3-Person Households | 92 (11.4%) | 0 (0.0%) |
| 4-Person Households | 133 (16.5%) | 0 (0.0%) |
| 5-Person Households | 32 (4.0%) | 0 (0.0%) |
| 6-Person Households | 0 (0.0%) | 0 (0.0%) |
| 7+ Person Households | 0 (0.0%) | 0 (0.0%) |
| Total | 486 (60.3%) | 320 (39.7%) |
Female Fertility in Sneads
Fertility by Age in Sneads
Average fertility rate in Sneads is 197.0 births per 1,000 women. Women in the age bracket of 20 to 34 years have the highest fertility rate with 236.0 births per 1,000 women. Women in the age bracket of 20 to 34 years acount for 56.0% of all women with births.
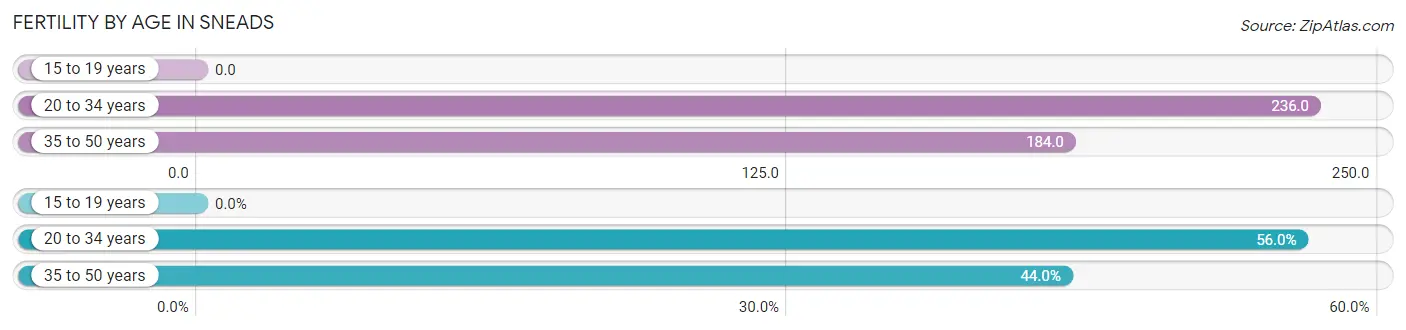
| Age Bracket | Women with Births | Births / 1,000 Women |
| 15 to 19 years | 0 (0.0%) | 0.0 |
| 20 to 34 years | 42 (56.0%) | 236.0 |
| 35 to 50 years | 33 (44.0%) | 184.0 |
| Total | 75 (100.0%) | 197.0 |
Fertility by Age by Marriage Status in Sneads
80.0% of women with births (75) in Sneads are married. The highest percentage of unmarried women with births falls into 20 to 34 years age bracket with 35.7% of them unmarried at the time of birth, while the lowest percentage of unmarried women with births belong to 35 to 50 years age bracket with 0.0% of them unmarried.
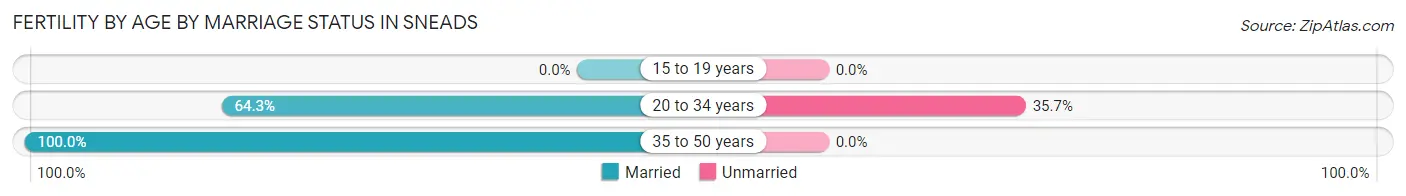
| Age Bracket | Married | Unmarried |
| 15 to 19 years | 0 (0.0%) | 0 (0.0%) |
| 20 to 34 years | 27 (64.3%) | 15 (35.7%) |
| 35 to 50 years | 33 (100.0%) | 0 (0.0%) |
| Total | 60 (80.0%) | 15 (20.0%) |
Fertility by Education in Sneads
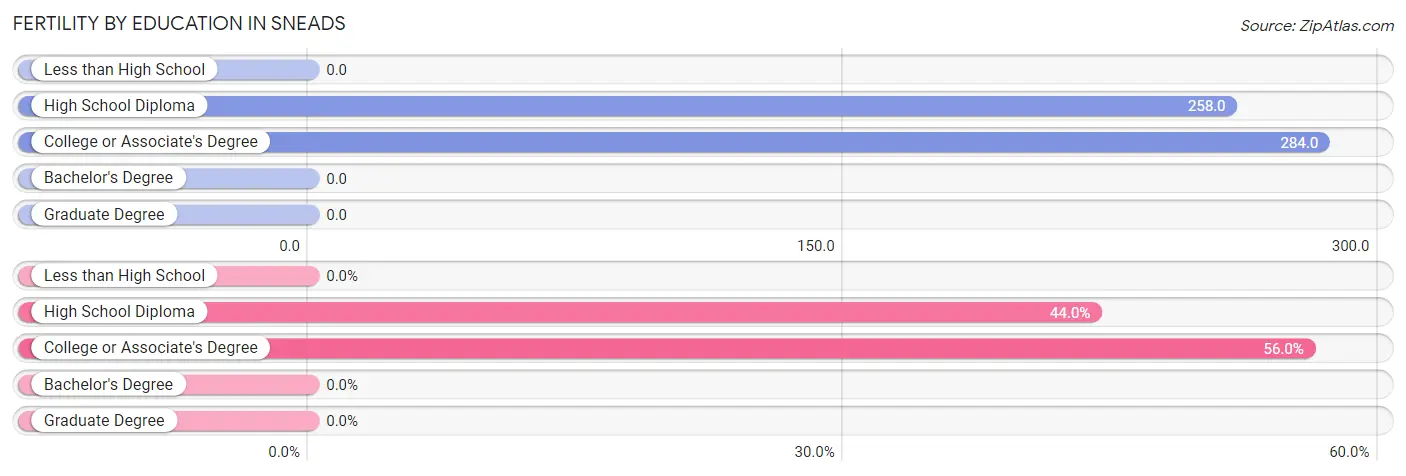
| Educational Attainment | Women with Births | Births / 1,000 Women |
| Less than High School | 0 (0.0%) | 0.0 |
| High School Diploma | 33 (44.0%) | 258.0 |
| College or Associate's Degree | 42 (56.0%) | 284.0 |
| Bachelor's Degree | 0 (0.0%) | 0.0 |
| Graduate Degree | 0 (0.0%) | 0.0 |
| Total | 75 (100.0%) | 197.0 |
Fertility by Education by Marriage Status in Sneads
20.0% of women with births in Sneads are unmarried. Women with the educational attainment of high school diploma are most likely to be married with 100.0% of them married at childbirth, while women with the educational attainment of college or associate's degree are least likely to be married with 35.7% of them unmarried at childbirth.
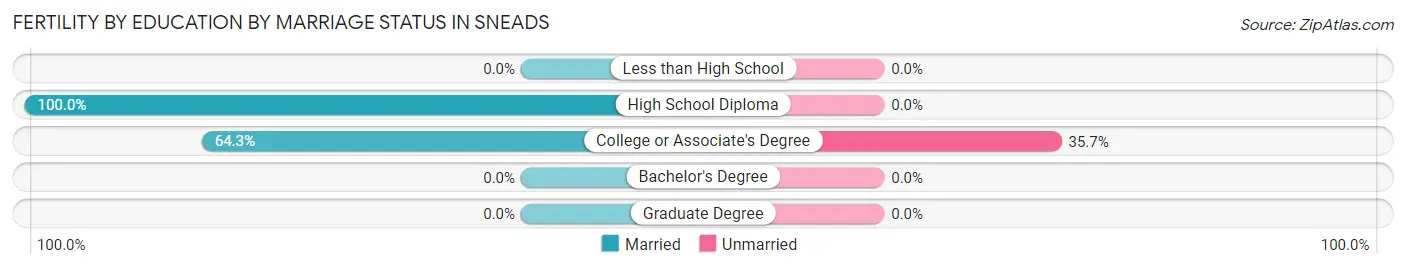
| Educational Attainment | Married | Unmarried |
| Less than High School | 0 (0.0%) | 0 (0.0%) |
| High School Diploma | 33 (100.0%) | 0 (0.0%) |
| College or Associate's Degree | 27 (64.3%) | 15 (35.7%) |
| Bachelor's Degree | 0 (0.0%) | 0 (0.0%) |
| Graduate Degree | 0 (0.0%) | 0 (0.0%) |
| Total | 60 (80.0%) | 15 (20.0%) |
Employment Characteristics in Sneads
Employment by Class of Employer in Sneads
Among the 747 employed individuals in Sneads, private company employees (332 | 44.4%), state government employees (167 | 22.4%), and local government employees (116 | 15.5%) make up the most common classes of employment.
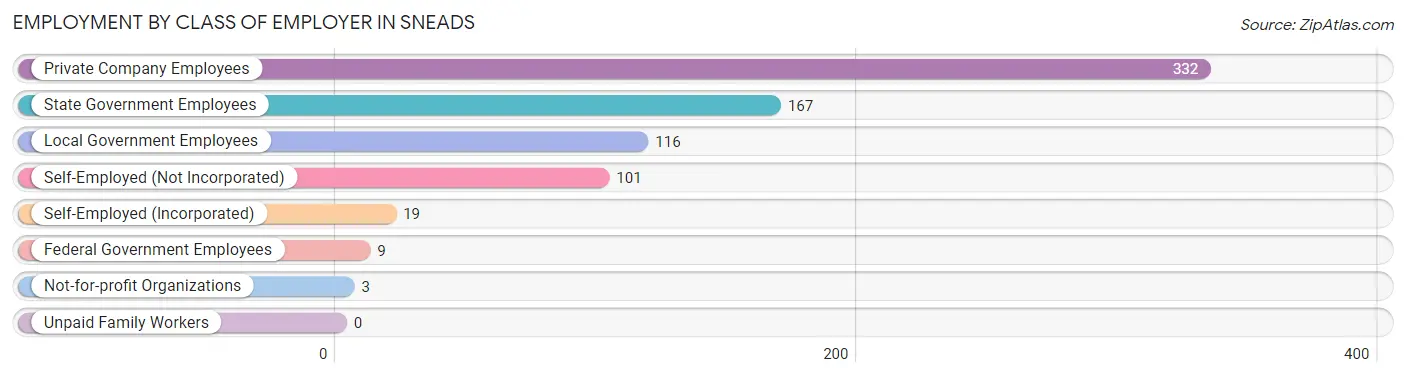
| Employer Class | # Employees | % Employees |
| Private Company Employees | 332 | 44.4% |
| Self-Employed (Incorporated) | 19 | 2.5% |
| Self-Employed (Not Incorporated) | 101 | 13.5% |
| Not-for-profit Organizations | 3 | 0.4% |
| Local Government Employees | 116 | 15.5% |
| State Government Employees | 167 | 22.4% |
| Federal Government Employees | 9 | 1.2% |
| Unpaid Family Workers | 0 | 0.0% |
| Total | 747 | 100.0% |
Employment Status by Age in Sneads
According to the labor force statistics for Sneads, out of the total population over 16 years of age (1,377), 58.0% or 799 individuals are in the labor force, with 5.9% or 47 of them unemployed. The age group with the highest labor force participation rate is 25 to 29 years, with 84.4% or 103 individuals in the labor force. Within the labor force, the 25 to 29 years age range has the highest percentage of unemployed individuals, with 38.8% or 40 of them being unemployed.
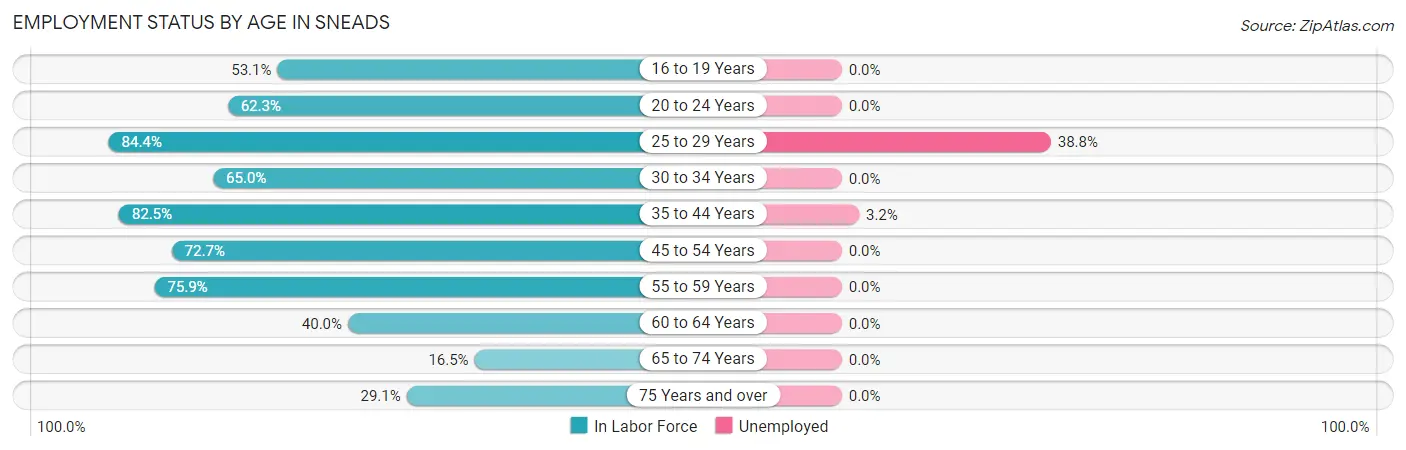
| Age Bracket | In Labor Force | Unemployed |
| 16 to 19 Years | 26 (53.1%) | 0 (0.0%) |
| 20 to 24 Years | 48 (62.3%) | 0 (0.0%) |
| 25 to 29 Years | 103 (84.4%) | 40 (38.8%) |
| 30 to 34 Years | 78 (65.0%) | 0 (0.0%) |
| 35 to 44 Years | 222 (82.5%) | 7 (3.2%) |
| 45 to 54 Years | 141 (72.7%) | 0 (0.0%) |
| 55 to 59 Years | 41 (75.9%) | 0 (0.0%) |
| 60 to 64 Years | 62 (40.0%) | 0 (0.0%) |
| 65 to 74 Years | 26 (16.5%) | 0 (0.0%) |
| 75 Years and over | 52 (29.1%) | 0 (0.0%) |
| Total | 799 (58.0%) | 47 (5.9%) |
Employment Status by Educational Attainment in Sneads
According to labor force statistics for Sneads, 70.8% of individuals (647) out of the total population between 25 and 64 years of age (914) are in the labor force, with 7.3% or 47 of them being unemployed. The group with the highest labor force participation rate are those with the educational attainment of bachelor's degree or higher, with 87.1% or 74 individuals in the labor force. Within the labor force, individuals with high school diploma education have the highest percentage of unemployment, with 16.8% or 47 of them being unemployed.
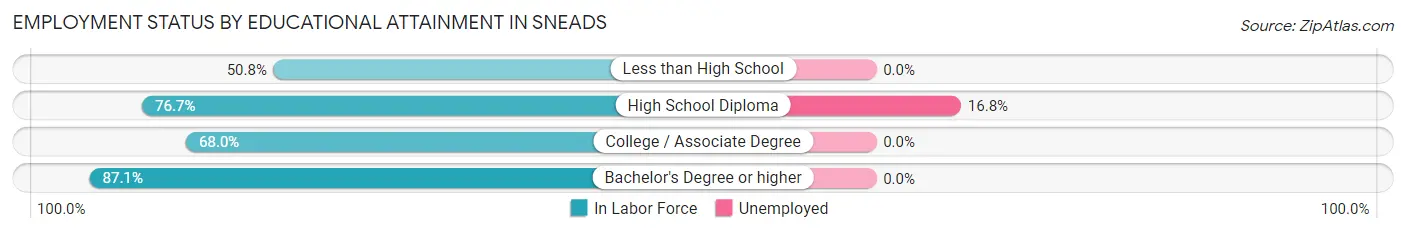
| Educational Attainment | In Labor Force | Unemployed |
| Less than High School | 66 (50.8%) | 0 (0.0%) |
| High School Diploma | 280 (76.7%) | 61 (16.8%) |
| College / Associate Degree | 227 (68.0%) | 0 (0.0%) |
| Bachelor's Degree or higher | 74 (87.1%) | 0 (0.0%) |
| Total | 647 (70.8%) | 67 (7.3%) |
Employment Occupations by Sex in Sneads
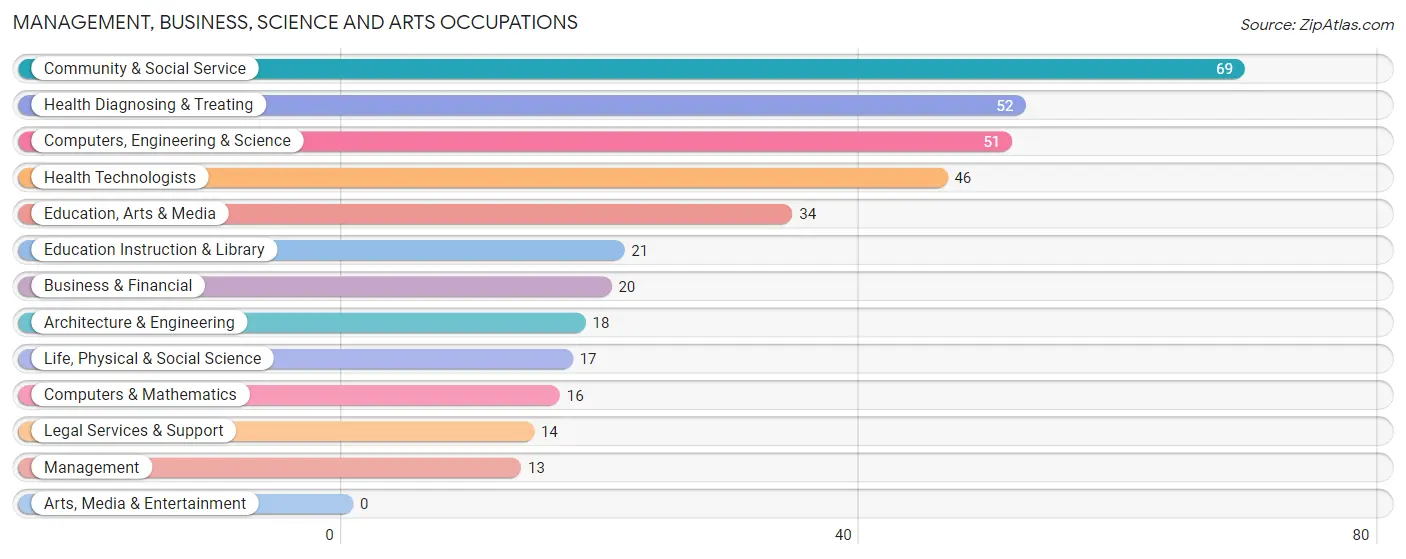
Management, Business, Science and Arts Occupations
The most common Management, Business, Science and Arts occupations in Sneads are Community & Social Service (69 | 9.2%), Health Diagnosing & Treating (52 | 6.9%), Computers, Engineering & Science (51 | 6.8%), Health Technologists (46 | 6.1%), and Education, Arts & Media (34 | 4.5%).
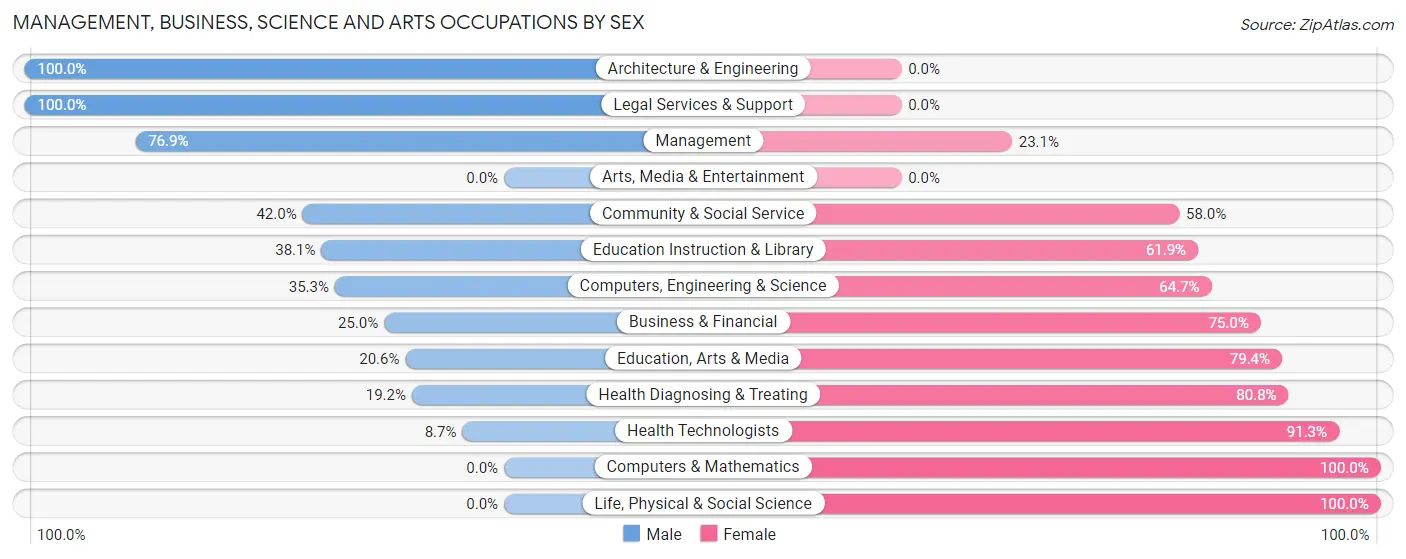
Management, Business, Science and Arts Occupations by Sex
Within the Management, Business, Science and Arts occupations in Sneads, the most male-oriented occupations are Architecture & Engineering (100.0%), Legal Services & Support (100.0%), and Management (76.9%), while the most female-oriented occupations are Computers & Mathematics (100.0%), Life, Physical & Social Science (100.0%), and Health Technologists (91.3%).
| Occupation | Male | Female |
| Management | 10 (76.9%) | 3 (23.1%) |
| Business & Financial | 5 (25.0%) | 15 (75.0%) |
| Computers, Engineering & Science | 18 (35.3%) | 33 (64.7%) |
| Computers & Mathematics | 0 (0.0%) | 16 (100.0%) |
| Architecture & Engineering | 18 (100.0%) | 0 (0.0%) |
| Life, Physical & Social Science | 0 (0.0%) | 17 (100.0%) |
| Community & Social Service | 29 (42.0%) | 40 (58.0%) |
| Education, Arts & Media | 7 (20.6%) | 27 (79.4%) |
| Legal Services & Support | 14 (100.0%) | 0 (0.0%) |
| Education Instruction & Library | 8 (38.1%) | 13 (61.9%) |
| Arts, Media & Entertainment | 0 (0.0%) | 0 (0.0%) |
| Health Diagnosing & Treating | 10 (19.2%) | 42 (80.8%) |
| Health Technologists | 4 (8.7%) | 42 (91.3%) |
| Total (Category) | 72 (35.1%) | 133 (64.9%) |
| Total (Overall) | 335 (44.6%) | 417 (55.4%) |
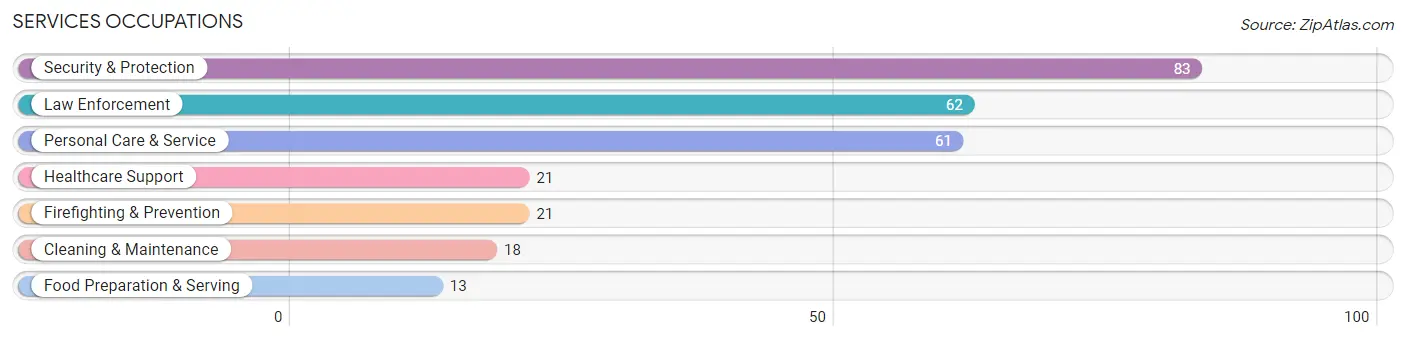
Services Occupations
The most common Services occupations in Sneads are Security & Protection (83 | 11.0%), Law Enforcement (62 | 8.2%), Personal Care & Service (61 | 8.1%), Healthcare Support (21 | 2.8%), and Firefighting & Prevention (21 | 2.8%).
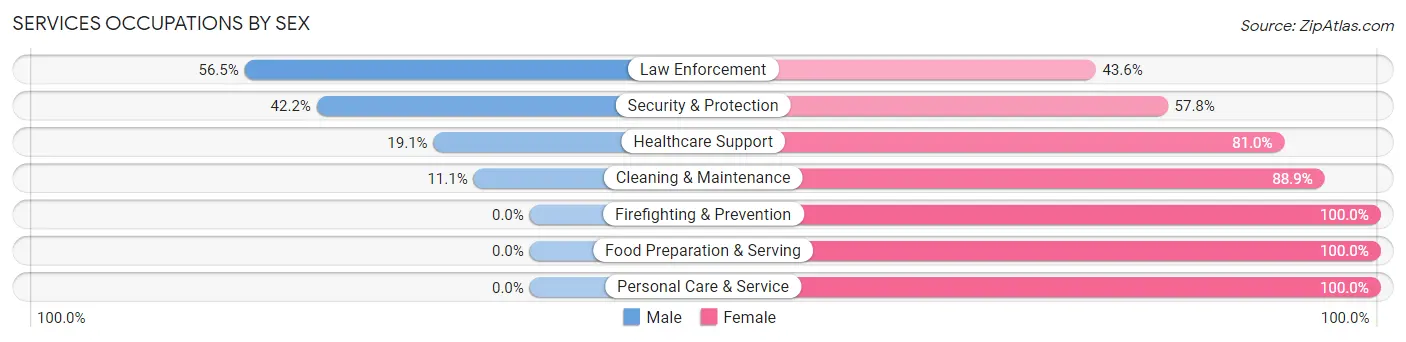
Services Occupations by Sex
Within the Services occupations in Sneads, the most male-oriented occupations are Law Enforcement (56.5%), Security & Protection (42.2%), and Healthcare Support (19.1%), while the most female-oriented occupations are Firefighting & Prevention (100.0%), Food Preparation & Serving (100.0%), and Personal Care & Service (100.0%).
| Occupation | Male | Female |
| Healthcare Support | 4 (19.1%) | 17 (80.9%) |
| Security & Protection | 35 (42.2%) | 48 (57.8%) |
| Firefighting & Prevention | 0 (0.0%) | 21 (100.0%) |
| Law Enforcement | 35 (56.5%) | 27 (43.5%) |
| Food Preparation & Serving | 0 (0.0%) | 13 (100.0%) |
| Cleaning & Maintenance | 2 (11.1%) | 16 (88.9%) |
| Personal Care & Service | 0 (0.0%) | 61 (100.0%) |
| Total (Category) | 41 (20.9%) | 155 (79.1%) |
| Total (Overall) | 335 (44.6%) | 417 (55.4%) |
Sales and Office Occupations
The most common Sales and Office occupations in Sneads are Sales & Related (121 | 16.1%), and Office & Administration (36 | 4.8%).
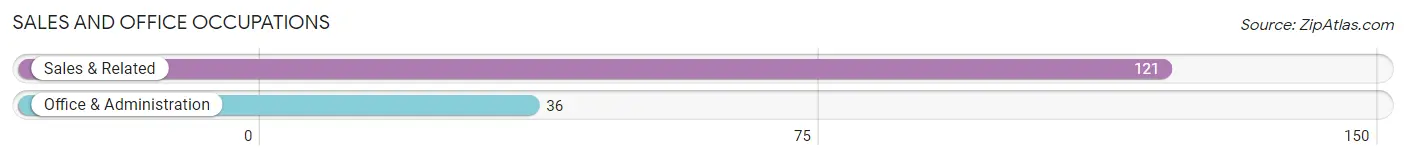
Sales and Office Occupations by Sex
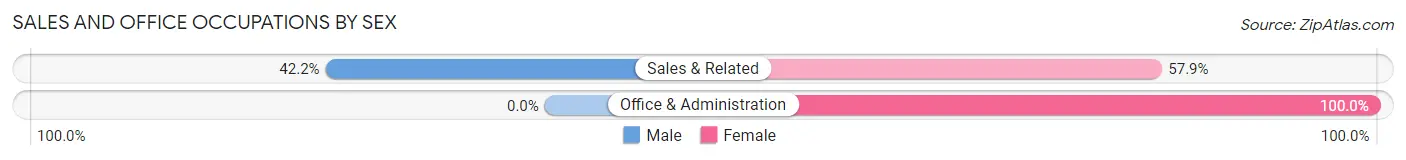
| Occupation | Male | Female |
| Sales & Related | 51 (42.1%) | 70 (57.9%) |
| Office & Administration | 0 (0.0%) | 36 (100.0%) |
| Total (Category) | 51 (32.5%) | 106 (67.5%) |
| Total (Overall) | 335 (44.6%) | 417 (55.4%) |
Natural Resources, Construction and Maintenance Occupations
The most common Natural Resources, Construction and Maintenance occupations in Sneads are Construction & Extraction (44 | 5.9%), and Installation, Maintenance & Repair (38 | 5.1%).
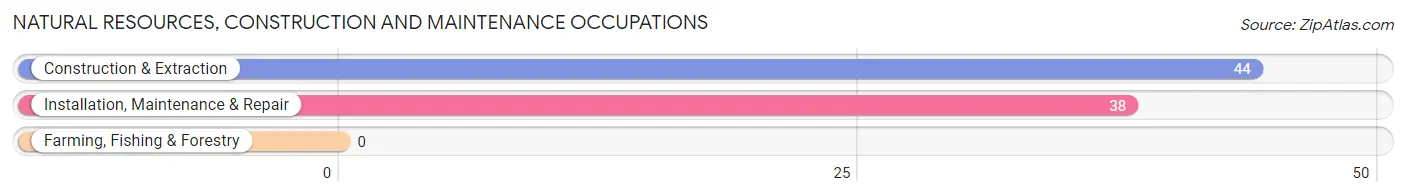
Natural Resources, Construction and Maintenance Occupations by Sex
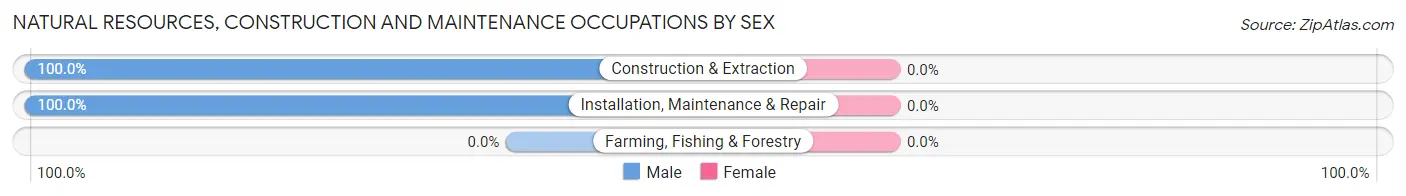
| Occupation | Male | Female |
| Farming, Fishing & Forestry | 0 (0.0%) | 0 (0.0%) |
| Construction & Extraction | 44 (100.0%) | 0 (0.0%) |
| Installation, Maintenance & Repair | 38 (100.0%) | 0 (0.0%) |
| Total (Category) | 82 (100.0%) | 0 (0.0%) |
| Total (Overall) | 335 (44.6%) | 417 (55.4%) |
Production, Transportation and Moving Occupations
The most common Production, Transportation and Moving occupations in Sneads are Production (72 | 9.6%), Material Moving (35 | 4.6%), and Transportation (5 | 0.7%).

Production, Transportation and Moving Occupations by Sex
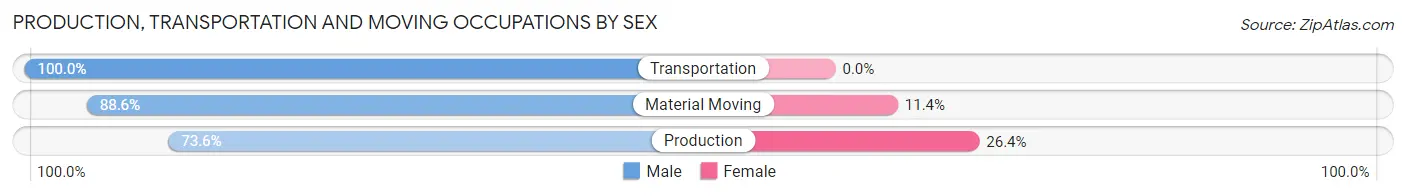
| Occupation | Male | Female |
| Production | 53 (73.6%) | 19 (26.4%) |
| Transportation | 5 (100.0%) | 0 (0.0%) |
| Material Moving | 31 (88.6%) | 4 (11.4%) |
| Total (Category) | 89 (79.5%) | 23 (20.5%) |
| Total (Overall) | 335 (44.6%) | 417 (55.4%) |
Employment Industries by Sex in Sneads
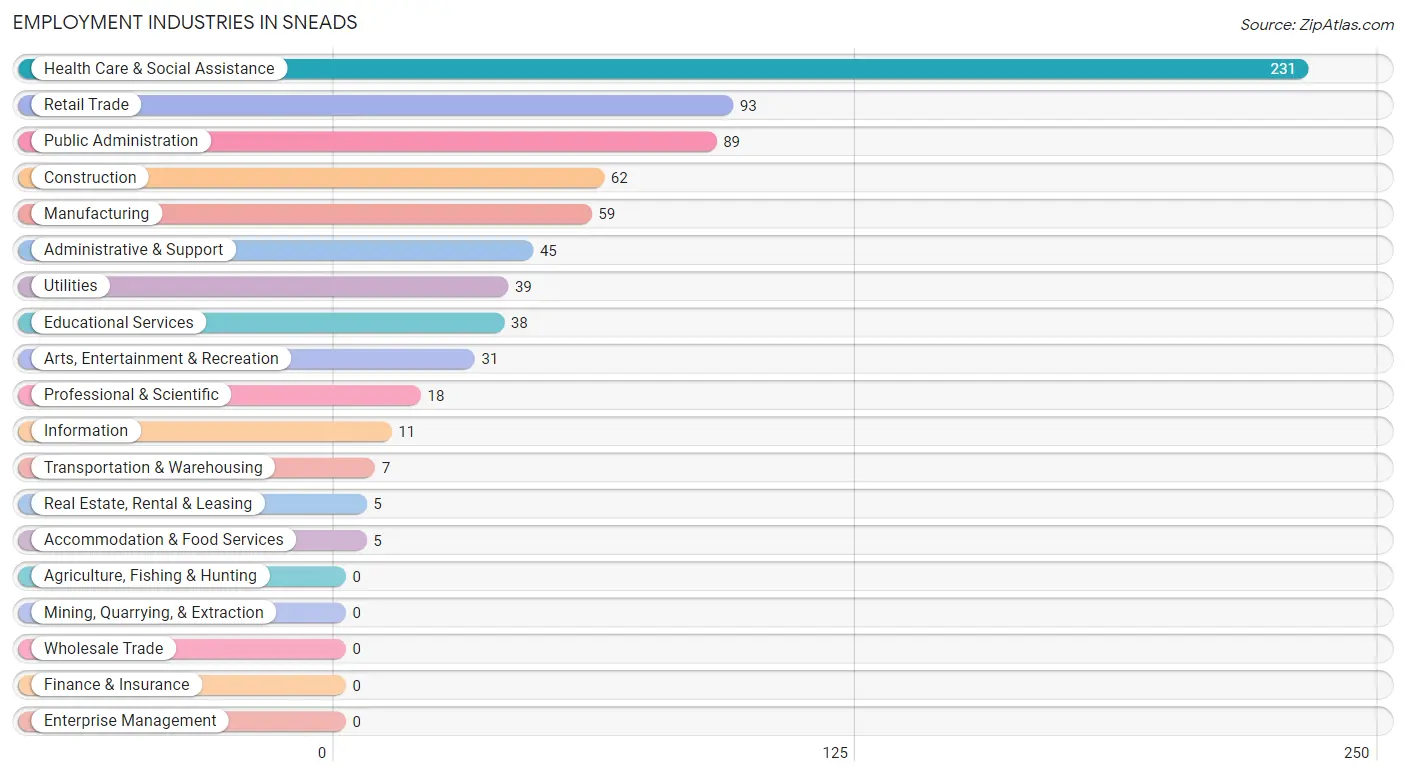
Employment Industries in Sneads
The major employment industries in Sneads include Health Care & Social Assistance (231 | 30.7%), Retail Trade (93 | 12.4%), Public Administration (89 | 11.8%), Construction (62 | 8.2%), and Manufacturing (59 | 7.9%).
Employment Industries by Sex in Sneads
The Sneads industries that see more men than women are Construction (100.0%), Utilities (100.0%), and Information (100.0%), whereas the industries that tend to have a higher number of women are Arts, Entertainment & Recreation (100.0%), Health Care & Social Assistance (90.0%), and Administrative & Support (73.3%).
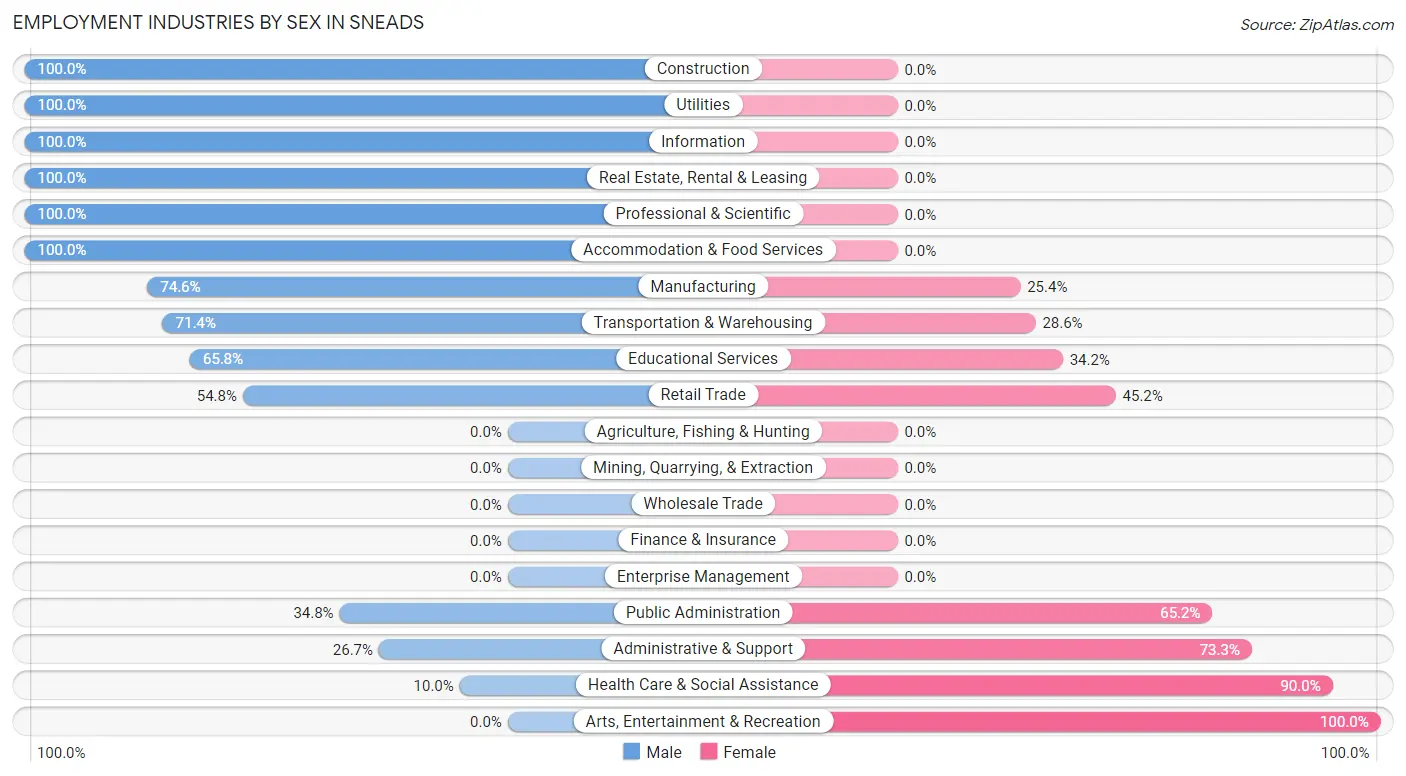
| Industry | Male | Female |
| Agriculture, Fishing & Hunting | 0 (0.0%) | 0 (0.0%) |
| Mining, Quarrying, & Extraction | 0 (0.0%) | 0 (0.0%) |
| Construction | 62 (100.0%) | 0 (0.0%) |
| Manufacturing | 44 (74.6%) | 15 (25.4%) |
| Wholesale Trade | 0 (0.0%) | 0 (0.0%) |
| Retail Trade | 51 (54.8%) | 42 (45.2%) |
| Transportation & Warehousing | 5 (71.4%) | 2 (28.6%) |
| Utilities | 39 (100.0%) | 0 (0.0%) |
| Information | 11 (100.0%) | 0 (0.0%) |
| Finance & Insurance | 0 (0.0%) | 0 (0.0%) |
| Real Estate, Rental & Leasing | 5 (100.0%) | 0 (0.0%) |
| Professional & Scientific | 18 (100.0%) | 0 (0.0%) |
| Enterprise Management | 0 (0.0%) | 0 (0.0%) |
| Administrative & Support | 12 (26.7%) | 33 (73.3%) |
| Educational Services | 25 (65.8%) | 13 (34.2%) |
| Health Care & Social Assistance | 23 (10.0%) | 208 (90.0%) |
| Arts, Entertainment & Recreation | 0 (0.0%) | 31 (100.0%) |
| Accommodation & Food Services | 5 (100.0%) | 0 (0.0%) |
| Public Administration | 31 (34.8%) | 58 (65.2%) |
| Total | 335 (44.6%) | 417 (55.4%) |
Education in Sneads
School Enrollment in Sneads
The most common levels of schooling among the 434 students in Sneads are elementary school (141 | 32.5%), college / undergraduate (93 | 21.4%), and middle school (60 | 13.8%).
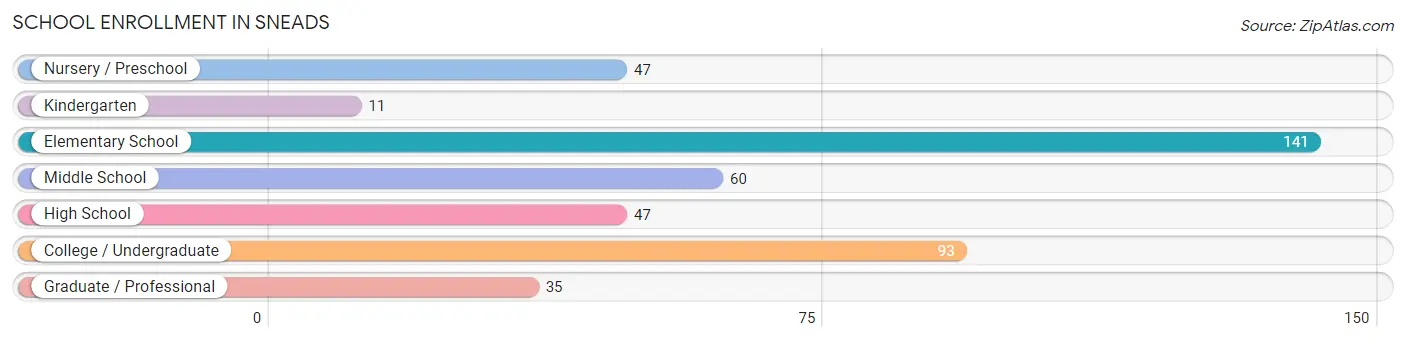
| School Level | # Students | % Students |
| Nursery / Preschool | 47 | 10.8% |
| Kindergarten | 11 | 2.5% |
| Elementary School | 141 | 32.5% |
| Middle School | 60 | 13.8% |
| High School | 47 | 10.8% |
| College / Undergraduate | 93 | 21.4% |
| Graduate / Professional | 35 | 8.1% |
| Total | 434 | 100.0% |
School Enrollment by Age by Funding Source in Sneads
Out of a total of 434 students who are enrolled in schools in Sneads, 41 (9.4%) attend a private institution, while the remaining 393 (90.6%) are enrolled in public schools. The age group of 20 to 24 year olds has the highest likelihood of being enrolled in private schools, with 17 (100.0% in the age bracket) enrolled. Conversely, the age group of 3 to 4 year olds has the lowest likelihood of being enrolled in a private school, with 47 (100.0% in the age bracket) attending a public institution.
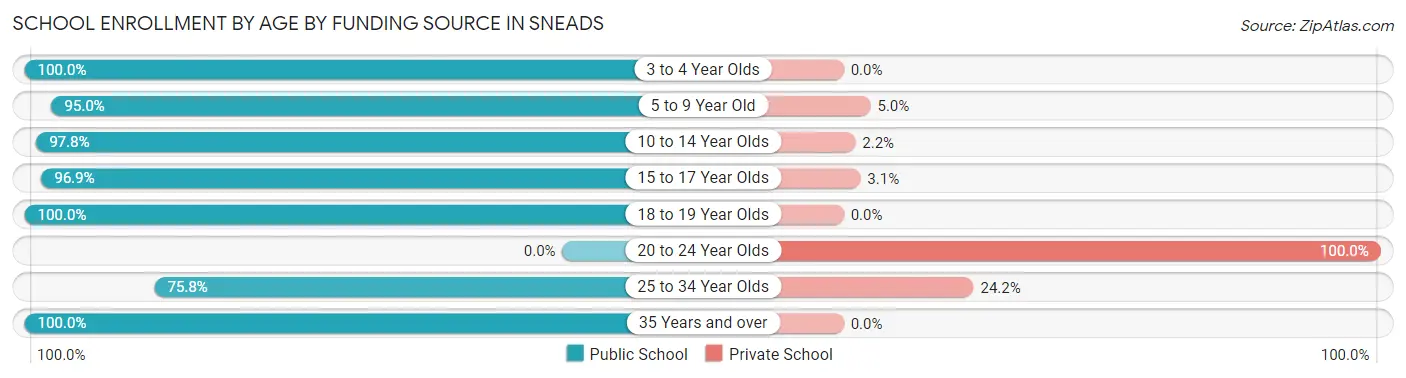
| Age Bracket | Public School | Private School |
| 3 to 4 Year Olds | 47 (100.0%) | 0 (0.0%) |
| 5 to 9 Year Old | 114 (95.0%) | 6 (5.0%) |
| 10 to 14 Year Olds | 90 (97.8%) | 2 (2.2%) |
| 15 to 17 Year Olds | 31 (96.9%) | 1 (3.1%) |
| 18 to 19 Year Olds | 18 (100.0%) | 0 (0.0%) |
| 20 to 24 Year Olds | 0 (0.0%) | 17 (100.0%) |
| 25 to 34 Year Olds | 47 (75.8%) | 15 (24.2%) |
| 35 Years and over | 46 (100.0%) | 0 (0.0%) |
| Total | 393 (90.6%) | 41 (9.4%) |
Educational Attainment by Field of Study in Sneads
Psychology (52 | 38.2%), education (22 | 16.2%), arts & humanities (20 | 14.7%), business (19 | 14.0%), and social sciences (10 | 7.3%) are the most common fields of study among 136 individuals in Sneads who have obtained a bachelor's degree or higher.
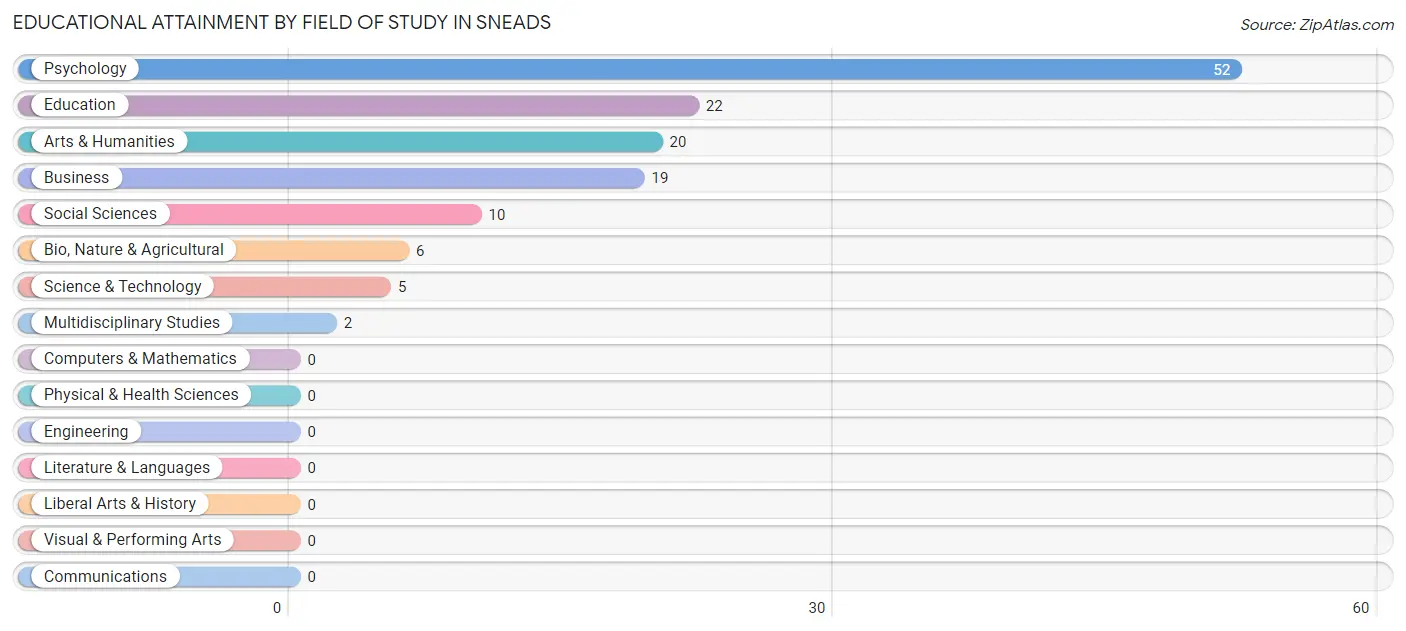
| Field of Study | # Graduates | % Graduates |
| Computers & Mathematics | 0 | 0.0% |
| Bio, Nature & Agricultural | 6 | 4.4% |
| Physical & Health Sciences | 0 | 0.0% |
| Psychology | 52 | 38.2% |
| Social Sciences | 10 | 7.3% |
| Engineering | 0 | 0.0% |
| Multidisciplinary Studies | 2 | 1.5% |
| Science & Technology | 5 | 3.7% |
| Business | 19 | 14.0% |
| Education | 22 | 16.2% |
| Literature & Languages | 0 | 0.0% |
| Liberal Arts & History | 0 | 0.0% |
| Visual & Performing Arts | 0 | 0.0% |
| Communications | 0 | 0.0% |
| Arts & Humanities | 20 | 14.7% |
| Total | 136 | 100.0% |
Transportation & Commute in Sneads
Vehicle Availability by Sex in Sneads
The most prevalent vehicle ownership categories in Sneads are males with 2 vehicles (126, accounting for 37.6%) and females with 2 vehicles (126, making up 30.6%).
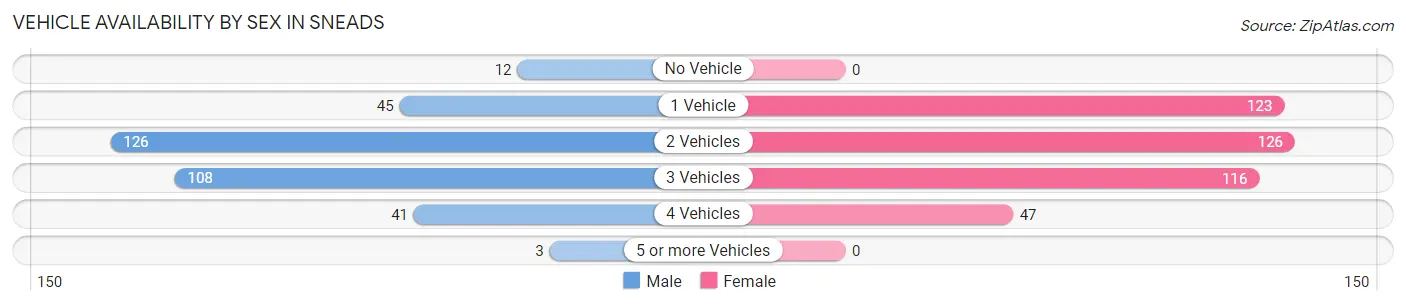
| Vehicles Available | Male | Female |
| No Vehicle | 12 (3.6%) | 0 (0.0%) |
| 1 Vehicle | 45 (13.4%) | 123 (29.8%) |
| 2 Vehicles | 126 (37.6%) | 126 (30.6%) |
| 3 Vehicles | 108 (32.2%) | 116 (28.2%) |
| 4 Vehicles | 41 (12.2%) | 47 (11.4%) |
| 5 or more Vehicles | 3 (0.9%) | 0 (0.0%) |
| Total | 335 (100.0%) | 412 (100.0%) |
Commute Time in Sneads
The most frequently occuring commute durations in Sneads are 30 to 34 minutes (166 commuters, 23.0%), 10 to 14 minutes (125 commuters, 17.3%), and 5 to 9 minutes (83 commuters, 11.5%).
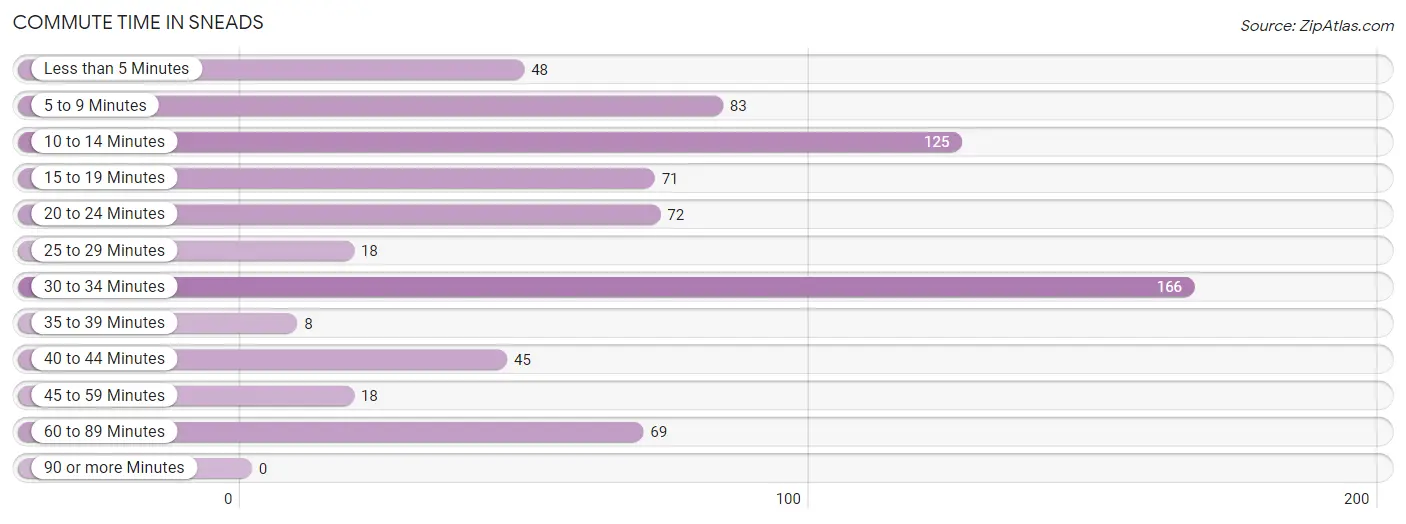
| Commute Time | # Commuters | % Commuters |
| Less than 5 Minutes | 48 | 6.6% |
| 5 to 9 Minutes | 83 | 11.5% |
| 10 to 14 Minutes | 125 | 17.3% |
| 15 to 19 Minutes | 71 | 9.8% |
| 20 to 24 Minutes | 72 | 10.0% |
| 25 to 29 Minutes | 18 | 2.5% |
| 30 to 34 Minutes | 166 | 23.0% |
| 35 to 39 Minutes | 8 | 1.1% |
| 40 to 44 Minutes | 45 | 6.2% |
| 45 to 59 Minutes | 18 | 2.5% |
| 60 to 89 Minutes | 69 | 9.5% |
| 90 or more Minutes | 0 | 0.0% |
Commute Time by Sex in Sneads
The most common commute times in Sneads are 30 to 34 minutes (77 commuters, 23.3%) for males and 10 to 14 minutes (89 commuters, 22.7%) for females.
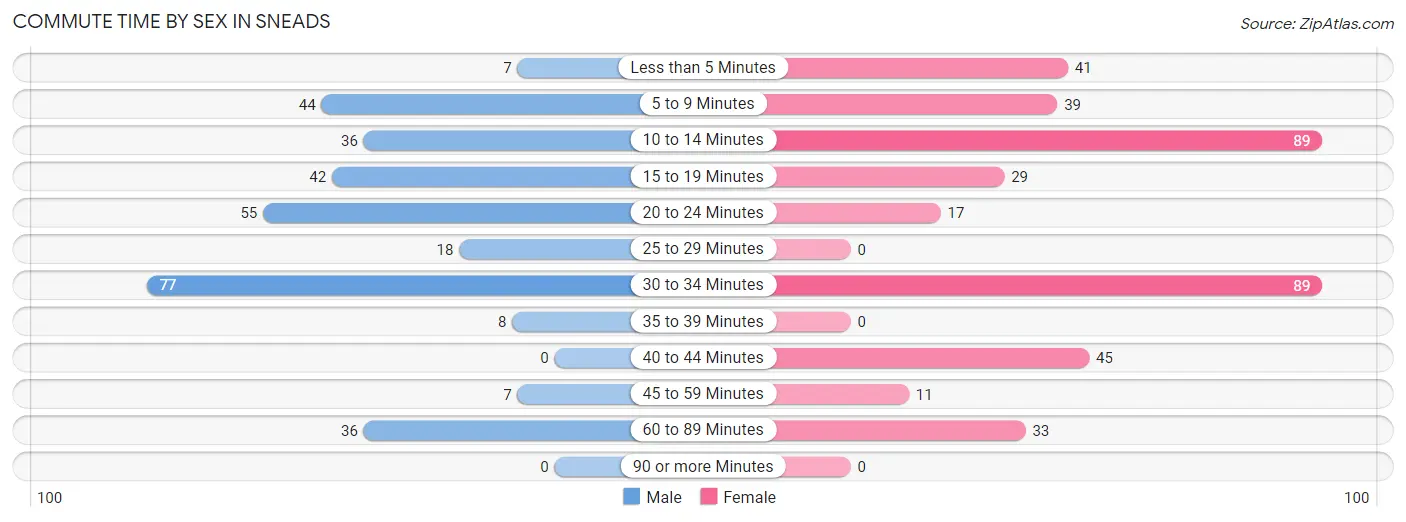
| Commute Time | Male | Female |
| Less than 5 Minutes | 7 (2.1%) | 41 (10.4%) |
| 5 to 9 Minutes | 44 (13.3%) | 39 (9.9%) |
| 10 to 14 Minutes | 36 (10.9%) | 89 (22.7%) |
| 15 to 19 Minutes | 42 (12.7%) | 29 (7.4%) |
| 20 to 24 Minutes | 55 (16.7%) | 17 (4.3%) |
| 25 to 29 Minutes | 18 (5.4%) | 0 (0.0%) |
| 30 to 34 Minutes | 77 (23.3%) | 89 (22.7%) |
| 35 to 39 Minutes | 8 (2.4%) | 0 (0.0%) |
| 40 to 44 Minutes | 0 (0.0%) | 45 (11.5%) |
| 45 to 59 Minutes | 7 (2.1%) | 11 (2.8%) |
| 60 to 89 Minutes | 36 (10.9%) | 33 (8.4%) |
| 90 or more Minutes | 0 (0.0%) | 0 (0.0%) |
Time of Departure to Work by Sex in Sneads
The most frequent times of departure to work in Sneads are 7:00 AM to 7:29 AM (87, 26.4%) for males and 6:00 AM to 6:29 AM (143, 36.4%) for females.
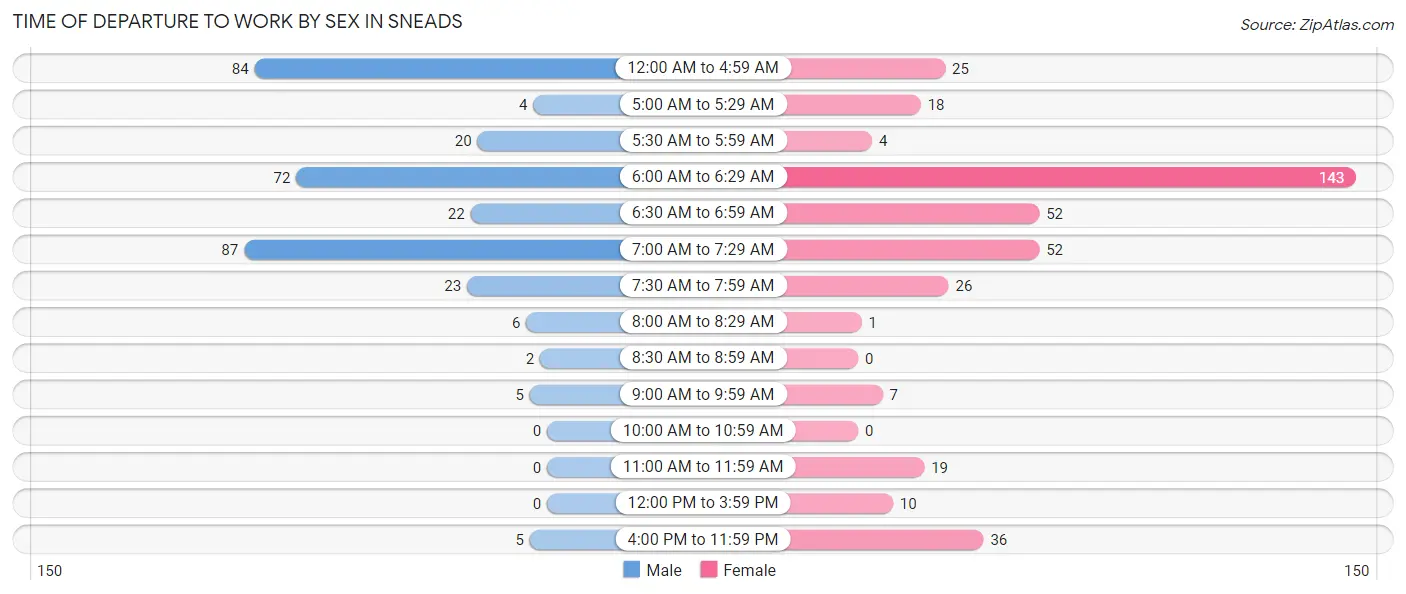
| Time of Departure | Male | Female |
| 12:00 AM to 4:59 AM | 84 (25.5%) | 25 (6.4%) |
| 5:00 AM to 5:29 AM | 4 (1.2%) | 18 (4.6%) |
| 5:30 AM to 5:59 AM | 20 (6.1%) | 4 (1.0%) |
| 6:00 AM to 6:29 AM | 72 (21.8%) | 143 (36.4%) |
| 6:30 AM to 6:59 AM | 22 (6.7%) | 52 (13.2%) |
| 7:00 AM to 7:29 AM | 87 (26.4%) | 52 (13.2%) |
| 7:30 AM to 7:59 AM | 23 (7.0%) | 26 (6.6%) |
| 8:00 AM to 8:29 AM | 6 (1.8%) | 1 (0.3%) |
| 8:30 AM to 8:59 AM | 2 (0.6%) | 0 (0.0%) |
| 9:00 AM to 9:59 AM | 5 (1.5%) | 7 (1.8%) |
| 10:00 AM to 10:59 AM | 0 (0.0%) | 0 (0.0%) |
| 11:00 AM to 11:59 AM | 0 (0.0%) | 19 (4.8%) |
| 12:00 PM to 3:59 PM | 0 (0.0%) | 10 (2.5%) |
| 4:00 PM to 11:59 PM | 5 (1.5%) | 36 (9.2%) |
| Total | 330 (100.0%) | 393 (100.0%) |
Housing Occupancy in Sneads
Occupancy by Ownership in Sneads
Of the total 806 dwellings in Sneads, owner-occupied units account for 538 (66.7%), while renter-occupied units make up 268 (33.3%).
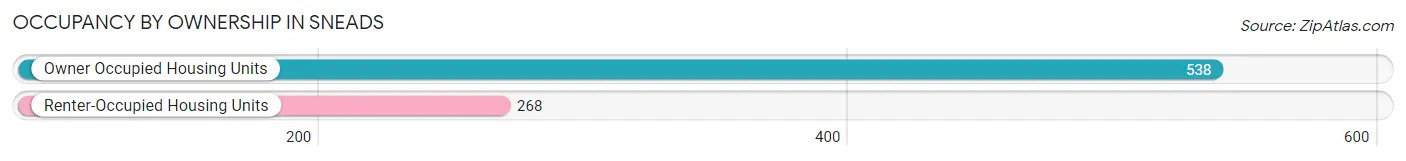
| Occupancy | # Housing Units | % Housing Units |
| Owner Occupied Housing Units | 538 | 66.7% |
| Renter-Occupied Housing Units | 268 | 33.3% |
| Total Occupied Housing Units | 806 | 100.0% |
Occupancy by Household Size in Sneads
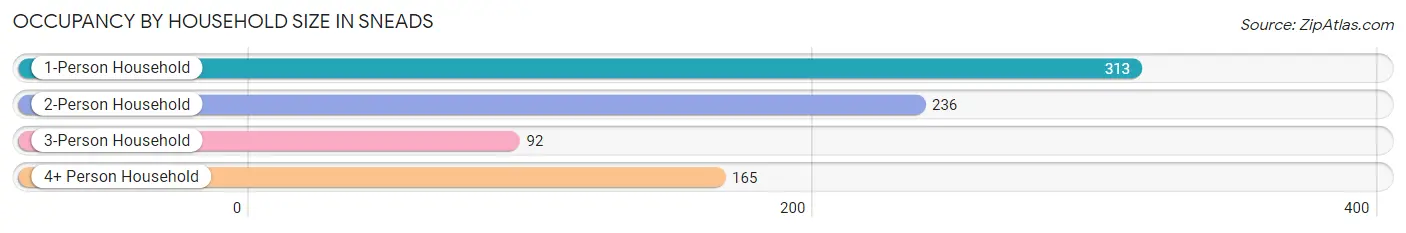
| Household Size | # Housing Units | % Housing Units |
| 1-Person Household | 313 | 38.8% |
| 2-Person Household | 236 | 29.3% |
| 3-Person Household | 92 | 11.4% |
| 4+ Person Household | 165 | 20.5% |
| Total Housing Units | 806 | 100.0% |
Occupancy by Ownership by Household Size in Sneads
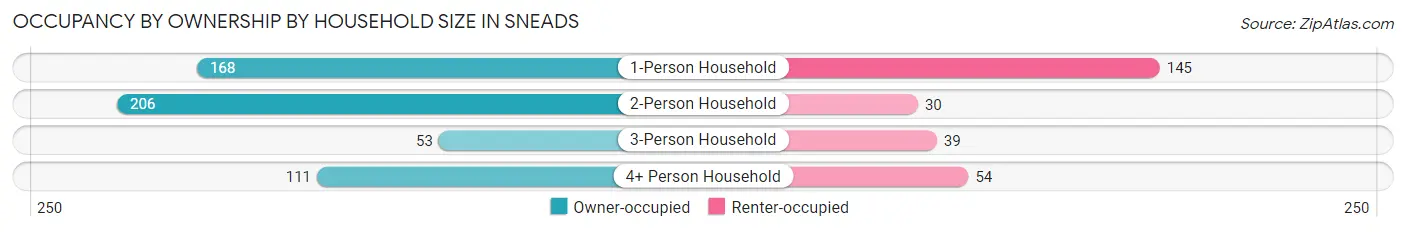
| Household Size | Owner-occupied | Renter-occupied |
| 1-Person Household | 168 (53.7%) | 145 (46.3%) |
| 2-Person Household | 206 (87.3%) | 30 (12.7%) |
| 3-Person Household | 53 (57.6%) | 39 (42.4%) |
| 4+ Person Household | 111 (67.3%) | 54 (32.7%) |
| Total Housing Units | 538 (66.7%) | 268 (33.3%) |
Occupancy by Educational Attainment in Sneads
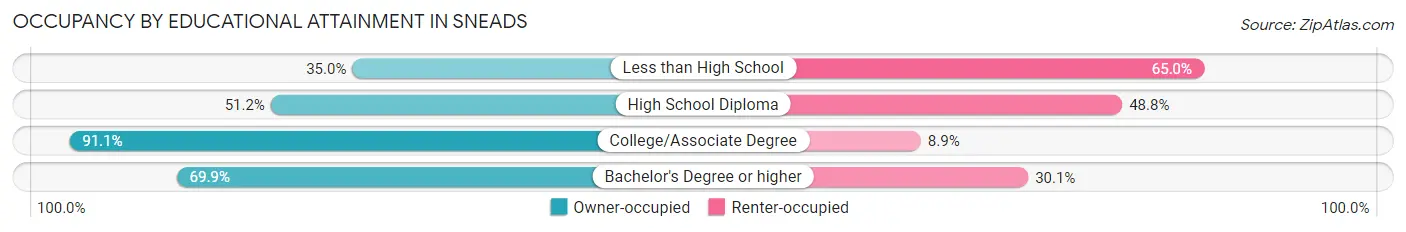
| Household Size | Owner-occupied | Renter-occupied |
| Less than High School | 41 (35.0%) | 76 (65.0%) |
| High School Diploma | 148 (51.2%) | 141 (48.8%) |
| College/Associate Degree | 298 (91.1%) | 29 (8.9%) |
| Bachelor's Degree or higher | 51 (69.9%) | 22 (30.1%) |
Occupancy by Age of Householder in Sneads
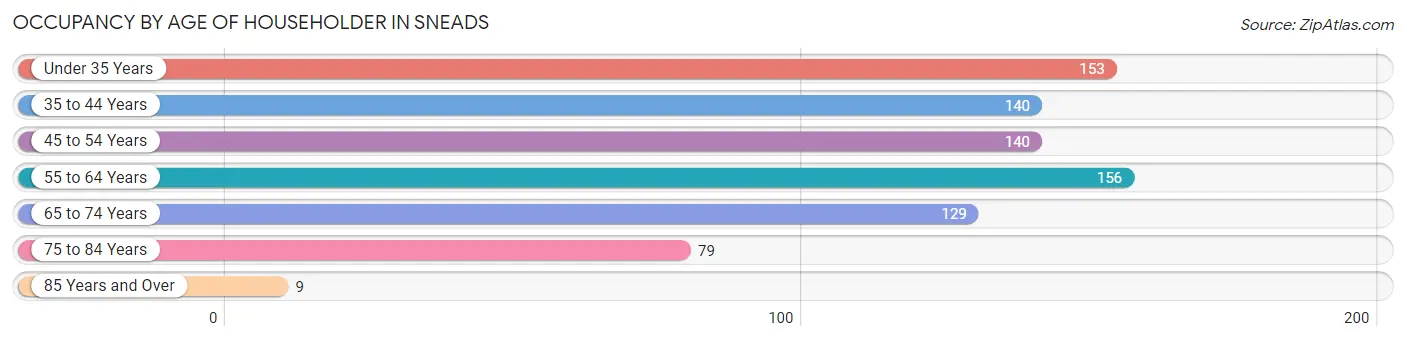
| Age Bracket | # Households | % Households |
| Under 35 Years | 153 | 19.0% |
| 35 to 44 Years | 140 | 17.4% |
| 45 to 54 Years | 140 | 17.4% |
| 55 to 64 Years | 156 | 19.4% |
| 65 to 74 Years | 129 | 16.0% |
| 75 to 84 Years | 79 | 9.8% |
| 85 Years and Over | 9 | 1.1% |
| Total | 806 | 100.0% |
Housing Finances in Sneads
Median Income by Occupancy in Sneads
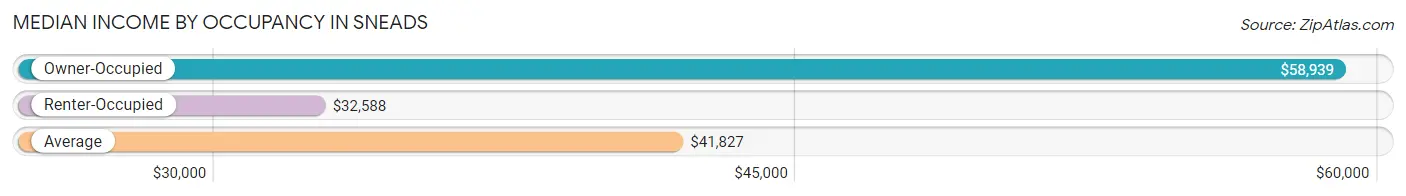
| Occupancy Type | # Households | Median Income |
| Owner-Occupied | 538 (66.7%) | $58,939 |
| Renter-Occupied | 268 (33.3%) | $32,588 |
| Average | 806 (100.0%) | $41,827 |
Occupancy by Householder Income Bracket in Sneads
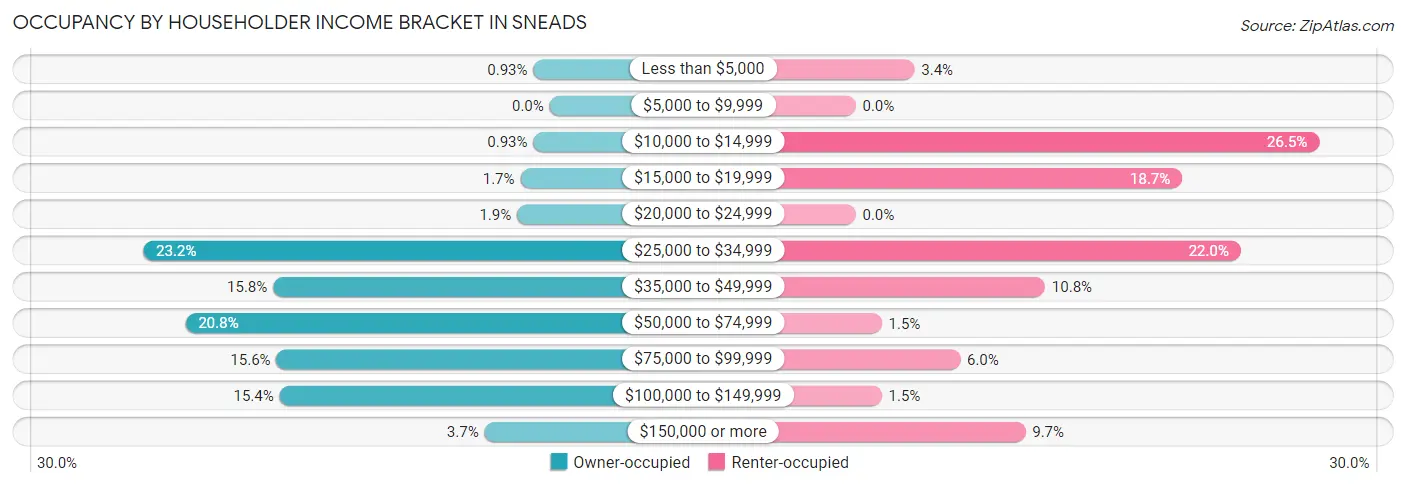
| Income Bracket | Owner-occupied | Renter-occupied |
| Less than $5,000 | 5 (0.9%) | 9 (3.4%) |
| $5,000 to $9,999 | 0 (0.0%) | 0 (0.0%) |
| $10,000 to $14,999 | 5 (0.9%) | 71 (26.5%) |
| $15,000 to $19,999 | 9 (1.7%) | 50 (18.7%) |
| $20,000 to $24,999 | 10 (1.9%) | 0 (0.0%) |
| $25,000 to $34,999 | 125 (23.2%) | 59 (22.0%) |
| $35,000 to $49,999 | 85 (15.8%) | 29 (10.8%) |
| $50,000 to $74,999 | 112 (20.8%) | 4 (1.5%) |
| $75,000 to $99,999 | 84 (15.6%) | 16 (6.0%) |
| $100,000 to $149,999 | 83 (15.4%) | 4 (1.5%) |
| $150,000 or more | 20 (3.7%) | 26 (9.7%) |
| Total | 538 (100.0%) | 268 (100.0%) |
Monthly Housing Cost Tiers in Sneads
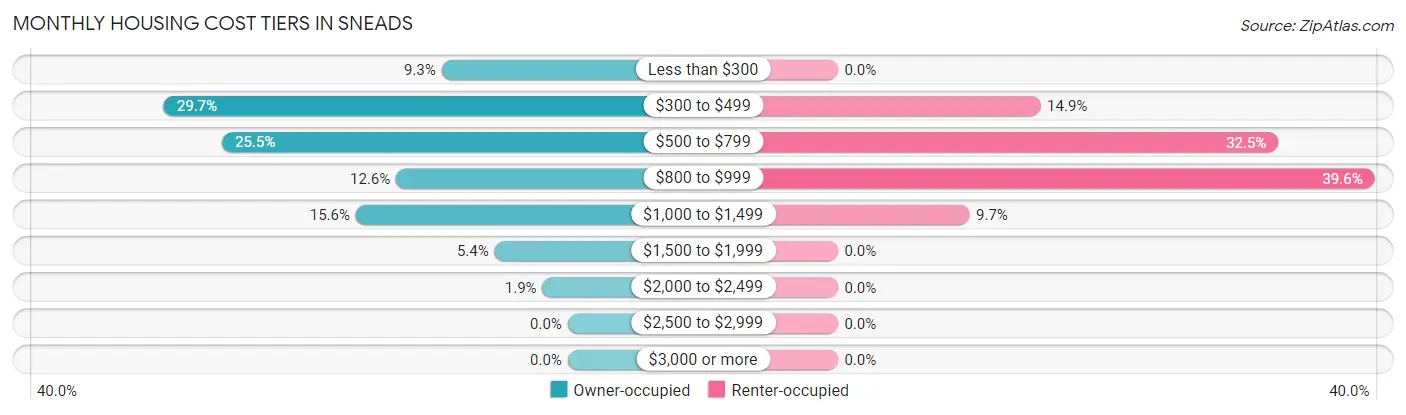
| Monthly Cost | Owner-occupied | Renter-occupied |
| Less than $300 | 50 (9.3%) | 0 (0.0%) |
| $300 to $499 | 160 (29.7%) | 40 (14.9%) |
| $500 to $799 | 137 (25.5%) | 87 (32.5%) |
| $800 to $999 | 68 (12.6%) | 106 (39.6%) |
| $1,000 to $1,499 | 84 (15.6%) | 26 (9.7%) |
| $1,500 to $1,999 | 29 (5.4%) | 0 (0.0%) |
| $2,000 to $2,499 | 10 (1.9%) | 0 (0.0%) |
| $2,500 to $2,999 | 0 (0.0%) | 0 (0.0%) |
| $3,000 or more | 0 (0.0%) | 0 (0.0%) |
| Total | 538 (100.0%) | 268 (100.0%) |
Physical Housing Characteristics in Sneads
Housing Structures in Sneads
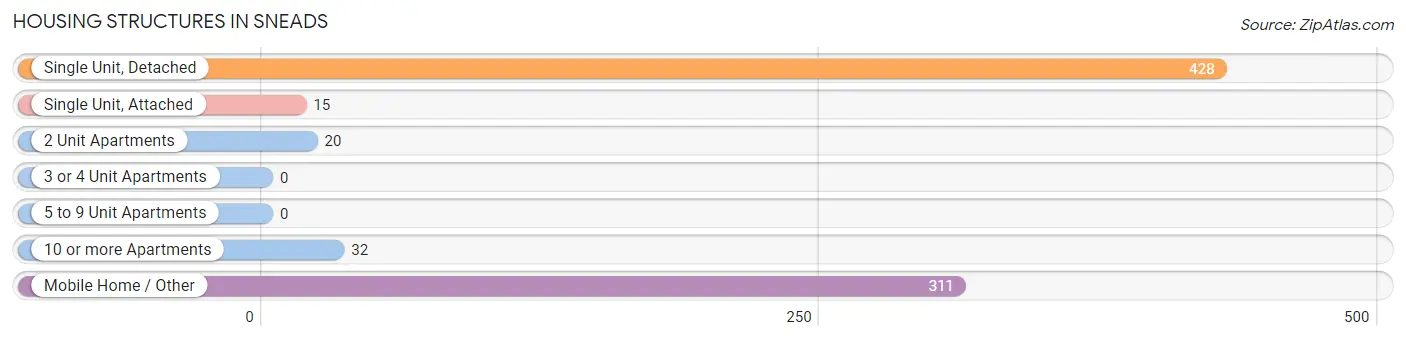
| Structure Type | # Housing Units | % Housing Units |
| Single Unit, Detached | 428 | 53.1% |
| Single Unit, Attached | 15 | 1.9% |
| 2 Unit Apartments | 20 | 2.5% |
| 3 or 4 Unit Apartments | 0 | 0.0% |
| 5 to 9 Unit Apartments | 0 | 0.0% |
| 10 or more Apartments | 32 | 4.0% |
| Mobile Home / Other | 311 | 38.6% |
| Total | 806 | 100.0% |
Housing Structures by Occupancy in Sneads
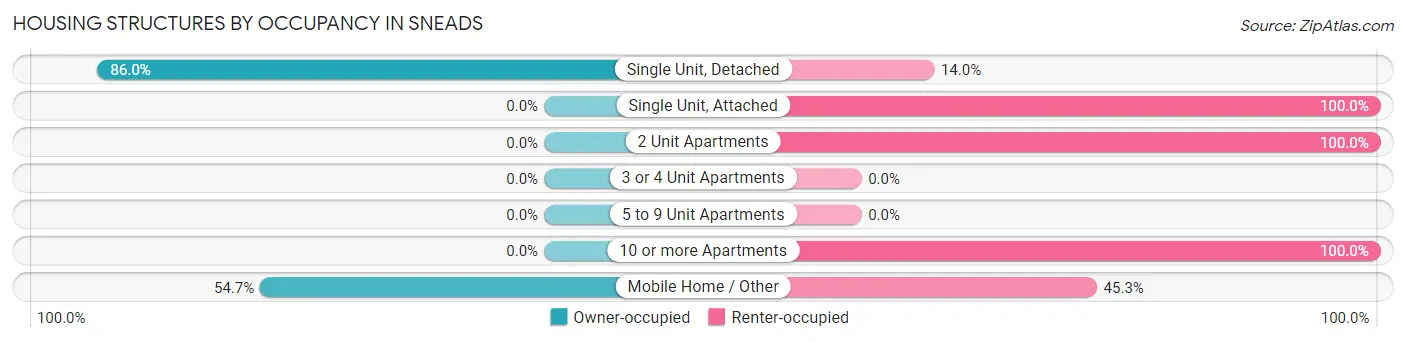
| Structure Type | Owner-occupied | Renter-occupied |
| Single Unit, Detached | 368 (86.0%) | 60 (14.0%) |
| Single Unit, Attached | 0 (0.0%) | 15 (100.0%) |
| 2 Unit Apartments | 0 (0.0%) | 20 (100.0%) |
| 3 or 4 Unit Apartments | 0 (0.0%) | 0 (0.0%) |
| 5 to 9 Unit Apartments | 0 (0.0%) | 0 (0.0%) |
| 10 or more Apartments | 0 (0.0%) | 32 (100.0%) |
| Mobile Home / Other | 170 (54.7%) | 141 (45.3%) |
| Total | 538 (66.7%) | 268 (33.3%) |
Housing Structures by Number of Rooms in Sneads
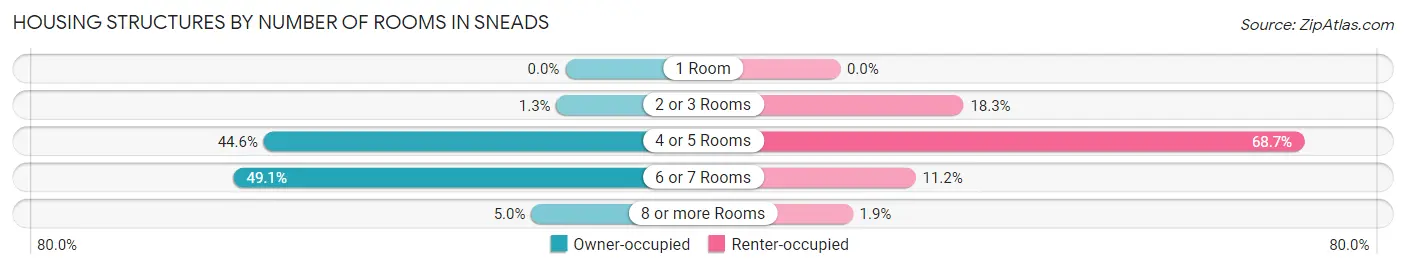
| Number of Rooms | Owner-occupied | Renter-occupied |
| 1 Room | 0 (0.0%) | 0 (0.0%) |
| 2 or 3 Rooms | 7 (1.3%) | 49 (18.3%) |
| 4 or 5 Rooms | 240 (44.6%) | 184 (68.7%) |
| 6 or 7 Rooms | 264 (49.1%) | 30 (11.2%) |
| 8 or more Rooms | 27 (5.0%) | 5 (1.9%) |
| Total | 538 (100.0%) | 268 (100.0%) |
Housing Structure by Heating Type in Sneads
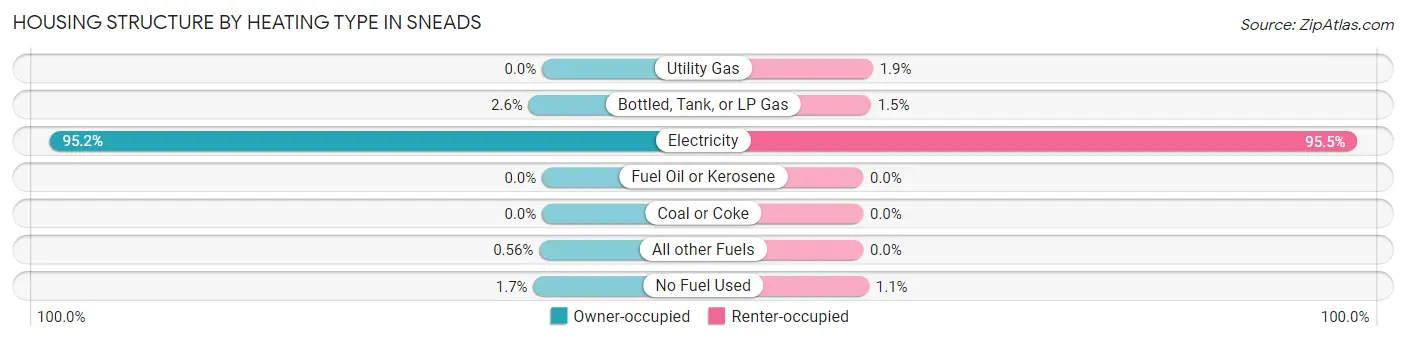
| Heating Type | Owner-occupied | Renter-occupied |
| Utility Gas | 0 (0.0%) | 5 (1.9%) |
| Bottled, Tank, or LP Gas | 14 (2.6%) | 4 (1.5%) |
| Electricity | 512 (95.2%) | 256 (95.5%) |
| Fuel Oil or Kerosene | 0 (0.0%) | 0 (0.0%) |
| Coal or Coke | 0 (0.0%) | 0 (0.0%) |
| All other Fuels | 3 (0.6%) | 0 (0.0%) |
| No Fuel Used | 9 (1.7%) | 3 (1.1%) |
| Total | 538 (100.0%) | 268 (100.0%) |
Household Vehicle Usage in Sneads
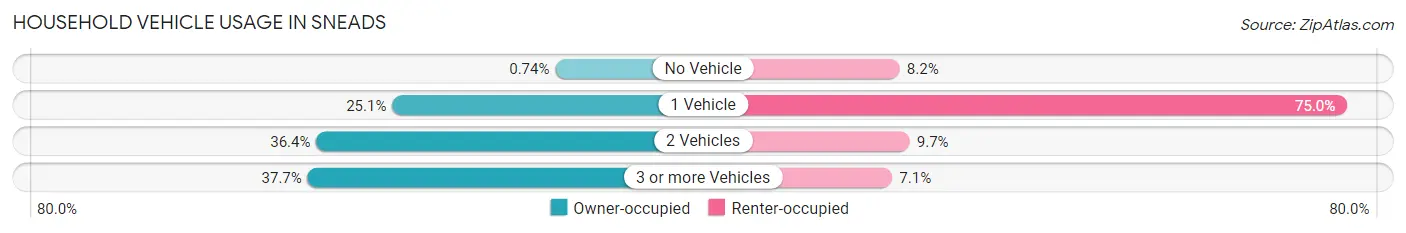
| Vehicles per Household | Owner-occupied | Renter-occupied |
| No Vehicle | 4 (0.7%) | 22 (8.2%) |
| 1 Vehicle | 135 (25.1%) | 201 (75.0%) |
| 2 Vehicles | 196 (36.4%) | 26 (9.7%) |
| 3 or more Vehicles | 203 (37.7%) | 19 (7.1%) |
| Total | 538 (100.0%) | 268 (100.0%) |
Real Estate & Mortgages in Sneads
Real Estate and Mortgage Overview in Sneads
| Characteristic | Without Mortgage | With Mortgage |
| Housing Units | 321 | 217 |
| Median Property Value | $84,500 | $108,600 |
| Median Household Income | $57,689 | $3 |
| Monthly Housing Costs | $435 | $0 |
| Real Estate Taxes | $482 | $36 |
Property Value by Mortgage Status in Sneads
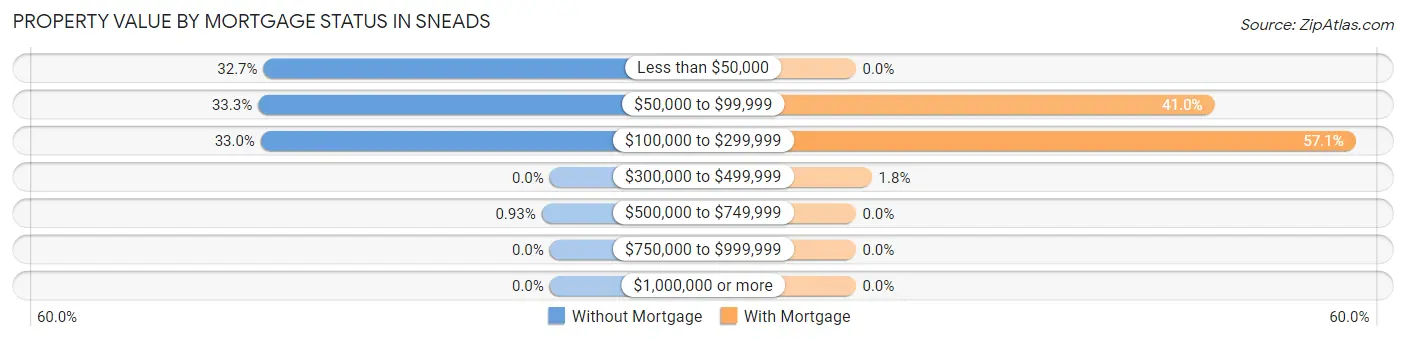
| Property Value | Without Mortgage | With Mortgage |
| Less than $50,000 | 105 (32.7%) | 0 (0.0%) |
| $50,000 to $99,999 | 107 (33.3%) | 89 (41.0%) |
| $100,000 to $299,999 | 106 (33.0%) | 124 (57.1%) |
| $300,000 to $499,999 | 0 (0.0%) | 4 (1.8%) |
| $500,000 to $749,999 | 3 (0.9%) | 0 (0.0%) |
| $750,000 to $999,999 | 0 (0.0%) | 0 (0.0%) |
| $1,000,000 or more | 0 (0.0%) | 0 (0.0%) |
| Total | 321 (100.0%) | 217 (100.0%) |
Household Income by Mortgage Status in Sneads
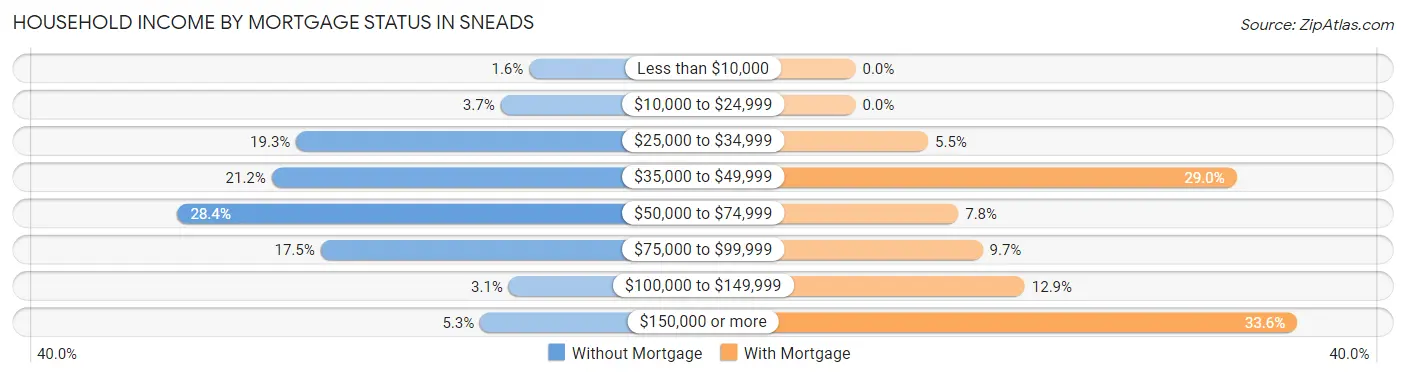
| Household Income | Without Mortgage | With Mortgage |
| Less than $10,000 | 5 (1.6%) | 0 (0.0%) |
| $10,000 to $24,999 | 12 (3.7%) | 0 (0.0%) |
| $25,000 to $34,999 | 62 (19.3%) | 12 (5.5%) |
| $35,000 to $49,999 | 68 (21.2%) | 63 (29.0%) |
| $50,000 to $74,999 | 91 (28.3%) | 17 (7.8%) |
| $75,000 to $99,999 | 56 (17.4%) | 21 (9.7%) |
| $100,000 to $149,999 | 10 (3.1%) | 28 (12.9%) |
| $150,000 or more | 17 (5.3%) | 73 (33.6%) |
| Total | 321 (100.0%) | 217 (100.0%) |
Property Value to Household Income Ratio in Sneads
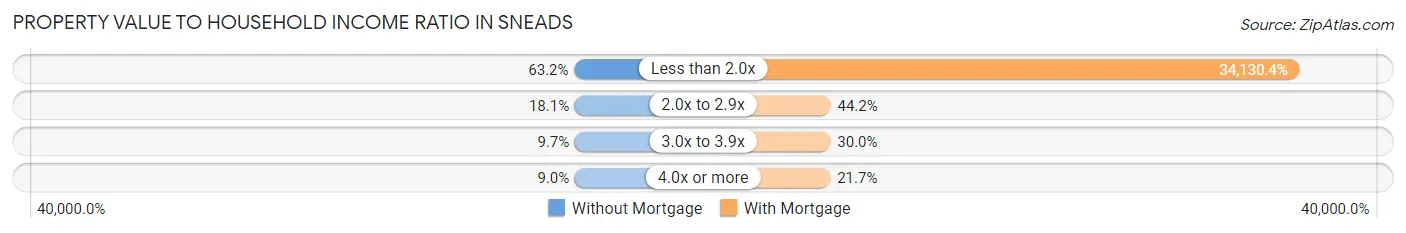
| Value-to-Income Ratio | Without Mortgage | With Mortgage |
| Less than 2.0x | 203 (63.2%) | 74,063 (34,130.4%) |
| 2.0x to 2.9x | 58 (18.1%) | 96 (44.2%) |
| 3.0x to 3.9x | 31 (9.7%) | 65 (29.9%) |
| 4.0x or more | 29 (9.0%) | 47 (21.7%) |
| Total | 321 (100.0%) | 217 (100.0%) |
Real Estate Taxes by Mortgage Status in Sneads
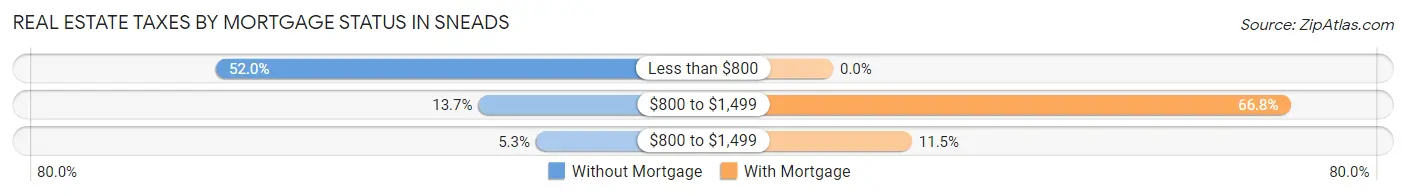
| Property Taxes | Without Mortgage | With Mortgage |
| Less than $800 | 167 (52.0%) | 0 (0.0%) |
| $800 to $1,499 | 44 (13.7%) | 145 (66.8%) |
| $800 to $1,499 | 17 (5.3%) | 25 (11.5%) |
| Total | 321 (100.0%) | 217 (100.0%) |
Health & Disability in Sneads
Health Insurance Coverage by Age in Sneads
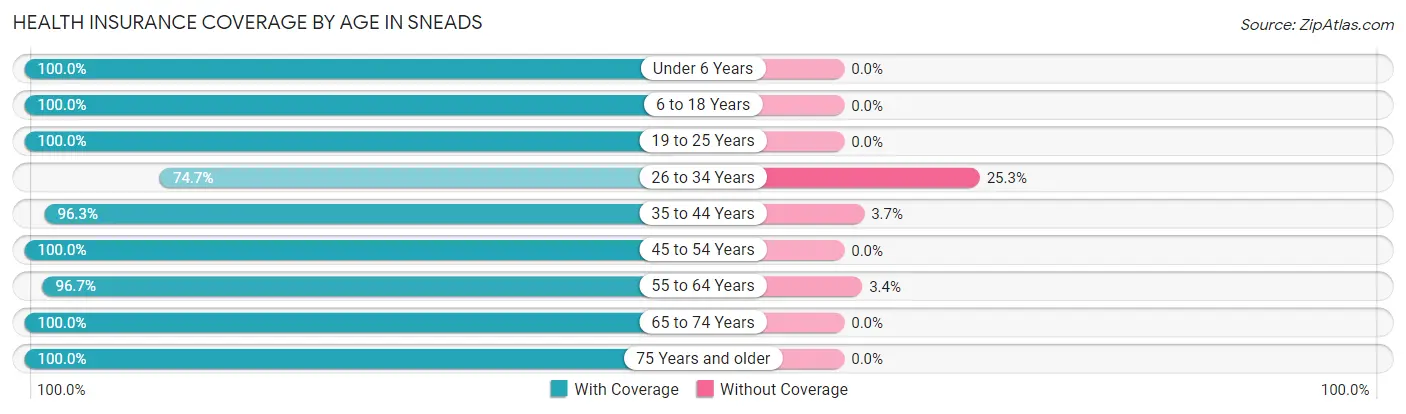
| Age Bracket | With Coverage | Without Coverage |
| Under 6 Years | 150 (100.0%) | 0 (0.0%) |
| 6 to 18 Years | 251 (100.0%) | 0 (0.0%) |
| 19 to 25 Years | 140 (100.0%) | 0 (0.0%) |
| 26 to 34 Years | 145 (74.7%) | 49 (25.3%) |
| 35 to 44 Years | 259 (96.3%) | 10 (3.7%) |
| 45 to 54 Years | 194 (100.0%) | 0 (0.0%) |
| 55 to 64 Years | 202 (96.7%) | 7 (3.4%) |
| 65 to 74 Years | 158 (100.0%) | 0 (0.0%) |
| 75 Years and older | 179 (100.0%) | 0 (0.0%) |
| Total | 1,678 (96.2%) | 66 (3.8%) |
Health Insurance Coverage by Citizenship Status in Sneads
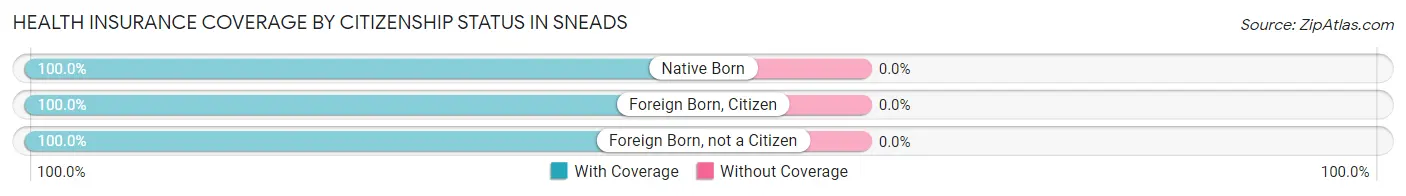
| Citizenship Status | With Coverage | Without Coverage |
| Native Born | 150 (100.0%) | 0 (0.0%) |
| Foreign Born, Citizen | 251 (100.0%) | 0 (0.0%) |
| Foreign Born, not a Citizen | 140 (100.0%) | 0 (0.0%) |
Health Insurance Coverage by Household Income in Sneads
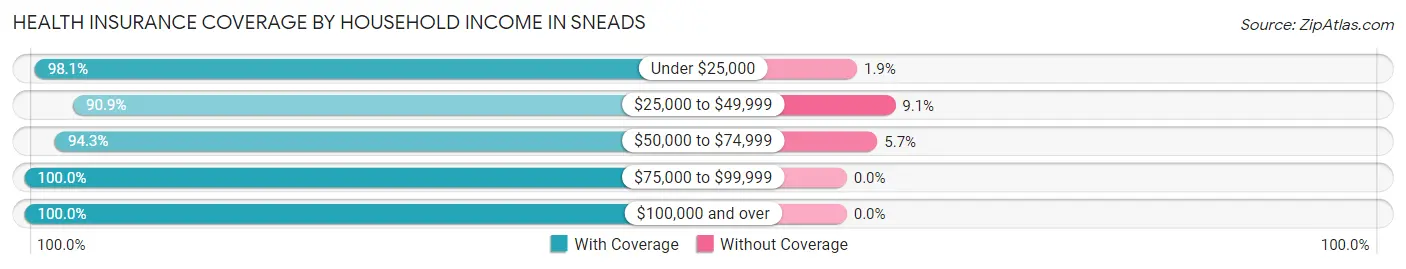
| Household Income | With Coverage | Without Coverage |
| Under $25,000 | 256 (98.1%) | 5 (1.9%) |
| $25,000 to $49,999 | 440 (90.9%) | 44 (9.1%) |
| $50,000 to $74,999 | 280 (94.3%) | 17 (5.7%) |
| $75,000 to $99,999 | 390 (100.0%) | 0 (0.0%) |
| $100,000 and over | 312 (100.0%) | 0 (0.0%) |
Public vs Private Health Insurance Coverage by Age in Sneads
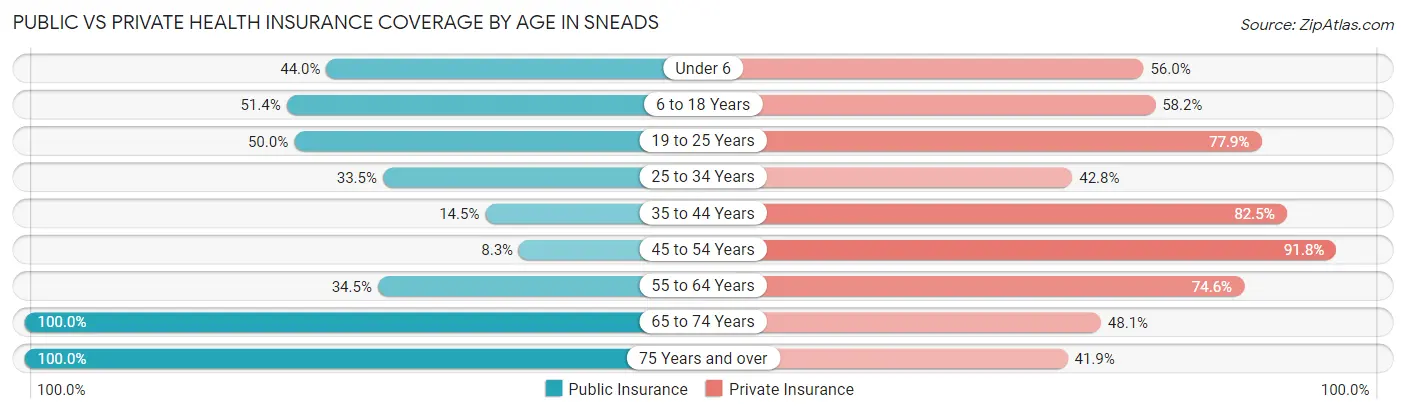
| Age Bracket | Public Insurance | Private Insurance |
| Under 6 | 66 (44.0%) | 84 (56.0%) |
| 6 to 18 Years | 129 (51.4%) | 146 (58.2%) |
| 19 to 25 Years | 70 (50.0%) | 109 (77.9%) |
| 25 to 34 Years | 65 (33.5%) | 83 (42.8%) |
| 35 to 44 Years | 39 (14.5%) | 222 (82.5%) |
| 45 to 54 Years | 16 (8.3%) | 178 (91.7%) |
| 55 to 64 Years | 72 (34.4%) | 156 (74.6%) |
| 65 to 74 Years | 158 (100.0%) | 76 (48.1%) |
| 75 Years and over | 179 (100.0%) | 75 (41.9%) |
| Total | 794 (45.5%) | 1,129 (64.7%) |
Disability Status by Sex by Age in Sneads
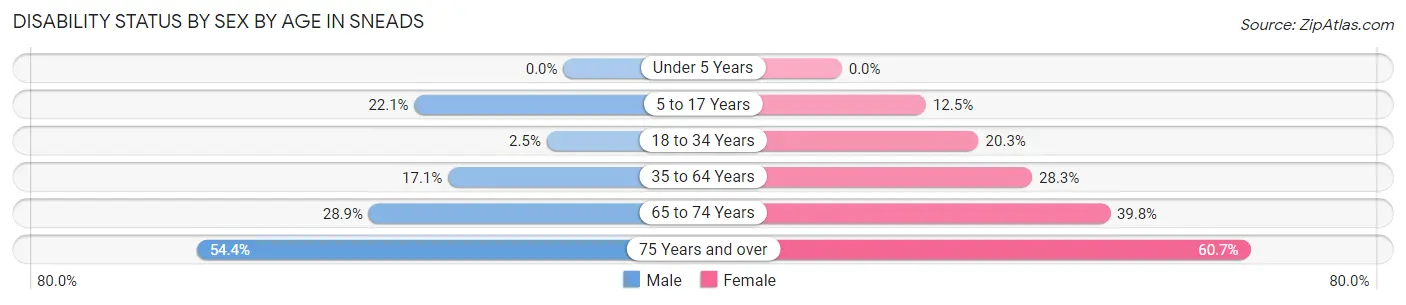
| Age Bracket | Male | Female |
| Under 5 Years | 0 (0.0%) | 0 (0.0%) |
| 5 to 17 Years | 21 (22.1%) | 19 (12.5%) |
| 18 to 34 Years | 4 (2.5%) | 38 (20.3%) |
| 35 to 64 Years | 52 (17.1%) | 104 (28.3%) |
| 65 to 74 Years | 13 (28.9%) | 45 (39.8%) |
| 75 Years and over | 49 (54.4%) | 54 (60.7%) |
Disability Class by Sex by Age in Sneads
Disability Class: Hearing Difficulty
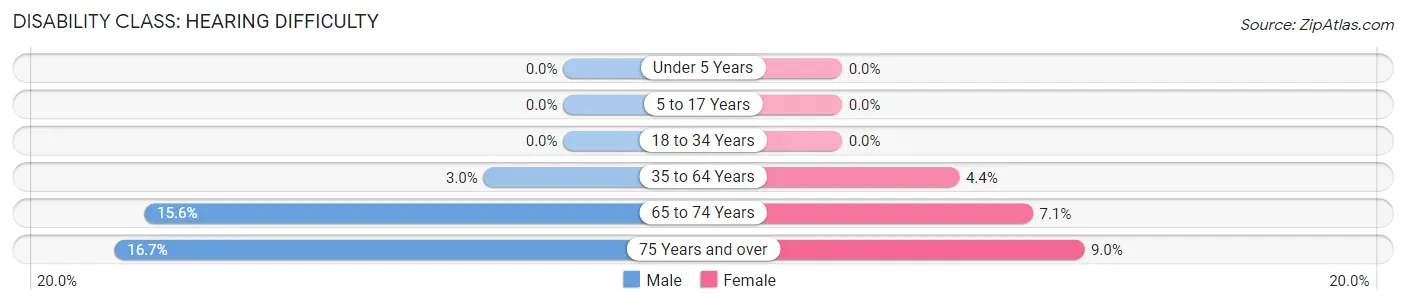
| Age Bracket | Male | Female |
| Under 5 Years | 0 (0.0%) | 0 (0.0%) |
| 5 to 17 Years | 0 (0.0%) | 0 (0.0%) |
| 18 to 34 Years | 0 (0.0%) | 0 (0.0%) |
| 35 to 64 Years | 9 (3.0%) | 16 (4.3%) |
| 65 to 74 Years | 7 (15.6%) | 8 (7.1%) |
| 75 Years and over | 15 (16.7%) | 8 (9.0%) |
Disability Class: Vision Difficulty
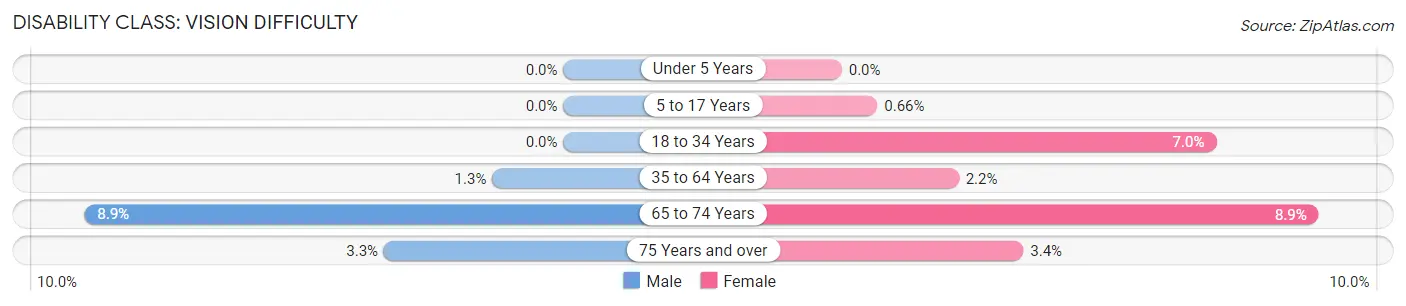
| Age Bracket | Male | Female |
| Under 5 Years | 0 (0.0%) | 0 (0.0%) |
| 5 to 17 Years | 0 (0.0%) | 1 (0.7%) |
| 18 to 34 Years | 0 (0.0%) | 13 (7.0%) |
| 35 to 64 Years | 4 (1.3%) | 8 (2.2%) |
| 65 to 74 Years | 4 (8.9%) | 10 (8.8%) |
| 75 Years and over | 3 (3.3%) | 3 (3.4%) |
Disability Class: Cognitive Difficulty
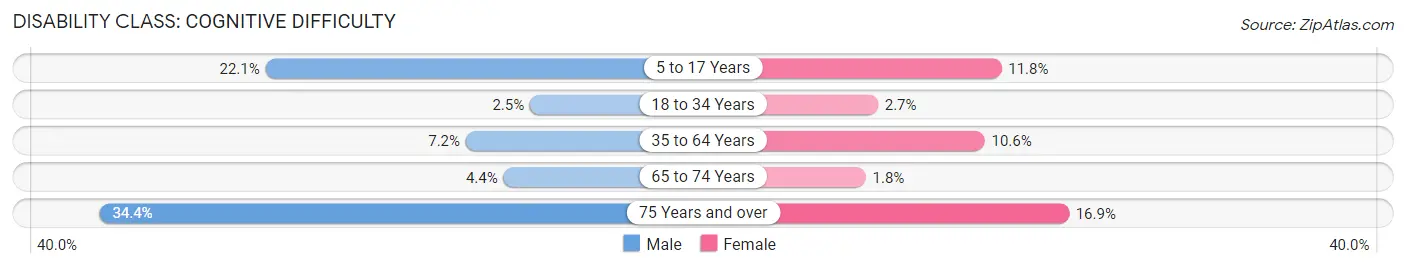
| Age Bracket | Male | Female |
| 5 to 17 Years | 21 (22.1%) | 18 (11.8%) |
| 18 to 34 Years | 4 (2.5%) | 5 (2.7%) |
| 35 to 64 Years | 22 (7.2%) | 39 (10.6%) |
| 65 to 74 Years | 2 (4.4%) | 2 (1.8%) |
| 75 Years and over | 31 (34.4%) | 15 (16.9%) |
Disability Class: Ambulatory Difficulty
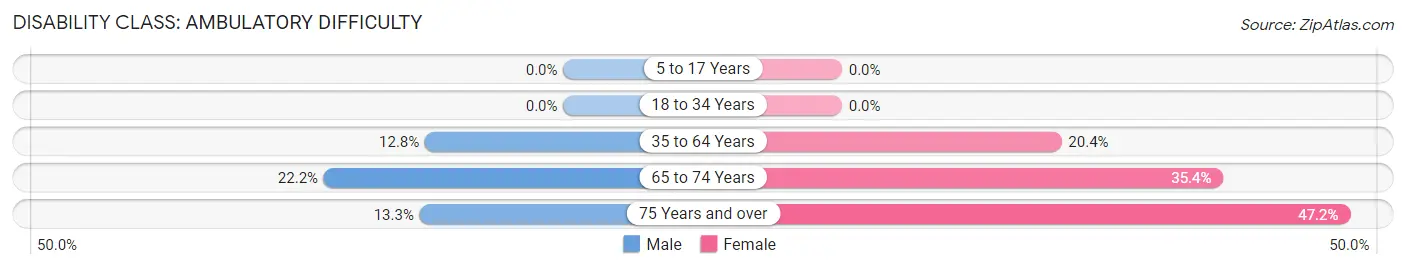
| Age Bracket | Male | Female |
| 5 to 17 Years | 0 (0.0%) | 0 (0.0%) |
| 18 to 34 Years | 0 (0.0%) | 0 (0.0%) |
| 35 to 64 Years | 39 (12.8%) | 75 (20.4%) |
| 65 to 74 Years | 10 (22.2%) | 40 (35.4%) |
| 75 Years and over | 12 (13.3%) | 42 (47.2%) |
Disability Class: Self-Care Difficulty
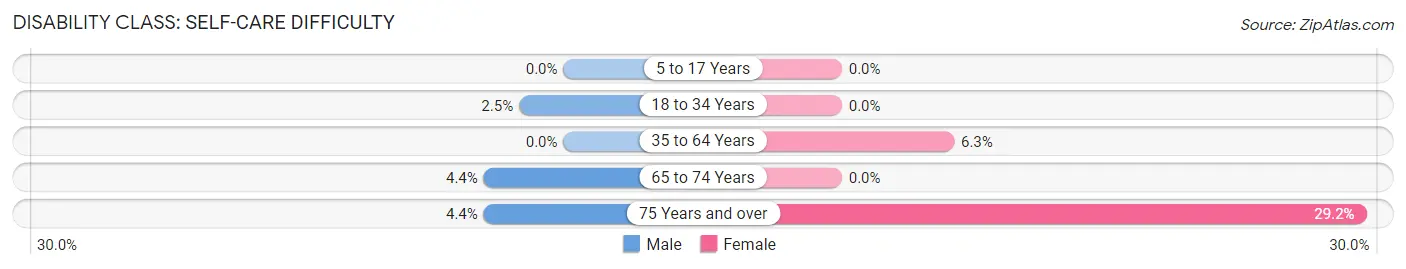
| Age Bracket | Male | Female |
| 5 to 17 Years | 0 (0.0%) | 0 (0.0%) |
| 18 to 34 Years | 4 (2.5%) | 0 (0.0%) |
| 35 to 64 Years | 0 (0.0%) | 23 (6.2%) |
| 65 to 74 Years | 2 (4.4%) | 0 (0.0%) |
| 75 Years and over | 4 (4.4%) | 26 (29.2%) |
Technology Access in Sneads
Computing Device Access in Sneads
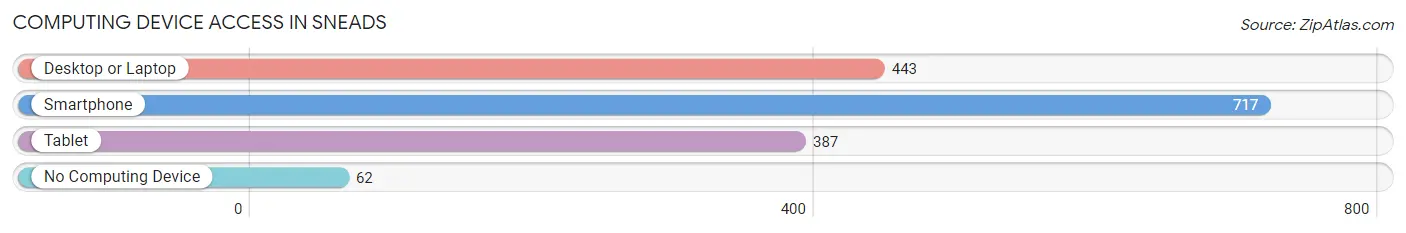
| Device Type | # Households | % Households |
| Desktop or Laptop | 443 | 55.0% |
| Smartphone | 717 | 89.0% |
| Tablet | 387 | 48.0% |
| No Computing Device | 62 | 7.7% |
| Total | 806 | 100.0% |
Internet Access in Sneads
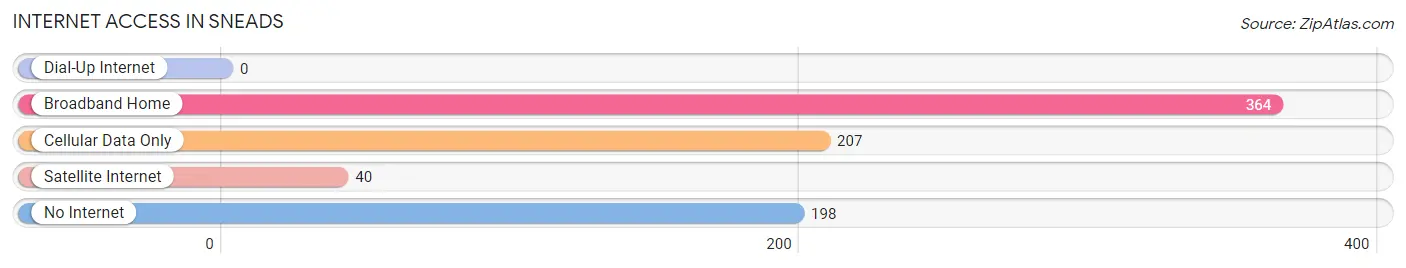
| Internet Type | # Households | % Households |
| Dial-Up Internet | 0 | 0.0% |
| Broadband Home | 364 | 45.2% |
| Cellular Data Only | 207 | 25.7% |
| Satellite Internet | 40 | 5.0% |
| No Internet | 198 | 24.6% |
| Total | 806 | 100.0% |
Sneads Summary
Sneads is a small town located in Jackson County, Florida. It is situated on the banks of the Chipola River, and is home to a population of approximately 1,500 people. The town was founded in 1891 and was named after the local creek, which was named after a prominent local family.
History
Sneads was founded in 1891 by a group of settlers from Georgia and Alabama. The town was named after the local creek, which was named after a prominent local family. The town was originally a farming community, and the main crops grown were cotton, corn, and peanuts. The town was also home to a number of sawmills and turpentine stills.
In the early 1900s, the town began to grow and develop. The first bank was established in 1906, and the first school was built in 1909. The town also had a post office, a hotel, and a number of stores.
In the 1920s, the town began to experience a period of growth and prosperity. The population increased from 500 to 1,000, and the town was home to a number of businesses, including a movie theater, a drug store, and a number of restaurants.
In the 1950s, the town began to decline. The population decreased, and many of the businesses closed. The town was also hit hard by the Great Depression.
In the 1970s, the town began to experience a period of revitalization. The population increased, and new businesses opened. The town was also home to a number of festivals, including the annual Sneads Watermelon Festival.
Geography
Sneads is located in Jackson County, Florida. It is situated on the banks of the Chipola River, and is approximately 20 miles north of Marianna. The town is located in the Florida Panhandle, and is surrounded by a number of small towns and rural areas.
The town is located in a humid subtropical climate zone, and experiences hot, humid summers and mild winters. The average temperature in the summer is around 90 degrees Fahrenheit, and the average temperature in the winter is around 60 degrees Fahrenheit.
Economy
The economy of Sneads is largely based on agriculture and tourism. The town is home to a number of farms, and the main crops grown are cotton, corn, and peanuts. The town is also home to a number of restaurants, hotels, and other businesses that cater to tourists.
The town is also home to a number of manufacturing businesses, including a furniture factory and a woodworking plant. The town is also home to a number of retail stores, including a grocery store, a hardware store, and a number of clothing stores.
Demographics
As of the 2010 census, the population of Sneads was 1,500. The racial makeup of the town was 79.2% White, 17.3% African American, 0.7% Native American, 0.3% Asian, 0.1% Pacific Islander, and 2.4% from other races. The median household income was $25,000, and the median family income was $30,000. The per capita income was $14,000.
Conclusion
Sneads is a small town located in Jackson County, Florida. It is situated on the banks of the Chipola River, and is home to a population of approximately 1,500 people. The town was founded in 1891 and was named after the local creek, which was named after a prominent local family. The economy of Sneads is largely based on agriculture and tourism, and the town is home to a number of farms, restaurants, hotels, and other businesses. The population of Sneads is largely White, with a small percentage of African Americans, Native Americans, Asians, and Pacific Islanders. The median household income is $25,000, and the median family income is $30,000.
Common Questions
What is Per Capita Income in Sneads?
Per Capita income in Sneads is $30,366.
What is the Median Family Income in Sneads?
Median Family Income in Sneads is $64,000.
What is the Median Household income in Sneads?
Median Household Income in Sneads is $41,827.
What is Income or Wage Gap in Sneads?
Income or Wage Gap in Sneads is 5.0%.
Women in Sneads earn 95.0 cents for every dollar earned by a man.
What is Inequality or Gini Index in Sneads?
Inequality or Gini Index in Sneads is 0.46.
What is the Total Population of Sneads?
Total Population of Sneads is 1,744.
What is the Total Male Population of Sneads?
Total Male Population of Sneads is 807.
What is the Total Female Population of Sneads?
Total Female Population of Sneads is 937.
What is the Ratio of Males per 100 Females in Sneads?
There are 86.13 Males per 100 Females in Sneads.
What is the Ratio of Females per 100 Males in Sneads?
There are 116.11 Females per 100 Males in Sneads.
What is the Median Population Age in Sneads?
Median Population Age in Sneads is 38.8 Years.
What is the Average Family Size in Sneads
Average Family Size in Sneads is 2.8 People.
What is the Average Household Size in Sneads
Average Household Size in Sneads is 2.2 People.
How Large is the Labor Force in Sneads?
There are 799 People in the Labor Forcein in Sneads.
What is the Percentage of People in the Labor Force in Sneads?
58.0% of People are in the Labor Force in Sneads.
What is the Unemployment Rate in Sneads?
Unemployment Rate in Sneads is 5.9%.