Shalimar, FL Map & Demographics
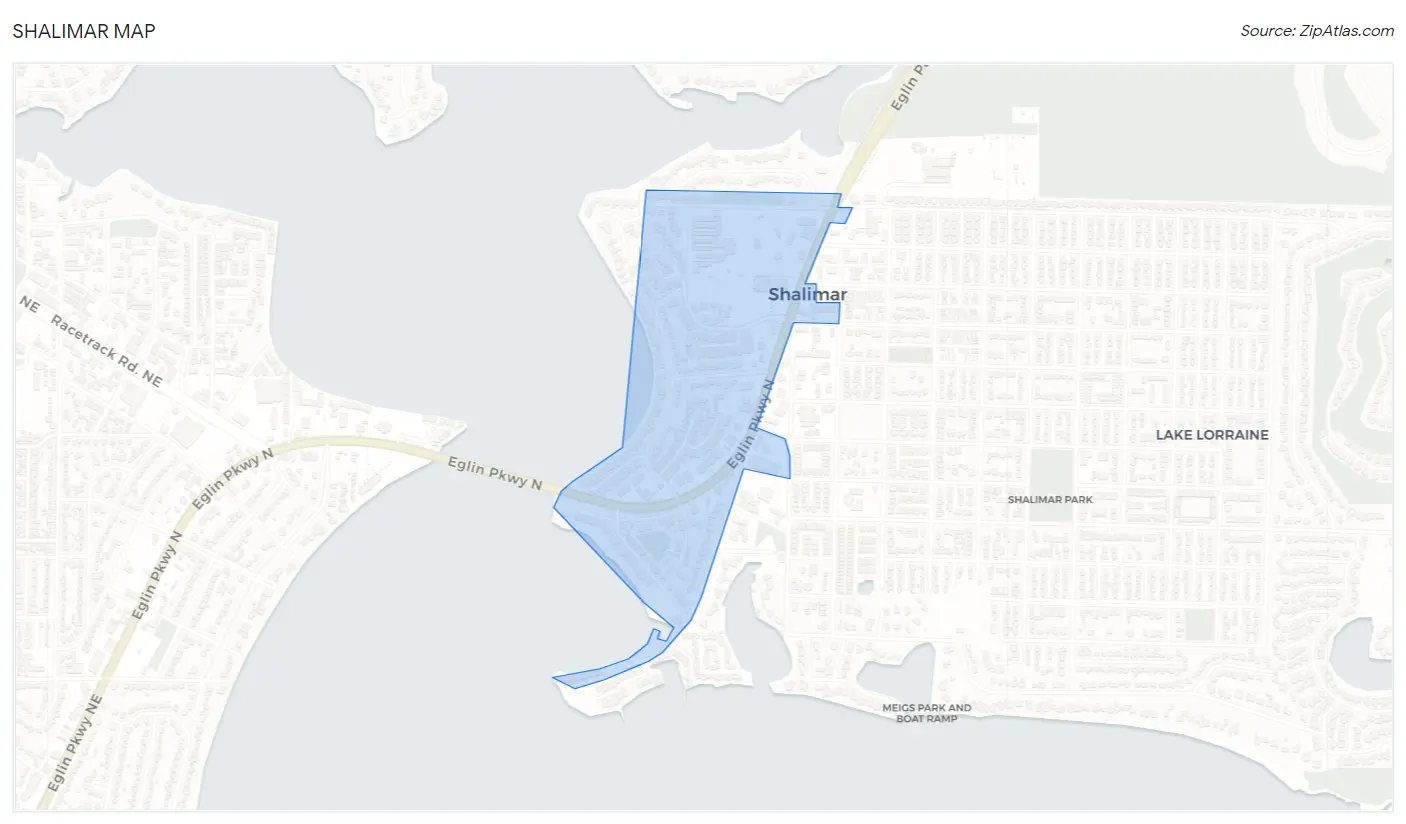
Shalimar Map
Shalimar Overview
$51,917
PER CAPITA INCOME
$112,292
AVG FAMILY INCOME
$104,265
AVG HOUSEHOLD INCOME
0.30
INEQUALITY / GINI INDEX
918
TOTAL POPULATION
412
MALE POPULATION
506
FEMALE POPULATION
81.42
MALES / 100 FEMALES
122.82
FEMALES / 100 MALES
43.7
MEDIAN AGE
2.8
AVG FAMILY SIZE
2.3
AVG HOUSEHOLD SIZE
526
LABOR FORCE [ PEOPLE ]
65.0%
PERCENT IN LABOR FORCE
7.1%
UNEMPLOYMENT RATE
Shalimar Zip Codes
Shalimar Area Codes
Income in Shalimar
Income Overview in Shalimar
Per Capita Income in Shalimar is $51,917, while median incomes of families and households are $112,292 and $104,265 respectively.
| Characteristic | Number | Measure |
| Per Capita Income | 918 | $51,917 |
| Median Family Income | 270 | $112,292 |
| Mean Family Income | 270 | $129,276 |
| Median Household Income | 396 | $104,265 |
| Mean Household Income | 396 | $120,534 |
| Income Deficit | 270 | $0 |
| Wage / Income Gap (%) | 918 | 0.00% |
| Wage / Income Gap ($) | 918 | 100.00¢ per $1 |
| Gini / Inequality Index | 918 | 0.30 |
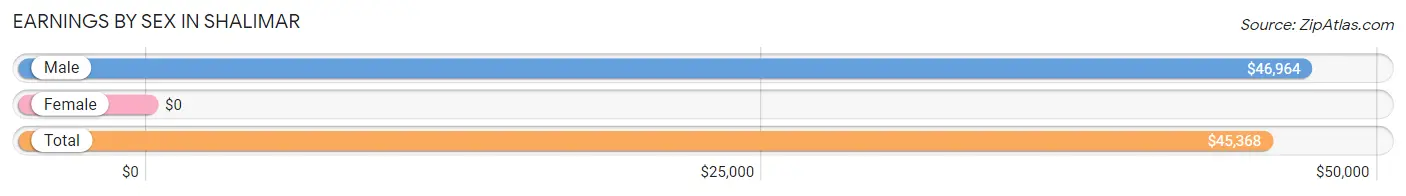
Earnings by Sex in Shalimar
| Sex | Number | Average Earnings |
| Male | 234 (42.8%) | $46,964 |
| Female | 313 (57.2%) | $0 |
| Total | 547 (100.0%) | $45,368 |
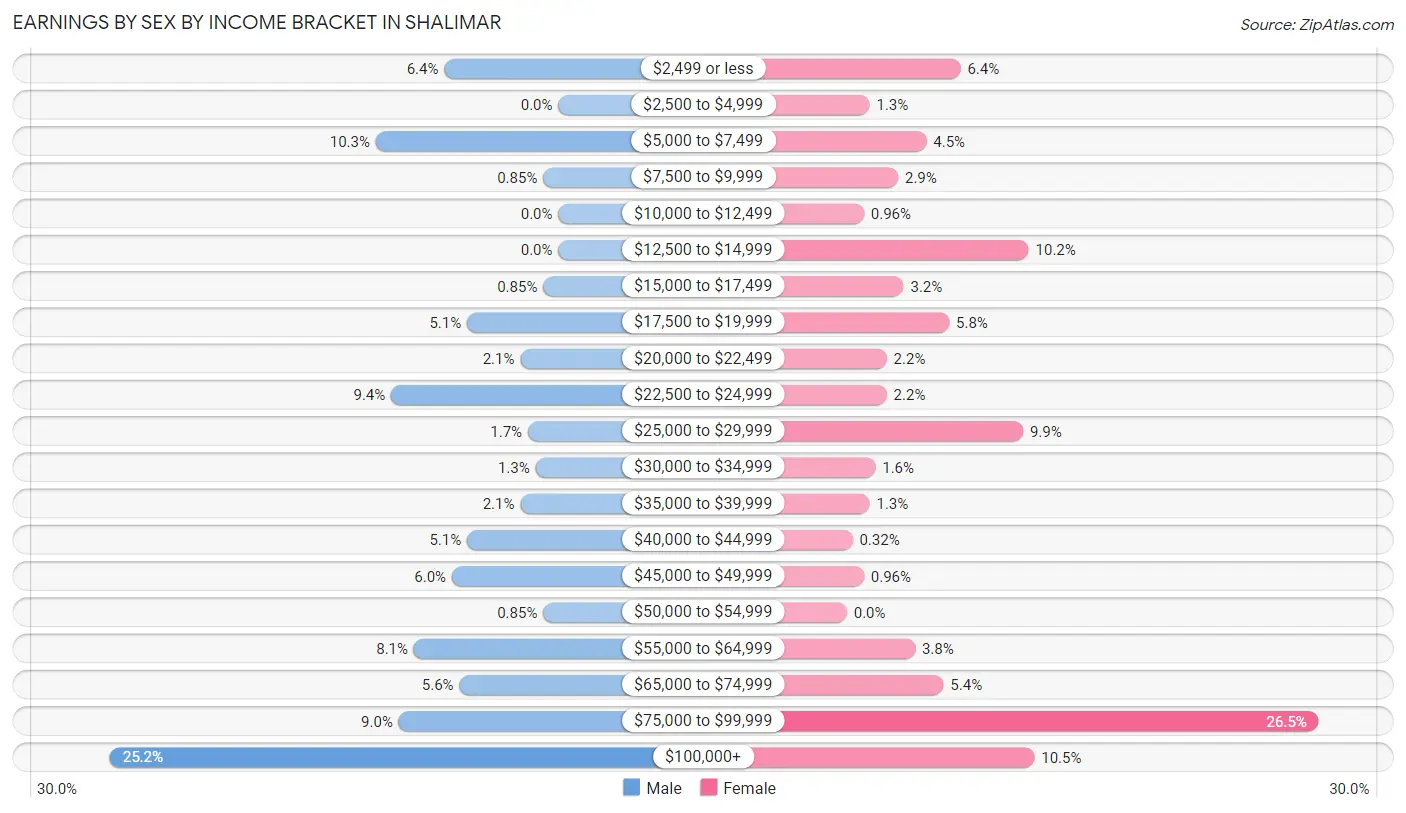
Earnings by Sex by Income Bracket in Shalimar
The most common earnings brackets in Shalimar are $100,000+ for men (59 | 25.2%) and $75,000 to $99,999 for women (83 | 26.5%).
| Income | Male | Female |
| $2,499 or less | 15 (6.4%) | 20 (6.4%) |
| $2,500 to $4,999 | 0 (0.0%) | 4 (1.3%) |
| $5,000 to $7,499 | 24 (10.3%) | 14 (4.5%) |
| $7,500 to $9,999 | 2 (0.9%) | 9 (2.9%) |
| $10,000 to $12,499 | 0 (0.0%) | 3 (1.0%) |
| $12,500 to $14,999 | 0 (0.0%) | 32 (10.2%) |
| $15,000 to $17,499 | 2 (0.9%) | 10 (3.2%) |
| $17,500 to $19,999 | 12 (5.1%) | 18 (5.8%) |
| $20,000 to $22,499 | 5 (2.1%) | 7 (2.2%) |
| $22,500 to $24,999 | 22 (9.4%) | 7 (2.2%) |
| $25,000 to $29,999 | 4 (1.7%) | 31 (9.9%) |
| $30,000 to $34,999 | 3 (1.3%) | 5 (1.6%) |
| $35,000 to $39,999 | 5 (2.1%) | 4 (1.3%) |
| $40,000 to $44,999 | 12 (5.1%) | 1 (0.3%) |
| $45,000 to $49,999 | 14 (6.0%) | 3 (1.0%) |
| $50,000 to $54,999 | 2 (0.9%) | 0 (0.0%) |
| $55,000 to $64,999 | 19 (8.1%) | 12 (3.8%) |
| $65,000 to $74,999 | 13 (5.6%) | 17 (5.4%) |
| $75,000 to $99,999 | 21 (9.0%) | 83 (26.5%) |
| $100,000+ | 59 (25.2%) | 33 (10.5%) |
| Total | 234 (100.0%) | 313 (100.0%) |
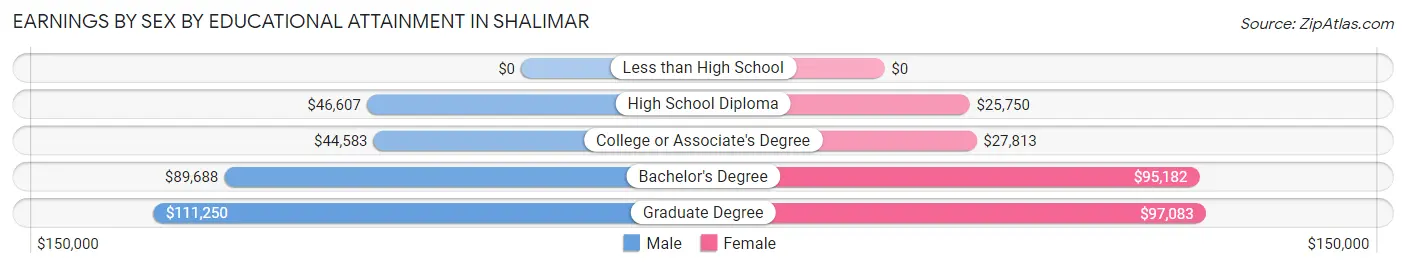
Earnings by Sex by Educational Attainment in Shalimar
Average earnings in Shalimar are $60,000 for men and $68,365 for women, a difference of 12.2%. Men with an educational attainment of graduate degree enjoy the highest average annual earnings of $111,250, while those with college or associate's degree education earn the least with $44,583. Women with an educational attainment of graduate degree earn the most with the average annual earnings of $97,083, while those with high school diploma education have the smallest earnings of $25,750.
| Educational Attainment | Male Income | Female Income |
| Less than High School | - | - |
| High School Diploma | $46,607 | $25,750 |
| College or Associate's Degree | $44,583 | $27,813 |
| Bachelor's Degree | $89,688 | $95,182 |
| Graduate Degree | $111,250 | $97,083 |
| Total | $60,000 | $68,365 |
Family Income in Shalimar
Family Income Brackets in Shalimar
According to the Shalimar family income data, there are 86 families falling into the $100,000 to $149,999 income range, which is the most common income bracket and makes up 31.9% of all families.
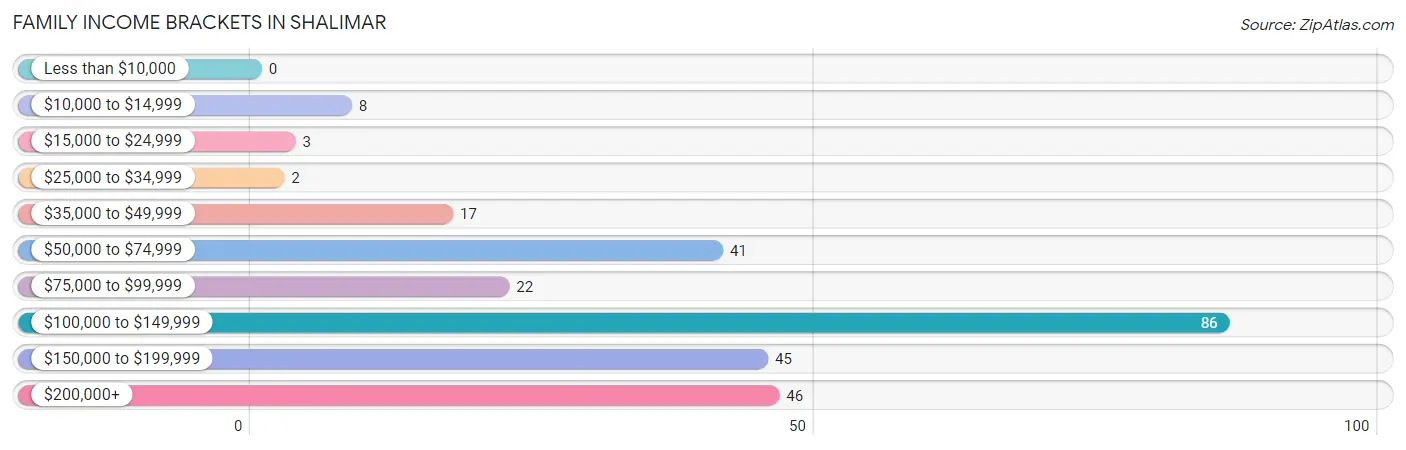
| Income Bracket | # Families | % Families |
| Less than $10,000 | 0 | 0.0% |
| $10,000 to $14,999 | 8 | 3.0% |
| $15,000 to $24,999 | 3 | 1.1% |
| $25,000 to $34,999 | 2 | 0.7% |
| $35,000 to $49,999 | 17 | 6.3% |
| $50,000 to $74,999 | 41 | 15.2% |
| $75,000 to $99,999 | 22 | 8.1% |
| $100,000 to $149,999 | 86 | 31.9% |
| $150,000 to $199,999 | 45 | 16.7% |
| $200,000+ | 46 | 17.0% |
Family Income by Famaliy Size in Shalimar
5-person families (7 | 2.6%) account for the highest median family income in Shalimar with $158,125 per family, while 2-person families (175 | 64.8%) have the highest median income of $53,680 per family member.
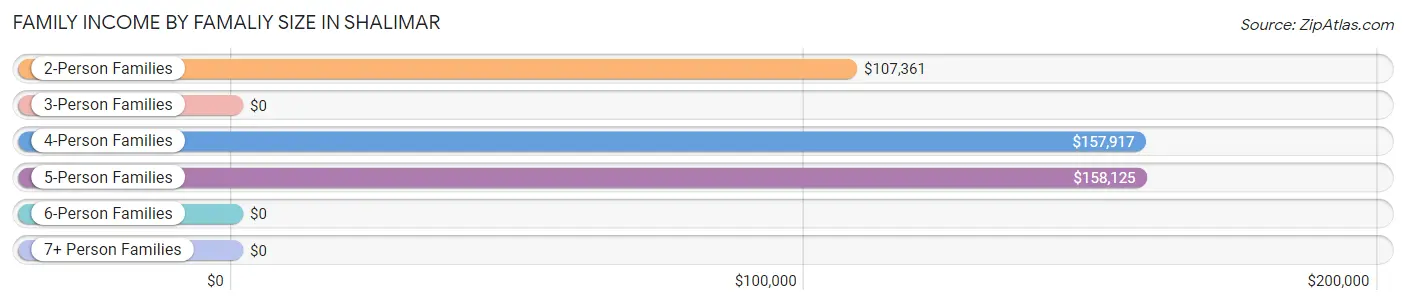
| Income Bracket | # Families | Median Income |
| 2-Person Families | 175 (64.8%) | $107,361 |
| 3-Person Families | 25 (9.3%) | $0 |
| 4-Person Families | 57 (21.1%) | $157,917 |
| 5-Person Families | 7 (2.6%) | $158,125 |
| 6-Person Families | 3 (1.1%) | $0 |
| 7+ Person Families | 3 (1.1%) | $0 |
| Total | 270 (100.0%) | $112,292 |
Family Income by Number of Earners in Shalimar
The median family income in Shalimar is $112,292, with families comprising 2 earners (94) having the highest median family income of $158,500, while families with 1 earner (72) have the lowest median family income of $88,750, accounting for 34.8% and 26.7% of families, respectively.
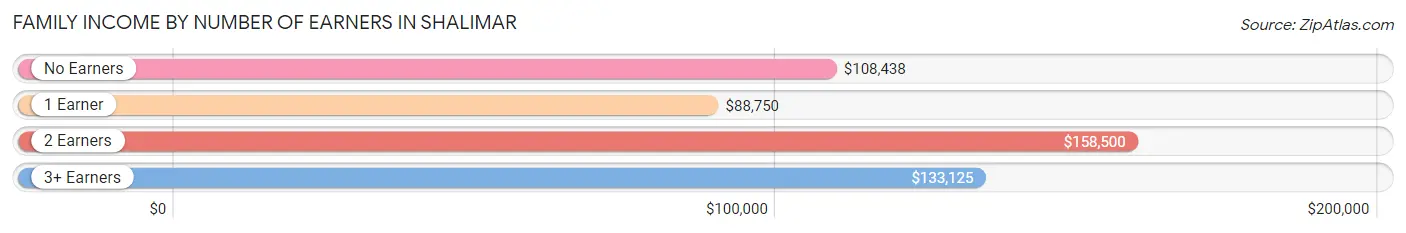
| Number of Earners | # Families | Median Income |
| No Earners | 67 (24.8%) | $108,438 |
| 1 Earner | 72 (26.7%) | $88,750 |
| 2 Earners | 94 (34.8%) | $158,500 |
| 3+ Earners | 37 (13.7%) | $133,125 |
| Total | 270 (100.0%) | $112,292 |
Household Income in Shalimar
Household Income Brackets in Shalimar
With 94 households falling in the category, the $100,000 to $149,999 income range is the most frequent in Shalimar, accounting for 23.7% of all households. In contrast, only 3 households (0.8%) fall into the less than $10,000 income bracket, making it the least populous group.
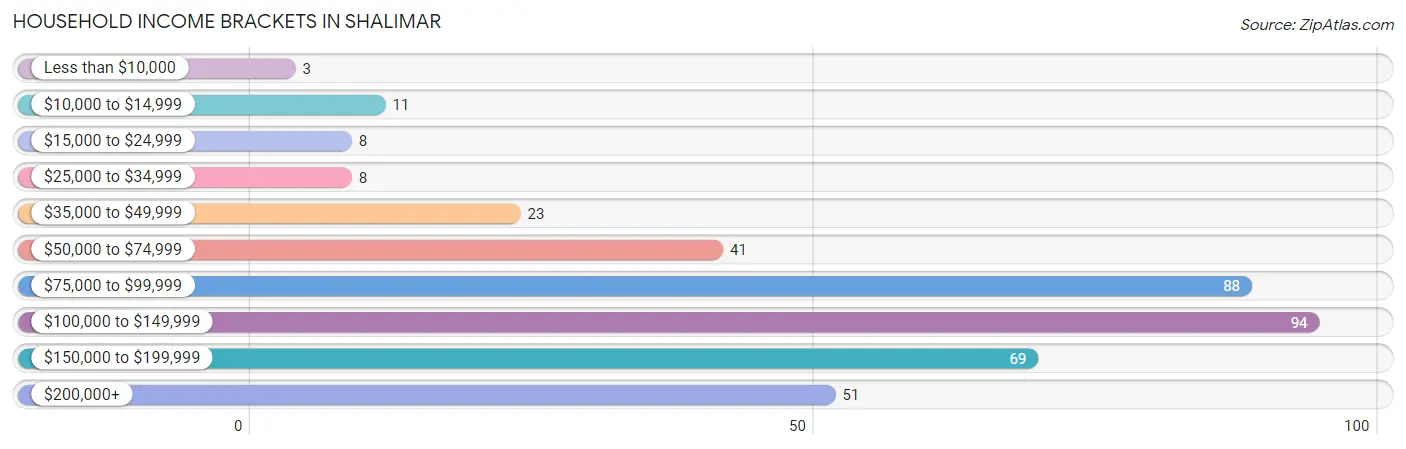
| Income Bracket | # Households | % Households |
| Less than $10,000 | 3 | 0.8% |
| $10,000 to $14,999 | 11 | 2.8% |
| $15,000 to $24,999 | 8 | 2.0% |
| $25,000 to $34,999 | 8 | 2.0% |
| $35,000 to $49,999 | 23 | 5.8% |
| $50,000 to $74,999 | 41 | 10.4% |
| $75,000 to $99,999 | 88 | 22.2% |
| $100,000 to $149,999 | 94 | 23.7% |
| $150,000 to $199,999 | 69 | 17.4% |
| $200,000+ | 51 | 12.9% |
Household Income by Householder Age in Shalimar
The median household income in Shalimar is $104,265, with the highest median household income of $138,438 found in the 45 to 64 years age bracket for the primary householder. A total of 115 households (29.0%) fall into this category. Meanwhile, the 15 to 24 years age bracket for the primary householder has the lowest median household income of $0, with 16 households (4.0%) in this group.
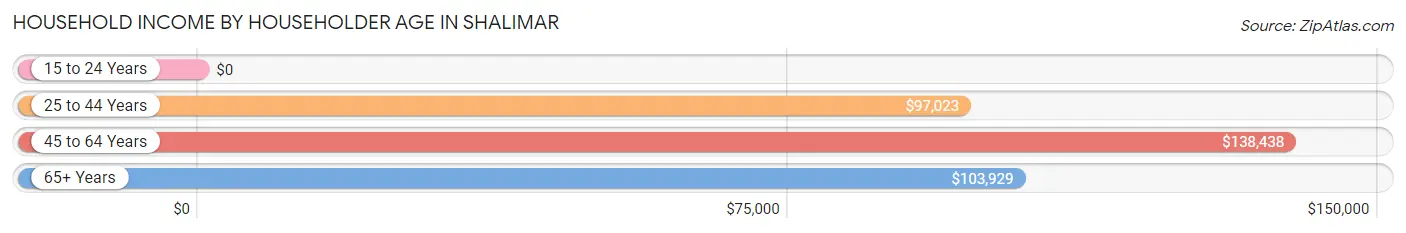
| Income Bracket | # Households | Median Income |
| 15 to 24 Years | 16 (4.0%) | $0 |
| 25 to 44 Years | 125 (31.6%) | $97,023 |
| 45 to 64 Years | 115 (29.0%) | $138,438 |
| 65+ Years | 140 (35.3%) | $103,929 |
| Total | 396 (100.0%) | $104,265 |
Poverty in Shalimar
Income Below Poverty by Sex and Age in Shalimar
With 7.0% poverty level for males and 5.9% for females among the residents of Shalimar, 25 to 34 year old males and 55 to 64 year old females are the most vulnerable to poverty, with 12 males (26.1%) and 11 females (17.2%) in their respective age groups living below the poverty level.
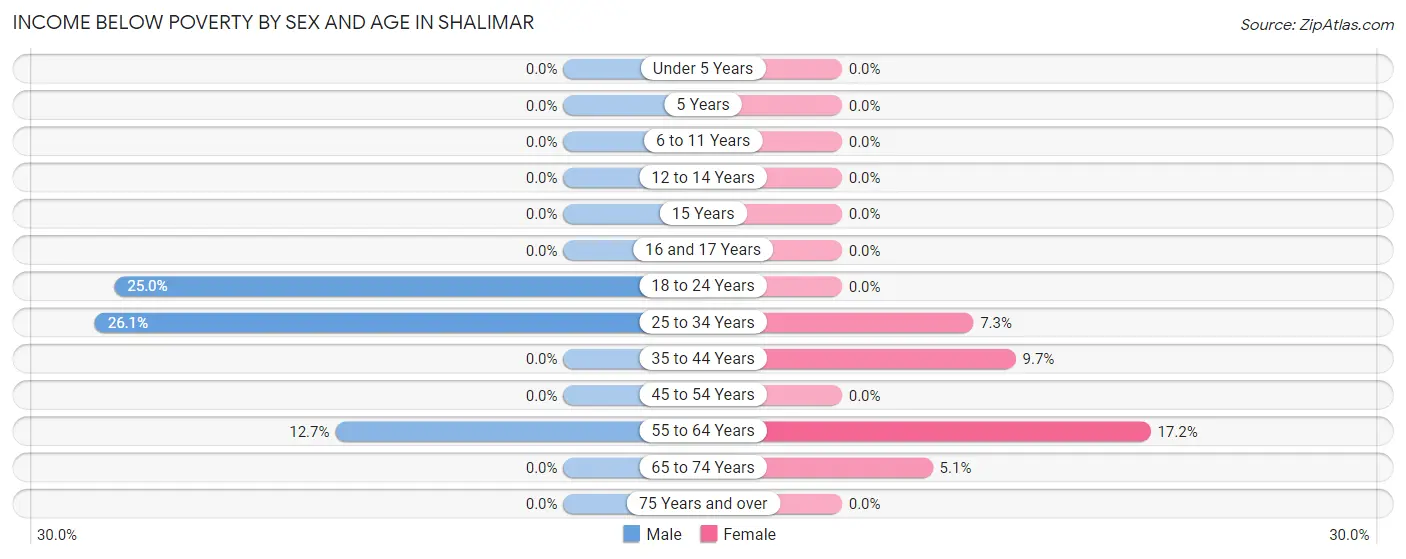
| Age Bracket | Male | Female |
| Under 5 Years | 0 (0.0%) | 0 (0.0%) |
| 5 Years | 0 (0.0%) | 0 (0.0%) |
| 6 to 11 Years | 0 (0.0%) | 0 (0.0%) |
| 12 to 14 Years | 0 (0.0%) | 0 (0.0%) |
| 15 Years | 0 (0.0%) | 0 (0.0%) |
| 16 and 17 Years | 0 (0.0%) | 0 (0.0%) |
| 18 to 24 Years | 9 (25.0%) | 0 (0.0%) |
| 25 to 34 Years | 12 (26.1%) | 3 (7.3%) |
| 35 to 44 Years | 0 (0.0%) | 12 (9.7%) |
| 45 to 54 Years | 0 (0.0%) | 0 (0.0%) |
| 55 to 64 Years | 8 (12.7%) | 11 (17.2%) |
| 65 to 74 Years | 0 (0.0%) | 4 (5.1%) |
| 75 Years and over | 0 (0.0%) | 0 (0.0%) |
| Total | 29 (7.0%) | 30 (5.9%) |
Income Above Poverty by Sex and Age in Shalimar
According to the poverty statistics in Shalimar, males aged under 5 years and females aged under 5 years are the age groups that are most secure financially, with 100.0% of males and 100.0% of females in these age groups living above the poverty line.
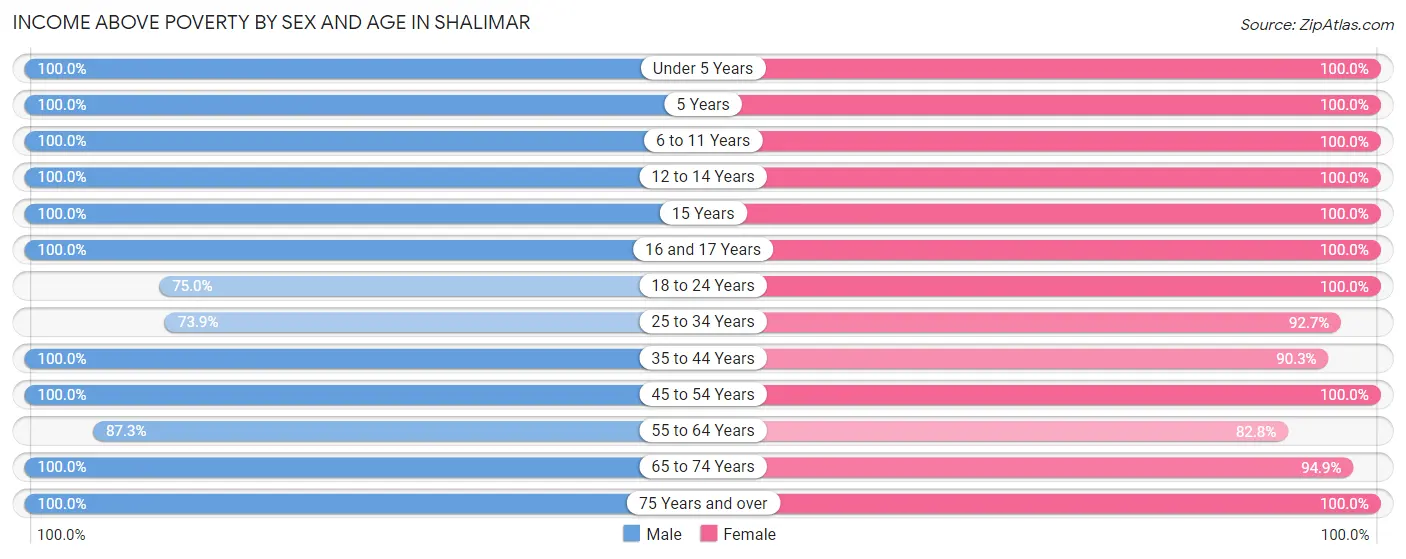
| Age Bracket | Male | Female |
| Under 5 Years | 21 (100.0%) | 10 (100.0%) |
| 5 Years | 3 (100.0%) | 3 (100.0%) |
| 6 to 11 Years | 14 (100.0%) | 32 (100.0%) |
| 12 to 14 Years | 10 (100.0%) | 9 (100.0%) |
| 15 Years | 1 (100.0%) | 4 (100.0%) |
| 16 and 17 Years | 13 (100.0%) | 11 (100.0%) |
| 18 to 24 Years | 27 (75.0%) | 58 (100.0%) |
| 25 to 34 Years | 34 (73.9%) | 38 (92.7%) |
| 35 to 44 Years | 32 (100.0%) | 112 (90.3%) |
| 45 to 54 Years | 48 (100.0%) | 36 (100.0%) |
| 55 to 64 Years | 55 (87.3%) | 53 (82.8%) |
| 65 to 74 Years | 67 (100.0%) | 75 (94.9%) |
| 75 Years and over | 58 (100.0%) | 33 (100.0%) |
| Total | 383 (93.0%) | 474 (94.1%) |
Income Below Poverty Among Married-Couple Families in Shalimar
The poverty statistics for married-couple families in Shalimar show that 3.4% or 8 of the total 239 families live below the poverty line. Families with no children have the highest poverty rate of 4.2%, comprising of 8 families. On the other hand, families with 1 or 2 children have the lowest poverty rate of 0.0%, which includes 0 families.
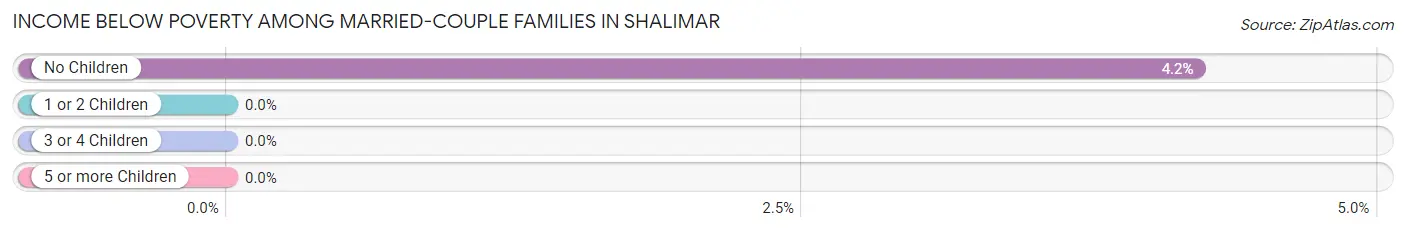
| Children | Above Poverty | Below Poverty |
| No Children | 182 (95.8%) | 8 (4.2%) |
| 1 or 2 Children | 37 (100.0%) | 0 (0.0%) |
| 3 or 4 Children | 11 (100.0%) | 0 (0.0%) |
| 5 or more Children | 1 (100.0%) | 0 (0.0%) |
| Total | 231 (96.7%) | 8 (3.4%) |
Income Below Poverty Among Single-Parent Households in Shalimar
| Children | Single Father | Single Mother |
| No Children | 0 (0.0%) | 0 (0.0%) |
| 1 or 2 Children | 0 (0.0%) | 0 (0.0%) |
| 3 or 4 Children | 0 (0.0%) | 0 (0.0%) |
| 5 or more Children | 0 (0.0%) | 0 (0.0%) |
| Total | 0 (0.0%) | 0 (0.0%) |
Income Below Poverty Among Married-Couple vs Single-Parent Households in Shalimar
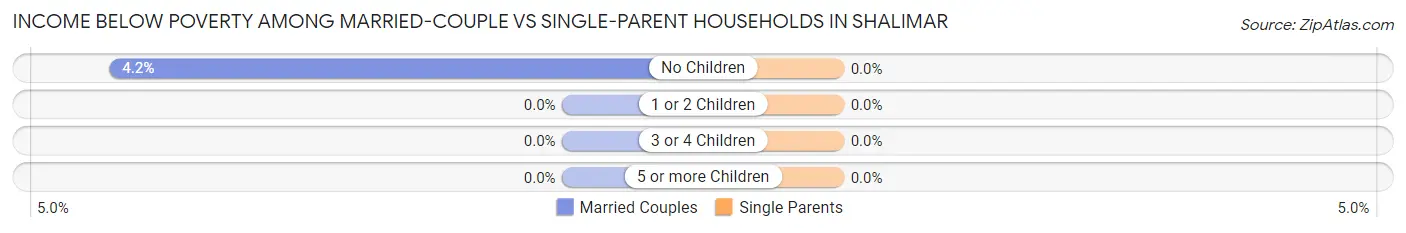
| Children | Married-Couple Families | Single-Parent Households |
| No Children | 8 (4.2%) | 0 (0.0%) |
| 1 or 2 Children | 0 (0.0%) | 0 (0.0%) |
| 3 or 4 Children | 0 (0.0%) | 0 (0.0%) |
| 5 or more Children | 0 (0.0%) | 0 (0.0%) |
| Total | 8 (3.4%) | 0 (0.0%) |
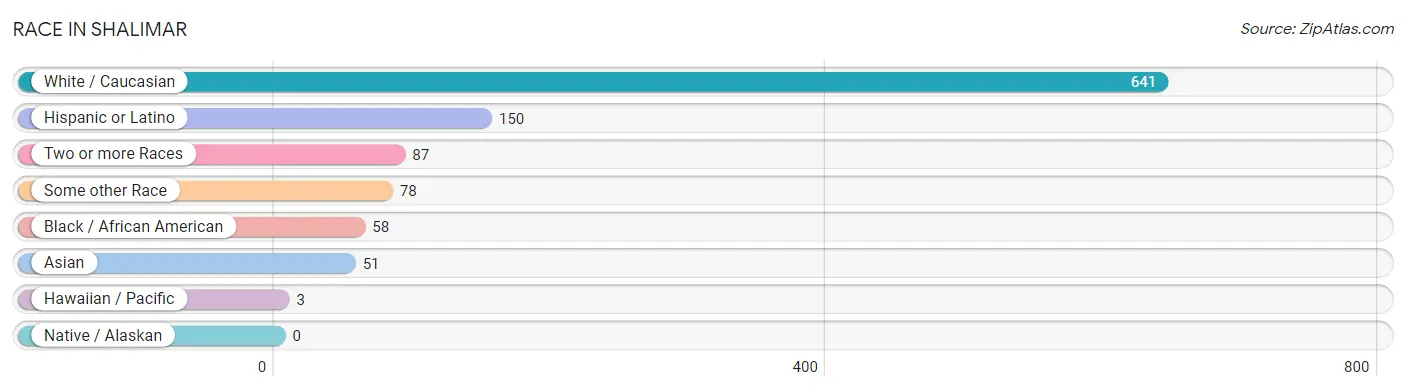
Race in Shalimar
The most populous races in Shalimar are White / Caucasian (641 | 69.8%), Hispanic or Latino (150 | 16.3%), and Two or more Races (87 | 9.5%).
| Race | # Population | % Population |
| Asian | 51 | 5.6% |
| Black / African American | 58 | 6.3% |
| Hawaiian / Pacific | 3 | 0.3% |
| Hispanic or Latino | 150 | 16.3% |
| Native / Alaskan | 0 | 0.0% |
| White / Caucasian | 641 | 69.8% |
| Two or more Races | 87 | 9.5% |
| Some other Race | 78 | 8.5% |
| Total | 918 | 100.0% |
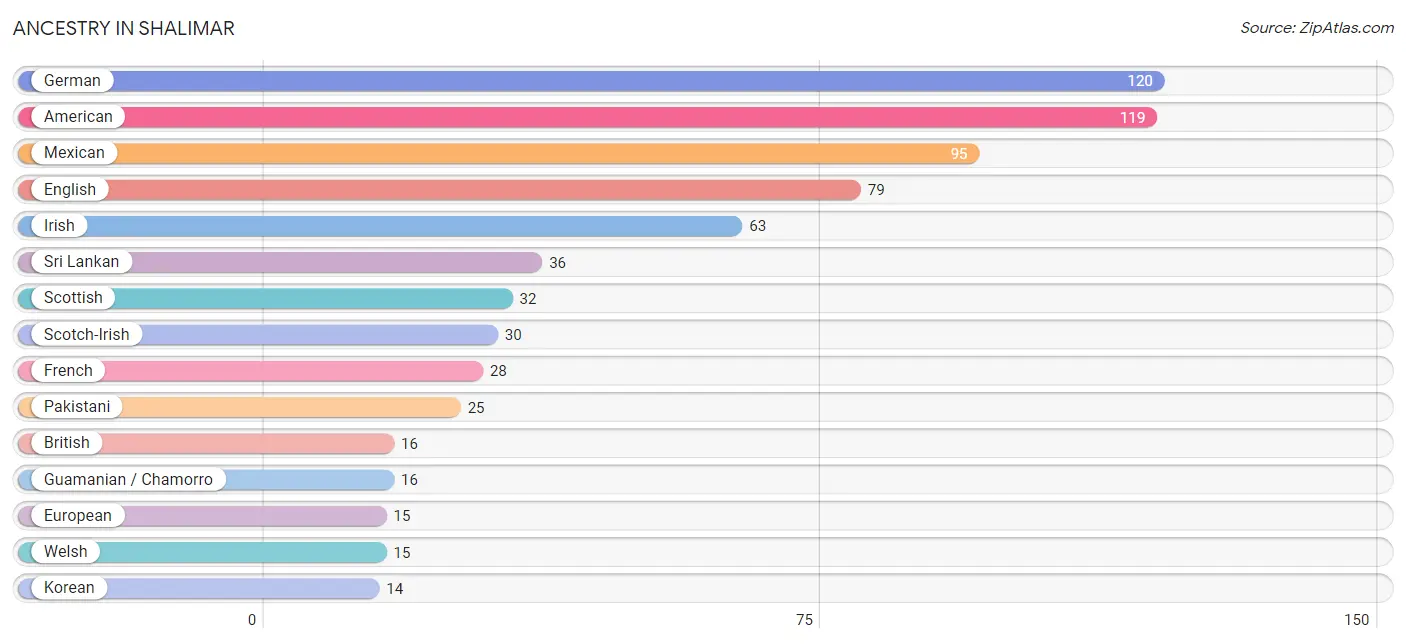
Ancestry in Shalimar
The most populous ancestries reported in Shalimar are German (120 | 13.1%), American (119 | 13.0%), Mexican (95 | 10.3%), English (79 | 8.6%), and Irish (63 | 6.9%), together accounting for 51.8% of all Shalimar residents.
| Ancestry | # Population | % Population |
| American | 119 | 13.0% |
| Belgian | 2 | 0.2% |
| Brazilian | 12 | 1.3% |
| British | 16 | 1.7% |
| Burmese | 1 | 0.1% |
| Central American | 13 | 1.4% |
| Colombian | 2 | 0.2% |
| Danish | 6 | 0.6% |
| Dutch | 2 | 0.2% |
| Ecuadorian | 2 | 0.2% |
| English | 79 | 8.6% |
| European | 15 | 1.6% |
| Filipino | 4 | 0.4% |
| French | 28 | 3.0% |
| German | 120 | 13.1% |
| Guamanian / Chamorro | 16 | 1.7% |
| Guatemalan | 8 | 0.9% |
| Honduran | 5 | 0.5% |
| Hungarian | 2 | 0.2% |
| Indian (Asian) | 9 | 1.0% |
| Irish | 63 | 6.9% |
| Italian | 11 | 1.2% |
| Korean | 14 | 1.5% |
| Mexican | 95 | 10.3% |
| Native Hawaiian | 7 | 0.8% |
| Northern European | 3 | 0.3% |
| Pakistani | 25 | 2.7% |
| Polish | 7 | 0.8% |
| Portuguese | 7 | 0.8% |
| Puerto Rican | 14 | 1.5% |
| Scandinavian | 7 | 0.8% |
| Scotch-Irish | 30 | 3.3% |
| Scottish | 32 | 3.5% |
| Slavic | 5 | 0.5% |
| South American | 4 | 0.4% |
| Spaniard | 3 | 0.3% |
| Spanish | 4 | 0.4% |
| Sri Lankan | 36 | 3.9% |
| Swedish | 11 | 1.2% |
| Turkish | 3 | 0.3% |
| Welsh | 15 | 1.6% | View All 41 Rows |
Immigrants in Shalimar
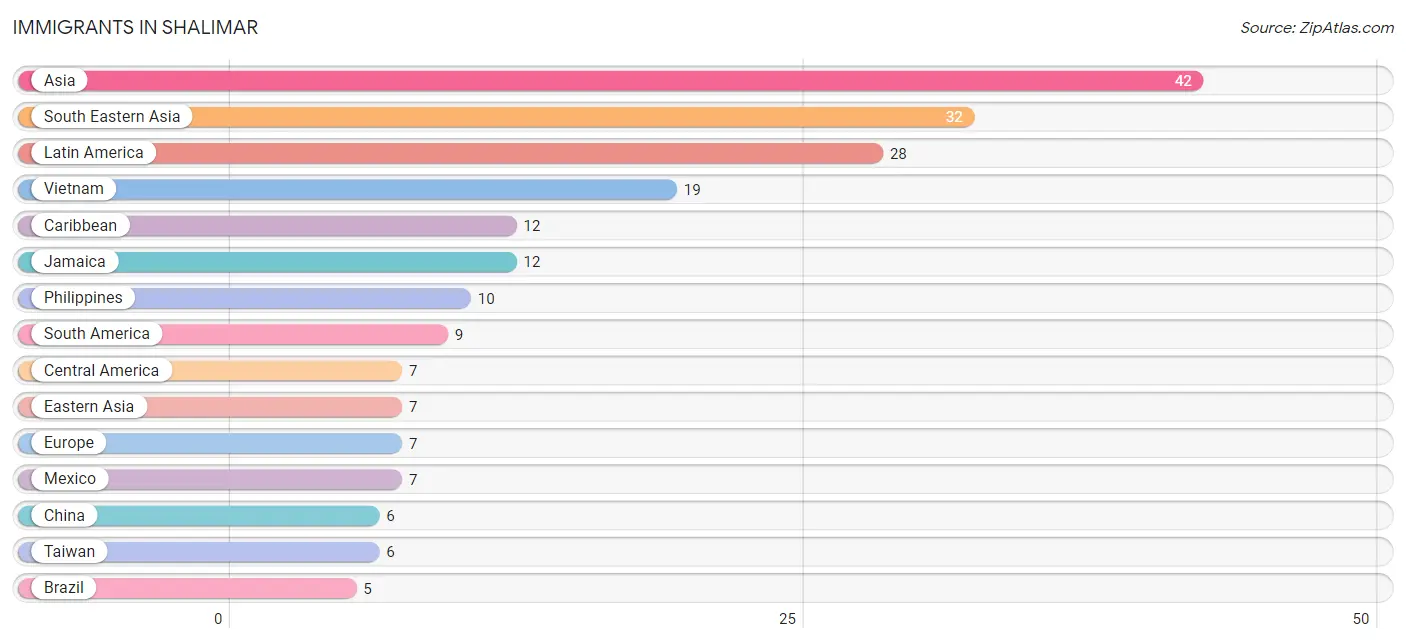
The most numerous immigrant groups reported in Shalimar came from Asia (42 | 4.6%), South Eastern Asia (32 | 3.5%), Latin America (28 | 3.0%), Vietnam (19 | 2.1%), and Caribbean (12 | 1.3%), together accounting for 14.5% of all Shalimar residents.
| Immigration Origin | # Population | % Population |
| Asia | 42 | 4.6% |
| Brazil | 5 | 0.5% |
| Caribbean | 12 | 1.3% |
| Central America | 7 | 0.8% |
| China | 6 | 0.6% |
| Colombia | 2 | 0.2% |
| Eastern Asia | 7 | 0.8% |
| Ecuador | 2 | 0.2% |
| England | 2 | 0.2% |
| Europe | 7 | 0.8% |
| Germany | 2 | 0.2% |
| Jamaica | 12 | 1.3% |
| Korea | 1 | 0.1% |
| Latin America | 28 | 3.0% |
| Mexico | 7 | 0.8% |
| Northern Europe | 2 | 0.2% |
| Philippines | 10 | 1.1% |
| South America | 9 | 1.0% |
| South Eastern Asia | 32 | 3.5% |
| Southern Europe | 3 | 0.3% |
| Spain | 3 | 0.3% |
| Taiwan | 6 | 0.6% |
| Thailand | 3 | 0.3% |
| Turkey | 3 | 0.3% |
| Vietnam | 19 | 2.1% |
| Western Asia | 3 | 0.3% |
| Western Europe | 2 | 0.2% | View All 27 Rows |
Sex and Age in Shalimar
Sex and Age in Shalimar
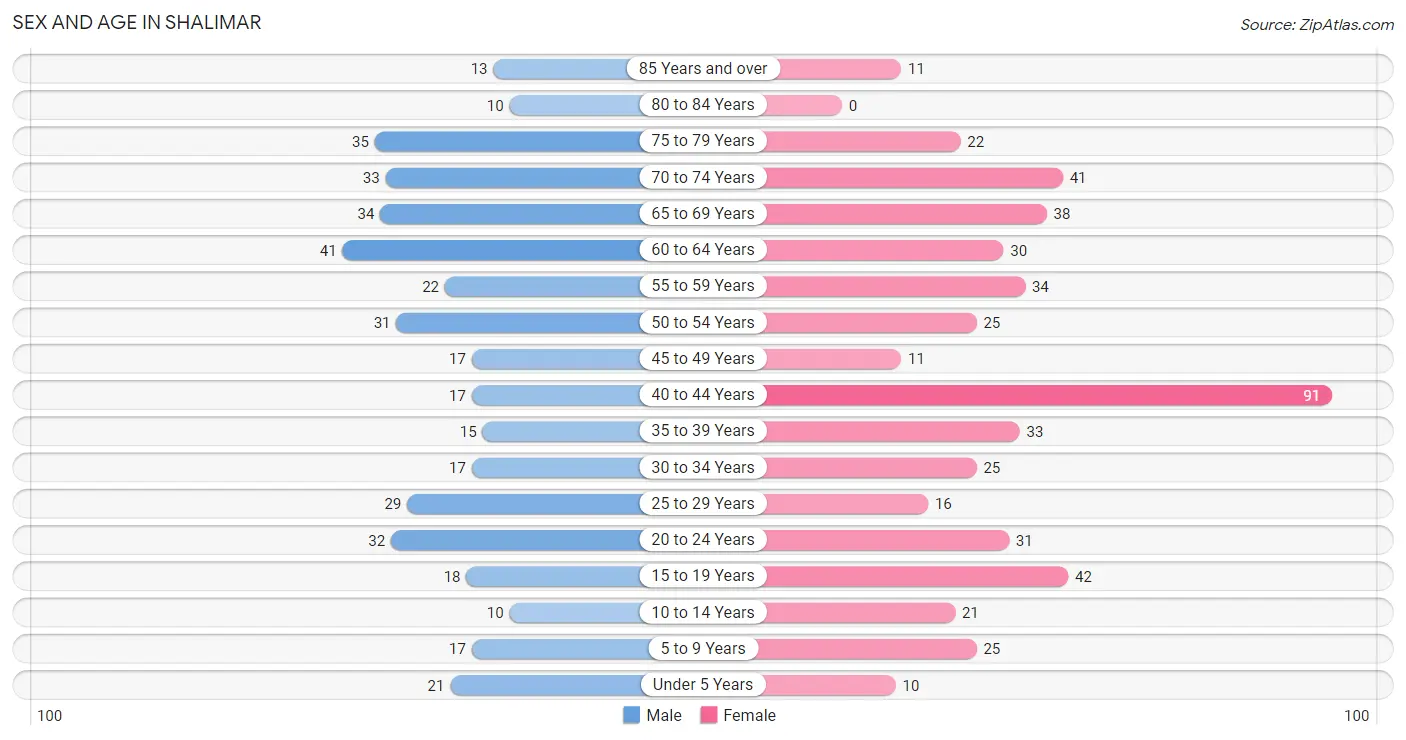
The most populous age groups in Shalimar are 60 to 64 Years (41 | 10.0%) for men and 40 to 44 Years (91 | 18.0%) for women.
| Age Bracket | Male | Female |
| Under 5 Years | 21 (5.1%) | 10 (2.0%) |
| 5 to 9 Years | 17 (4.1%) | 25 (4.9%) |
| 10 to 14 Years | 10 (2.4%) | 21 (4.2%) |
| 15 to 19 Years | 18 (4.4%) | 42 (8.3%) |
| 20 to 24 Years | 32 (7.8%) | 31 (6.1%) |
| 25 to 29 Years | 29 (7.0%) | 16 (3.2%) |
| 30 to 34 Years | 17 (4.1%) | 25 (4.9%) |
| 35 to 39 Years | 15 (3.6%) | 33 (6.5%) |
| 40 to 44 Years | 17 (4.1%) | 91 (18.0%) |
| 45 to 49 Years | 17 (4.1%) | 11 (2.2%) |
| 50 to 54 Years | 31 (7.5%) | 25 (4.9%) |
| 55 to 59 Years | 22 (5.3%) | 34 (6.7%) |
| 60 to 64 Years | 41 (10.0%) | 30 (5.9%) |
| 65 to 69 Years | 34 (8.3%) | 38 (7.5%) |
| 70 to 74 Years | 33 (8.0%) | 41 (8.1%) |
| 75 to 79 Years | 35 (8.5%) | 22 (4.3%) |
| 80 to 84 Years | 10 (2.4%) | 0 (0.0%) |
| 85 Years and over | 13 (3.2%) | 11 (2.2%) |
| Total | 412 (100.0%) | 506 (100.0%) |
Families and Households in Shalimar
Median Family Size in Shalimar
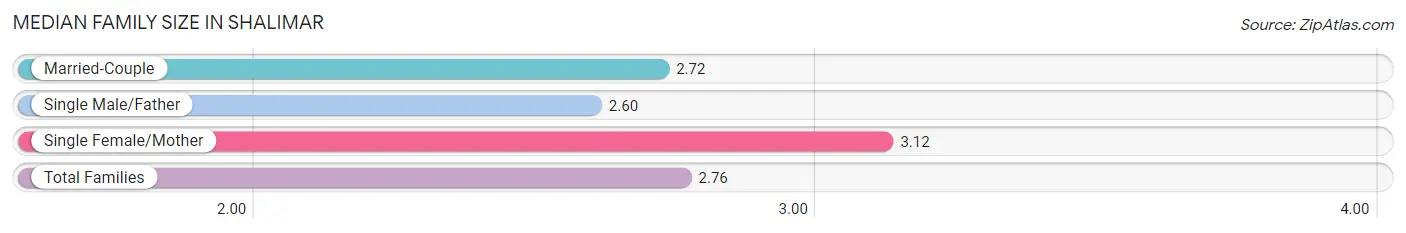
The median family size in Shalimar is 2.76 persons per family, with single female/mother families (26 | 9.6%) accounting for the largest median family size of 3.12 persons per family. On the other hand, single male/father families (5 | 1.8%) represent the smallest median family size with 2.60 persons per family.
| Family Type | # Families | Family Size |
| Married-Couple | 239 (88.5%) | 2.72 |
| Single Male/Father | 5 (1.8%) | 2.60 |
| Single Female/Mother | 26 (9.6%) | 3.12 |
| Total Families | 270 (100.0%) | 2.76 |
Median Household Size in Shalimar
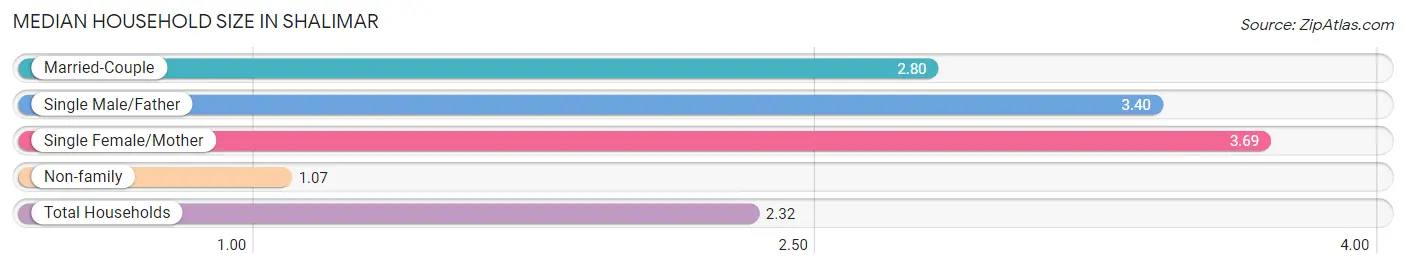
The median household size in Shalimar is 2.32 persons per household, with single female/mother households (26 | 6.6%) accounting for the largest median household size of 3.69 persons per household. non-family households (126 | 31.8%) represent the smallest median household size with 1.07 persons per household.
| Household Type | # Households | Household Size |
| Married-Couple | 239 (60.4%) | 2.80 |
| Single Male/Father | 5 (1.3%) | 3.40 |
| Single Female/Mother | 26 (6.6%) | 3.69 |
| Non-family | 126 (31.8%) | 1.07 |
| Total Households | 396 (100.0%) | 2.32 |
Household Size by Marriage Status in Shalimar
Out of a total of 396 households in Shalimar, 270 (68.2%) are family households, while 126 (31.8%) are nonfamily households. The most numerous type of family households are 2-person households, comprising 168, and the most common type of nonfamily households are 1-person households, comprising 113.
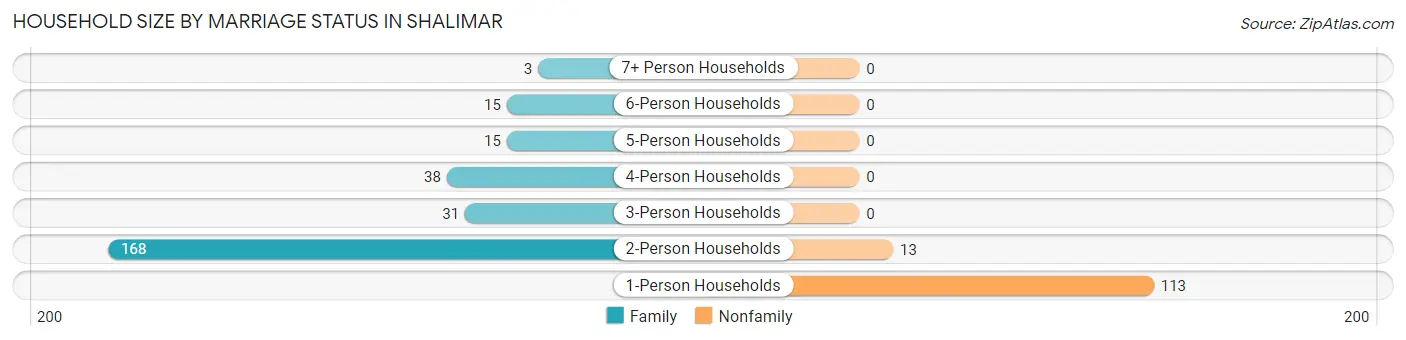
| Household Size | Family Households | Nonfamily Households |
| 1-Person Households | - | 113 (28.5%) |
| 2-Person Households | 168 (42.4%) | 13 (3.3%) |
| 3-Person Households | 31 (7.8%) | 0 (0.0%) |
| 4-Person Households | 38 (9.6%) | 0 (0.0%) |
| 5-Person Households | 15 (3.8%) | 0 (0.0%) |
| 6-Person Households | 15 (3.8%) | 0 (0.0%) |
| 7+ Person Households | 3 (0.8%) | 0 (0.0%) |
| Total | 270 (68.2%) | 126 (31.8%) |
Female Fertility in Shalimar
Fertility by Age in Shalimar
| Age Bracket | Women with Births | Births / 1,000 Women |
| 15 to 19 years | 0 (0.0%) | 0.0 |
| 20 to 34 years | 0 (0.0%) | 0.0 |
| 35 to 50 years | 0 (0.0%) | 0.0 |
| Total | 0 (0.0%) | 0.0 |
Fertility by Age by Marriage Status in Shalimar
| Age Bracket | Married | Unmarried |
| 15 to 19 years | 0 (0.0%) | 0 (0.0%) |
| 20 to 34 years | 0 (0.0%) | 0 (0.0%) |
| 35 to 50 years | 0 (0.0%) | 0 (0.0%) |
| Total | 0 (0.0%) | 0 (0.0%) |
Fertility by Education in Shalimar
| Educational Attainment | Women with Births | Births / 1,000 Women |
| Less than High School | 0 (0.0%) | 0.0 |
| High School Diploma | 0 (0.0%) | 0.0 |
| College or Associate's Degree | 0 (0.0%) | 0.0 |
| Bachelor's Degree | 0 (0.0%) | 0.0 |
| Graduate Degree | 0 (0.0%) | 0.0 |
| Total | 0 (0.0%) | 0.0 |
Fertility by Education by Marriage Status in Shalimar
| Educational Attainment | Married | Unmarried |
| Less than High School | 0 (0.0%) | 0 (0.0%) |
| High School Diploma | 0 (0.0%) | 0 (0.0%) |
| College or Associate's Degree | 0 (0.0%) | 0 (0.0%) |
| Bachelor's Degree | 0 (0.0%) | 0 (0.0%) |
| Graduate Degree | 0 (0.0%) | 0 (0.0%) |
| Total | 0 (0.0%) | 0 (0.0%) |
Employment Characteristics in Shalimar
Employment by Class of Employer in Shalimar
Among the 483 employed individuals in Shalimar, private company employees (194 | 40.2%), federal government employees (135 | 28.0%), and self-employed (not incorporated) (58 | 12.0%) make up the most common classes of employment.
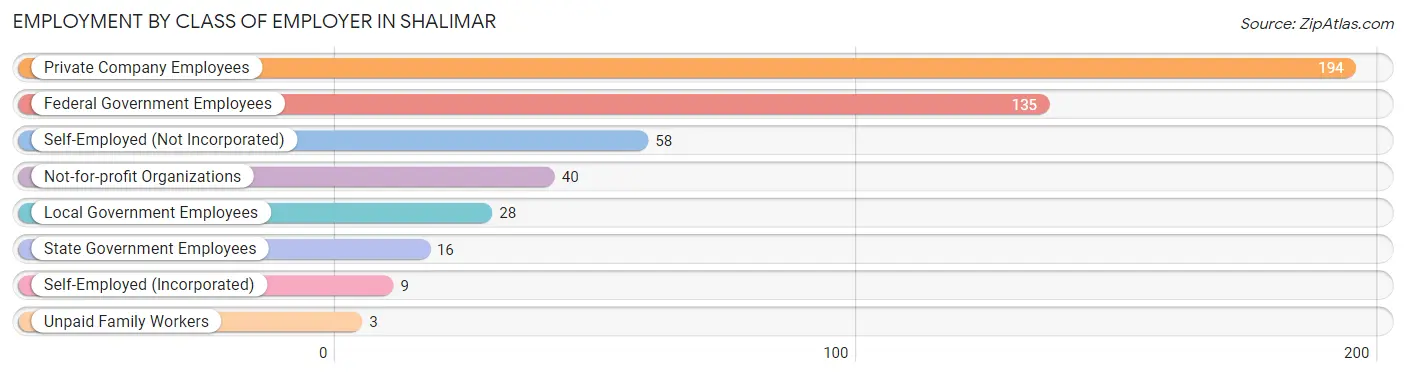
| Employer Class | # Employees | % Employees |
| Private Company Employees | 194 | 40.2% |
| Self-Employed (Incorporated) | 9 | 1.9% |
| Self-Employed (Not Incorporated) | 58 | 12.0% |
| Not-for-profit Organizations | 40 | 8.3% |
| Local Government Employees | 28 | 5.8% |
| State Government Employees | 16 | 3.3% |
| Federal Government Employees | 135 | 28.0% |
| Unpaid Family Workers | 3 | 0.6% |
| Total | 483 | 100.0% |
Employment Status by Age in Shalimar
According to the labor force statistics for Shalimar, out of the total population over 16 years of age (809), 65.0% or 526 individuals are in the labor force, with 7.1% or 37 of them unemployed. The age group with the highest labor force participation rate is 20 to 24 years, with 100.0% or 63 individuals in the labor force. Within the labor force, the 75 years and over age range has the highest percentage of unemployed individuals, with 37.5% or 9 of them being unemployed.
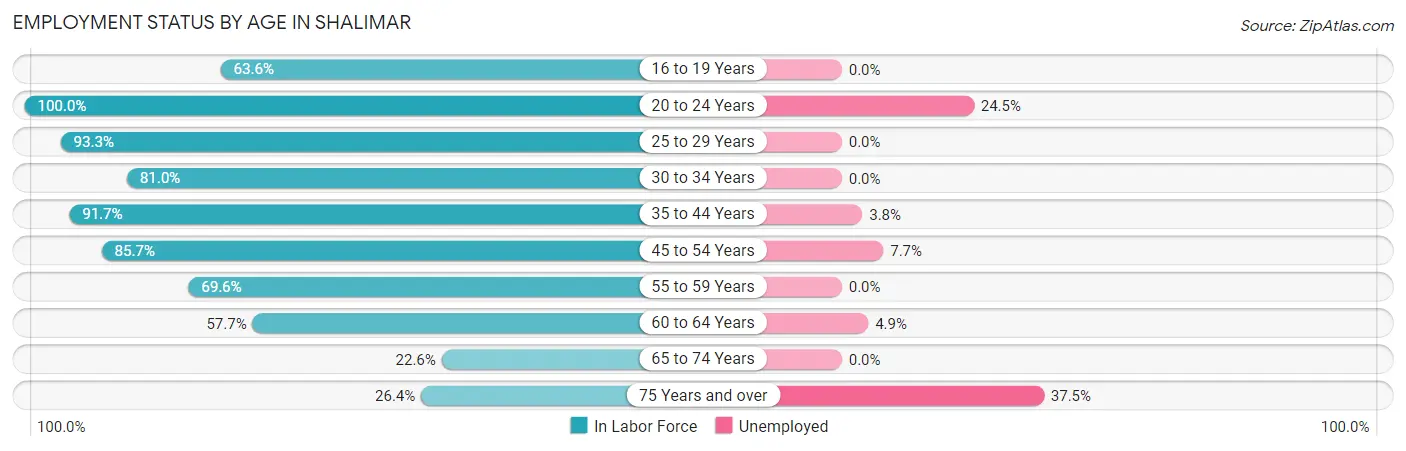
| Age Bracket | In Labor Force | Unemployed |
| 16 to 19 Years | 35 (63.6%) | 0 (0.0%) |
| 20 to 24 Years | 63 (100.0%) | 15 (24.5%) |
| 25 to 29 Years | 42 (93.3%) | 0 (0.0%) |
| 30 to 34 Years | 34 (81.0%) | 0 (0.0%) |
| 35 to 44 Years | 143 (91.7%) | 5 (3.8%) |
| 45 to 54 Years | 72 (85.7%) | 6 (7.7%) |
| 55 to 59 Years | 39 (69.6%) | 0 (0.0%) |
| 60 to 64 Years | 41 (57.7%) | 2 (4.9%) |
| 65 to 74 Years | 33 (22.6%) | 0 (0.0%) |
| 75 Years and over | 24 (26.4%) | 9 (37.5%) |
| Total | 526 (65.0%) | 37 (7.1%) |
Employment Status by Educational Attainment in Shalimar
According to labor force statistics for Shalimar, 81.7% of individuals (371) out of the total population between 25 and 64 years of age (454) are in the labor force, with 3.6% or 13 of them being unemployed. The group with the highest labor force participation rate are those with the educational attainment of less than high school, with 87.5% or 14 individuals in the labor force. Within the labor force, individuals with bachelor's degree or higher education have the highest percentage of unemployment, with 5.0% or 12 of them being unemployed.
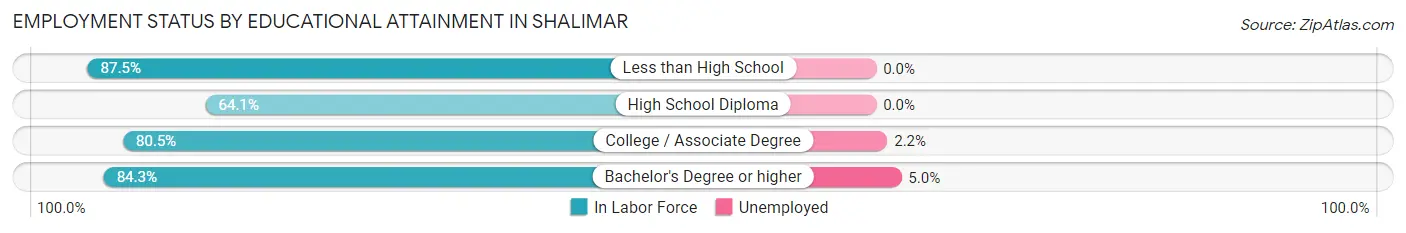
| Educational Attainment | In Labor Force | Unemployed |
| Less than High School | 14 (87.5%) | 0 (0.0%) |
| High School Diploma | 25 (64.1%) | 0 (0.0%) |
| College / Associate Degree | 95 (80.5%) | 3 (2.2%) |
| Bachelor's Degree or higher | 237 (84.3%) | 14 (5.0%) |
| Total | 371 (81.7%) | 16 (3.6%) |
Employment Occupations by Sex in Shalimar
Management, Business, Science and Arts Occupations
The most common Management, Business, Science and Arts occupations in Shalimar are Computers, Engineering & Science (95 | 21.4%), Management (77 | 17.3%), Computers & Mathematics (67 | 15.1%), Community & Social Service (55 | 12.4%), and Education Instruction & Library (42 | 9.5%).
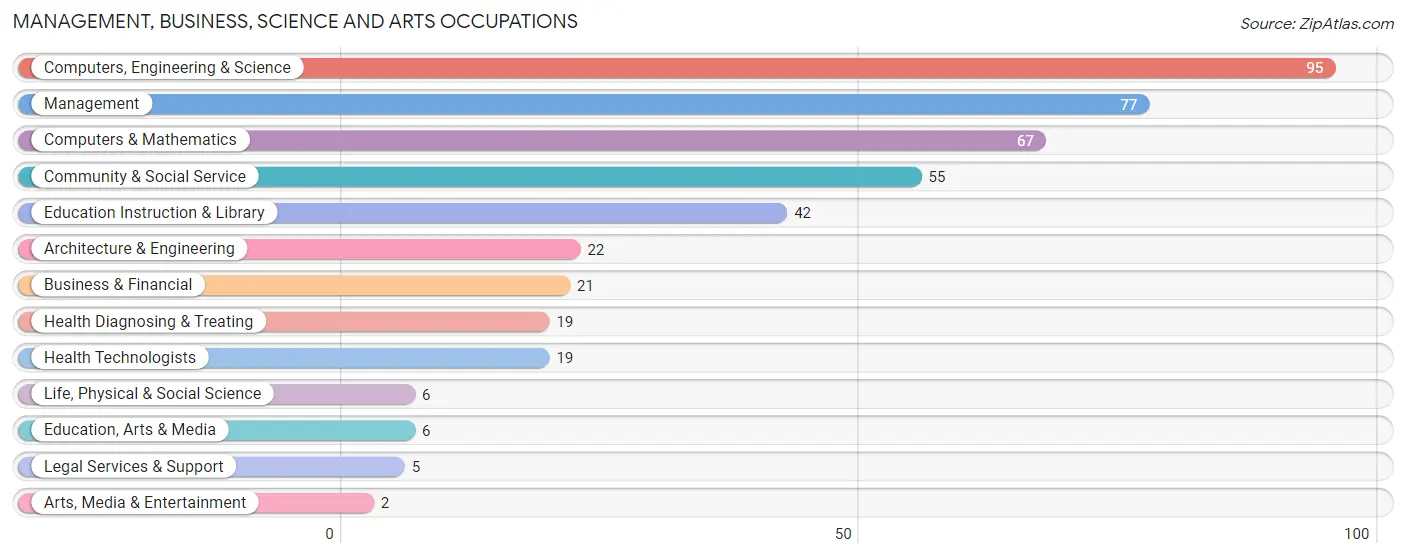
Management, Business, Science and Arts Occupations by Sex
Within the Management, Business, Science and Arts occupations in Shalimar, the most male-oriented occupations are Arts, Media & Entertainment (100.0%), Architecture & Engineering (81.8%), and Management (57.1%), while the most female-oriented occupations are Education, Arts & Media (100.0%), Legal Services & Support (100.0%), and Health Diagnosing & Treating (100.0%).
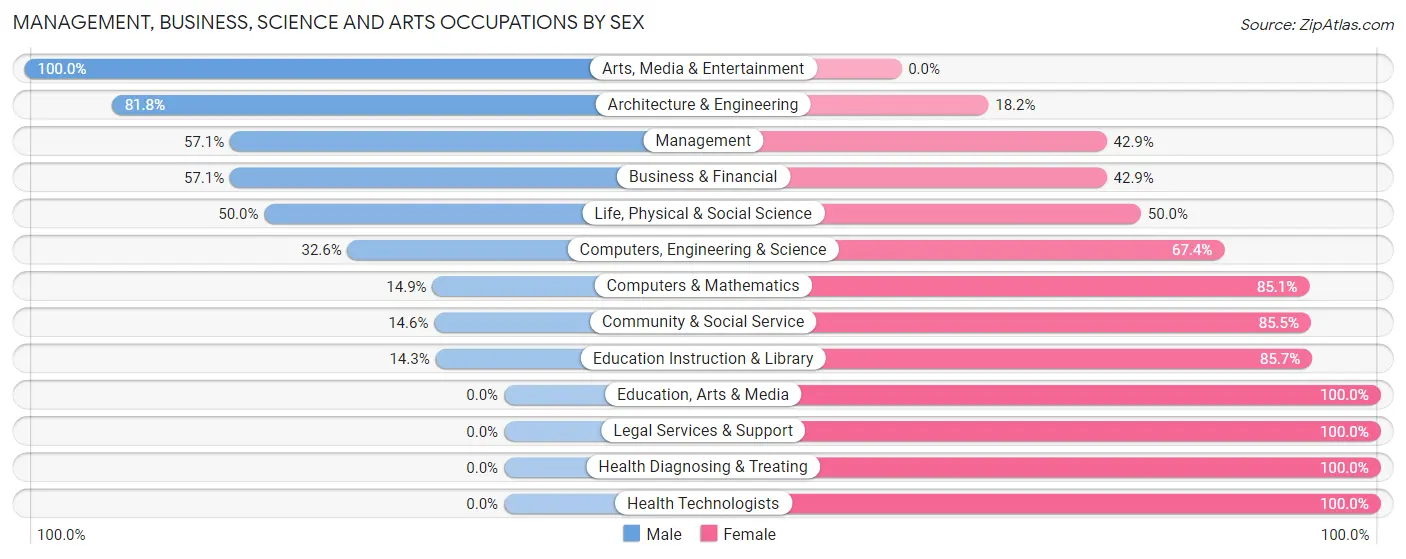
| Occupation | Male | Female |
| Management | 44 (57.1%) | 33 (42.9%) |
| Business & Financial | 12 (57.1%) | 9 (42.9%) |
| Computers, Engineering & Science | 31 (32.6%) | 64 (67.4%) |
| Computers & Mathematics | 10 (14.9%) | 57 (85.1%) |
| Architecture & Engineering | 18 (81.8%) | 4 (18.2%) |
| Life, Physical & Social Science | 3 (50.0%) | 3 (50.0%) |
| Community & Social Service | 8 (14.5%) | 47 (85.5%) |
| Education, Arts & Media | 0 (0.0%) | 6 (100.0%) |
| Legal Services & Support | 0 (0.0%) | 5 (100.0%) |
| Education Instruction & Library | 6 (14.3%) | 36 (85.7%) |
| Arts, Media & Entertainment | 2 (100.0%) | 0 (0.0%) |
| Health Diagnosing & Treating | 0 (0.0%) | 19 (100.0%) |
| Health Technologists | 0 (0.0%) | 19 (100.0%) |
| Total (Category) | 95 (35.6%) | 172 (64.4%) |
| Total (Overall) | 158 (35.6%) | 286 (64.4%) |
Services Occupations
The most common Services occupations in Shalimar are Personal Care & Service (17 | 3.8%), Cleaning & Maintenance (11 | 2.5%), Food Preparation & Serving (10 | 2.2%), Security & Protection (8 | 1.8%), and Law Enforcement (6 | 1.3%).
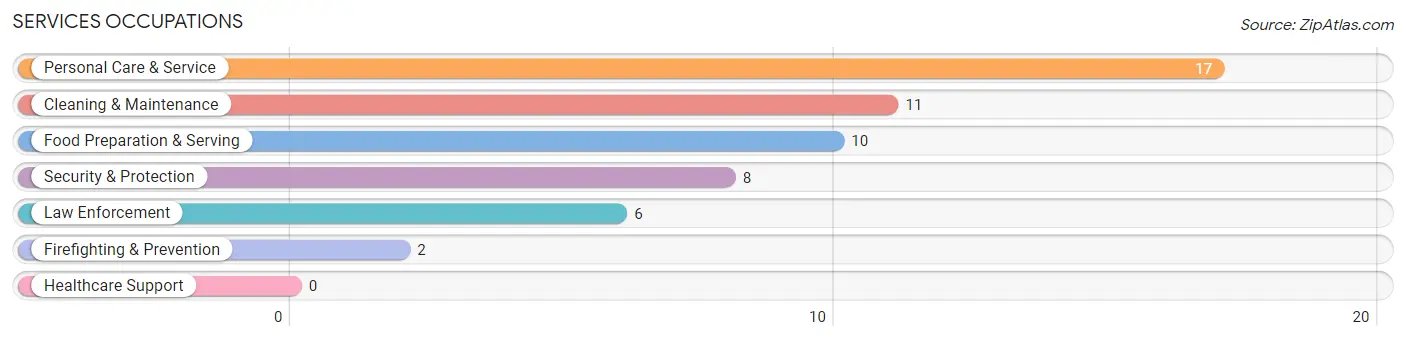
Services Occupations by Sex
Within the Services occupations in Shalimar, the most male-oriented occupations are Security & Protection (100.0%), Firefighting & Prevention (100.0%), and Law Enforcement (100.0%), while the most female-oriented occupations are Personal Care & Service (88.2%), Cleaning & Maintenance (81.8%), and Food Preparation & Serving (60.0%).
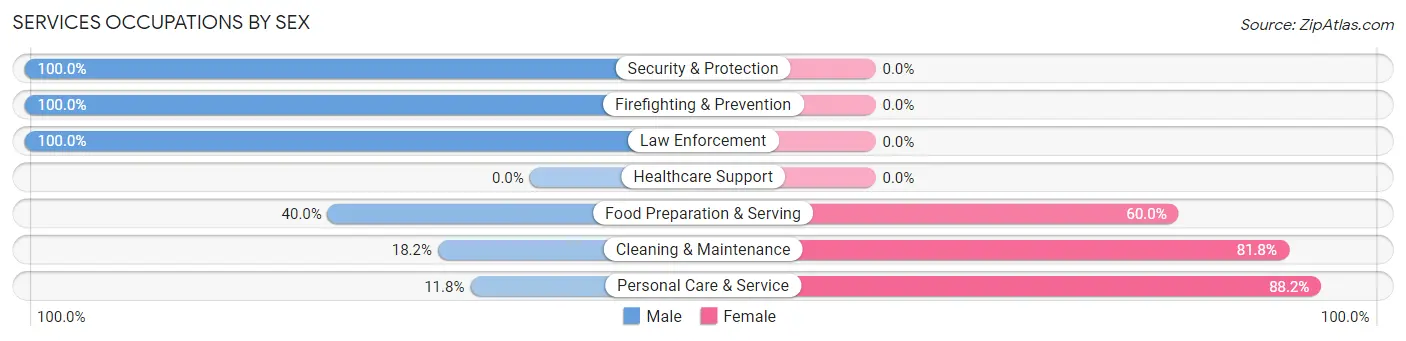
| Occupation | Male | Female |
| Healthcare Support | 0 (0.0%) | 0 (0.0%) |
| Security & Protection | 8 (100.0%) | 0 (0.0%) |
| Firefighting & Prevention | 2 (100.0%) | 0 (0.0%) |
| Law Enforcement | 6 (100.0%) | 0 (0.0%) |
| Food Preparation & Serving | 4 (40.0%) | 6 (60.0%) |
| Cleaning & Maintenance | 2 (18.2%) | 9 (81.8%) |
| Personal Care & Service | 2 (11.8%) | 15 (88.2%) |
| Total (Category) | 16 (34.8%) | 30 (65.2%) |
| Total (Overall) | 158 (35.6%) | 286 (64.4%) |
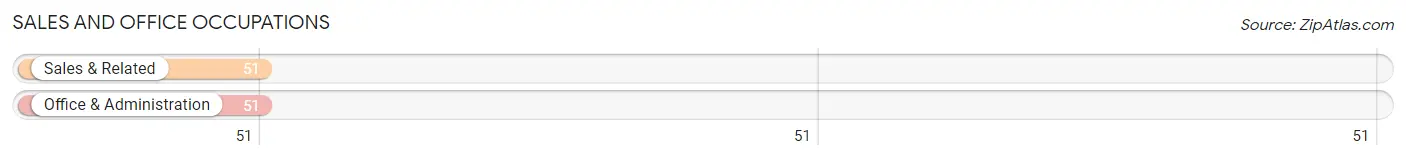
Sales and Office Occupations
The most common Sales and Office occupations in Shalimar are Sales & Related (51 | 11.5%), and Office & Administration (51 | 11.5%).
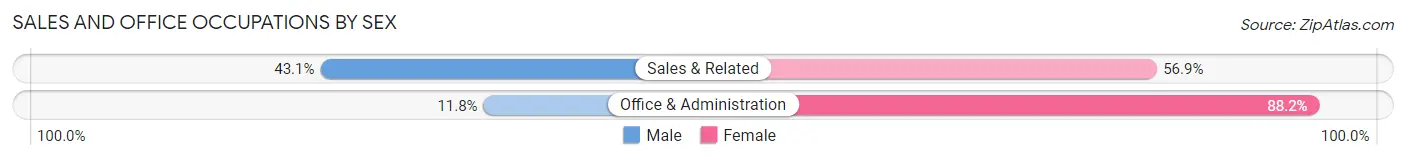
Sales and Office Occupations by Sex
| Occupation | Male | Female |
| Sales & Related | 22 (43.1%) | 29 (56.9%) |
| Office & Administration | 6 (11.8%) | 45 (88.2%) |
| Total (Category) | 28 (27.5%) | 74 (72.6%) |
| Total (Overall) | 158 (35.6%) | 286 (64.4%) |
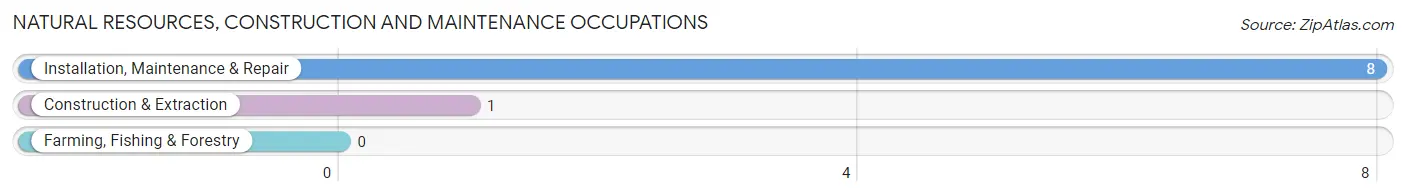
Natural Resources, Construction and Maintenance Occupations
The most common Natural Resources, Construction and Maintenance occupations in Shalimar are Installation, Maintenance & Repair (8 | 1.8%), and Construction & Extraction (1 | 0.2%).
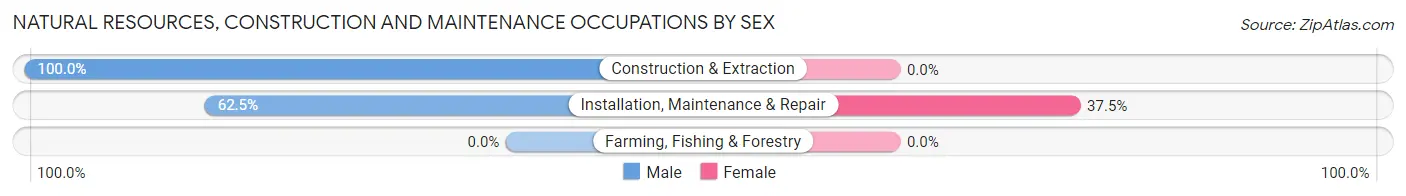
Natural Resources, Construction and Maintenance Occupations by Sex
| Occupation | Male | Female |
| Farming, Fishing & Forestry | 0 (0.0%) | 0 (0.0%) |
| Construction & Extraction | 1 (100.0%) | 0 (0.0%) |
| Installation, Maintenance & Repair | 5 (62.5%) | 3 (37.5%) |
| Total (Category) | 6 (66.7%) | 3 (33.3%) |
| Total (Overall) | 158 (35.6%) | 286 (64.4%) |
Production, Transportation and Moving Occupations
The most common Production, Transportation and Moving occupations in Shalimar are Production (9 | 2.0%), Material Moving (8 | 1.8%), and Transportation (3 | 0.7%).
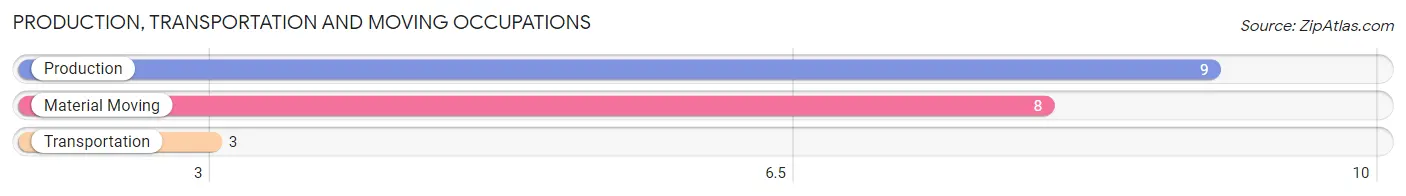
Production, Transportation and Moving Occupations by Sex
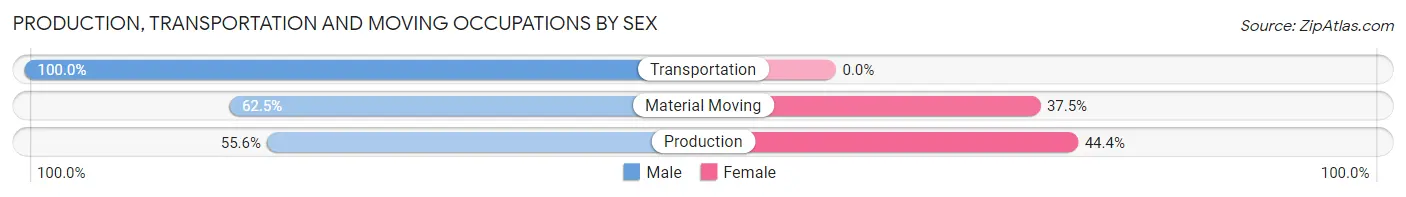
| Occupation | Male | Female |
| Production | 5 (55.6%) | 4 (44.4%) |
| Transportation | 3 (100.0%) | 0 (0.0%) |
| Material Moving | 5 (62.5%) | 3 (37.5%) |
| Total (Category) | 13 (65.0%) | 7 (35.0%) |
| Total (Overall) | 158 (35.6%) | 286 (64.4%) |
Employment Industries by Sex in Shalimar
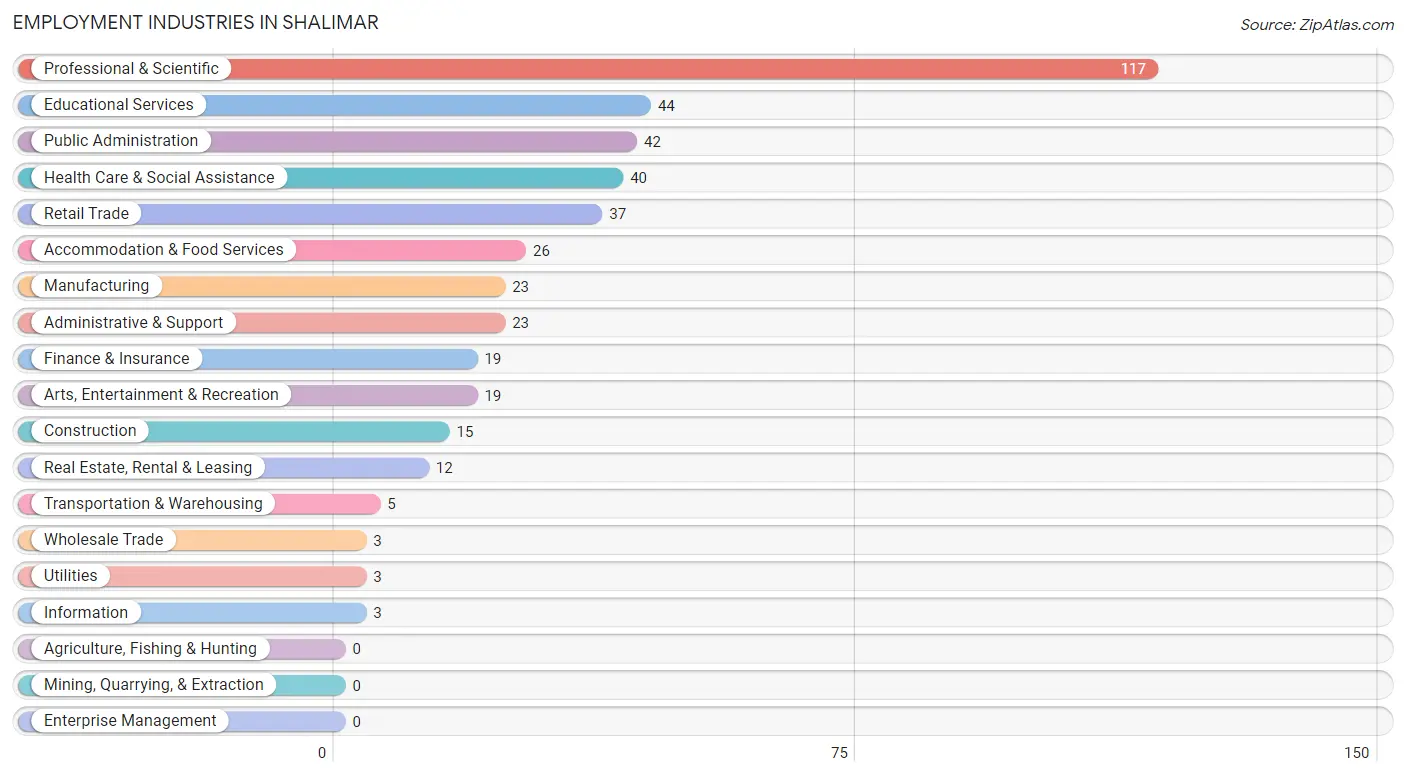
Employment Industries in Shalimar
The major employment industries in Shalimar include Professional & Scientific (117 | 26.4%), Educational Services (44 | 9.9%), Public Administration (42 | 9.5%), Health Care & Social Assistance (40 | 9.0%), and Retail Trade (37 | 8.3%).
Employment Industries by Sex in Shalimar
The Shalimar industries that see more men than women are Wholesale Trade (100.0%), Transportation & Warehousing (100.0%), and Utilities (100.0%), whereas the industries that tend to have a higher number of women are Health Care & Social Assistance (100.0%), Educational Services (86.4%), and Retail Trade (83.8%).
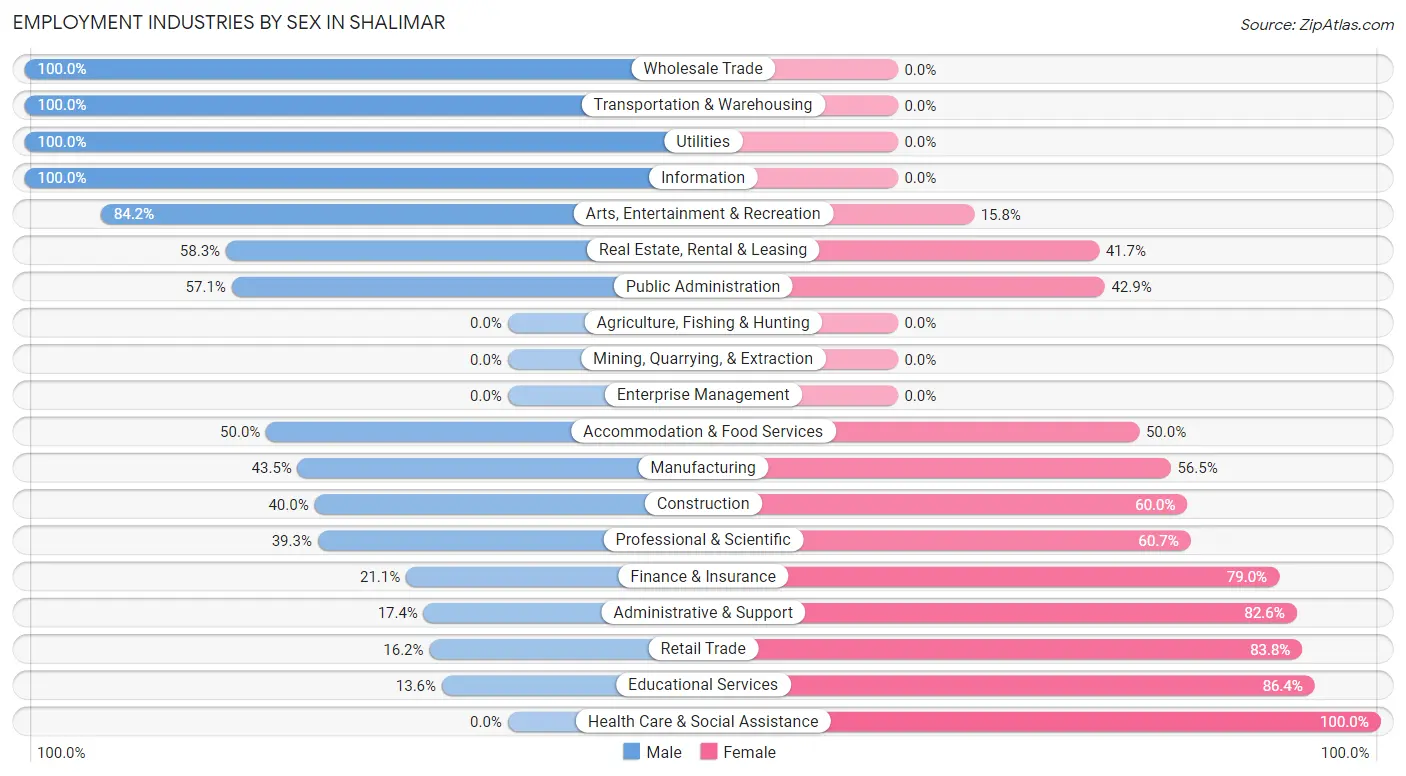
| Industry | Male | Female |
| Agriculture, Fishing & Hunting | 0 (0.0%) | 0 (0.0%) |
| Mining, Quarrying, & Extraction | 0 (0.0%) | 0 (0.0%) |
| Construction | 6 (40.0%) | 9 (60.0%) |
| Manufacturing | 10 (43.5%) | 13 (56.5%) |
| Wholesale Trade | 3 (100.0%) | 0 (0.0%) |
| Retail Trade | 6 (16.2%) | 31 (83.8%) |
| Transportation & Warehousing | 5 (100.0%) | 0 (0.0%) |
| Utilities | 3 (100.0%) | 0 (0.0%) |
| Information | 3 (100.0%) | 0 (0.0%) |
| Finance & Insurance | 4 (21.0%) | 15 (78.9%) |
| Real Estate, Rental & Leasing | 7 (58.3%) | 5 (41.7%) |
| Professional & Scientific | 46 (39.3%) | 71 (60.7%) |
| Enterprise Management | 0 (0.0%) | 0 (0.0%) |
| Administrative & Support | 4 (17.4%) | 19 (82.6%) |
| Educational Services | 6 (13.6%) | 38 (86.4%) |
| Health Care & Social Assistance | 0 (0.0%) | 40 (100.0%) |
| Arts, Entertainment & Recreation | 16 (84.2%) | 3 (15.8%) |
| Accommodation & Food Services | 13 (50.0%) | 13 (50.0%) |
| Public Administration | 24 (57.1%) | 18 (42.9%) |
| Total | 158 (35.6%) | 286 (64.4%) |
Education in Shalimar
School Enrollment in Shalimar
The most common levels of schooling among the 191 students in Shalimar are college / undergraduate (55 | 28.8%), elementary school (38 | 19.9%), and high school (30 | 15.7%).
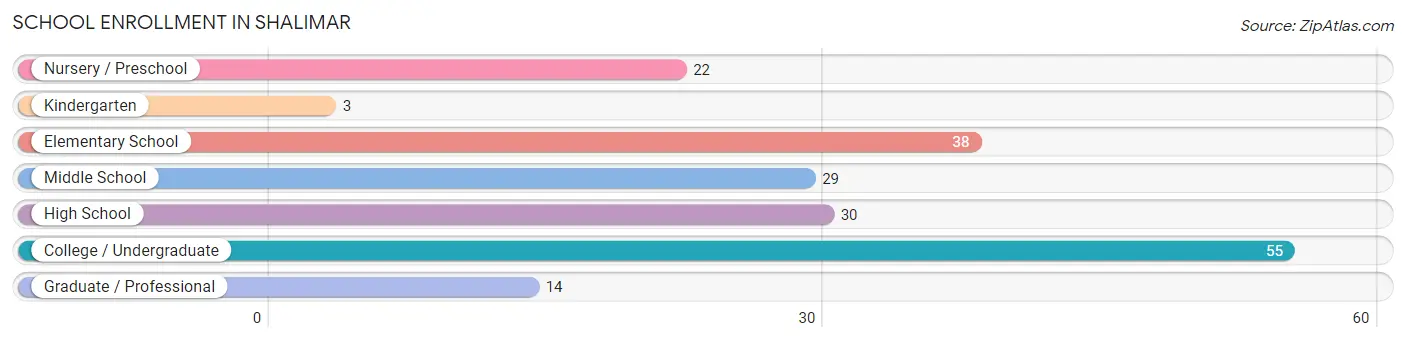
| School Level | # Students | % Students |
| Nursery / Preschool | 22 | 11.5% |
| Kindergarten | 3 | 1.6% |
| Elementary School | 38 | 19.9% |
| Middle School | 29 | 15.2% |
| High School | 30 | 15.7% |
| College / Undergraduate | 55 | 28.8% |
| Graduate / Professional | 14 | 7.3% |
| Total | 191 | 100.0% |
School Enrollment by Age by Funding Source in Shalimar
Out of a total of 191 students who are enrolled in schools in Shalimar, 26 (13.6%) attend a private institution, while the remaining 165 (86.4%) are enrolled in public schools. The age group of 3 to 4 year olds has the highest likelihood of being enrolled in private schools, with 9 (47.4% in the age bracket) enrolled. Conversely, the age group of 18 to 19 year olds has the lowest likelihood of being enrolled in a private school, with 12 (100.0% in the age bracket) attending a public institution.
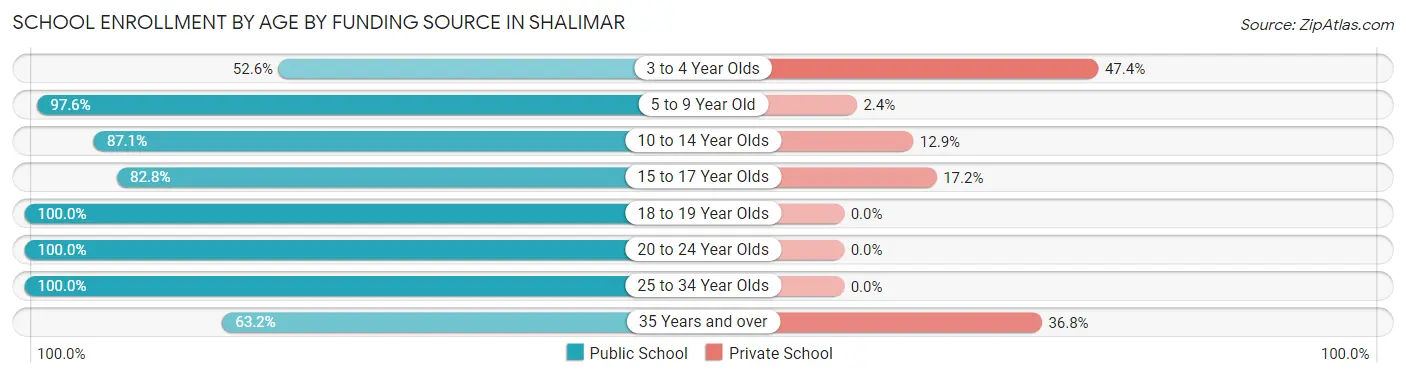
| Age Bracket | Public School | Private School |
| 3 to 4 Year Olds | 10 (52.6%) | 9 (47.4%) |
| 5 to 9 Year Old | 41 (97.6%) | 1 (2.4%) |
| 10 to 14 Year Olds | 27 (87.1%) | 4 (12.9%) |
| 15 to 17 Year Olds | 24 (82.8%) | 5 (17.2%) |
| 18 to 19 Year Olds | 12 (100.0%) | 0 (0.0%) |
| 20 to 24 Year Olds | 25 (100.0%) | 0 (0.0%) |
| 25 to 34 Year Olds | 14 (100.0%) | 0 (0.0%) |
| 35 Years and over | 12 (63.2%) | 7 (36.8%) |
| Total | 165 (86.4%) | 26 (13.6%) |
Educational Attainment by Field of Study in Shalimar
Business (140 | 32.3%), engineering (59 | 13.6%), literature & languages (37 | 8.5%), education (33 | 7.6%), and arts & humanities (26 | 6.0%) are the most common fields of study among 434 individuals in Shalimar who have obtained a bachelor's degree or higher.
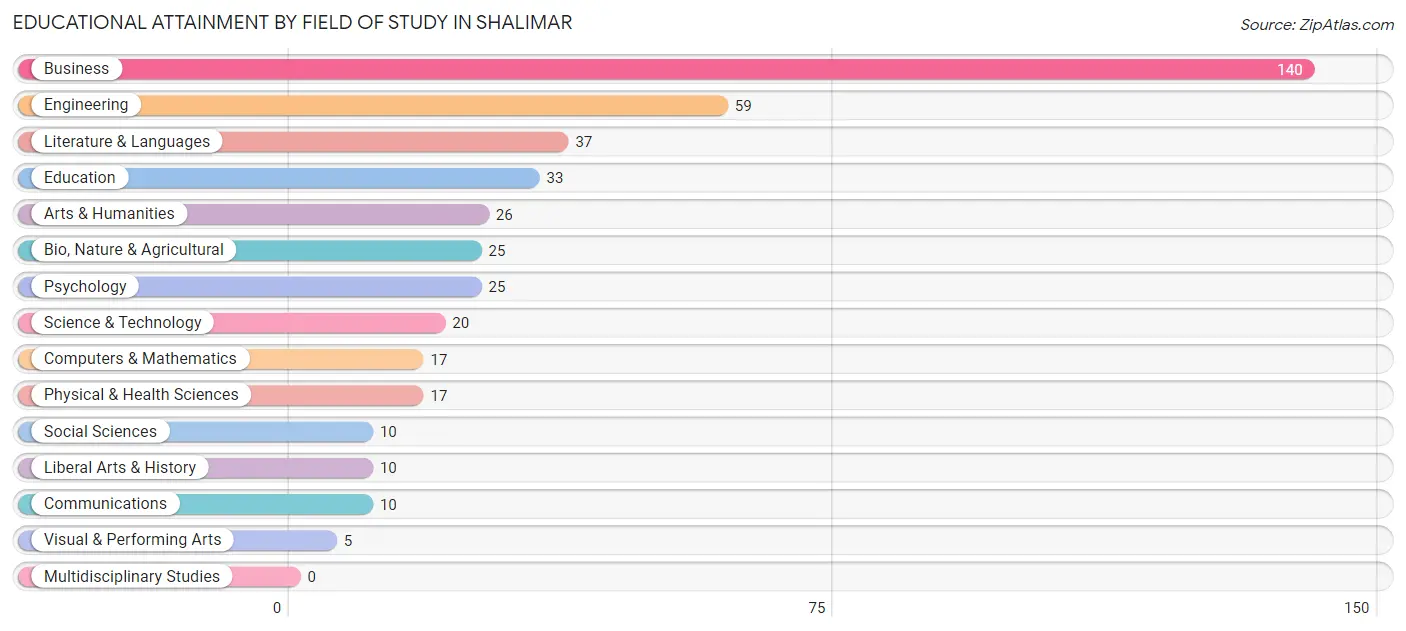
| Field of Study | # Graduates | % Graduates |
| Computers & Mathematics | 17 | 3.9% |
| Bio, Nature & Agricultural | 25 | 5.8% |
| Physical & Health Sciences | 17 | 3.9% |
| Psychology | 25 | 5.8% |
| Social Sciences | 10 | 2.3% |
| Engineering | 59 | 13.6% |
| Multidisciplinary Studies | 0 | 0.0% |
| Science & Technology | 20 | 4.6% |
| Business | 140 | 32.3% |
| Education | 33 | 7.6% |
| Literature & Languages | 37 | 8.5% |
| Liberal Arts & History | 10 | 2.3% |
| Visual & Performing Arts | 5 | 1.1% |
| Communications | 10 | 2.3% |
| Arts & Humanities | 26 | 6.0% |
| Total | 434 | 100.0% |
Transportation & Commute in Shalimar
Vehicle Availability by Sex in Shalimar
The most prevalent vehicle ownership categories in Shalimar are males with 2 vehicles (92, accounting for 47.9%) and females with 2 vehicles (100, making up 31.6%).
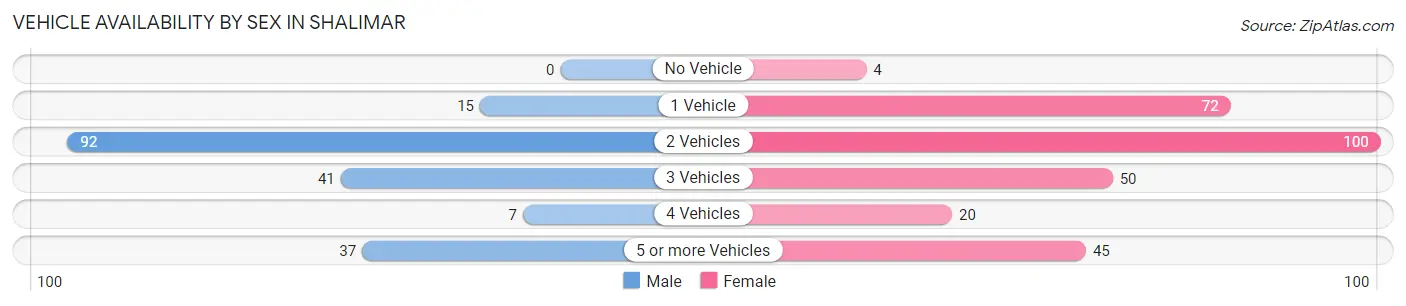
| Vehicles Available | Male | Female |
| No Vehicle | 0 (0.0%) | 4 (1.4%) |
| 1 Vehicle | 15 (7.8%) | 72 (24.7%) |
| 2 Vehicles | 92 (47.9%) | 100 (34.4%) |
| 3 Vehicles | 41 (21.3%) | 50 (17.2%) |
| 4 Vehicles | 7 (3.6%) | 20 (6.9%) |
| 5 or more Vehicles | 37 (19.3%) | 45 (15.5%) |
| Total | 192 (100.0%) | 291 (100.0%) |
Commute Time in Shalimar
The most frequently occuring commute durations in Shalimar are 15 to 19 minutes (128 commuters, 29.0%), 10 to 14 minutes (104 commuters, 23.5%), and 5 to 9 minutes (66 commuters, 14.9%).
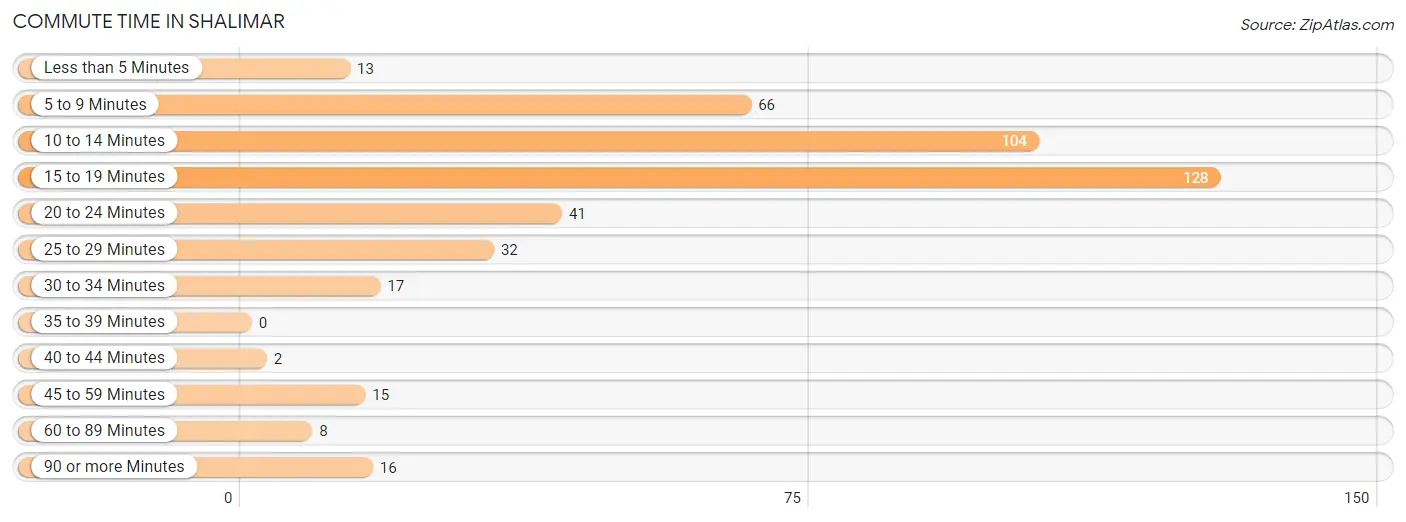
| Commute Time | # Commuters | % Commuters |
| Less than 5 Minutes | 13 | 2.9% |
| 5 to 9 Minutes | 66 | 14.9% |
| 10 to 14 Minutes | 104 | 23.5% |
| 15 to 19 Minutes | 128 | 29.0% |
| 20 to 24 Minutes | 41 | 9.3% |
| 25 to 29 Minutes | 32 | 7.2% |
| 30 to 34 Minutes | 17 | 3.8% |
| 35 to 39 Minutes | 0 | 0.0% |
| 40 to 44 Minutes | 2 | 0.4% |
| 45 to 59 Minutes | 15 | 3.4% |
| 60 to 89 Minutes | 8 | 1.8% |
| 90 or more Minutes | 16 | 3.6% |
Commute Time by Sex in Shalimar
The most common commute times in Shalimar are 10 to 14 minutes (34 commuters, 20.4%) for males and 15 to 19 minutes (94 commuters, 34.2%) for females.
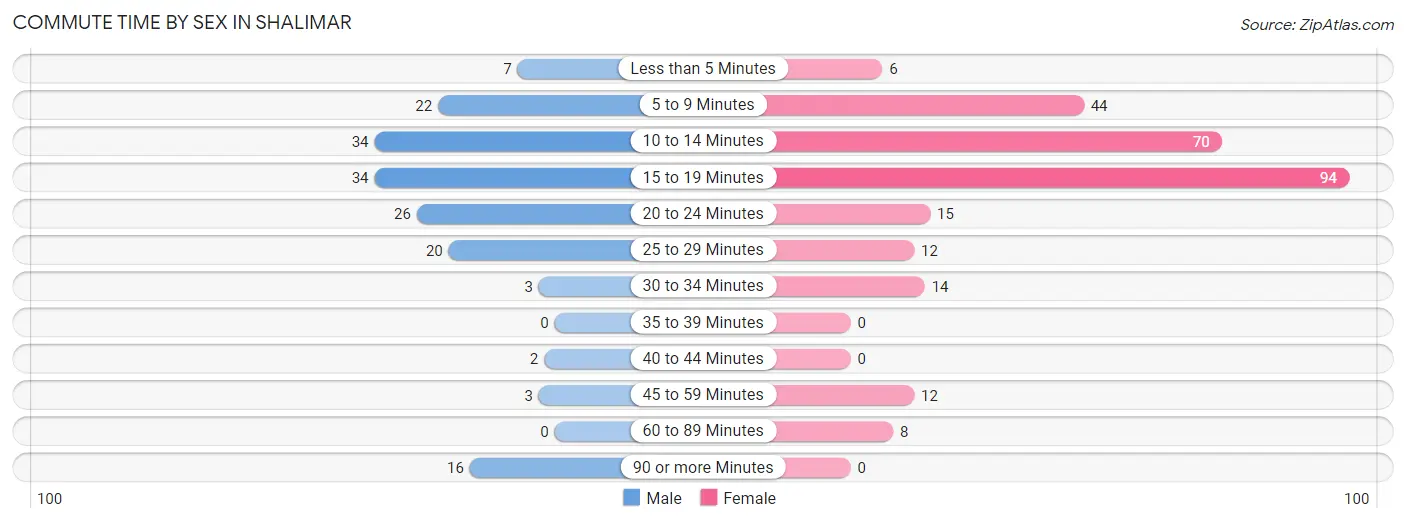
| Commute Time | Male | Female |
| Less than 5 Minutes | 7 (4.2%) | 6 (2.2%) |
| 5 to 9 Minutes | 22 (13.2%) | 44 (16.0%) |
| 10 to 14 Minutes | 34 (20.4%) | 70 (25.5%) |
| 15 to 19 Minutes | 34 (20.4%) | 94 (34.2%) |
| 20 to 24 Minutes | 26 (15.6%) | 15 (5.4%) |
| 25 to 29 Minutes | 20 (12.0%) | 12 (4.4%) |
| 30 to 34 Minutes | 3 (1.8%) | 14 (5.1%) |
| 35 to 39 Minutes | 0 (0.0%) | 0 (0.0%) |
| 40 to 44 Minutes | 2 (1.2%) | 0 (0.0%) |
| 45 to 59 Minutes | 3 (1.8%) | 12 (4.4%) |
| 60 to 89 Minutes | 0 (0.0%) | 8 (2.9%) |
| 90 or more Minutes | 16 (9.6%) | 0 (0.0%) |
Time of Departure to Work by Sex in Shalimar
The most frequent times of departure to work in Shalimar are 6:00 AM to 6:29 AM (32, 19.2%) for males and 7:30 AM to 7:59 AM (79, 28.7%) for females.
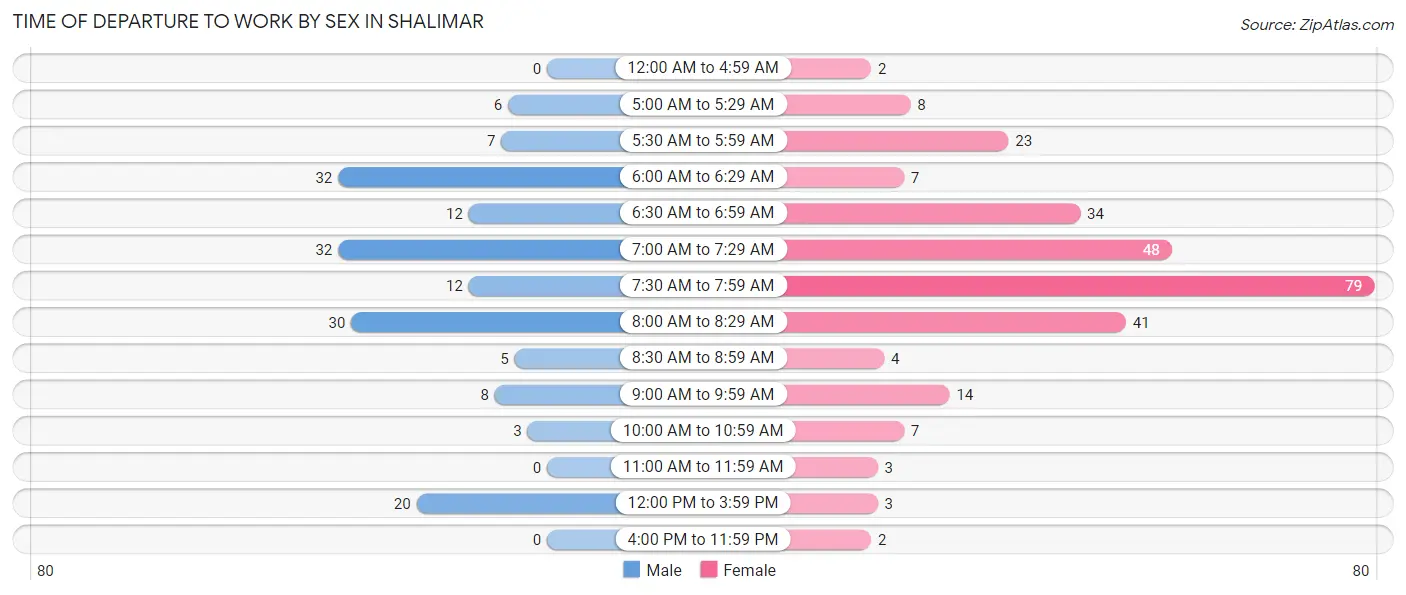
| Time of Departure | Male | Female |
| 12:00 AM to 4:59 AM | 0 (0.0%) | 2 (0.7%) |
| 5:00 AM to 5:29 AM | 6 (3.6%) | 8 (2.9%) |
| 5:30 AM to 5:59 AM | 7 (4.2%) | 23 (8.4%) |
| 6:00 AM to 6:29 AM | 32 (19.2%) | 7 (2.5%) |
| 6:30 AM to 6:59 AM | 12 (7.2%) | 34 (12.4%) |
| 7:00 AM to 7:29 AM | 32 (19.2%) | 48 (17.4%) |
| 7:30 AM to 7:59 AM | 12 (7.2%) | 79 (28.7%) |
| 8:00 AM to 8:29 AM | 30 (18.0%) | 41 (14.9%) |
| 8:30 AM to 8:59 AM | 5 (3.0%) | 4 (1.5%) |
| 9:00 AM to 9:59 AM | 8 (4.8%) | 14 (5.1%) |
| 10:00 AM to 10:59 AM | 3 (1.8%) | 7 (2.5%) |
| 11:00 AM to 11:59 AM | 0 (0.0%) | 3 (1.1%) |
| 12:00 PM to 3:59 PM | 20 (12.0%) | 3 (1.1%) |
| 4:00 PM to 11:59 PM | 0 (0.0%) | 2 (0.7%) |
| Total | 167 (100.0%) | 275 (100.0%) |
Housing Occupancy in Shalimar
Occupancy by Ownership in Shalimar
Of the total 396 dwellings in Shalimar, owner-occupied units account for 282 (71.2%), while renter-occupied units make up 114 (28.8%).
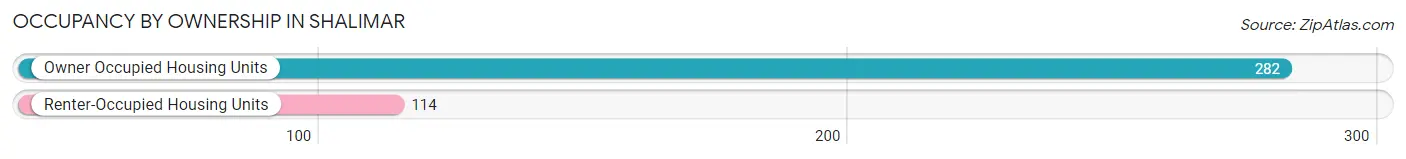
| Occupancy | # Housing Units | % Housing Units |
| Owner Occupied Housing Units | 282 | 71.2% |
| Renter-Occupied Housing Units | 114 | 28.8% |
| Total Occupied Housing Units | 396 | 100.0% |
Occupancy by Household Size in Shalimar
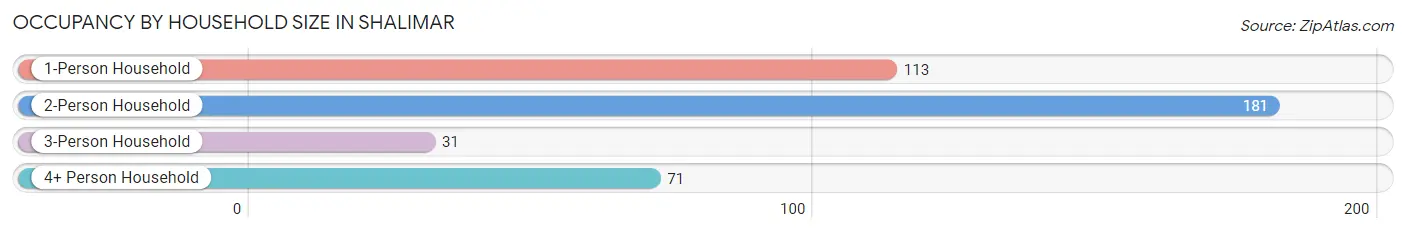
| Household Size | # Housing Units | % Housing Units |
| 1-Person Household | 113 | 28.5% |
| 2-Person Household | 181 | 45.7% |
| 3-Person Household | 31 | 7.8% |
| 4+ Person Household | 71 | 17.9% |
| Total Housing Units | 396 | 100.0% |
Occupancy by Ownership by Household Size in Shalimar
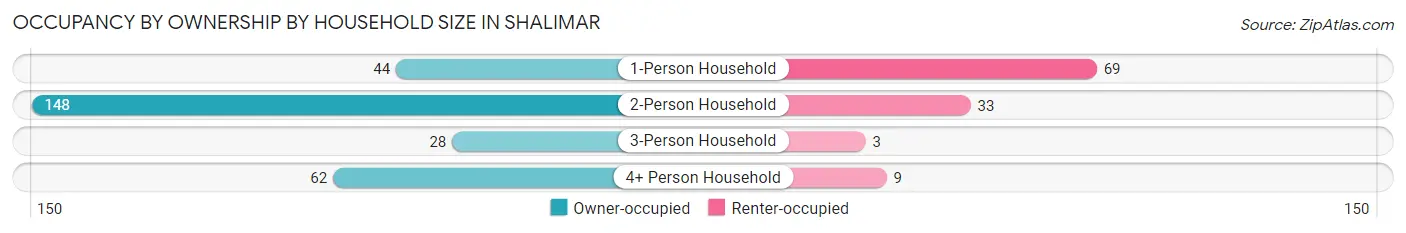
| Household Size | Owner-occupied | Renter-occupied |
| 1-Person Household | 44 (38.9%) | 69 (61.1%) |
| 2-Person Household | 148 (81.8%) | 33 (18.2%) |
| 3-Person Household | 28 (90.3%) | 3 (9.7%) |
| 4+ Person Household | 62 (87.3%) | 9 (12.7%) |
| Total Housing Units | 282 (71.2%) | 114 (28.8%) |
Occupancy by Educational Attainment in Shalimar
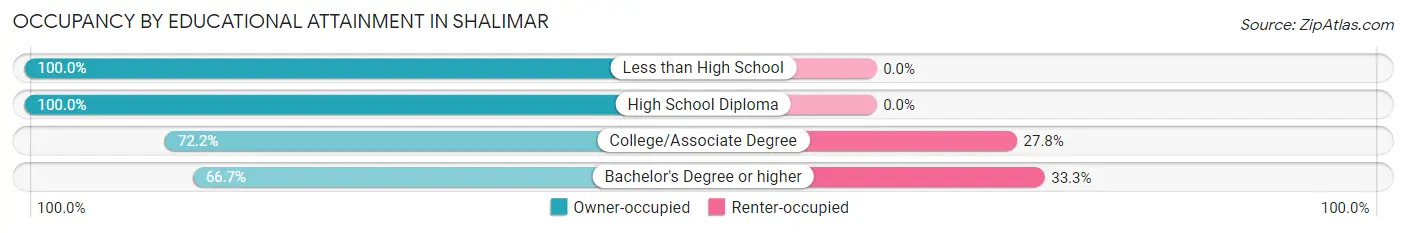
| Household Size | Owner-occupied | Renter-occupied |
| Less than High School | 8 (100.0%) | 0 (0.0%) |
| High School Diploma | 30 (100.0%) | 0 (0.0%) |
| College/Associate Degree | 70 (72.2%) | 27 (27.8%) |
| Bachelor's Degree or higher | 174 (66.7%) | 87 (33.3%) |
Occupancy by Age of Householder in Shalimar
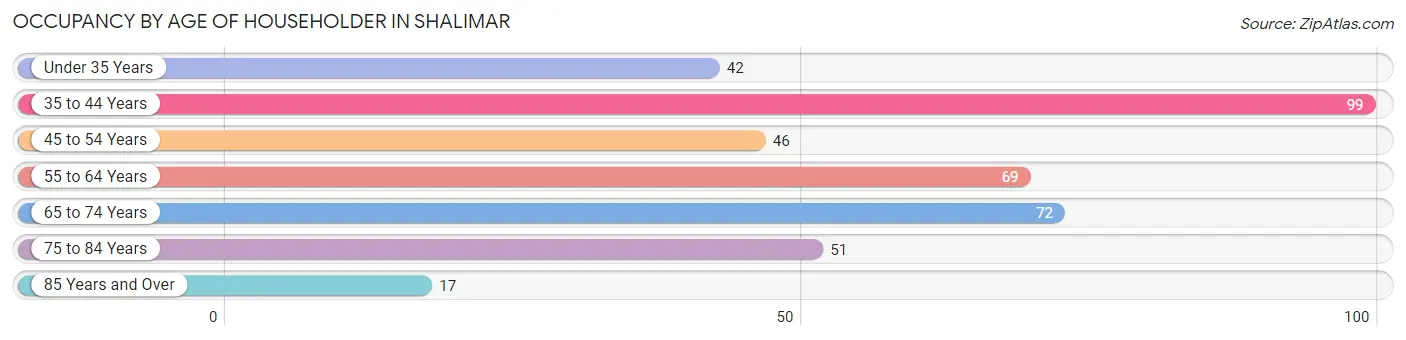
| Age Bracket | # Households | % Households |
| Under 35 Years | 42 | 10.6% |
| 35 to 44 Years | 99 | 25.0% |
| 45 to 54 Years | 46 | 11.6% |
| 55 to 64 Years | 69 | 17.4% |
| 65 to 74 Years | 72 | 18.2% |
| 75 to 84 Years | 51 | 12.9% |
| 85 Years and Over | 17 | 4.3% |
| Total | 396 | 100.0% |
Housing Finances in Shalimar
Median Income by Occupancy in Shalimar
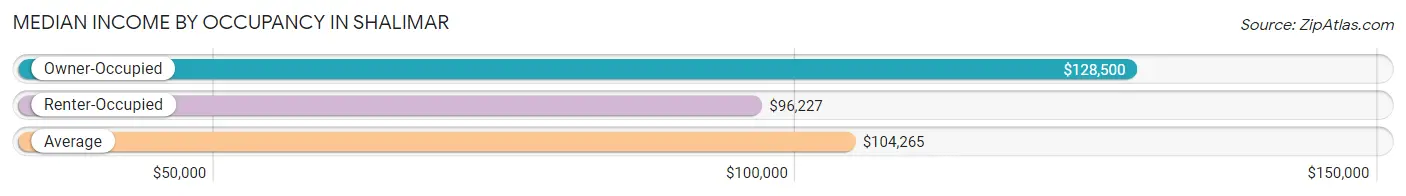
| Occupancy Type | # Households | Median Income |
| Owner-Occupied | 282 (71.2%) | $128,500 |
| Renter-Occupied | 114 (28.8%) | $96,227 |
| Average | 396 (100.0%) | $104,265 |
Occupancy by Householder Income Bracket in Shalimar
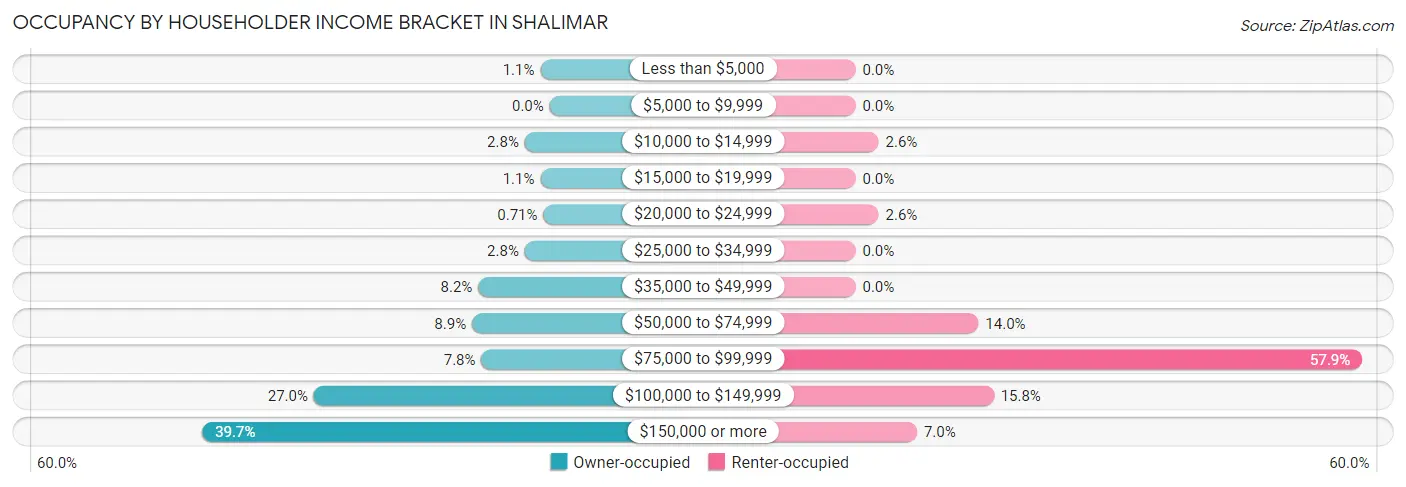
| Income Bracket | Owner-occupied | Renter-occupied |
| Less than $5,000 | 3 (1.1%) | 0 (0.0%) |
| $5,000 to $9,999 | 0 (0.0%) | 0 (0.0%) |
| $10,000 to $14,999 | 8 (2.8%) | 3 (2.6%) |
| $15,000 to $19,999 | 3 (1.1%) | 0 (0.0%) |
| $20,000 to $24,999 | 2 (0.7%) | 3 (2.6%) |
| $25,000 to $34,999 | 8 (2.8%) | 0 (0.0%) |
| $35,000 to $49,999 | 23 (8.2%) | 0 (0.0%) |
| $50,000 to $74,999 | 25 (8.9%) | 16 (14.0%) |
| $75,000 to $99,999 | 22 (7.8%) | 66 (57.9%) |
| $100,000 to $149,999 | 76 (27.0%) | 18 (15.8%) |
| $150,000 or more | 112 (39.7%) | 8 (7.0%) |
| Total | 282 (100.0%) | 114 (100.0%) |
Monthly Housing Cost Tiers in Shalimar
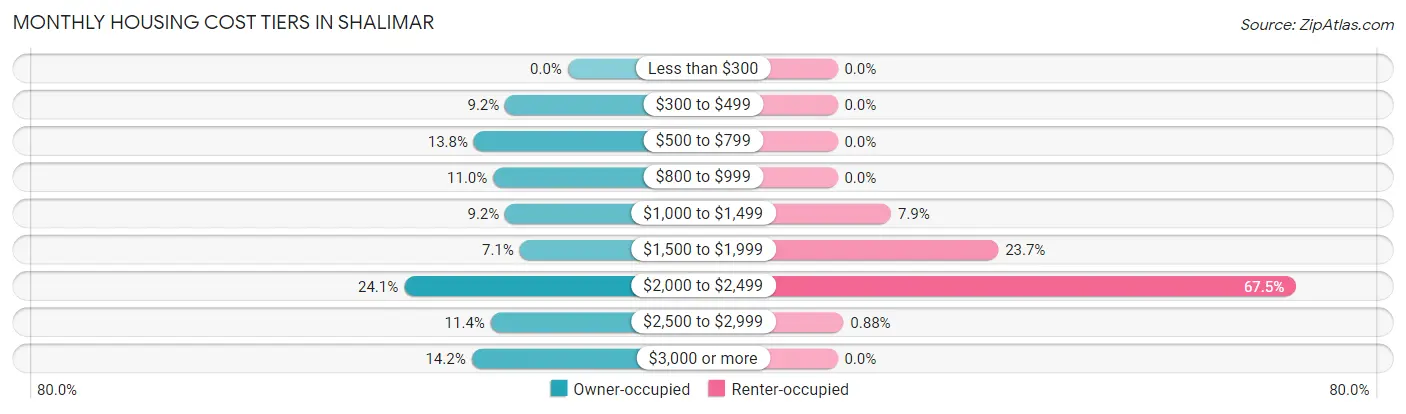
| Monthly Cost | Owner-occupied | Renter-occupied |
| Less than $300 | 0 (0.0%) | 0 (0.0%) |
| $300 to $499 | 26 (9.2%) | 0 (0.0%) |
| $500 to $799 | 39 (13.8%) | 0 (0.0%) |
| $800 to $999 | 31 (11.0%) | 0 (0.0%) |
| $1,000 to $1,499 | 26 (9.2%) | 9 (7.9%) |
| $1,500 to $1,999 | 20 (7.1%) | 27 (23.7%) |
| $2,000 to $2,499 | 68 (24.1%) | 77 (67.5%) |
| $2,500 to $2,999 | 32 (11.4%) | 1 (0.9%) |
| $3,000 or more | 40 (14.2%) | 0 (0.0%) |
| Total | 282 (100.0%) | 114 (100.0%) |
Physical Housing Characteristics in Shalimar
Housing Structures in Shalimar
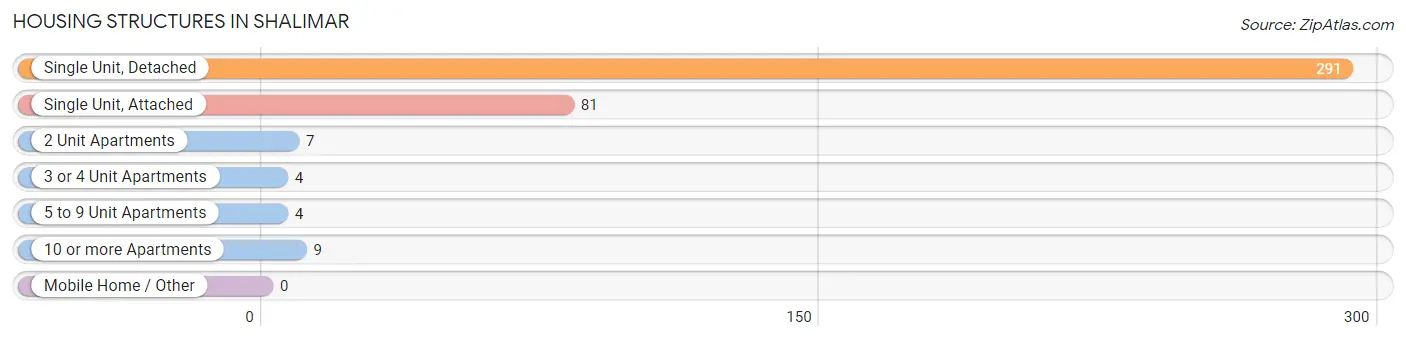
| Structure Type | # Housing Units | % Housing Units |
| Single Unit, Detached | 291 | 73.5% |
| Single Unit, Attached | 81 | 20.4% |
| 2 Unit Apartments | 7 | 1.8% |
| 3 or 4 Unit Apartments | 4 | 1.0% |
| 5 to 9 Unit Apartments | 4 | 1.0% |
| 10 or more Apartments | 9 | 2.3% |
| Mobile Home / Other | 0 | 0.0% |
| Total | 396 | 100.0% |
Housing Structures by Occupancy in Shalimar
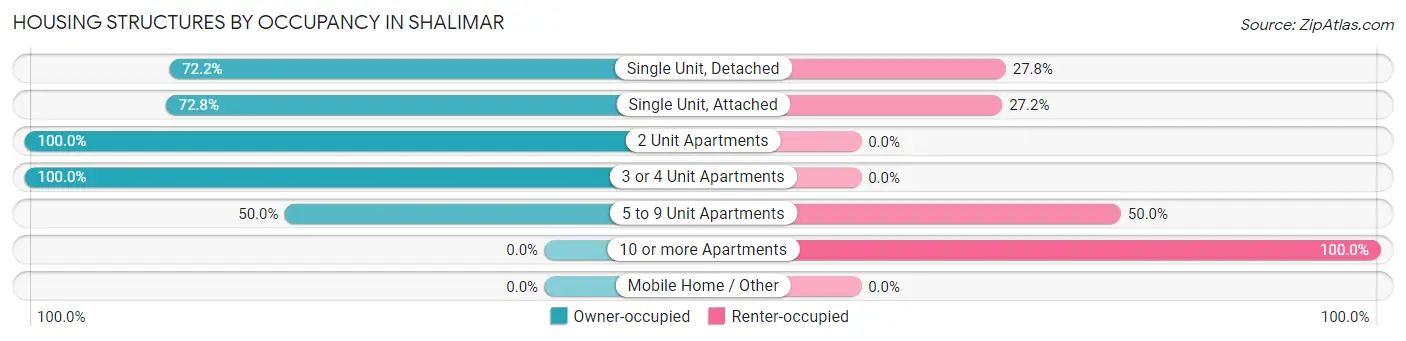
| Structure Type | Owner-occupied | Renter-occupied |
| Single Unit, Detached | 210 (72.2%) | 81 (27.8%) |
| Single Unit, Attached | 59 (72.8%) | 22 (27.2%) |
| 2 Unit Apartments | 7 (100.0%) | 0 (0.0%) |
| 3 or 4 Unit Apartments | 4 (100.0%) | 0 (0.0%) |
| 5 to 9 Unit Apartments | 2 (50.0%) | 2 (50.0%) |
| 10 or more Apartments | 0 (0.0%) | 9 (100.0%) |
| Mobile Home / Other | 0 (0.0%) | 0 (0.0%) |
| Total | 282 (71.2%) | 114 (28.8%) |
Housing Structures by Number of Rooms in Shalimar
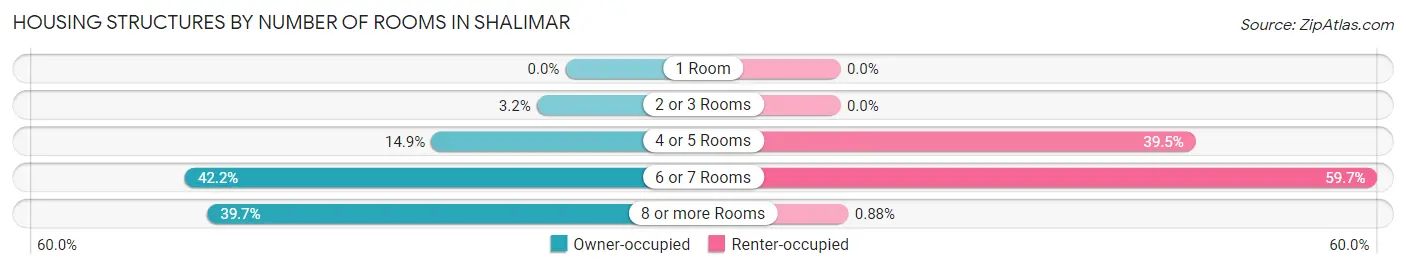
| Number of Rooms | Owner-occupied | Renter-occupied |
| 1 Room | 0 (0.0%) | 0 (0.0%) |
| 2 or 3 Rooms | 9 (3.2%) | 0 (0.0%) |
| 4 or 5 Rooms | 42 (14.9%) | 45 (39.5%) |
| 6 or 7 Rooms | 119 (42.2%) | 68 (59.7%) |
| 8 or more Rooms | 112 (39.7%) | 1 (0.9%) |
| Total | 282 (100.0%) | 114 (100.0%) |
Housing Structure by Heating Type in Shalimar
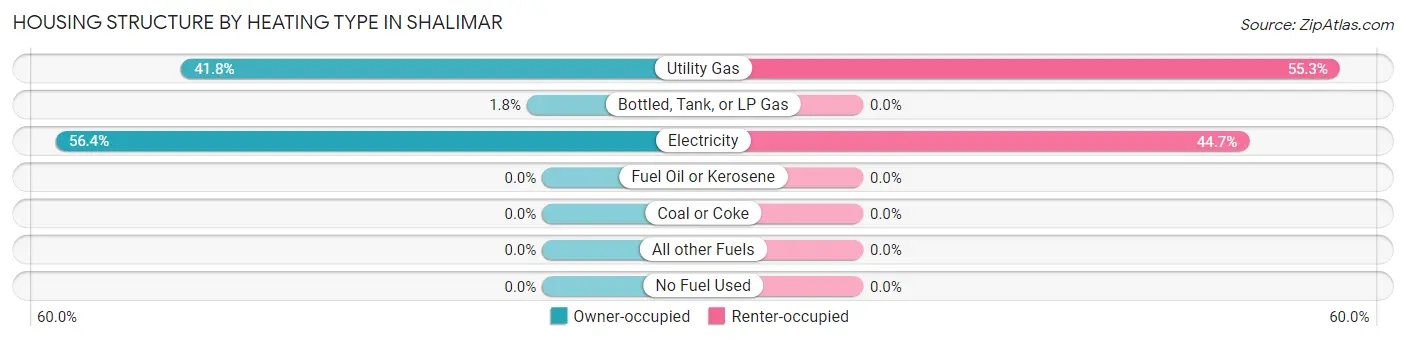
| Heating Type | Owner-occupied | Renter-occupied |
| Utility Gas | 118 (41.8%) | 63 (55.3%) |
| Bottled, Tank, or LP Gas | 5 (1.8%) | 0 (0.0%) |
| Electricity | 159 (56.4%) | 51 (44.7%) |
| Fuel Oil or Kerosene | 0 (0.0%) | 0 (0.0%) |
| Coal or Coke | 0 (0.0%) | 0 (0.0%) |
| All other Fuels | 0 (0.0%) | 0 (0.0%) |
| No Fuel Used | 0 (0.0%) | 0 (0.0%) |
| Total | 282 (100.0%) | 114 (100.0%) |
Household Vehicle Usage in Shalimar
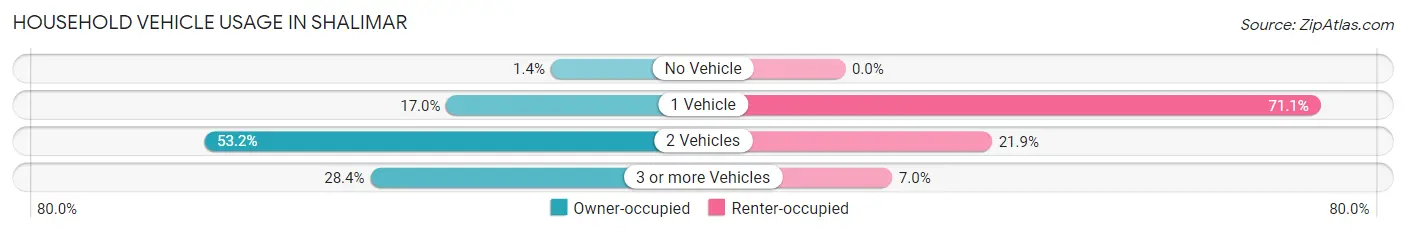
| Vehicles per Household | Owner-occupied | Renter-occupied |
| No Vehicle | 4 (1.4%) | 0 (0.0%) |
| 1 Vehicle | 48 (17.0%) | 81 (71.1%) |
| 2 Vehicles | 150 (53.2%) | 25 (21.9%) |
| 3 or more Vehicles | 80 (28.4%) | 8 (7.0%) |
| Total | 282 (100.0%) | 114 (100.0%) |
Real Estate & Mortgages in Shalimar
Real Estate and Mortgage Overview in Shalimar
| Characteristic | Without Mortgage | With Mortgage |
| Housing Units | 109 | 173 |
| Median Property Value | $425,000 | $417,400 |
| Median Household Income | $90,625 | $89 |
| Monthly Housing Costs | $752 | $40 |
| Real Estate Taxes | $2,598 | $6 |
Property Value by Mortgage Status in Shalimar
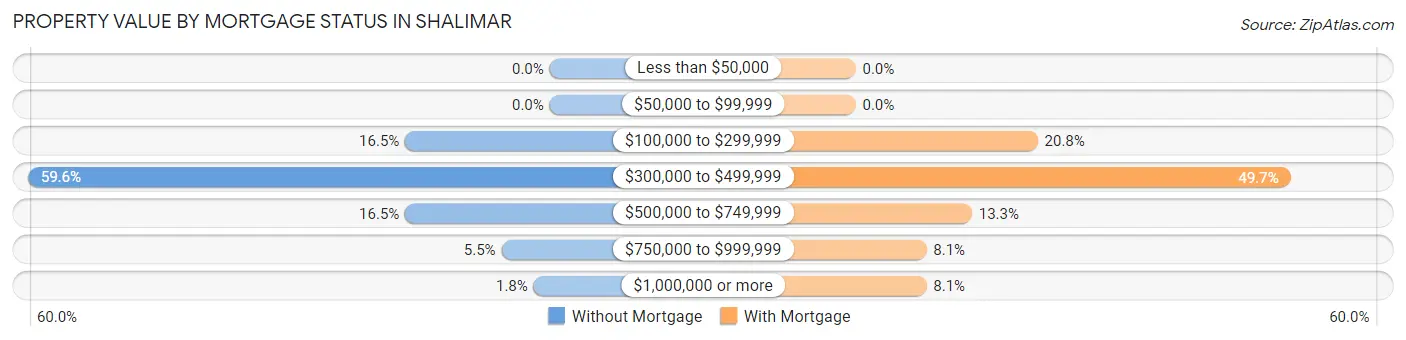
| Property Value | Without Mortgage | With Mortgage |
| Less than $50,000 | 0 (0.0%) | 0 (0.0%) |
| $50,000 to $99,999 | 0 (0.0%) | 0 (0.0%) |
| $100,000 to $299,999 | 18 (16.5%) | 36 (20.8%) |
| $300,000 to $499,999 | 65 (59.6%) | 86 (49.7%) |
| $500,000 to $749,999 | 18 (16.5%) | 23 (13.3%) |
| $750,000 to $999,999 | 6 (5.5%) | 14 (8.1%) |
| $1,000,000 or more | 2 (1.8%) | 14 (8.1%) |
| Total | 109 (100.0%) | 173 (100.0%) |
Household Income by Mortgage Status in Shalimar
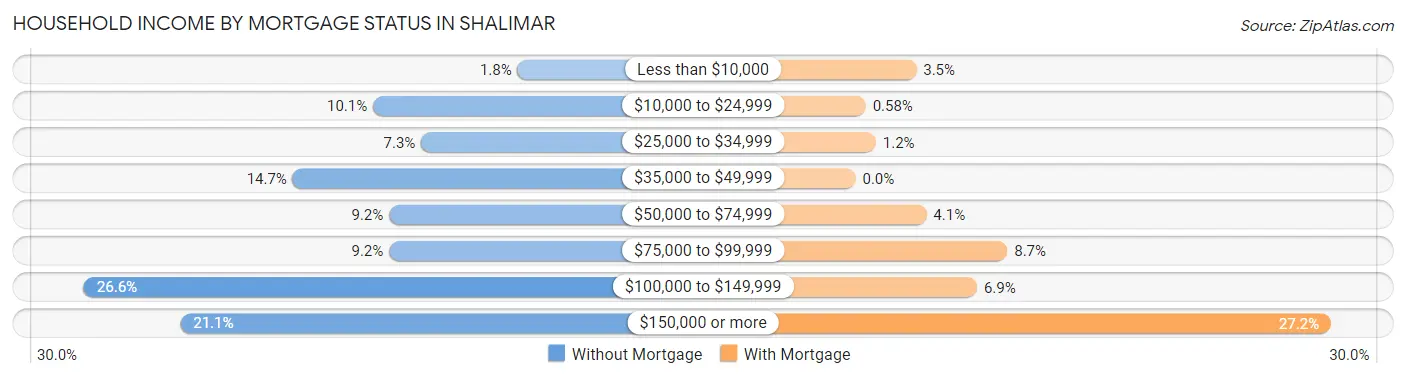
| Household Income | Without Mortgage | With Mortgage |
| Less than $10,000 | 2 (1.8%) | 6 (3.5%) |
| $10,000 to $24,999 | 11 (10.1%) | 1 (0.6%) |
| $25,000 to $34,999 | 8 (7.3%) | 2 (1.2%) |
| $35,000 to $49,999 | 16 (14.7%) | 0 (0.0%) |
| $50,000 to $74,999 | 10 (9.2%) | 7 (4.1%) |
| $75,000 to $99,999 | 10 (9.2%) | 15 (8.7%) |
| $100,000 to $149,999 | 29 (26.6%) | 12 (6.9%) |
| $150,000 or more | 23 (21.1%) | 47 (27.2%) |
| Total | 109 (100.0%) | 173 (100.0%) |
Property Value to Household Income Ratio in Shalimar
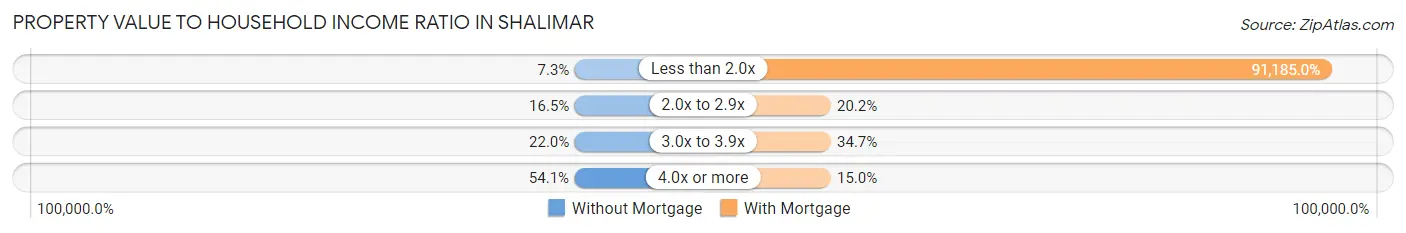
| Value-to-Income Ratio | Without Mortgage | With Mortgage |
| Less than 2.0x | 8 (7.3%) | 157,750 (91,185.0%) |
| 2.0x to 2.9x | 18 (16.5%) | 35 (20.2%) |
| 3.0x to 3.9x | 24 (22.0%) | 60 (34.7%) |
| 4.0x or more | 59 (54.1%) | 26 (15.0%) |
| Total | 109 (100.0%) | 173 (100.0%) |
Real Estate Taxes by Mortgage Status in Shalimar
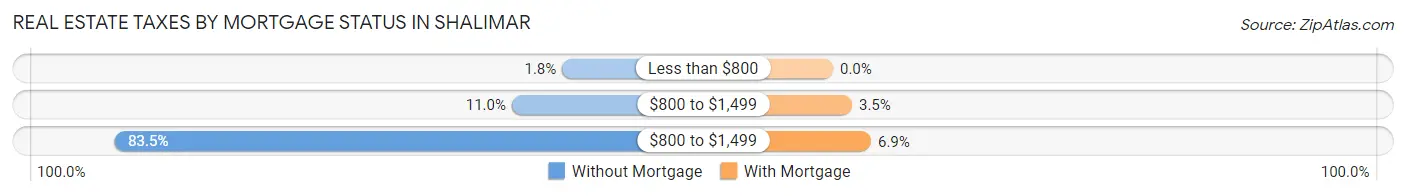
| Property Taxes | Without Mortgage | With Mortgage |
| Less than $800 | 2 (1.8%) | 0 (0.0%) |
| $800 to $1,499 | 12 (11.0%) | 6 (3.5%) |
| $800 to $1,499 | 91 (83.5%) | 12 (6.9%) |
| Total | 109 (100.0%) | 173 (100.0%) |
Health & Disability in Shalimar
Health Insurance Coverage by Age in Shalimar
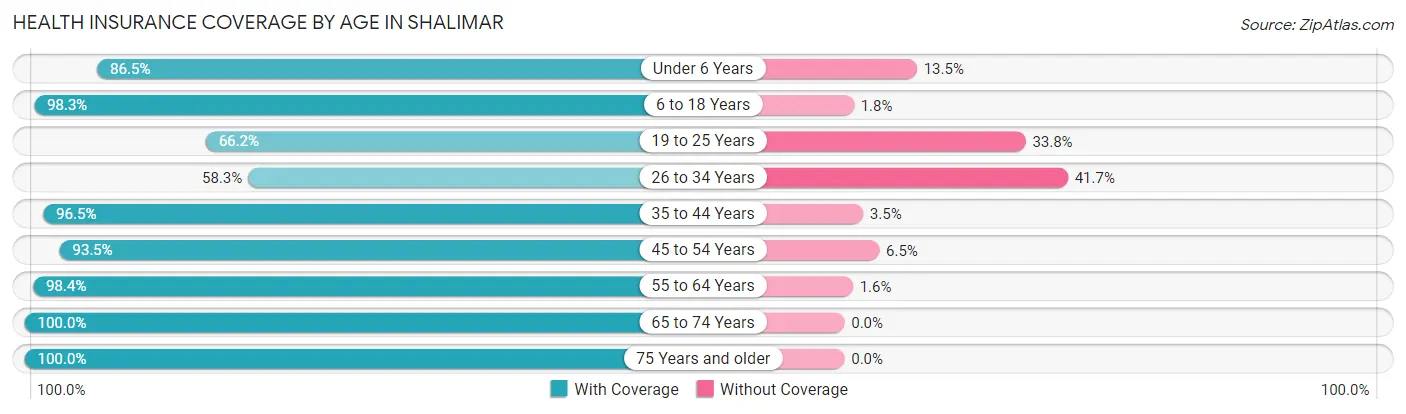
| Age Bracket | With Coverage | Without Coverage |
| Under 6 Years | 32 (86.5%) | 5 (13.5%) |
| 6 to 18 Years | 112 (98.3%) | 2 (1.8%) |
| 19 to 25 Years | 49 (66.2%) | 25 (33.8%) |
| 26 to 34 Years | 35 (58.3%) | 25 (41.7%) |
| 35 to 44 Years | 139 (96.5%) | 5 (3.5%) |
| 45 to 54 Years | 72 (93.5%) | 5 (6.5%) |
| 55 to 64 Years | 125 (98.4%) | 2 (1.6%) |
| 65 to 74 Years | 146 (100.0%) | 0 (0.0%) |
| 75 Years and older | 91 (100.0%) | 0 (0.0%) |
| Total | 801 (92.1%) | 69 (7.9%) |
Health Insurance Coverage by Citizenship Status in Shalimar
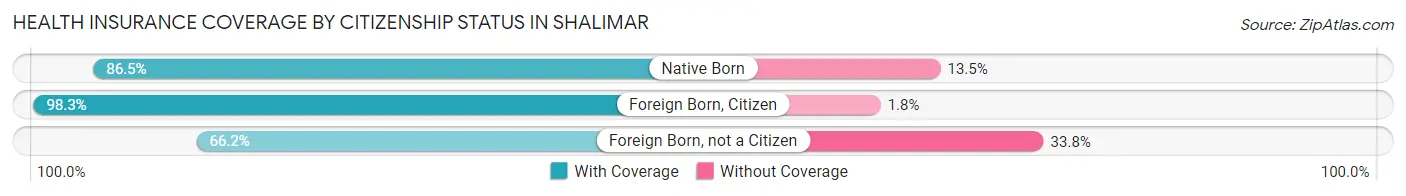
| Citizenship Status | With Coverage | Without Coverage |
| Native Born | 32 (86.5%) | 5 (13.5%) |
| Foreign Born, Citizen | 112 (98.3%) | 2 (1.8%) |
| Foreign Born, not a Citizen | 49 (66.2%) | 25 (33.8%) |
Health Insurance Coverage by Household Income in Shalimar
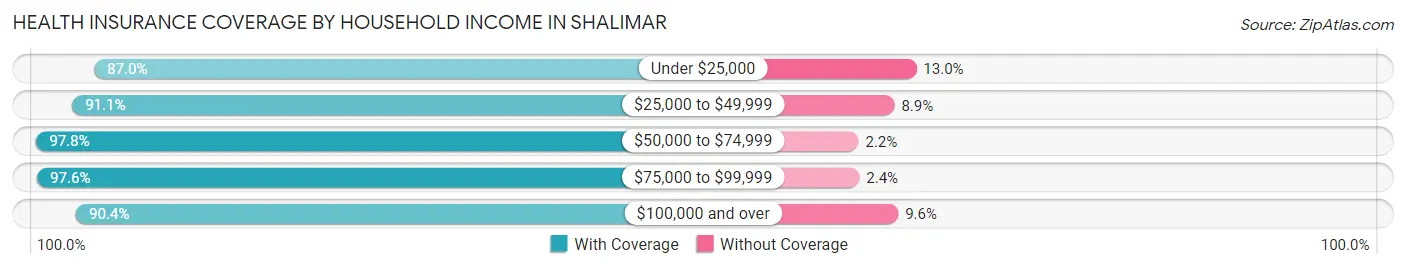
| Household Income | With Coverage | Without Coverage |
| Under $25,000 | 40 (87.0%) | 6 (13.0%) |
| $25,000 to $49,999 | 51 (91.1%) | 5 (8.9%) |
| $50,000 to $74,999 | 89 (97.8%) | 2 (2.2%) |
| $75,000 to $99,999 | 124 (97.6%) | 3 (2.4%) |
| $100,000 and over | 497 (90.4%) | 53 (9.6%) |
Public vs Private Health Insurance Coverage by Age in Shalimar
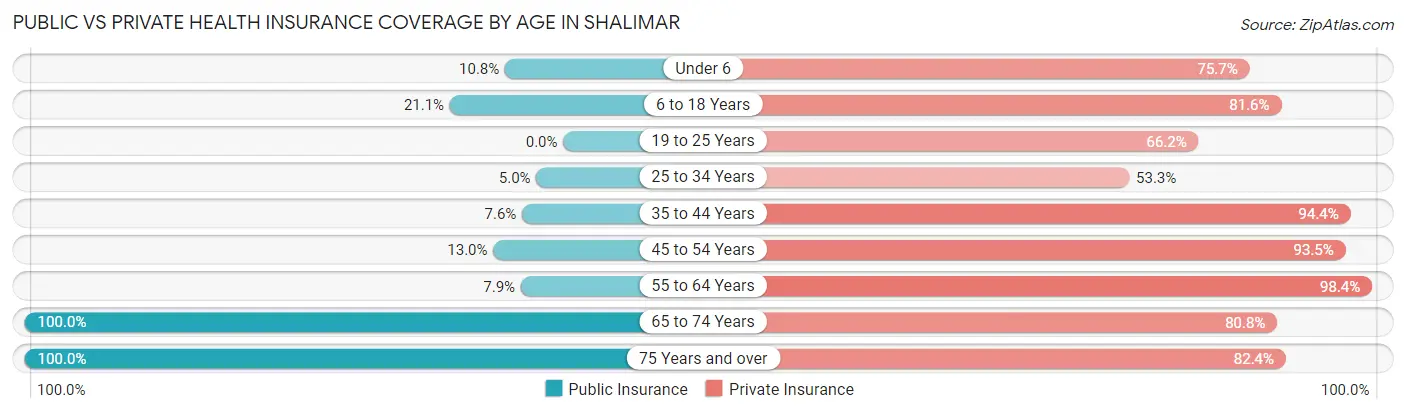
| Age Bracket | Public Insurance | Private Insurance |
| Under 6 | 4 (10.8%) | 28 (75.7%) |
| 6 to 18 Years | 24 (21.0%) | 93 (81.6%) |
| 19 to 25 Years | 0 (0.0%) | 49 (66.2%) |
| 25 to 34 Years | 3 (5.0%) | 32 (53.3%) |
| 35 to 44 Years | 11 (7.6%) | 136 (94.4%) |
| 45 to 54 Years | 10 (13.0%) | 72 (93.5%) |
| 55 to 64 Years | 10 (7.9%) | 125 (98.4%) |
| 65 to 74 Years | 146 (100.0%) | 118 (80.8%) |
| 75 Years and over | 91 (100.0%) | 75 (82.4%) |
| Total | 299 (34.4%) | 728 (83.7%) |
Disability Status by Sex by Age in Shalimar
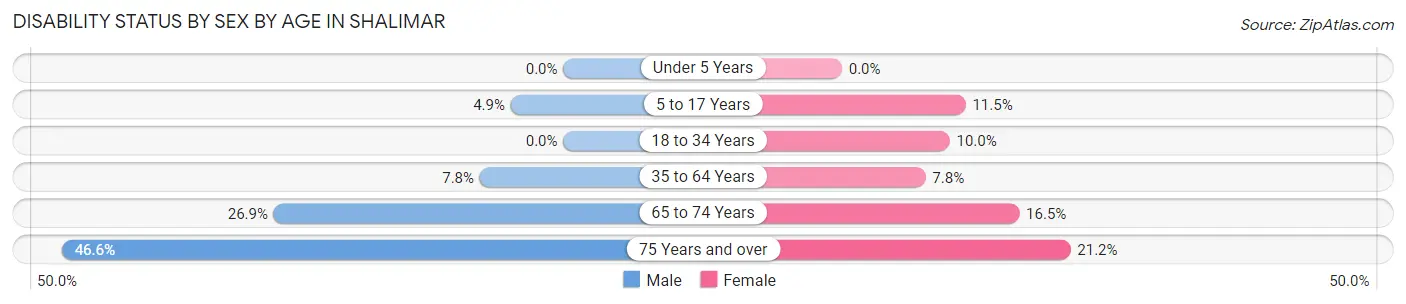
| Age Bracket | Male | Female |
| Under 5 Years | 0 (0.0%) | 0 (0.0%) |
| 5 to 17 Years | 2 (4.9%) | 7 (11.5%) |
| 18 to 34 Years | 0 (0.0%) | 9 (10.0%) |
| 35 to 64 Years | 10 (7.7%) | 17 (7.8%) |
| 65 to 74 Years | 18 (26.9%) | 13 (16.5%) |
| 75 Years and over | 27 (46.6%) | 7 (21.2%) |
Disability Class by Sex by Age in Shalimar
Disability Class: Hearing Difficulty
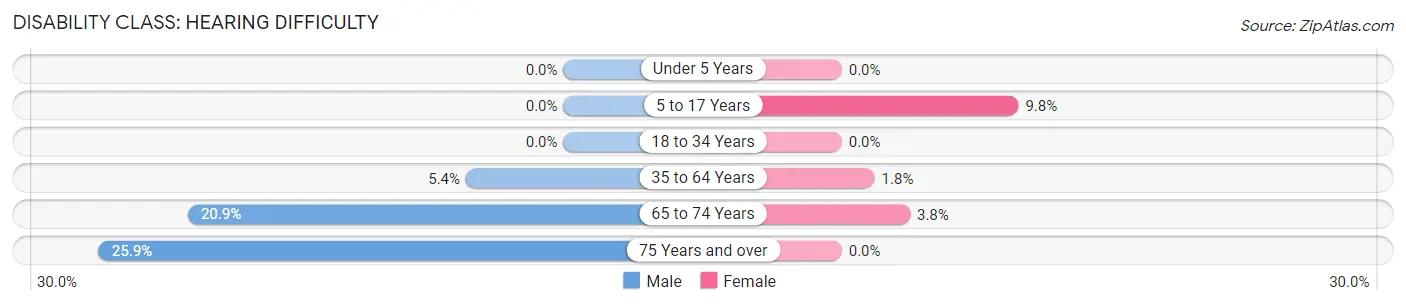
| Age Bracket | Male | Female |
| Under 5 Years | 0 (0.0%) | 0 (0.0%) |
| 5 to 17 Years | 0 (0.0%) | 6 (9.8%) |
| 18 to 34 Years | 0 (0.0%) | 0 (0.0%) |
| 35 to 64 Years | 7 (5.4%) | 4 (1.8%) |
| 65 to 74 Years | 14 (20.9%) | 3 (3.8%) |
| 75 Years and over | 15 (25.9%) | 0 (0.0%) |
Disability Class: Vision Difficulty
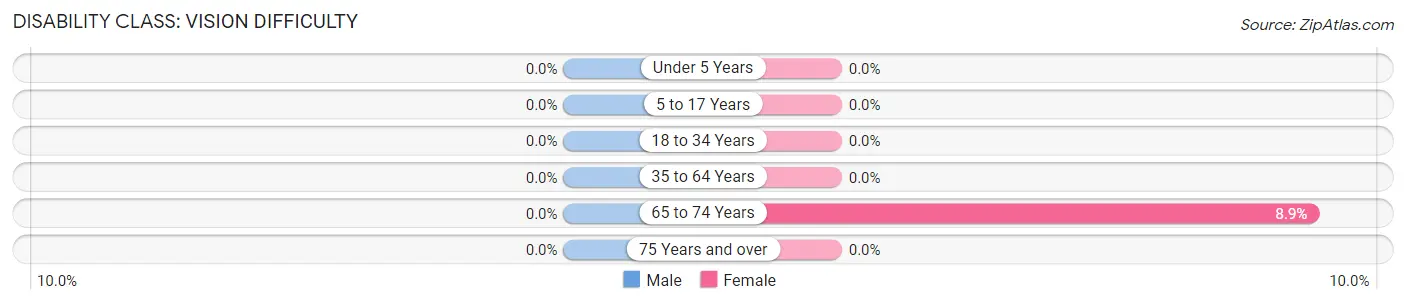
| Age Bracket | Male | Female |
| Under 5 Years | 0 (0.0%) | 0 (0.0%) |
| 5 to 17 Years | 0 (0.0%) | 0 (0.0%) |
| 18 to 34 Years | 0 (0.0%) | 0 (0.0%) |
| 35 to 64 Years | 0 (0.0%) | 0 (0.0%) |
| 65 to 74 Years | 0 (0.0%) | 7 (8.9%) |
| 75 Years and over | 0 (0.0%) | 0 (0.0%) |
Disability Class: Cognitive Difficulty
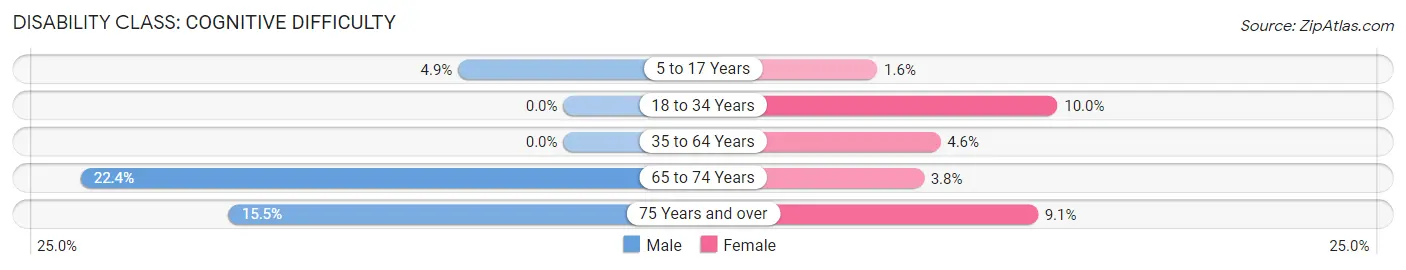
| Age Bracket | Male | Female |
| 5 to 17 Years | 2 (4.9%) | 1 (1.6%) |
| 18 to 34 Years | 0 (0.0%) | 9 (10.0%) |
| 35 to 64 Years | 0 (0.0%) | 10 (4.6%) |
| 65 to 74 Years | 15 (22.4%) | 3 (3.8%) |
| 75 Years and over | 9 (15.5%) | 3 (9.1%) |
Disability Class: Ambulatory Difficulty
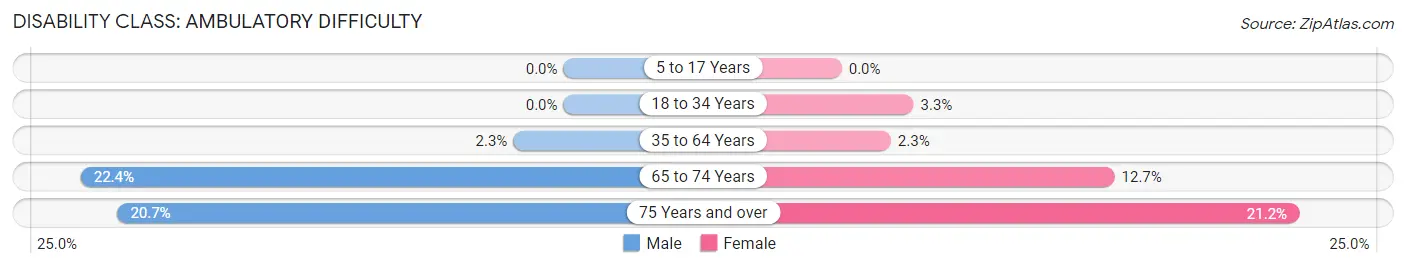
| Age Bracket | Male | Female |
| 5 to 17 Years | 0 (0.0%) | 0 (0.0%) |
| 18 to 34 Years | 0 (0.0%) | 3 (3.3%) |
| 35 to 64 Years | 3 (2.3%) | 5 (2.3%) |
| 65 to 74 Years | 15 (22.4%) | 10 (12.7%) |
| 75 Years and over | 12 (20.7%) | 7 (21.2%) |
Disability Class: Self-Care Difficulty
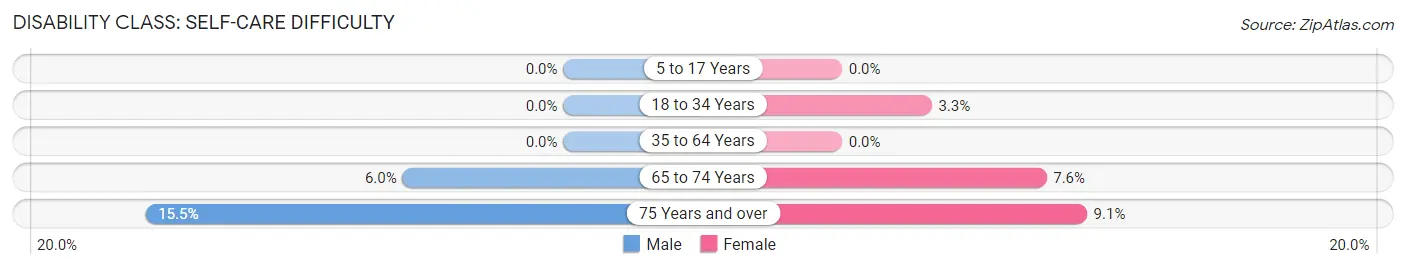
| Age Bracket | Male | Female |
| 5 to 17 Years | 0 (0.0%) | 0 (0.0%) |
| 18 to 34 Years | 0 (0.0%) | 3 (3.3%) |
| 35 to 64 Years | 0 (0.0%) | 0 (0.0%) |
| 65 to 74 Years | 4 (6.0%) | 6 (7.6%) |
| 75 Years and over | 9 (15.5%) | 3 (9.1%) |
Technology Access in Shalimar
Computing Device Access in Shalimar
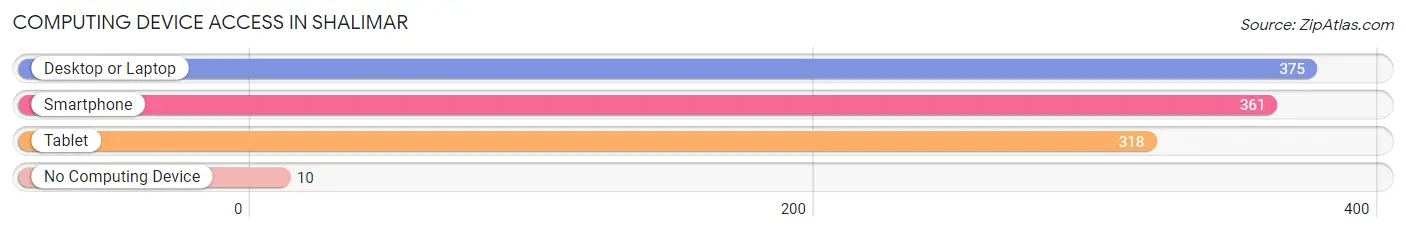
| Device Type | # Households | % Households |
| Desktop or Laptop | 375 | 94.7% |
| Smartphone | 361 | 91.2% |
| Tablet | 318 | 80.3% |
| No Computing Device | 10 | 2.5% |
| Total | 396 | 100.0% |
Internet Access in Shalimar
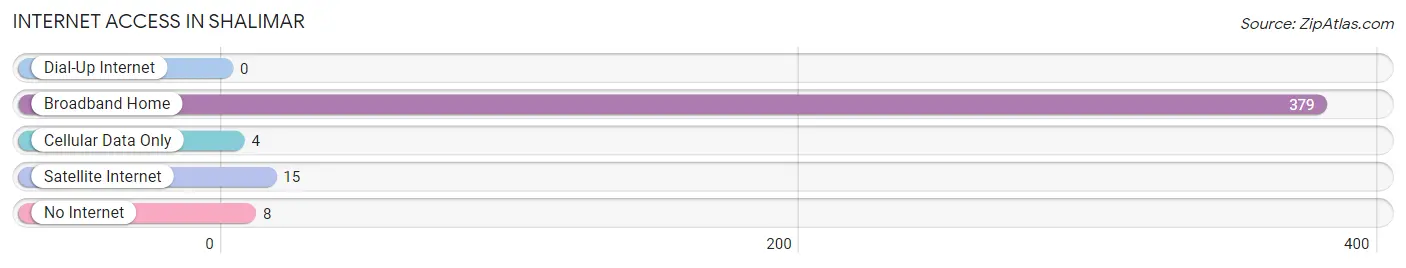
| Internet Type | # Households | % Households |
| Dial-Up Internet | 0 | 0.0% |
| Broadband Home | 379 | 95.7% |
| Cellular Data Only | 4 | 1.0% |
| Satellite Internet | 15 | 3.8% |
| No Internet | 8 | 2.0% |
| Total | 396 | 100.0% |
Shalimar Summary
Shalimar is a small town located in Okaloosa County, Florida. It is situated on the shores of Choctawhatchee Bay, just east of Fort Walton Beach and south of Eglin Air Force Base. The town was founded in the early 1900s and has a population of approximately 2,500 people.
History
Shalimar was founded in the early 1900s by a group of settlers from the nearby town of Fort Walton Beach. The settlers were looking for a place to settle and start a new life. The town was named after the Shalimar Gardens in India, which were built by the Mughal Emperor Shah Jahan in the 17th century. The town was incorporated in 1925 and has remained a small, close-knit community ever since.
Geography
Shalimar is located in Okaloosa County, Florida. It is situated on the shores of Choctawhatchee Bay, just east of Fort Walton Beach and south of Eglin Air Force Base. The town is surrounded by lush green forests and is home to a variety of wildlife, including deer, wild turkeys, and bald eagles. The town is also home to several parks, including the Shalimar Pointe Park, which offers a variety of recreational activities, such as fishing, boating, and swimming.
Economy
Shalimar’s economy is largely based on tourism and the military. The town is home to several military bases, including Eglin Air Force Base, which is the largest military base in the United States. The base provides a large number of jobs to the local economy. Additionally, the town is home to several tourist attractions, such as the Gulfarium Marine Adventure Park, which is a popular destination for families. The town also has a variety of restaurants, shops, and other businesses that cater to tourists and locals alike.
Demographics
As of the 2010 census, Shalimar had a population of 2,500 people. The racial makeup of the town was 94.2% White, 2.2% African American, 0.8% Native American, 0.8% Asian, 0.2% Pacific Islander, and 1.8% from other races. The median household income was $45,000, and the median age was 42. The town is home to a variety of religious denominations, including Baptist, Catholic, and Methodist.
Shalimar is a small town with a rich history and a vibrant economy. It is home to a variety of attractions, businesses, and military bases, and is a popular destination for tourists and locals alike. The town is also home to a diverse population, with a variety of racial and religious backgrounds. Shalimar is a great place to live, work, and play.
Common Questions
What is Per Capita Income in Shalimar?
Per Capita income in Shalimar is $51,917.
What is the Median Family Income in Shalimar?
Median Family Income in Shalimar is $112,292.
What is the Median Household income in Shalimar?
Median Household Income in Shalimar is $104,265.
What is Inequality or Gini Index in Shalimar?
Inequality or Gini Index in Shalimar is 0.30.
What is the Total Population of Shalimar?
Total Population of Shalimar is 918.
What is the Total Male Population of Shalimar?
Total Male Population of Shalimar is 412.
What is the Total Female Population of Shalimar?
Total Female Population of Shalimar is 506.
What is the Ratio of Males per 100 Females in Shalimar?
There are 81.42 Males per 100 Females in Shalimar.
What is the Ratio of Females per 100 Males in Shalimar?
There are 122.82 Females per 100 Males in Shalimar.
What is the Median Population Age in Shalimar?
Median Population Age in Shalimar is 43.7 Years.
What is the Average Family Size in Shalimar
Average Family Size in Shalimar is 2.8 People.
What is the Average Household Size in Shalimar
Average Household Size in Shalimar is 2.3 People.
How Large is the Labor Force in Shalimar?
There are 526 People in the Labor Forcein in Shalimar.
What is the Percentage of People in the Labor Force in Shalimar?
65.0% of People are in the Labor Force in Shalimar.
What is the Unemployment Rate in Shalimar?
Unemployment Rate in Shalimar is 7.1%.