Seffner, FL Map & Demographics
Seffner Map
Seffner Overview
$41,366
PER CAPITA INCOME
$102,772
AVG FAMILY INCOME
$87,847
AVG HOUSEHOLD INCOME
10.3%
WAGE / INCOME GAP [ % ]
89.7¢/ $1
WAGE / INCOME GAP [ $ ]
0.43
INEQUALITY / GINI INDEX
8,597
TOTAL POPULATION
4,322
MALE POPULATION
4,275
FEMALE POPULATION
101.10
MALES / 100 FEMALES
98.91
FEMALES / 100 MALES
38.8
MEDIAN AGE
3.5
AVG FAMILY SIZE
3.0
AVG HOUSEHOLD SIZE
4,423
LABOR FORCE [ PEOPLE ]
66.1%
PERCENT IN LABOR FORCE
1.9%
UNEMPLOYMENT RATE
Seffner Zip Codes
Seffner Area Codes
Income in Seffner
Income Overview in Seffner
Per Capita Income in Seffner is $41,366, while median incomes of families and households are $102,772 and $87,847 respectively.
| Characteristic | Number | Measure |
| Per Capita Income | 8,597 | $41,366 |
| Median Family Income | 2,241 | $102,772 |
| Mean Family Income | 2,241 | $137,859 |
| Median Household Income | 2,839 | $87,847 |
| Mean Household Income | 2,839 | $123,328 |
| Income Deficit | 2,241 | $0 |
| Wage / Income Gap (%) | 8,597 | 10.28% |
| Wage / Income Gap ($) | 8,597 | 89.72¢ per $1 |
| Gini / Inequality Index | 8,597 | 0.43 |
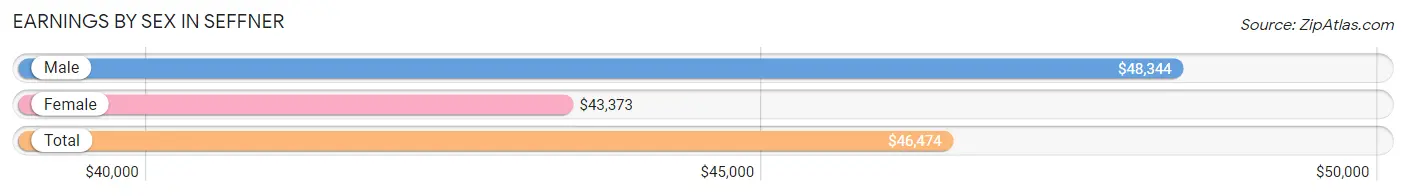
Earnings by Sex in Seffner
Average Earnings in Seffner are $46,474, $48,344 for men and $43,373 for women, a difference of 10.3%.
| Sex | Number | Average Earnings |
| Male | 2,354 (52.4%) | $48,344 |
| Female | 2,137 (47.6%) | $43,373 |
| Total | 4,491 (100.0%) | $46,474 |
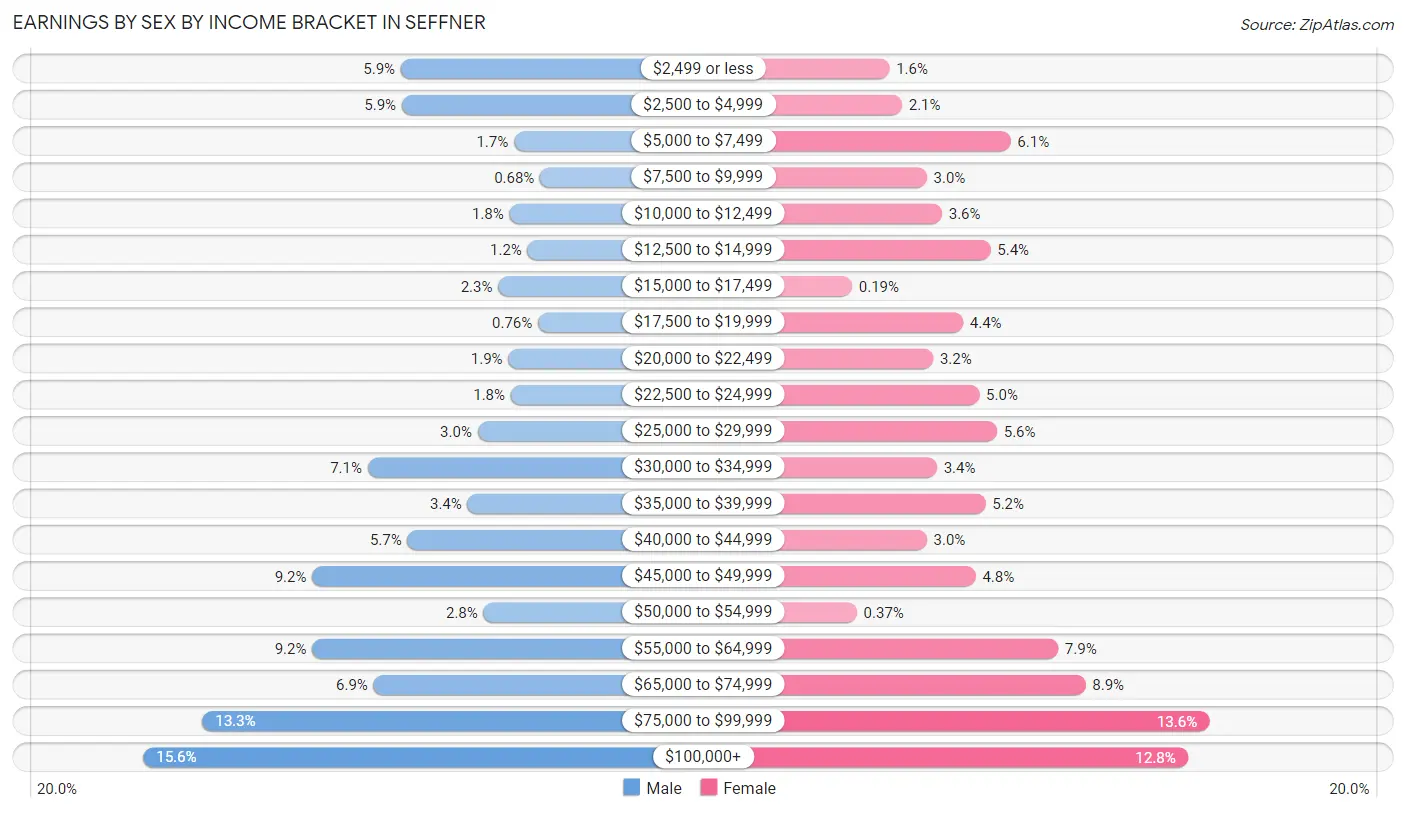
Earnings by Sex by Income Bracket in Seffner
The most common earnings brackets in Seffner are $100,000+ for men (366 | 15.5%) and $75,000 to $99,999 for women (290 | 13.6%).
| Income | Male | Female |
| $2,499 or less | 139 (5.9%) | 34 (1.6%) |
| $2,500 to $4,999 | 138 (5.9%) | 44 (2.1%) |
| $5,000 to $7,499 | 39 (1.7%) | 131 (6.1%) |
| $7,500 to $9,999 | 16 (0.7%) | 64 (3.0%) |
| $10,000 to $12,499 | 43 (1.8%) | 76 (3.6%) |
| $12,500 to $14,999 | 27 (1.1%) | 115 (5.4%) |
| $15,000 to $17,499 | 53 (2.2%) | 4 (0.2%) |
| $17,500 to $19,999 | 18 (0.8%) | 93 (4.3%) |
| $20,000 to $22,499 | 44 (1.9%) | 69 (3.2%) |
| $22,500 to $24,999 | 42 (1.8%) | 106 (5.0%) |
| $25,000 to $29,999 | 71 (3.0%) | 120 (5.6%) |
| $30,000 to $34,999 | 168 (7.1%) | 72 (3.4%) |
| $35,000 to $39,999 | 80 (3.4%) | 111 (5.2%) |
| $40,000 to $44,999 | 133 (5.7%) | 64 (3.0%) |
| $45,000 to $49,999 | 217 (9.2%) | 103 (4.8%) |
| $50,000 to $54,999 | 66 (2.8%) | 8 (0.4%) |
| $55,000 to $64,999 | 217 (9.2%) | 169 (7.9%) |
| $65,000 to $74,999 | 163 (6.9%) | 191 (8.9%) |
| $75,000 to $99,999 | 314 (13.3%) | 290 (13.6%) |
| $100,000+ | 366 (15.5%) | 273 (12.8%) |
| Total | 2,354 (100.0%) | 2,137 (100.0%) |
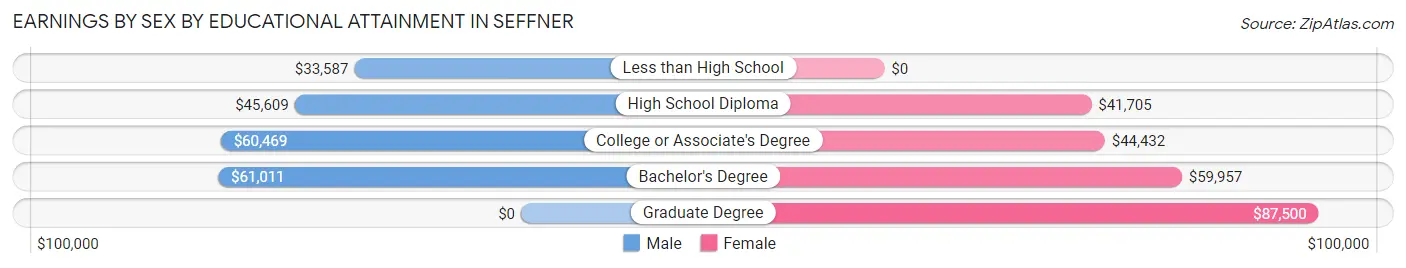
Earnings by Sex by Educational Attainment in Seffner
Average earnings in Seffner are $53,344 for men and $57,716 for women, a difference of 7.6%. Men with an educational attainment of bachelor's degree enjoy the highest average annual earnings of $61,011, while those with less than high school education earn the least with $33,587. Women with an educational attainment of graduate degree earn the most with the average annual earnings of $87,500, while those with high school diploma education have the smallest earnings of $41,705.
| Educational Attainment | Male Income | Female Income |
| Less than High School | $33,587 | $0 |
| High School Diploma | $45,609 | $41,705 |
| College or Associate's Degree | $60,469 | $44,432 |
| Bachelor's Degree | $61,011 | $59,957 |
| Graduate Degree | - | - |
| Total | $53,344 | $57,716 |
Family Income in Seffner
Family Income Brackets in Seffner
According to the Seffner family income data, there are 484 families falling into the $100,000 to $149,999 income range, which is the most common income bracket and makes up 21.6% of all families. Conversely, the less than $10,000 income bracket is the least frequent group with only 4 families (0.2%) belonging to this category.
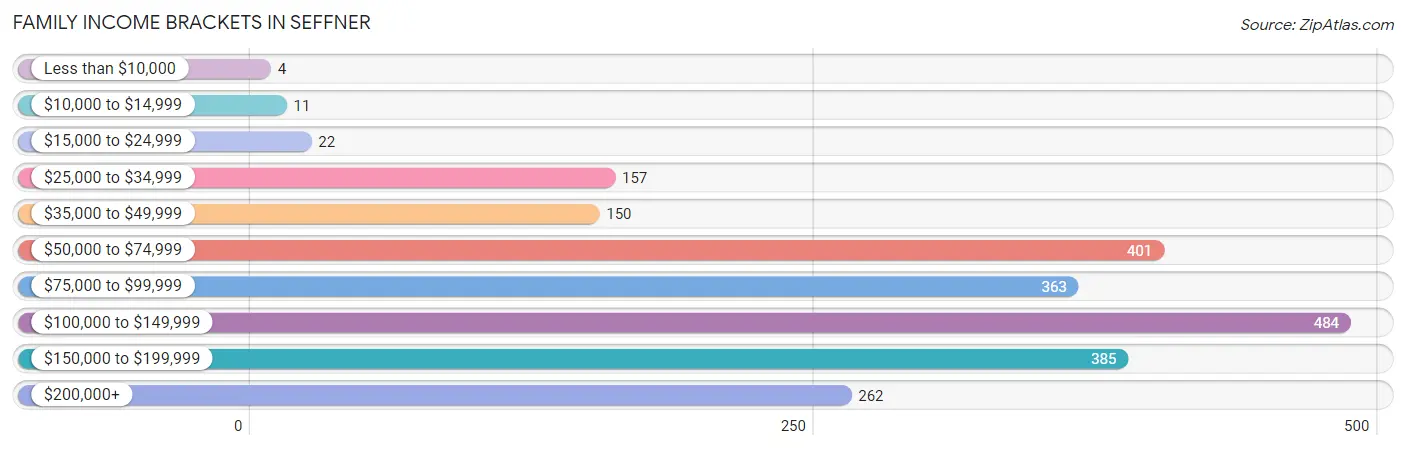
| Income Bracket | # Families | % Families |
| Less than $10,000 | 4 | 0.2% |
| $10,000 to $14,999 | 11 | 0.5% |
| $15,000 to $24,999 | 22 | 1.0% |
| $25,000 to $34,999 | 157 | 7.0% |
| $35,000 to $49,999 | 150 | 6.7% |
| $50,000 to $74,999 | 401 | 17.9% |
| $75,000 to $99,999 | 363 | 16.2% |
| $100,000 to $149,999 | 484 | 21.6% |
| $150,000 to $199,999 | 385 | 17.2% |
| $200,000+ | 262 | 11.7% |
Family Income by Famaliy Size in Seffner
6-person families (141 | 6.3%) account for the highest median family income in Seffner with $173,976 per family, while 2-person families (940 | 41.9%) have the highest median income of $48,125 per family member.
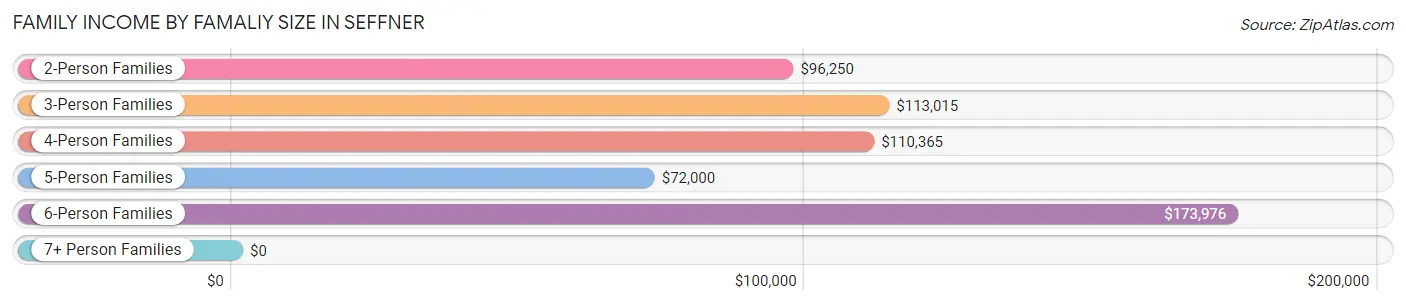
| Income Bracket | # Families | Median Income |
| 2-Person Families | 940 (41.9%) | $96,250 |
| 3-Person Families | 513 (22.9%) | $113,015 |
| 4-Person Families | 387 (17.3%) | $110,365 |
| 5-Person Families | 260 (11.6%) | $72,000 |
| 6-Person Families | 141 (6.3%) | $173,976 |
| 7+ Person Families | 0 (0.0%) | $0 |
| Total | 2,241 (100.0%) | $102,772 |
Family Income by Number of Earners in Seffner
The median family income in Seffner is $102,772, with families comprising 3+ earners (323) having the highest median family income of $135,208, while families with no earners (203) have the lowest median family income of $53,750, accounting for 14.4% and 9.1% of families, respectively.
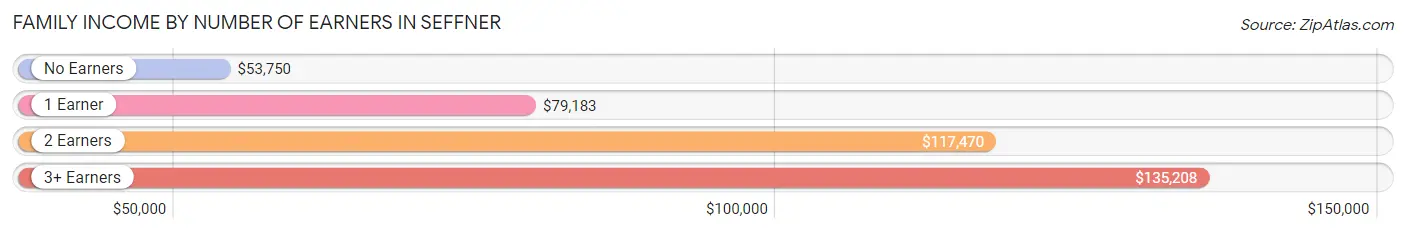
| Number of Earners | # Families | Median Income |
| No Earners | 203 (9.1%) | $53,750 |
| 1 Earner | 728 (32.5%) | $79,183 |
| 2 Earners | 987 (44.0%) | $117,470 |
| 3+ Earners | 323 (14.4%) | $135,208 |
| Total | 2,241 (100.0%) | $102,772 |
Household Income in Seffner
Household Income Brackets in Seffner
With 571 households falling in the category, the $50,000 to $74,999 income range is the most frequent in Seffner, accounting for 20.1% of all households.
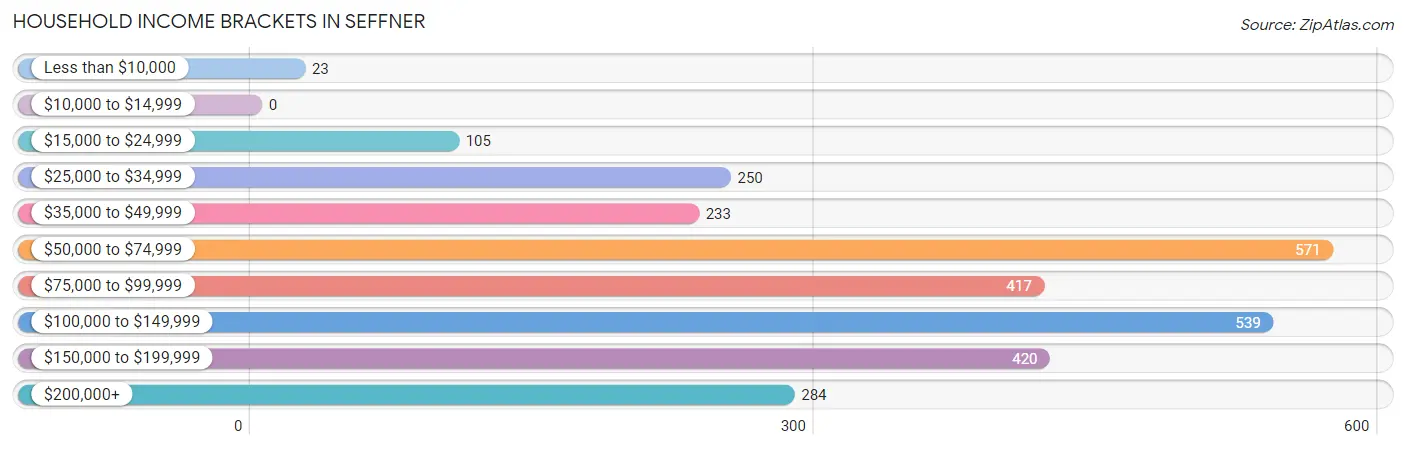
| Income Bracket | # Households | % Households |
| Less than $10,000 | 23 | 0.8% |
| $10,000 to $14,999 | 0 | 0.0% |
| $15,000 to $24,999 | 105 | 3.7% |
| $25,000 to $34,999 | 250 | 8.8% |
| $35,000 to $49,999 | 233 | 8.2% |
| $50,000 to $74,999 | 571 | 20.1% |
| $75,000 to $99,999 | 417 | 14.7% |
| $100,000 to $149,999 | 539 | 19.0% |
| $150,000 to $199,999 | 420 | 14.8% |
| $200,000+ | 284 | 10.0% |
Household Income by Householder Age in Seffner
The median household income in Seffner is $87,847, with the highest median household income of $107,353 found in the 45 to 64 years age bracket for the primary householder. A total of 1,200 households (42.3%) fall into this category. Meanwhile, the 15 to 24 years age bracket for the primary householder has the lowest median household income of $46,635, with 39 households (1.4%) in this group.
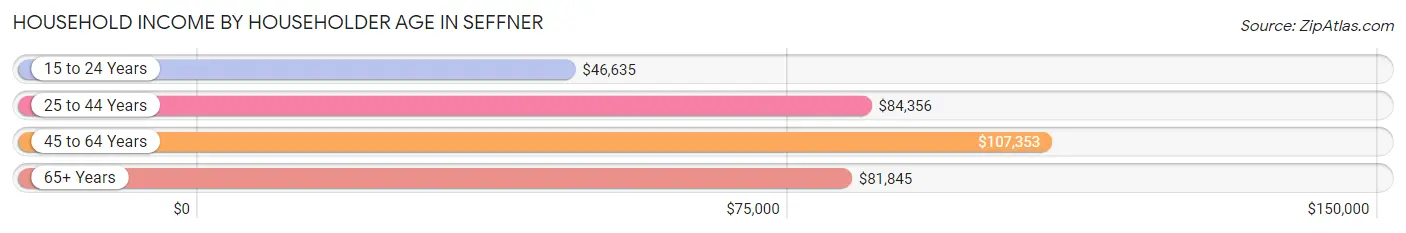
| Income Bracket | # Households | Median Income |
| 15 to 24 Years | 39 (1.4%) | $46,635 |
| 25 to 44 Years | 891 (31.4%) | $84,356 |
| 45 to 64 Years | 1,200 (42.3%) | $107,353 |
| 65+ Years | 709 (25.0%) | $81,845 |
| Total | 2,839 (100.0%) | $87,847 |
Poverty in Seffner
Income Below Poverty by Sex and Age in Seffner
With 4.7% poverty level for males and 8.1% for females among the residents of Seffner, 16 and 17 year old males and 18 to 24 year old females are the most vulnerable to poverty, with 68 males (46.9%) and 116 females (29.1%) in their respective age groups living below the poverty level.
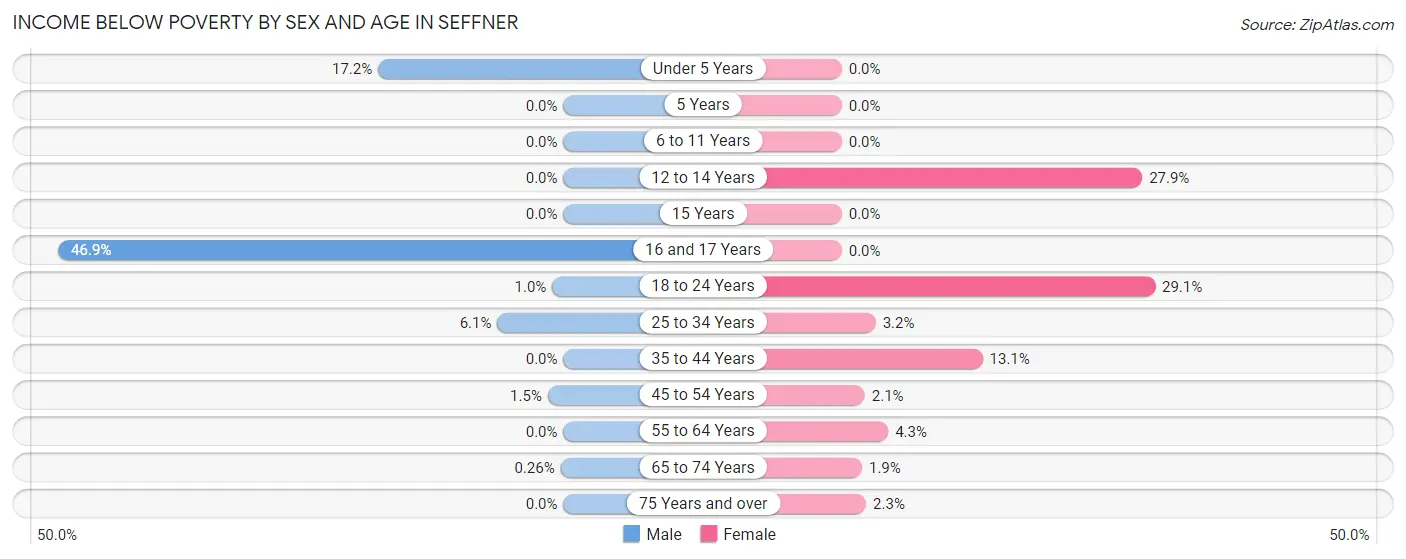
| Age Bracket | Male | Female |
| Under 5 Years | 86 (17.2%) | 0 (0.0%) |
| 5 Years | 0 (0.0%) | 0 (0.0%) |
| 6 to 11 Years | 0 (0.0%) | 0 (0.0%) |
| 12 to 14 Years | 0 (0.0%) | 87 (27.9%) |
| 15 Years | 0 (0.0%) | 0 (0.0%) |
| 16 and 17 Years | 68 (46.9%) | 0 (0.0%) |
| 18 to 24 Years | 5 (1.0%) | 116 (29.1%) |
| 25 to 34 Years | 30 (6.1%) | 12 (3.2%) |
| 35 to 44 Years | 0 (0.0%) | 77 (13.1%) |
| 45 to 54 Years | 11 (1.5%) | 11 (2.1%) |
| 55 to 64 Years | 0 (0.0%) | 26 (4.3%) |
| 65 to 74 Years | 1 (0.3%) | 8 (1.9%) |
| 75 Years and over | 0 (0.0%) | 6 (2.3%) |
| Total | 201 (4.7%) | 343 (8.1%) |
Income Above Poverty by Sex and Age in Seffner
According to the poverty statistics in Seffner, males aged 6 to 11 years and females aged under 5 years are the age groups that are most secure financially, with 100.0% of males and 100.0% of females in these age groups living above the poverty line.
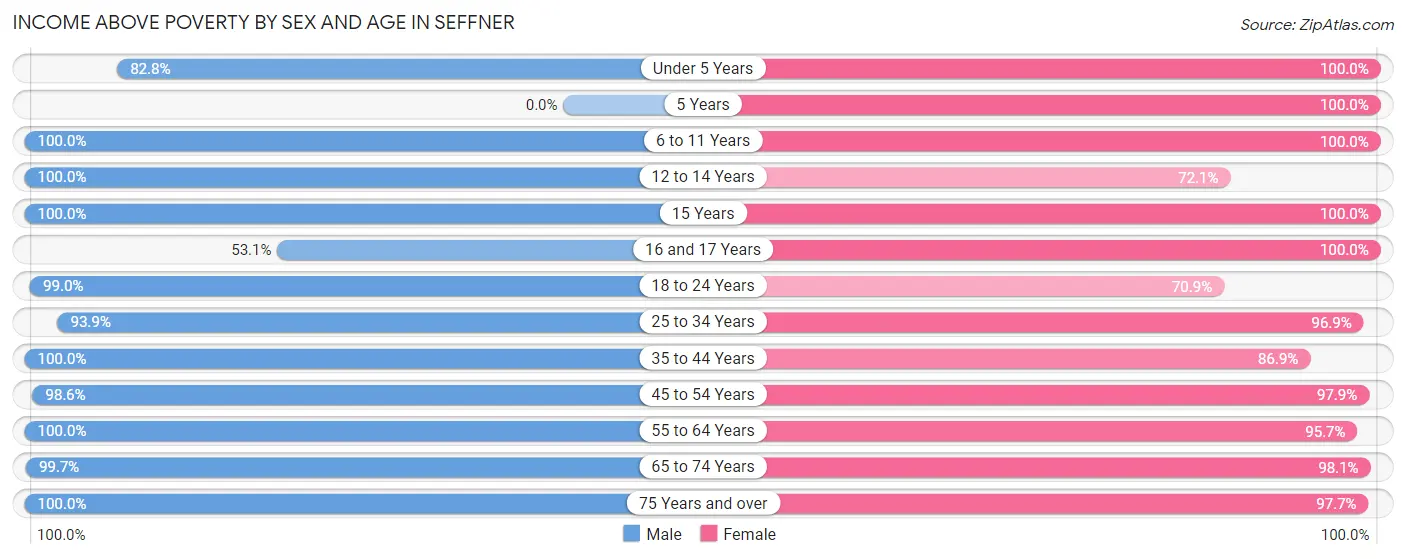
| Age Bracket | Male | Female |
| Under 5 Years | 414 (82.8%) | 260 (100.0%) |
| 5 Years | 0 (0.0%) | 80 (100.0%) |
| 6 to 11 Years | 225 (100.0%) | 242 (100.0%) |
| 12 to 14 Years | 132 (100.0%) | 225 (72.1%) |
| 15 Years | 75 (100.0%) | 40 (100.0%) |
| 16 and 17 Years | 77 (53.1%) | 149 (100.0%) |
| 18 to 24 Years | 475 (99.0%) | 283 (70.9%) |
| 25 to 34 Years | 459 (93.9%) | 369 (96.9%) |
| 35 to 44 Years | 544 (100.0%) | 512 (86.9%) |
| 45 to 54 Years | 749 (98.6%) | 504 (97.9%) |
| 55 to 64 Years | 417 (100.0%) | 577 (95.7%) |
| 65 to 74 Years | 388 (99.7%) | 418 (98.1%) |
| 75 Years and over | 141 (100.0%) | 259 (97.7%) |
| Total | 4,096 (95.3%) | 3,918 (91.9%) |
Income Below Poverty Among Married-Couple Families in Seffner
The poverty statistics for married-couple families in Seffner show that 0.2% or 4 of the total 1,778 families live below the poverty line. Families with no children have the highest poverty rate of 0.4%, comprising of 4 families. On the other hand, families with 1 or 2 children have the lowest poverty rate of 0.0%, which includes 0 families.
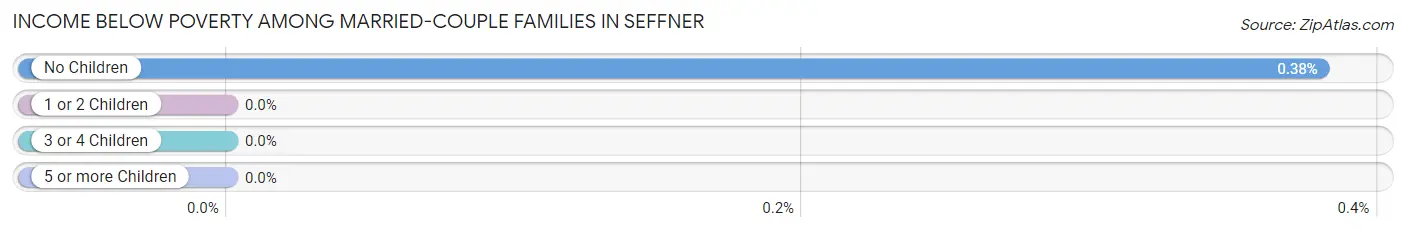
| Children | Above Poverty | Below Poverty |
| No Children | 1,046 (99.6%) | 4 (0.4%) |
| 1 or 2 Children | 559 (100.0%) | 0 (0.0%) |
| 3 or 4 Children | 169 (100.0%) | 0 (0.0%) |
| 5 or more Children | 0 (0.0%) | 0 (0.0%) |
| Total | 1,774 (99.8%) | 4 (0.2%) |
Income Below Poverty Among Single-Parent Households in Seffner
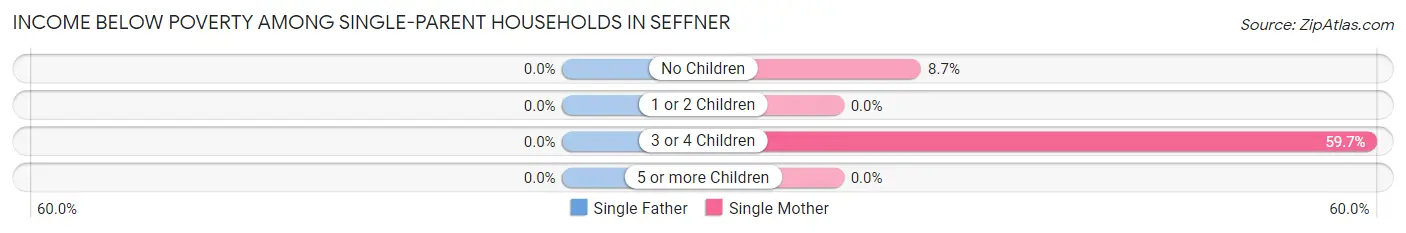
| Children | Single Father | Single Mother |
| No Children | 0 (0.0%) | 11 (8.7%) |
| 1 or 2 Children | 0 (0.0%) | 0 (0.0%) |
| 3 or 4 Children | 0 (0.0%) | 68 (59.7%) |
| 5 or more Children | 0 (0.0%) | 0 (0.0%) |
| Total | 0 (0.0%) | 79 (27.3%) |
Income Below Poverty Among Married-Couple vs Single-Parent Households in Seffner
The poverty data for Seffner shows that 4 of the married-couple family households (0.2%) and 79 of the single-parent households (17.1%) are living below the poverty level. Within the married-couple family households, those with no children have the highest poverty rate, with 4 households (0.4%) falling below the poverty line. Among the single-parent households, those with 3 or 4 children have the highest poverty rate, with 68 household (55.3%) living below poverty.
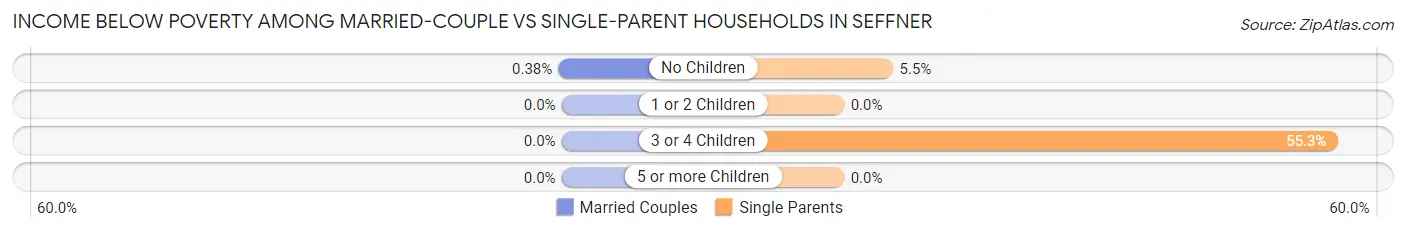
| Children | Married-Couple Families | Single-Parent Households |
| No Children | 4 (0.4%) | 11 (5.5%) |
| 1 or 2 Children | 0 (0.0%) | 0 (0.0%) |
| 3 or 4 Children | 0 (0.0%) | 68 (55.3%) |
| 5 or more Children | 0 (0.0%) | 0 (0.0%) |
| Total | 4 (0.2%) | 79 (17.1%) |
Race in Seffner
The most populous races in Seffner are White / Caucasian (5,206 | 60.6%), Black / African American (2,032 | 23.6%), and Hispanic or Latino (1,979 | 23.0%).
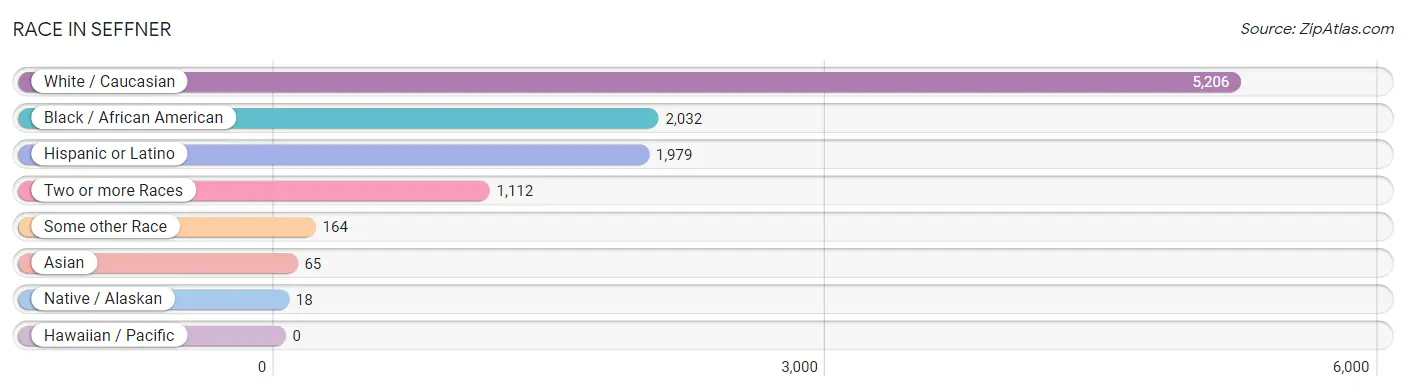
| Race | # Population | % Population |
| Asian | 65 | 0.8% |
| Black / African American | 2,032 | 23.6% |
| Hawaiian / Pacific | 0 | 0.0% |
| Hispanic or Latino | 1,979 | 23.0% |
| Native / Alaskan | 18 | 0.2% |
| White / Caucasian | 5,206 | 60.6% |
| Two or more Races | 1,112 | 12.9% |
| Some other Race | 164 | 1.9% |
| Total | 8,597 | 100.0% |
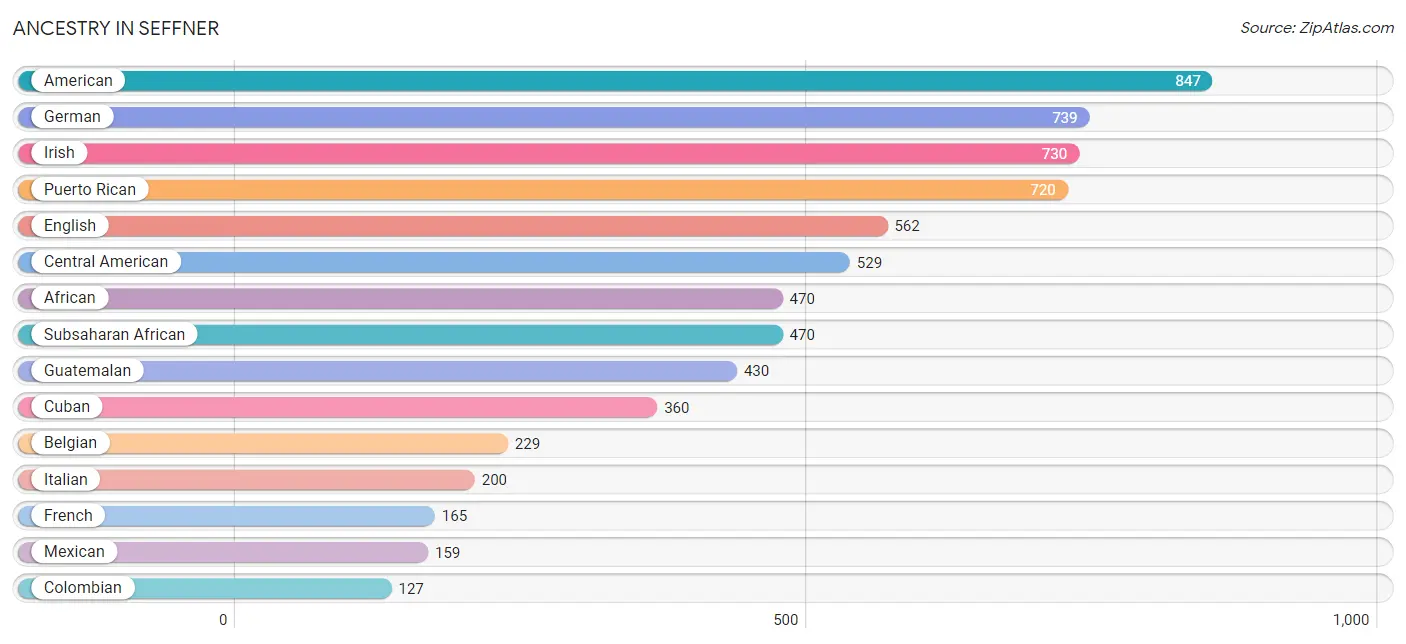
Ancestry in Seffner
The most populous ancestries reported in Seffner are American (847 | 9.9%), German (739 | 8.6%), Irish (730 | 8.5%), Puerto Rican (720 | 8.4%), and English (562 | 6.5%), together accounting for 41.9% of all Seffner residents.
| Ancestry | # Population | % Population |
| African | 470 | 5.5% |
| American | 847 | 9.9% |
| Arab | 28 | 0.3% |
| Austrian | 18 | 0.2% |
| Belgian | 229 | 2.7% |
| British | 44 | 0.5% |
| Bulgarian | 13 | 0.2% |
| Burmese | 9 | 0.1% |
| Canadian | 8 | 0.1% |
| Central American | 529 | 6.1% |
| Central American Indian | 26 | 0.3% |
| Cherokee | 9 | 0.1% |
| Choctaw | 25 | 0.3% |
| Colombian | 127 | 1.5% |
| Cuban | 360 | 4.2% |
| Czech | 13 | 0.2% |
| Dutch | 30 | 0.4% |
| English | 562 | 6.5% |
| European | 31 | 0.4% |
| French | 165 | 1.9% |
| French Canadian | 109 | 1.3% |
| German | 739 | 8.6% |
| Greek | 21 | 0.2% |
| Guatemalan | 430 | 5.0% |
| Guyanese | 53 | 0.6% |
| Honduran | 13 | 0.2% |
| Hungarian | 18 | 0.2% |
| Irish | 730 | 8.5% |
| Italian | 200 | 2.3% |
| Latvian | 26 | 0.3% |
| Lithuanian | 11 | 0.1% |
| Mexican | 159 | 1.8% |
| Mexican American Indian | 26 | 0.3% |
| Northern European | 31 | 0.4% |
| Norwegian | 21 | 0.2% |
| Pakistani | 11 | 0.1% |
| Palestinian | 14 | 0.2% |
| Panamanian | 86 | 1.0% |
| Polish | 91 | 1.1% |
| Puerto Rican | 720 | 8.4% |
| Romanian | 15 | 0.2% |
| Russian | 15 | 0.2% |
| Scandinavian | 9 | 0.1% |
| Scotch-Irish | 52 | 0.6% |
| Scottish | 83 | 1.0% |
| Slovak | 7 | 0.1% |
| South American | 127 | 1.5% |
| Spaniard | 47 | 0.5% |
| Subsaharan African | 470 | 5.5% |
| Swedish | 66 | 0.8% |
| Swiss | 14 | 0.2% |
| Thai | 45 | 0.5% |
| Ukrainian | 56 | 0.6% |
| Welsh | 44 | 0.5% |
| West Indian | 29 | 0.3% | View All 55 Rows |
Immigrants in Seffner
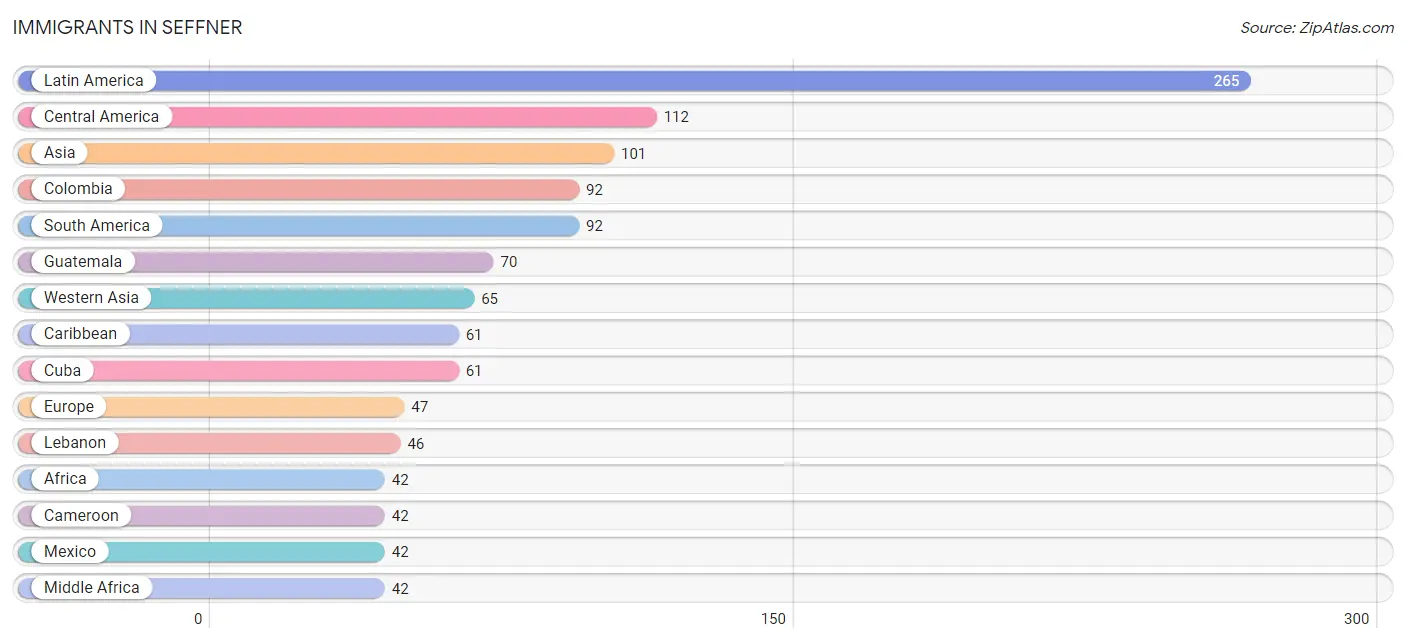
The most numerous immigrant groups reported in Seffner came from Latin America (265 | 3.1%), Central America (112 | 1.3%), Asia (101 | 1.2%), Colombia (92 | 1.1%), and South America (92 | 1.1%), together accounting for 7.7% of all Seffner residents.
| Immigration Origin | # Population | % Population |
| Africa | 42 | 0.5% |
| Asia | 101 | 1.2% |
| Cameroon | 42 | 0.5% |
| Caribbean | 61 | 0.7% |
| Central America | 112 | 1.3% |
| Colombia | 92 | 1.1% |
| Cuba | 61 | 0.7% |
| Eastern Asia | 9 | 0.1% |
| Europe | 47 | 0.5% |
| Germany | 21 | 0.2% |
| Guatemala | 70 | 0.8% |
| India | 21 | 0.2% |
| Ireland | 1 | 0.0% |
| Israel | 5 | 0.1% |
| Italy | 16 | 0.2% |
| Jordan | 14 | 0.2% |
| Korea | 9 | 0.1% |
| Latin America | 265 | 3.1% |
| Lebanon | 46 | 0.5% |
| Mexico | 42 | 0.5% |
| Middle Africa | 42 | 0.5% |
| Northern Europe | 10 | 0.1% |
| South America | 92 | 1.1% |
| South Central Asia | 21 | 0.2% |
| South Eastern Asia | 6 | 0.1% |
| Southern Europe | 16 | 0.2% |
| Thailand | 6 | 0.1% |
| Western Asia | 65 | 0.8% |
| Western Europe | 21 | 0.2% | View All 29 Rows |
Sex and Age in Seffner
Sex and Age in Seffner
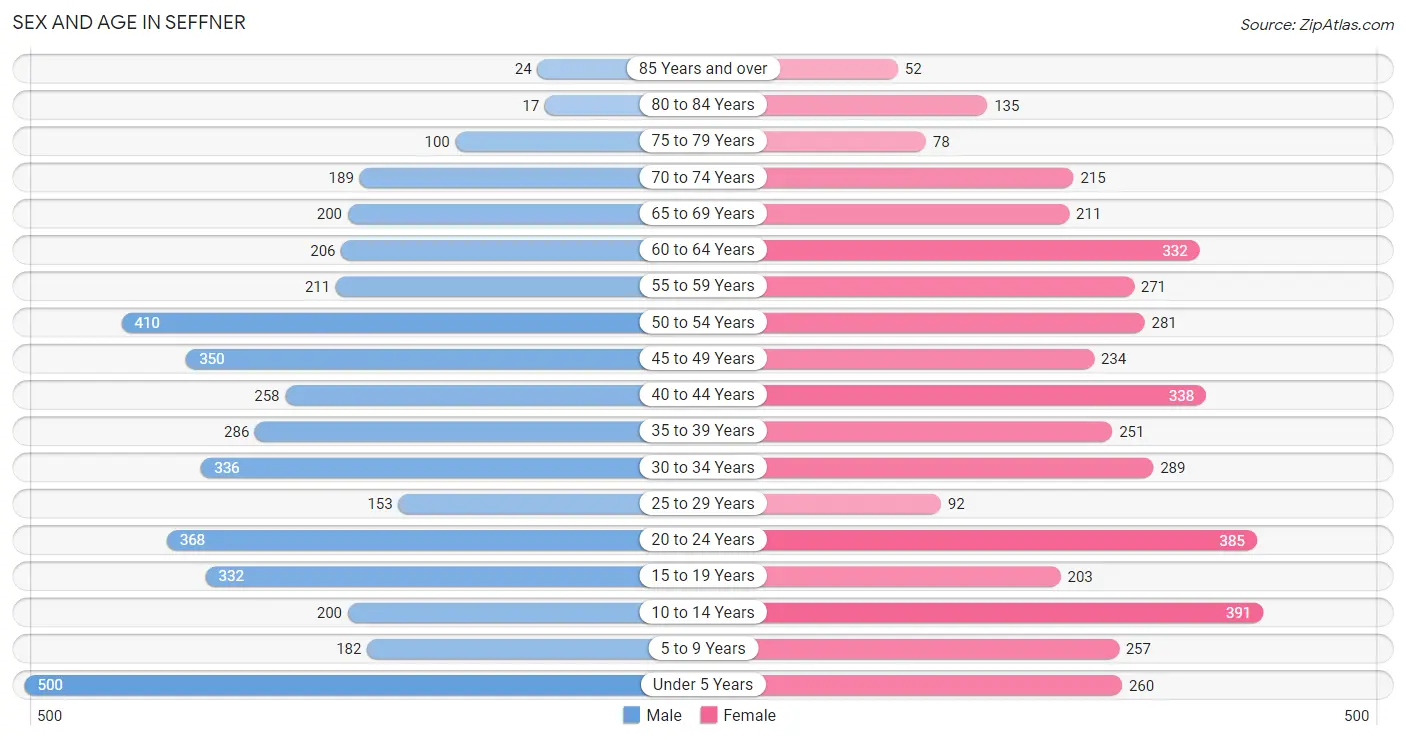
The most populous age groups in Seffner are Under 5 Years (500 | 11.6%) for men and 10 to 14 Years (391 | 9.1%) for women.
| Age Bracket | Male | Female |
| Under 5 Years | 500 (11.6%) | 260 (6.1%) |
| 5 to 9 Years | 182 (4.2%) | 257 (6.0%) |
| 10 to 14 Years | 200 (4.6%) | 391 (9.1%) |
| 15 to 19 Years | 332 (7.7%) | 203 (4.8%) |
| 20 to 24 Years | 368 (8.5%) | 385 (9.0%) |
| 25 to 29 Years | 153 (3.5%) | 92 (2.1%) |
| 30 to 34 Years | 336 (7.8%) | 289 (6.8%) |
| 35 to 39 Years | 286 (6.6%) | 251 (5.9%) |
| 40 to 44 Years | 258 (6.0%) | 338 (7.9%) |
| 45 to 49 Years | 350 (8.1%) | 234 (5.5%) |
| 50 to 54 Years | 410 (9.5%) | 281 (6.6%) |
| 55 to 59 Years | 211 (4.9%) | 271 (6.3%) |
| 60 to 64 Years | 206 (4.8%) | 332 (7.8%) |
| 65 to 69 Years | 200 (4.6%) | 211 (4.9%) |
| 70 to 74 Years | 189 (4.4%) | 215 (5.0%) |
| 75 to 79 Years | 100 (2.3%) | 78 (1.8%) |
| 80 to 84 Years | 17 (0.4%) | 135 (3.2%) |
| 85 Years and over | 24 (0.6%) | 52 (1.2%) |
| Total | 4,322 (100.0%) | 4,275 (100.0%) |
Families and Households in Seffner
Median Family Size in Seffner
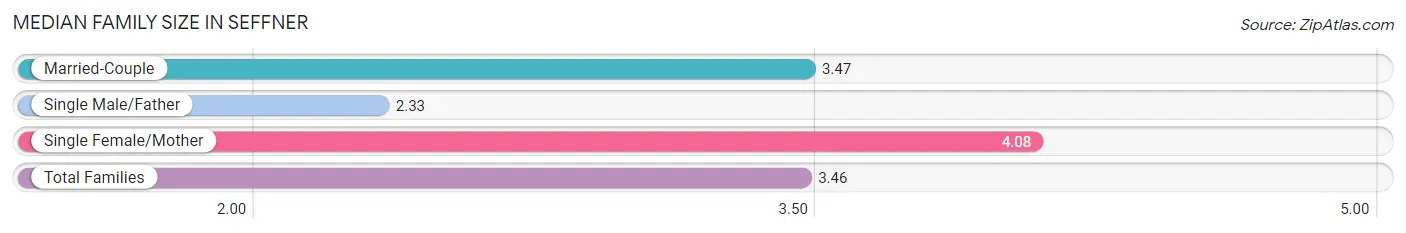
The median family size in Seffner is 3.46 persons per family, with single female/mother families (289 | 12.9%) accounting for the largest median family size of 4.08 persons per family. On the other hand, single male/father families (174 | 7.8%) represent the smallest median family size with 2.33 persons per family.
| Family Type | # Families | Family Size |
| Married-Couple | 1,778 (79.3%) | 3.47 |
| Single Male/Father | 174 (7.8%) | 2.33 |
| Single Female/Mother | 289 (12.9%) | 4.08 |
| Total Families | 2,241 (100.0%) | 3.46 |
Median Household Size in Seffner
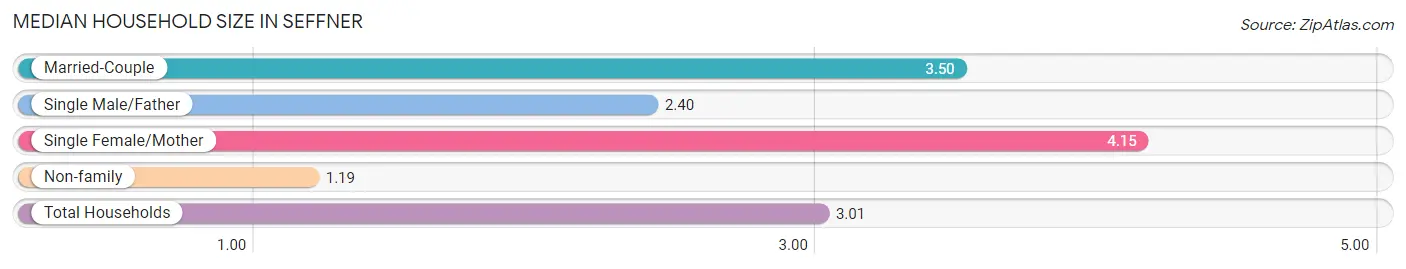
The median household size in Seffner is 3.01 persons per household, with single female/mother households (289 | 10.2%) accounting for the largest median household size of 4.15 persons per household. non-family households (598 | 21.1%) represent the smallest median household size with 1.19 persons per household.
| Household Type | # Households | Household Size |
| Married-Couple | 1,778 (62.6%) | 3.50 |
| Single Male/Father | 174 (6.1%) | 2.40 |
| Single Female/Mother | 289 (10.2%) | 4.15 |
| Non-family | 598 (21.1%) | 1.19 |
| Total Households | 2,839 (100.0%) | 3.01 |
Household Size by Marriage Status in Seffner
Out of a total of 2,839 households in Seffner, 2,241 (78.9%) are family households, while 598 (21.1%) are nonfamily households. The most numerous type of family households are 2-person households, comprising 906, and the most common type of nonfamily households are 1-person households, comprising 507.
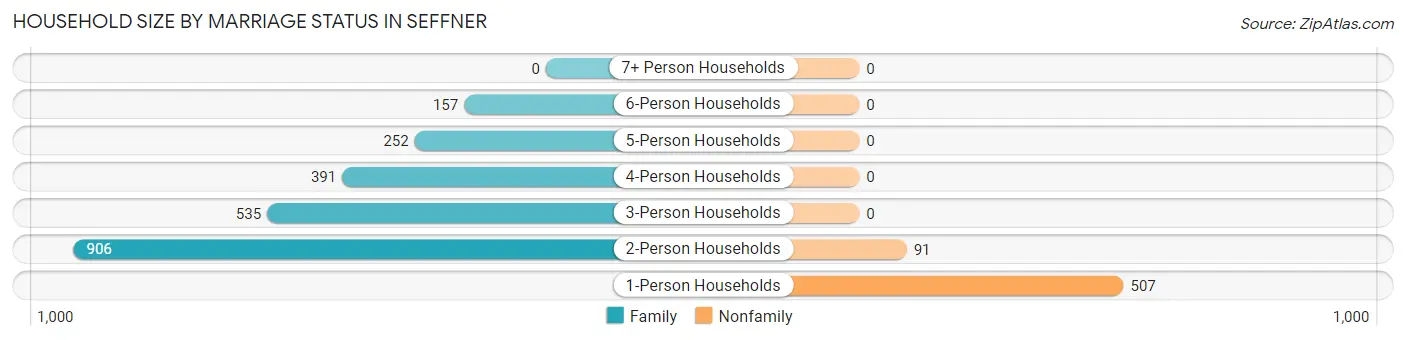
| Household Size | Family Households | Nonfamily Households |
| 1-Person Households | - | 507 (17.9%) |
| 2-Person Households | 906 (31.9%) | 91 (3.2%) |
| 3-Person Households | 535 (18.8%) | 0 (0.0%) |
| 4-Person Households | 391 (13.8%) | 0 (0.0%) |
| 5-Person Households | 252 (8.9%) | 0 (0.0%) |
| 6-Person Households | 157 (5.5%) | 0 (0.0%) |
| 7+ Person Households | 0 (0.0%) | 0 (0.0%) |
| Total | 2,241 (78.9%) | 598 (21.1%) |
Female Fertility in Seffner
Fertility by Age in Seffner
Average fertility rate in Seffner is 116.0 births per 1,000 women. Women in the age bracket of 20 to 34 years have the highest fertility rate with 256.0 births per 1,000 women. Women in the age bracket of 20 to 34 years acount for 93.3% of all women with births.
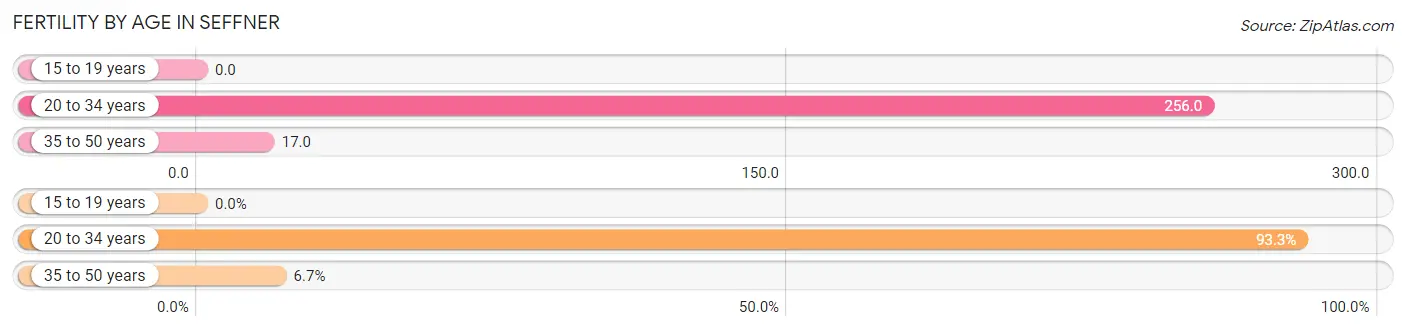
| Age Bracket | Women with Births | Births / 1,000 Women |
| 15 to 19 years | 0 (0.0%) | 0.0 |
| 20 to 34 years | 196 (93.3%) | 256.0 |
| 35 to 50 years | 14 (6.7%) | 17.0 |
| Total | 210 (100.0%) | 116.0 |
Fertility by Age by Marriage Status in Seffner
52.9% of women with births (210) in Seffner are married. The highest percentage of unmarried women with births falls into 20 to 34 years age bracket with 50.5% of them unmarried at the time of birth, while the lowest percentage of unmarried women with births belong to 35 to 50 years age bracket with 0.0% of them unmarried.
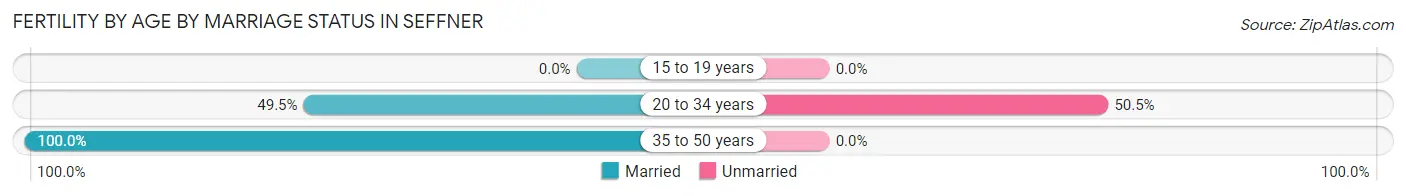
| Age Bracket | Married | Unmarried |
| 15 to 19 years | 0 (0.0%) | 0 (0.0%) |
| 20 to 34 years | 97 (49.5%) | 99 (50.5%) |
| 35 to 50 years | 14 (100.0%) | 0 (0.0%) |
| Total | 111 (52.9%) | 99 (47.1%) |
Fertility by Education in Seffner
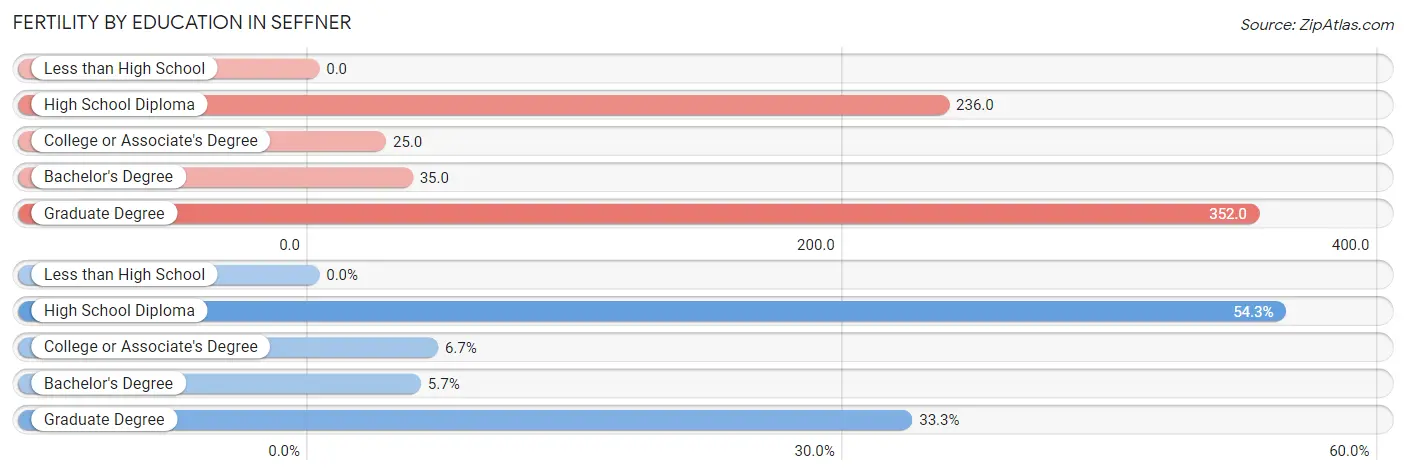
| Educational Attainment | Women with Births | Births / 1,000 Women |
| Less than High School | 0 (0.0%) | 0.0 |
| High School Diploma | 114 (54.3%) | 236.0 |
| College or Associate's Degree | 14 (6.7%) | 25.0 |
| Bachelor's Degree | 12 (5.7%) | 35.0 |
| Graduate Degree | 70 (33.3%) | 352.0 |
| Total | 210 (100.0%) | 116.0 |
Fertility by Education by Marriage Status in Seffner
47.1% of women with births in Seffner are unmarried. Women with the educational attainment of college or associate's degree are most likely to be married with 100.0% of them married at childbirth, while women with the educational attainment of high school diploma are least likely to be married with 86.8% of them unmarried at childbirth.
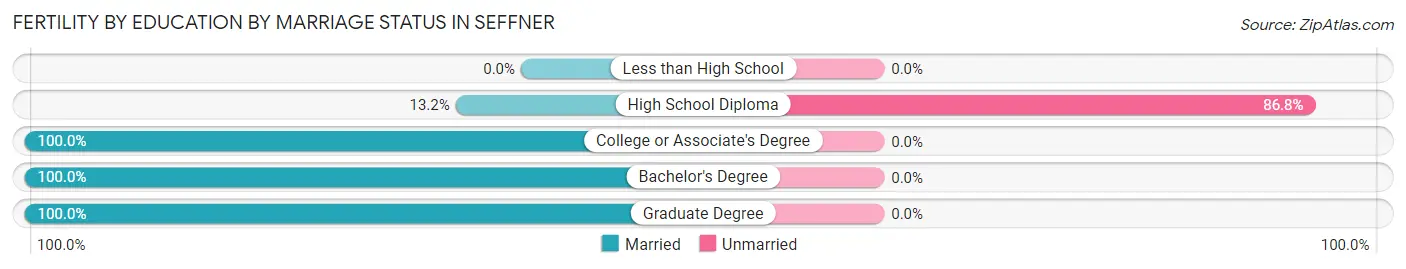
| Educational Attainment | Married | Unmarried |
| Less than High School | 0 (0.0%) | 0 (0.0%) |
| High School Diploma | 15 (13.2%) | 99 (86.8%) |
| College or Associate's Degree | 14 (100.0%) | 0 (0.0%) |
| Bachelor's Degree | 12 (100.0%) | 0 (0.0%) |
| Graduate Degree | 70 (100.0%) | 0 (0.0%) |
| Total | 111 (52.9%) | 99 (47.1%) |
Employment Characteristics in Seffner
Employment by Class of Employer in Seffner
Among the 4,284 employed individuals in Seffner, private company employees (2,972 | 69.4%), local government employees (302 | 7.0%), and self-employed (not incorporated) (270 | 6.3%) make up the most common classes of employment.
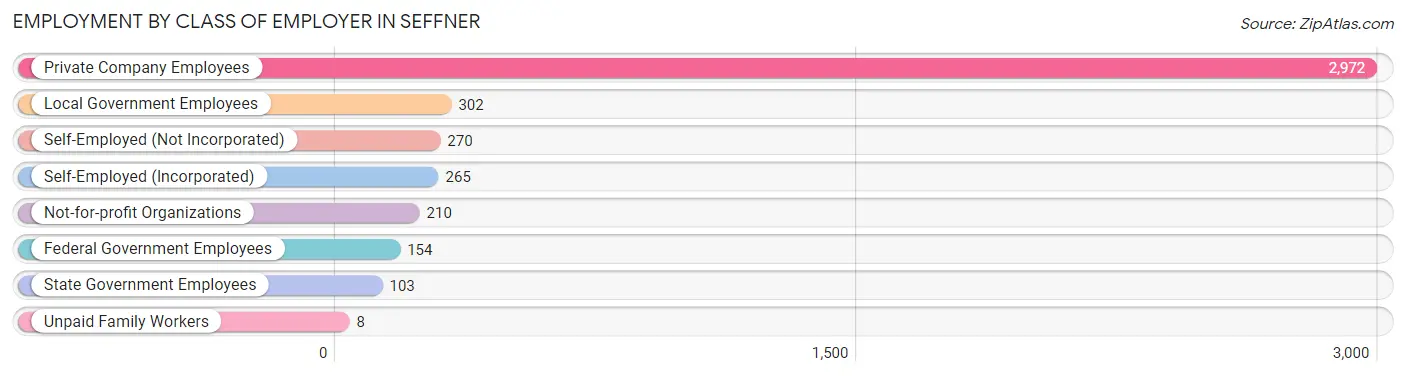
| Employer Class | # Employees | % Employees |
| Private Company Employees | 2,972 | 69.4% |
| Self-Employed (Incorporated) | 265 | 6.2% |
| Self-Employed (Not Incorporated) | 270 | 6.3% |
| Not-for-profit Organizations | 210 | 4.9% |
| Local Government Employees | 302 | 7.0% |
| State Government Employees | 103 | 2.4% |
| Federal Government Employees | 154 | 3.6% |
| Unpaid Family Workers | 8 | 0.2% |
| Total | 4,284 | 100.0% |
Employment Status by Age in Seffner
According to the labor force statistics for Seffner, out of the total population over 16 years of age (6,692), 66.1% or 4,423 individuals are in the labor force, with 1.9% or 84 of them unemployed. The age group with the highest labor force participation rate is 25 to 29 years, with 91.0% or 223 individuals in the labor force. Within the labor force, the 25 to 29 years age range has the highest percentage of unemployed individuals, with 10.3% or 23 of them being unemployed.
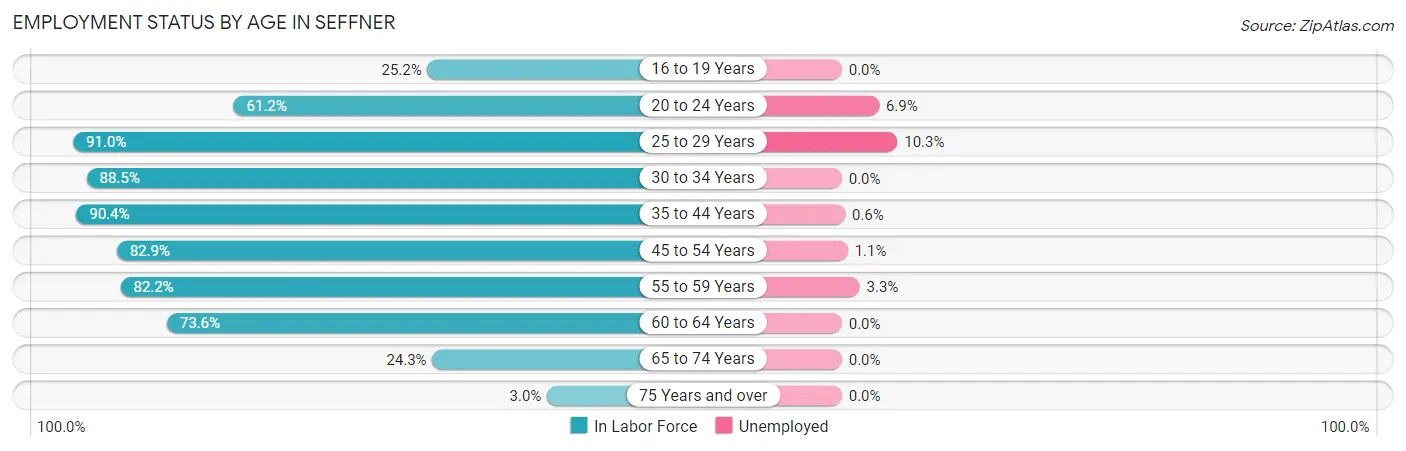
| Age Bracket | In Labor Force | Unemployed |
| 16 to 19 Years | 106 (25.2%) | 0 (0.0%) |
| 20 to 24 Years | 461 (61.2%) | 32 (6.9%) |
| 25 to 29 Years | 223 (91.0%) | 23 (10.3%) |
| 30 to 34 Years | 553 (88.5%) | 0 (0.0%) |
| 35 to 44 Years | 1,024 (90.4%) | 6 (0.6%) |
| 45 to 54 Years | 1,057 (82.9%) | 12 (1.1%) |
| 55 to 59 Years | 396 (82.2%) | 13 (3.3%) |
| 60 to 64 Years | 396 (73.6%) | 0 (0.0%) |
| 65 to 74 Years | 198 (24.3%) | 0 (0.0%) |
| 75 Years and over | 12 (3.0%) | 0 (0.0%) |
| Total | 4,423 (66.1%) | 84 (1.9%) |
Employment Status by Educational Attainment in Seffner
According to labor force statistics for Seffner, 84.9% of individuals (3,649) out of the total population between 25 and 64 years of age (4,298) are in the labor force, with 1.5% or 55 of them being unemployed. The group with the highest labor force participation rate are those with the educational attainment of college / associate degree, with 92.0% or 1,171 individuals in the labor force. Within the labor force, individuals with high school diploma education have the highest percentage of unemployment, with 3.1% or 33 of them being unemployed.
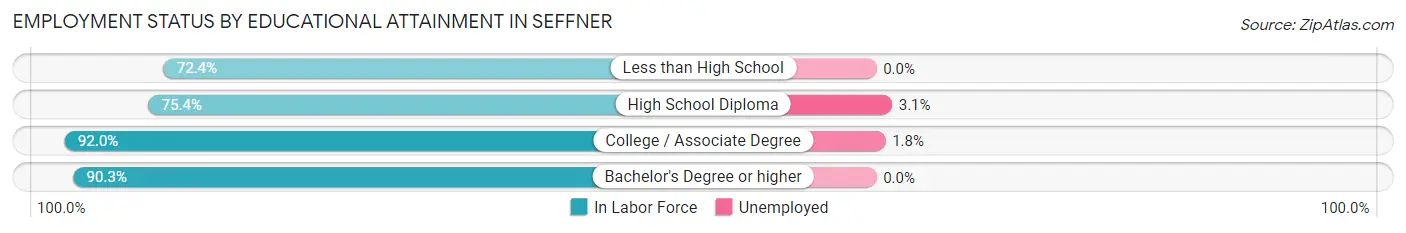
| Educational Attainment | In Labor Force | Unemployed |
| Less than High School | 160 (72.4%) | 0 (0.0%) |
| High School Diploma | 1,077 (75.4%) | 44 (3.1%) |
| College / Associate Degree | 1,171 (92.0%) | 23 (1.8%) |
| Bachelor's Degree or higher | 1,243 (90.3%) | 0 (0.0%) |
| Total | 3,649 (84.9%) | 64 (1.5%) |
Employment Occupations by Sex in Seffner
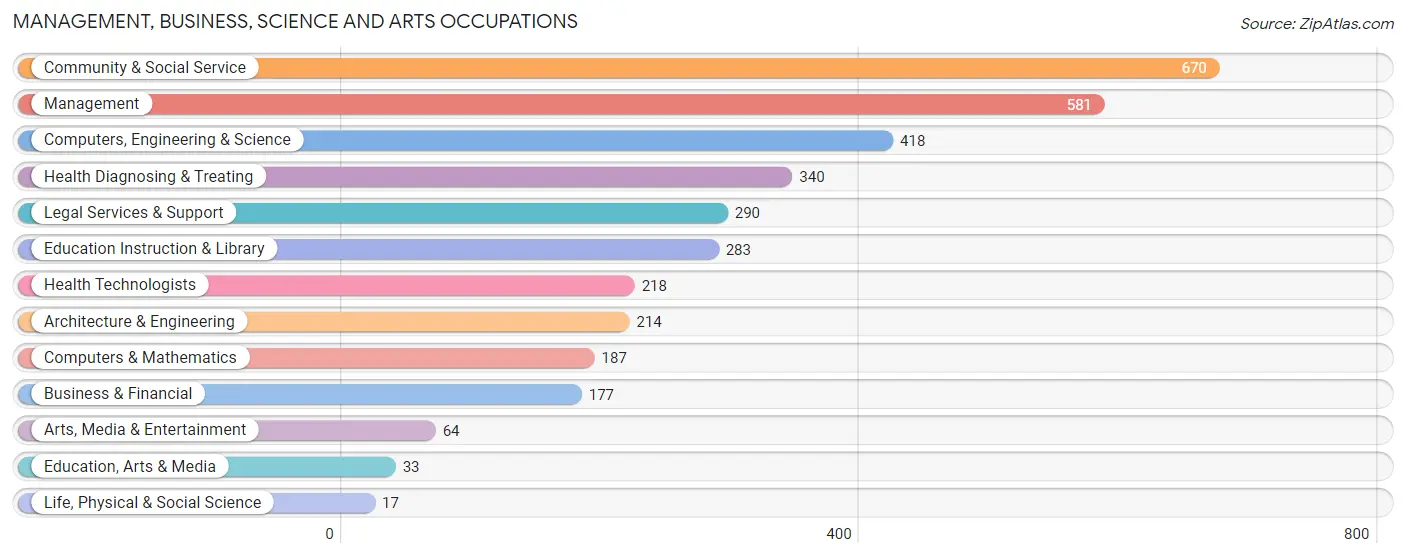
Management, Business, Science and Arts Occupations
The most common Management, Business, Science and Arts occupations in Seffner are Community & Social Service (670 | 15.4%), Management (581 | 13.4%), Computers, Engineering & Science (418 | 9.6%), Health Diagnosing & Treating (340 | 7.8%), and Legal Services & Support (290 | 6.7%).
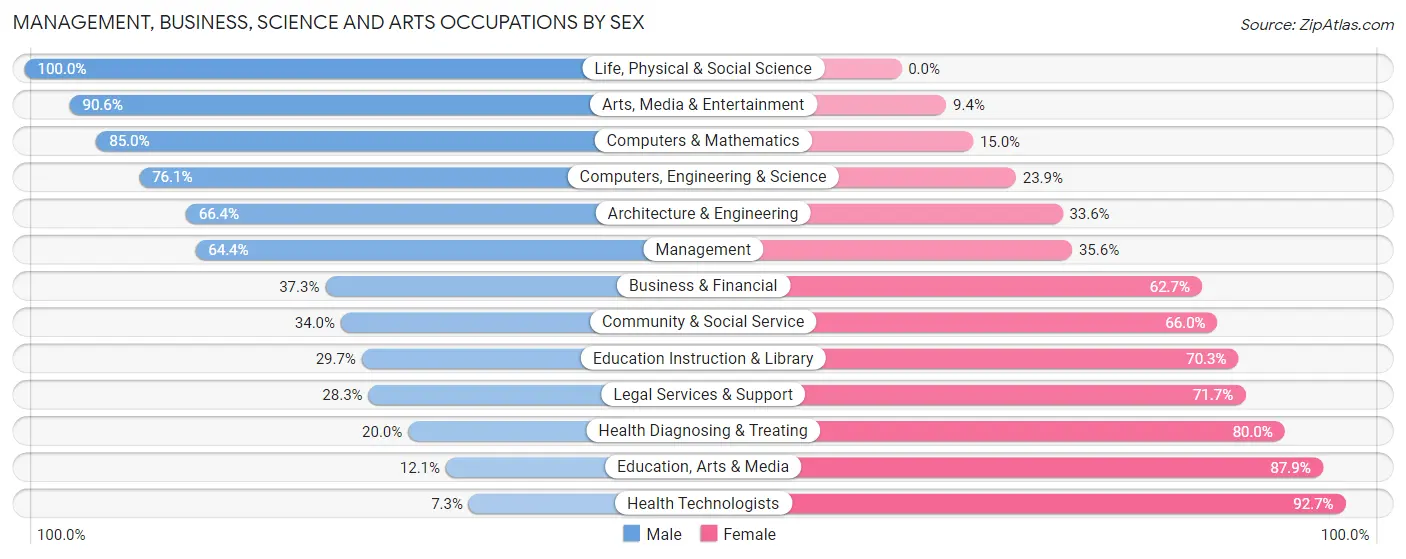
Management, Business, Science and Arts Occupations by Sex
Within the Management, Business, Science and Arts occupations in Seffner, the most male-oriented occupations are Life, Physical & Social Science (100.0%), Arts, Media & Entertainment (90.6%), and Computers & Mathematics (85.0%), while the most female-oriented occupations are Health Technologists (92.7%), Education, Arts & Media (87.9%), and Health Diagnosing & Treating (80.0%).
| Occupation | Male | Female |
| Management | 374 (64.4%) | 207 (35.6%) |
| Business & Financial | 66 (37.3%) | 111 (62.7%) |
| Computers, Engineering & Science | 318 (76.1%) | 100 (23.9%) |
| Computers & Mathematics | 159 (85.0%) | 28 (15.0%) |
| Architecture & Engineering | 142 (66.4%) | 72 (33.6%) |
| Life, Physical & Social Science | 17 (100.0%) | 0 (0.0%) |
| Community & Social Service | 228 (34.0%) | 442 (66.0%) |
| Education, Arts & Media | 4 (12.1%) | 29 (87.9%) |
| Legal Services & Support | 82 (28.3%) | 208 (71.7%) |
| Education Instruction & Library | 84 (29.7%) | 199 (70.3%) |
| Arts, Media & Entertainment | 58 (90.6%) | 6 (9.4%) |
| Health Diagnosing & Treating | 68 (20.0%) | 272 (80.0%) |
| Health Technologists | 16 (7.3%) | 202 (92.7%) |
| Total (Category) | 1,054 (48.2%) | 1,132 (51.8%) |
| Total (Overall) | 2,306 (53.1%) | 2,034 (46.9%) |
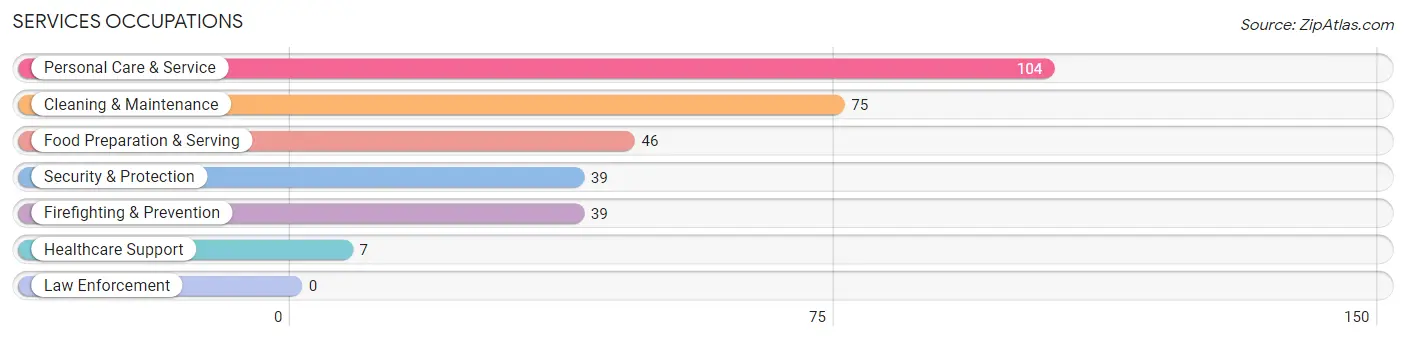
Services Occupations
The most common Services occupations in Seffner are Personal Care & Service (104 | 2.4%), Cleaning & Maintenance (75 | 1.7%), Food Preparation & Serving (46 | 1.1%), Security & Protection (39 | 0.9%), and Firefighting & Prevention (39 | 0.9%).
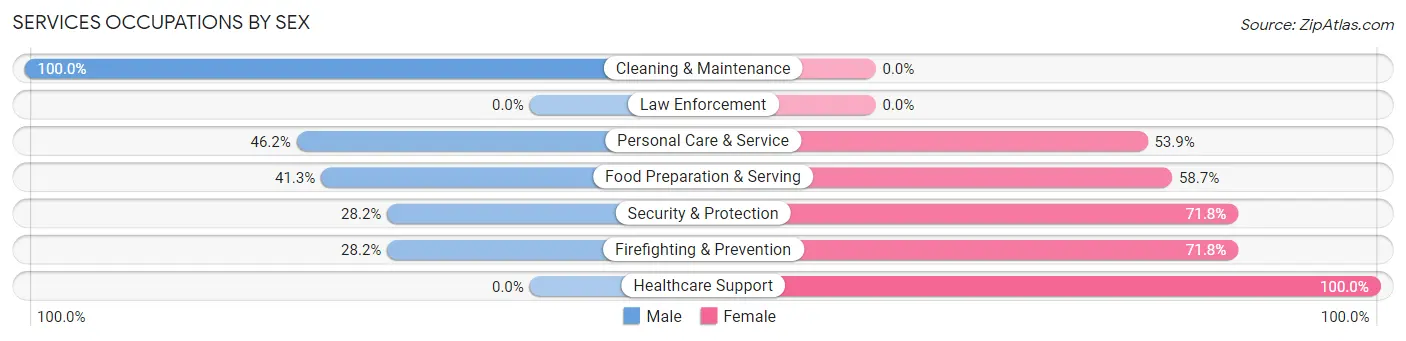
Services Occupations by Sex
Within the Services occupations in Seffner, the most male-oriented occupations are Cleaning & Maintenance (100.0%), Personal Care & Service (46.2%), and Food Preparation & Serving (41.3%), while the most female-oriented occupations are Healthcare Support (100.0%), Security & Protection (71.8%), and Firefighting & Prevention (71.8%).
| Occupation | Male | Female |
| Healthcare Support | 0 (0.0%) | 7 (100.0%) |
| Security & Protection | 11 (28.2%) | 28 (71.8%) |
| Firefighting & Prevention | 11 (28.2%) | 28 (71.8%) |
| Law Enforcement | 0 (0.0%) | 0 (0.0%) |
| Food Preparation & Serving | 19 (41.3%) | 27 (58.7%) |
| Cleaning & Maintenance | 75 (100.0%) | 0 (0.0%) |
| Personal Care & Service | 48 (46.2%) | 56 (53.8%) |
| Total (Category) | 153 (56.5%) | 118 (43.5%) |
| Total (Overall) | 2,306 (53.1%) | 2,034 (46.9%) |
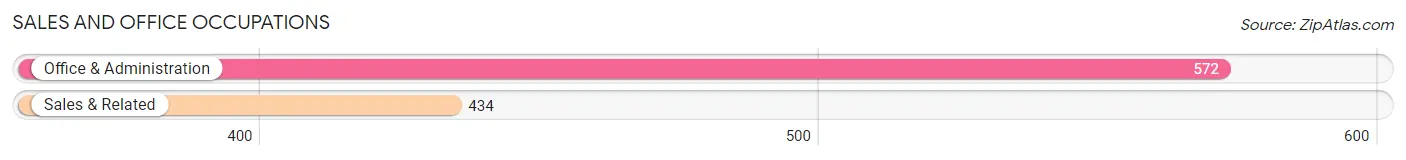
Sales and Office Occupations
The most common Sales and Office occupations in Seffner are Office & Administration (572 | 13.2%), and Sales & Related (434 | 10.0%).
Sales and Office Occupations by Sex
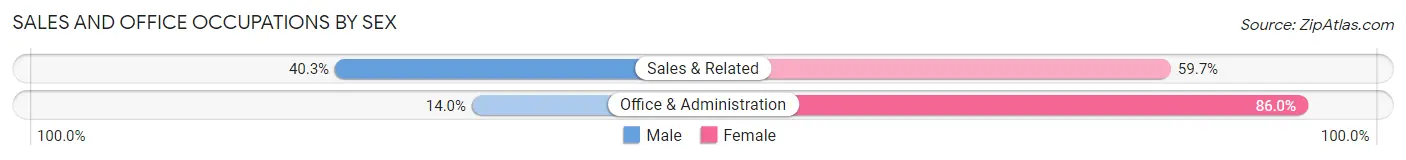
| Occupation | Male | Female |
| Sales & Related | 175 (40.3%) | 259 (59.7%) |
| Office & Administration | 80 (14.0%) | 492 (86.0%) |
| Total (Category) | 255 (25.4%) | 751 (74.7%) |
| Total (Overall) | 2,306 (53.1%) | 2,034 (46.9%) |
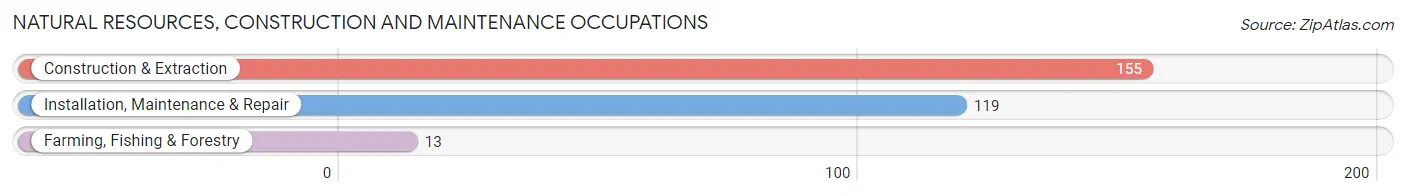
Natural Resources, Construction and Maintenance Occupations
The most common Natural Resources, Construction and Maintenance occupations in Seffner are Construction & Extraction (155 | 3.6%), Installation, Maintenance & Repair (119 | 2.7%), and Farming, Fishing & Forestry (13 | 0.3%).
Natural Resources, Construction and Maintenance Occupations by Sex
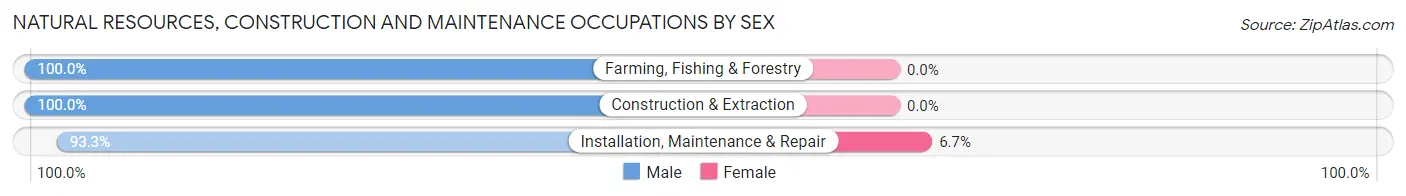
| Occupation | Male | Female |
| Farming, Fishing & Forestry | 13 (100.0%) | 0 (0.0%) |
| Construction & Extraction | 155 (100.0%) | 0 (0.0%) |
| Installation, Maintenance & Repair | 111 (93.3%) | 8 (6.7%) |
| Total (Category) | 279 (97.2%) | 8 (2.8%) |
| Total (Overall) | 2,306 (53.1%) | 2,034 (46.9%) |
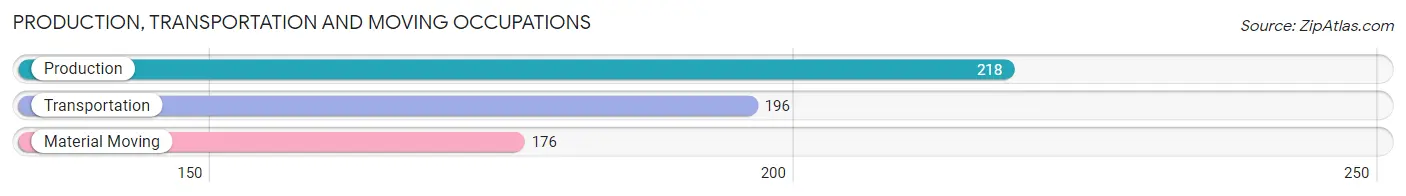
Production, Transportation and Moving Occupations
The most common Production, Transportation and Moving occupations in Seffner are Production (218 | 5.0%), Transportation (196 | 4.5%), and Material Moving (176 | 4.1%).
Production, Transportation and Moving Occupations by Sex
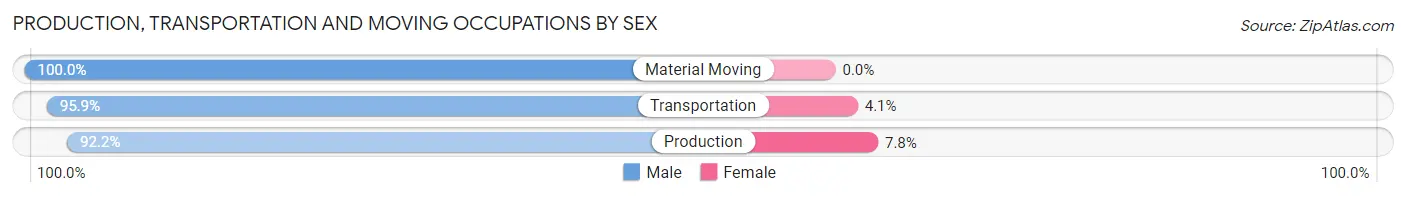
| Occupation | Male | Female |
| Production | 201 (92.2%) | 17 (7.8%) |
| Transportation | 188 (95.9%) | 8 (4.1%) |
| Material Moving | 176 (100.0%) | 0 (0.0%) |
| Total (Category) | 565 (95.8%) | 25 (4.2%) |
| Total (Overall) | 2,306 (53.1%) | 2,034 (46.9%) |
Employment Industries by Sex in Seffner
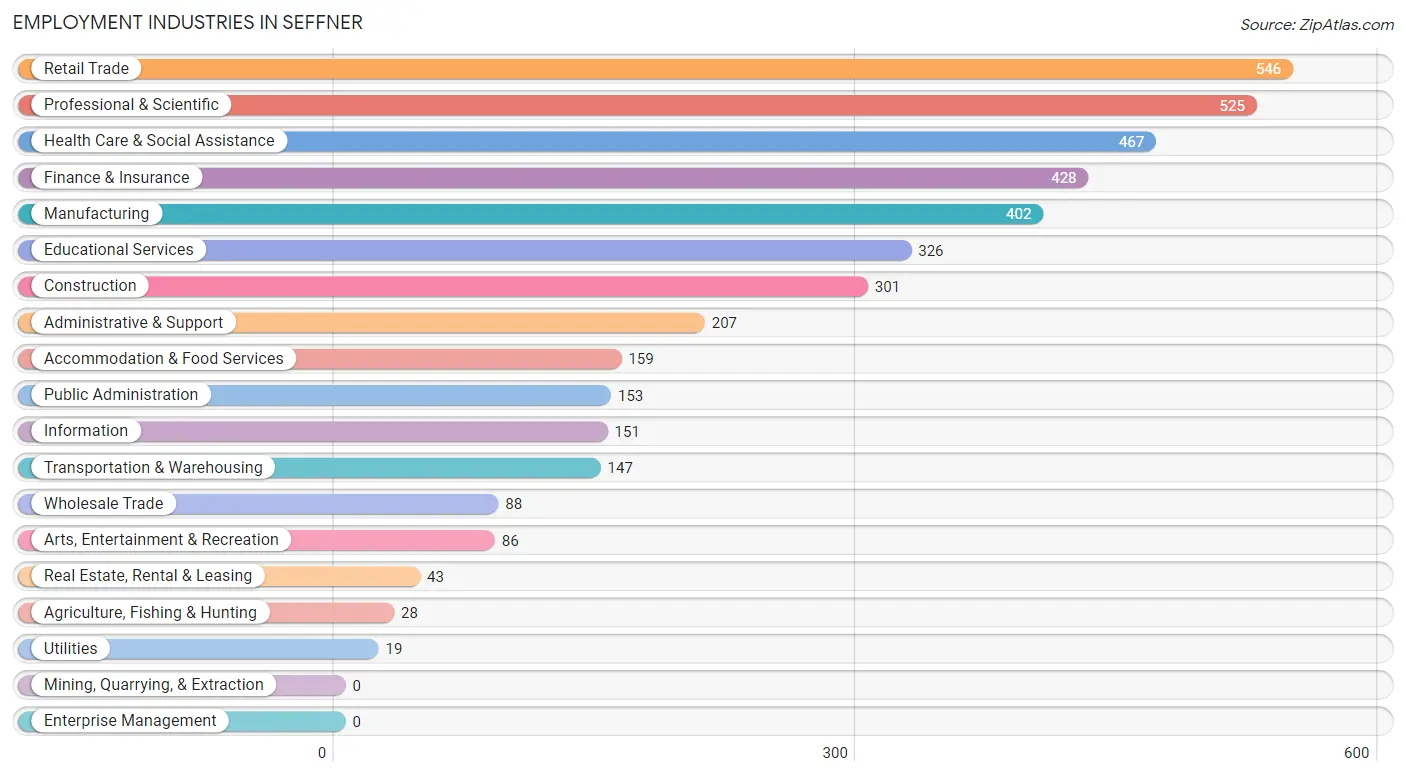
Employment Industries in Seffner
The major employment industries in Seffner include Retail Trade (546 | 12.6%), Professional & Scientific (525 | 12.1%), Health Care & Social Assistance (467 | 10.8%), Finance & Insurance (428 | 9.9%), and Manufacturing (402 | 9.3%).
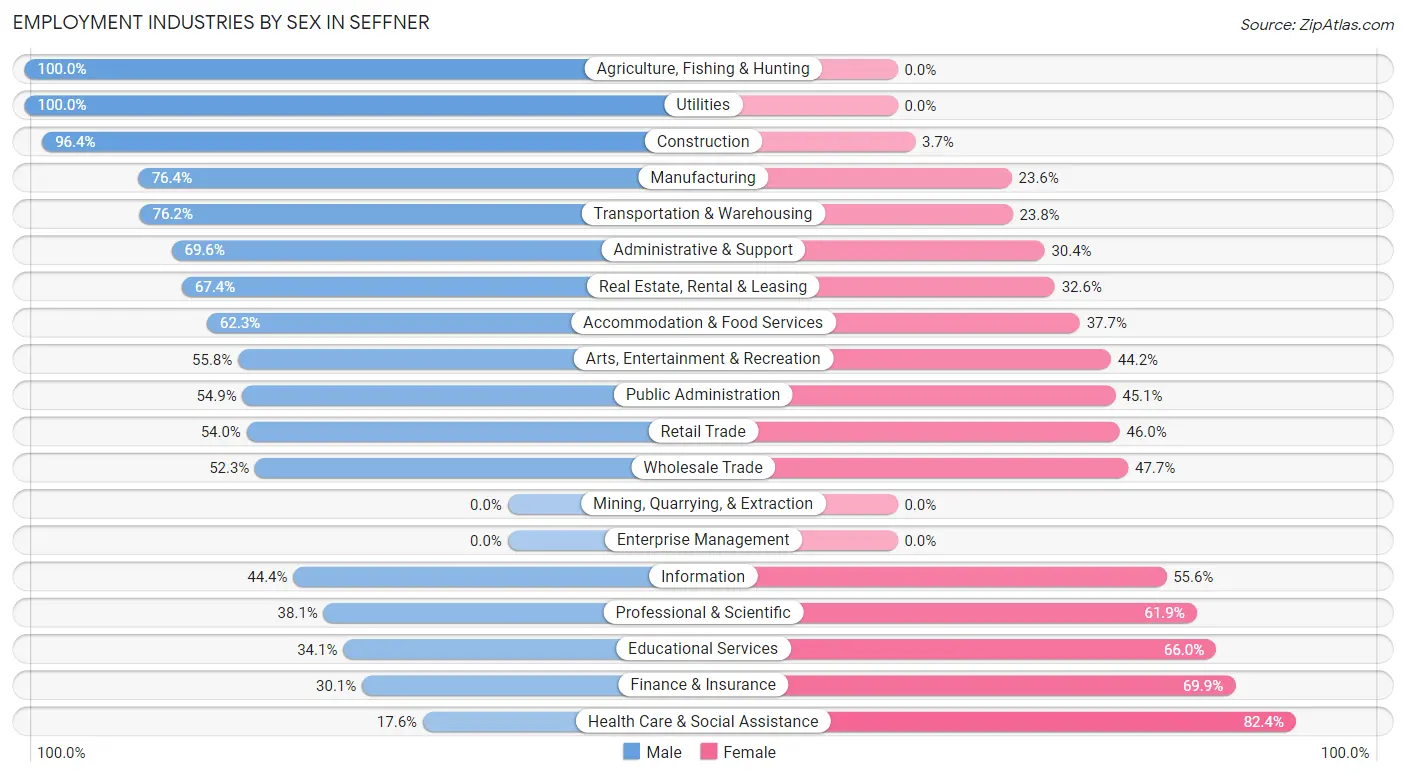
Employment Industries by Sex in Seffner
The Seffner industries that see more men than women are Agriculture, Fishing & Hunting (100.0%), Utilities (100.0%), and Construction (96.4%), whereas the industries that tend to have a higher number of women are Health Care & Social Assistance (82.4%), Finance & Insurance (69.9%), and Educational Services (65.9%).
| Industry | Male | Female |
| Agriculture, Fishing & Hunting | 28 (100.0%) | 0 (0.0%) |
| Mining, Quarrying, & Extraction | 0 (0.0%) | 0 (0.0%) |
| Construction | 290 (96.4%) | 11 (3.6%) |
| Manufacturing | 307 (76.4%) | 95 (23.6%) |
| Wholesale Trade | 46 (52.3%) | 42 (47.7%) |
| Retail Trade | 295 (54.0%) | 251 (46.0%) |
| Transportation & Warehousing | 112 (76.2%) | 35 (23.8%) |
| Utilities | 19 (100.0%) | 0 (0.0%) |
| Information | 67 (44.4%) | 84 (55.6%) |
| Finance & Insurance | 129 (30.1%) | 299 (69.9%) |
| Real Estate, Rental & Leasing | 29 (67.4%) | 14 (32.6%) |
| Professional & Scientific | 200 (38.1%) | 325 (61.9%) |
| Enterprise Management | 0 (0.0%) | 0 (0.0%) |
| Administrative & Support | 144 (69.6%) | 63 (30.4%) |
| Educational Services | 111 (34.1%) | 215 (65.9%) |
| Health Care & Social Assistance | 82 (17.6%) | 385 (82.4%) |
| Arts, Entertainment & Recreation | 48 (55.8%) | 38 (44.2%) |
| Accommodation & Food Services | 99 (62.3%) | 60 (37.7%) |
| Public Administration | 84 (54.9%) | 69 (45.1%) |
| Total | 2,306 (53.1%) | 2,034 (46.9%) |
Education in Seffner
School Enrollment in Seffner
The most common levels of schooling among the 1,888 students in Seffner are middle school (480 | 25.4%), high school (421 | 22.3%), and college / undergraduate (367 | 19.4%).
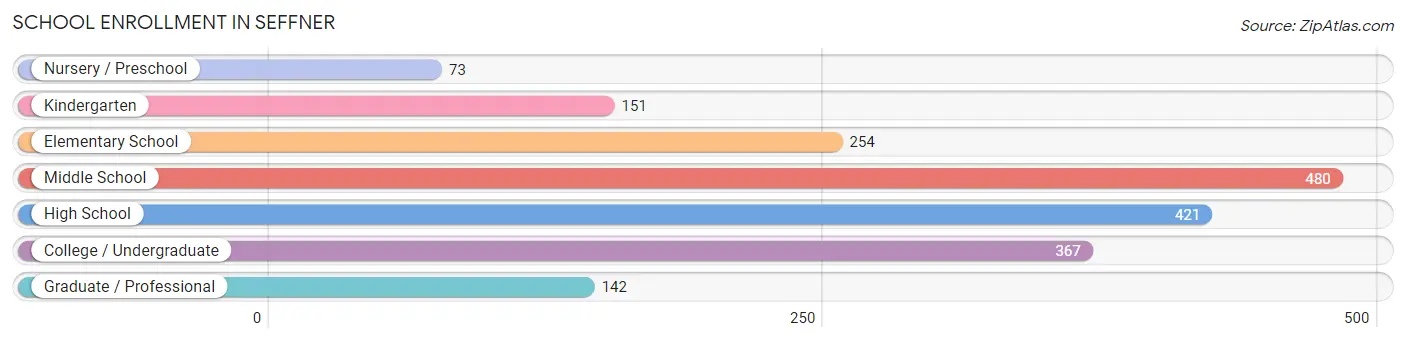
| School Level | # Students | % Students |
| Nursery / Preschool | 73 | 3.9% |
| Kindergarten | 151 | 8.0% |
| Elementary School | 254 | 13.5% |
| Middle School | 480 | 25.4% |
| High School | 421 | 22.3% |
| College / Undergraduate | 367 | 19.4% |
| Graduate / Professional | 142 | 7.5% |
| Total | 1,888 | 100.0% |
School Enrollment by Age by Funding Source in Seffner
Out of a total of 1,888 students who are enrolled in schools in Seffner, 385 (20.4%) attend a private institution, while the remaining 1,503 (79.6%) are enrolled in public schools. The age group of 35 years and over has the highest likelihood of being enrolled in private schools, with 28 (75.7% in the age bracket) enrolled. Conversely, the age group of 18 to 19 year olds has the lowest likelihood of being enrolled in a private school, with 13 (100.0% in the age bracket) attending a public institution.
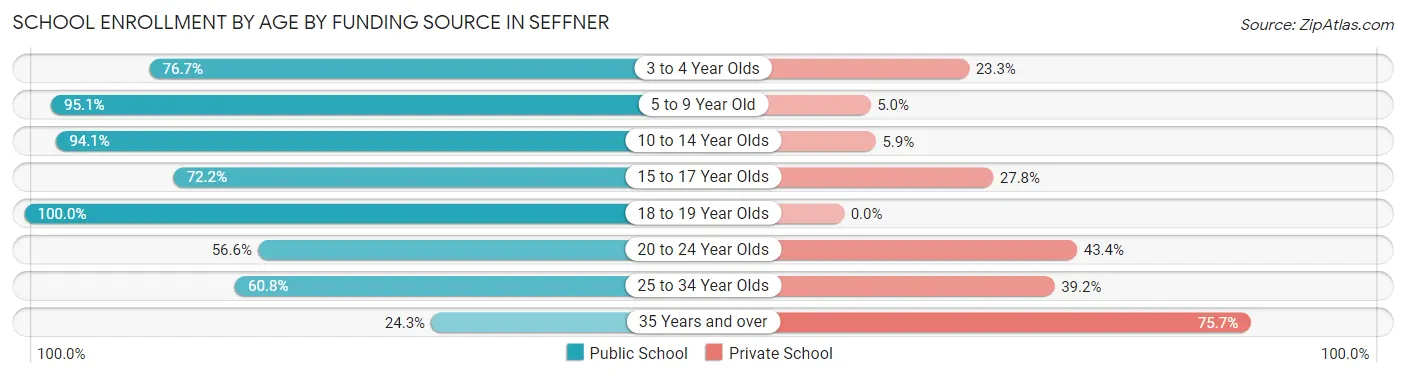
| Age Bracket | Public School | Private School |
| 3 to 4 Year Olds | 56 (76.7%) | 17 (23.3%) |
| 5 to 9 Year Old | 365 (95.1%) | 19 (5.0%) |
| 10 to 14 Year Olds | 556 (94.1%) | 35 (5.9%) |
| 15 to 17 Year Olds | 239 (72.2%) | 92 (27.8%) |
| 18 to 19 Year Olds | 13 (100.0%) | 0 (0.0%) |
| 20 to 24 Year Olds | 202 (56.6%) | 155 (43.4%) |
| 25 to 34 Year Olds | 62 (60.8%) | 40 (39.2%) |
| 35 Years and over | 9 (24.3%) | 28 (75.7%) |
| Total | 1,503 (79.6%) | 385 (20.4%) |
Educational Attainment by Field of Study in Seffner
Business (385 | 21.5%), education (294 | 16.4%), science & technology (212 | 11.8%), computers & mathematics (140 | 7.8%), and arts & humanities (99 | 5.5%) are the most common fields of study among 1,793 individuals in Seffner who have obtained a bachelor's degree or higher.
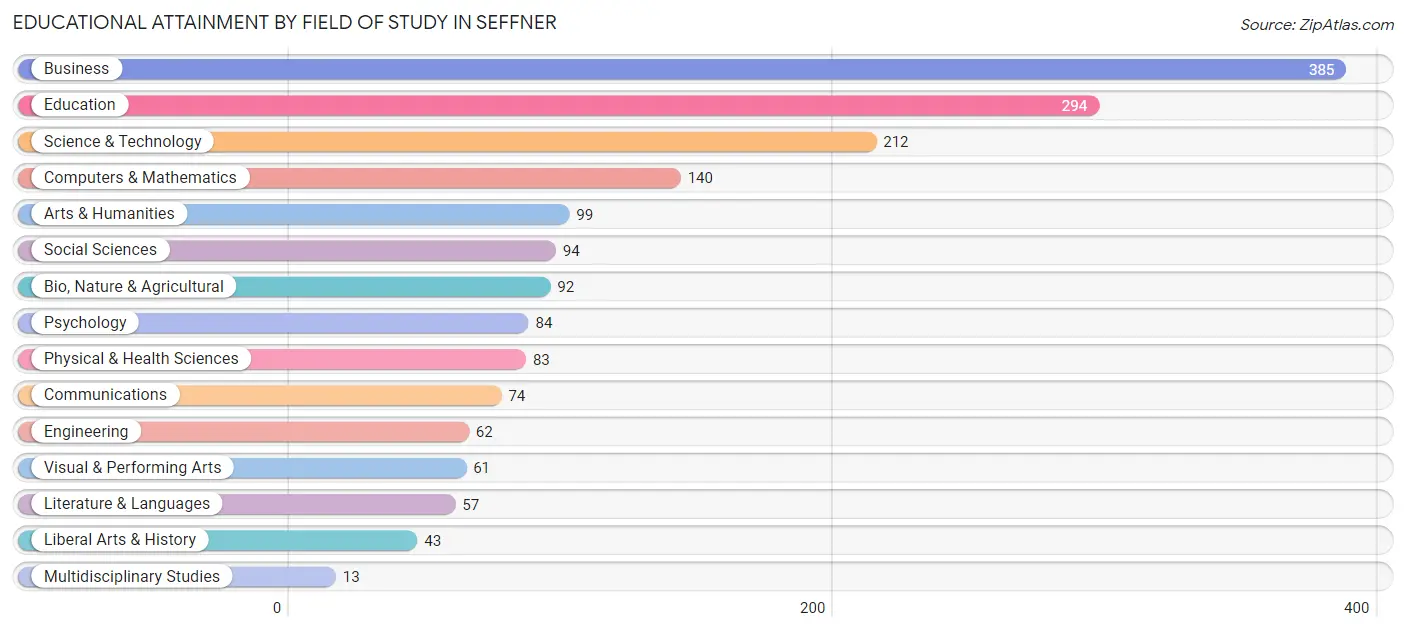
| Field of Study | # Graduates | % Graduates |
| Computers & Mathematics | 140 | 7.8% |
| Bio, Nature & Agricultural | 92 | 5.1% |
| Physical & Health Sciences | 83 | 4.6% |
| Psychology | 84 | 4.7% |
| Social Sciences | 94 | 5.2% |
| Engineering | 62 | 3.5% |
| Multidisciplinary Studies | 13 | 0.7% |
| Science & Technology | 212 | 11.8% |
| Business | 385 | 21.5% |
| Education | 294 | 16.4% |
| Literature & Languages | 57 | 3.2% |
| Liberal Arts & History | 43 | 2.4% |
| Visual & Performing Arts | 61 | 3.4% |
| Communications | 74 | 4.1% |
| Arts & Humanities | 99 | 5.5% |
| Total | 1,793 | 100.0% |
Transportation & Commute in Seffner
Vehicle Availability by Sex in Seffner
The most prevalent vehicle ownership categories in Seffner are males with 2 vehicles (1,085, accounting for 47.9%) and females with 2 vehicles (956, making up 54.2%).
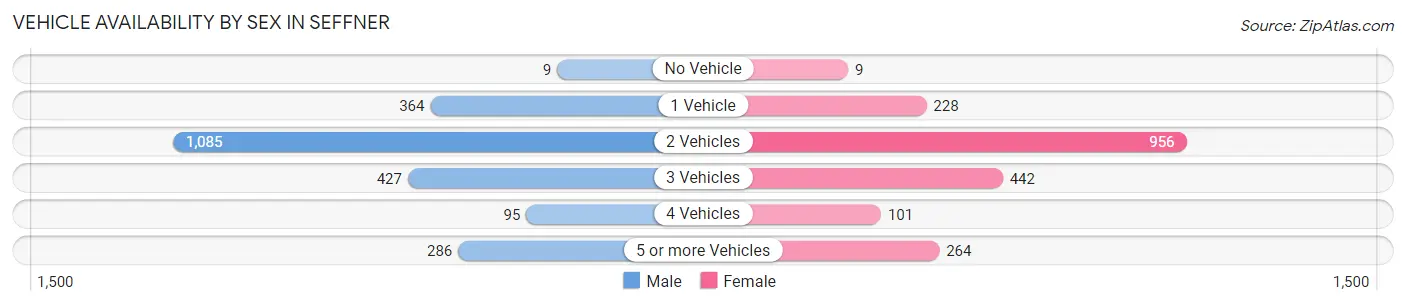
| Vehicles Available | Male | Female |
| No Vehicle | 9 (0.4%) | 9 (0.4%) |
| 1 Vehicle | 364 (16.1%) | 228 (11.4%) |
| 2 Vehicles | 1,085 (47.9%) | 956 (47.8%) |
| 3 Vehicles | 427 (18.8%) | 442 (22.1%) |
| 4 Vehicles | 95 (4.2%) | 101 (5.1%) |
| 5 or more Vehicles | 286 (12.6%) | 264 (13.2%) |
| Total | 2,266 (100.0%) | 2,000 (100.0%) |
Commute Time in Seffner
The most frequently occuring commute durations in Seffner are 15 to 19 minutes (690 commuters, 18.8%), 20 to 24 minutes (555 commuters, 15.1%), and 30 to 34 minutes (479 commuters, 13.1%).
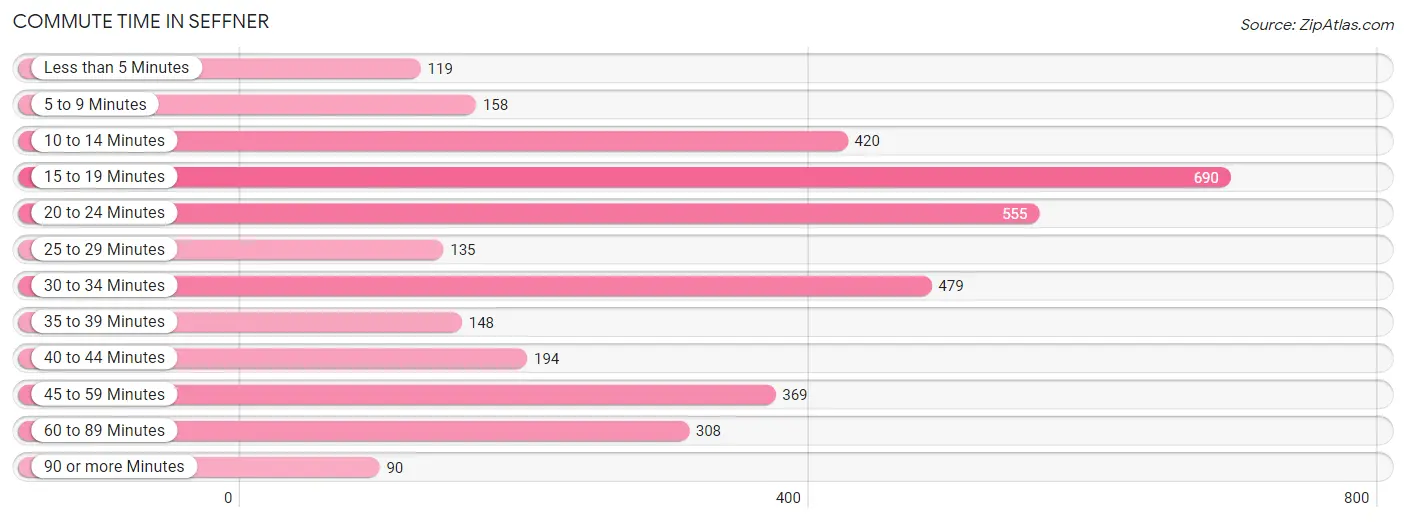
| Commute Time | # Commuters | % Commuters |
| Less than 5 Minutes | 119 | 3.3% |
| 5 to 9 Minutes | 158 | 4.3% |
| 10 to 14 Minutes | 420 | 11.5% |
| 15 to 19 Minutes | 690 | 18.8% |
| 20 to 24 Minutes | 555 | 15.1% |
| 25 to 29 Minutes | 135 | 3.7% |
| 30 to 34 Minutes | 479 | 13.1% |
| 35 to 39 Minutes | 148 | 4.0% |
| 40 to 44 Minutes | 194 | 5.3% |
| 45 to 59 Minutes | 369 | 10.1% |
| 60 to 89 Minutes | 308 | 8.4% |
| 90 or more Minutes | 90 | 2.5% |
Commute Time by Sex in Seffner
The most common commute times in Seffner are 30 to 34 minutes (327 commuters, 16.1%) for males and 15 to 19 minutes (473 commuters, 28.9%) for females.
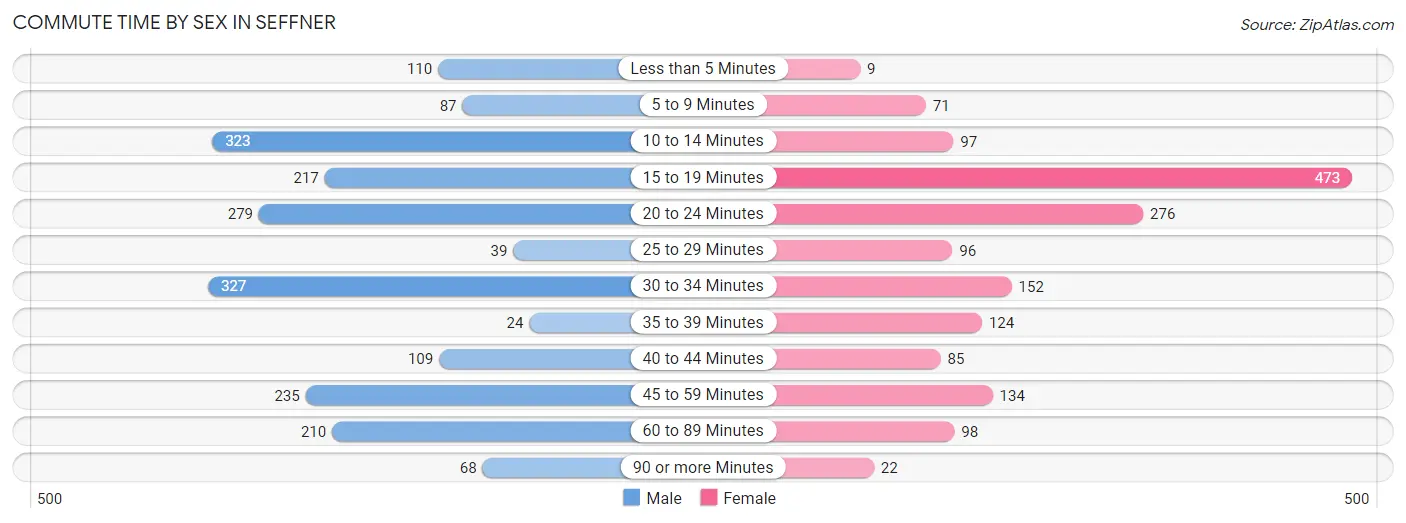
| Commute Time | Male | Female |
| Less than 5 Minutes | 110 (5.4%) | 9 (0.5%) |
| 5 to 9 Minutes | 87 (4.3%) | 71 (4.3%) |
| 10 to 14 Minutes | 323 (15.9%) | 97 (5.9%) |
| 15 to 19 Minutes | 217 (10.7%) | 473 (28.9%) |
| 20 to 24 Minutes | 279 (13.8%) | 276 (16.9%) |
| 25 to 29 Minutes | 39 (1.9%) | 96 (5.9%) |
| 30 to 34 Minutes | 327 (16.1%) | 152 (9.3%) |
| 35 to 39 Minutes | 24 (1.2%) | 124 (7.6%) |
| 40 to 44 Minutes | 109 (5.4%) | 85 (5.2%) |
| 45 to 59 Minutes | 235 (11.6%) | 134 (8.2%) |
| 60 to 89 Minutes | 210 (10.4%) | 98 (6.0%) |
| 90 or more Minutes | 68 (3.4%) | 22 (1.3%) |
Time of Departure to Work by Sex in Seffner
The most frequent times of departure to work in Seffner are 7:00 AM to 7:29 AM (348, 17.2%) for males and 7:00 AM to 7:29 AM (302, 18.4%) for females.
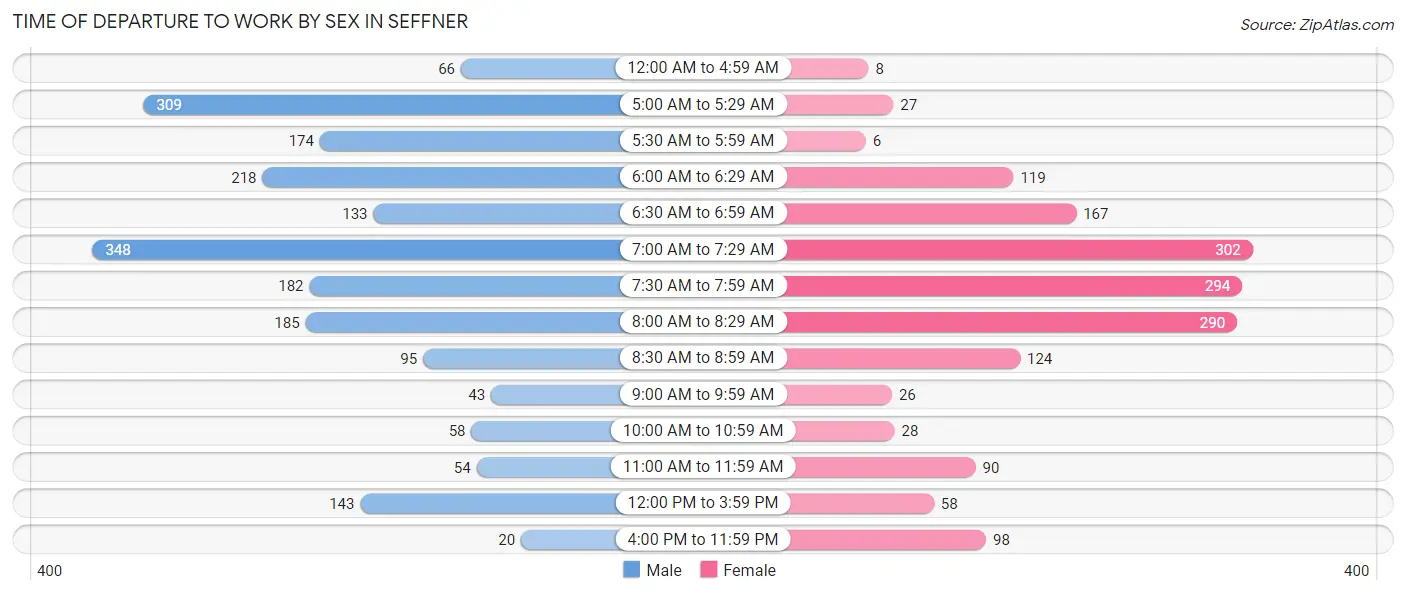
| Time of Departure | Male | Female |
| 12:00 AM to 4:59 AM | 66 (3.3%) | 8 (0.5%) |
| 5:00 AM to 5:29 AM | 309 (15.2%) | 27 (1.7%) |
| 5:30 AM to 5:59 AM | 174 (8.6%) | 6 (0.4%) |
| 6:00 AM to 6:29 AM | 218 (10.7%) | 119 (7.3%) |
| 6:30 AM to 6:59 AM | 133 (6.6%) | 167 (10.2%) |
| 7:00 AM to 7:29 AM | 348 (17.2%) | 302 (18.4%) |
| 7:30 AM to 7:59 AM | 182 (9.0%) | 294 (18.0%) |
| 8:00 AM to 8:29 AM | 185 (9.1%) | 290 (17.7%) |
| 8:30 AM to 8:59 AM | 95 (4.7%) | 124 (7.6%) |
| 9:00 AM to 9:59 AM | 43 (2.1%) | 26 (1.6%) |
| 10:00 AM to 10:59 AM | 58 (2.9%) | 28 (1.7%) |
| 11:00 AM to 11:59 AM | 54 (2.7%) | 90 (5.5%) |
| 12:00 PM to 3:59 PM | 143 (7.0%) | 58 (3.5%) |
| 4:00 PM to 11:59 PM | 20 (1.0%) | 98 (6.0%) |
| Total | 2,028 (100.0%) | 1,637 (100.0%) |
Housing Occupancy in Seffner
Occupancy by Ownership in Seffner
Of the total 2,839 dwellings in Seffner, owner-occupied units account for 2,474 (87.1%), while renter-occupied units make up 365 (12.9%).
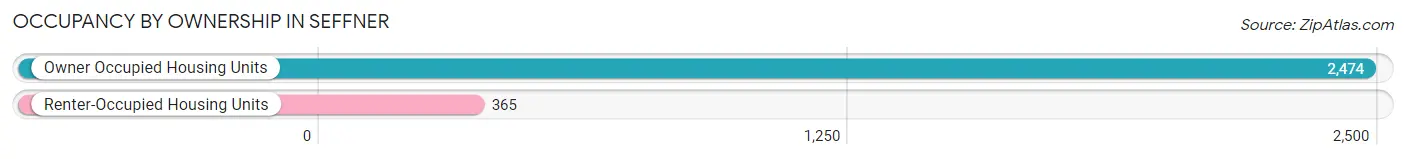
| Occupancy | # Housing Units | % Housing Units |
| Owner Occupied Housing Units | 2,474 | 87.1% |
| Renter-Occupied Housing Units | 365 | 12.9% |
| Total Occupied Housing Units | 2,839 | 100.0% |
Occupancy by Household Size in Seffner
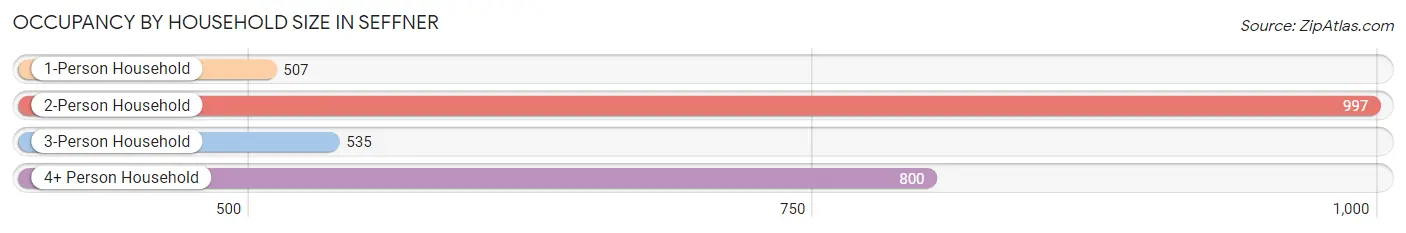
| Household Size | # Housing Units | % Housing Units |
| 1-Person Household | 507 | 17.9% |
| 2-Person Household | 997 | 35.1% |
| 3-Person Household | 535 | 18.8% |
| 4+ Person Household | 800 | 28.2% |
| Total Housing Units | 2,839 | 100.0% |
Occupancy by Ownership by Household Size in Seffner
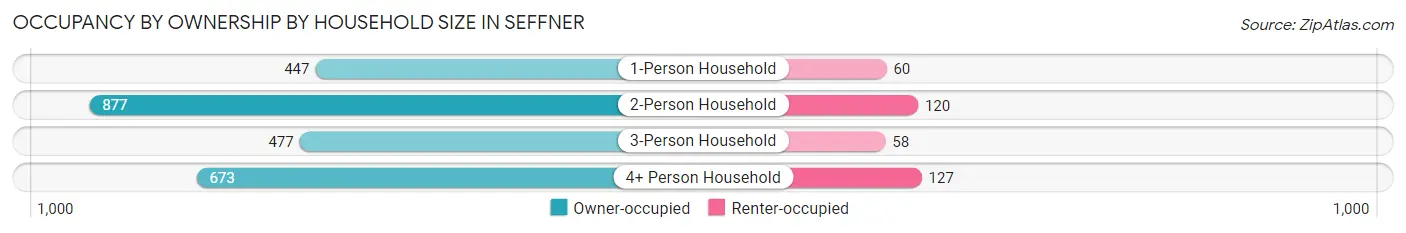
| Household Size | Owner-occupied | Renter-occupied |
| 1-Person Household | 447 (88.2%) | 60 (11.8%) |
| 2-Person Household | 877 (88.0%) | 120 (12.0%) |
| 3-Person Household | 477 (89.2%) | 58 (10.8%) |
| 4+ Person Household | 673 (84.1%) | 127 (15.9%) |
| Total Housing Units | 2,474 (87.1%) | 365 (12.9%) |
Occupancy by Educational Attainment in Seffner
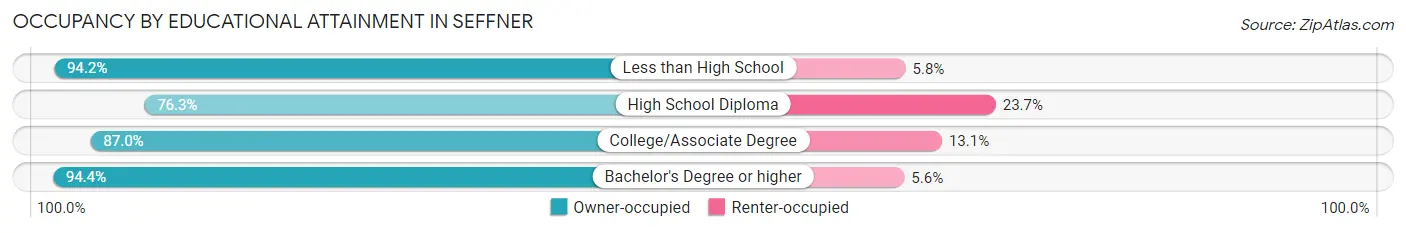
| Household Size | Owner-occupied | Renter-occupied |
| Less than High School | 97 (94.2%) | 6 (5.8%) |
| High School Diploma | 566 (76.3%) | 176 (23.7%) |
| College/Associate Degree | 833 (87.0%) | 125 (13.1%) |
| Bachelor's Degree or higher | 978 (94.4%) | 58 (5.6%) |
Occupancy by Age of Householder in Seffner
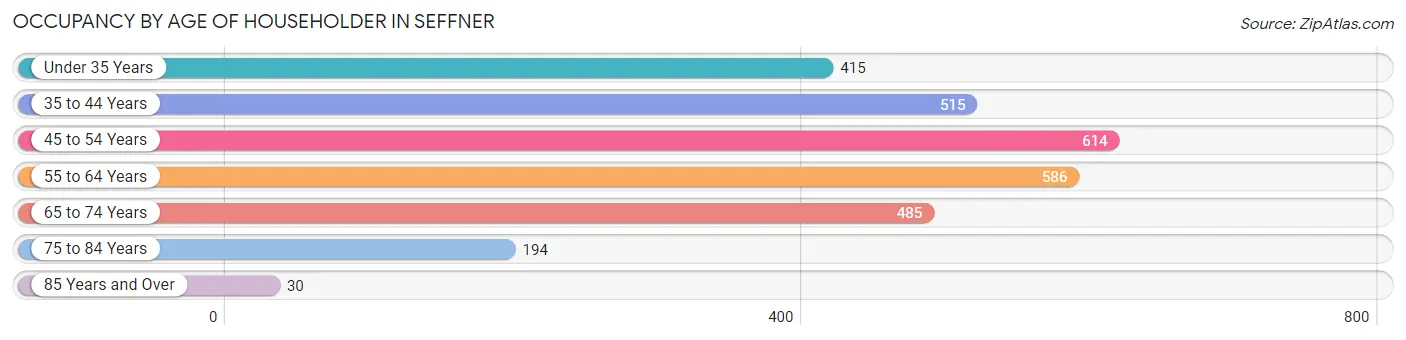
| Age Bracket | # Households | % Households |
| Under 35 Years | 415 | 14.6% |
| 35 to 44 Years | 515 | 18.1% |
| 45 to 54 Years | 614 | 21.6% |
| 55 to 64 Years | 586 | 20.6% |
| 65 to 74 Years | 485 | 17.1% |
| 75 to 84 Years | 194 | 6.8% |
| 85 Years and Over | 30 | 1.1% |
| Total | 2,839 | 100.0% |
Housing Finances in Seffner
Median Income by Occupancy in Seffner
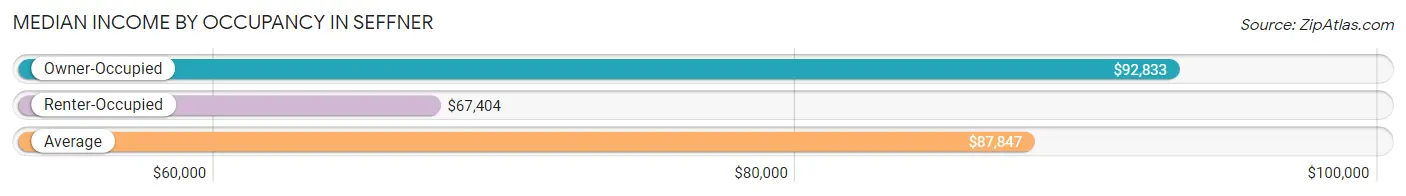
| Occupancy Type | # Households | Median Income |
| Owner-Occupied | 2,474 (87.1%) | $92,833 |
| Renter-Occupied | 365 (12.9%) | $67,404 |
| Average | 2,839 (100.0%) | $87,847 |
Occupancy by Householder Income Bracket in Seffner
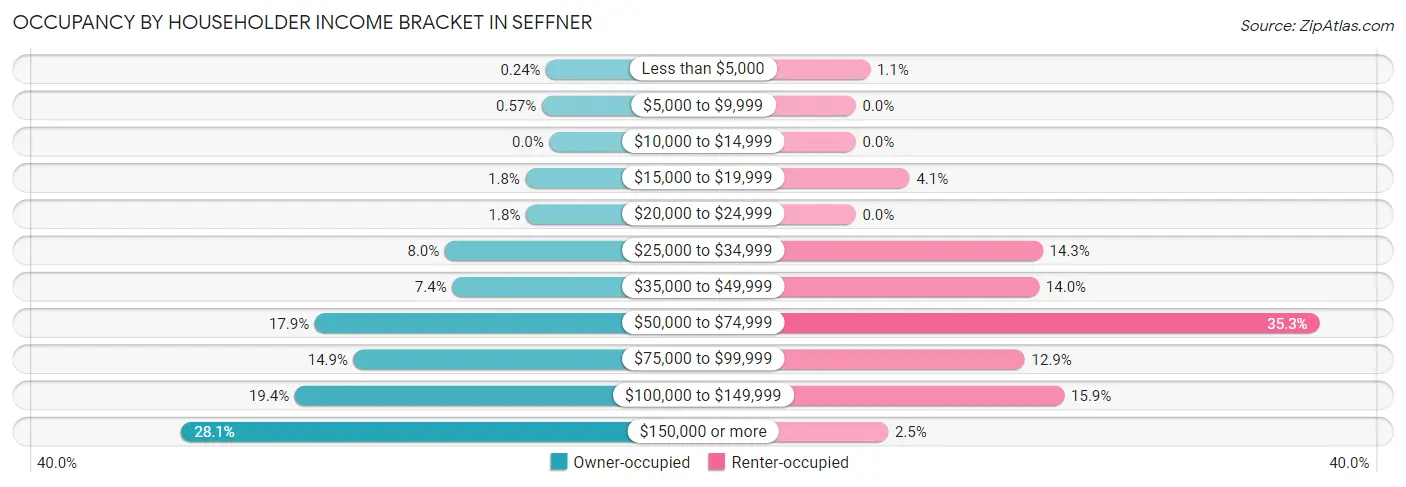
| Income Bracket | Owner-occupied | Renter-occupied |
| Less than $5,000 | 6 (0.2%) | 4 (1.1%) |
| $5,000 to $9,999 | 14 (0.6%) | 0 (0.0%) |
| $10,000 to $14,999 | 0 (0.0%) | 0 (0.0%) |
| $15,000 to $19,999 | 45 (1.8%) | 15 (4.1%) |
| $20,000 to $24,999 | 44 (1.8%) | 0 (0.0%) |
| $25,000 to $34,999 | 197 (8.0%) | 52 (14.2%) |
| $35,000 to $49,999 | 183 (7.4%) | 51 (14.0%) |
| $50,000 to $74,999 | 442 (17.9%) | 129 (35.3%) |
| $75,000 to $99,999 | 369 (14.9%) | 47 (12.9%) |
| $100,000 to $149,999 | 480 (19.4%) | 58 (15.9%) |
| $150,000 or more | 694 (28.1%) | 9 (2.5%) |
| Total | 2,474 (100.0%) | 365 (100.0%) |
Monthly Housing Cost Tiers in Seffner
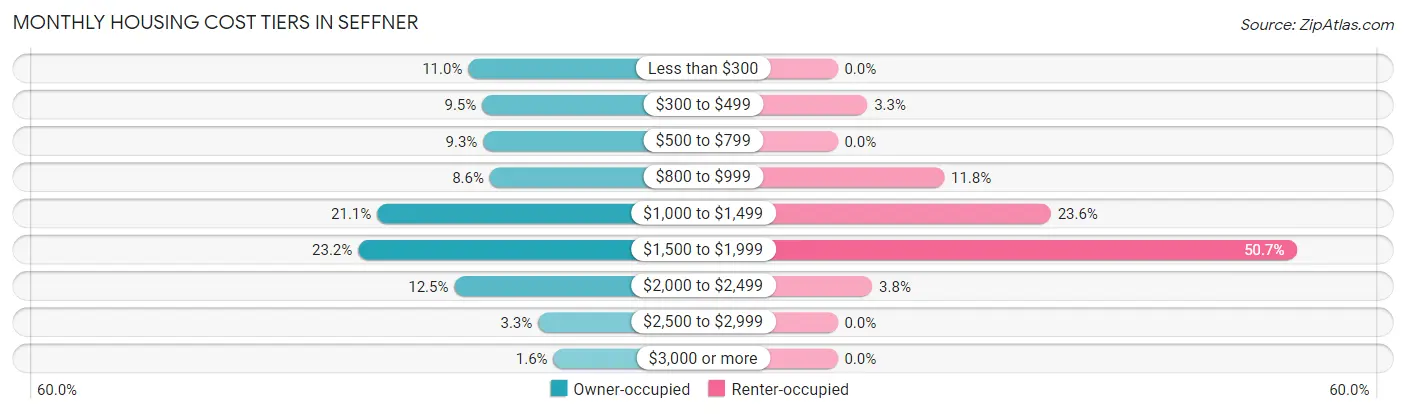
| Monthly Cost | Owner-occupied | Renter-occupied |
| Less than $300 | 272 (11.0%) | 0 (0.0%) |
| $300 to $499 | 234 (9.5%) | 12 (3.3%) |
| $500 to $799 | 231 (9.3%) | 0 (0.0%) |
| $800 to $999 | 213 (8.6%) | 43 (11.8%) |
| $1,000 to $1,499 | 521 (21.1%) | 86 (23.6%) |
| $1,500 to $1,999 | 573 (23.2%) | 185 (50.7%) |
| $2,000 to $2,499 | 310 (12.5%) | 14 (3.8%) |
| $2,500 to $2,999 | 81 (3.3%) | 0 (0.0%) |
| $3,000 or more | 39 (1.6%) | 0 (0.0%) |
| Total | 2,474 (100.0%) | 365 (100.0%) |
Physical Housing Characteristics in Seffner
Housing Structures in Seffner
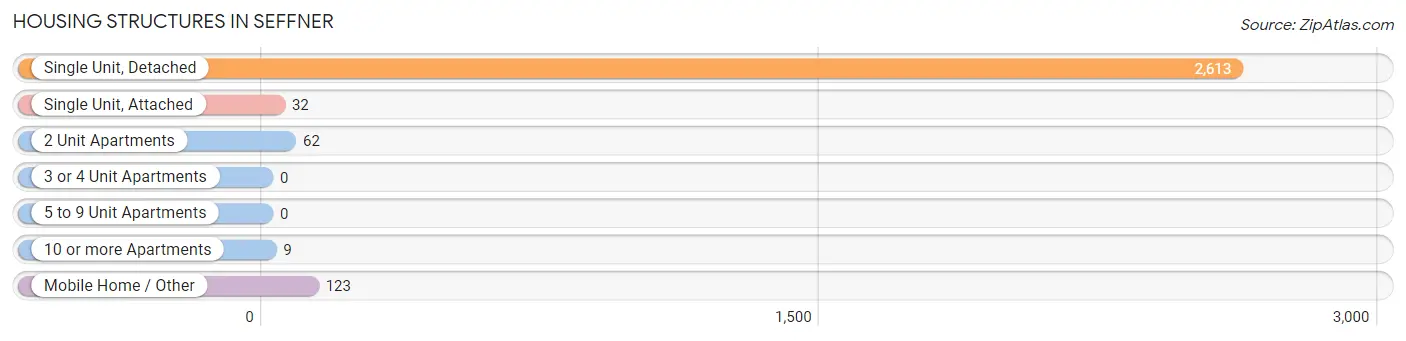
| Structure Type | # Housing Units | % Housing Units |
| Single Unit, Detached | 2,613 | 92.0% |
| Single Unit, Attached | 32 | 1.1% |
| 2 Unit Apartments | 62 | 2.2% |
| 3 or 4 Unit Apartments | 0 | 0.0% |
| 5 to 9 Unit Apartments | 0 | 0.0% |
| 10 or more Apartments | 9 | 0.3% |
| Mobile Home / Other | 123 | 4.3% |
| Total | 2,839 | 100.0% |
Housing Structures by Occupancy in Seffner
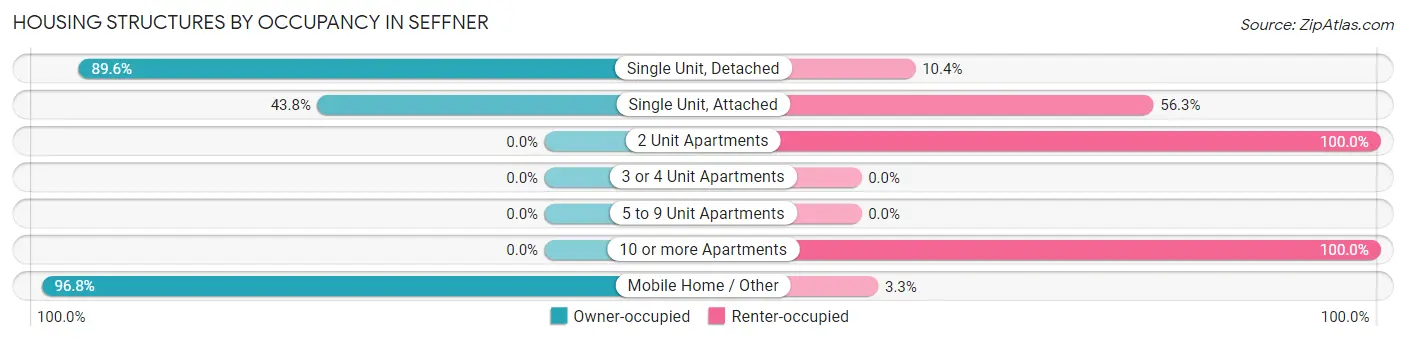
| Structure Type | Owner-occupied | Renter-occupied |
| Single Unit, Detached | 2,341 (89.6%) | 272 (10.4%) |
| Single Unit, Attached | 14 (43.8%) | 18 (56.2%) |
| 2 Unit Apartments | 0 (0.0%) | 62 (100.0%) |
| 3 or 4 Unit Apartments | 0 (0.0%) | 0 (0.0%) |
| 5 to 9 Unit Apartments | 0 (0.0%) | 0 (0.0%) |
| 10 or more Apartments | 0 (0.0%) | 9 (100.0%) |
| Mobile Home / Other | 119 (96.8%) | 4 (3.3%) |
| Total | 2,474 (87.1%) | 365 (12.9%) |
Housing Structures by Number of Rooms in Seffner
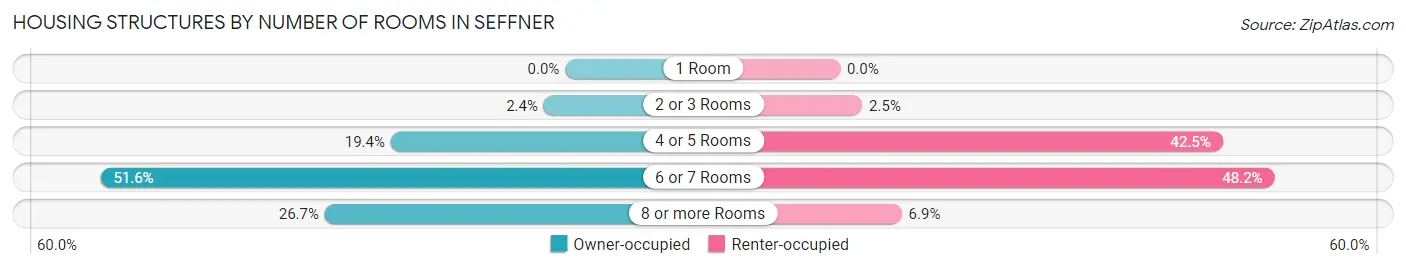
| Number of Rooms | Owner-occupied | Renter-occupied |
| 1 Room | 0 (0.0%) | 0 (0.0%) |
| 2 or 3 Rooms | 59 (2.4%) | 9 (2.5%) |
| 4 or 5 Rooms | 479 (19.4%) | 155 (42.5%) |
| 6 or 7 Rooms | 1,276 (51.6%) | 176 (48.2%) |
| 8 or more Rooms | 660 (26.7%) | 25 (6.9%) |
| Total | 2,474 (100.0%) | 365 (100.0%) |
Housing Structure by Heating Type in Seffner
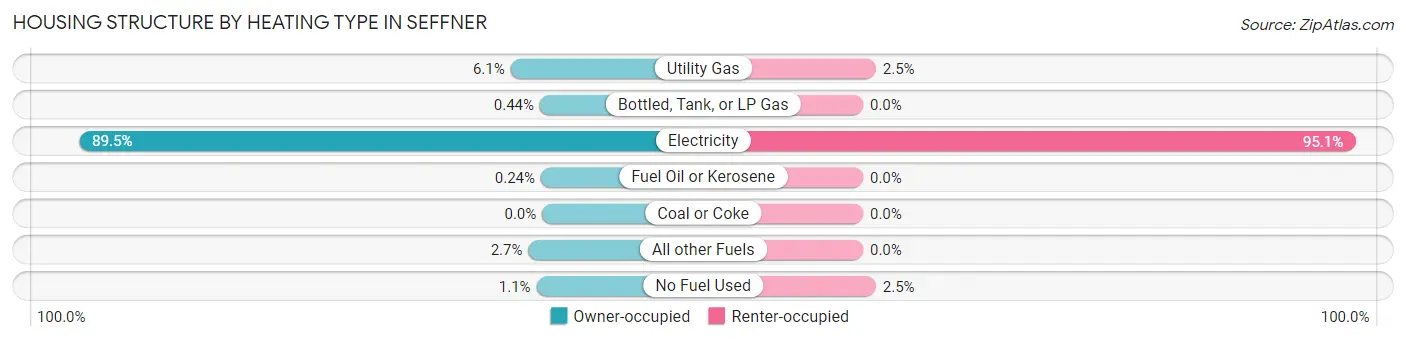
| Heating Type | Owner-occupied | Renter-occupied |
| Utility Gas | 151 (6.1%) | 9 (2.5%) |
| Bottled, Tank, or LP Gas | 11 (0.4%) | 0 (0.0%) |
| Electricity | 2,213 (89.4%) | 347 (95.1%) |
| Fuel Oil or Kerosene | 6 (0.2%) | 0 (0.0%) |
| Coal or Coke | 0 (0.0%) | 0 (0.0%) |
| All other Fuels | 66 (2.7%) | 0 (0.0%) |
| No Fuel Used | 27 (1.1%) | 9 (2.5%) |
| Total | 2,474 (100.0%) | 365 (100.0%) |
Household Vehicle Usage in Seffner
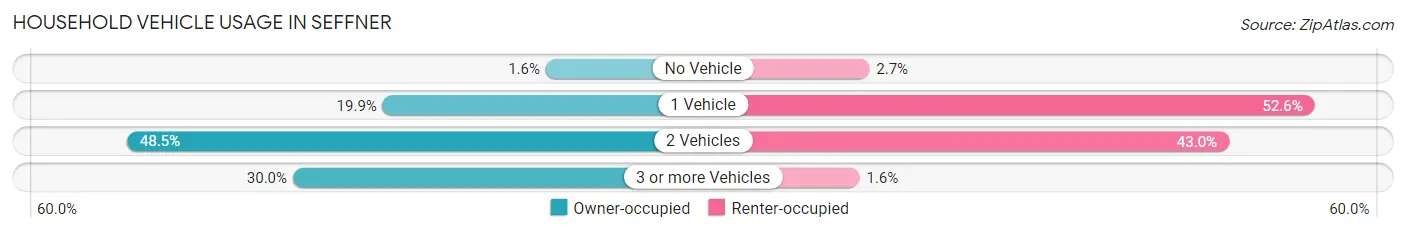
| Vehicles per Household | Owner-occupied | Renter-occupied |
| No Vehicle | 40 (1.6%) | 10 (2.7%) |
| 1 Vehicle | 492 (19.9%) | 192 (52.6%) |
| 2 Vehicles | 1,201 (48.5%) | 157 (43.0%) |
| 3 or more Vehicles | 741 (29.9%) | 6 (1.6%) |
| Total | 2,474 (100.0%) | 365 (100.0%) |
Real Estate & Mortgages in Seffner
Real Estate and Mortgage Overview in Seffner
| Characteristic | Without Mortgage | With Mortgage |
| Housing Units | 829 | 1,645 |
| Median Property Value | $248,400 | $288,100 |
| Median Household Income | $80,568 | $589 |
| Monthly Housing Costs | $452 | $39 |
| Real Estate Taxes | $1,589 | $26 |
Property Value by Mortgage Status in Seffner
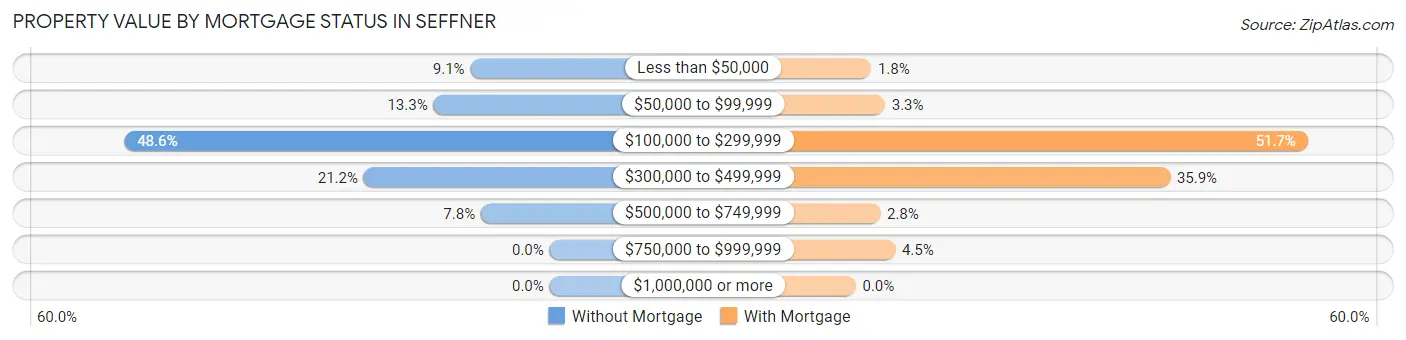
| Property Value | Without Mortgage | With Mortgage |
| Less than $50,000 | 75 (9.0%) | 29 (1.8%) |
| $50,000 to $99,999 | 110 (13.3%) | 55 (3.3%) |
| $100,000 to $299,999 | 403 (48.6%) | 850 (51.7%) |
| $300,000 to $499,999 | 176 (21.2%) | 591 (35.9%) |
| $500,000 to $749,999 | 65 (7.8%) | 46 (2.8%) |
| $750,000 to $999,999 | 0 (0.0%) | 74 (4.5%) |
| $1,000,000 or more | 0 (0.0%) | 0 (0.0%) |
| Total | 829 (100.0%) | 1,645 (100.0%) |
Household Income by Mortgage Status in Seffner
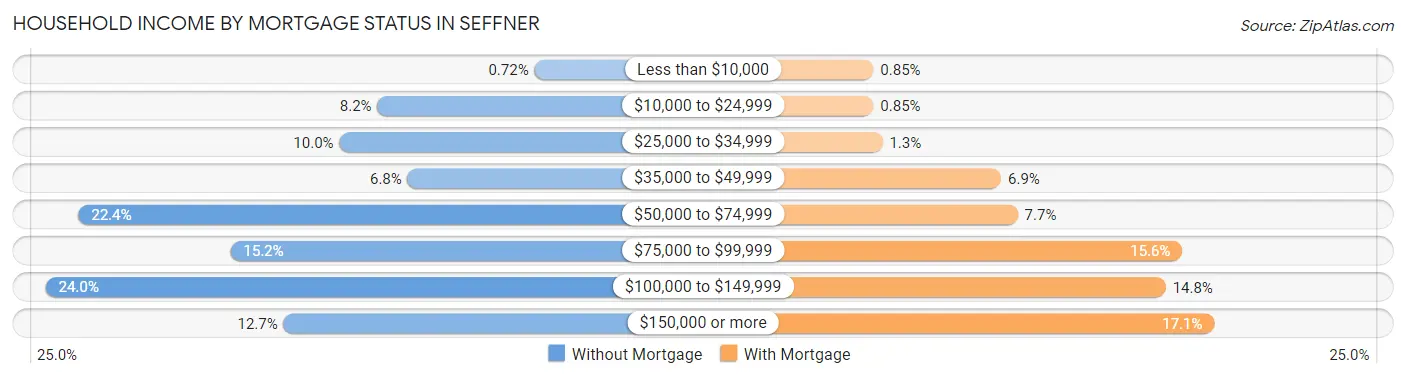
| Household Income | Without Mortgage | With Mortgage |
| Less than $10,000 | 6 (0.7%) | 14 (0.9%) |
| $10,000 to $24,999 | 68 (8.2%) | 14 (0.9%) |
| $25,000 to $34,999 | 83 (10.0%) | 21 (1.3%) |
| $35,000 to $49,999 | 56 (6.8%) | 114 (6.9%) |
| $50,000 to $74,999 | 186 (22.4%) | 127 (7.7%) |
| $75,000 to $99,999 | 126 (15.2%) | 256 (15.6%) |
| $100,000 to $149,999 | 199 (24.0%) | 243 (14.8%) |
| $150,000 or more | 105 (12.7%) | 281 (17.1%) |
| Total | 829 (100.0%) | 1,645 (100.0%) |
Property Value to Household Income Ratio in Seffner
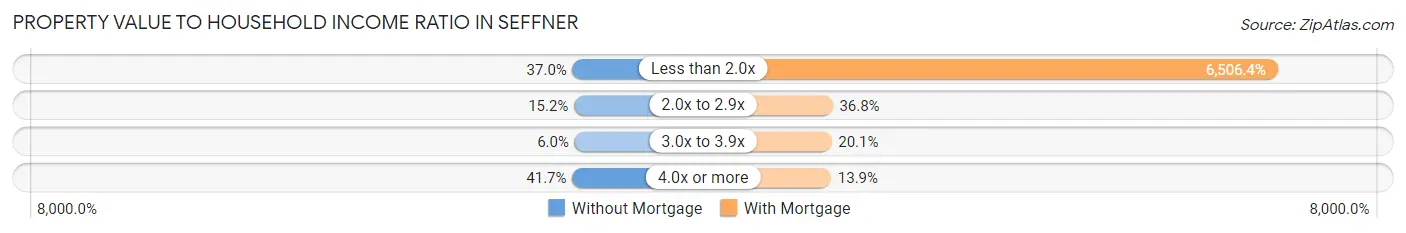
| Value-to-Income Ratio | Without Mortgage | With Mortgage |
| Less than 2.0x | 307 (37.0%) | 107,031 (6,506.4%) |
| 2.0x to 2.9x | 126 (15.2%) | 605 (36.8%) |
| 3.0x to 3.9x | 50 (6.0%) | 331 (20.1%) |
| 4.0x or more | 346 (41.7%) | 228 (13.9%) |
| Total | 829 (100.0%) | 1,645 (100.0%) |
Real Estate Taxes by Mortgage Status in Seffner
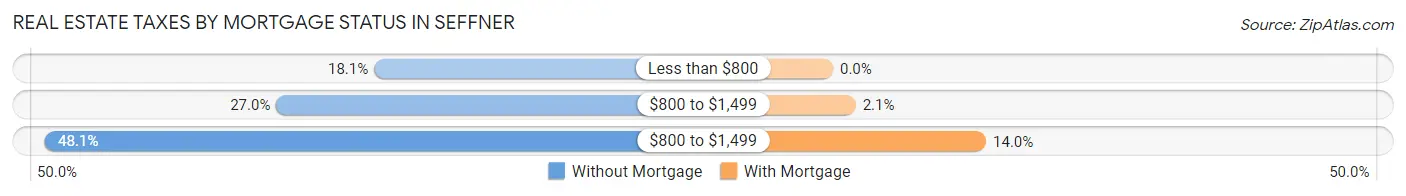
| Property Taxes | Without Mortgage | With Mortgage |
| Less than $800 | 150 (18.1%) | 0 (0.0%) |
| $800 to $1,499 | 224 (27.0%) | 34 (2.1%) |
| $800 to $1,499 | 399 (48.1%) | 230 (14.0%) |
| Total | 829 (100.0%) | 1,645 (100.0%) |
Health & Disability in Seffner
Health Insurance Coverage by Age in Seffner
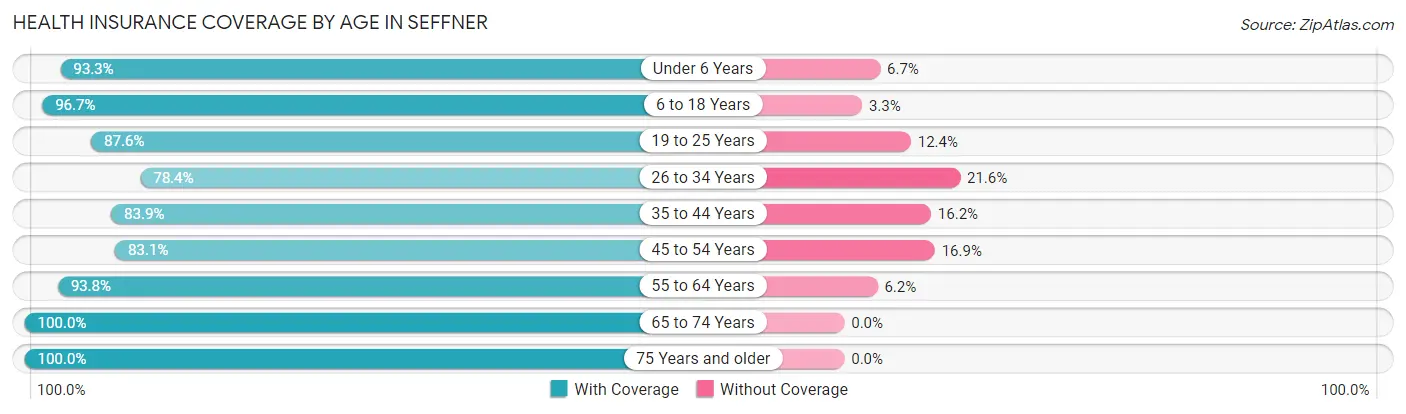
| Age Bracket | With Coverage | Without Coverage |
| Under 6 Years | 784 (93.3%) | 56 (6.7%) |
| 6 to 18 Years | 1,383 (96.7%) | 47 (3.3%) |
| 19 to 25 Years | 770 (87.6%) | 109 (12.4%) |
| 26 to 34 Years | 607 (78.4%) | 167 (21.6%) |
| 35 to 44 Years | 950 (83.9%) | 183 (16.2%) |
| 45 to 54 Years | 1,060 (83.1%) | 215 (16.9%) |
| 55 to 64 Years | 957 (93.8%) | 63 (6.2%) |
| 65 to 74 Years | 815 (100.0%) | 0 (0.0%) |
| 75 Years and older | 406 (100.0%) | 0 (0.0%) |
| Total | 7,732 (90.2%) | 840 (9.8%) |
Health Insurance Coverage by Citizenship Status in Seffner
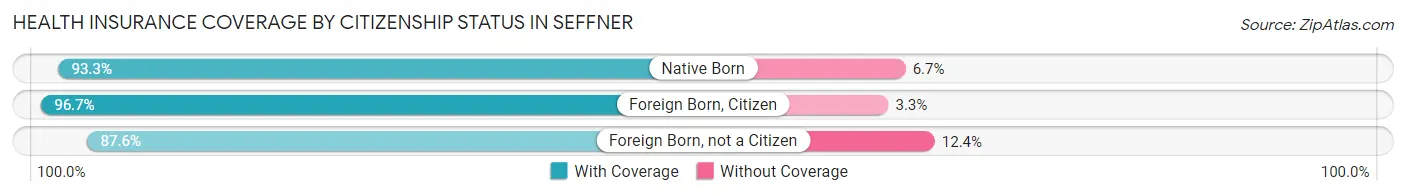
| Citizenship Status | With Coverage | Without Coverage |
| Native Born | 784 (93.3%) | 56 (6.7%) |
| Foreign Born, Citizen | 1,383 (96.7%) | 47 (3.3%) |
| Foreign Born, not a Citizen | 770 (87.6%) | 109 (12.4%) |
Health Insurance Coverage by Household Income in Seffner
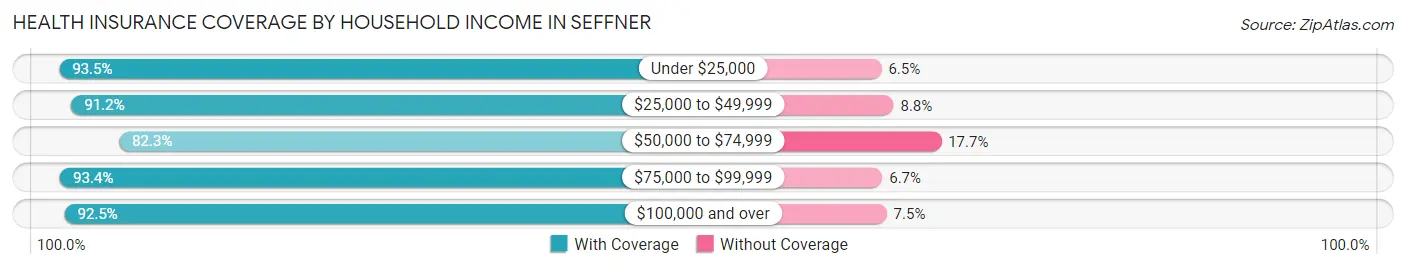
| Household Income | With Coverage | Without Coverage |
| Under $25,000 | 144 (93.5%) | 10 (6.5%) |
| $25,000 to $49,999 | 1,156 (91.2%) | 111 (8.8%) |
| $50,000 to $74,999 | 1,433 (82.3%) | 308 (17.7%) |
| $75,000 to $99,999 | 1,010 (93.3%) | 72 (6.7%) |
| $100,000 and over | 3,986 (92.5%) | 322 (7.5%) |
Public vs Private Health Insurance Coverage by Age in Seffner
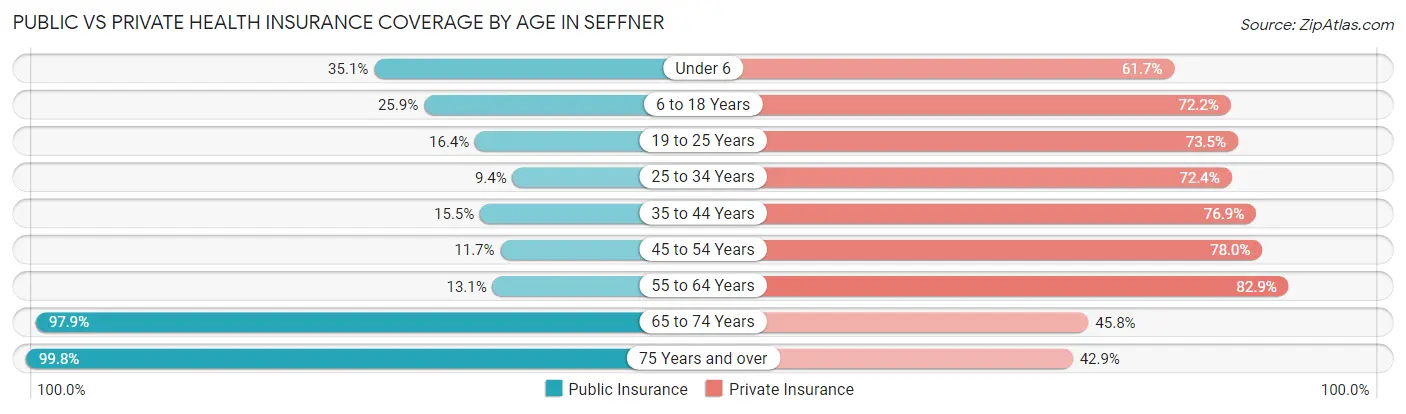
| Age Bracket | Public Insurance | Private Insurance |
| Under 6 | 295 (35.1%) | 518 (61.7%) |
| 6 to 18 Years | 370 (25.9%) | 1,032 (72.2%) |
| 19 to 25 Years | 144 (16.4%) | 646 (73.5%) |
| 25 to 34 Years | 73 (9.4%) | 560 (72.4%) |
| 35 to 44 Years | 175 (15.4%) | 871 (76.9%) |
| 45 to 54 Years | 149 (11.7%) | 995 (78.0%) |
| 55 to 64 Years | 134 (13.1%) | 846 (82.9%) |
| 65 to 74 Years | 798 (97.9%) | 373 (45.8%) |
| 75 Years and over | 405 (99.8%) | 174 (42.9%) |
| Total | 2,543 (29.7%) | 6,015 (70.2%) |
Disability Status by Sex by Age in Seffner
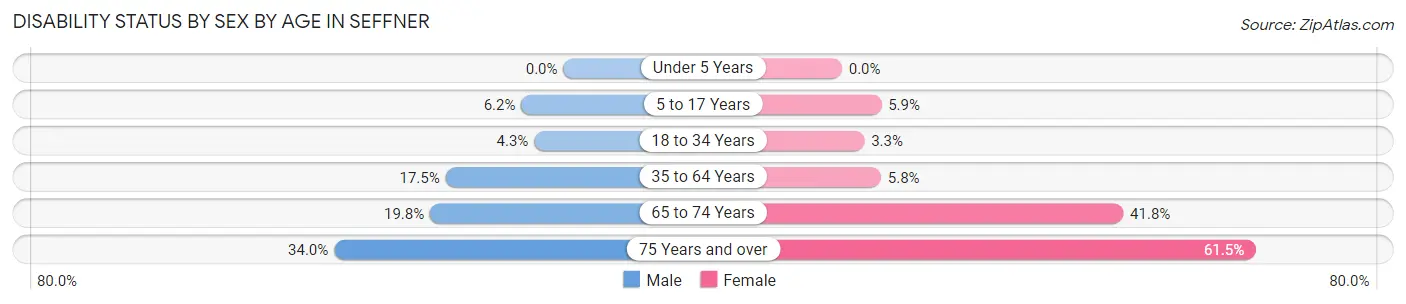
| Age Bracket | Male | Female |
| Under 5 Years | 0 (0.0%) | 0 (0.0%) |
| 5 to 17 Years | 36 (6.2%) | 49 (5.9%) |
| 18 to 34 Years | 42 (4.3%) | 26 (3.3%) |
| 35 to 64 Years | 301 (17.5%) | 99 (5.8%) |
| 65 to 74 Years | 77 (19.8%) | 178 (41.8%) |
| 75 Years and over | 48 (34.0%) | 163 (61.5%) |
Disability Class by Sex by Age in Seffner
Disability Class: Hearing Difficulty
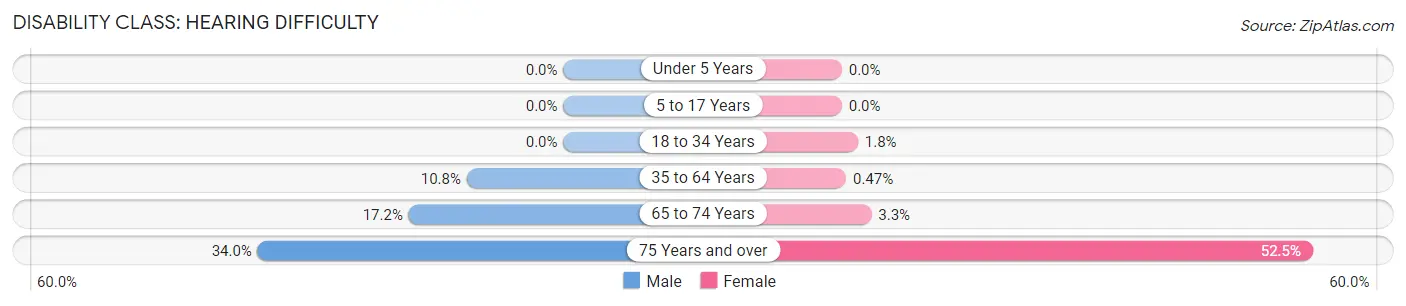
| Age Bracket | Male | Female |
| Under 5 Years | 0 (0.0%) | 0 (0.0%) |
| 5 to 17 Years | 0 (0.0%) | 0 (0.0%) |
| 18 to 34 Years | 0 (0.0%) | 14 (1.8%) |
| 35 to 64 Years | 185 (10.7%) | 8 (0.5%) |
| 65 to 74 Years | 67 (17.2%) | 14 (3.3%) |
| 75 Years and over | 48 (34.0%) | 139 (52.4%) |
Disability Class: Vision Difficulty
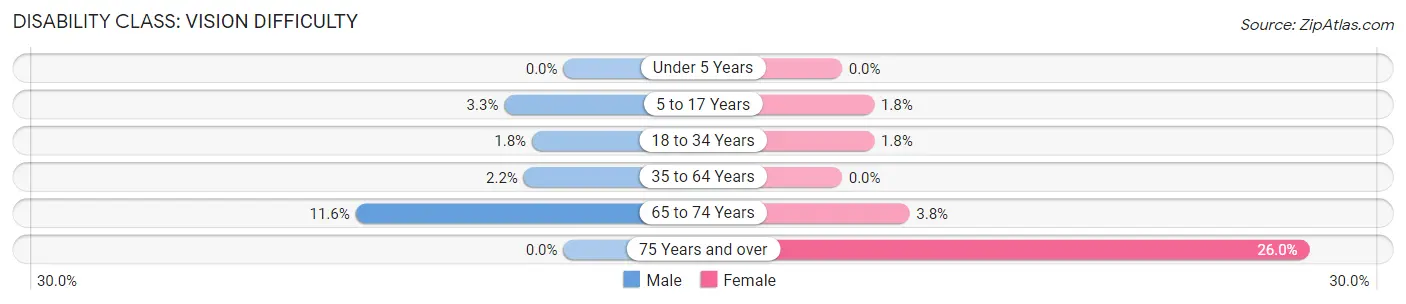
| Age Bracket | Male | Female |
| Under 5 Years | 0 (0.0%) | 0 (0.0%) |
| 5 to 17 Years | 19 (3.3%) | 15 (1.8%) |
| 18 to 34 Years | 17 (1.8%) | 14 (1.8%) |
| 35 to 64 Years | 38 (2.2%) | 0 (0.0%) |
| 65 to 74 Years | 45 (11.6%) | 16 (3.8%) |
| 75 Years and over | 0 (0.0%) | 69 (26.0%) |
Disability Class: Cognitive Difficulty
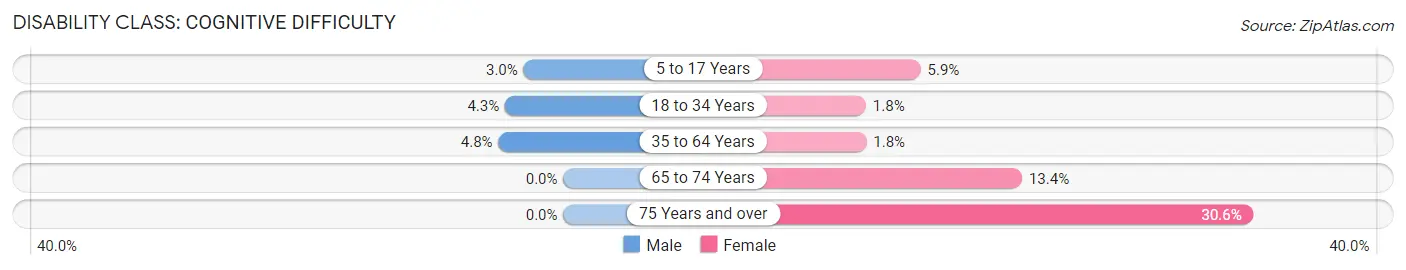
| Age Bracket | Male | Female |
| 5 to 17 Years | 17 (2.9%) | 49 (5.9%) |
| 18 to 34 Years | 42 (4.3%) | 14 (1.8%) |
| 35 to 64 Years | 83 (4.8%) | 31 (1.8%) |
| 65 to 74 Years | 0 (0.0%) | 57 (13.4%) |
| 75 Years and over | 0 (0.0%) | 81 (30.6%) |
Disability Class: Ambulatory Difficulty
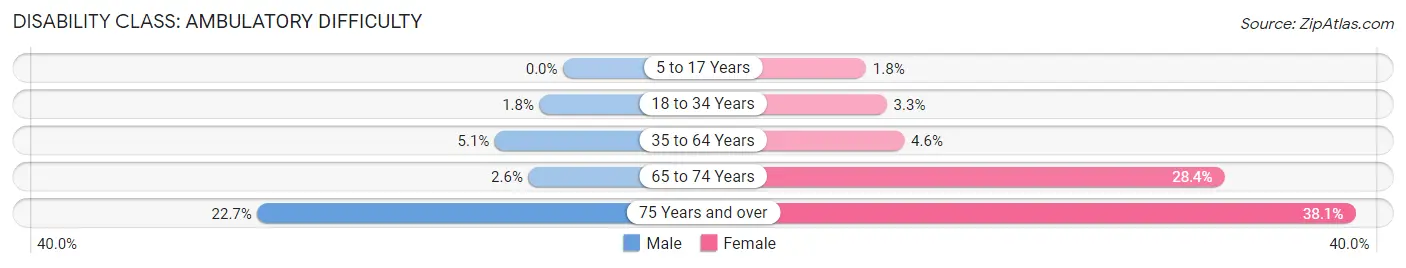
| Age Bracket | Male | Female |
| 5 to 17 Years | 0 (0.0%) | 15 (1.8%) |
| 18 to 34 Years | 17 (1.8%) | 26 (3.3%) |
| 35 to 64 Years | 87 (5.1%) | 79 (4.6%) |
| 65 to 74 Years | 10 (2.6%) | 121 (28.4%) |
| 75 Years and over | 32 (22.7%) | 101 (38.1%) |
Disability Class: Self-Care Difficulty
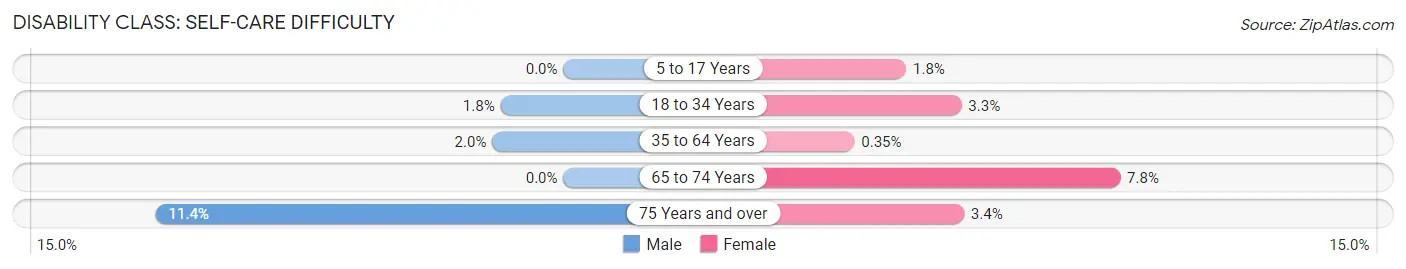
| Age Bracket | Male | Female |
| 5 to 17 Years | 0 (0.0%) | 15 (1.8%) |
| 18 to 34 Years | 17 (1.8%) | 26 (3.3%) |
| 35 to 64 Years | 34 (2.0%) | 6 (0.4%) |
| 65 to 74 Years | 0 (0.0%) | 33 (7.7%) |
| 75 Years and over | 16 (11.4%) | 9 (3.4%) |
Technology Access in Seffner
Computing Device Access in Seffner
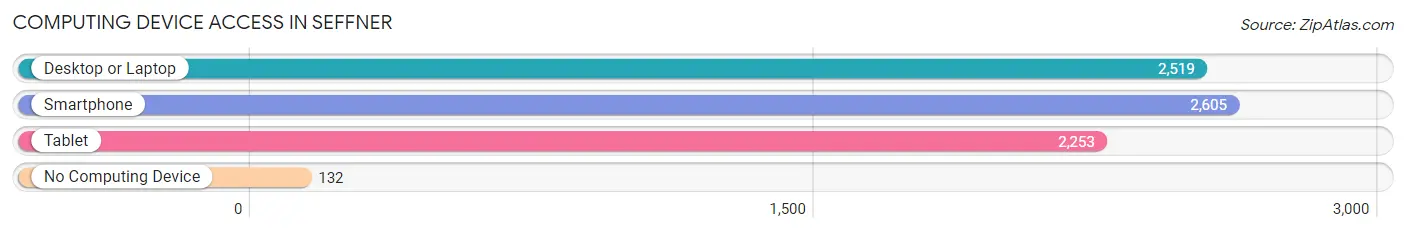
| Device Type | # Households | % Households |
| Desktop or Laptop | 2,519 | 88.7% |
| Smartphone | 2,605 | 91.8% |
| Tablet | 2,253 | 79.4% |
| No Computing Device | 132 | 4.6% |
| Total | 2,839 | 100.0% |
Internet Access in Seffner
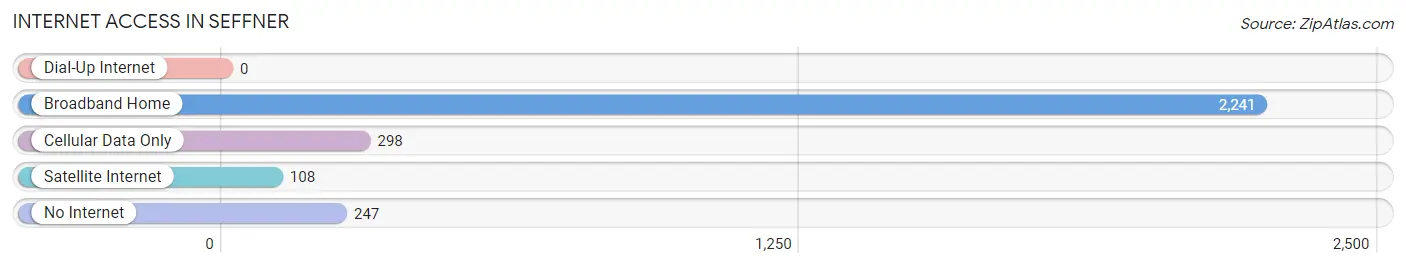
| Internet Type | # Households | % Households |
| Dial-Up Internet | 0 | 0.0% |
| Broadband Home | 2,241 | 78.9% |
| Cellular Data Only | 298 | 10.5% |
| Satellite Internet | 108 | 3.8% |
| No Internet | 247 | 8.7% |
| Total | 2,839 | 100.0% |
Seffner Summary
Seffner, Florida is a small town located in Hillsborough County, just east of Tampa. It is a part of the Tampa-St. Petersburg-Clearwater metropolitan area and is home to approximately 8,000 people. Seffner is known for its rural atmosphere and its proximity to the larger cities of Tampa and Brandon.
History
Seffner was first settled in the late 1800s by a group of settlers from Georgia. The town was originally known as Fort Lonesome, but was later renamed Seffner after a local family. The town was officially incorporated in 1902.
In the early 1900s, Seffner was a small farming community. The town was home to several citrus groves, as well as a few small businesses. The town was also home to a railroad station, which connected Seffner to the larger cities of Tampa and Brandon.
In the 1950s, Seffner began to experience rapid growth. The town was home to several new businesses, including a shopping center and a movie theater. The town also saw an influx of new residents, as many people moved to Seffner from other parts of Florida.
Geography
Seffner is located in Hillsborough County, just east of Tampa. The town is situated on the northern edge of the Tampa Bay area, and is bordered by Brandon to the west and Mango to the east. Seffner is located approximately 20 miles from downtown Tampa.
The town is home to several parks, including Seffner Community Park and Seffner Nature Park. The town is also home to several lakes, including Lake Weeks and Lake Thonotosassa.
Economy
Seffner’s economy is largely based on the service industry. The town is home to several restaurants, retail stores, and other businesses. The town is also home to several industrial parks, which provide employment opportunities for local residents.
The town is also home to several large employers, including Amazon, Walmart, and Publix. The town is also home to several small businesses, including restaurants, retail stores, and other businesses.
Demographics
As of the 2010 census, Seffner had a population of 8,000 people. The town is predominantly white, with approximately 75% of the population identifying as white. The town is also home to a large Hispanic population, with approximately 20% of the population identifying as Hispanic.
The median household income in Seffner is approximately $50,000, and the median home value is approximately $150,000. The town is home to several schools, including Seffner Elementary School, Seffner Middle School, and Seffner High School.
Conclusion
Seffner, Florida is a small town located in Hillsborough County, just east of Tampa. The town is known for its rural atmosphere and its proximity to the larger cities of Tampa and Brandon. Seffner’s economy is largely based on the service industry, and the town is home to several large employers, including Amazon, Walmart, and Publix. As of the 2010 census, Seffner had a population of 8,000 people, with approximately 75% of the population identifying as white and 20% identifying as Hispanic. The median household income in Seffner is approximately $50,000, and the median home value is approximately $150,000.
Common Questions
What is Per Capita Income in Seffner?
Per Capita income in Seffner is $41,366.
What is the Median Family Income in Seffner?
Median Family Income in Seffner is $102,772.
What is the Median Household income in Seffner?
Median Household Income in Seffner is $87,847.
What is Income or Wage Gap in Seffner?
Income or Wage Gap in Seffner is 10.3%.
Women in Seffner earn 89.7 cents for every dollar earned by a man.
What is Inequality or Gini Index in Seffner?
Inequality or Gini Index in Seffner is 0.43.
What is the Total Population of Seffner?
Total Population of Seffner is 8,597.
What is the Total Male Population of Seffner?
Total Male Population of Seffner is 4,322.
What is the Total Female Population of Seffner?
Total Female Population of Seffner is 4,275.
What is the Ratio of Males per 100 Females in Seffner?
There are 101.10 Males per 100 Females in Seffner.
What is the Ratio of Females per 100 Males in Seffner?
There are 98.91 Females per 100 Males in Seffner.
What is the Median Population Age in Seffner?
Median Population Age in Seffner is 38.8 Years.
What is the Average Family Size in Seffner
Average Family Size in Seffner is 3.5 People.
What is the Average Household Size in Seffner
Average Household Size in Seffner is 3.0 People.
How Large is the Labor Force in Seffner?
There are 4,423 People in the Labor Forcein in Seffner.
What is the Percentage of People in the Labor Force in Seffner?
66.1% of People are in the Labor Force in Seffner.
What is the Unemployment Rate in Seffner?
Unemployment Rate in Seffner is 1.9%.