Sebring, FL Map & Demographics
Sebring Map
Sebring Overview
$29,697
PER CAPITA INCOME
$54,803
AVG FAMILY INCOME
$38,024
AVG HOUSEHOLD INCOME
12.1%
WAGE / INCOME GAP [ % ]
87.9¢/ $1
WAGE / INCOME GAP [ $ ]
$12,577
FAMILY INCOME DEFICIT
0.56
INEQUALITY / GINI INDEX
11,006
TOTAL POPULATION
5,141
MALE POPULATION
5,865
FEMALE POPULATION
87.66
MALES / 100 FEMALES
114.08
FEMALES / 100 MALES
46.3
MEDIAN AGE
2.9
AVG FAMILY SIZE
2.1
AVG HOUSEHOLD SIZE
4,266
LABOR FORCE [ PEOPLE ]
44.9%
PERCENT IN LABOR FORCE
12.7%
UNEMPLOYMENT RATE
Sebring Area Codes
Income in Sebring
Income Overview in Sebring
Per Capita Income in Sebring is $29,697, while median incomes of families and households are $54,803 and $38,024 respectively.
| Characteristic | Number | Measure |
| Per Capita Income | 11,006 | $29,697 |
| Median Family Income | 2,437 | $54,803 |
| Mean Family Income | 2,437 | $81,074 |
| Median Household Income | 4,759 | $38,024 |
| Mean Household Income | 4,759 | $64,834 |
| Income Deficit | 2,437 | $12,577 |
| Wage / Income Gap (%) | 11,006 | 12.06% |
| Wage / Income Gap ($) | 11,006 | 87.94¢ per $1 |
| Gini / Inequality Index | 11,006 | 0.56 |
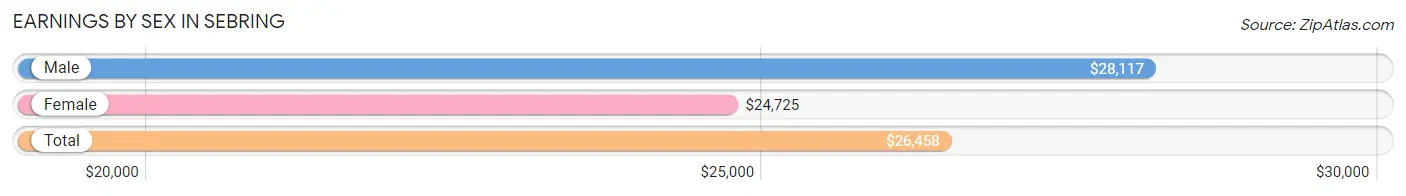
Earnings by Sex in Sebring
Average Earnings in Sebring are $26,458, $28,117 for men and $24,725 for women, a difference of 12.1%.
| Sex | Number | Average Earnings |
| Male | 2,143 (50.2%) | $28,117 |
| Female | 2,125 (49.8%) | $24,725 |
| Total | 4,268 (100.0%) | $26,458 |
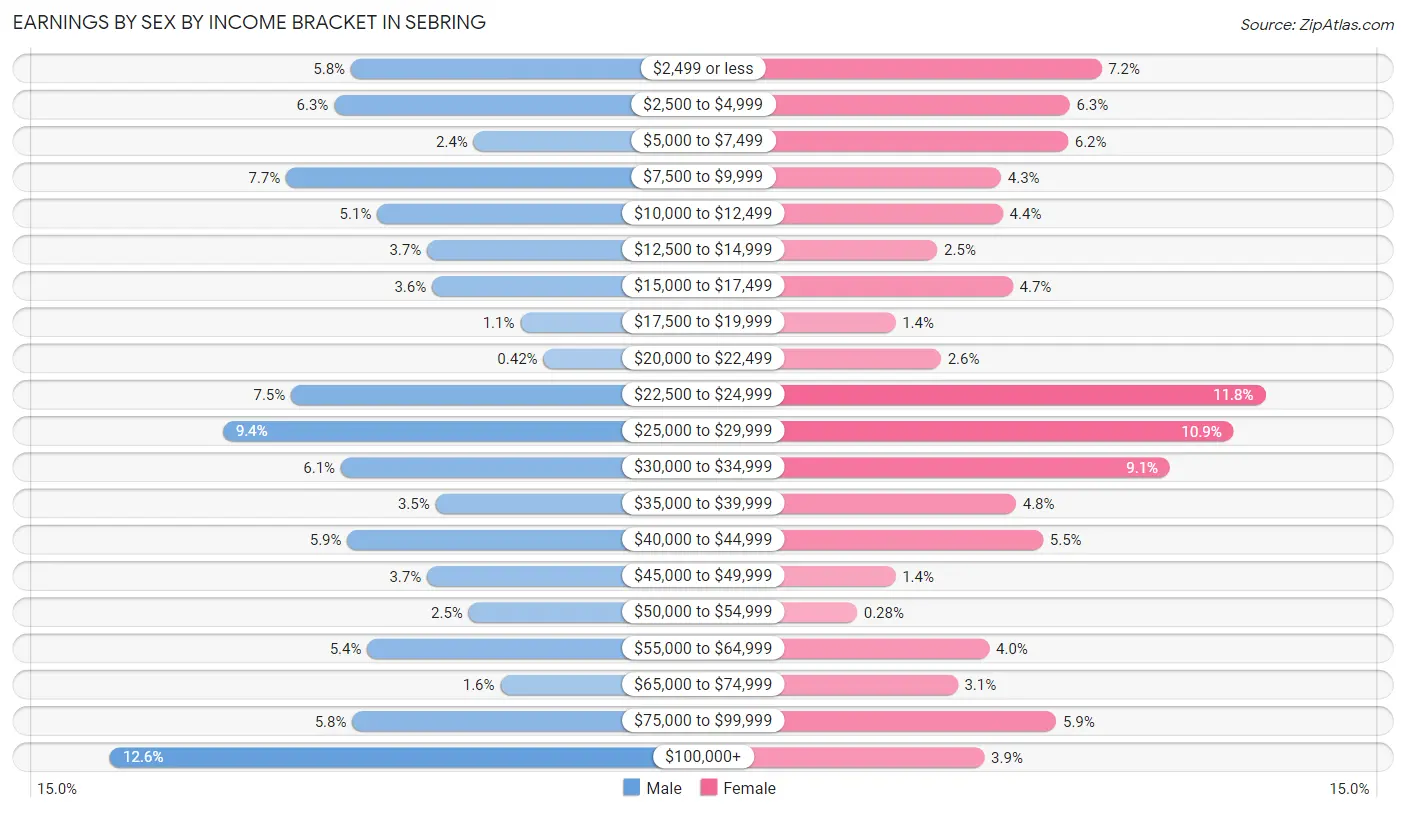
Earnings by Sex by Income Bracket in Sebring
The most common earnings brackets in Sebring are $100,000+ for men (270 | 12.6%) and $22,500 to $24,999 for women (250 | 11.8%).
| Income | Male | Female |
| $2,499 or less | 125 (5.8%) | 152 (7.1%) |
| $2,500 to $4,999 | 135 (6.3%) | 133 (6.3%) |
| $5,000 to $7,499 | 51 (2.4%) | 132 (6.2%) |
| $7,500 to $9,999 | 164 (7.6%) | 92 (4.3%) |
| $10,000 to $12,499 | 109 (5.1%) | 93 (4.4%) |
| $12,500 to $14,999 | 79 (3.7%) | 54 (2.5%) |
| $15,000 to $17,499 | 76 (3.5%) | 99 (4.7%) |
| $17,500 to $19,999 | 23 (1.1%) | 29 (1.4%) |
| $20,000 to $22,499 | 9 (0.4%) | 56 (2.6%) |
| $22,500 to $24,999 | 161 (7.5%) | 250 (11.8%) |
| $25,000 to $29,999 | 202 (9.4%) | 231 (10.9%) |
| $30,000 to $34,999 | 131 (6.1%) | 193 (9.1%) |
| $35,000 to $39,999 | 74 (3.5%) | 101 (4.8%) |
| $40,000 to $44,999 | 127 (5.9%) | 117 (5.5%) |
| $45,000 to $49,999 | 79 (3.7%) | 29 (1.4%) |
| $50,000 to $54,999 | 54 (2.5%) | 6 (0.3%) |
| $55,000 to $64,999 | 115 (5.4%) | 85 (4.0%) |
| $65,000 to $74,999 | 35 (1.6%) | 66 (3.1%) |
| $75,000 to $99,999 | 124 (5.8%) | 125 (5.9%) |
| $100,000+ | 270 (12.6%) | 82 (3.9%) |
| Total | 2,143 (100.0%) | 2,125 (100.0%) |
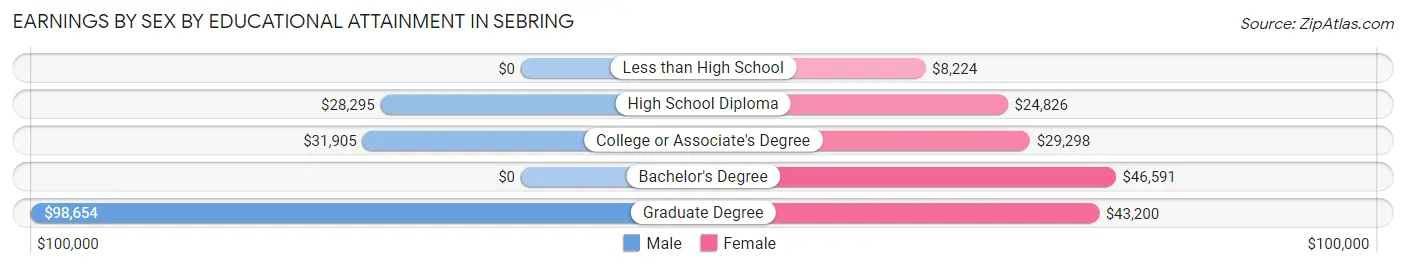
Earnings by Sex by Educational Attainment in Sebring
Average earnings in Sebring are $33,016 for men and $27,862 for women, a difference of 15.6%. Men with an educational attainment of graduate degree enjoy the highest average annual earnings of $98,654, while those with high school diploma education earn the least with $28,295. Women with an educational attainment of bachelor's degree earn the most with the average annual earnings of $46,591, while those with less than high school education have the smallest earnings of $8,224.
| Educational Attainment | Male Income | Female Income |
| Less than High School | - | - |
| High School Diploma | $28,295 | $24,826 |
| College or Associate's Degree | $31,905 | $29,298 |
| Bachelor's Degree | - | - |
| Graduate Degree | $98,654 | $43,200 |
| Total | $33,016 | $27,862 |
Family Income in Sebring
Family Income Brackets in Sebring
According to the Sebring family income data, there are 624 families falling into the $50,000 to $74,999 income range, which is the most common income bracket and makes up 25.6% of all families. Conversely, the $10,000 to $14,999 income bracket is the least frequent group with only 63 families (2.6%) belonging to this category.
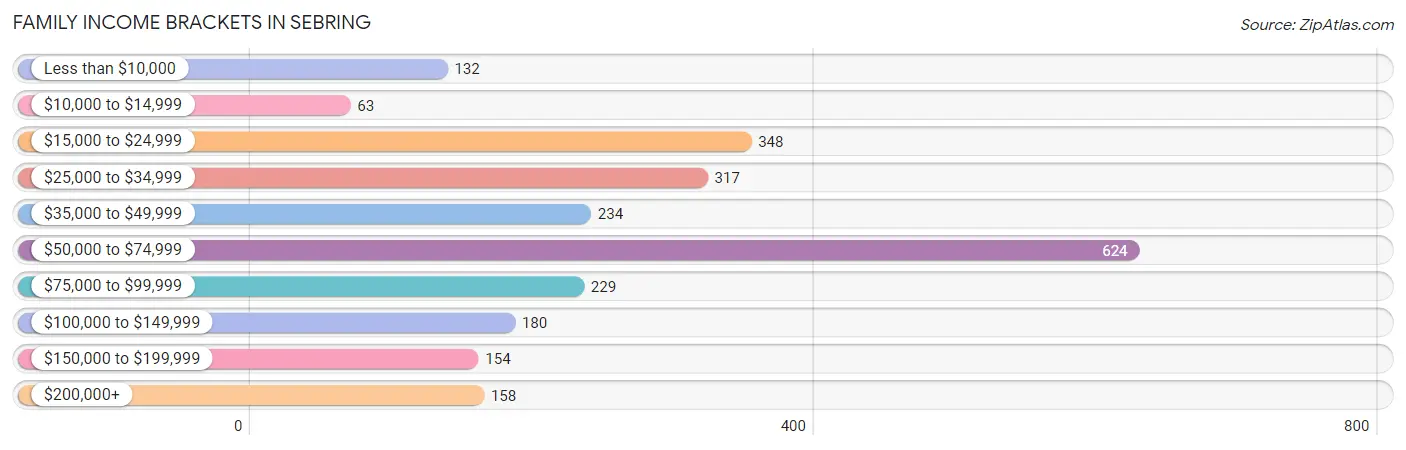
| Income Bracket | # Families | % Families |
| Less than $10,000 | 132 | 5.4% |
| $10,000 to $14,999 | 63 | 2.6% |
| $15,000 to $24,999 | 348 | 14.3% |
| $25,000 to $34,999 | 317 | 13.0% |
| $35,000 to $49,999 | 234 | 9.6% |
| $50,000 to $74,999 | 624 | 25.6% |
| $75,000 to $99,999 | 229 | 9.4% |
| $100,000 to $149,999 | 180 | 7.4% |
| $150,000 to $199,999 | 154 | 6.3% |
| $200,000+ | 158 | 6.5% |
Family Income by Famaliy Size in Sebring
3-person families (510 | 20.9%) account for the highest median family income in Sebring with $75,000 per family, while 2-person families (1,457 | 59.8%) have the highest median income of $26,066 per family member.
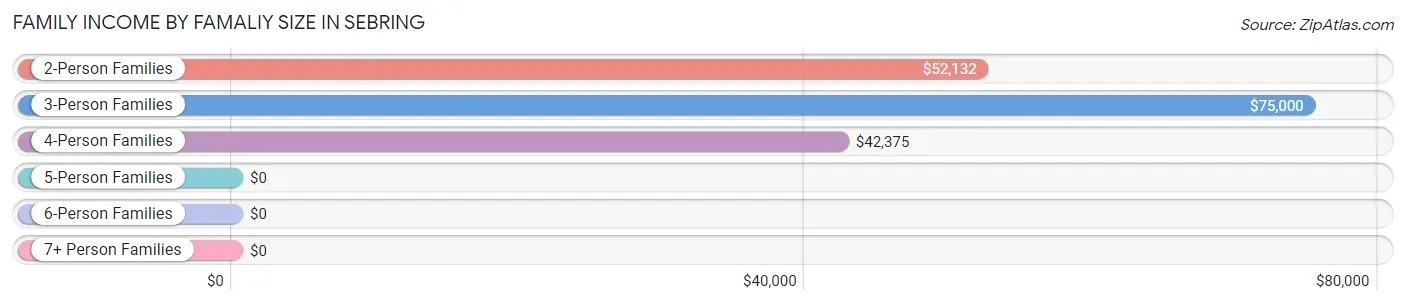
| Income Bracket | # Families | Median Income |
| 2-Person Families | 1,457 (59.8%) | $52,132 |
| 3-Person Families | 510 (20.9%) | $75,000 |
| 4-Person Families | 165 (6.8%) | $42,375 |
| 5-Person Families | 180 (7.4%) | $0 |
| 6-Person Families | 63 (2.6%) | $0 |
| 7+ Person Families | 62 (2.5%) | $0 |
| Total | 2,437 (100.0%) | $54,803 |
Family Income by Number of Earners in Sebring
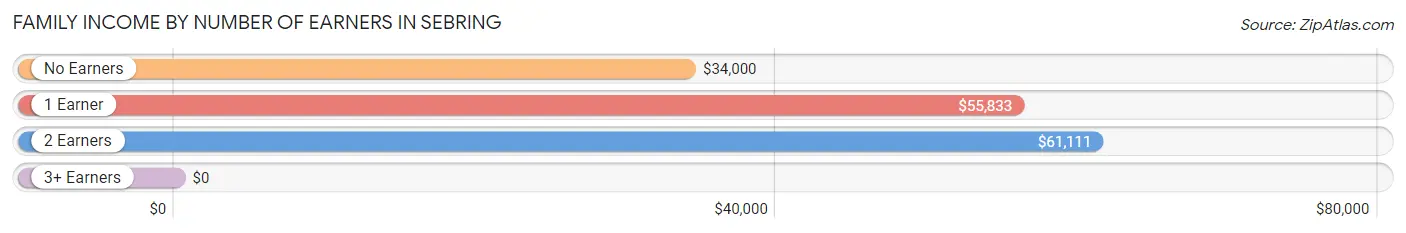
| Number of Earners | # Families | Median Income |
| No Earners | 898 (36.8%) | $34,000 |
| 1 Earner | 698 (28.6%) | $55,833 |
| 2 Earners | 708 (29.0%) | $61,111 |
| 3+ Earners | 133 (5.5%) | $0 |
| Total | 2,437 (100.0%) | $54,803 |
Household Income in Sebring
Household Income Brackets in Sebring
With 914 households falling in the category, the $50,000 to $74,999 income range is the most frequent in Sebring, accounting for 19.2% of all households. In contrast, only 162 households (3.4%) fall into the $150,000 to $199,999 income bracket, making it the least populous group.
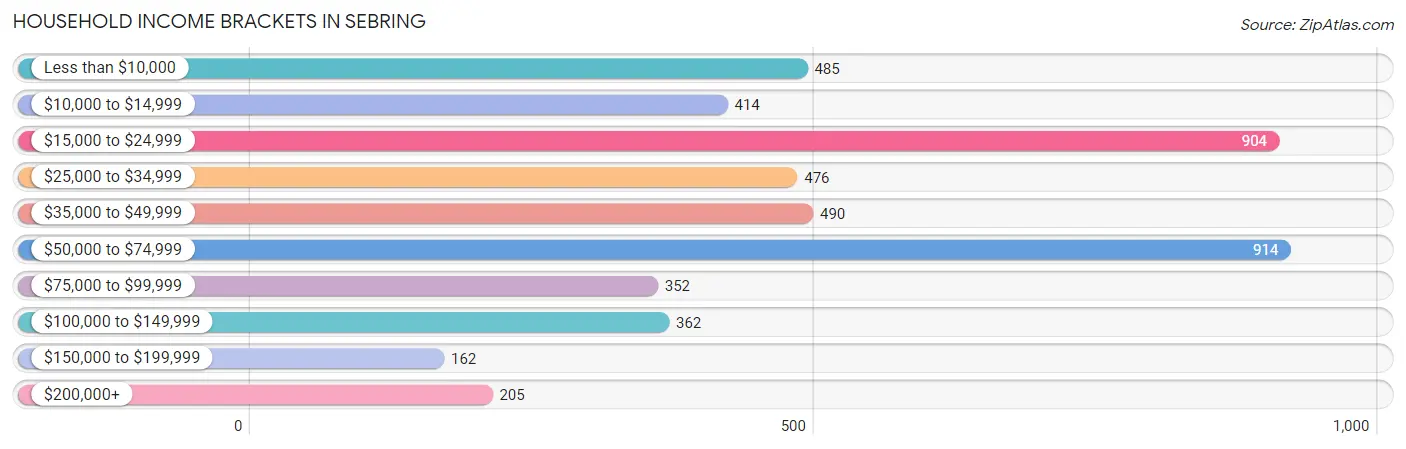
| Income Bracket | # Households | % Households |
| Less than $10,000 | 485 | 10.2% |
| $10,000 to $14,999 | 414 | 8.7% |
| $15,000 to $24,999 | 904 | 19.0% |
| $25,000 to $34,999 | 476 | 10.0% |
| $35,000 to $49,999 | 490 | 10.3% |
| $50,000 to $74,999 | 914 | 19.2% |
| $75,000 to $99,999 | 352 | 7.4% |
| $100,000 to $149,999 | 362 | 7.6% |
| $150,000 to $199,999 | 162 | 3.4% |
| $200,000+ | 205 | 4.3% |
Household Income by Householder Age in Sebring
The median household income in Sebring is $38,024, with the highest median household income of $40,900 found in the 45 to 64 years age bracket for the primary householder. A total of 1,320 households (27.7%) fall into this category. Meanwhile, the 15 to 24 years age bracket for the primary householder has the lowest median household income of $0, with 290 households (6.1%) in this group.
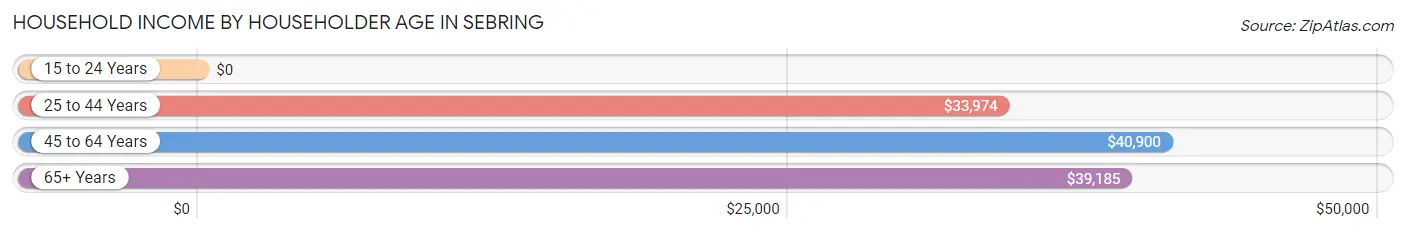
| Income Bracket | # Households | Median Income |
| 15 to 24 Years | 290 (6.1%) | $0 |
| 25 to 44 Years | 1,142 (24.0%) | $33,974 |
| 45 to 64 Years | 1,320 (27.7%) | $40,900 |
| 65+ Years | 2,007 (42.2%) | $39,185 |
| Total | 4,759 (100.0%) | $38,024 |
Poverty in Sebring
Income Below Poverty by Sex and Age in Sebring
With 29.6% poverty level for males and 27.8% for females among the residents of Sebring, 16 and 17 year old males and under 5 year old females are the most vulnerable to poverty, with 79 males (69.9%) and 251 females (75.8%) in their respective age groups living below the poverty level.
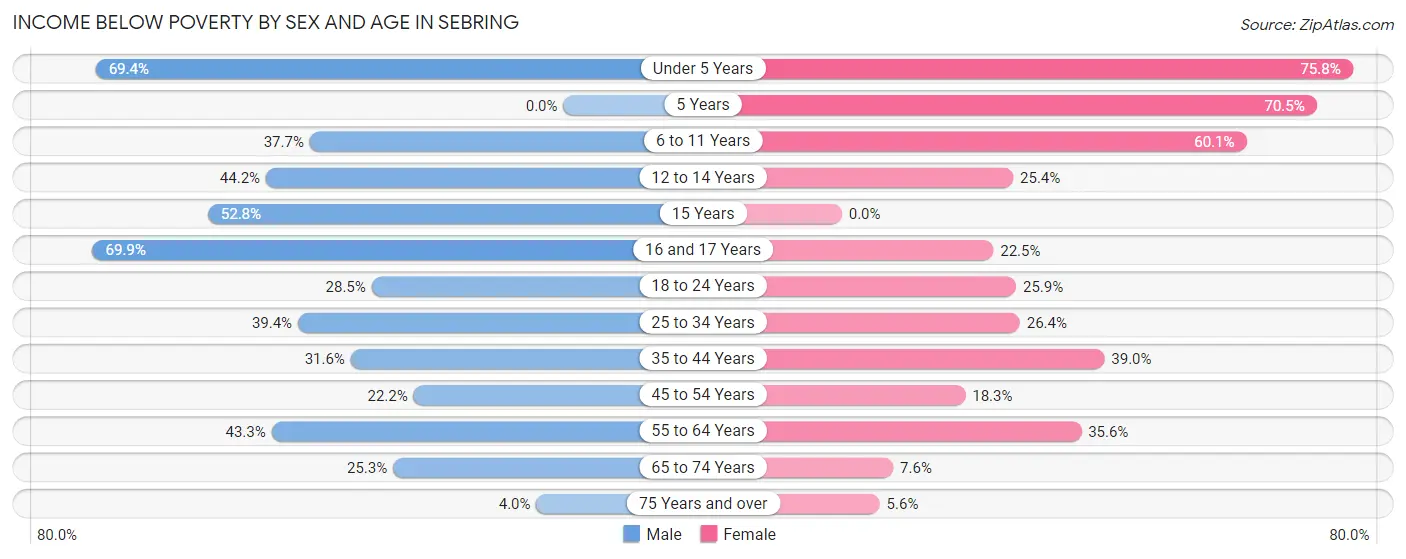
| Age Bracket | Male | Female |
| Under 5 Years | 50 (69.4%) | 251 (75.8%) |
| 5 Years | 0 (0.0%) | 43 (70.5%) |
| 6 to 11 Years | 90 (37.7%) | 182 (60.1%) |
| 12 to 14 Years | 53 (44.2%) | 73 (25.4%) |
| 15 Years | 38 (52.8%) | 0 (0.0%) |
| 16 and 17 Years | 79 (69.9%) | 27 (22.5%) |
| 18 to 24 Years | 154 (28.5%) | 117 (25.9%) |
| 25 to 34 Years | 147 (39.4%) | 143 (26.4%) |
| 35 to 44 Years | 222 (31.6%) | 271 (39.0%) |
| 45 to 54 Years | 111 (22.2%) | 117 (18.3%) |
| 55 to 64 Years | 221 (43.3%) | 225 (35.5%) |
| 65 to 74 Years | 193 (25.3%) | 59 (7.6%) |
| 75 Years and over | 27 (4.0%) | 41 (5.6%) |
| Total | 1,385 (29.6%) | 1,549 (27.8%) |
Income Above Poverty by Sex and Age in Sebring
According to the poverty statistics in Sebring, males aged 75 years and over and females aged 75 years and over are the age groups that are most secure financially, with 96.0% of males and 94.4% of females in these age groups living above the poverty line.
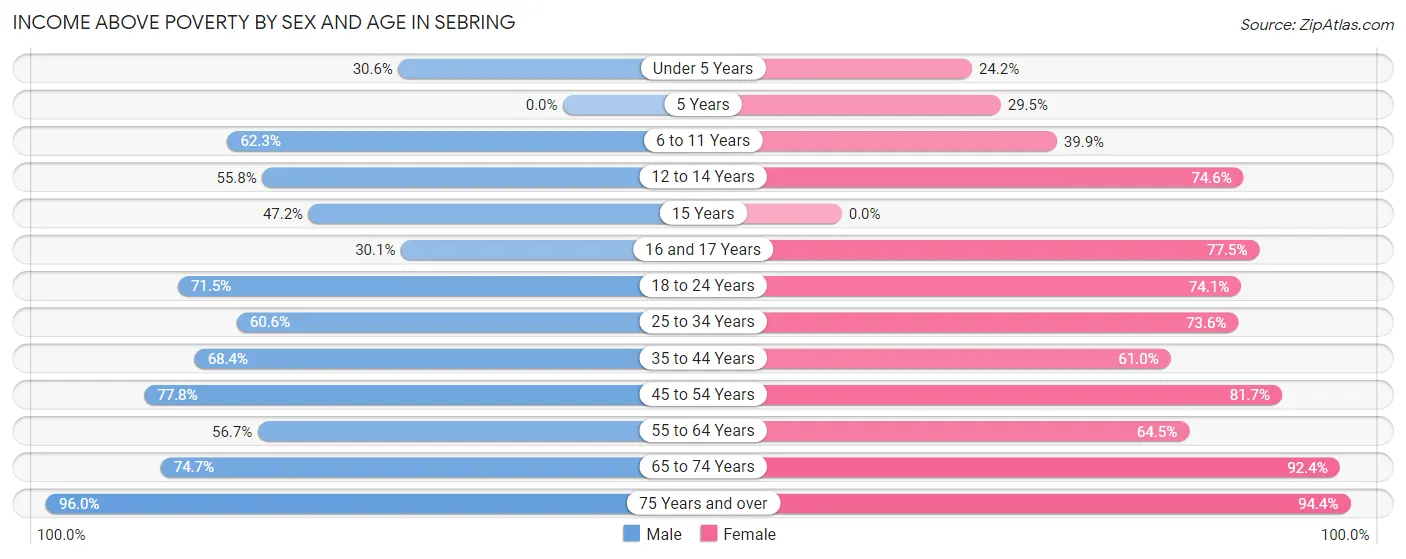
| Age Bracket | Male | Female |
| Under 5 Years | 22 (30.6%) | 80 (24.2%) |
| 5 Years | 0 (0.0%) | 18 (29.5%) |
| 6 to 11 Years | 149 (62.3%) | 121 (39.9%) |
| 12 to 14 Years | 67 (55.8%) | 214 (74.6%) |
| 15 Years | 34 (47.2%) | 0 (0.0%) |
| 16 and 17 Years | 34 (30.1%) | 93 (77.5%) |
| 18 to 24 Years | 387 (71.5%) | 335 (74.1%) |
| 25 to 34 Years | 226 (60.6%) | 398 (73.6%) |
| 35 to 44 Years | 481 (68.4%) | 424 (61.0%) |
| 45 to 54 Years | 388 (77.8%) | 521 (81.7%) |
| 55 to 64 Years | 289 (56.7%) | 408 (64.4%) |
| 65 to 74 Years | 570 (74.7%) | 714 (92.4%) |
| 75 Years and over | 647 (96.0%) | 689 (94.4%) |
| Total | 3,294 (70.4%) | 4,015 (72.2%) |
Income Below Poverty Among Married-Couple Families in Sebring
The poverty statistics for married-couple families in Sebring show that 14.0% or 222 of the total 1,585 families live below the poverty line. Families with 5 or more children have the highest poverty rate of 100.0%, comprising of 29 families. On the other hand, families with no children have the lowest poverty rate of 1.4%, which includes 15 families.
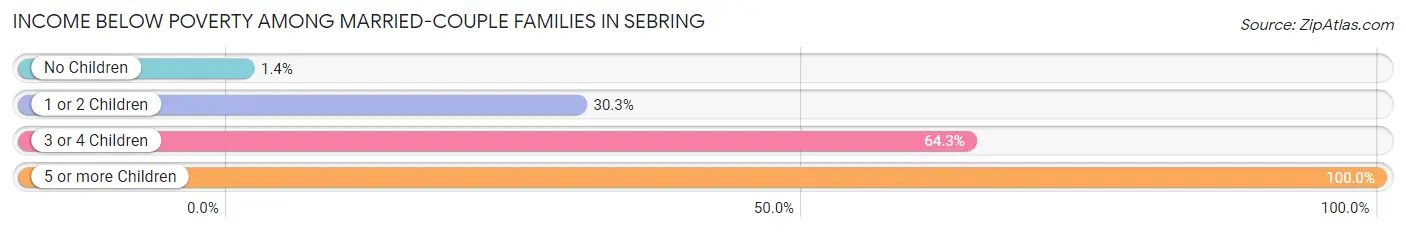
| Children | Above Poverty | Below Poverty |
| No Children | 1,064 (98.6%) | 15 (1.4%) |
| 1 or 2 Children | 264 (69.7%) | 115 (30.3%) |
| 3 or 4 Children | 35 (35.7%) | 63 (64.3%) |
| 5 or more Children | 0 (0.0%) | 29 (100.0%) |
| Total | 1,363 (86.0%) | 222 (14.0%) |
Income Below Poverty Among Single-Parent Households in Sebring
According to the poverty data in Sebring, 36.1% or 105 single-father households and 20.7% or 116 single-mother households are living below the poverty line. Among single-father households, those with 1 or 2 children have the highest poverty rate, with 44 households (42.3%) experiencing poverty. Likewise, among single-mother households, those with 3 or 4 children have the highest poverty rate, with 49 households (90.7%) falling below the poverty line.
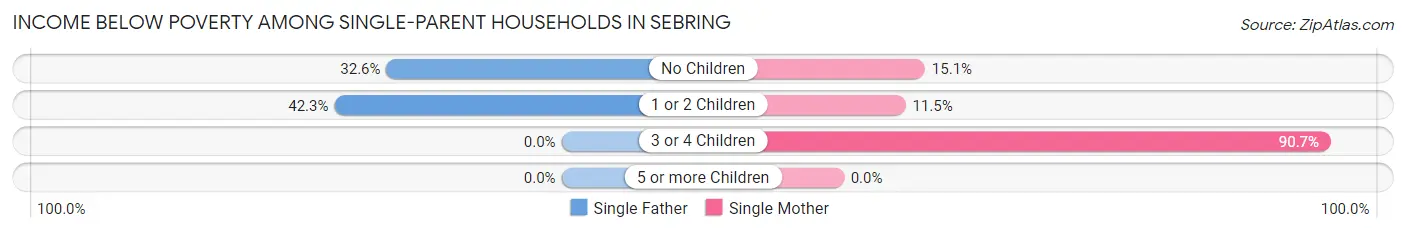
| Children | Single Father | Single Mother |
| No Children | 61 (32.6%) | 36 (15.1%) |
| 1 or 2 Children | 44 (42.3%) | 31 (11.5%) |
| 3 or 4 Children | 0 (0.0%) | 49 (90.7%) |
| 5 or more Children | 0 (0.0%) | 0 (0.0%) |
| Total | 105 (36.1%) | 116 (20.7%) |
Income Below Poverty Among Married-Couple vs Single-Parent Households in Sebring
The poverty data for Sebring shows that 222 of the married-couple family households (14.0%) and 221 of the single-parent households (25.9%) are living below the poverty level. Within the married-couple family households, those with 5 or more children have the highest poverty rate, with 29 households (100.0%) falling below the poverty line. Among the single-parent households, those with 3 or 4 children have the highest poverty rate, with 49 household (90.7%) living below poverty.
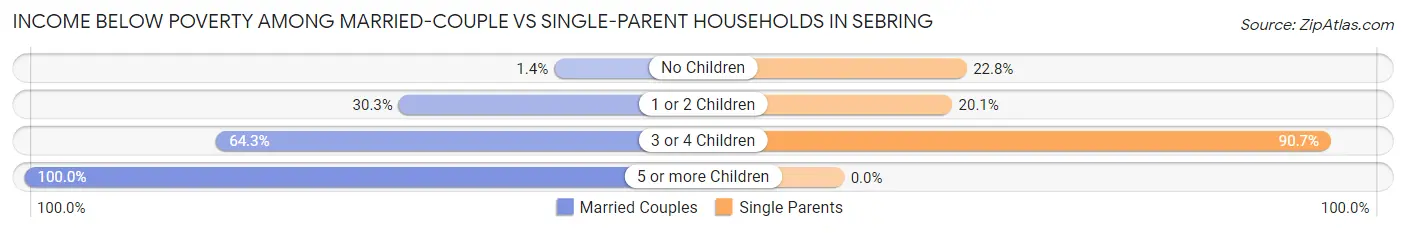
| Children | Married-Couple Families | Single-Parent Households |
| No Children | 15 (1.4%) | 97 (22.8%) |
| 1 or 2 Children | 115 (30.3%) | 75 (20.1%) |
| 3 or 4 Children | 63 (64.3%) | 49 (90.7%) |
| 5 or more Children | 29 (100.0%) | 0 (0.0%) |
| Total | 222 (14.0%) | 221 (25.9%) |
Race in Sebring
The most populous races in Sebring are White / Caucasian (7,189 | 65.3%), Hispanic or Latino (2,476 | 22.5%), and Black / African American (2,117 | 19.2%).
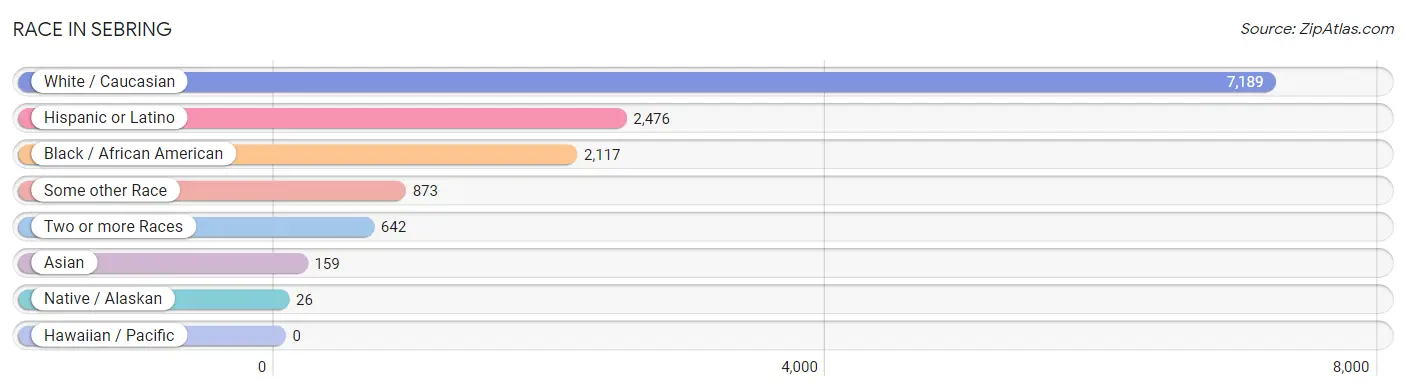
| Race | # Population | % Population |
| Asian | 159 | 1.4% |
| Black / African American | 2,117 | 19.2% |
| Hawaiian / Pacific | 0 | 0.0% |
| Hispanic or Latino | 2,476 | 22.5% |
| Native / Alaskan | 26 | 0.2% |
| White / Caucasian | 7,189 | 65.3% |
| Two or more Races | 642 | 5.8% |
| Some other Race | 873 | 7.9% |
| Total | 11,006 | 100.0% |
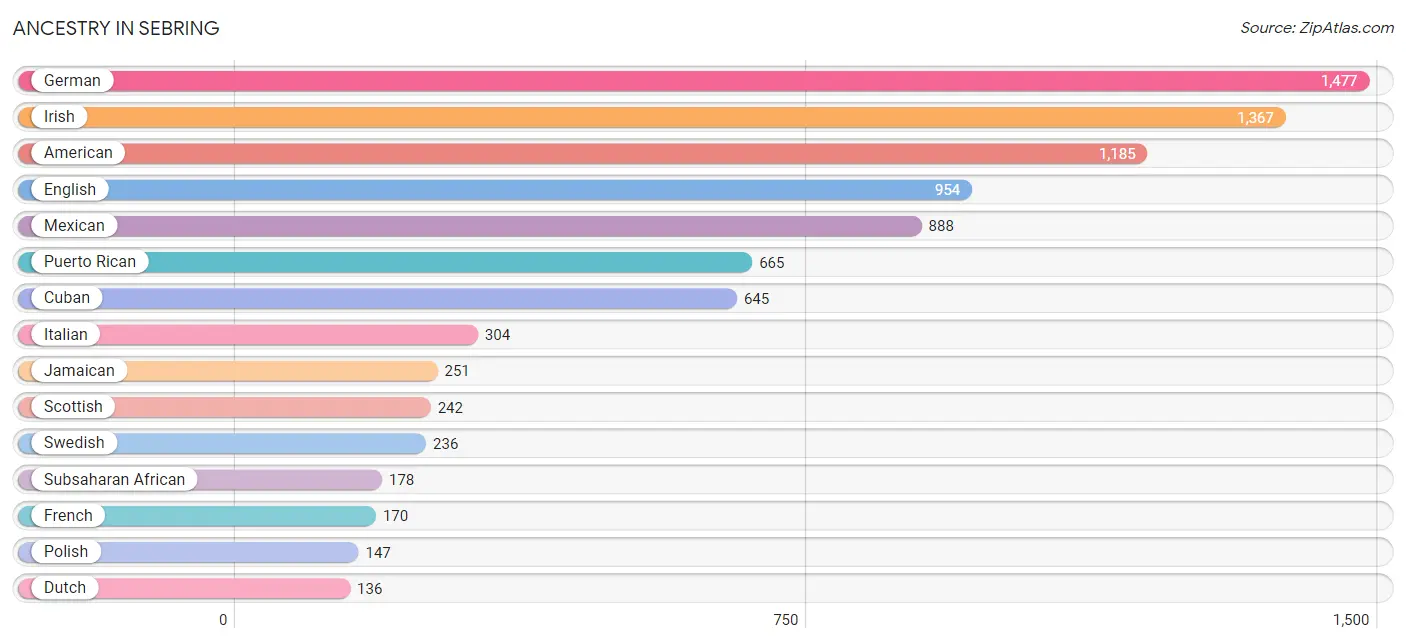
Ancestry in Sebring
The most populous ancestries reported in Sebring are German (1,477 | 13.4%), Irish (1,367 | 12.4%), American (1,185 | 10.8%), English (954 | 8.7%), and Mexican (888 | 8.1%), together accounting for 53.4% of all Sebring residents.
| Ancestry | # Population | % Population |
| African | 116 | 1.1% |
| American | 1,185 | 10.8% |
| Arab | 4 | 0.0% |
| Argentinean | 10 | 0.1% |
| Blackfeet | 8 | 0.1% |
| Brazilian | 42 | 0.4% |
| British | 67 | 0.6% |
| Burmese | 52 | 0.5% |
| Canadian | 11 | 0.1% |
| Central American | 108 | 1.0% |
| Cherokee | 8 | 0.1% |
| Colombian | 42 | 0.4% |
| Cuban | 645 | 5.9% |
| Dominican | 60 | 0.5% |
| Dutch | 136 | 1.2% |
| English | 954 | 8.7% |
| European | 53 | 0.5% |
| Finnish | 17 | 0.2% |
| French | 170 | 1.5% |
| French Canadian | 104 | 0.9% |
| German | 1,477 | 13.4% |
| Greek | 45 | 0.4% |
| Haitian | 15 | 0.1% |
| Honduran | 7 | 0.1% |
| Hungarian | 19 | 0.2% |
| Indian (Asian) | 89 | 0.8% |
| Irish | 1,367 | 12.4% |
| Israeli | 8 | 0.1% |
| Italian | 304 | 2.8% |
| Jamaican | 251 | 2.3% |
| Korean | 24 | 0.2% |
| Lebanese | 4 | 0.0% |
| Lithuanian | 5 | 0.1% |
| Mexican | 888 | 8.1% |
| Nigerian | 57 | 0.5% |
| Northern European | 5 | 0.1% |
| Norwegian | 13 | 0.1% |
| Panamanian | 82 | 0.7% |
| Peruvian | 11 | 0.1% |
| Polish | 147 | 1.3% |
| Portuguese | 13 | 0.1% |
| Potawatomi | 7 | 0.1% |
| Puerto Rican | 665 | 6.0% |
| Russian | 10 | 0.1% |
| Salvadoran | 19 | 0.2% |
| Scandinavian | 27 | 0.3% |
| Scotch-Irish | 55 | 0.5% |
| Scottish | 242 | 2.2% |
| Slovak | 15 | 0.1% |
| South African | 5 | 0.1% |
| South American | 78 | 0.7% |
| South American Indian | 11 | 0.1% |
| Spanish | 18 | 0.2% |
| Sri Lankan | 7 | 0.1% |
| Subsaharan African | 178 | 1.6% |
| Swedish | 236 | 2.1% |
| Swiss | 10 | 0.1% |
| Thai | 39 | 0.4% |
| Uruguayan | 15 | 0.1% |
| Welsh | 59 | 0.5% | View All 60 Rows |
Immigrants in Sebring
The most numerous immigrant groups reported in Sebring came from Latin America (998 | 9.1%), Caribbean (553 | 5.0%), Cuba (474 | 4.3%), Central America (354 | 3.2%), and Mexico (339 | 3.1%), together accounting for 24.7% of all Sebring residents.
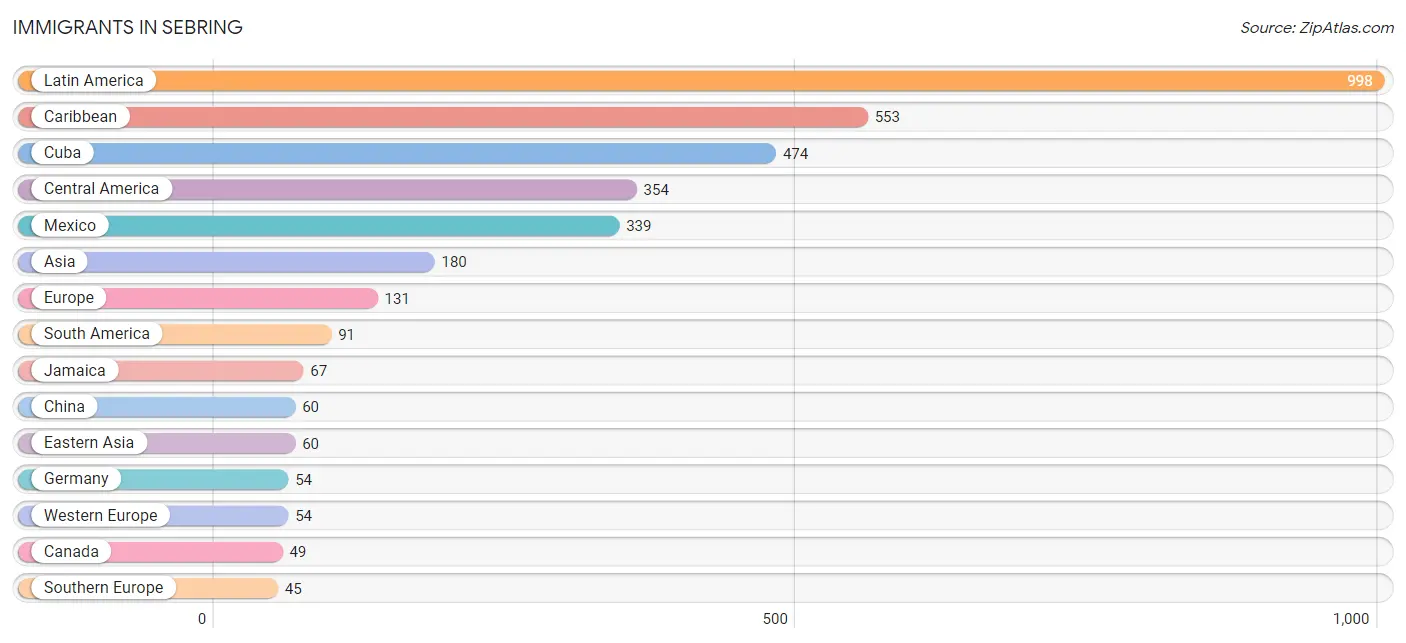
| Immigration Origin | # Population | % Population |
| Asia | 180 | 1.6% |
| Canada | 49 | 0.4% |
| Caribbean | 553 | 5.0% |
| Central America | 354 | 3.2% |
| China | 60 | 0.5% |
| Colombia | 38 | 0.4% |
| Cuba | 474 | 4.3% |
| Eastern Asia | 60 | 0.5% |
| Europe | 131 | 1.2% |
| Germany | 54 | 0.5% |
| Greece | 38 | 0.4% |
| Haiti | 12 | 0.1% |
| Honduras | 7 | 0.1% |
| India | 35 | 0.3% |
| Jamaica | 67 | 0.6% |
| Latin America | 998 | 9.1% |
| Mexico | 339 | 3.1% |
| Northern Europe | 32 | 0.3% |
| Norway | 8 | 0.1% |
| Panama | 8 | 0.1% |
| Peru | 11 | 0.1% |
| Philippines | 24 | 0.2% |
| Portugal | 7 | 0.1% |
| South America | 91 | 0.8% |
| South Central Asia | 35 | 0.3% |
| South Eastern Asia | 31 | 0.3% |
| Southern Europe | 45 | 0.4% |
| Uruguay | 27 | 0.3% |
| Venezuela | 15 | 0.1% |
| Vietnam | 7 | 0.1% |
| Western Europe | 54 | 0.5% | View All 31 Rows |
Sex and Age in Sebring
Sex and Age in Sebring
The most populous age groups in Sebring are 40 to 44 Years (456 | 8.9%) for men and 65 to 69 Years (488 | 8.3%) for women.
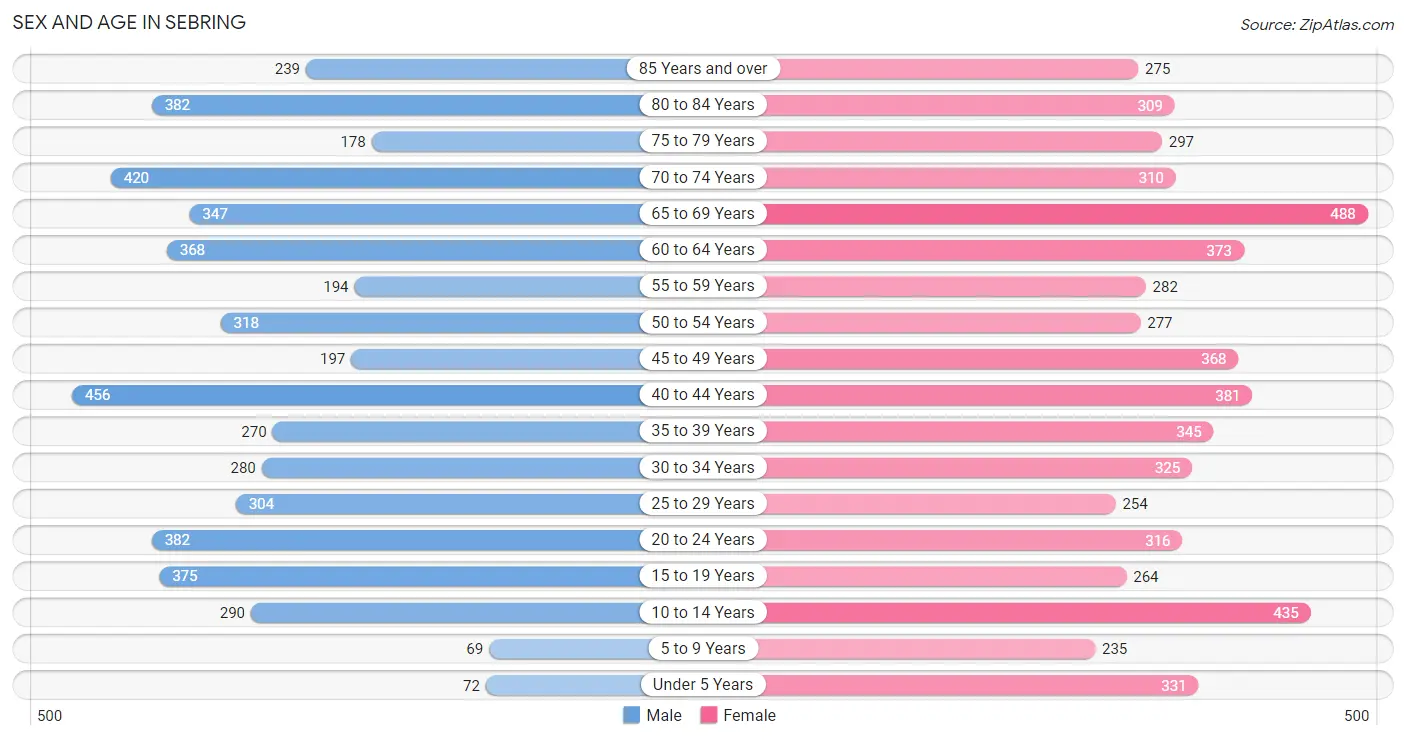
| Age Bracket | Male | Female |
| Under 5 Years | 72 (1.4%) | 331 (5.6%) |
| 5 to 9 Years | 69 (1.3%) | 235 (4.0%) |
| 10 to 14 Years | 290 (5.6%) | 435 (7.4%) |
| 15 to 19 Years | 375 (7.3%) | 264 (4.5%) |
| 20 to 24 Years | 382 (7.4%) | 316 (5.4%) |
| 25 to 29 Years | 304 (5.9%) | 254 (4.3%) |
| 30 to 34 Years | 280 (5.4%) | 325 (5.5%) |
| 35 to 39 Years | 270 (5.2%) | 345 (5.9%) |
| 40 to 44 Years | 456 (8.9%) | 381 (6.5%) |
| 45 to 49 Years | 197 (3.8%) | 368 (6.3%) |
| 50 to 54 Years | 318 (6.2%) | 277 (4.7%) |
| 55 to 59 Years | 194 (3.8%) | 282 (4.8%) |
| 60 to 64 Years | 368 (7.2%) | 373 (6.4%) |
| 65 to 69 Years | 347 (6.8%) | 488 (8.3%) |
| 70 to 74 Years | 420 (8.2%) | 310 (5.3%) |
| 75 to 79 Years | 178 (3.5%) | 297 (5.1%) |
| 80 to 84 Years | 382 (7.4%) | 309 (5.3%) |
| 85 Years and over | 239 (4.6%) | 275 (4.7%) |
| Total | 5,141 (100.0%) | 5,865 (100.0%) |
Families and Households in Sebring
Median Family Size in Sebring
The median family size in Sebring is 2.93 persons per family, with single female/mother families (561 | 23.0%) accounting for the largest median family size of 3.07 persons per family. On the other hand, single male/father families (291 | 11.9%) represent the smallest median family size with 2.17 persons per family.
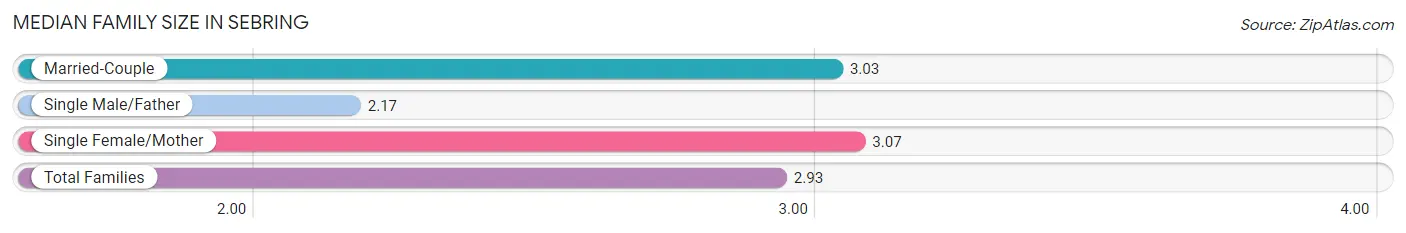
| Family Type | # Families | Family Size |
| Married-Couple | 1,585 (65.0%) | 3.03 |
| Single Male/Father | 291 (11.9%) | 2.17 |
| Single Female/Mother | 561 (23.0%) | 3.07 |
| Total Families | 2,437 (100.0%) | 2.93 |
Median Household Size in Sebring
The median household size in Sebring is 2.14 persons per household, with single female/mother households (561 | 11.8%) accounting for the largest median household size of 3.21 persons per household. non-family households (2,322 | 48.8%) represent the smallest median household size with 1.23 persons per household.
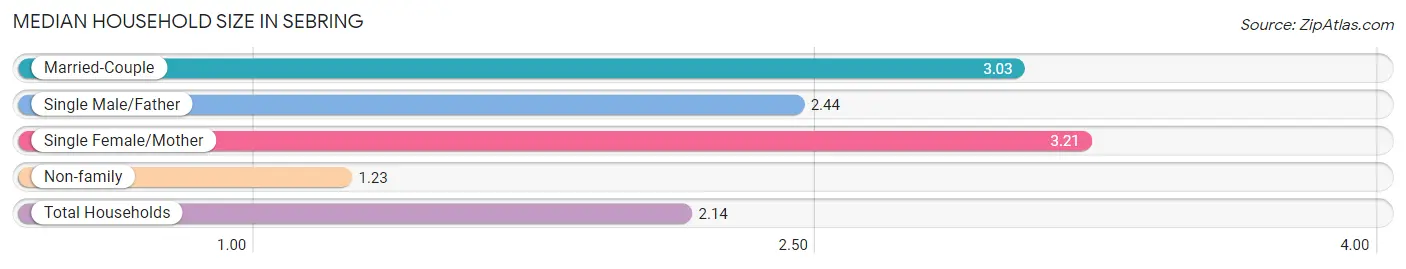
| Household Type | # Households | Household Size |
| Married-Couple | 1,585 (33.3%) | 3.03 |
| Single Male/Father | 291 (6.1%) | 2.44 |
| Single Female/Mother | 561 (11.8%) | 3.21 |
| Non-family | 2,322 (48.8%) | 1.23 |
| Total Households | 4,759 (100.0%) | 2.14 |
Household Size by Marriage Status in Sebring
Out of a total of 4,759 households in Sebring, 2,437 (51.2%) are family households, while 2,322 (48.8%) are nonfamily households. The most numerous type of family households are 2-person households, comprising 1,279, and the most common type of nonfamily households are 1-person households, comprising 1,923.
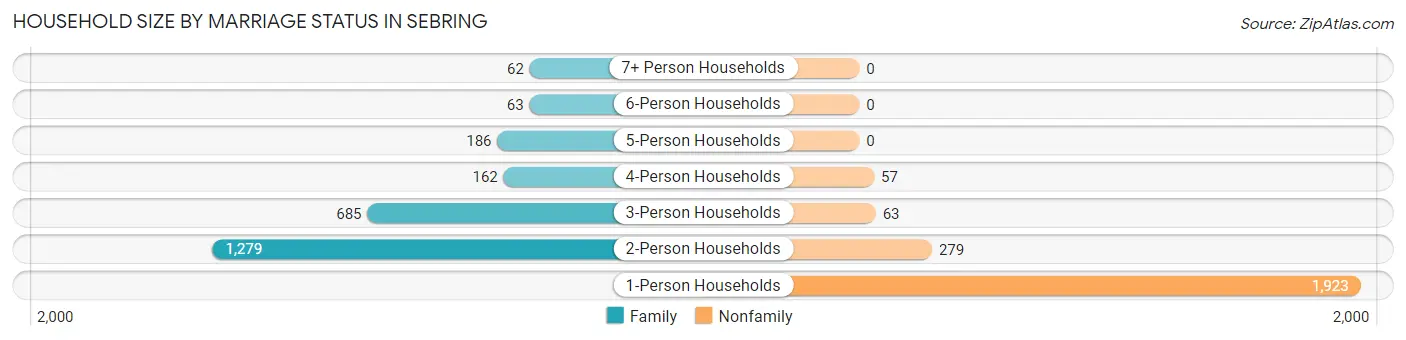
| Household Size | Family Households | Nonfamily Households |
| 1-Person Households | - | 1,923 (40.4%) |
| 2-Person Households | 1,279 (26.9%) | 279 (5.9%) |
| 3-Person Households | 685 (14.4%) | 63 (1.3%) |
| 4-Person Households | 162 (3.4%) | 57 (1.2%) |
| 5-Person Households | 186 (3.9%) | 0 (0.0%) |
| 6-Person Households | 63 (1.3%) | 0 (0.0%) |
| 7+ Person Households | 62 (1.3%) | 0 (0.0%) |
| Total | 2,437 (51.2%) | 2,322 (48.8%) |
Female Fertility in Sebring
Fertility by Age in Sebring
Average fertility rate in Sebring is 46.0 births per 1,000 women. Women in the age bracket of 20 to 34 years have the highest fertility rate with 86.0 births per 1,000 women. Women in the age bracket of 20 to 34 years acount for 73.3% of all women with births.
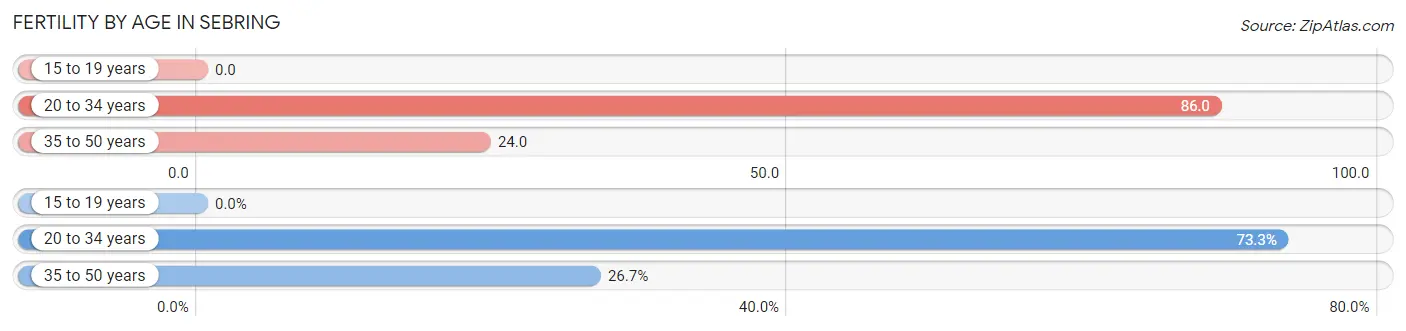
| Age Bracket | Women with Births | Births / 1,000 Women |
| 15 to 19 years | 0 (0.0%) | 0.0 |
| 20 to 34 years | 77 (73.3%) | 86.0 |
| 35 to 50 years | 28 (26.7%) | 24.0 |
| Total | 105 (100.0%) | 46.0 |
Fertility by Age by Marriage Status in Sebring
76.2% of women with births (105) in Sebring are married. The highest percentage of unmarried women with births falls into 20 to 34 years age bracket with 32.5% of them unmarried at the time of birth, while the lowest percentage of unmarried women with births belong to 35 to 50 years age bracket with 0.0% of them unmarried.
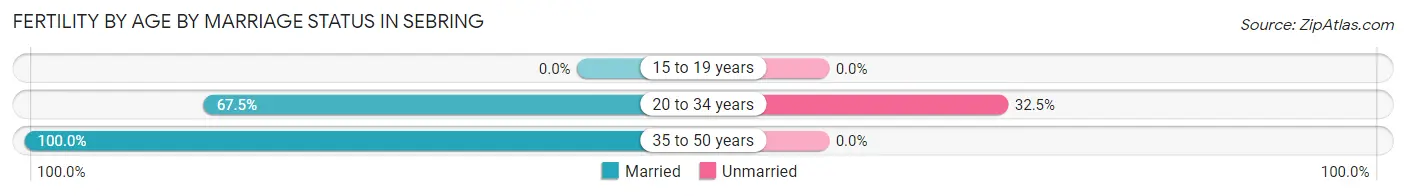
| Age Bracket | Married | Unmarried |
| 15 to 19 years | 0 (0.0%) | 0 (0.0%) |
| 20 to 34 years | 52 (67.5%) | 25 (32.5%) |
| 35 to 50 years | 28 (100.0%) | 0 (0.0%) |
| Total | 80 (76.2%) | 25 (23.8%) |
Fertility by Education in Sebring
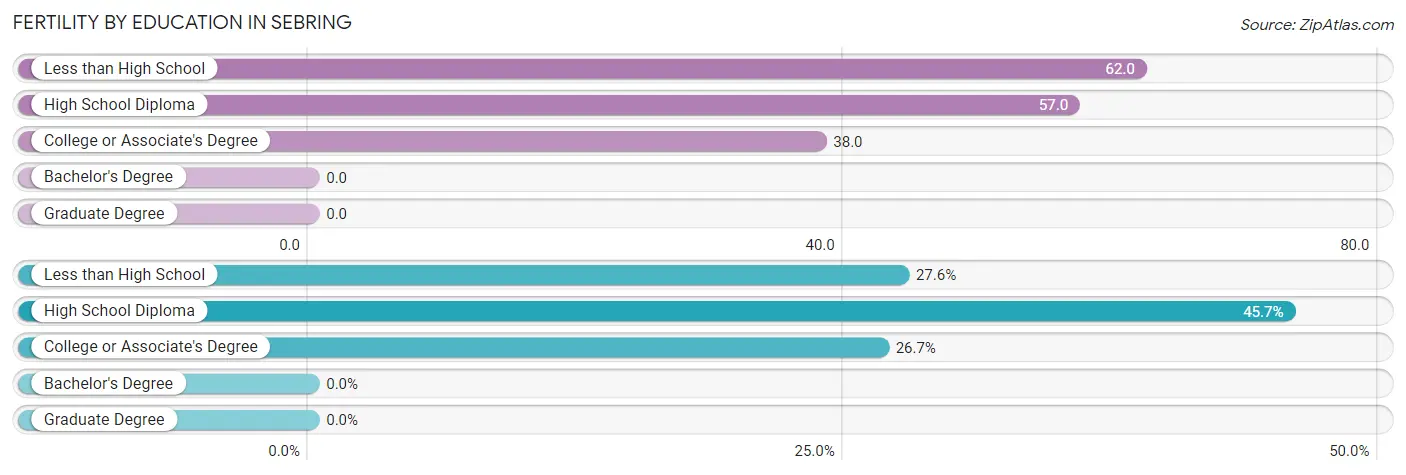
| Educational Attainment | Women with Births | Births / 1,000 Women |
| Less than High School | 29 (27.6%) | 62.0 |
| High School Diploma | 48 (45.7%) | 57.0 |
| College or Associate's Degree | 28 (26.7%) | 38.0 |
| Bachelor's Degree | 0 (0.0%) | 0.0 |
| Graduate Degree | 0 (0.0%) | 0.0 |
| Total | 105 (100.0%) | 46.0 |
Fertility by Education by Marriage Status in Sebring
23.8% of women with births in Sebring are unmarried. Women with the educational attainment of less than high school are most likely to be married with 100.0% of them married at childbirth, while women with the educational attainment of high school diploma are least likely to be married with 52.1% of them unmarried at childbirth.
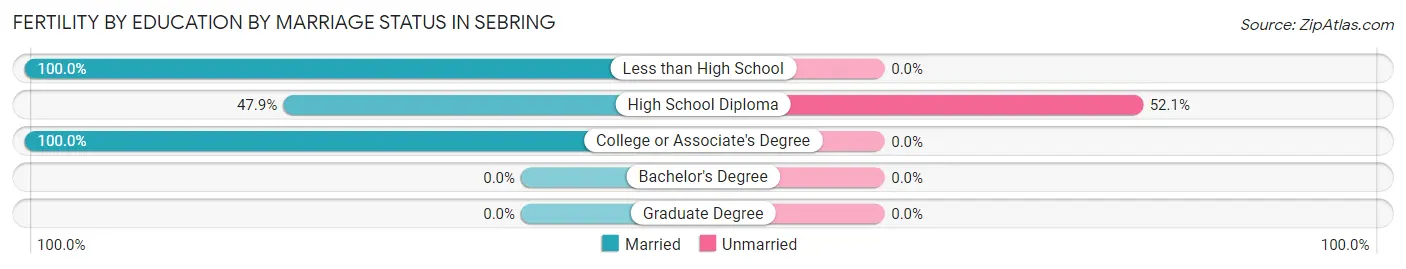
| Educational Attainment | Married | Unmarried |
| Less than High School | 29 (100.0%) | 0 (0.0%) |
| High School Diploma | 23 (47.9%) | 25 (52.1%) |
| College or Associate's Degree | 28 (100.0%) | 0 (0.0%) |
| Bachelor's Degree | 0 (0.0%) | 0 (0.0%) |
| Graduate Degree | 0 (0.0%) | 0 (0.0%) |
| Total | 80 (76.2%) | 25 (23.8%) |
Employment Characteristics in Sebring
Employment by Class of Employer in Sebring
Among the 3,718 employed individuals in Sebring, private company employees (2,404 | 64.7%), not-for-profit organizations (318 | 8.6%), and local government employees (264 | 7.1%) make up the most common classes of employment.
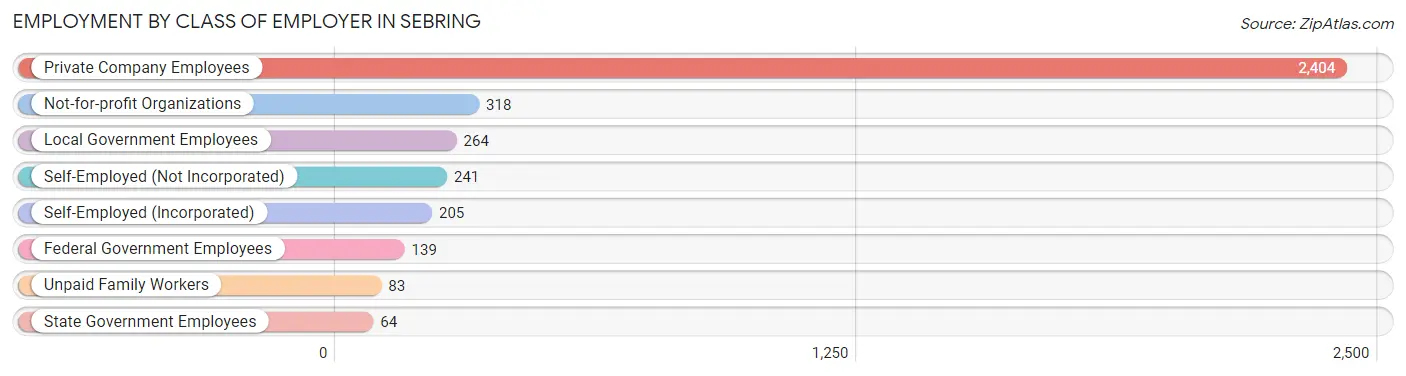
| Employer Class | # Employees | % Employees |
| Private Company Employees | 2,404 | 64.7% |
| Self-Employed (Incorporated) | 205 | 5.5% |
| Self-Employed (Not Incorporated) | 241 | 6.5% |
| Not-for-profit Organizations | 318 | 8.6% |
| Local Government Employees | 264 | 7.1% |
| State Government Employees | 64 | 1.7% |
| Federal Government Employees | 139 | 3.7% |
| Unpaid Family Workers | 83 | 2.2% |
| Total | 3,718 | 100.0% |
Employment Status by Age in Sebring
According to the labor force statistics for Sebring, out of the total population over 16 years of age (9,502), 44.9% or 4,266 individuals are in the labor force, with 12.7% or 542 of them unemployed. The age group with the highest labor force participation rate is 20 to 24 years, with 79.2% or 553 individuals in the labor force. Within the labor force, the 16 to 19 years age range has the highest percentage of unemployed individuals, with 66.2% or 190 of them being unemployed.
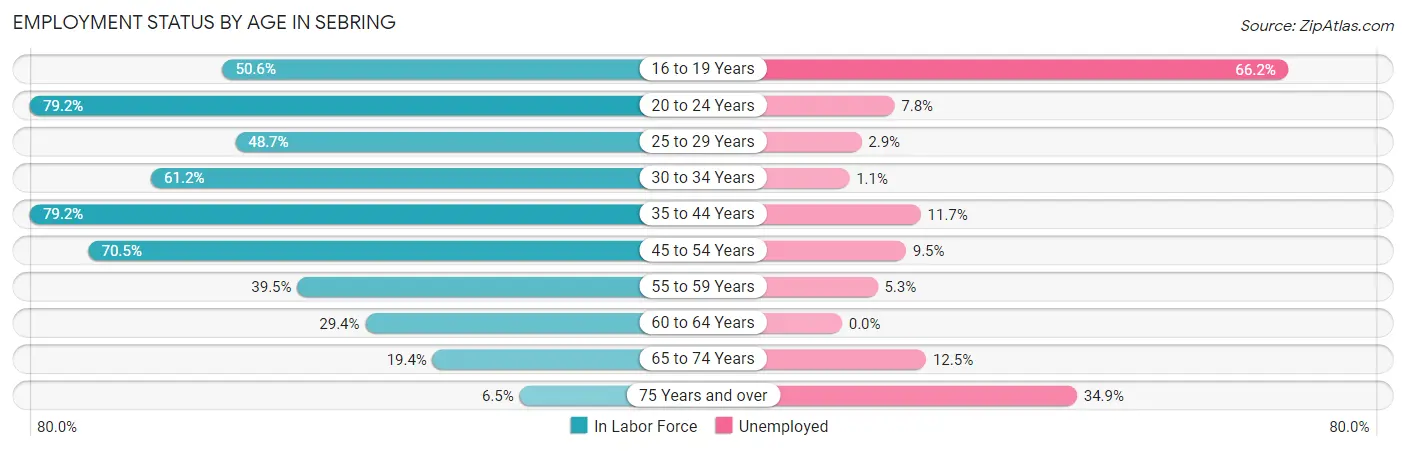
| Age Bracket | In Labor Force | Unemployed |
| 16 to 19 Years | 287 (50.6%) | 190 (66.2%) |
| 20 to 24 Years | 553 (79.2%) | 43 (7.8%) |
| 25 to 29 Years | 272 (48.7%) | 8 (2.9%) |
| 30 to 34 Years | 370 (61.2%) | 4 (1.1%) |
| 35 to 44 Years | 1,150 (79.2%) | 135 (11.7%) |
| 45 to 54 Years | 818 (70.5%) | 78 (9.5%) |
| 55 to 59 Years | 188 (39.5%) | 10 (5.3%) |
| 60 to 64 Years | 218 (29.4%) | 0 (0.0%) |
| 65 to 74 Years | 304 (19.4%) | 38 (12.5%) |
| 75 Years and over | 109 (6.5%) | 38 (34.9%) |
| Total | 4,266 (44.9%) | 542 (12.7%) |
Employment Status by Educational Attainment in Sebring
According to labor force statistics for Sebring, 60.4% of individuals (3,015) out of the total population between 25 and 64 years of age (4,992) are in the labor force, with 7.8% or 235 of them being unemployed. The group with the highest labor force participation rate are those with the educational attainment of bachelor's degree or higher, with 88.5% or 609 individuals in the labor force. Within the labor force, individuals with less than high school education have the highest percentage of unemployment, with 12.9% or 64 of them being unemployed.
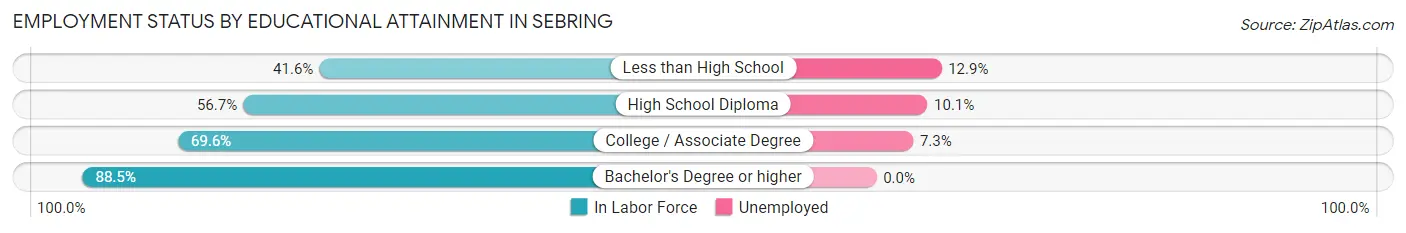
| Educational Attainment | In Labor Force | Unemployed |
| Less than High School | 498 (41.6%) | 154 (12.9%) |
| High School Diploma | 1,112 (56.7%) | 198 (10.1%) |
| College / Associate Degree | 798 (69.6%) | 84 (7.3%) |
| Bachelor's Degree or higher | 609 (88.5%) | 0 (0.0%) |
| Total | 3,015 (60.4%) | 389 (7.8%) |
Employment Occupations by Sex in Sebring
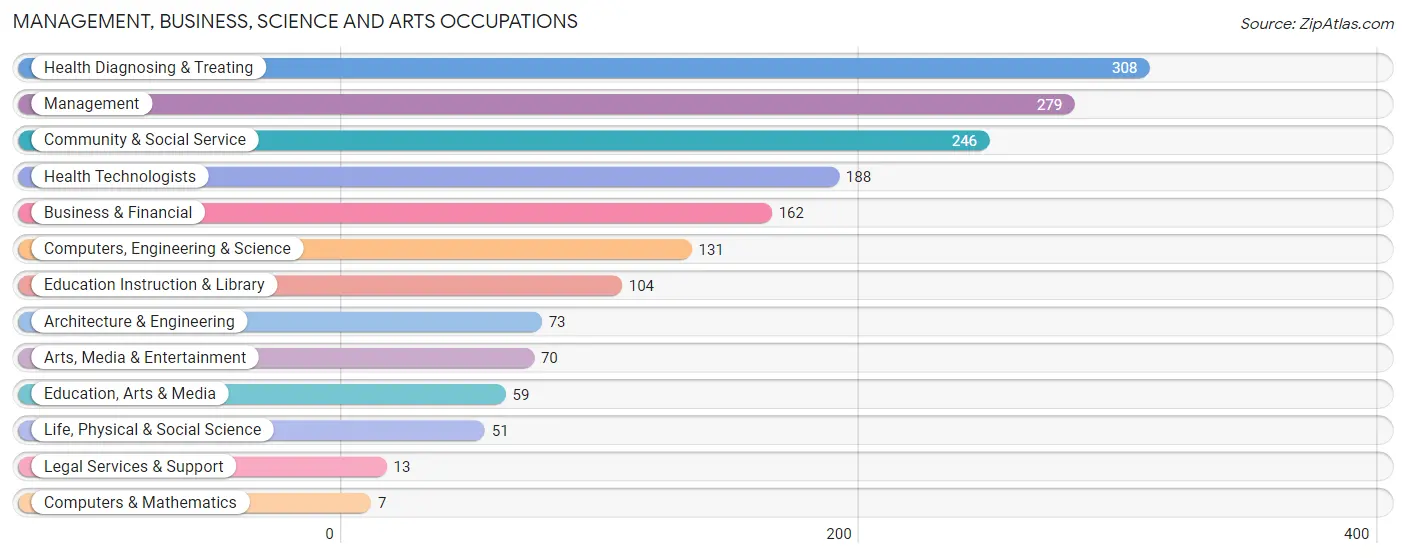
Management, Business, Science and Arts Occupations
The most common Management, Business, Science and Arts occupations in Sebring are Health Diagnosing & Treating (308 | 8.3%), Management (279 | 7.5%), Community & Social Service (246 | 6.6%), Health Technologists (188 | 5.1%), and Business & Financial (162 | 4.3%).
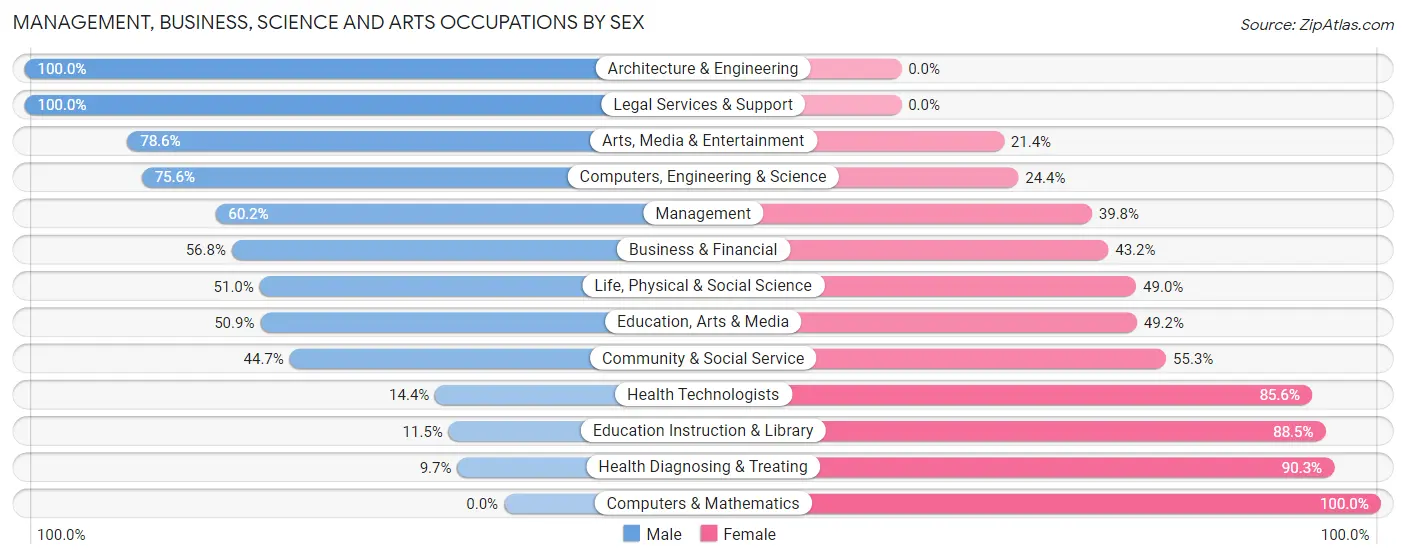
Management, Business, Science and Arts Occupations by Sex
Within the Management, Business, Science and Arts occupations in Sebring, the most male-oriented occupations are Architecture & Engineering (100.0%), Legal Services & Support (100.0%), and Arts, Media & Entertainment (78.6%), while the most female-oriented occupations are Computers & Mathematics (100.0%), Health Diagnosing & Treating (90.3%), and Education Instruction & Library (88.5%).
| Occupation | Male | Female |
| Management | 168 (60.2%) | 111 (39.8%) |
| Business & Financial | 92 (56.8%) | 70 (43.2%) |
| Computers, Engineering & Science | 99 (75.6%) | 32 (24.4%) |
| Computers & Mathematics | 0 (0.0%) | 7 (100.0%) |
| Architecture & Engineering | 73 (100.0%) | 0 (0.0%) |
| Life, Physical & Social Science | 26 (51.0%) | 25 (49.0%) |
| Community & Social Service | 110 (44.7%) | 136 (55.3%) |
| Education, Arts & Media | 30 (50.8%) | 29 (49.1%) |
| Legal Services & Support | 13 (100.0%) | 0 (0.0%) |
| Education Instruction & Library | 12 (11.5%) | 92 (88.5%) |
| Arts, Media & Entertainment | 55 (78.6%) | 15 (21.4%) |
| Health Diagnosing & Treating | 30 (9.7%) | 278 (90.3%) |
| Health Technologists | 27 (14.4%) | 161 (85.6%) |
| Total (Category) | 499 (44.3%) | 627 (55.7%) |
| Total (Overall) | 1,818 (48.8%) | 1,908 (51.2%) |
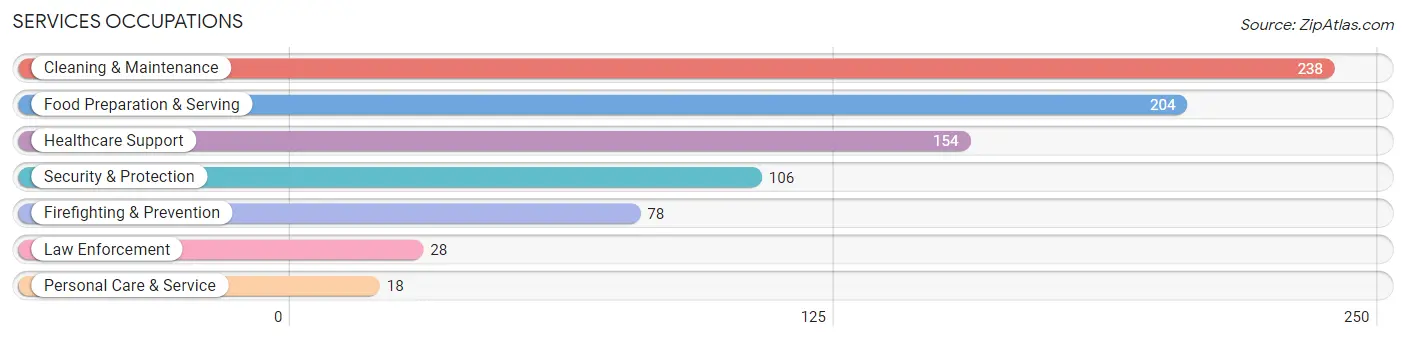
Services Occupations
The most common Services occupations in Sebring are Cleaning & Maintenance (238 | 6.4%), Food Preparation & Serving (204 | 5.5%), Healthcare Support (154 | 4.1%), Security & Protection (106 | 2.8%), and Firefighting & Prevention (78 | 2.1%).
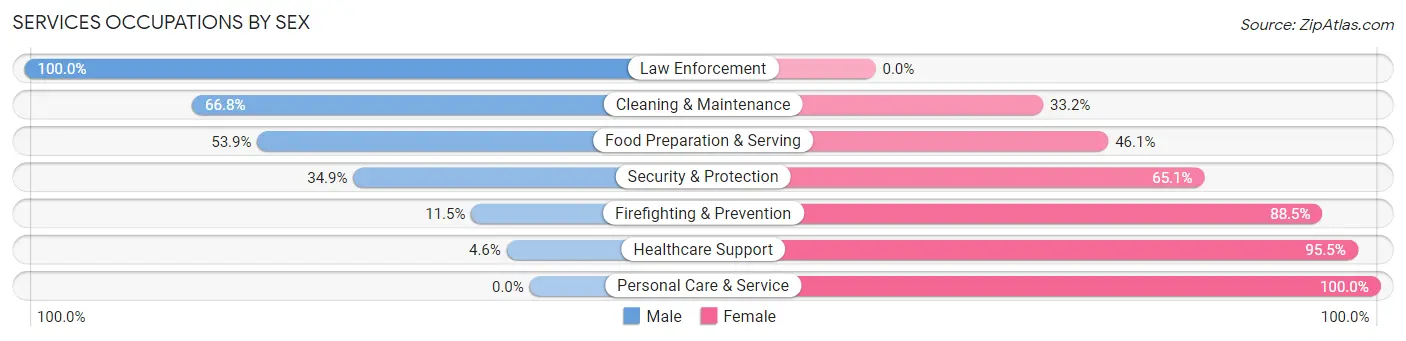
Services Occupations by Sex
Within the Services occupations in Sebring, the most male-oriented occupations are Law Enforcement (100.0%), Cleaning & Maintenance (66.8%), and Food Preparation & Serving (53.9%), while the most female-oriented occupations are Personal Care & Service (100.0%), Healthcare Support (95.5%), and Firefighting & Prevention (88.5%).
| Occupation | Male | Female |
| Healthcare Support | 7 (4.5%) | 147 (95.5%) |
| Security & Protection | 37 (34.9%) | 69 (65.1%) |
| Firefighting & Prevention | 9 (11.5%) | 69 (88.5%) |
| Law Enforcement | 28 (100.0%) | 0 (0.0%) |
| Food Preparation & Serving | 110 (53.9%) | 94 (46.1%) |
| Cleaning & Maintenance | 159 (66.8%) | 79 (33.2%) |
| Personal Care & Service | 0 (0.0%) | 18 (100.0%) |
| Total (Category) | 313 (43.5%) | 407 (56.5%) |
| Total (Overall) | 1,818 (48.8%) | 1,908 (51.2%) |
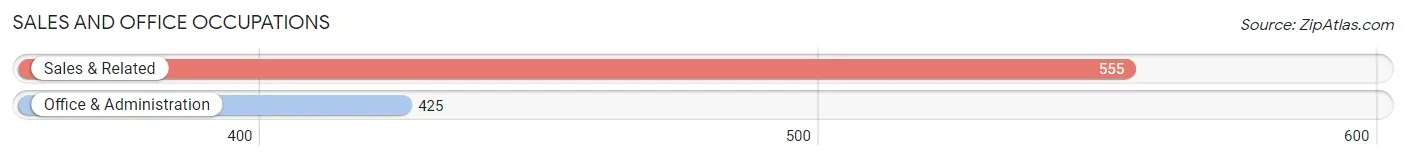
Sales and Office Occupations
The most common Sales and Office occupations in Sebring are Sales & Related (555 | 14.9%), and Office & Administration (425 | 11.4%).
Sales and Office Occupations by Sex
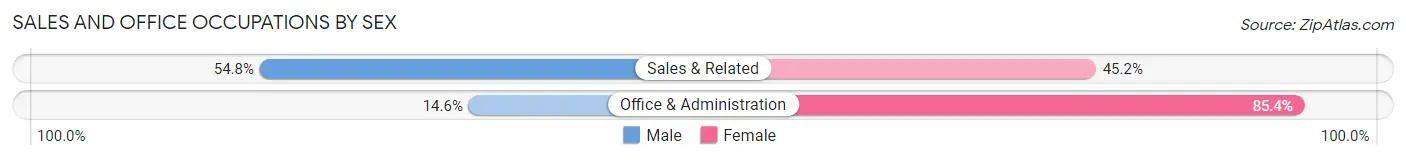
| Occupation | Male | Female |
| Sales & Related | 304 (54.8%) | 251 (45.2%) |
| Office & Administration | 62 (14.6%) | 363 (85.4%) |
| Total (Category) | 366 (37.3%) | 614 (62.6%) |
| Total (Overall) | 1,818 (48.8%) | 1,908 (51.2%) |
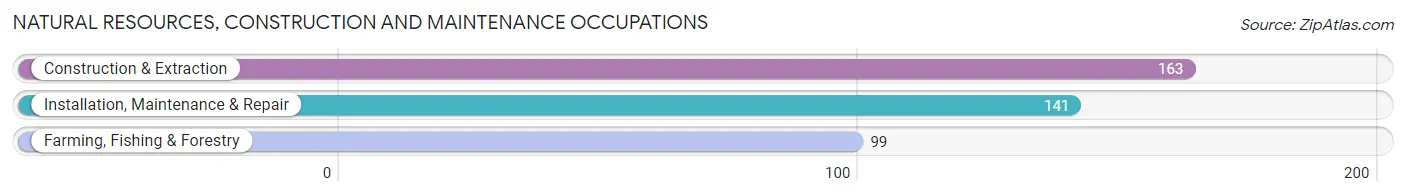
Natural Resources, Construction and Maintenance Occupations
The most common Natural Resources, Construction and Maintenance occupations in Sebring are Construction & Extraction (163 | 4.4%), Installation, Maintenance & Repair (141 | 3.8%), and Farming, Fishing & Forestry (99 | 2.7%).
Natural Resources, Construction and Maintenance Occupations by Sex
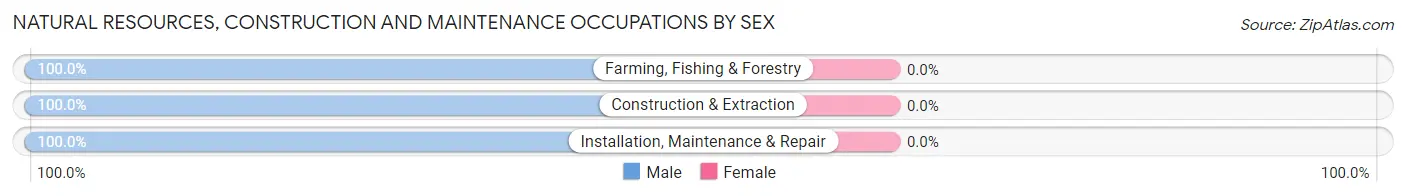
| Occupation | Male | Female |
| Farming, Fishing & Forestry | 99 (100.0%) | 0 (0.0%) |
| Construction & Extraction | 163 (100.0%) | 0 (0.0%) |
| Installation, Maintenance & Repair | 141 (100.0%) | 0 (0.0%) |
| Total (Category) | 403 (100.0%) | 0 (0.0%) |
| Total (Overall) | 1,818 (48.8%) | 1,908 (51.2%) |
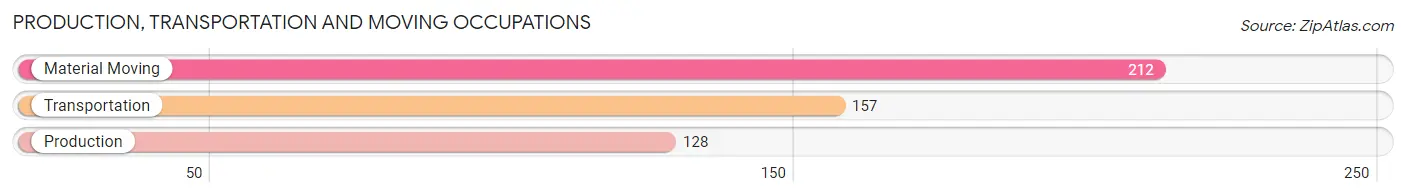
Production, Transportation and Moving Occupations
The most common Production, Transportation and Moving occupations in Sebring are Material Moving (212 | 5.7%), Transportation (157 | 4.2%), and Production (128 | 3.4%).
Production, Transportation and Moving Occupations by Sex
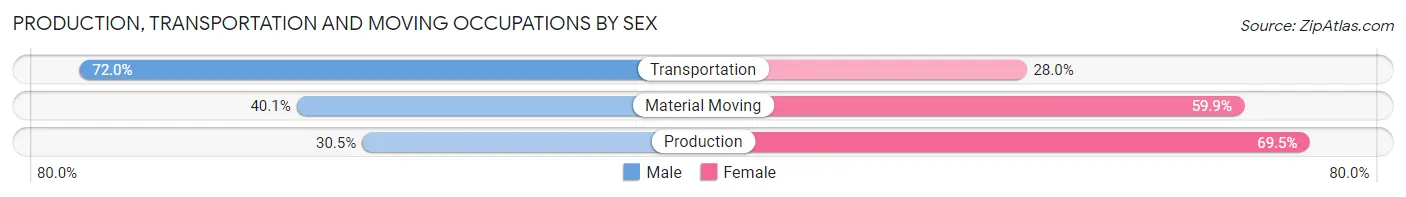
| Occupation | Male | Female |
| Production | 39 (30.5%) | 89 (69.5%) |
| Transportation | 113 (72.0%) | 44 (28.0%) |
| Material Moving | 85 (40.1%) | 127 (59.9%) |
| Total (Category) | 237 (47.7%) | 260 (52.3%) |
| Total (Overall) | 1,818 (48.8%) | 1,908 (51.2%) |
Employment Industries by Sex in Sebring
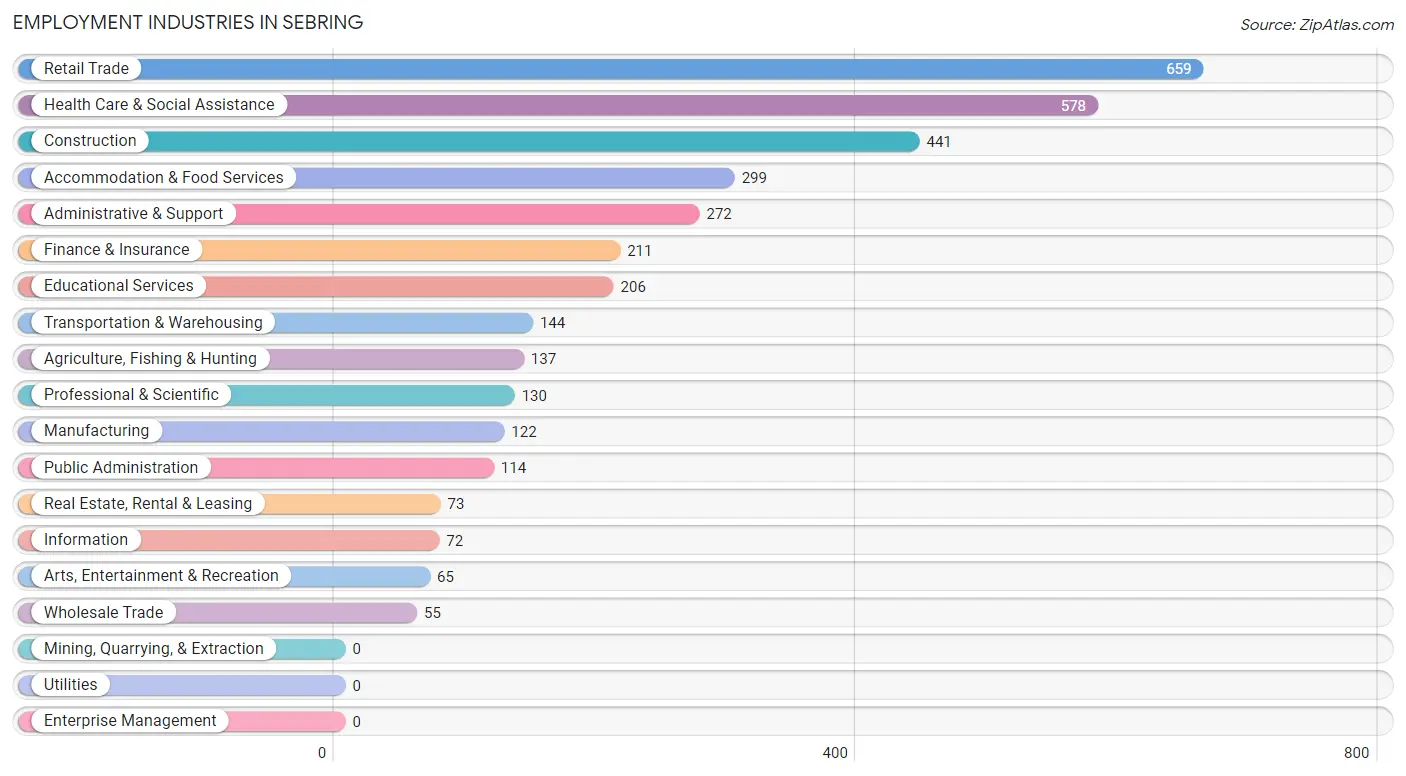
Employment Industries in Sebring
The major employment industries in Sebring include Retail Trade (659 | 17.7%), Health Care & Social Assistance (578 | 15.5%), Construction (441 | 11.8%), Accommodation & Food Services (299 | 8.0%), and Administrative & Support (272 | 7.3%).
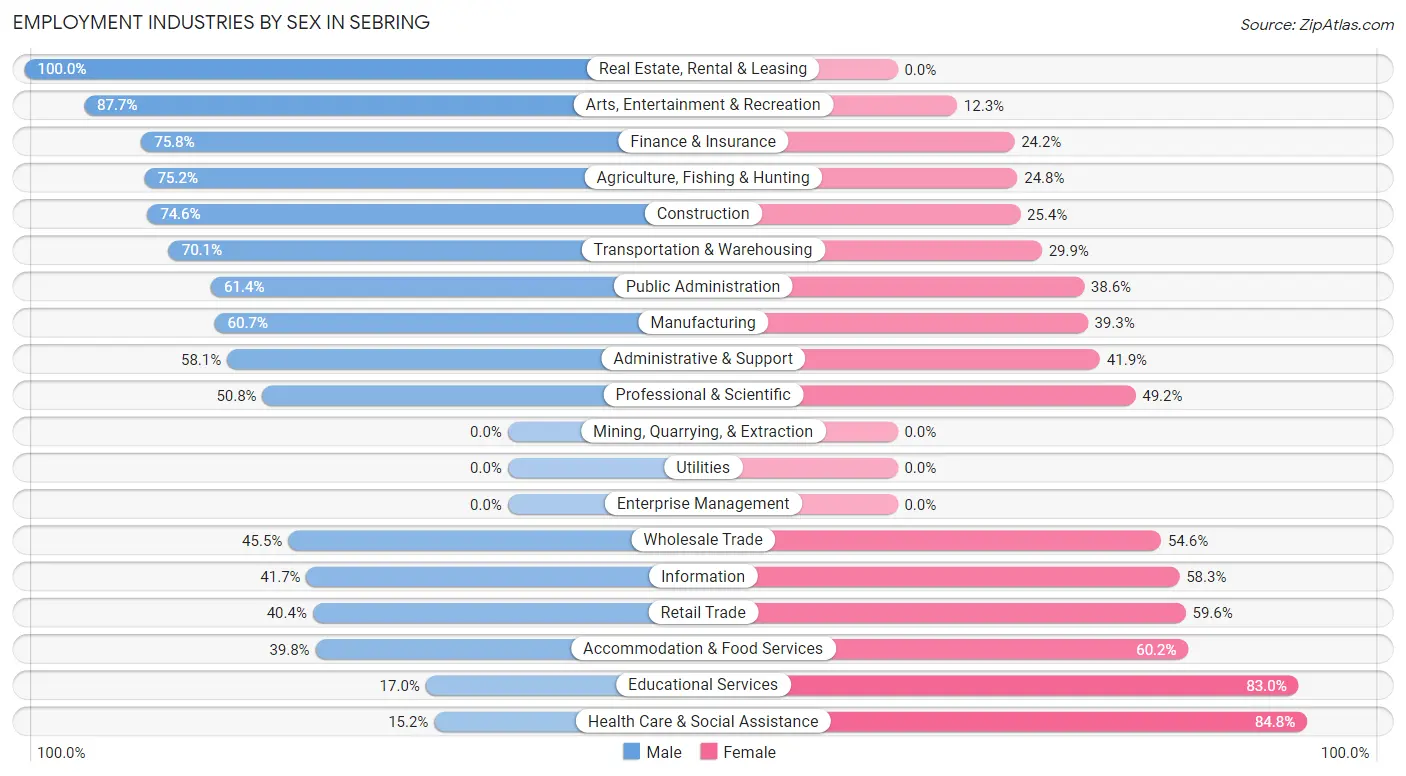
Employment Industries by Sex in Sebring
The Sebring industries that see more men than women are Real Estate, Rental & Leasing (100.0%), Arts, Entertainment & Recreation (87.7%), and Finance & Insurance (75.8%), whereas the industries that tend to have a higher number of women are Health Care & Social Assistance (84.8%), Educational Services (83.0%), and Accommodation & Food Services (60.2%).
| Industry | Male | Female |
| Agriculture, Fishing & Hunting | 103 (75.2%) | 34 (24.8%) |
| Mining, Quarrying, & Extraction | 0 (0.0%) | 0 (0.0%) |
| Construction | 329 (74.6%) | 112 (25.4%) |
| Manufacturing | 74 (60.7%) | 48 (39.3%) |
| Wholesale Trade | 25 (45.5%) | 30 (54.5%) |
| Retail Trade | 266 (40.4%) | 393 (59.6%) |
| Transportation & Warehousing | 101 (70.1%) | 43 (29.9%) |
| Utilities | 0 (0.0%) | 0 (0.0%) |
| Information | 30 (41.7%) | 42 (58.3%) |
| Finance & Insurance | 160 (75.8%) | 51 (24.2%) |
| Real Estate, Rental & Leasing | 73 (100.0%) | 0 (0.0%) |
| Professional & Scientific | 66 (50.8%) | 64 (49.2%) |
| Enterprise Management | 0 (0.0%) | 0 (0.0%) |
| Administrative & Support | 158 (58.1%) | 114 (41.9%) |
| Educational Services | 35 (17.0%) | 171 (83.0%) |
| Health Care & Social Assistance | 88 (15.2%) | 490 (84.8%) |
| Arts, Entertainment & Recreation | 57 (87.7%) | 8 (12.3%) |
| Accommodation & Food Services | 119 (39.8%) | 180 (60.2%) |
| Public Administration | 70 (61.4%) | 44 (38.6%) |
| Total | 1,818 (48.8%) | 1,908 (51.2%) |
Education in Sebring
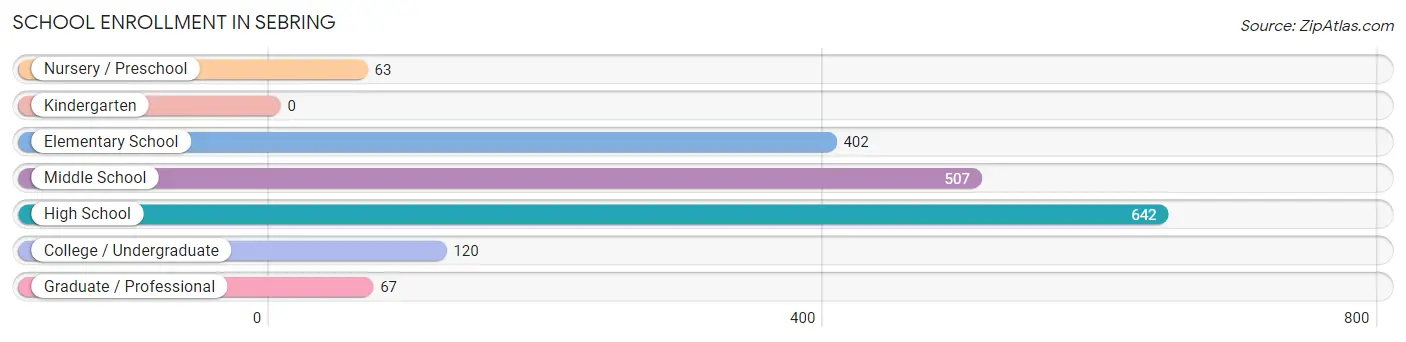
School Enrollment in Sebring
The most common levels of schooling among the 1,801 students in Sebring are high school (642 | 35.6%), middle school (507 | 28.1%), and elementary school (402 | 22.3%).
| School Level | # Students | % Students |
| Nursery / Preschool | 63 | 3.5% |
| Kindergarten | 0 | 0.0% |
| Elementary School | 402 | 22.3% |
| Middle School | 507 | 28.1% |
| High School | 642 | 35.6% |
| College / Undergraduate | 120 | 6.7% |
| Graduate / Professional | 67 | 3.7% |
| Total | 1,801 | 100.0% |
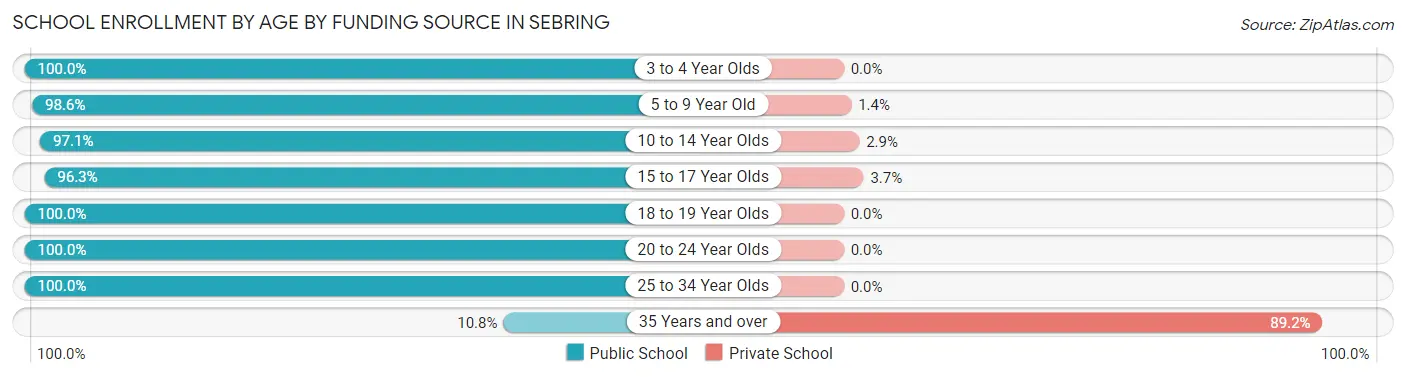
School Enrollment by Age by Funding Source in Sebring
Out of a total of 1,801 students who are enrolled in schools in Sebring, 110 (6.1%) attend a private institution, while the remaining 1,691 (93.9%) are enrolled in public schools. The age group of 35 years and over has the highest likelihood of being enrolled in private schools, with 74 (89.2% in the age bracket) enrolled. Conversely, the age group of 3 to 4 year olds has the lowest likelihood of being enrolled in a private school, with 63 (100.0% in the age bracket) attending a public institution.
| Age Bracket | Public School | Private School |
| 3 to 4 Year Olds | 63 (100.0%) | 0 (0.0%) |
| 5 to 9 Year Old | 282 (98.6%) | 4 (1.4%) |
| 10 to 14 Year Olds | 704 (97.1%) | 21 (2.9%) |
| 15 to 17 Year Olds | 287 (96.3%) | 11 (3.7%) |
| 18 to 19 Year Olds | 184 (100.0%) | 0 (0.0%) |
| 20 to 24 Year Olds | 81 (100.0%) | 0 (0.0%) |
| 25 to 34 Year Olds | 81 (100.0%) | 0 (0.0%) |
| 35 Years and over | 9 (10.8%) | 74 (89.2%) |
| Total | 1,691 (93.9%) | 110 (6.1%) |
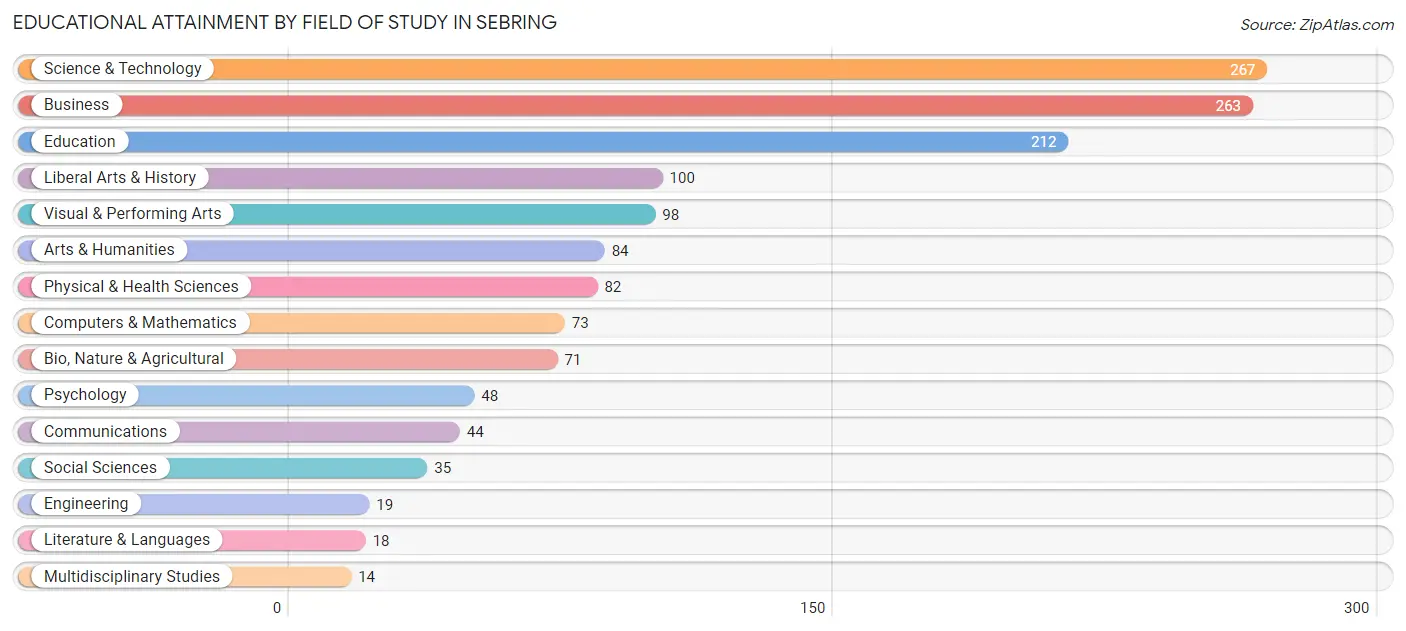
Educational Attainment by Field of Study in Sebring
Science & technology (267 | 18.7%), business (263 | 18.4%), education (212 | 14.8%), liberal arts & history (100 | 7.0%), and visual & performing arts (98 | 6.9%) are the most common fields of study among 1,428 individuals in Sebring who have obtained a bachelor's degree or higher.
| Field of Study | # Graduates | % Graduates |
| Computers & Mathematics | 73 | 5.1% |
| Bio, Nature & Agricultural | 71 | 5.0% |
| Physical & Health Sciences | 82 | 5.7% |
| Psychology | 48 | 3.4% |
| Social Sciences | 35 | 2.5% |
| Engineering | 19 | 1.3% |
| Multidisciplinary Studies | 14 | 1.0% |
| Science & Technology | 267 | 18.7% |
| Business | 263 | 18.4% |
| Education | 212 | 14.8% |
| Literature & Languages | 18 | 1.3% |
| Liberal Arts & History | 100 | 7.0% |
| Visual & Performing Arts | 98 | 6.9% |
| Communications | 44 | 3.1% |
| Arts & Humanities | 84 | 5.9% |
| Total | 1,428 | 100.0% |
Transportation & Commute in Sebring
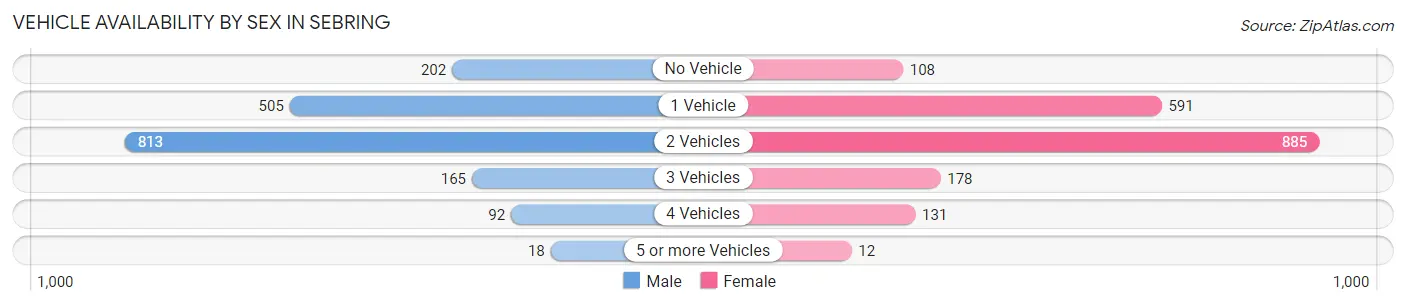
Vehicle Availability by Sex in Sebring
The most prevalent vehicle ownership categories in Sebring are males with 2 vehicles (813, accounting for 45.3%) and females with 2 vehicles (885, making up 42.7%).
| Vehicles Available | Male | Female |
| No Vehicle | 202 (11.3%) | 108 (5.7%) |
| 1 Vehicle | 505 (28.1%) | 591 (31.0%) |
| 2 Vehicles | 813 (45.3%) | 885 (46.5%) |
| 3 Vehicles | 165 (9.2%) | 178 (9.3%) |
| 4 Vehicles | 92 (5.1%) | 131 (6.9%) |
| 5 or more Vehicles | 18 (1.0%) | 12 (0.6%) |
| Total | 1,795 (100.0%) | 1,905 (100.0%) |
Commute Time in Sebring
The most frequently occuring commute durations in Sebring are 10 to 14 minutes (794 commuters, 23.0%), 15 to 19 minutes (791 commuters, 22.9%), and 5 to 9 minutes (714 commuters, 20.7%).
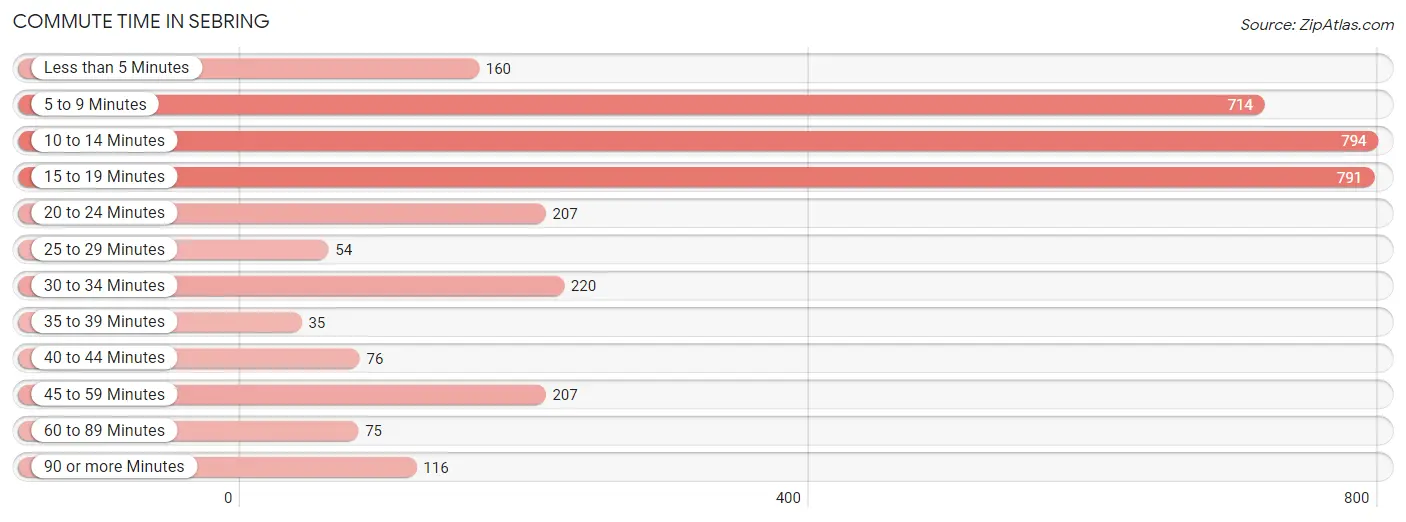
| Commute Time | # Commuters | % Commuters |
| Less than 5 Minutes | 160 | 4.6% |
| 5 to 9 Minutes | 714 | 20.7% |
| 10 to 14 Minutes | 794 | 23.0% |
| 15 to 19 Minutes | 791 | 22.9% |
| 20 to 24 Minutes | 207 | 6.0% |
| 25 to 29 Minutes | 54 | 1.6% |
| 30 to 34 Minutes | 220 | 6.4% |
| 35 to 39 Minutes | 35 | 1.0% |
| 40 to 44 Minutes | 76 | 2.2% |
| 45 to 59 Minutes | 207 | 6.0% |
| 60 to 89 Minutes | 75 | 2.2% |
| 90 or more Minutes | 116 | 3.4% |
Commute Time by Sex in Sebring
The most common commute times in Sebring are 15 to 19 minutes (330 commuters, 19.8%) for males and 10 to 14 minutes (474 commuters, 26.5%) for females.
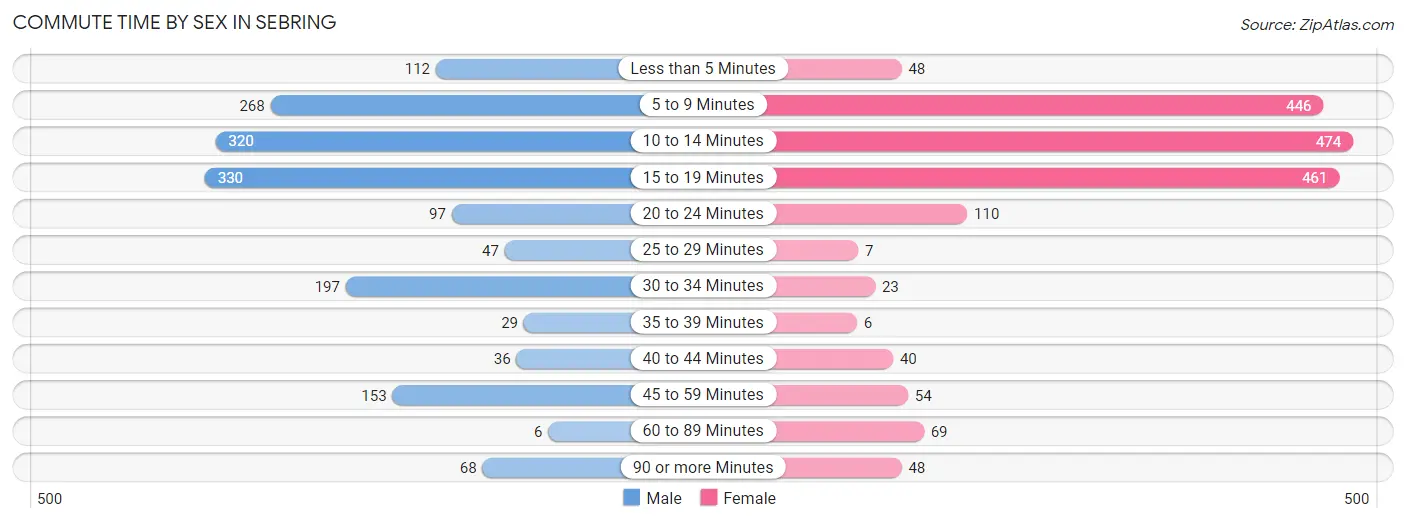
| Commute Time | Male | Female |
| Less than 5 Minutes | 112 (6.7%) | 48 (2.7%) |
| 5 to 9 Minutes | 268 (16.1%) | 446 (25.0%) |
| 10 to 14 Minutes | 320 (19.2%) | 474 (26.5%) |
| 15 to 19 Minutes | 330 (19.8%) | 461 (25.8%) |
| 20 to 24 Minutes | 97 (5.8%) | 110 (6.2%) |
| 25 to 29 Minutes | 47 (2.8%) | 7 (0.4%) |
| 30 to 34 Minutes | 197 (11.8%) | 23 (1.3%) |
| 35 to 39 Minutes | 29 (1.7%) | 6 (0.3%) |
| 40 to 44 Minutes | 36 (2.2%) | 40 (2.2%) |
| 45 to 59 Minutes | 153 (9.2%) | 54 (3.0%) |
| 60 to 89 Minutes | 6 (0.4%) | 69 (3.9%) |
| 90 or more Minutes | 68 (4.1%) | 48 (2.7%) |
Time of Departure to Work by Sex in Sebring
The most frequent times of departure to work in Sebring are 7:00 AM to 7:29 AM (269, 16.2%) for males and 7:30 AM to 7:59 AM (381, 21.3%) for females.
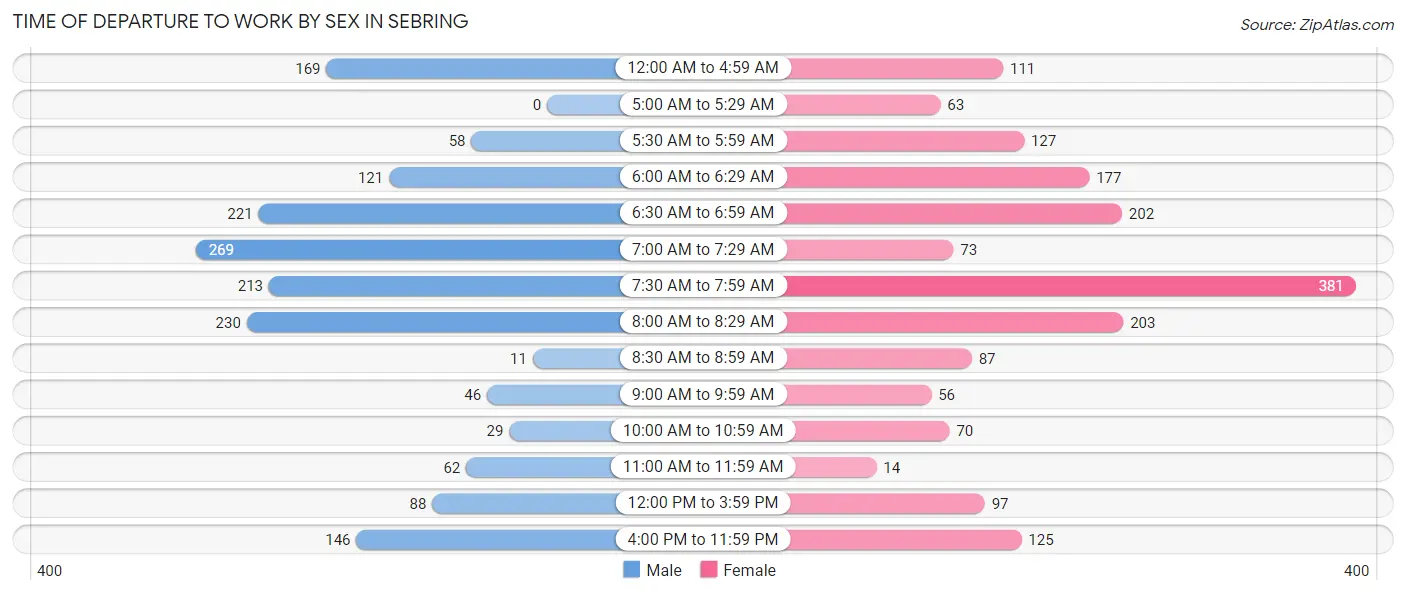
| Time of Departure | Male | Female |
| 12:00 AM to 4:59 AM | 169 (10.2%) | 111 (6.2%) |
| 5:00 AM to 5:29 AM | 0 (0.0%) | 63 (3.5%) |
| 5:30 AM to 5:59 AM | 58 (3.5%) | 127 (7.1%) |
| 6:00 AM to 6:29 AM | 121 (7.3%) | 177 (9.9%) |
| 6:30 AM to 6:59 AM | 221 (13.3%) | 202 (11.3%) |
| 7:00 AM to 7:29 AM | 269 (16.2%) | 73 (4.1%) |
| 7:30 AM to 7:59 AM | 213 (12.8%) | 381 (21.3%) |
| 8:00 AM to 8:29 AM | 230 (13.8%) | 203 (11.4%) |
| 8:30 AM to 8:59 AM | 11 (0.7%) | 87 (4.9%) |
| 9:00 AM to 9:59 AM | 46 (2.8%) | 56 (3.1%) |
| 10:00 AM to 10:59 AM | 29 (1.7%) | 70 (3.9%) |
| 11:00 AM to 11:59 AM | 62 (3.7%) | 14 (0.8%) |
| 12:00 PM to 3:59 PM | 88 (5.3%) | 97 (5.4%) |
| 4:00 PM to 11:59 PM | 146 (8.8%) | 125 (7.0%) |
| Total | 1,663 (100.0%) | 1,786 (100.0%) |
Housing Occupancy in Sebring
Occupancy by Ownership in Sebring
Of the total 4,759 dwellings in Sebring, owner-occupied units account for 2,414 (50.7%), while renter-occupied units make up 2,345 (49.3%).
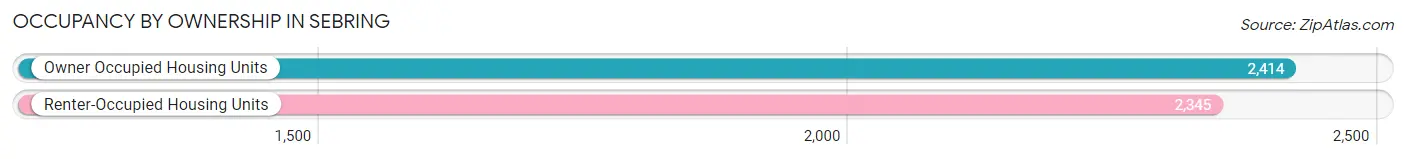
| Occupancy | # Housing Units | % Housing Units |
| Owner Occupied Housing Units | 2,414 | 50.7% |
| Renter-Occupied Housing Units | 2,345 | 49.3% |
| Total Occupied Housing Units | 4,759 | 100.0% |
Occupancy by Household Size in Sebring
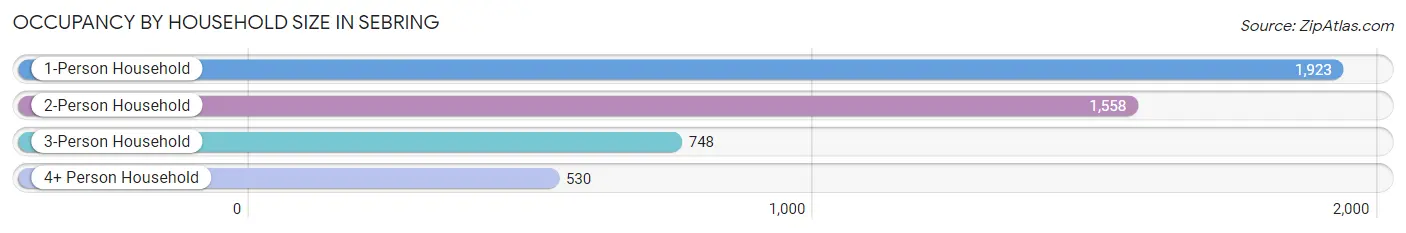
| Household Size | # Housing Units | % Housing Units |
| 1-Person Household | 1,923 | 40.4% |
| 2-Person Household | 1,558 | 32.7% |
| 3-Person Household | 748 | 15.7% |
| 4+ Person Household | 530 | 11.1% |
| Total Housing Units | 4,759 | 100.0% |
Occupancy by Ownership by Household Size in Sebring
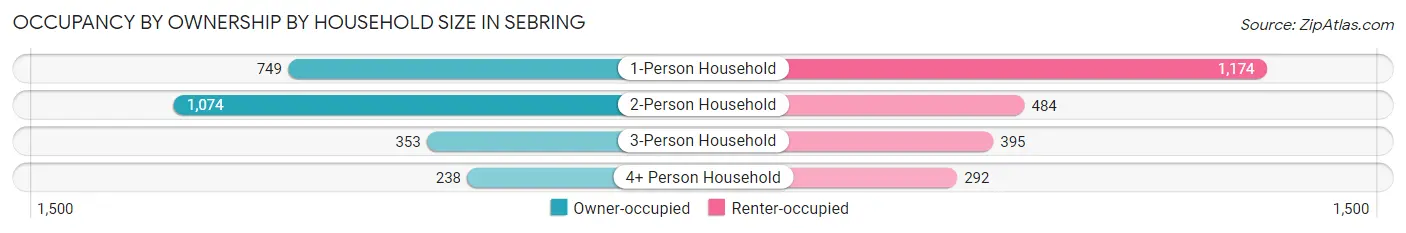
| Household Size | Owner-occupied | Renter-occupied |
| 1-Person Household | 749 (39.0%) | 1,174 (61.1%) |
| 2-Person Household | 1,074 (68.9%) | 484 (31.1%) |
| 3-Person Household | 353 (47.2%) | 395 (52.8%) |
| 4+ Person Household | 238 (44.9%) | 292 (55.1%) |
| Total Housing Units | 2,414 (50.7%) | 2,345 (49.3%) |
Occupancy by Educational Attainment in Sebring
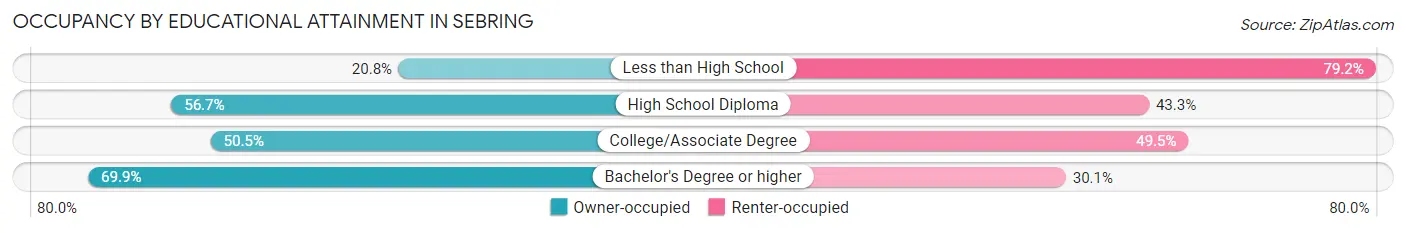
| Household Size | Owner-occupied | Renter-occupied |
| Less than High School | 179 (20.8%) | 682 (79.2%) |
| High School Diploma | 906 (56.7%) | 691 (43.3%) |
| College/Associate Degree | 727 (50.5%) | 713 (49.5%) |
| Bachelor's Degree or higher | 602 (69.9%) | 259 (30.1%) |
Occupancy by Age of Householder in Sebring
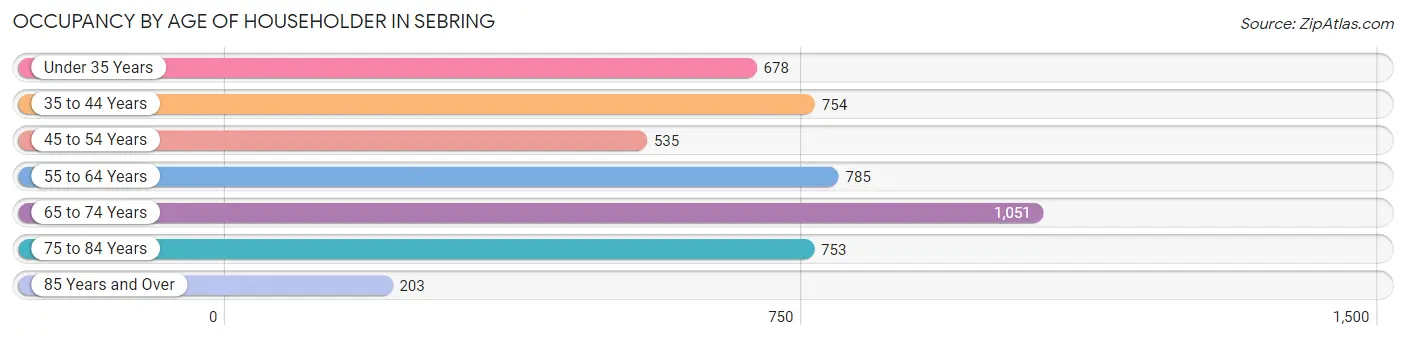
| Age Bracket | # Households | % Households |
| Under 35 Years | 678 | 14.2% |
| 35 to 44 Years | 754 | 15.8% |
| 45 to 54 Years | 535 | 11.2% |
| 55 to 64 Years | 785 | 16.5% |
| 65 to 74 Years | 1,051 | 22.1% |
| 75 to 84 Years | 753 | 15.8% |
| 85 Years and Over | 203 | 4.3% |
| Total | 4,759 | 100.0% |
Housing Finances in Sebring
Median Income by Occupancy in Sebring
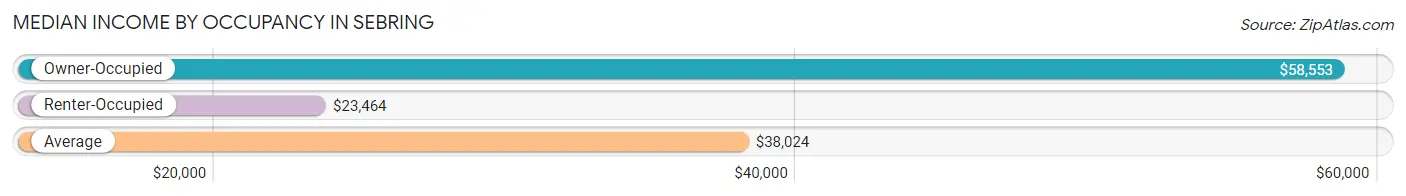
| Occupancy Type | # Households | Median Income |
| Owner-Occupied | 2,414 (50.7%) | $58,553 |
| Renter-Occupied | 2,345 (49.3%) | $23,464 |
| Average | 4,759 (100.0%) | $38,024 |
Occupancy by Householder Income Bracket in Sebring
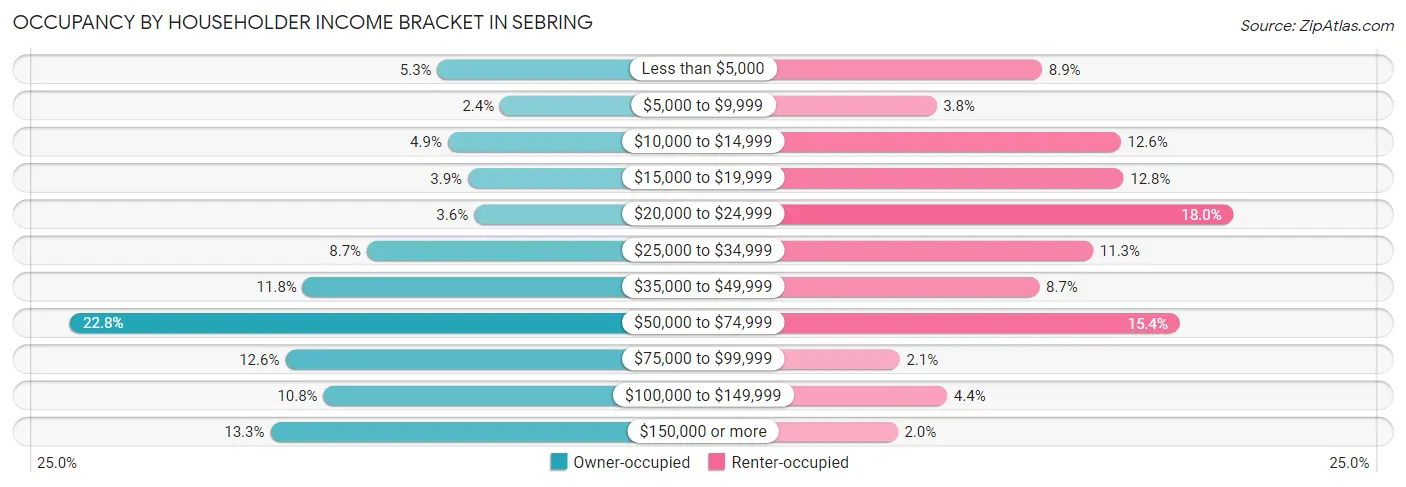
| Income Bracket | Owner-occupied | Renter-occupied |
| Less than $5,000 | 129 (5.3%) | 208 (8.9%) |
| $5,000 to $9,999 | 57 (2.4%) | 90 (3.8%) |
| $10,000 to $14,999 | 117 (4.9%) | 296 (12.6%) |
| $15,000 to $19,999 | 94 (3.9%) | 299 (12.8%) |
| $20,000 to $24,999 | 87 (3.6%) | 422 (18.0%) |
| $25,000 to $34,999 | 210 (8.7%) | 265 (11.3%) |
| $35,000 to $49,999 | 284 (11.8%) | 205 (8.7%) |
| $50,000 to $74,999 | 551 (22.8%) | 362 (15.4%) |
| $75,000 to $99,999 | 304 (12.6%) | 49 (2.1%) |
| $100,000 to $149,999 | 260 (10.8%) | 102 (4.3%) |
| $150,000 or more | 321 (13.3%) | 47 (2.0%) |
| Total | 2,414 (100.0%) | 2,345 (100.0%) |
Monthly Housing Cost Tiers in Sebring
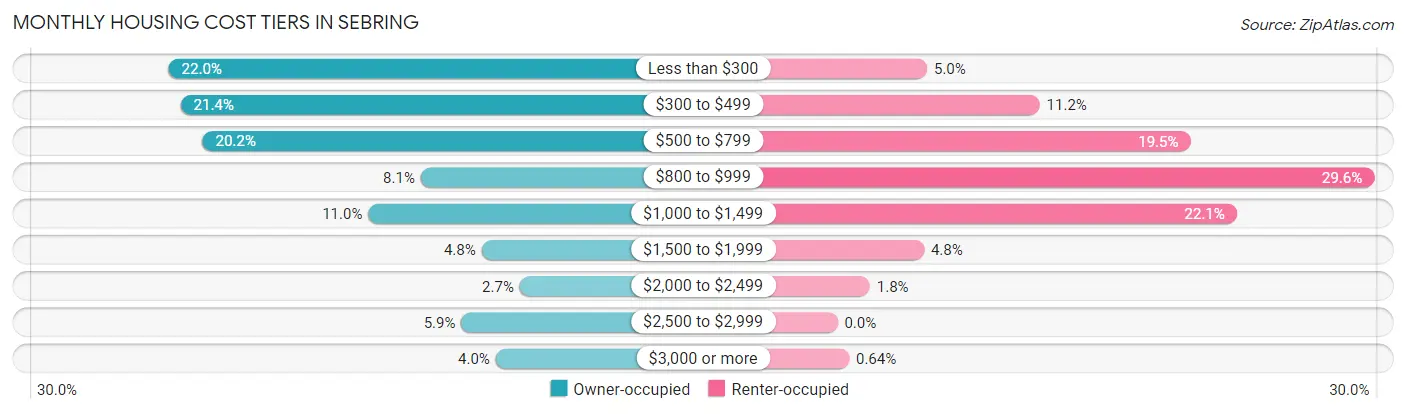
| Monthly Cost | Owner-occupied | Renter-occupied |
| Less than $300 | 532 (22.0%) | 116 (5.0%) |
| $300 to $499 | 516 (21.4%) | 262 (11.2%) |
| $500 to $799 | 487 (20.2%) | 457 (19.5%) |
| $800 to $999 | 196 (8.1%) | 695 (29.6%) |
| $1,000 to $1,499 | 266 (11.0%) | 517 (22.1%) |
| $1,500 to $1,999 | 115 (4.8%) | 112 (4.8%) |
| $2,000 to $2,499 | 64 (2.6%) | 42 (1.8%) |
| $2,500 to $2,999 | 142 (5.9%) | 0 (0.0%) |
| $3,000 or more | 96 (4.0%) | 15 (0.6%) |
| Total | 2,414 (100.0%) | 2,345 (100.0%) |
Physical Housing Characteristics in Sebring
Housing Structures in Sebring
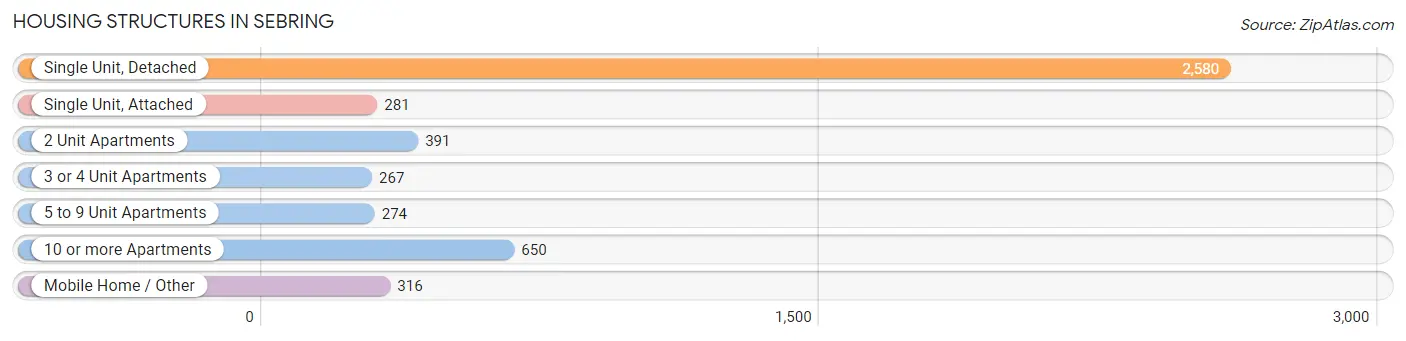
| Structure Type | # Housing Units | % Housing Units |
| Single Unit, Detached | 2,580 | 54.2% |
| Single Unit, Attached | 281 | 5.9% |
| 2 Unit Apartments | 391 | 8.2% |
| 3 or 4 Unit Apartments | 267 | 5.6% |
| 5 to 9 Unit Apartments | 274 | 5.8% |
| 10 or more Apartments | 650 | 13.7% |
| Mobile Home / Other | 316 | 6.6% |
| Total | 4,759 | 100.0% |
Housing Structures by Occupancy in Sebring
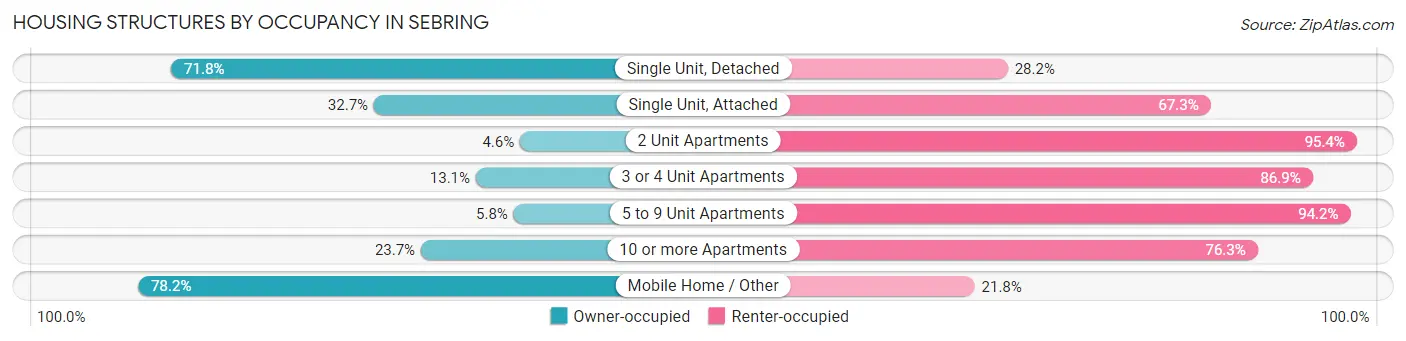
| Structure Type | Owner-occupied | Renter-occupied |
| Single Unit, Detached | 1,852 (71.8%) | 728 (28.2%) |
| Single Unit, Attached | 92 (32.7%) | 189 (67.3%) |
| 2 Unit Apartments | 18 (4.6%) | 373 (95.4%) |
| 3 or 4 Unit Apartments | 35 (13.1%) | 232 (86.9%) |
| 5 to 9 Unit Apartments | 16 (5.8%) | 258 (94.2%) |
| 10 or more Apartments | 154 (23.7%) | 496 (76.3%) |
| Mobile Home / Other | 247 (78.2%) | 69 (21.8%) |
| Total | 2,414 (50.7%) | 2,345 (49.3%) |
Housing Structures by Number of Rooms in Sebring
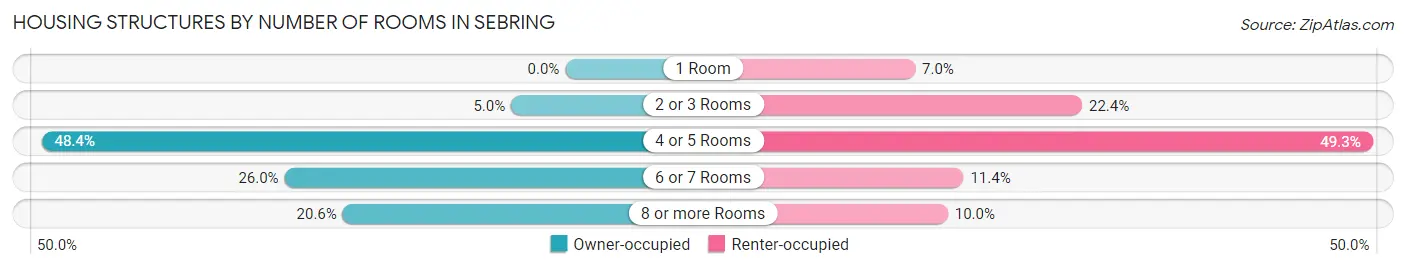
| Number of Rooms | Owner-occupied | Renter-occupied |
| 1 Room | 0 (0.0%) | 163 (7.0%) |
| 2 or 3 Rooms | 121 (5.0%) | 525 (22.4%) |
| 4 or 5 Rooms | 1,169 (48.4%) | 1,155 (49.2%) |
| 6 or 7 Rooms | 627 (26.0%) | 268 (11.4%) |
| 8 or more Rooms | 497 (20.6%) | 234 (10.0%) |
| Total | 2,414 (100.0%) | 2,345 (100.0%) |
Housing Structure by Heating Type in Sebring
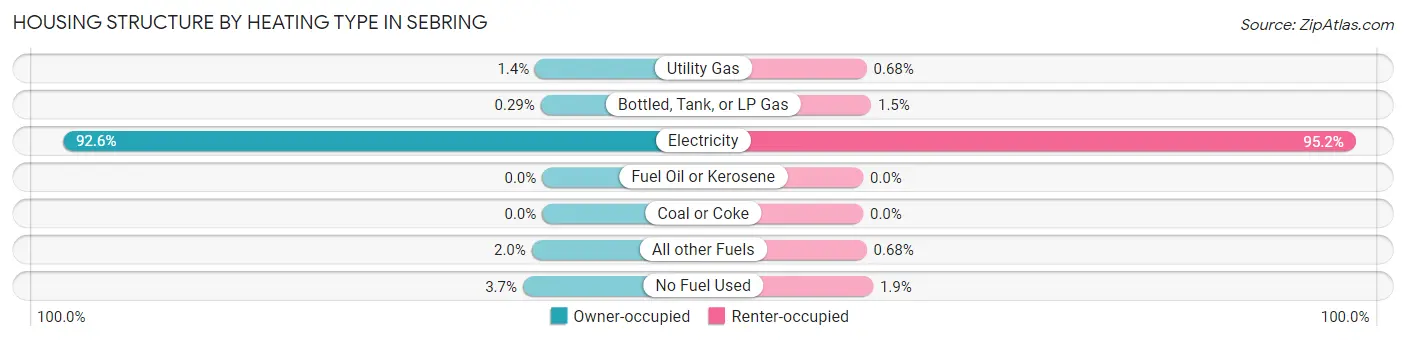
| Heating Type | Owner-occupied | Renter-occupied |
| Utility Gas | 33 (1.4%) | 16 (0.7%) |
| Bottled, Tank, or LP Gas | 7 (0.3%) | 36 (1.5%) |
| Electricity | 2,235 (92.6%) | 2,232 (95.2%) |
| Fuel Oil or Kerosene | 0 (0.0%) | 0 (0.0%) |
| Coal or Coke | 0 (0.0%) | 0 (0.0%) |
| All other Fuels | 49 (2.0%) | 16 (0.7%) |
| No Fuel Used | 90 (3.7%) | 45 (1.9%) |
| Total | 2,414 (100.0%) | 2,345 (100.0%) |
Household Vehicle Usage in Sebring
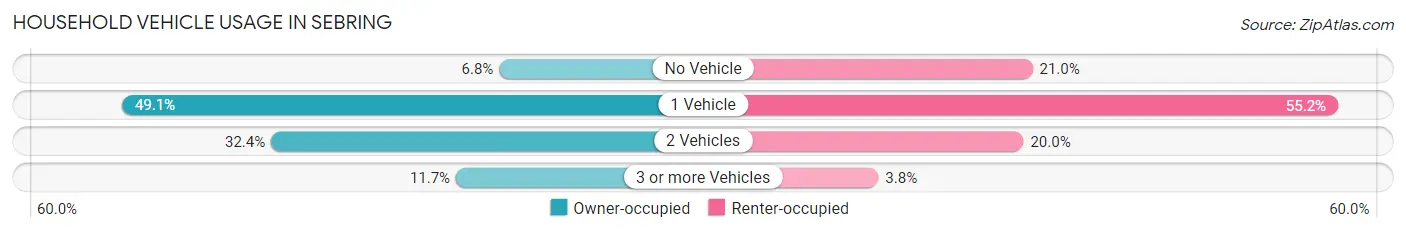
| Vehicles per Household | Owner-occupied | Renter-occupied |
| No Vehicle | 165 (6.8%) | 493 (21.0%) |
| 1 Vehicle | 1,185 (49.1%) | 1,295 (55.2%) |
| 2 Vehicles | 782 (32.4%) | 469 (20.0%) |
| 3 or more Vehicles | 282 (11.7%) | 88 (3.7%) |
| Total | 2,414 (100.0%) | 2,345 (100.0%) |
Real Estate & Mortgages in Sebring
Real Estate and Mortgage Overview in Sebring
| Characteristic | Without Mortgage | With Mortgage |
| Housing Units | 1,524 | 890 |
| Median Property Value | $137,600 | $178,600 |
| Median Household Income | $50,938 | $169 |
| Monthly Housing Costs | $382 | $96 |
| Real Estate Taxes | $1,048 | $32 |
Property Value by Mortgage Status in Sebring
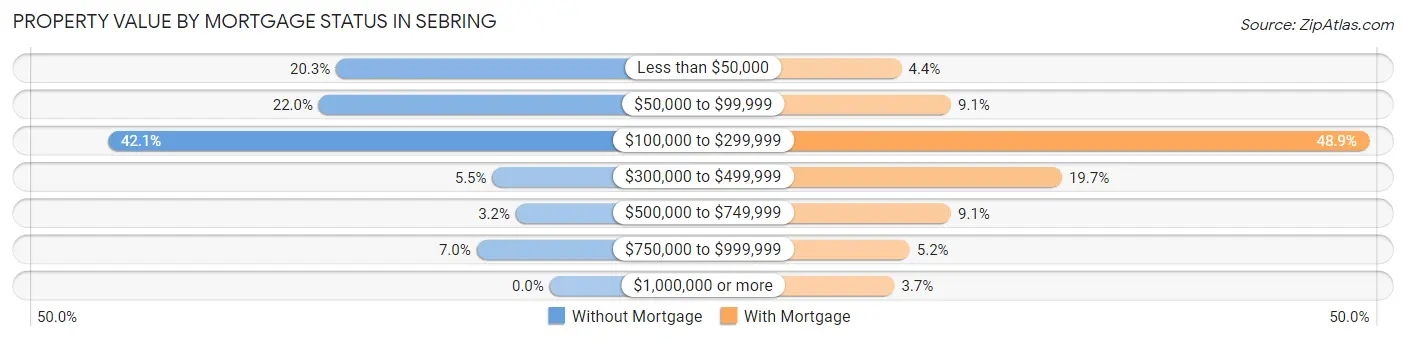
| Property Value | Without Mortgage | With Mortgage |
| Less than $50,000 | 310 (20.3%) | 39 (4.4%) |
| $50,000 to $99,999 | 335 (22.0%) | 81 (9.1%) |
| $100,000 to $299,999 | 641 (42.1%) | 435 (48.9%) |
| $300,000 to $499,999 | 83 (5.4%) | 175 (19.7%) |
| $500,000 to $749,999 | 49 (3.2%) | 81 (9.1%) |
| $750,000 to $999,999 | 106 (7.0%) | 46 (5.2%) |
| $1,000,000 or more | 0 (0.0%) | 33 (3.7%) |
| Total | 1,524 (100.0%) | 890 (100.0%) |
Household Income by Mortgage Status in Sebring
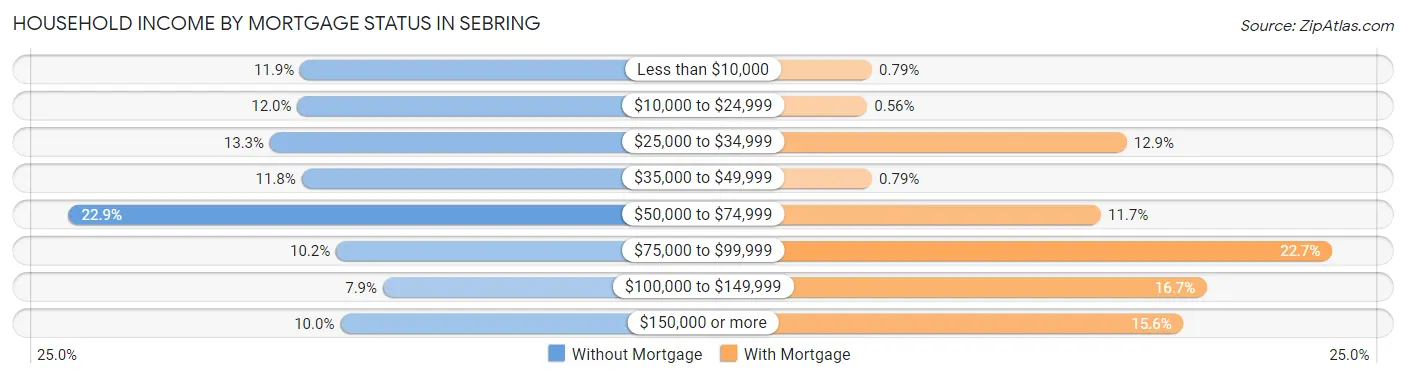
| Household Income | Without Mortgage | With Mortgage |
| Less than $10,000 | 181 (11.9%) | 7 (0.8%) |
| $10,000 to $24,999 | 183 (12.0%) | 5 (0.6%) |
| $25,000 to $34,999 | 203 (13.3%) | 115 (12.9%) |
| $35,000 to $49,999 | 180 (11.8%) | 7 (0.8%) |
| $50,000 to $74,999 | 349 (22.9%) | 104 (11.7%) |
| $75,000 to $99,999 | 155 (10.2%) | 202 (22.7%) |
| $100,000 to $149,999 | 121 (7.9%) | 149 (16.7%) |
| $150,000 or more | 152 (10.0%) | 139 (15.6%) |
| Total | 1,524 (100.0%) | 890 (100.0%) |
Property Value to Household Income Ratio in Sebring
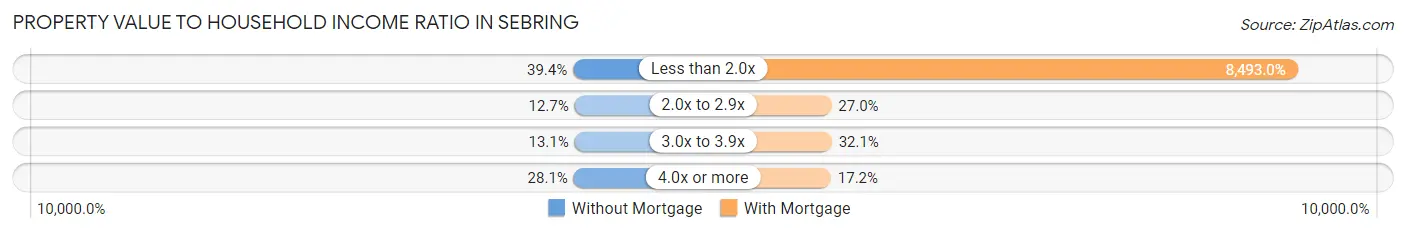
| Value-to-Income Ratio | Without Mortgage | With Mortgage |
| Less than 2.0x | 600 (39.4%) | 75,588 (8,493.0%) |
| 2.0x to 2.9x | 193 (12.7%) | 240 (27.0%) |
| 3.0x to 3.9x | 199 (13.1%) | 286 (32.1%) |
| 4.0x or more | 428 (28.1%) | 153 (17.2%) |
| Total | 1,524 (100.0%) | 890 (100.0%) |
Real Estate Taxes by Mortgage Status in Sebring
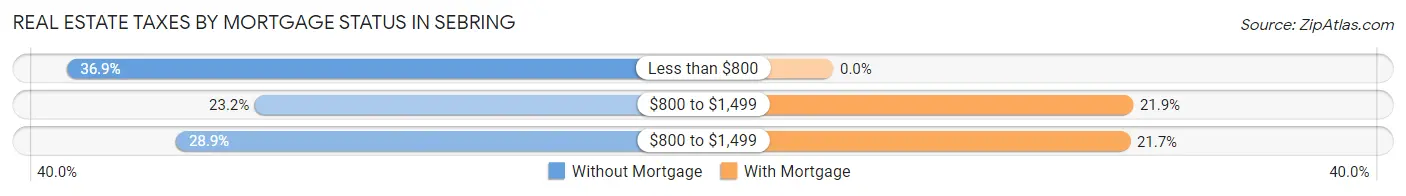
| Property Taxes | Without Mortgage | With Mortgage |
| Less than $800 | 562 (36.9%) | 0 (0.0%) |
| $800 to $1,499 | 353 (23.2%) | 195 (21.9%) |
| $800 to $1,499 | 441 (28.9%) | 193 (21.7%) |
| Total | 1,524 (100.0%) | 890 (100.0%) |
Health & Disability in Sebring
Health Insurance Coverage by Age in Sebring
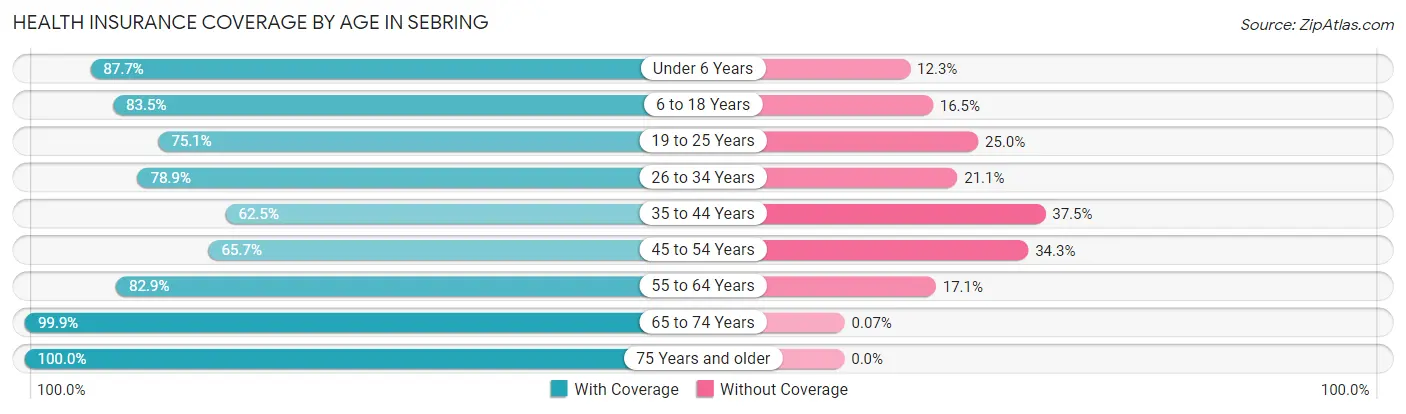
| Age Bracket | With Coverage | Without Coverage |
| Under 6 Years | 407 (87.7%) | 57 (12.3%) |
| 6 to 18 Years | 1,219 (83.5%) | 241 (16.5%) |
| 19 to 25 Years | 746 (75.0%) | 248 (24.9%) |
| 26 to 34 Years | 573 (78.9%) | 153 (21.1%) |
| 35 to 44 Years | 874 (62.5%) | 524 (37.5%) |
| 45 to 54 Years | 747 (65.7%) | 390 (34.3%) |
| 55 to 64 Years | 948 (82.9%) | 195 (17.1%) |
| 65 to 74 Years | 1,535 (99.9%) | 1 (0.1%) |
| 75 Years and older | 1,404 (100.0%) | 0 (0.0%) |
| Total | 8,453 (82.4%) | 1,809 (17.6%) |
Health Insurance Coverage by Citizenship Status in Sebring
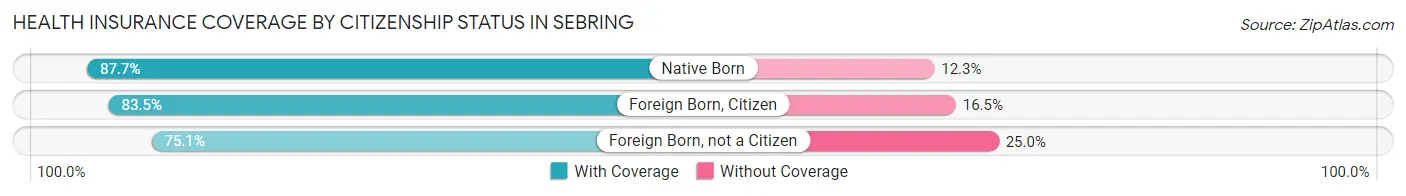
| Citizenship Status | With Coverage | Without Coverage |
| Native Born | 407 (87.7%) | 57 (12.3%) |
| Foreign Born, Citizen | 1,219 (83.5%) | 241 (16.5%) |
| Foreign Born, not a Citizen | 746 (75.0%) | 248 (24.9%) |
Health Insurance Coverage by Household Income in Sebring
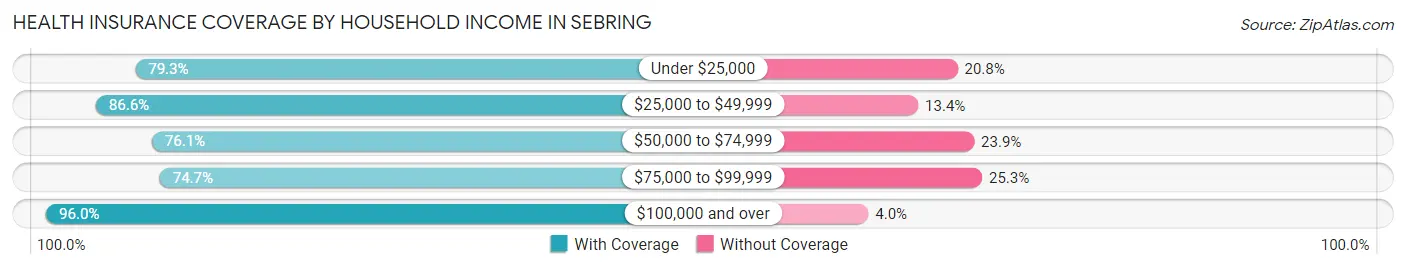
| Household Income | With Coverage | Without Coverage |
| Under $25,000 | 2,650 (79.2%) | 694 (20.7%) |
| $25,000 to $49,999 | 1,736 (86.6%) | 268 (13.4%) |
| $50,000 to $74,999 | 1,793 (76.1%) | 562 (23.9%) |
| $75,000 to $99,999 | 548 (74.7%) | 186 (25.3%) |
| $100,000 and over | 1,664 (96.0%) | 70 (4.0%) |
Public vs Private Health Insurance Coverage by Age in Sebring
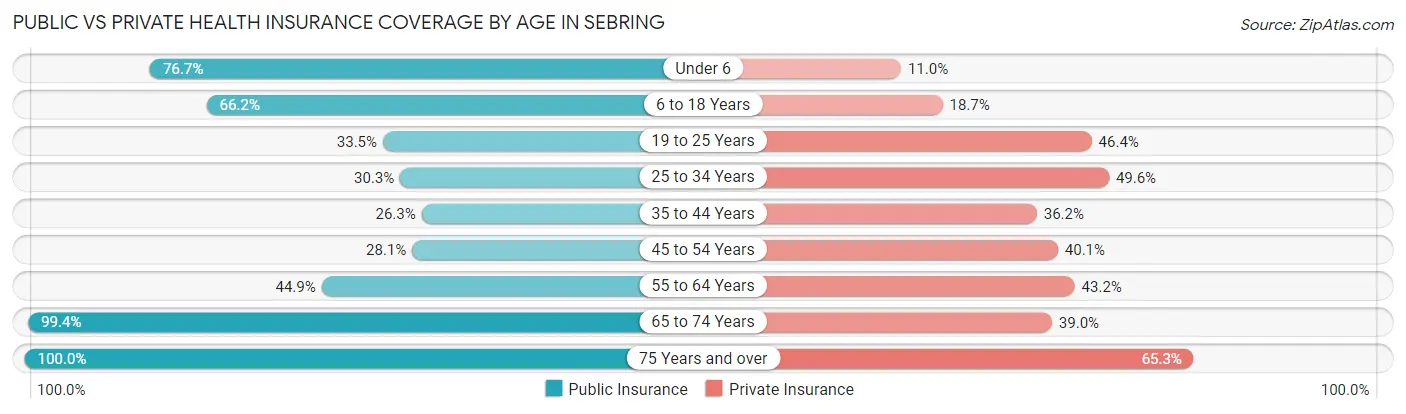
| Age Bracket | Public Insurance | Private Insurance |
| Under 6 | 356 (76.7%) | 51 (11.0%) |
| 6 to 18 Years | 967 (66.2%) | 273 (18.7%) |
| 19 to 25 Years | 333 (33.5%) | 461 (46.4%) |
| 25 to 34 Years | 220 (30.3%) | 360 (49.6%) |
| 35 to 44 Years | 368 (26.3%) | 506 (36.2%) |
| 45 to 54 Years | 319 (28.1%) | 456 (40.1%) |
| 55 to 64 Years | 513 (44.9%) | 494 (43.2%) |
| 65 to 74 Years | 1,526 (99.4%) | 599 (39.0%) |
| 75 Years and over | 1,404 (100.0%) | 917 (65.3%) |
| Total | 6,006 (58.5%) | 4,117 (40.1%) |
Disability Status by Sex by Age in Sebring
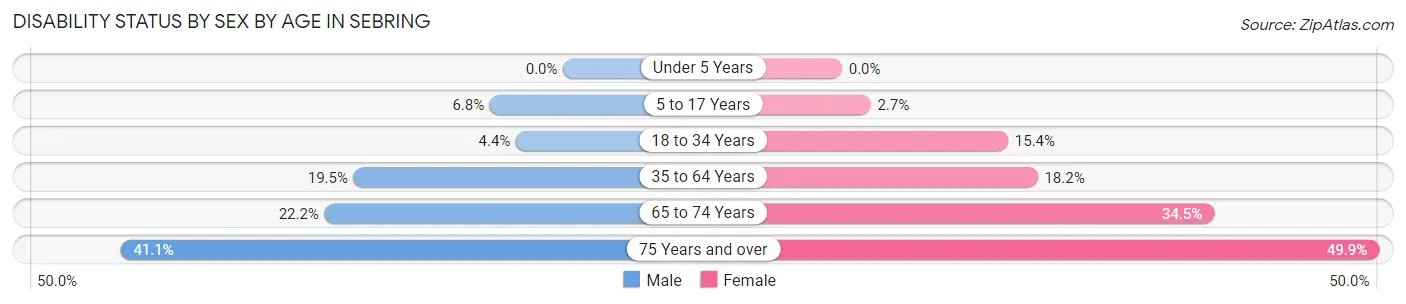
| Age Bracket | Male | Female |
| Under 5 Years | 0 (0.0%) | 0 (0.0%) |
| 5 to 17 Years | 37 (6.8%) | 21 (2.7%) |
| 18 to 34 Years | 40 (4.4%) | 153 (15.4%) |
| 35 to 64 Years | 333 (19.5%) | 357 (18.2%) |
| 65 to 74 Years | 169 (22.2%) | 267 (34.5%) |
| 75 Years and over | 277 (41.1%) | 364 (49.9%) |
Disability Class by Sex by Age in Sebring
Disability Class: Hearing Difficulty
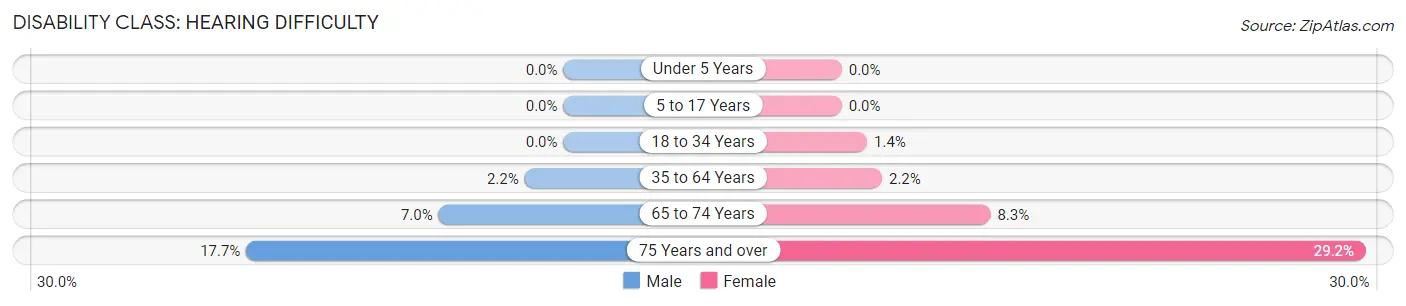
| Age Bracket | Male | Female |
| Under 5 Years | 0 (0.0%) | 0 (0.0%) |
| 5 to 17 Years | 0 (0.0%) | 0 (0.0%) |
| 18 to 34 Years | 0 (0.0%) | 14 (1.4%) |
| 35 to 64 Years | 37 (2.2%) | 44 (2.2%) |
| 65 to 74 Years | 53 (7.0%) | 64 (8.3%) |
| 75 Years and over | 119 (17.7%) | 213 (29.2%) |
Disability Class: Vision Difficulty
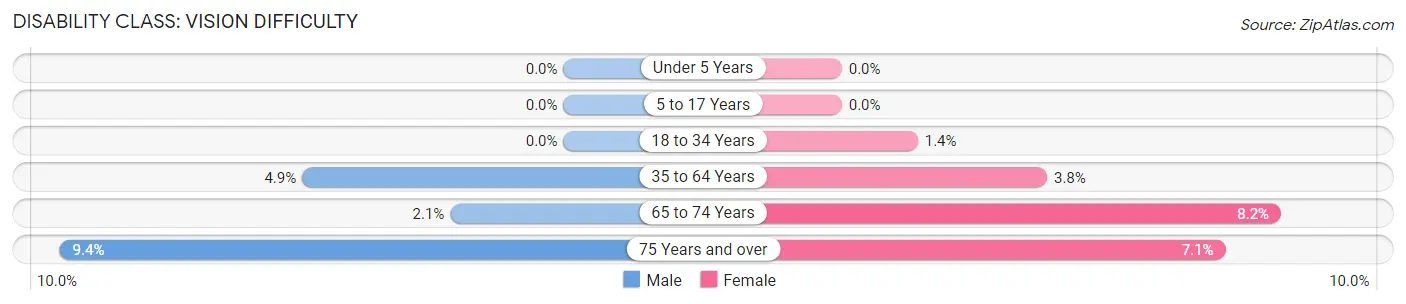
| Age Bracket | Male | Female |
| Under 5 Years | 0 (0.0%) | 0 (0.0%) |
| 5 to 17 Years | 0 (0.0%) | 0 (0.0%) |
| 18 to 34 Years | 0 (0.0%) | 14 (1.4%) |
| 35 to 64 Years | 83 (4.9%) | 75 (3.8%) |
| 65 to 74 Years | 16 (2.1%) | 63 (8.2%) |
| 75 Years and over | 63 (9.3%) | 52 (7.1%) |
Disability Class: Cognitive Difficulty
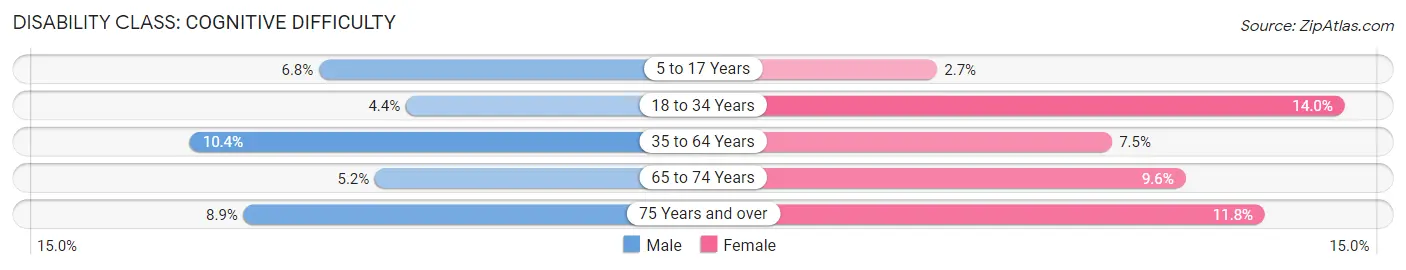
| Age Bracket | Male | Female |
| 5 to 17 Years | 37 (6.8%) | 21 (2.7%) |
| 18 to 34 Years | 40 (4.4%) | 139 (14.0%) |
| 35 to 64 Years | 178 (10.4%) | 148 (7.5%) |
| 65 to 74 Years | 40 (5.2%) | 74 (9.6%) |
| 75 Years and over | 60 (8.9%) | 86 (11.8%) |
Disability Class: Ambulatory Difficulty
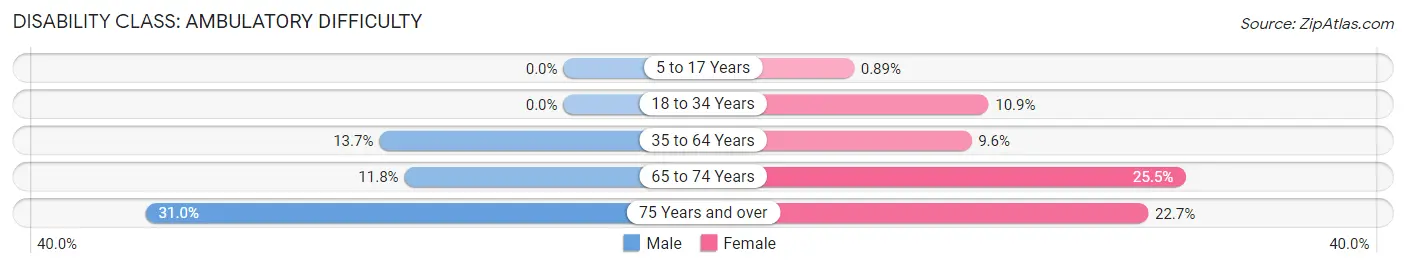
| Age Bracket | Male | Female |
| 5 to 17 Years | 0 (0.0%) | 7 (0.9%) |
| 18 to 34 Years | 0 (0.0%) | 108 (10.9%) |
| 35 to 64 Years | 234 (13.7%) | 189 (9.6%) |
| 65 to 74 Years | 90 (11.8%) | 197 (25.5%) |
| 75 Years and over | 209 (31.0%) | 166 (22.7%) |
Disability Class: Self-Care Difficulty
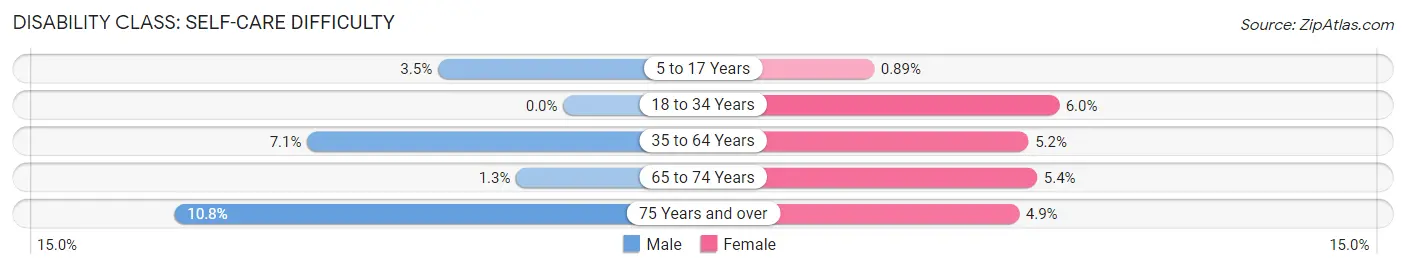
| Age Bracket | Male | Female |
| 5 to 17 Years | 19 (3.5%) | 7 (0.9%) |
| 18 to 34 Years | 0 (0.0%) | 60 (6.0%) |
| 35 to 64 Years | 122 (7.1%) | 102 (5.2%) |
| 65 to 74 Years | 10 (1.3%) | 42 (5.4%) |
| 75 Years and over | 73 (10.8%) | 36 (4.9%) |
Technology Access in Sebring
Computing Device Access in Sebring
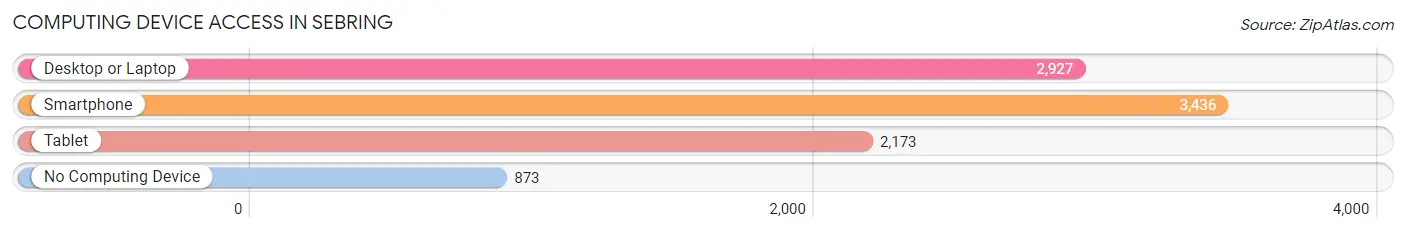
| Device Type | # Households | % Households |
| Desktop or Laptop | 2,927 | 61.5% |
| Smartphone | 3,436 | 72.2% |
| Tablet | 2,173 | 45.7% |
| No Computing Device | 873 | 18.3% |
| Total | 4,759 | 100.0% |
Internet Access in Sebring
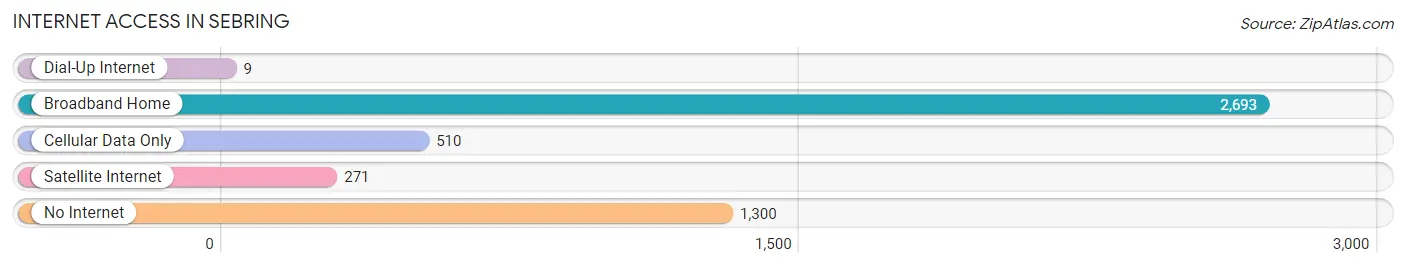
| Internet Type | # Households | % Households |
| Dial-Up Internet | 9 | 0.2% |
| Broadband Home | 2,693 | 56.6% |
| Cellular Data Only | 510 | 10.7% |
| Satellite Internet | 271 | 5.7% |
| No Internet | 1,300 | 27.3% |
| Total | 4,759 | 100.0% |
Sebring Summary
Sebring, Florida is a city located in Highlands County, in the central part of the state. It is the county seat and the largest city in the county. The city is located on the shores of Lake Jackson, a large freshwater lake that is part of the Kissimmee River chain of lakes. Sebring is located about an hour and a half south of Orlando and two hours north of Miami.
History
The area that is now Sebring was first settled in the late 1800s by settlers from the north. The first settlers were mostly farmers and ranchers who were attracted to the area by its fertile soil and abundant wildlife. The first post office was established in 1884 and the town was officially incorporated in 1913.
The city was named after George Sebring, a German-American who had moved to the area in the late 1800s. He was a successful businessman and was instrumental in the development of the city. He built a hotel, a bank, and a sawmill, and was also involved in the citrus industry.
In the early 1900s, Sebring was a popular tourist destination. The city was known for its beautiful lakes and its mild climate. It was also home to a number of resorts and hotels.
In the 1950s, Sebring began to experience a period of growth and development. The city was chosen as the site of the Sebring International Raceway, which opened in 1950. The raceway has since become a popular destination for auto racing fans from around the world.
Geography
Sebring is located in the central part of Florida, in Highlands County. The city is situated on the shores of Lake Jackson, a large freshwater lake that is part of the Kissimmee River chain of lakes. The city is located about an hour and a half south of Orlando and two hours north of Miami.
The city has a total area of 11.2 square miles, of which 10.9 square miles is land and 0.3 square miles is water. The city is located at an elevation of 98 feet above sea level.
Economy
Sebring has a diverse economy that is driven by tourism, agriculture, and manufacturing. The city is home to a number of resorts and hotels, as well as a number of agricultural operations. The city is also home to a number of manufacturing companies, including a large aluminum plant.
The city is also home to the Sebring International Raceway, which is a popular destination for auto racing fans from around the world. The raceway hosts a number of major auto racing events each year, including the 12 Hours of Sebring, which is one of the oldest and most prestigious endurance races in the world.
Demographics
As of the 2010 census, Sebring had a population of 10,491. The racial makeup of the city was 79.2% White, 15.2% African American, 0.5% Native American, 0.7% Asian, 0.1% Pacific Islander, 2.7% from other races, and 1.7% from two or more races. Hispanic or Latino of any race were 8.3% of the population.
The median income for a household in the city was $30,945, and the median income for a family was $37,945. The per capita income for the city was $17,845. About 17.2% of families and 20.7% of the population were below the poverty line, including 28.2% of those under age 18 and 11.2% of those age 65 or over.
Common Questions
What is Per Capita Income in Sebring?
Per Capita income in Sebring is $29,697.
What is the Median Family Income in Sebring?
Median Family Income in Sebring is $54,803.
What is the Median Household income in Sebring?
Median Household Income in Sebring is $38,024.
What is Income or Wage Gap in Sebring?
Income or Wage Gap in Sebring is 12.1%.
Women in Sebring earn 87.9 cents for every dollar earned by a man.
What is Family Income Deficit in Sebring?
Family Income Deficit in Sebring is $12,577.
Families that are below poverty line in Sebring earn $12,577 less on average than the poverty threshold level.
What is Inequality or Gini Index in Sebring?
Inequality or Gini Index in Sebring is 0.56.
What is the Total Population of Sebring?
Total Population of Sebring is 11,006.
What is the Total Male Population of Sebring?
Total Male Population of Sebring is 5,141.
What is the Total Female Population of Sebring?
Total Female Population of Sebring is 5,865.
What is the Ratio of Males per 100 Females in Sebring?
There are 87.66 Males per 100 Females in Sebring.
What is the Ratio of Females per 100 Males in Sebring?
There are 114.08 Females per 100 Males in Sebring.
What is the Median Population Age in Sebring?
Median Population Age in Sebring is 46.3 Years.
What is the Average Family Size in Sebring
Average Family Size in Sebring is 2.9 People.
What is the Average Household Size in Sebring
Average Household Size in Sebring is 2.1 People.
How Large is the Labor Force in Sebring?
There are 4,266 People in the Labor Forcein in Sebring.
What is the Percentage of People in the Labor Force in Sebring?
44.9% of People are in the Labor Force in Sebring.
What is the Unemployment Rate in Sebring?
Unemployment Rate in Sebring is 12.7%.