Roeville, FL Map & Demographics
Roeville Map
Roeville Overview
$30,828
PER CAPITA INCOME
$48,750
AVG FAMILY INCOME
$85,379
AVG HOUSEHOLD INCOME
14.1%
WAGE / INCOME GAP [ % ]
85.9¢/ $1
WAGE / INCOME GAP [ $ ]
0.26
INEQUALITY / GINI INDEX
425
TOTAL POPULATION
199
MALE POPULATION
226
FEMALE POPULATION
88.05
MALES / 100 FEMALES
113.57
FEMALES / 100 MALES
45.2
MEDIAN AGE
3.3
AVG FAMILY SIZE
2.4
AVG HOUSEHOLD SIZE
284
LABOR FORCE [ PEOPLE ]
77.8%
PERCENT IN LABOR FORCE
3.9%
UNEMPLOYMENT RATE
Income in Roeville
Income Overview in Roeville
Per Capita Income in Roeville is $30,828, while median incomes of families and households are $48,750 and $85,379 respectively.
| Characteristic | Number | Measure |
| Per Capita Income | 425 | $30,828 |
| Median Family Income | 82 | $48,750 |
| Mean Family Income | 82 | $62,579 |
| Median Household Income | 181 | $85,379 |
| Mean Household Income | 181 | $70,027 |
| Income Deficit | 82 | $0 |
| Wage / Income Gap (%) | 425 | 14.12% |
| Wage / Income Gap ($) | 425 | 85.88¢ per $1 |
| Gini / Inequality Index | 425 | 0.26 |
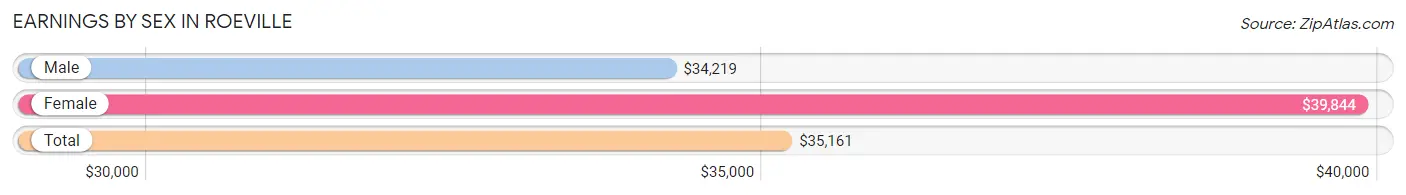
Earnings by Sex in Roeville
Average Earnings in Roeville are $35,161, $34,219 for men and $39,844 for women, a difference of 14.1%.
| Sex | Number | Average Earnings |
| Male | 175 (57.2%) | $34,219 |
| Female | 131 (42.8%) | $39,844 |
| Total | 306 (100.0%) | $35,161 |
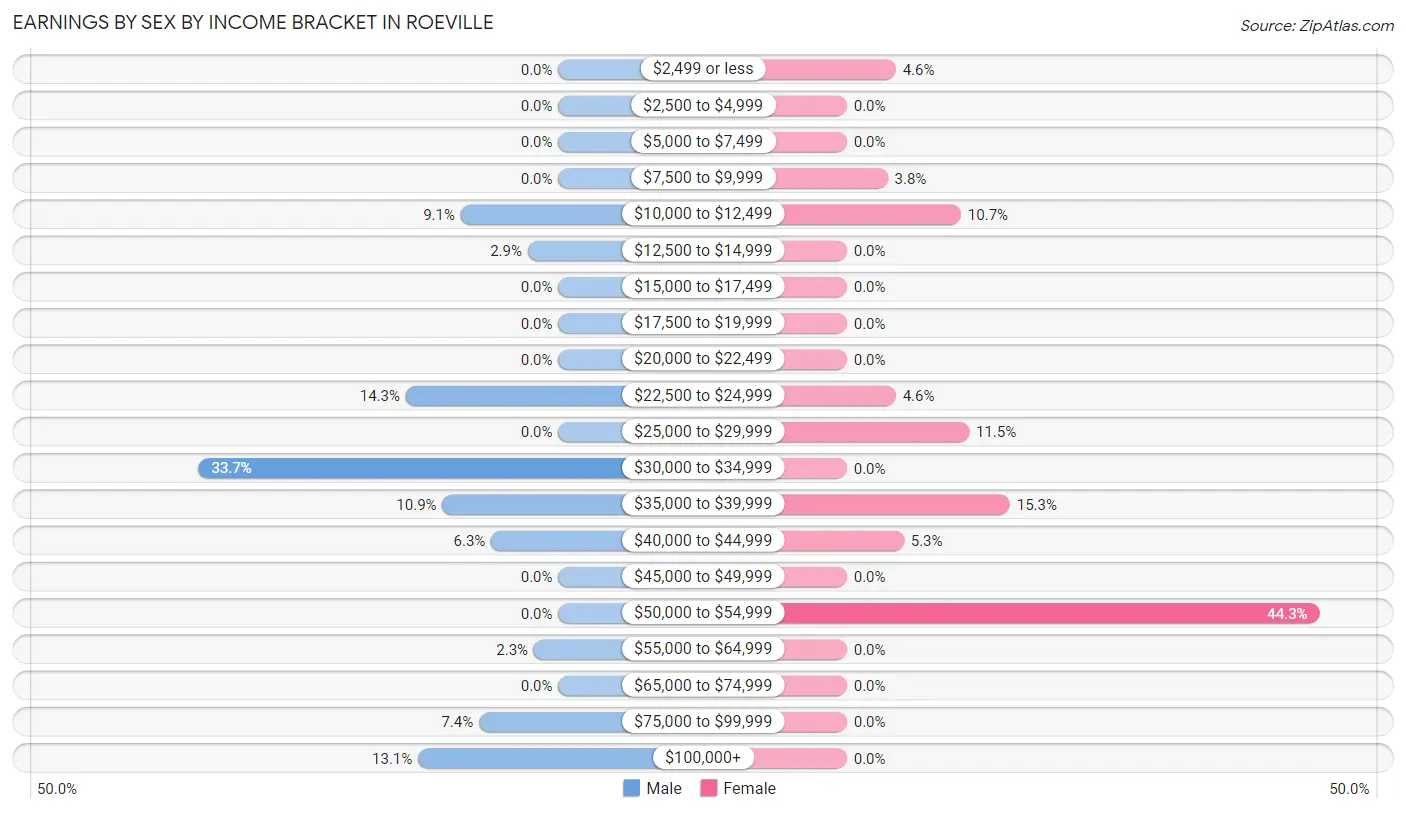
Earnings by Sex by Income Bracket in Roeville
The most common earnings brackets in Roeville are $30,000 to $34,999 for men (59 | 33.7%) and $50,000 to $54,999 for women (58 | 44.3%).
| Income | Male | Female |
| $2,499 or less | 0 (0.0%) | 6 (4.6%) |
| $2,500 to $4,999 | 0 (0.0%) | 0 (0.0%) |
| $5,000 to $7,499 | 0 (0.0%) | 0 (0.0%) |
| $7,500 to $9,999 | 0 (0.0%) | 5 (3.8%) |
| $10,000 to $12,499 | 16 (9.1%) | 14 (10.7%) |
| $12,500 to $14,999 | 5 (2.9%) | 0 (0.0%) |
| $15,000 to $17,499 | 0 (0.0%) | 0 (0.0%) |
| $17,500 to $19,999 | 0 (0.0%) | 0 (0.0%) |
| $20,000 to $22,499 | 0 (0.0%) | 0 (0.0%) |
| $22,500 to $24,999 | 25 (14.3%) | 6 (4.6%) |
| $25,000 to $29,999 | 0 (0.0%) | 15 (11.5%) |
| $30,000 to $34,999 | 59 (33.7%) | 0 (0.0%) |
| $35,000 to $39,999 | 19 (10.9%) | 20 (15.3%) |
| $40,000 to $44,999 | 11 (6.3%) | 7 (5.3%) |
| $45,000 to $49,999 | 0 (0.0%) | 0 (0.0%) |
| $50,000 to $54,999 | 0 (0.0%) | 58 (44.3%) |
| $55,000 to $64,999 | 4 (2.3%) | 0 (0.0%) |
| $65,000 to $74,999 | 0 (0.0%) | 0 (0.0%) |
| $75,000 to $99,999 | 13 (7.4%) | 0 (0.0%) |
| $100,000+ | 23 (13.1%) | 0 (0.0%) |
| Total | 175 (100.0%) | 131 (100.0%) |
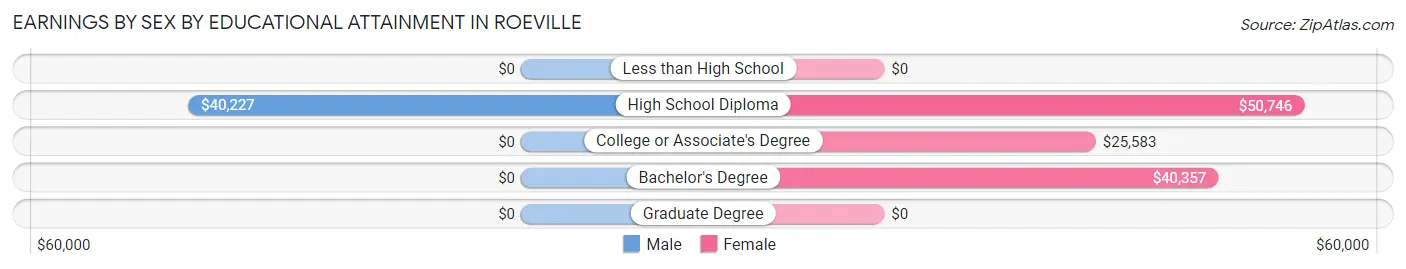
Earnings by Sex by Educational Attainment in Roeville
Average earnings in Roeville are $34,286 for men and $40,893 for women, a difference of 16.2%. Men with an educational attainment of high school diploma enjoy the highest average annual earnings of $40,227, while those with high school diploma education earn the least with $40,227. Women with an educational attainment of high school diploma earn the most with the average annual earnings of $50,746, while those with college or associate's degree education have the smallest earnings of $25,583.
| Educational Attainment | Male Income | Female Income |
| Less than High School | - | - |
| High School Diploma | $40,227 | $50,746 |
| College or Associate's Degree | - | - |
| Bachelor's Degree | - | - |
| Graduate Degree | - | - |
| Total | $34,286 | $40,893 |
Family Income in Roeville
Family Income Brackets in Roeville
According to the Roeville family income data, there are 27 families falling into the $35,000 to $49,999 income range, which is the most common income bracket and makes up 32.9% of all families.
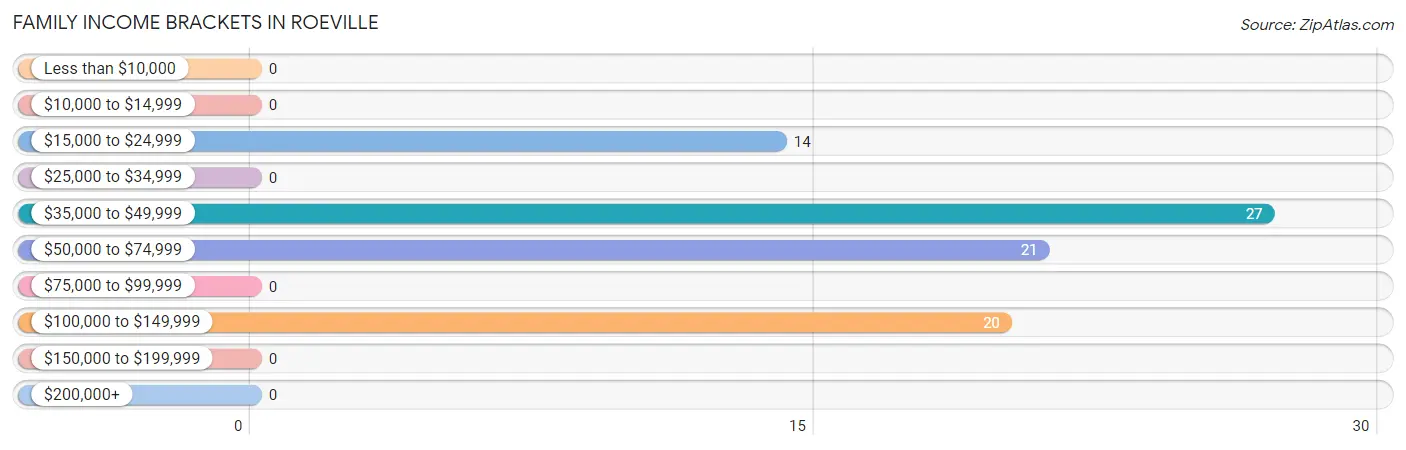
| Income Bracket | # Families | % Families |
| Less than $10,000 | 0 | 0.0% |
| $10,000 to $14,999 | 0 | 0.0% |
| $15,000 to $24,999 | 14 | 17.1% |
| $25,000 to $34,999 | 0 | 0.0% |
| $35,000 to $49,999 | 27 | 32.9% |
| $50,000 to $74,999 | 21 | 25.6% |
| $75,000 to $99,999 | 0 | 0.0% |
| $100,000 to $149,999 | 20 | 24.4% |
| $150,000 to $199,999 | 0 | 0.0% |
| $200,000+ | 0 | 0.0% |
Family Income by Famaliy Size in Roeville
3-person families (35 | 42.7%) account for the highest median family income in Roeville with $115,417 per family, while 3-person families (35 | 42.7%) have the highest median income of $38,472 per family member.
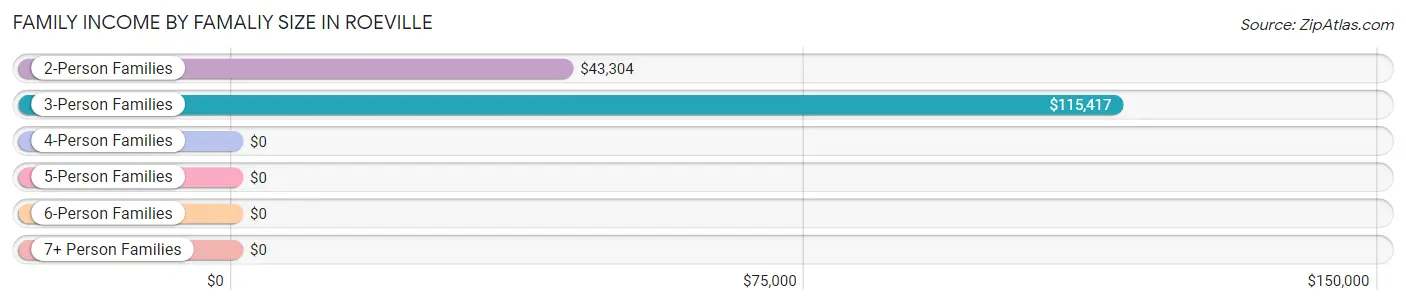
| Income Bracket | # Families | Median Income |
| 2-Person Families | 27 (32.9%) | $43,304 |
| 3-Person Families | 35 (42.7%) | $115,417 |
| 4-Person Families | 5 (6.1%) | $0 |
| 5-Person Families | 15 (18.3%) | $0 |
| 6-Person Families | 0 (0.0%) | $0 |
| 7+ Person Families | 0 (0.0%) | $0 |
| Total | 82 (100.0%) | $48,750 |
Family Income by Number of Earners in Roeville
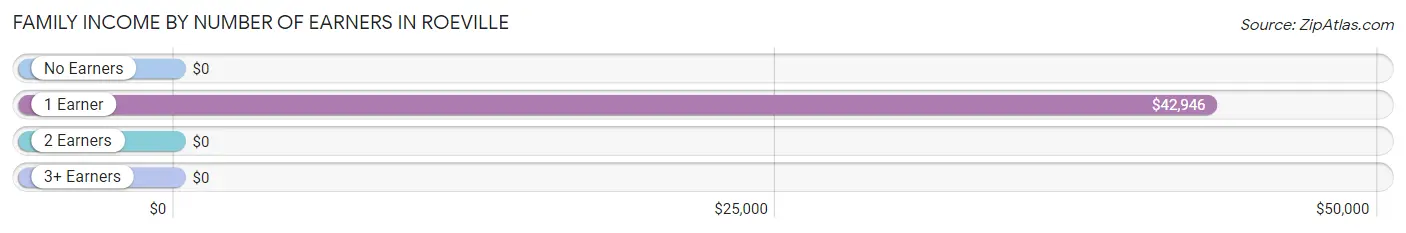
| Number of Earners | # Families | Median Income |
| No Earners | 9 (11.0%) | $0 |
| 1 Earner | 31 (37.8%) | $42,946 |
| 2 Earners | 14 (17.1%) | $0 |
| 3+ Earners | 28 (34.2%) | $0 |
| Total | 82 (100.0%) | $48,750 |
Household Income in Roeville
Household Income Brackets in Roeville
With 56 households falling in the category, the $75,000 to $99,999 income range is the most frequent in Roeville, accounting for 30.9% of all households.
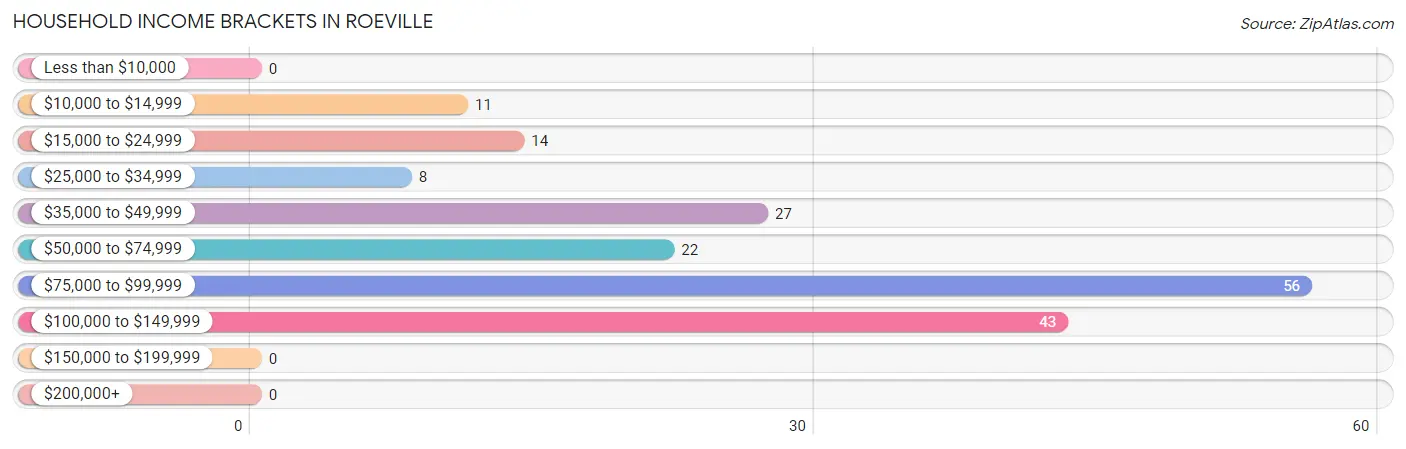
| Income Bracket | # Households | % Households |
| Less than $10,000 | 0 | 0.0% |
| $10,000 to $14,999 | 11 | 6.1% |
| $15,000 to $24,999 | 14 | 7.7% |
| $25,000 to $34,999 | 8 | 4.4% |
| $35,000 to $49,999 | 27 | 14.9% |
| $50,000 to $74,999 | 22 | 12.2% |
| $75,000 to $99,999 | 56 | 30.9% |
| $100,000 to $149,999 | 43 | 23.8% |
| $150,000 to $199,999 | 0 | 0.0% |
| $200,000+ | 0 | 0.0% |
Household Income by Householder Age in Roeville
The median household income in Roeville is $85,379, with the highest median household income of $85,714 found in the 45 to 64 years age bracket for the primary householder. A total of 152 households (84.0%) fall into this category.
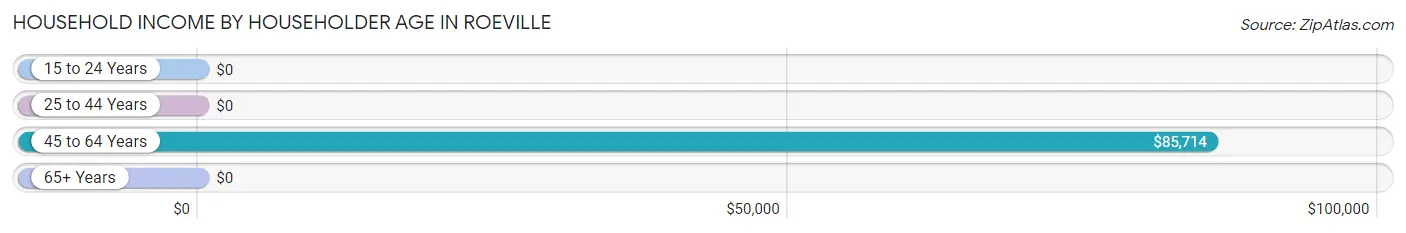
| Income Bracket | # Households | Median Income |
| 15 to 24 Years | 0 (0.0%) | $0 |
| 25 to 44 Years | 12 (6.6%) | $0 |
| 45 to 64 Years | 152 (84.0%) | $85,714 |
| 65+ Years | 17 (9.4%) | $0 |
| Total | 181 (100.0%) | $85,379 |
Poverty in Roeville
Income Below Poverty by Sex and Age in Roeville
With 10.1% poverty level for males and 13.7% for females among the residents of Roeville, 75 year old and over males and 75 year old and over females are the most vulnerable to poverty, with 9 males (100.0%) and 9 females (52.9%) in their respective age groups living below the poverty level.
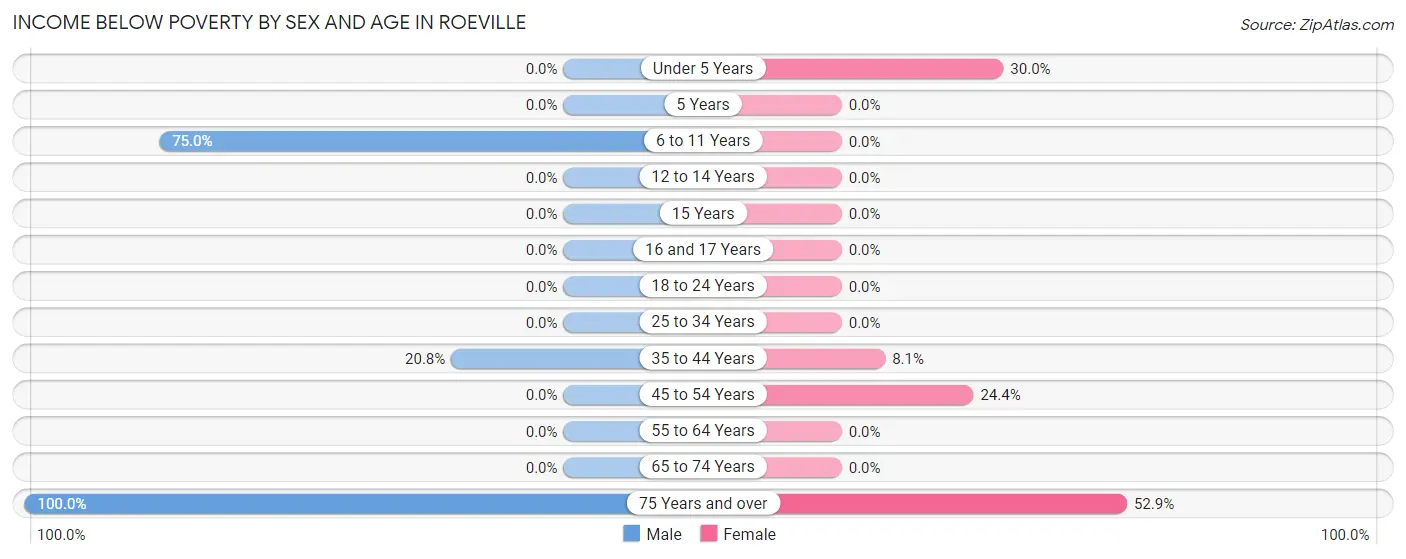
| Age Bracket | Male | Female |
| Under 5 Years | 0 (0.0%) | 6 (30.0%) |
| 5 Years | 0 (0.0%) | 0 (0.0%) |
| 6 to 11 Years | 6 (75.0%) | 0 (0.0%) |
| 12 to 14 Years | 0 (0.0%) | 0 (0.0%) |
| 15 Years | 0 (0.0%) | 0 (0.0%) |
| 16 and 17 Years | 0 (0.0%) | 0 (0.0%) |
| 18 to 24 Years | 0 (0.0%) | 0 (0.0%) |
| 25 to 34 Years | 0 (0.0%) | 0 (0.0%) |
| 35 to 44 Years | 5 (20.8%) | 5 (8.1%) |
| 45 to 54 Years | 0 (0.0%) | 11 (24.4%) |
| 55 to 64 Years | 0 (0.0%) | 0 (0.0%) |
| 65 to 74 Years | 0 (0.0%) | 0 (0.0%) |
| 75 Years and over | 9 (100.0%) | 9 (52.9%) |
| Total | 20 (10.1%) | 31 (13.7%) |
Income Above Poverty by Sex and Age in Roeville
According to the poverty statistics in Roeville, males aged under 5 years and females aged 6 to 11 years are the age groups that are most secure financially, with 100.0% of males and 100.0% of females in these age groups living above the poverty line.
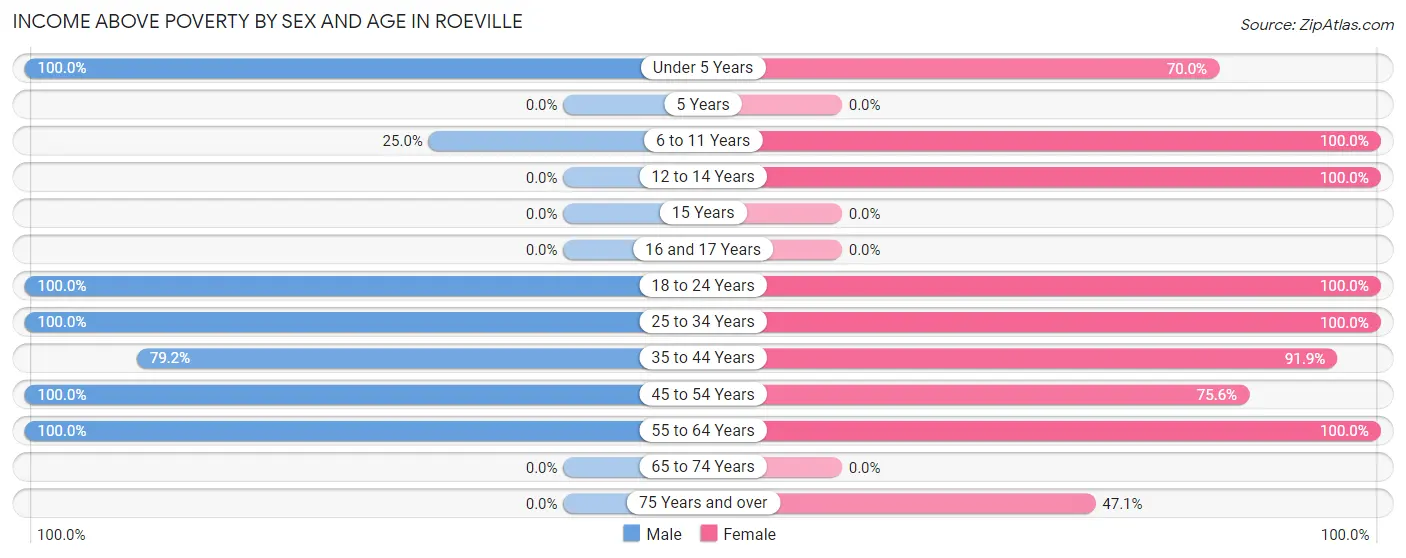
| Age Bracket | Male | Female |
| Under 5 Years | 7 (100.0%) | 14 (70.0%) |
| 5 Years | 0 (0.0%) | 0 (0.0%) |
| 6 to 11 Years | 2 (25.0%) | 2 (100.0%) |
| 12 to 14 Years | 0 (0.0%) | 23 (100.0%) |
| 15 Years | 0 (0.0%) | 0 (0.0%) |
| 16 and 17 Years | 0 (0.0%) | 0 (0.0%) |
| 18 to 24 Years | 3 (100.0%) | 6 (100.0%) |
| 25 to 34 Years | 33 (100.0%) | 22 (100.0%) |
| 35 to 44 Years | 19 (79.2%) | 57 (91.9%) |
| 45 to 54 Years | 61 (100.0%) | 34 (75.6%) |
| 55 to 64 Years | 54 (100.0%) | 29 (100.0%) |
| 65 to 74 Years | 0 (0.0%) | 0 (0.0%) |
| 75 Years and over | 0 (0.0%) | 8 (47.1%) |
| Total | 179 (89.9%) | 195 (86.3%) |
Income Below Poverty Among Married-Couple Families in Roeville
The poverty statistics for married-couple families in Roeville show that 19.4% or 14 of the total 72 families live below the poverty line. Families with 1 or 2 children have the highest poverty rate of 41.7%, comprising of 5 families. On the other hand, families with 3 or 4 children have the lowest poverty rate of 0.0%, which includes 0 families.
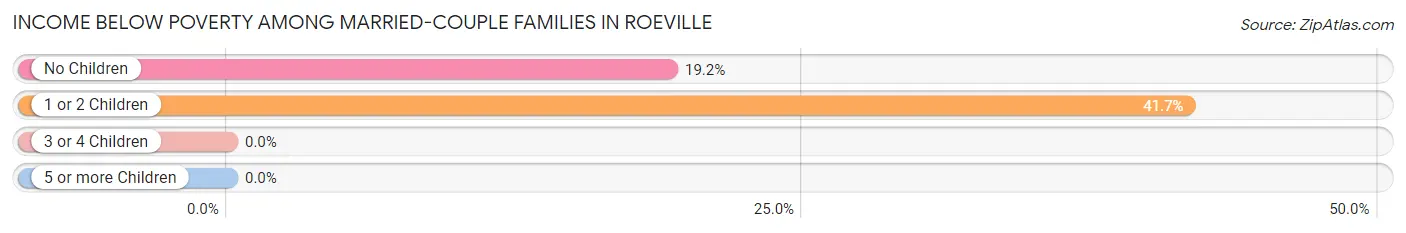
| Children | Above Poverty | Below Poverty |
| No Children | 38 (80.8%) | 9 (19.2%) |
| 1 or 2 Children | 7 (58.3%) | 5 (41.7%) |
| 3 or 4 Children | 13 (100.0%) | 0 (0.0%) |
| 5 or more Children | 0 (0.0%) | 0 (0.0%) |
| Total | 58 (80.6%) | 14 (19.4%) |
Income Below Poverty Among Single-Parent Households in Roeville
| Children | Single Father | Single Mother |
| No Children | 0 (0.0%) | 0 (0.0%) |
| 1 or 2 Children | 0 (0.0%) | 0 (0.0%) |
| 3 or 4 Children | 0 (0.0%) | 0 (0.0%) |
| 5 or more Children | 0 (0.0%) | 0 (0.0%) |
| Total | 0 (0.0%) | 0 (0.0%) |
Income Below Poverty Among Married-Couple vs Single-Parent Households in Roeville
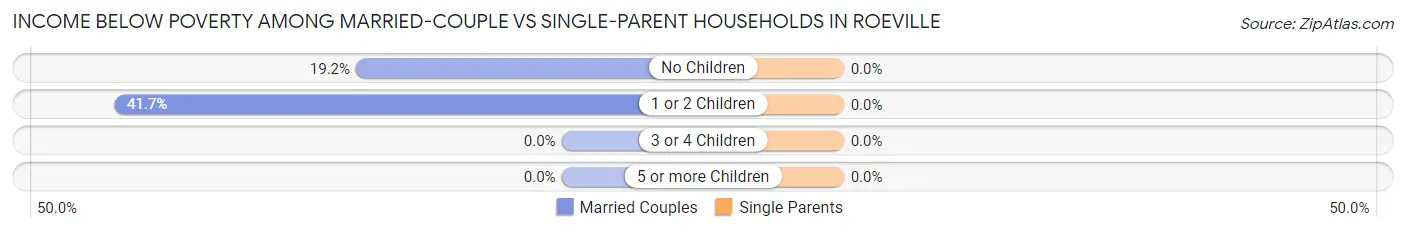
| Children | Married-Couple Families | Single-Parent Households |
| No Children | 9 (19.2%) | 0 (0.0%) |
| 1 or 2 Children | 5 (41.7%) | 0 (0.0%) |
| 3 or 4 Children | 0 (0.0%) | 0 (0.0%) |
| 5 or more Children | 0 (0.0%) | 0 (0.0%) |
| Total | 14 (19.4%) | 0 (0.0%) |
Race in Roeville
The most populous races in Roeville are White / Caucasian (425 | 100.0%), and Hispanic or Latino (67 | 15.8%).
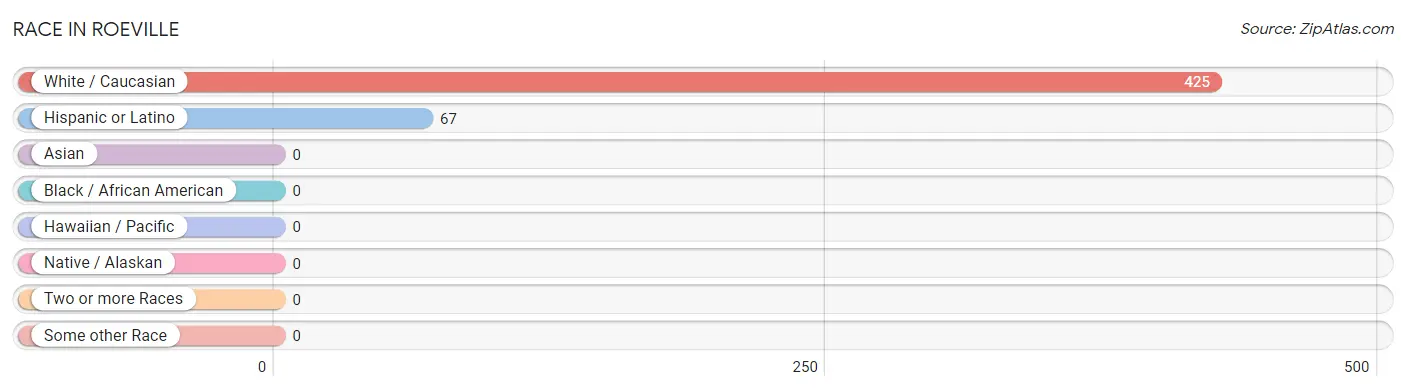
| Race | # Population | % Population |
| Asian | 0 | 0.0% |
| Black / African American | 0 | 0.0% |
| Hawaiian / Pacific | 0 | 0.0% |
| Hispanic or Latino | 67 | 15.8% |
| Native / Alaskan | 0 | 0.0% |
| White / Caucasian | 425 | 100.0% |
| Two or more Races | 0 | 0.0% |
| Some other Race | 0 | 0.0% |
| Total | 425 | 100.0% |
Ancestry in Roeville
The most populous ancestries reported in Roeville are American (67 | 15.8%), Irish (67 | 15.8%), Puerto Rican (67 | 15.8%), French Canadian (23 | 5.4%), and Norwegian (18 | 4.2%), together accounting for 56.9% of all Roeville residents.
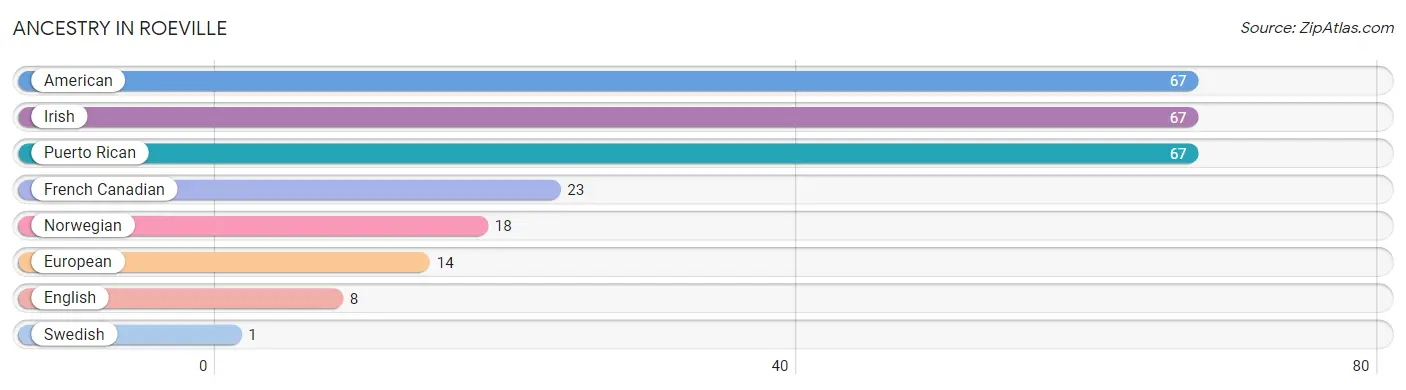
| Ancestry | # Population | % Population |
| American | 67 | 15.8% |
| English | 8 | 1.9% |
| European | 14 | 3.3% |
| French Canadian | 23 | 5.4% |
| Irish | 67 | 15.8% |
| Norwegian | 18 | 4.2% |
| Puerto Rican | 67 | 15.8% |
| Swedish | 1 | 0.2% | View All 8 Rows |
Immigrants in Roeville

| Immigration Origin | # Population | % Population | View All 0 Rows |
Sex and Age in Roeville
Sex and Age in Roeville
The most populous age groups in Roeville are 50 to 54 Years (61 | 30.6%) for men and 35 to 39 Years (62 | 27.4%) for women.
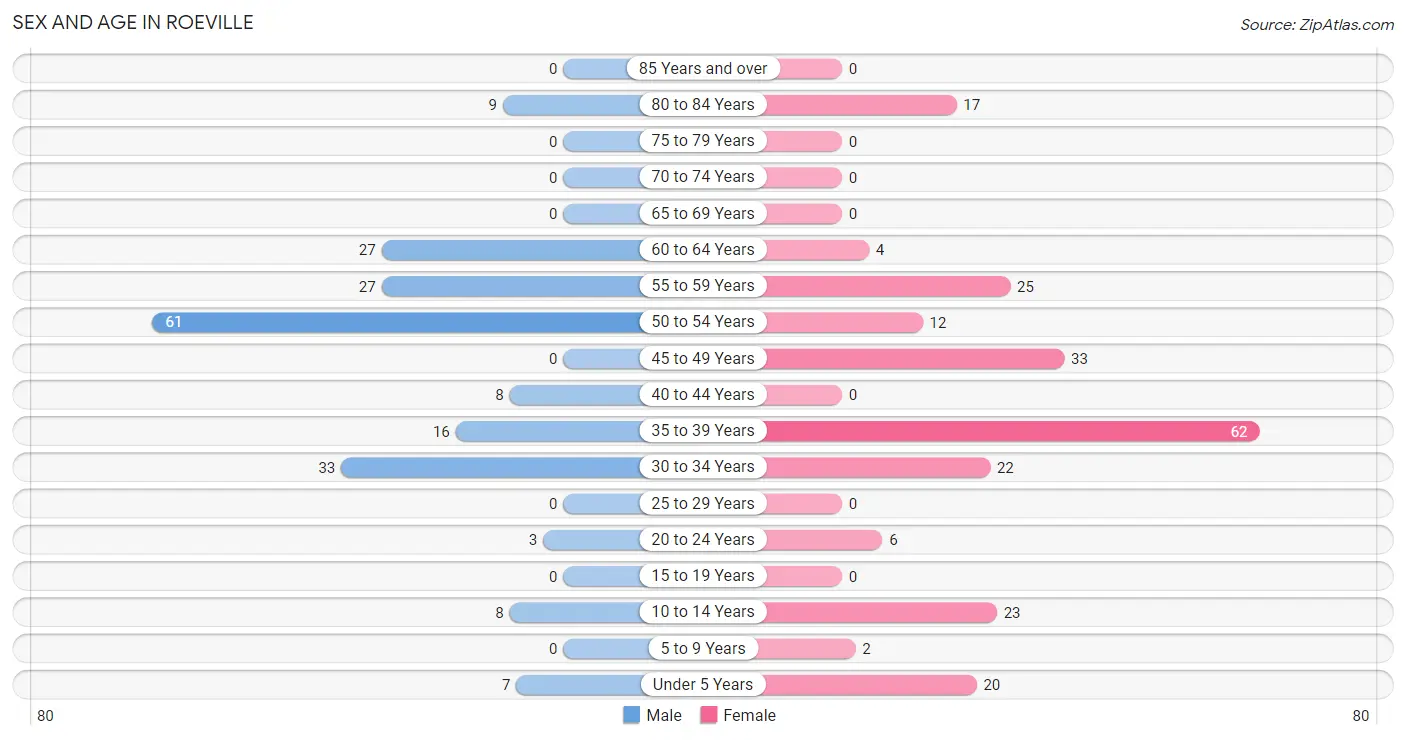
| Age Bracket | Male | Female |
| Under 5 Years | 7 (3.5%) | 20 (8.8%) |
| 5 to 9 Years | 0 (0.0%) | 2 (0.9%) |
| 10 to 14 Years | 8 (4.0%) | 23 (10.2%) |
| 15 to 19 Years | 0 (0.0%) | 0 (0.0%) |
| 20 to 24 Years | 3 (1.5%) | 6 (2.6%) |
| 25 to 29 Years | 0 (0.0%) | 0 (0.0%) |
| 30 to 34 Years | 33 (16.6%) | 22 (9.7%) |
| 35 to 39 Years | 16 (8.0%) | 62 (27.4%) |
| 40 to 44 Years | 8 (4.0%) | 0 (0.0%) |
| 45 to 49 Years | 0 (0.0%) | 33 (14.6%) |
| 50 to 54 Years | 61 (30.6%) | 12 (5.3%) |
| 55 to 59 Years | 27 (13.6%) | 25 (11.1%) |
| 60 to 64 Years | 27 (13.6%) | 4 (1.8%) |
| 65 to 69 Years | 0 (0.0%) | 0 (0.0%) |
| 70 to 74 Years | 0 (0.0%) | 0 (0.0%) |
| 75 to 79 Years | 0 (0.0%) | 0 (0.0%) |
| 80 to 84 Years | 9 (4.5%) | 17 (7.5%) |
| 85 Years and over | 0 (0.0%) | 0 (0.0%) |
| Total | 199 (100.0%) | 226 (100.0%) |
Families and Households in Roeville
Median Family Size in Roeville
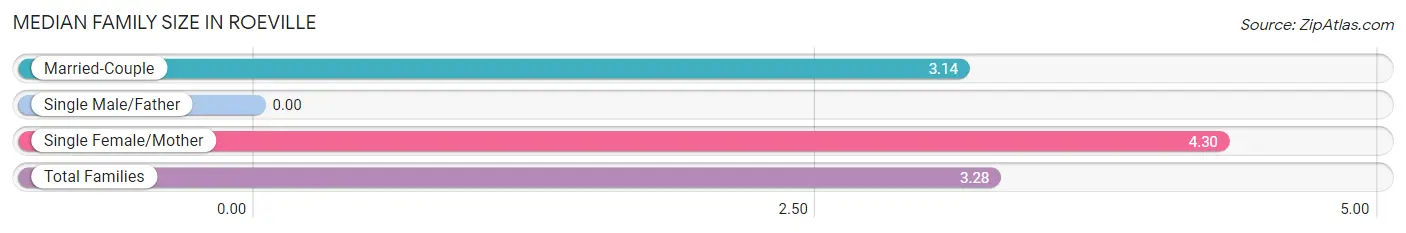
| Family Type | # Families | Family Size |
| Married-Couple | 72 (87.8%) | 3.14 |
| Single Male/Father | 0 (0.0%) | - |
| Single Female/Mother | 10 (12.2%) | 4.30 |
| Total Families | 82 (100.0%) | 3.28 |
Median Household Size in Roeville
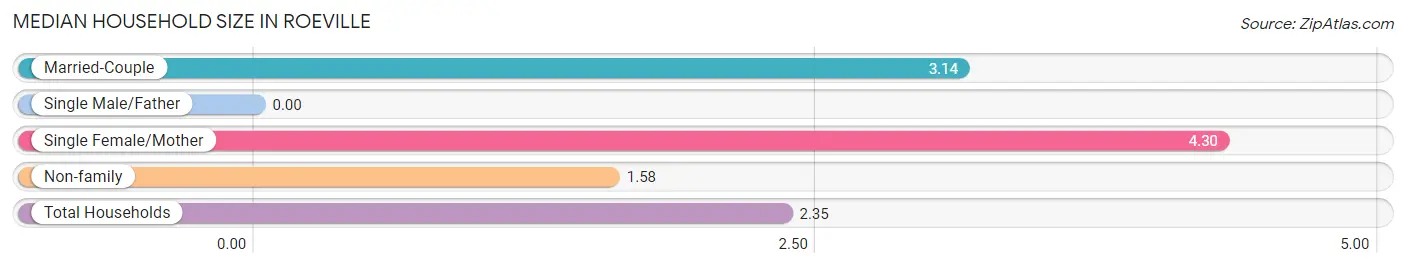
| Household Type | # Households | Household Size |
| Married-Couple | 72 (39.8%) | 3.14 |
| Single Male/Father | 0 (0.0%) | - |
| Single Female/Mother | 10 (5.5%) | 4.30 |
| Non-family | 99 (54.7%) | 1.58 |
| Total Households | 181 (100.0%) | 2.35 |
Household Size by Marriage Status in Roeville
Out of a total of 181 households in Roeville, 82 (45.3%) are family households, while 99 (54.7%) are nonfamily households. The most numerous type of family households are 3-person households, comprising 35, and the most common type of nonfamily households are 2-person households, comprising 56.
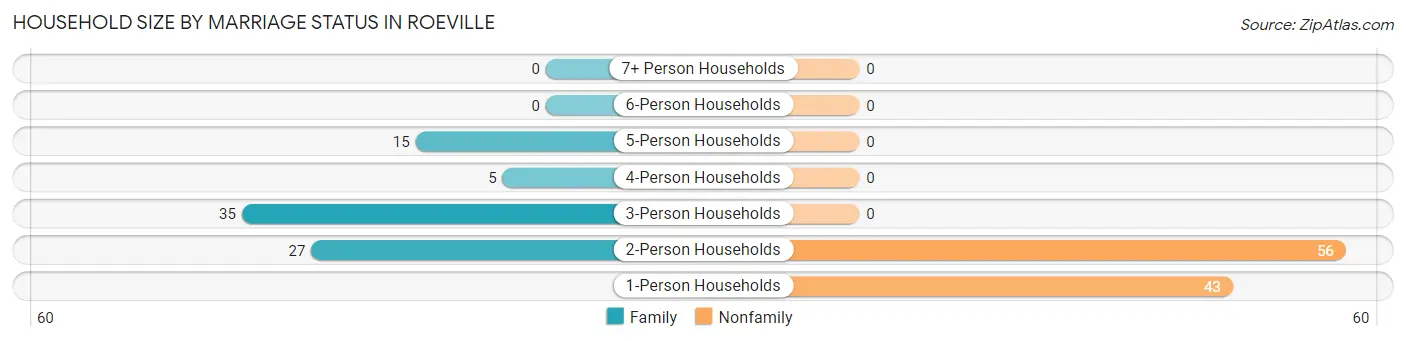
| Household Size | Family Households | Nonfamily Households |
| 1-Person Households | - | 43 (23.8%) |
| 2-Person Households | 27 (14.9%) | 56 (30.9%) |
| 3-Person Households | 35 (19.3%) | 0 (0.0%) |
| 4-Person Households | 5 (2.8%) | 0 (0.0%) |
| 5-Person Households | 15 (8.3%) | 0 (0.0%) |
| 6-Person Households | 0 (0.0%) | 0 (0.0%) |
| 7+ Person Households | 0 (0.0%) | 0 (0.0%) |
| Total | 82 (45.3%) | 99 (54.7%) |
Female Fertility in Roeville
Fertility by Age in Roeville
| Age Bracket | Women with Births | Births / 1,000 Women |
| 15 to 19 years | 0 (0.0%) | 0.0 |
| 20 to 34 years | 0 (0.0%) | 0.0 |
| 35 to 50 years | 0 (0.0%) | 0.0 |
| Total | 0 (0.0%) | 0.0 |
Fertility by Age by Marriage Status in Roeville
| Age Bracket | Married | Unmarried |
| 15 to 19 years | 0 (0.0%) | 0 (0.0%) |
| 20 to 34 years | 0 (0.0%) | 0 (0.0%) |
| 35 to 50 years | 0 (0.0%) | 0 (0.0%) |
| Total | 0 (0.0%) | 0 (0.0%) |
Fertility by Education in Roeville
| Educational Attainment | Women with Births | Births / 1,000 Women |
| Less than High School | 0 (0.0%) | 0.0 |
| High School Diploma | 0 (0.0%) | 0.0 |
| College or Associate's Degree | 0 (0.0%) | 0.0 |
| Bachelor's Degree | 0 (0.0%) | 0.0 |
| Graduate Degree | 0 (0.0%) | 0.0 |
| Total | 0 (0.0%) | 0.0 |
Fertility by Education by Marriage Status in Roeville
| Educational Attainment | Married | Unmarried |
| Less than High School | 0 (0.0%) | 0 (0.0%) |
| High School Diploma | 0 (0.0%) | 0 (0.0%) |
| College or Associate's Degree | 0 (0.0%) | 0 (0.0%) |
| Bachelor's Degree | 0 (0.0%) | 0 (0.0%) |
| Graduate Degree | 0 (0.0%) | 0 (0.0%) |
| Total | 0 (0.0%) | 0 (0.0%) |
Employment Characteristics in Roeville
Employment by Class of Employer in Roeville
Among the 273 employed individuals in Roeville, private company employees (177 | 64.8%), self-employed (not incorporated) (56 | 20.5%), and state government employees (15 | 5.5%) make up the most common classes of employment.
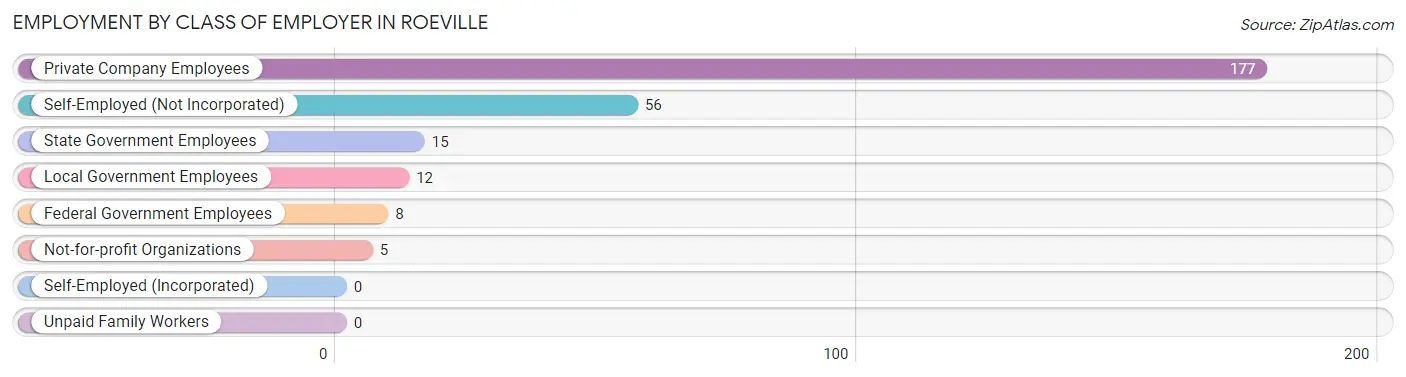
| Employer Class | # Employees | % Employees |
| Private Company Employees | 177 | 64.8% |
| Self-Employed (Incorporated) | 0 | 0.0% |
| Self-Employed (Not Incorporated) | 56 | 20.5% |
| Not-for-profit Organizations | 5 | 1.8% |
| Local Government Employees | 12 | 4.4% |
| State Government Employees | 15 | 5.5% |
| Federal Government Employees | 8 | 2.9% |
| Unpaid Family Workers | 0 | 0.0% |
| Total | 273 | 100.0% |
Employment Status by Age in Roeville
According to the labor force statistics for Roeville, out of the total population over 16 years of age (365), 77.8% or 284 individuals are in the labor force, with 3.9% or 11 of them unemployed. The age group with the highest labor force participation rate is 30 to 34 years, with 100.0% or 55 individuals in the labor force. Within the labor force, the 45 to 54 years age range has the highest percentage of unemployed individuals, with 13.9% or 11 of them being unemployed.
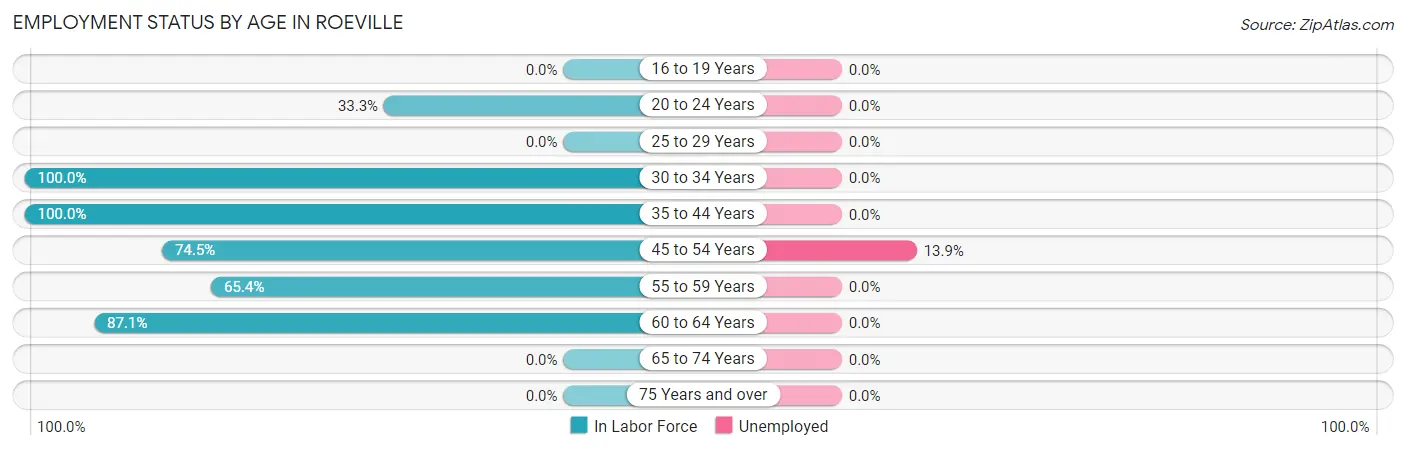
| Age Bracket | In Labor Force | Unemployed |
| 16 to 19 Years | 0 (0.0%) | 0 (0.0%) |
| 20 to 24 Years | 3 (33.3%) | 0 (0.0%) |
| 25 to 29 Years | 0 (0.0%) | 0 (0.0%) |
| 30 to 34 Years | 55 (100.0%) | 0 (0.0%) |
| 35 to 44 Years | 86 (100.0%) | 0 (0.0%) |
| 45 to 54 Years | 79 (74.5%) | 11 (13.9%) |
| 55 to 59 Years | 34 (65.4%) | 0 (0.0%) |
| 60 to 64 Years | 27 (87.1%) | 0 (0.0%) |
| 65 to 74 Years | 0 (0.0%) | 0 (0.0%) |
| 75 Years and over | 0 (0.0%) | 0 (0.0%) |
| Total | 284 (77.8%) | 11 (3.9%) |
Employment Status by Educational Attainment in Roeville
According to labor force statistics for Roeville, 85.2% of individuals (281) out of the total population between 25 and 64 years of age (330) are in the labor force, with 3.9% or 11 of them being unemployed. The group with the highest labor force participation rate are those with the educational attainment of less than high school, with 100.0% or 8 individuals in the labor force. Within the labor force, individuals with high school diploma education have the highest percentage of unemployment, with 10.2% or 11 of them being unemployed.
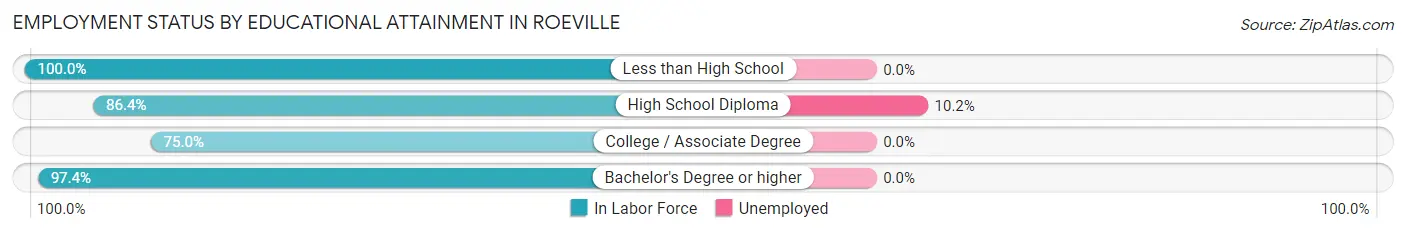
| Educational Attainment | In Labor Force | Unemployed |
| Less than High School | 8 (100.0%) | 0 (0.0%) |
| High School Diploma | 108 (86.4%) | 13 (10.2%) |
| College / Associate Degree | 90 (75.0%) | 0 (0.0%) |
| Bachelor's Degree or higher | 75 (97.4%) | 0 (0.0%) |
| Total | 281 (85.2%) | 13 (3.9%) |
Employment Occupations by Sex in Roeville
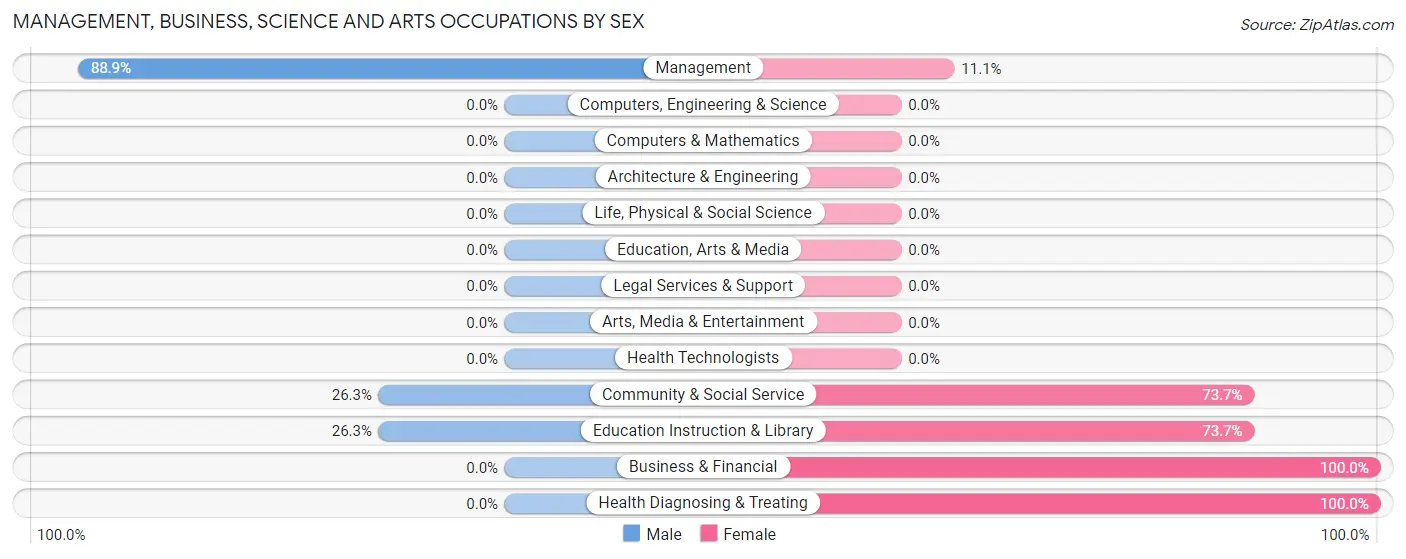
Management, Business, Science and Arts Occupations
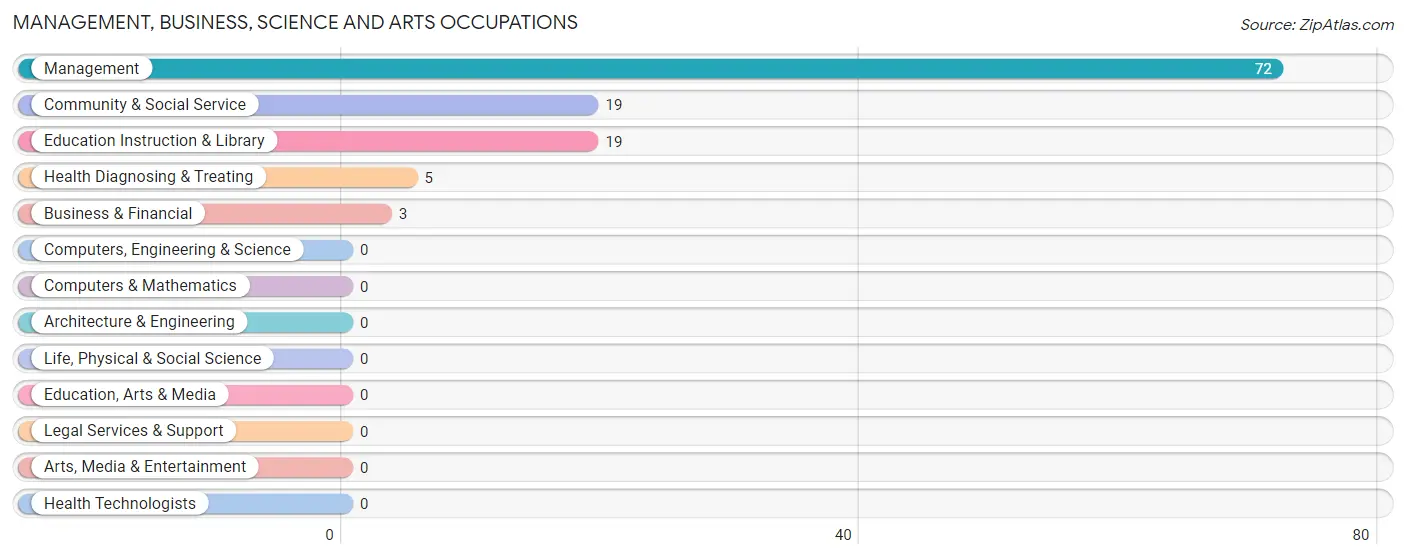
The most common Management, Business, Science and Arts occupations in Roeville are Management (72 | 26.4%), Community & Social Service (19 | 7.0%), Education Instruction & Library (19 | 7.0%), Health Diagnosing & Treating (5 | 1.8%), and Business & Financial (3 | 1.1%).
Management, Business, Science and Arts Occupations by Sex
Within the Management, Business, Science and Arts occupations in Roeville, the most male-oriented occupations are Management (88.9%), Community & Social Service (26.3%), and Education Instruction & Library (26.3%), while the most female-oriented occupations are Business & Financial (100.0%), Health Diagnosing & Treating (100.0%), and Community & Social Service (73.7%).
| Occupation | Male | Female |
| Management | 64 (88.9%) | 8 (11.1%) |
| Business & Financial | 0 (0.0%) | 3 (100.0%) |
| Computers, Engineering & Science | 0 (0.0%) | 0 (0.0%) |
| Computers & Mathematics | 0 (0.0%) | 0 (0.0%) |
| Architecture & Engineering | 0 (0.0%) | 0 (0.0%) |
| Life, Physical & Social Science | 0 (0.0%) | 0 (0.0%) |
| Community & Social Service | 5 (26.3%) | 14 (73.7%) |
| Education, Arts & Media | 0 (0.0%) | 0 (0.0%) |
| Legal Services & Support | 0 (0.0%) | 0 (0.0%) |
| Education Instruction & Library | 5 (26.3%) | 14 (73.7%) |
| Arts, Media & Entertainment | 0 (0.0%) | 0 (0.0%) |
| Health Diagnosing & Treating | 0 (0.0%) | 5 (100.0%) |
| Health Technologists | 0 (0.0%) | 0 (0.0%) |
| Total (Category) | 69 (69.7%) | 30 (30.3%) |
| Total (Overall) | 159 (58.2%) | 114 (41.8%) |
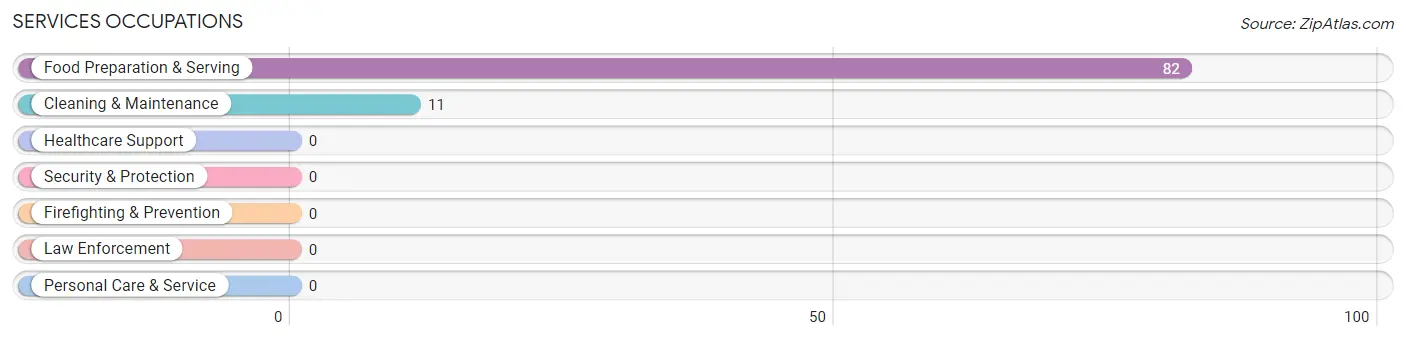
Services Occupations
The most common Services occupations in Roeville are Food Preparation & Serving (82 | 30.0%), and Cleaning & Maintenance (11 | 4.0%).
Services Occupations by Sex
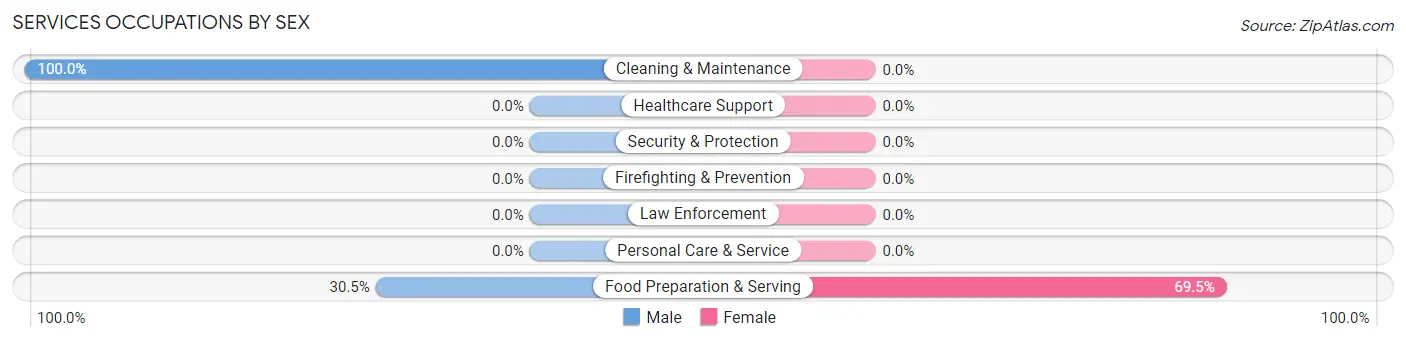
| Occupation | Male | Female |
| Healthcare Support | 0 (0.0%) | 0 (0.0%) |
| Security & Protection | 0 (0.0%) | 0 (0.0%) |
| Firefighting & Prevention | 0 (0.0%) | 0 (0.0%) |
| Law Enforcement | 0 (0.0%) | 0 (0.0%) |
| Food Preparation & Serving | 25 (30.5%) | 57 (69.5%) |
| Cleaning & Maintenance | 11 (100.0%) | 0 (0.0%) |
| Personal Care & Service | 0 (0.0%) | 0 (0.0%) |
| Total (Category) | 36 (38.7%) | 57 (61.3%) |
| Total (Overall) | 159 (58.2%) | 114 (41.8%) |
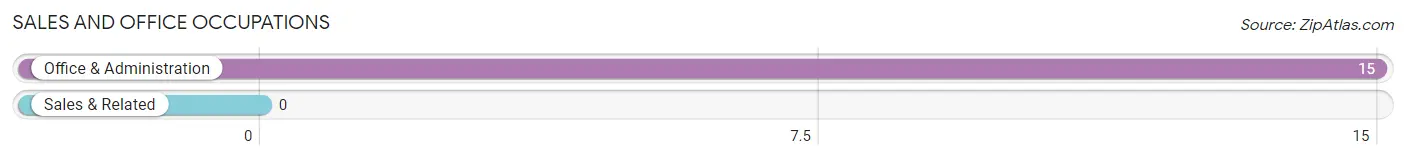
Sales and Office Occupations
The most common Sales and Office occupations in Roeville are , and Office & Administration (15 | 5.5%).
Sales and Office Occupations by Sex
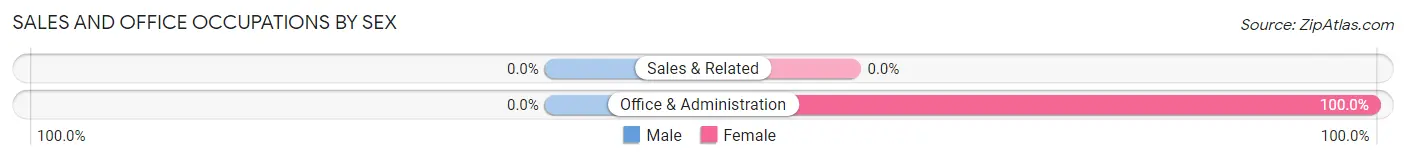
| Occupation | Male | Female |
| Sales & Related | 0 (0.0%) | 0 (0.0%) |
| Office & Administration | 0 (0.0%) | 15 (100.0%) |
| Total (Category) | 0 (0.0%) | 15 (100.0%) |
| Total (Overall) | 159 (58.2%) | 114 (41.8%) |
Natural Resources, Construction and Maintenance Occupations
The most common Natural Resources, Construction and Maintenance occupations in Roeville are Construction & Extraction (26 | 9.5%), and Installation, Maintenance & Repair (11 | 4.0%).
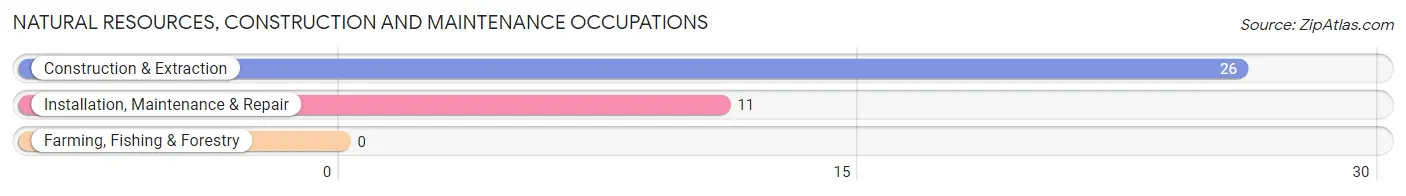
Natural Resources, Construction and Maintenance Occupations by Sex
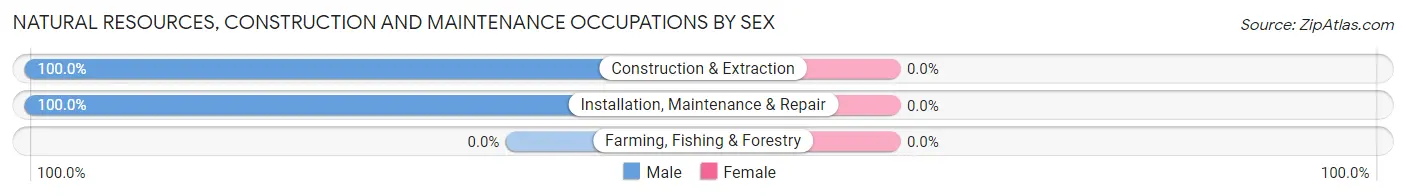
| Occupation | Male | Female |
| Farming, Fishing & Forestry | 0 (0.0%) | 0 (0.0%) |
| Construction & Extraction | 26 (100.0%) | 0 (0.0%) |
| Installation, Maintenance & Repair | 11 (100.0%) | 0 (0.0%) |
| Total (Category) | 37 (100.0%) | 0 (0.0%) |
| Total (Overall) | 159 (58.2%) | 114 (41.8%) |
Production, Transportation and Moving Occupations
The most common Production, Transportation and Moving occupations in Roeville are Material Moving (13 | 4.8%), Production (12 | 4.4%), and Transportation (4 | 1.5%).
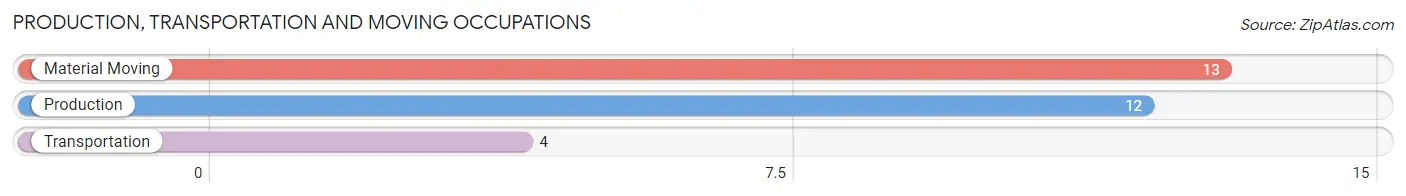
Production, Transportation and Moving Occupations by Sex
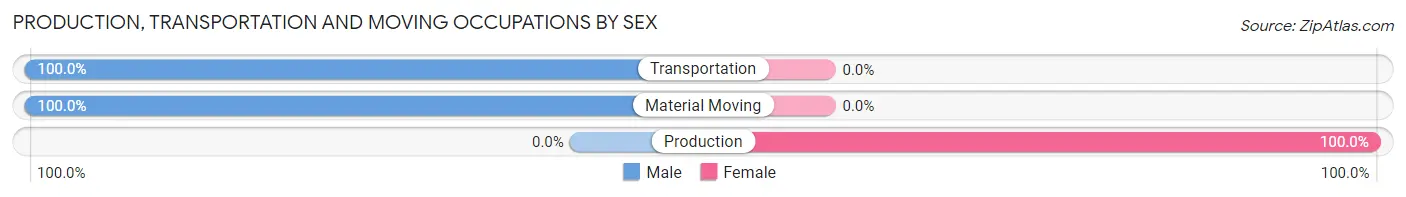
| Occupation | Male | Female |
| Production | 0 (0.0%) | 12 (100.0%) |
| Transportation | 4 (100.0%) | 0 (0.0%) |
| Material Moving | 13 (100.0%) | 0 (0.0%) |
| Total (Category) | 17 (58.6%) | 12 (41.4%) |
| Total (Overall) | 159 (58.2%) | 114 (41.8%) |
Employment Industries by Sex in Roeville
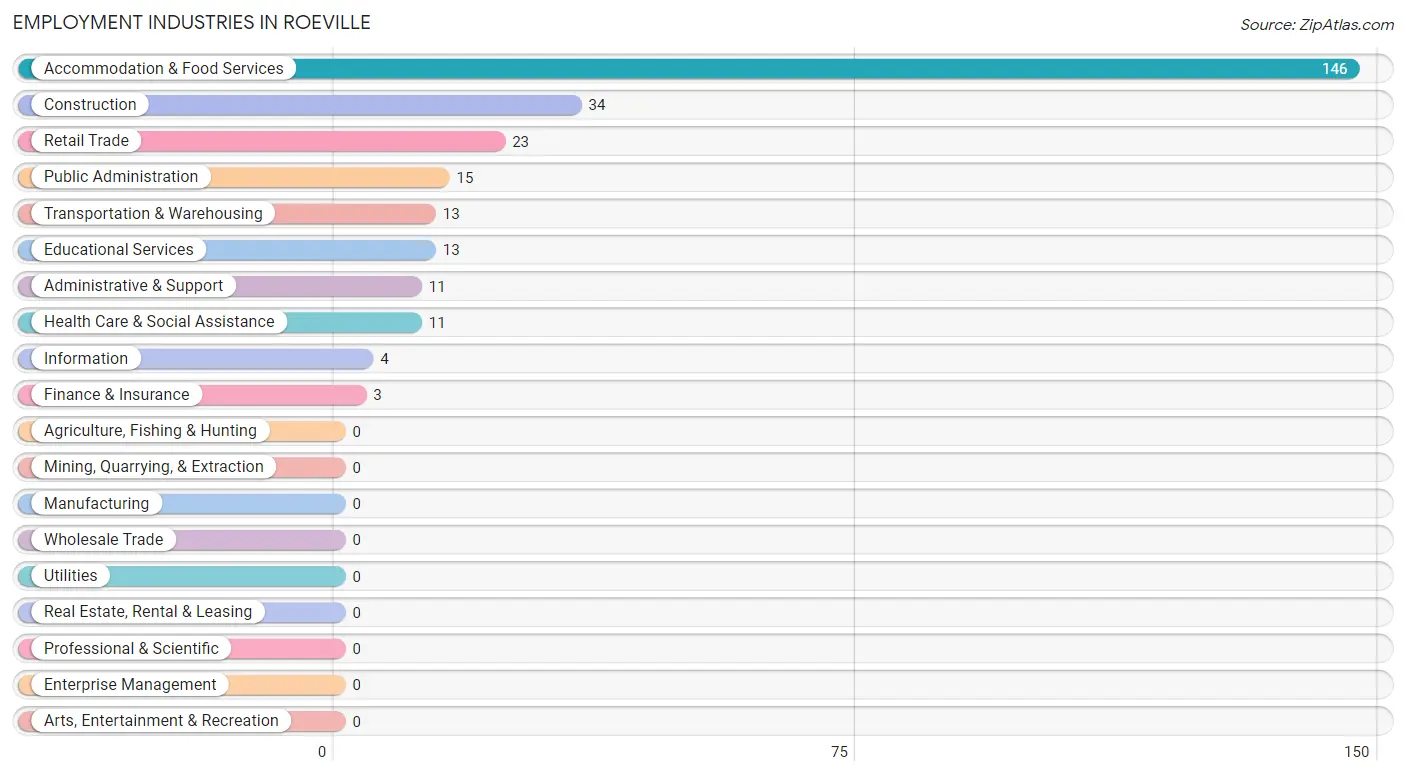
Employment Industries in Roeville
The major employment industries in Roeville include Accommodation & Food Services (146 | 53.5%), Construction (34 | 12.4%), Retail Trade (23 | 8.4%), Public Administration (15 | 5.5%), and Transportation & Warehousing (13 | 4.8%).
Employment Industries by Sex in Roeville
The Roeville industries that see more men than women are Construction (100.0%), Transportation & Warehousing (100.0%), and Information (100.0%), whereas the industries that tend to have a higher number of women are Finance & Insurance (100.0%), Health Care & Social Assistance (100.0%), and Public Administration (100.0%).
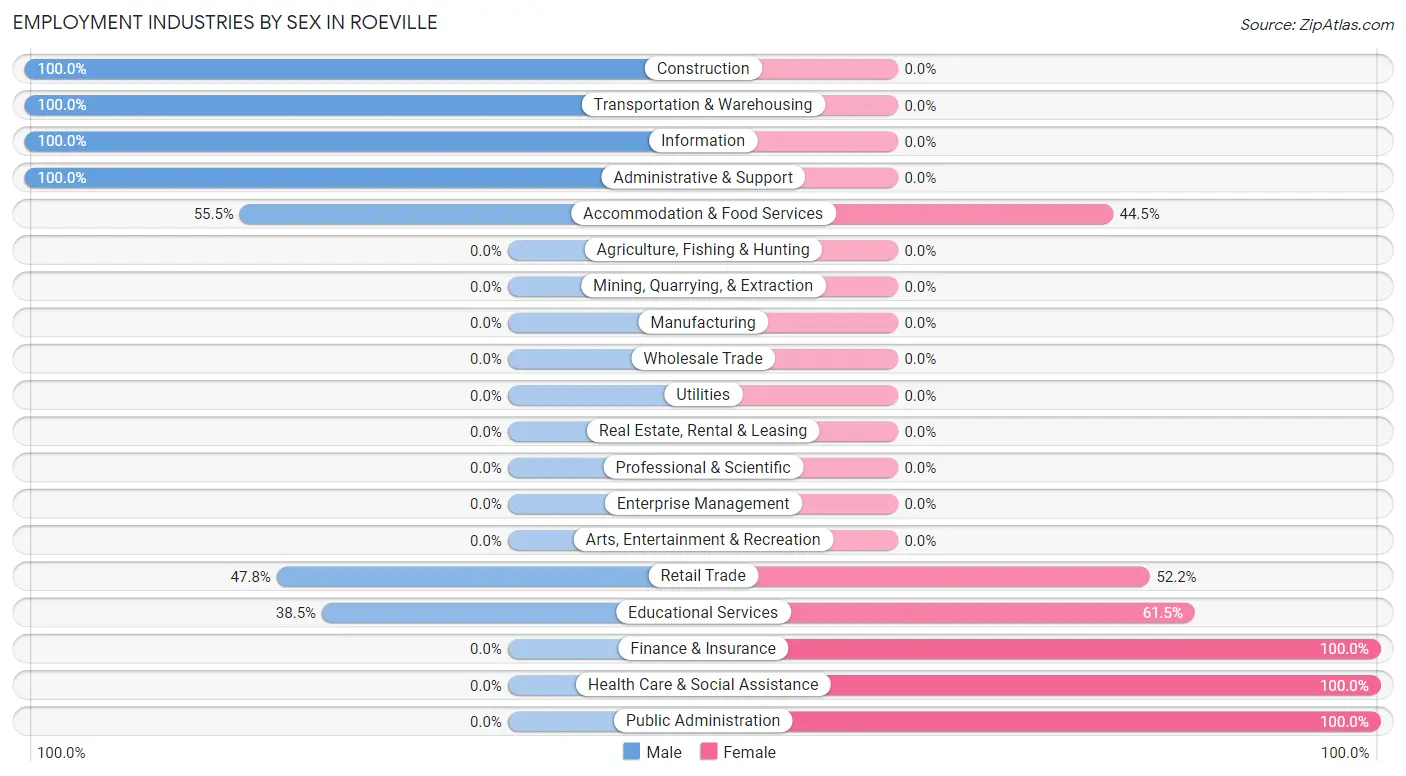
| Industry | Male | Female |
| Agriculture, Fishing & Hunting | 0 (0.0%) | 0 (0.0%) |
| Mining, Quarrying, & Extraction | 0 (0.0%) | 0 (0.0%) |
| Construction | 34 (100.0%) | 0 (0.0%) |
| Manufacturing | 0 (0.0%) | 0 (0.0%) |
| Wholesale Trade | 0 (0.0%) | 0 (0.0%) |
| Retail Trade | 11 (47.8%) | 12 (52.2%) |
| Transportation & Warehousing | 13 (100.0%) | 0 (0.0%) |
| Utilities | 0 (0.0%) | 0 (0.0%) |
| Information | 4 (100.0%) | 0 (0.0%) |
| Finance & Insurance | 0 (0.0%) | 3 (100.0%) |
| Real Estate, Rental & Leasing | 0 (0.0%) | 0 (0.0%) |
| Professional & Scientific | 0 (0.0%) | 0 (0.0%) |
| Enterprise Management | 0 (0.0%) | 0 (0.0%) |
| Administrative & Support | 11 (100.0%) | 0 (0.0%) |
| Educational Services | 5 (38.5%) | 8 (61.5%) |
| Health Care & Social Assistance | 0 (0.0%) | 11 (100.0%) |
| Arts, Entertainment & Recreation | 0 (0.0%) | 0 (0.0%) |
| Accommodation & Food Services | 81 (55.5%) | 65 (44.5%) |
| Public Administration | 0 (0.0%) | 15 (100.0%) |
| Total | 159 (58.2%) | 114 (41.8%) |
Education in Roeville
School Enrollment in Roeville
The most common levels of schooling among the 52 students in Roeville are middle school (31 | 59.6%), nursery / preschool (13 | 25.0%), and college / undergraduate (6 | 11.5%).
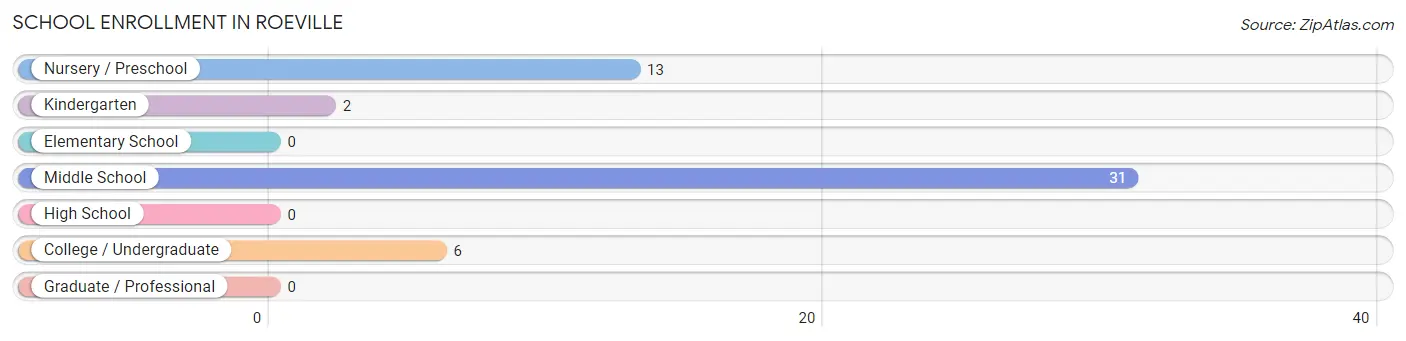
| School Level | # Students | % Students |
| Nursery / Preschool | 13 | 25.0% |
| Kindergarten | 2 | 3.8% |
| Elementary School | 0 | 0.0% |
| Middle School | 31 | 59.6% |
| High School | 0 | 0.0% |
| College / Undergraduate | 6 | 11.5% |
| Graduate / Professional | 0 | 0.0% |
| Total | 52 | 100.0% |
School Enrollment by Age by Funding Source in Roeville
Out of a total of 52 students who are enrolled in schools in Roeville, 32 (61.5%) attend a private institution, while the remaining 20 (38.5%) are enrolled in public schools. The age group of 10 to 14 year olds has the highest likelihood of being enrolled in private schools, with 25 (80.6% in the age bracket) enrolled. Conversely, the age group of 5 to 9 year old has the lowest likelihood of being enrolled in a private school, with 2 (100.0% in the age bracket) attending a public institution.
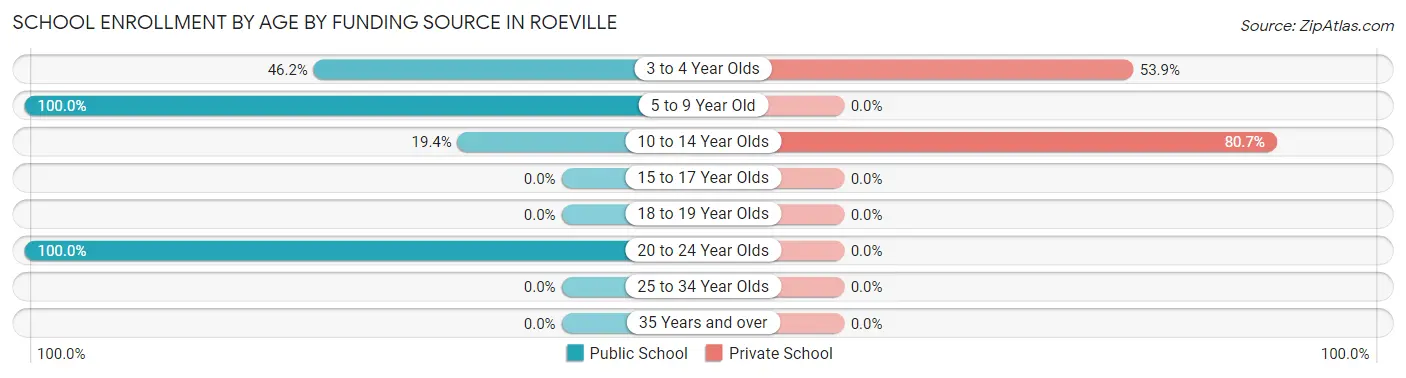
| Age Bracket | Public School | Private School |
| 3 to 4 Year Olds | 6 (46.2%) | 7 (53.8%) |
| 5 to 9 Year Old | 2 (100.0%) | 0 (0.0%) |
| 10 to 14 Year Olds | 6 (19.4%) | 25 (80.6%) |
| 15 to 17 Year Olds | 0 (0.0%) | 0 (0.0%) |
| 18 to 19 Year Olds | 0 (0.0%) | 0 (0.0%) |
| 20 to 24 Year Olds | 6 (100.0%) | 0 (0.0%) |
| 25 to 34 Year Olds | 0 (0.0%) | 0 (0.0%) |
| 35 Years and over | 0 (0.0%) | 0 (0.0%) |
| Total | 20 (38.5%) | 32 (61.5%) |
Educational Attainment by Field of Study in Roeville
Arts & humanities (58 | 75.3%), and education (19 | 24.7%) are the most common fields of study among 77 individuals in Roeville who have obtained a bachelor's degree or higher.
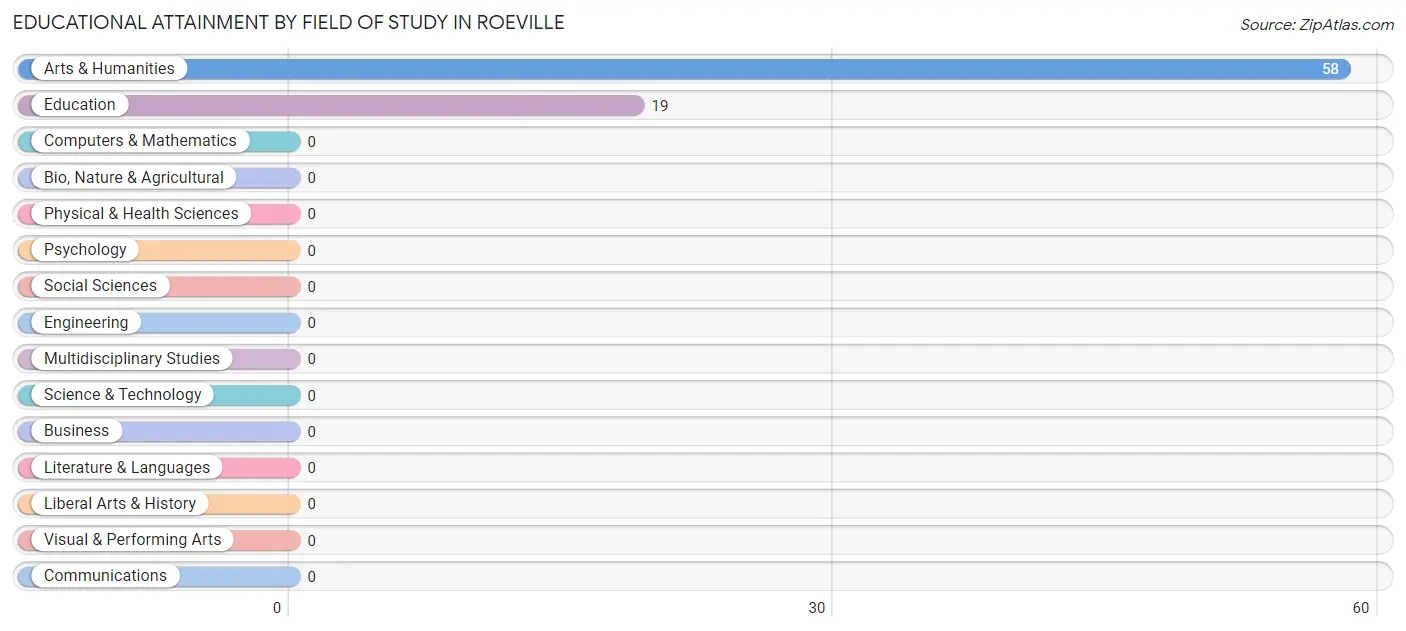
| Field of Study | # Graduates | % Graduates |
| Computers & Mathematics | 0 | 0.0% |
| Bio, Nature & Agricultural | 0 | 0.0% |
| Physical & Health Sciences | 0 | 0.0% |
| Psychology | 0 | 0.0% |
| Social Sciences | 0 | 0.0% |
| Engineering | 0 | 0.0% |
| Multidisciplinary Studies | 0 | 0.0% |
| Science & Technology | 0 | 0.0% |
| Business | 0 | 0.0% |
| Education | 19 | 24.7% |
| Literature & Languages | 0 | 0.0% |
| Liberal Arts & History | 0 | 0.0% |
| Visual & Performing Arts | 0 | 0.0% |
| Communications | 0 | 0.0% |
| Arts & Humanities | 58 | 75.3% |
| Total | 77 | 100.0% |
Transportation & Commute in Roeville
Vehicle Availability by Sex in Roeville
The most prevalent vehicle ownership categories in Roeville are males with 3 vehicles (108, accounting for 67.9%) and females with 3 vehicles (108, making up 94.7%).
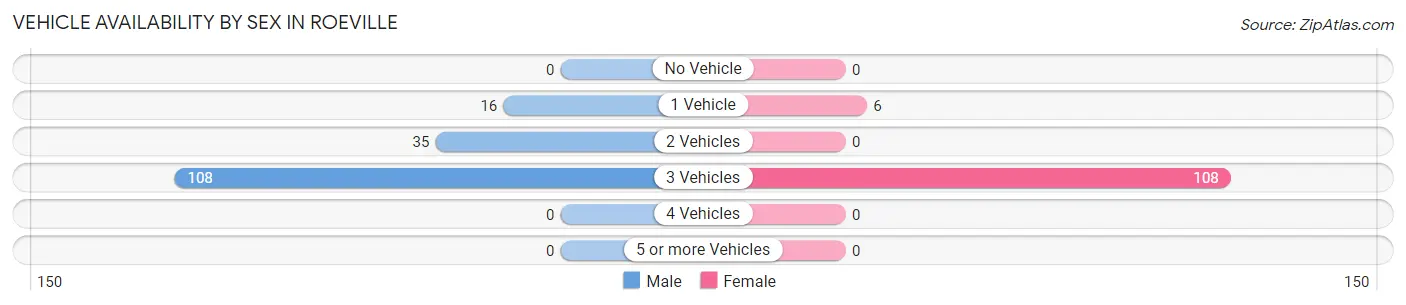
| Vehicles Available | Male | Female |
| No Vehicle | 0 (0.0%) | 0 (0.0%) |
| 1 Vehicle | 16 (10.1%) | 6 (5.3%) |
| 2 Vehicles | 35 (22.0%) | 0 (0.0%) |
| 3 Vehicles | 108 (67.9%) | 108 (94.7%) |
| 4 Vehicles | 0 (0.0%) | 0 (0.0%) |
| 5 or more Vehicles | 0 (0.0%) | 0 (0.0%) |
| Total | 159 (100.0%) | 114 (100.0%) |
Commute Time in Roeville
The most frequently occuring commute durations in Roeville are 30 to 34 minutes (91 commuters, 33.3%), 45 to 59 minutes (75 commuters, 27.5%), and 5 to 9 minutes (64 commuters, 23.4%).
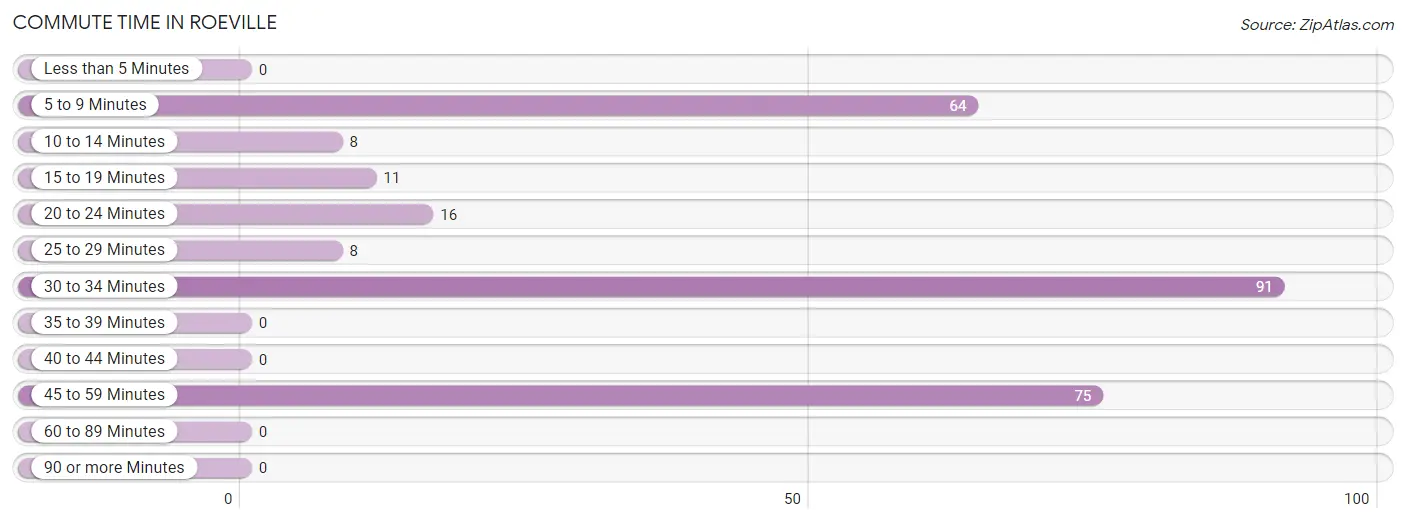
| Commute Time | # Commuters | % Commuters |
| Less than 5 Minutes | 0 | 0.0% |
| 5 to 9 Minutes | 64 | 23.4% |
| 10 to 14 Minutes | 8 | 2.9% |
| 15 to 19 Minutes | 11 | 4.0% |
| 20 to 24 Minutes | 16 | 5.9% |
| 25 to 29 Minutes | 8 | 2.9% |
| 30 to 34 Minutes | 91 | 33.3% |
| 35 to 39 Minutes | 0 | 0.0% |
| 40 to 44 Minutes | 0 | 0.0% |
| 45 to 59 Minutes | 75 | 27.5% |
| 60 to 89 Minutes | 0 | 0.0% |
| 90 or more Minutes | 0 | 0.0% |
Commute Time by Sex in Roeville
The most common commute times in Roeville are 5 to 9 minutes (64 commuters, 40.3%) for males and 30 to 34 minutes (57 commuters, 50.0%) for females.
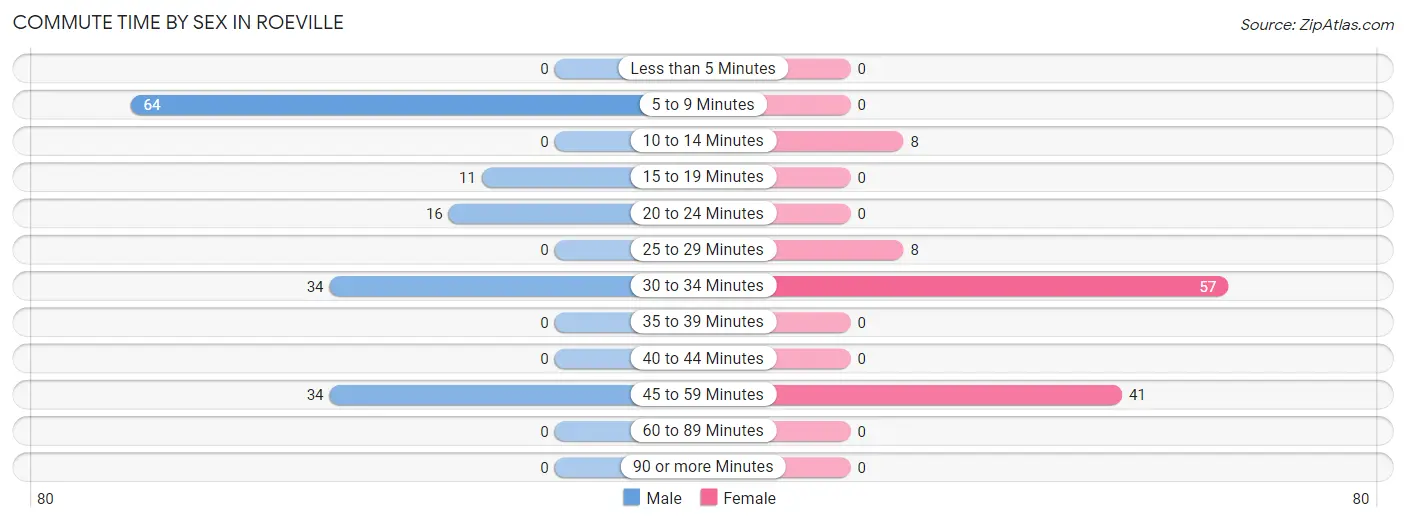
| Commute Time | Male | Female |
| Less than 5 Minutes | 0 (0.0%) | 0 (0.0%) |
| 5 to 9 Minutes | 64 (40.3%) | 0 (0.0%) |
| 10 to 14 Minutes | 0 (0.0%) | 8 (7.0%) |
| 15 to 19 Minutes | 11 (6.9%) | 0 (0.0%) |
| 20 to 24 Minutes | 16 (10.1%) | 0 (0.0%) |
| 25 to 29 Minutes | 0 (0.0%) | 8 (7.0%) |
| 30 to 34 Minutes | 34 (21.4%) | 57 (50.0%) |
| 35 to 39 Minutes | 0 (0.0%) | 0 (0.0%) |
| 40 to 44 Minutes | 0 (0.0%) | 0 (0.0%) |
| 45 to 59 Minutes | 34 (21.4%) | 41 (36.0%) |
| 60 to 89 Minutes | 0 (0.0%) | 0 (0.0%) |
| 90 or more Minutes | 0 (0.0%) | 0 (0.0%) |
Time of Departure to Work by Sex in Roeville
The most frequent times of departure to work in Roeville are 4:00 PM to 11:59 PM (89, 56.0%) for males and 6:00 AM to 6:29 AM (84, 73.7%) for females.
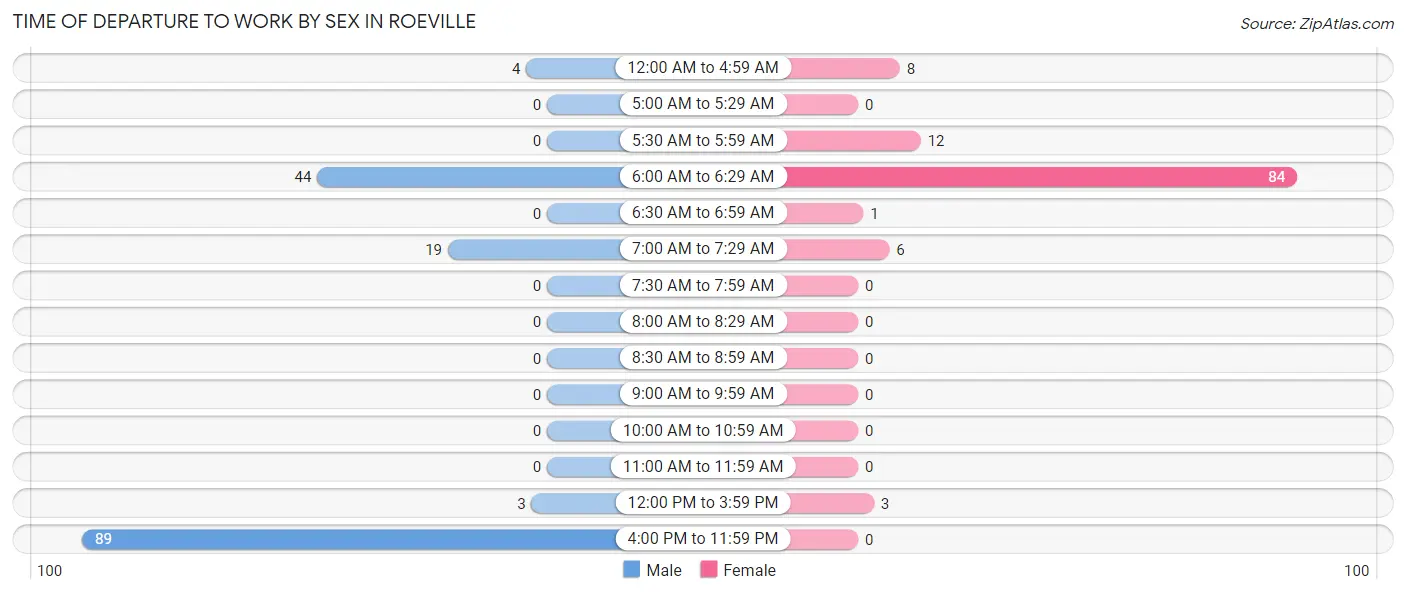
| Time of Departure | Male | Female |
| 12:00 AM to 4:59 AM | 4 (2.5%) | 8 (7.0%) |
| 5:00 AM to 5:29 AM | 0 (0.0%) | 0 (0.0%) |
| 5:30 AM to 5:59 AM | 0 (0.0%) | 12 (10.5%) |
| 6:00 AM to 6:29 AM | 44 (27.7%) | 84 (73.7%) |
| 6:30 AM to 6:59 AM | 0 (0.0%) | 1 (0.9%) |
| 7:00 AM to 7:29 AM | 19 (11.9%) | 6 (5.3%) |
| 7:30 AM to 7:59 AM | 0 (0.0%) | 0 (0.0%) |
| 8:00 AM to 8:29 AM | 0 (0.0%) | 0 (0.0%) |
| 8:30 AM to 8:59 AM | 0 (0.0%) | 0 (0.0%) |
| 9:00 AM to 9:59 AM | 0 (0.0%) | 0 (0.0%) |
| 10:00 AM to 10:59 AM | 0 (0.0%) | 0 (0.0%) |
| 11:00 AM to 11:59 AM | 0 (0.0%) | 0 (0.0%) |
| 12:00 PM to 3:59 PM | 3 (1.9%) | 3 (2.6%) |
| 4:00 PM to 11:59 PM | 89 (56.0%) | 0 (0.0%) |
| Total | 159 (100.0%) | 114 (100.0%) |
Housing Occupancy in Roeville
Occupancy by Ownership in Roeville
Of the total 181 dwellings in Roeville, owner-occupied units account for 138 (76.2%), while renter-occupied units make up 43 (23.8%).
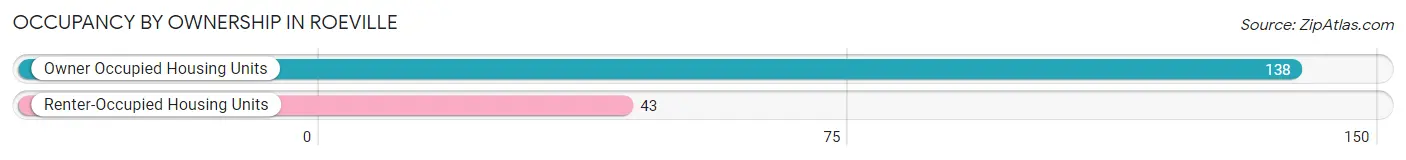
| Occupancy | # Housing Units | % Housing Units |
| Owner Occupied Housing Units | 138 | 76.2% |
| Renter-Occupied Housing Units | 43 | 23.8% |
| Total Occupied Housing Units | 181 | 100.0% |
Occupancy by Household Size in Roeville
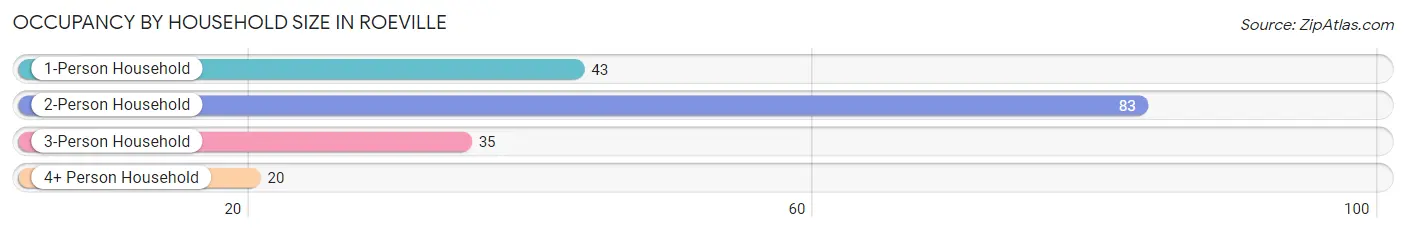
| Household Size | # Housing Units | % Housing Units |
| 1-Person Household | 43 | 23.8% |
| 2-Person Household | 83 | 45.9% |
| 3-Person Household | 35 | 19.3% |
| 4+ Person Household | 20 | 11.1% |
| Total Housing Units | 181 | 100.0% |
Occupancy by Ownership by Household Size in Roeville
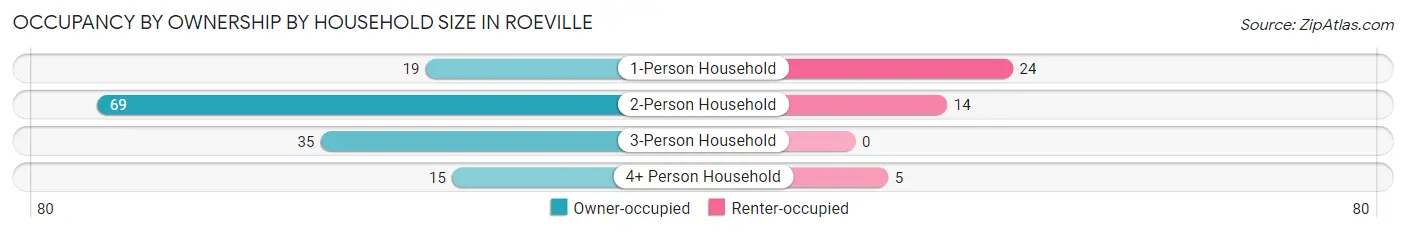
| Household Size | Owner-occupied | Renter-occupied |
| 1-Person Household | 19 (44.2%) | 24 (55.8%) |
| 2-Person Household | 69 (83.1%) | 14 (16.9%) |
| 3-Person Household | 35 (100.0%) | 0 (0.0%) |
| 4+ Person Household | 15 (75.0%) | 5 (25.0%) |
| Total Housing Units | 138 (76.2%) | 43 (23.8%) |
Occupancy by Educational Attainment in Roeville
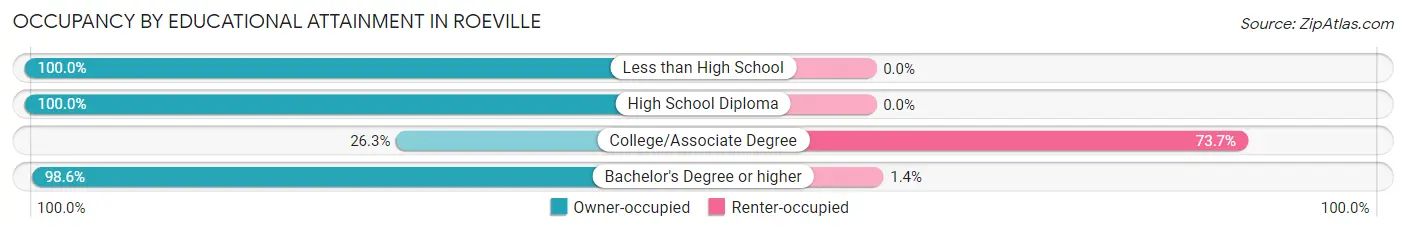
| Household Size | Owner-occupied | Renter-occupied |
| Less than High School | 8 (100.0%) | 0 (0.0%) |
| High School Diploma | 45 (100.0%) | 0 (0.0%) |
| College/Associate Degree | 15 (26.3%) | 42 (73.7%) |
| Bachelor's Degree or higher | 70 (98.6%) | 1 (1.4%) |
Occupancy by Age of Householder in Roeville
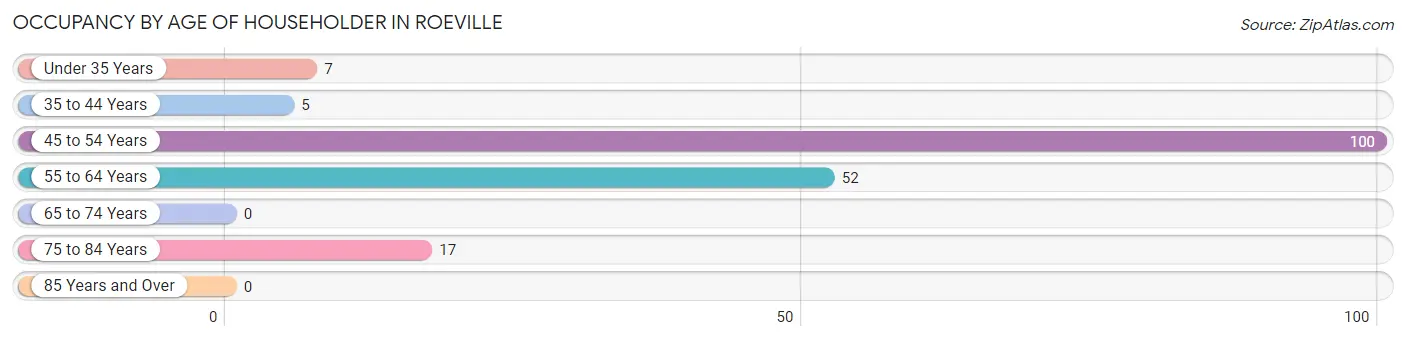
| Age Bracket | # Households | % Households |
| Under 35 Years | 7 | 3.9% |
| 35 to 44 Years | 5 | 2.8% |
| 45 to 54 Years | 100 | 55.2% |
| 55 to 64 Years | 52 | 28.7% |
| 65 to 74 Years | 0 | 0.0% |
| 75 to 84 Years | 17 | 9.4% |
| 85 Years and Over | 0 | 0.0% |
| Total | 181 | 100.0% |
Housing Finances in Roeville
Median Income by Occupancy in Roeville
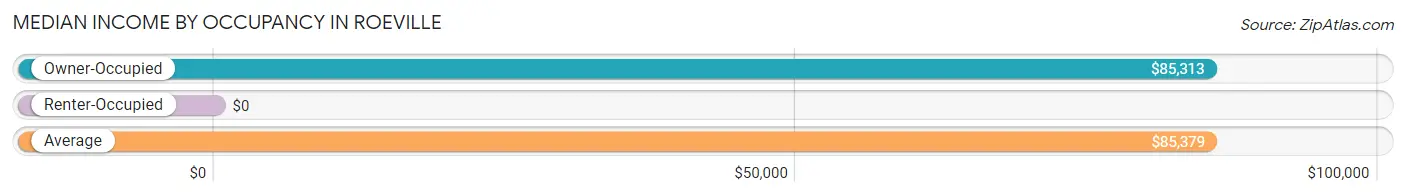
| Occupancy Type | # Households | Median Income |
| Owner-Occupied | 138 (76.2%) | $85,313 |
| Renter-Occupied | 43 (23.8%) | $0 |
| Average | 181 (100.0%) | $85,379 |
Occupancy by Householder Income Bracket in Roeville
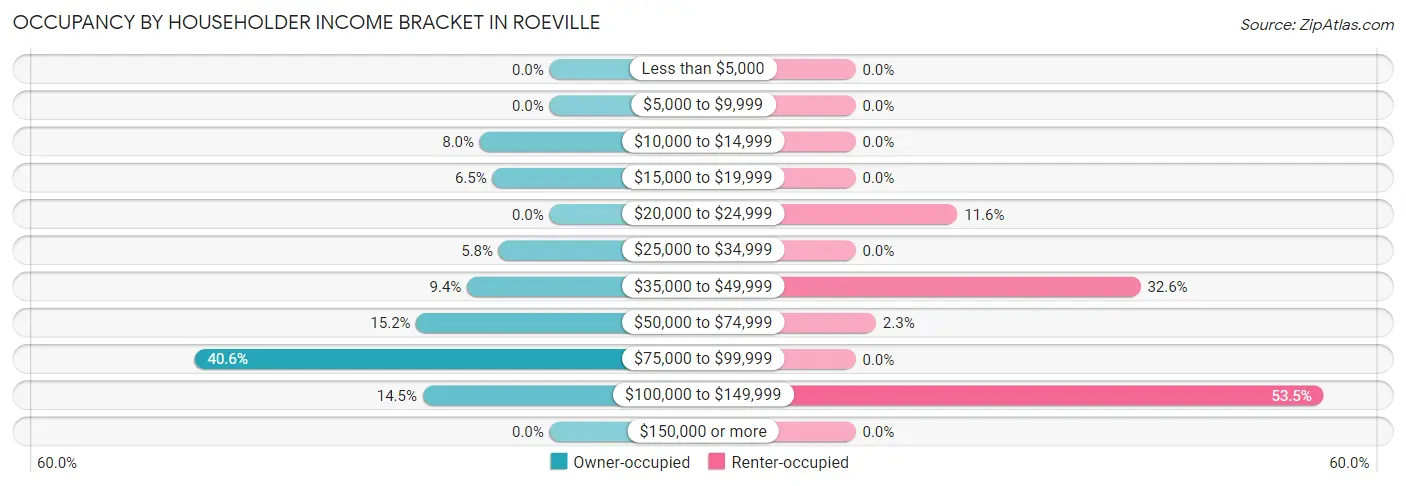
| Income Bracket | Owner-occupied | Renter-occupied |
| Less than $5,000 | 0 (0.0%) | 0 (0.0%) |
| $5,000 to $9,999 | 0 (0.0%) | 0 (0.0%) |
| $10,000 to $14,999 | 11 (8.0%) | 0 (0.0%) |
| $15,000 to $19,999 | 9 (6.5%) | 0 (0.0%) |
| $20,000 to $24,999 | 0 (0.0%) | 5 (11.6%) |
| $25,000 to $34,999 | 8 (5.8%) | 0 (0.0%) |
| $35,000 to $49,999 | 13 (9.4%) | 14 (32.6%) |
| $50,000 to $74,999 | 21 (15.2%) | 1 (2.3%) |
| $75,000 to $99,999 | 56 (40.6%) | 0 (0.0%) |
| $100,000 to $149,999 | 20 (14.5%) | 23 (53.5%) |
| $150,000 or more | 0 (0.0%) | 0 (0.0%) |
| Total | 138 (100.0%) | 43 (100.0%) |
Monthly Housing Cost Tiers in Roeville
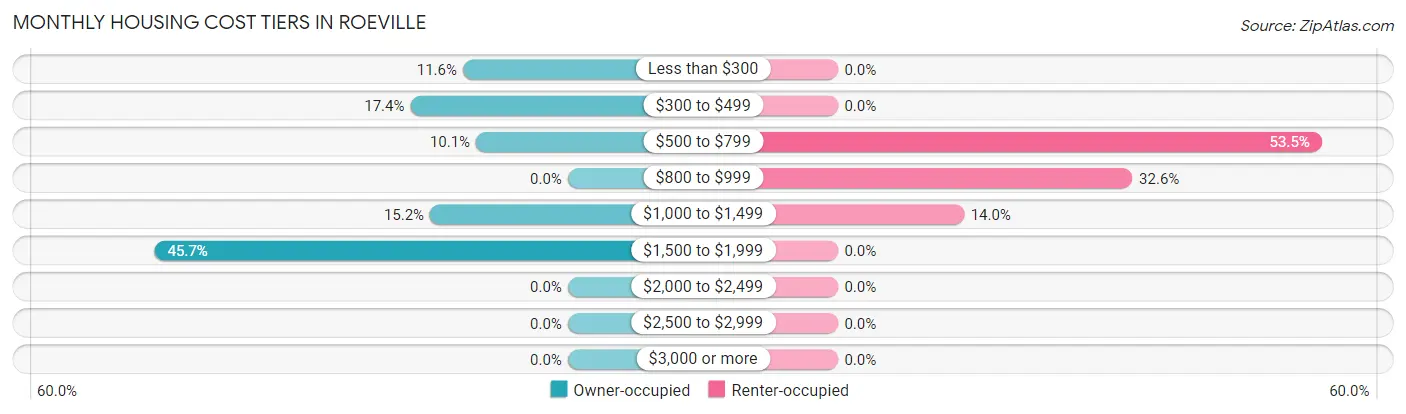
| Monthly Cost | Owner-occupied | Renter-occupied |
| Less than $300 | 16 (11.6%) | 0 (0.0%) |
| $300 to $499 | 24 (17.4%) | 0 (0.0%) |
| $500 to $799 | 14 (10.1%) | 23 (53.5%) |
| $800 to $999 | 0 (0.0%) | 14 (32.6%) |
| $1,000 to $1,499 | 21 (15.2%) | 6 (14.0%) |
| $1,500 to $1,999 | 63 (45.7%) | 0 (0.0%) |
| $2,000 to $2,499 | 0 (0.0%) | 0 (0.0%) |
| $2,500 to $2,999 | 0 (0.0%) | 0 (0.0%) |
| $3,000 or more | 0 (0.0%) | 0 (0.0%) |
| Total | 138 (100.0%) | 43 (100.0%) |
Physical Housing Characteristics in Roeville
Housing Structures in Roeville
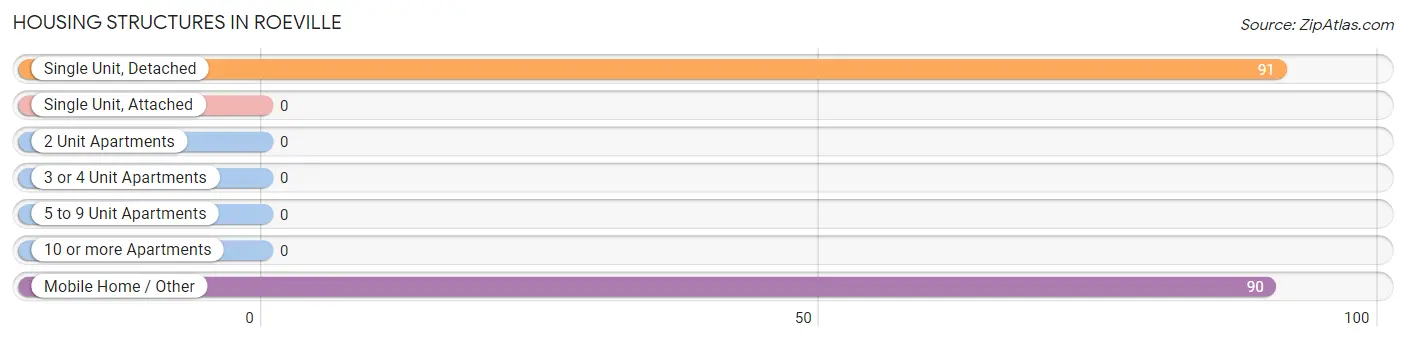
| Structure Type | # Housing Units | % Housing Units |
| Single Unit, Detached | 91 | 50.3% |
| Single Unit, Attached | 0 | 0.0% |
| 2 Unit Apartments | 0 | 0.0% |
| 3 or 4 Unit Apartments | 0 | 0.0% |
| 5 to 9 Unit Apartments | 0 | 0.0% |
| 10 or more Apartments | 0 | 0.0% |
| Mobile Home / Other | 90 | 49.7% |
| Total | 181 | 100.0% |
Housing Structures by Occupancy in Roeville
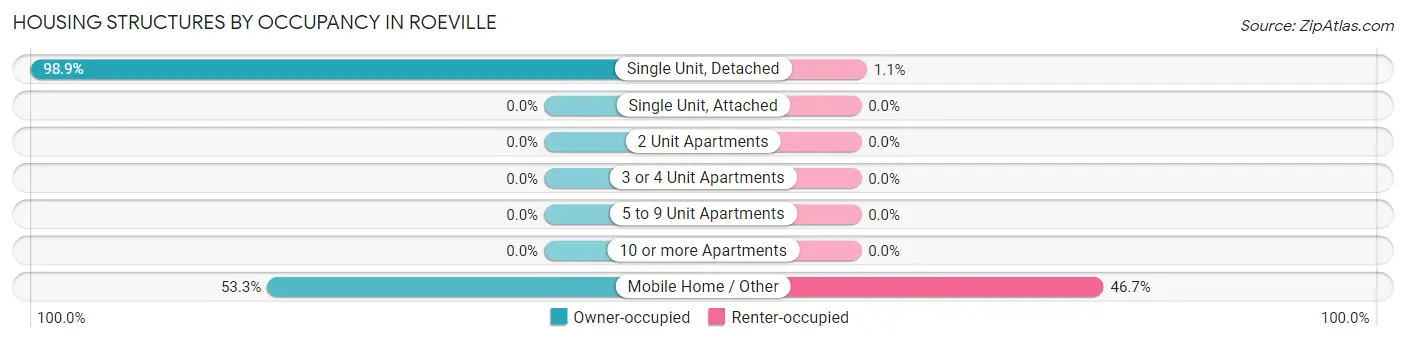
| Structure Type | Owner-occupied | Renter-occupied |
| Single Unit, Detached | 90 (98.9%) | 1 (1.1%) |
| Single Unit, Attached | 0 (0.0%) | 0 (0.0%) |
| 2 Unit Apartments | 0 (0.0%) | 0 (0.0%) |
| 3 or 4 Unit Apartments | 0 (0.0%) | 0 (0.0%) |
| 5 to 9 Unit Apartments | 0 (0.0%) | 0 (0.0%) |
| 10 or more Apartments | 0 (0.0%) | 0 (0.0%) |
| Mobile Home / Other | 48 (53.3%) | 42 (46.7%) |
| Total | 138 (76.2%) | 43 (23.8%) |
Housing Structures by Number of Rooms in Roeville
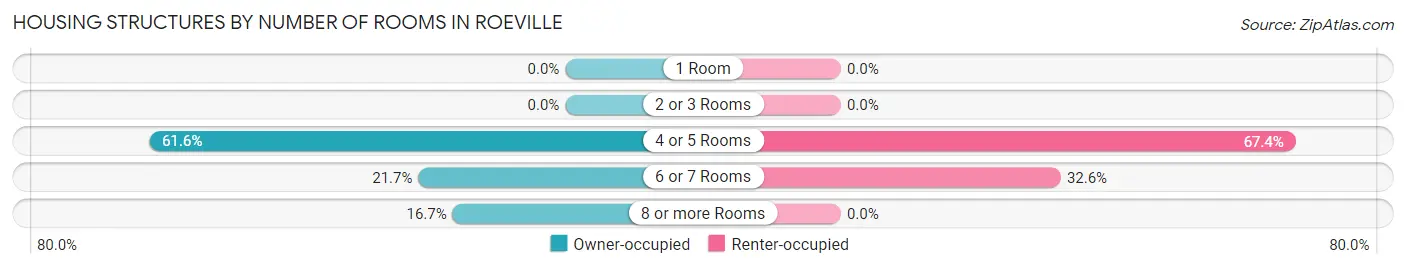
| Number of Rooms | Owner-occupied | Renter-occupied |
| 1 Room | 0 (0.0%) | 0 (0.0%) |
| 2 or 3 Rooms | 0 (0.0%) | 0 (0.0%) |
| 4 or 5 Rooms | 85 (61.6%) | 29 (67.4%) |
| 6 or 7 Rooms | 30 (21.7%) | 14 (32.6%) |
| 8 or more Rooms | 23 (16.7%) | 0 (0.0%) |
| Total | 138 (100.0%) | 43 (100.0%) |
Housing Structure by Heating Type in Roeville
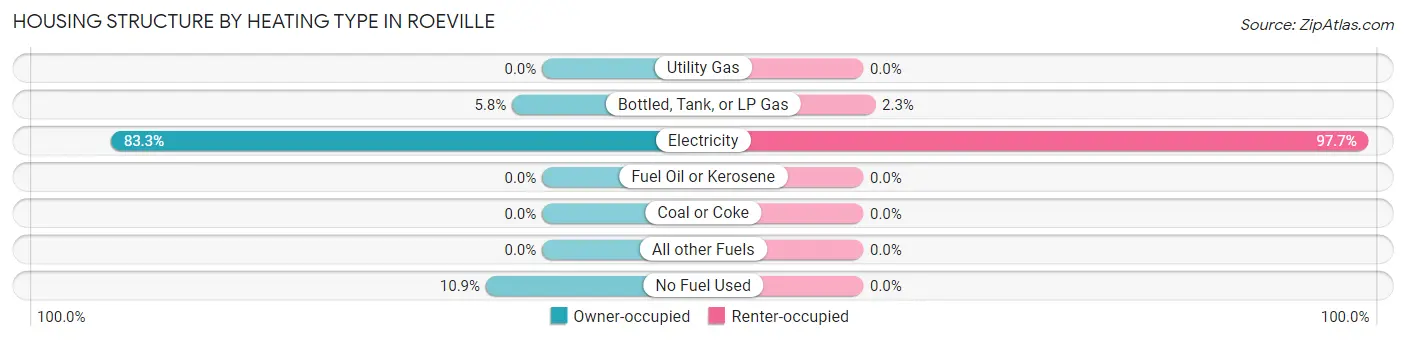
| Heating Type | Owner-occupied | Renter-occupied |
| Utility Gas | 0 (0.0%) | 0 (0.0%) |
| Bottled, Tank, or LP Gas | 8 (5.8%) | 1 (2.3%) |
| Electricity | 115 (83.3%) | 42 (97.7%) |
| Fuel Oil or Kerosene | 0 (0.0%) | 0 (0.0%) |
| Coal or Coke | 0 (0.0%) | 0 (0.0%) |
| All other Fuels | 0 (0.0%) | 0 (0.0%) |
| No Fuel Used | 15 (10.9%) | 0 (0.0%) |
| Total | 138 (100.0%) | 43 (100.0%) |
Household Vehicle Usage in Roeville
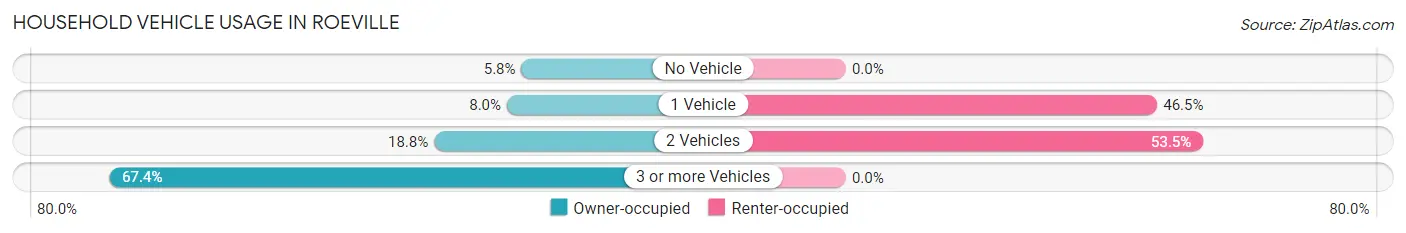
| Vehicles per Household | Owner-occupied | Renter-occupied |
| No Vehicle | 8 (5.8%) | 0 (0.0%) |
| 1 Vehicle | 11 (8.0%) | 20 (46.5%) |
| 2 Vehicles | 26 (18.8%) | 23 (53.5%) |
| 3 or more Vehicles | 93 (67.4%) | 0 (0.0%) |
| Total | 138 (100.0%) | 43 (100.0%) |
Real Estate & Mortgages in Roeville
Real Estate and Mortgage Overview in Roeville
| Characteristic | Without Mortgage | With Mortgage |
| Housing Units | 60 | 78 |
| Median Property Value | $104,500 | $333,900 |
| Median Household Income | - | - |
| Monthly Housing Costs | $433 | $0 |
| Real Estate Taxes | $510 | $0 |
Property Value by Mortgage Status in Roeville
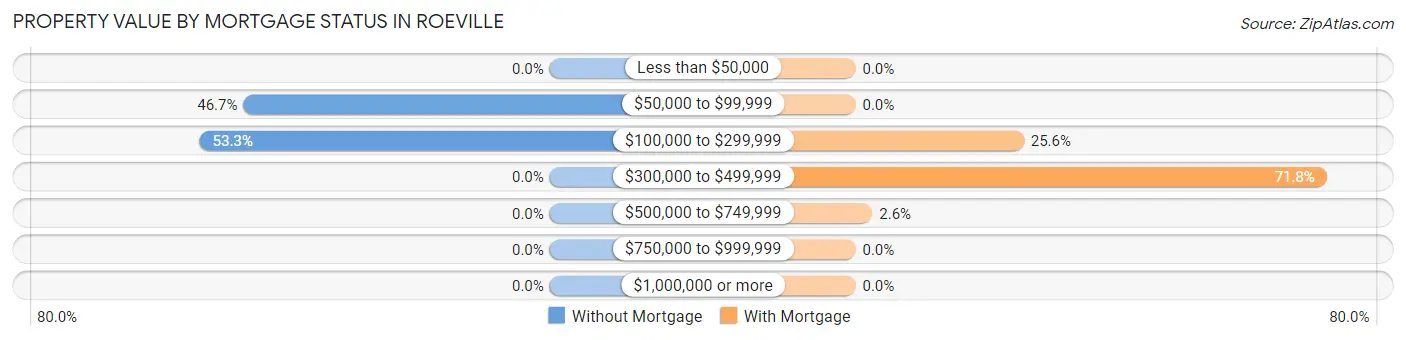
| Property Value | Without Mortgage | With Mortgage |
| Less than $50,000 | 0 (0.0%) | 0 (0.0%) |
| $50,000 to $99,999 | 28 (46.7%) | 0 (0.0%) |
| $100,000 to $299,999 | 32 (53.3%) | 20 (25.6%) |
| $300,000 to $499,999 | 0 (0.0%) | 56 (71.8%) |
| $500,000 to $749,999 | 0 (0.0%) | 2 (2.6%) |
| $750,000 to $999,999 | 0 (0.0%) | 0 (0.0%) |
| $1,000,000 or more | 0 (0.0%) | 0 (0.0%) |
| Total | 60 (100.0%) | 78 (100.0%) |
Household Income by Mortgage Status in Roeville
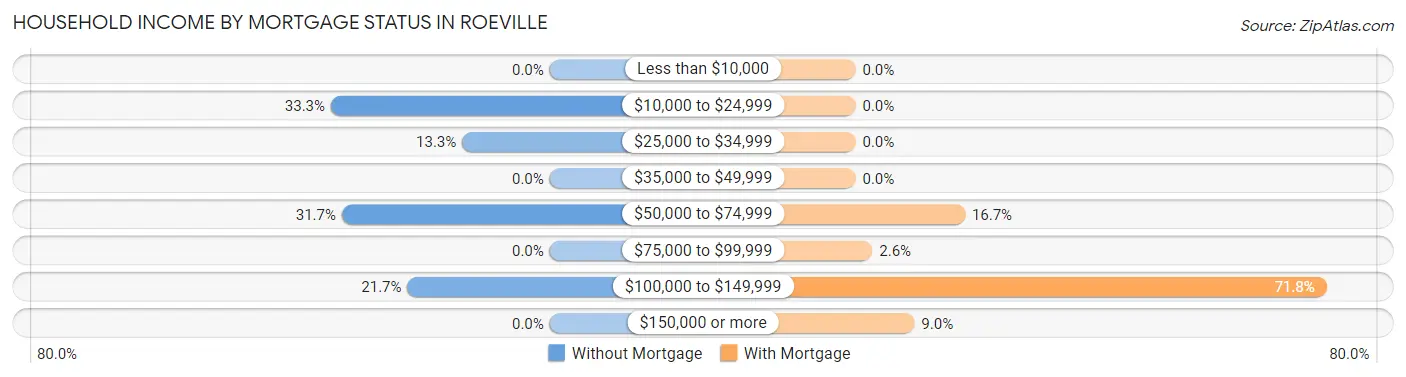
| Household Income | Without Mortgage | With Mortgage |
| Less than $10,000 | 0 (0.0%) | 0 (0.0%) |
| $10,000 to $24,999 | 20 (33.3%) | 0 (0.0%) |
| $25,000 to $34,999 | 8 (13.3%) | 0 (0.0%) |
| $35,000 to $49,999 | 0 (0.0%) | 0 (0.0%) |
| $50,000 to $74,999 | 19 (31.7%) | 13 (16.7%) |
| $75,000 to $99,999 | 0 (0.0%) | 2 (2.6%) |
| $100,000 to $149,999 | 13 (21.7%) | 56 (71.8%) |
| $150,000 or more | 0 (0.0%) | 7 (9.0%) |
| Total | 60 (100.0%) | 78 (100.0%) |
Property Value to Household Income Ratio in Roeville
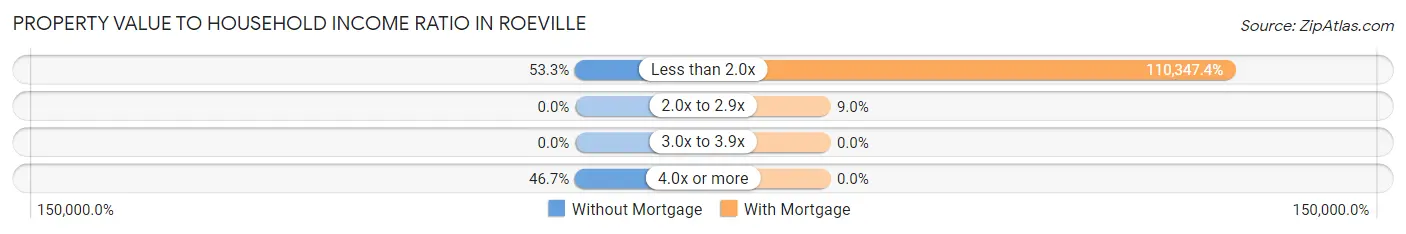
| Value-to-Income Ratio | Without Mortgage | With Mortgage |
| Less than 2.0x | 32 (53.3%) | 86,071 (110,347.4%) |
| 2.0x to 2.9x | 0 (0.0%) | 7 (9.0%) |
| 3.0x to 3.9x | 0 (0.0%) | 0 (0.0%) |
| 4.0x or more | 28 (46.7%) | 0 (0.0%) |
| Total | 60 (100.0%) | 78 (100.0%) |
Real Estate Taxes by Mortgage Status in Roeville
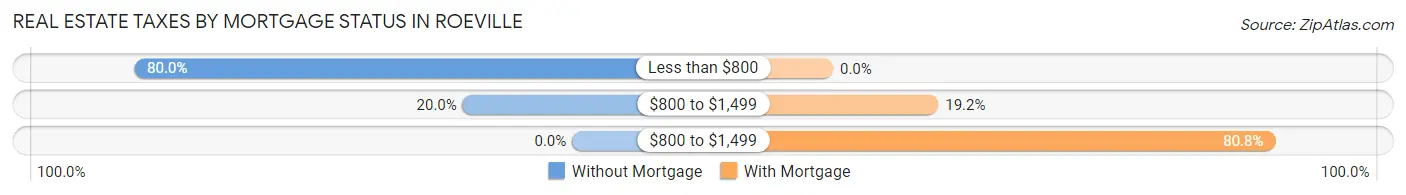
| Property Taxes | Without Mortgage | With Mortgage |
| Less than $800 | 48 (80.0%) | 0 (0.0%) |
| $800 to $1,499 | 12 (20.0%) | 15 (19.2%) |
| $800 to $1,499 | 0 (0.0%) | 63 (80.8%) |
| Total | 60 (100.0%) | 78 (100.0%) |
Health & Disability in Roeville
Health Insurance Coverage by Age in Roeville
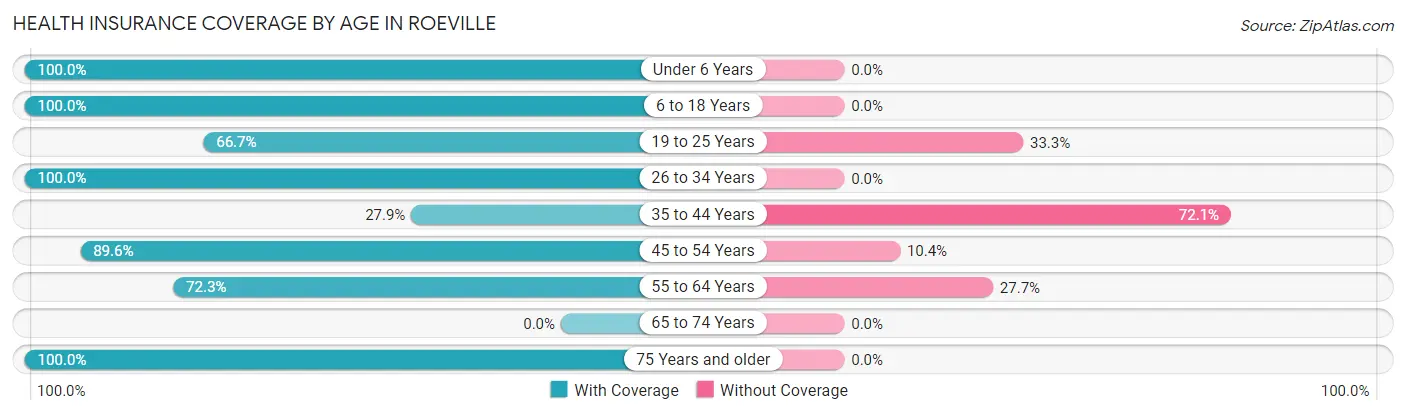
| Age Bracket | With Coverage | Without Coverage |
| Under 6 Years | 27 (100.0%) | 0 (0.0%) |
| 6 to 18 Years | 33 (100.0%) | 0 (0.0%) |
| 19 to 25 Years | 6 (66.7%) | 3 (33.3%) |
| 26 to 34 Years | 55 (100.0%) | 0 (0.0%) |
| 35 to 44 Years | 24 (27.9%) | 62 (72.1%) |
| 45 to 54 Years | 95 (89.6%) | 11 (10.4%) |
| 55 to 64 Years | 60 (72.3%) | 23 (27.7%) |
| 65 to 74 Years | 0 (0.0%) | 0 (0.0%) |
| 75 Years and older | 26 (100.0%) | 0 (0.0%) |
| Total | 326 (76.7%) | 99 (23.3%) |
Health Insurance Coverage by Citizenship Status in Roeville
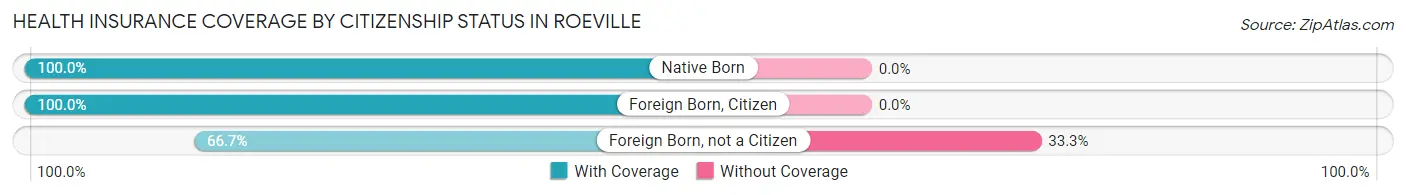
| Citizenship Status | With Coverage | Without Coverage |
| Native Born | 27 (100.0%) | 0 (0.0%) |
| Foreign Born, Citizen | 33 (100.0%) | 0 (0.0%) |
| Foreign Born, not a Citizen | 6 (66.7%) | 3 (33.3%) |
Health Insurance Coverage by Household Income in Roeville
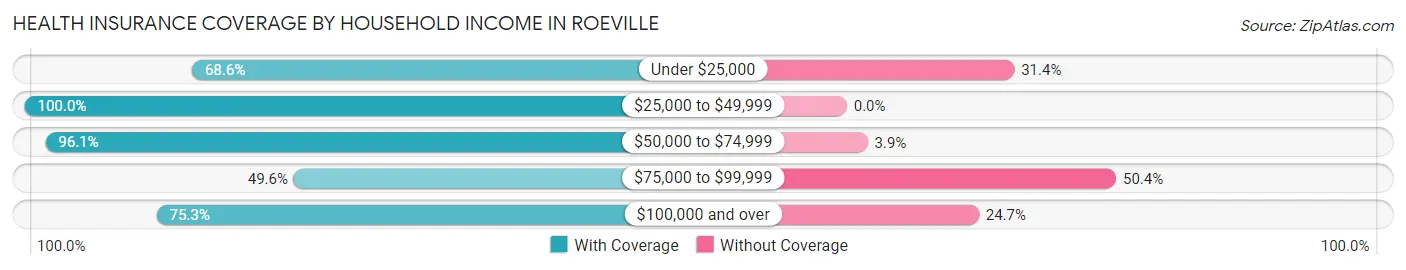
| Household Income | With Coverage | Without Coverage |
| Under $25,000 | 35 (68.6%) | 16 (31.4%) |
| $25,000 to $49,999 | 91 (100.0%) | 0 (0.0%) |
| $50,000 to $74,999 | 74 (96.1%) | 3 (3.9%) |
| $75,000 to $99,999 | 56 (49.6%) | 57 (50.4%) |
| $100,000 and over | 70 (75.3%) | 23 (24.7%) |
Public vs Private Health Insurance Coverage by Age in Roeville
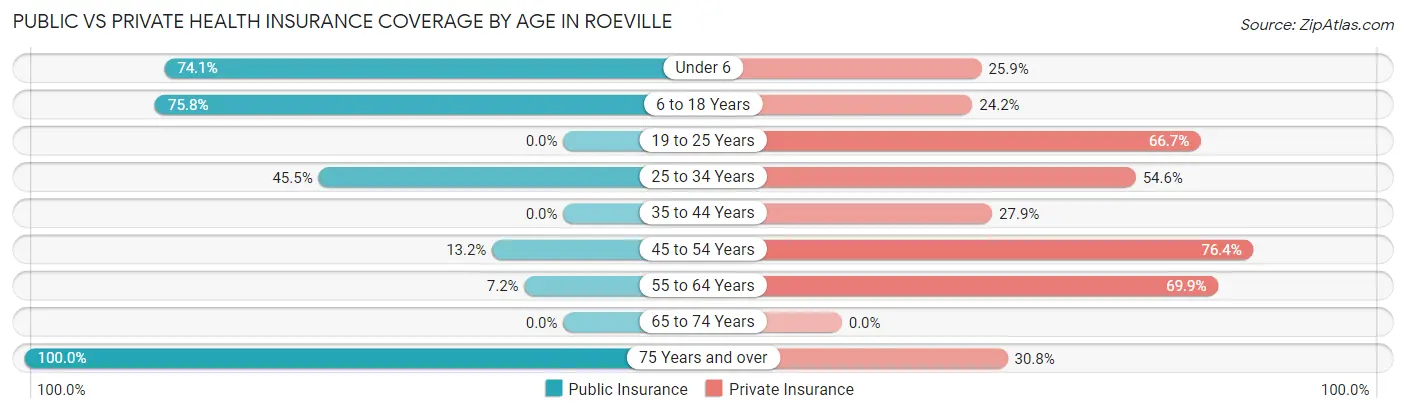
| Age Bracket | Public Insurance | Private Insurance |
| Under 6 | 20 (74.1%) | 7 (25.9%) |
| 6 to 18 Years | 25 (75.8%) | 8 (24.2%) |
| 19 to 25 Years | 0 (0.0%) | 6 (66.7%) |
| 25 to 34 Years | 25 (45.5%) | 30 (54.5%) |
| 35 to 44 Years | 0 (0.0%) | 24 (27.9%) |
| 45 to 54 Years | 14 (13.2%) | 81 (76.4%) |
| 55 to 64 Years | 6 (7.2%) | 58 (69.9%) |
| 65 to 74 Years | 0 (0.0%) | 0 (0.0%) |
| 75 Years and over | 26 (100.0%) | 8 (30.8%) |
| Total | 116 (27.3%) | 222 (52.2%) |
Disability Status by Sex by Age in Roeville
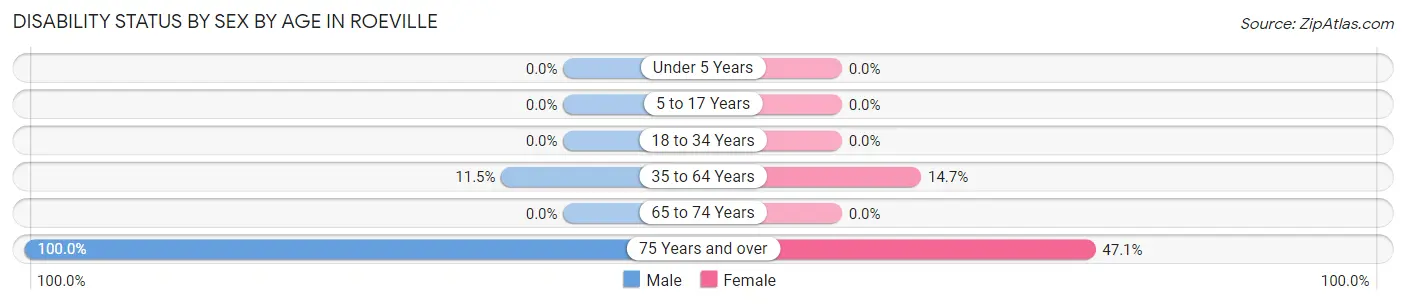
| Age Bracket | Male | Female |
| Under 5 Years | 0 (0.0%) | 0 (0.0%) |
| 5 to 17 Years | 0 (0.0%) | 0 (0.0%) |
| 18 to 34 Years | 0 (0.0%) | 0 (0.0%) |
| 35 to 64 Years | 16 (11.5%) | 20 (14.7%) |
| 65 to 74 Years | 0 (0.0%) | 0 (0.0%) |
| 75 Years and over | 9 (100.0%) | 8 (47.1%) |
Disability Class by Sex by Age in Roeville
Disability Class: Hearing Difficulty
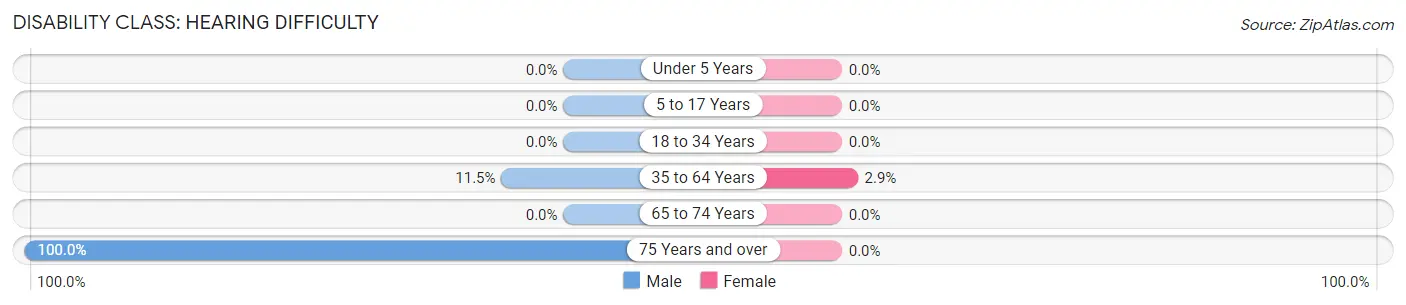
| Age Bracket | Male | Female |
| Under 5 Years | 0 (0.0%) | 0 (0.0%) |
| 5 to 17 Years | 0 (0.0%) | 0 (0.0%) |
| 18 to 34 Years | 0 (0.0%) | 0 (0.0%) |
| 35 to 64 Years | 16 (11.5%) | 4 (2.9%) |
| 65 to 74 Years | 0 (0.0%) | 0 (0.0%) |
| 75 Years and over | 9 (100.0%) | 0 (0.0%) |
Disability Class: Vision Difficulty
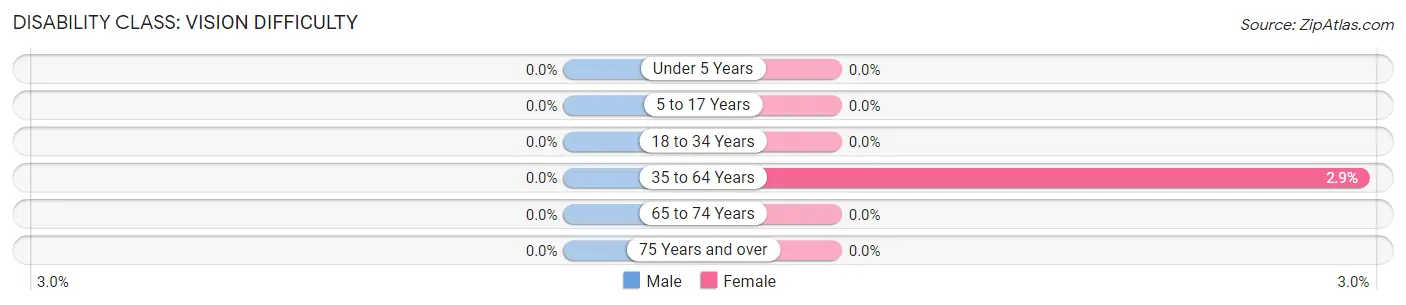
| Age Bracket | Male | Female |
| Under 5 Years | 0 (0.0%) | 0 (0.0%) |
| 5 to 17 Years | 0 (0.0%) | 0 (0.0%) |
| 18 to 34 Years | 0 (0.0%) | 0 (0.0%) |
| 35 to 64 Years | 0 (0.0%) | 4 (2.9%) |
| 65 to 74 Years | 0 (0.0%) | 0 (0.0%) |
| 75 Years and over | 0 (0.0%) | 0 (0.0%) |
Disability Class: Cognitive Difficulty
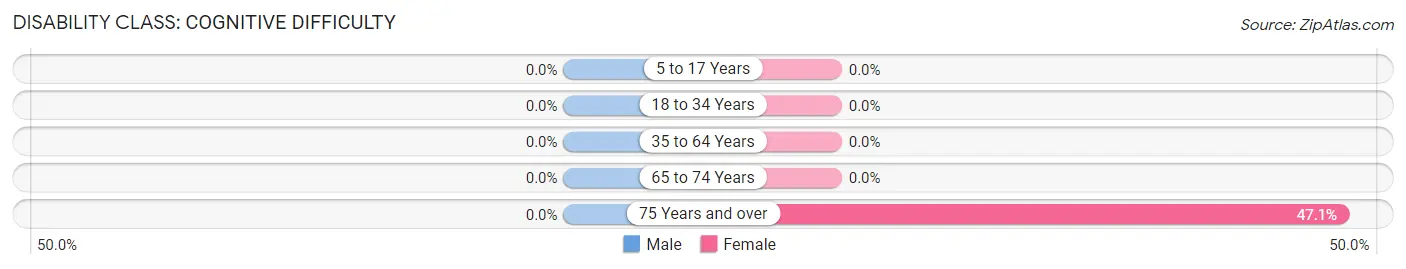
| Age Bracket | Male | Female |
| 5 to 17 Years | 0 (0.0%) | 0 (0.0%) |
| 18 to 34 Years | 0 (0.0%) | 0 (0.0%) |
| 35 to 64 Years | 0 (0.0%) | 0 (0.0%) |
| 65 to 74 Years | 0 (0.0%) | 0 (0.0%) |
| 75 Years and over | 0 (0.0%) | 8 (47.1%) |
Disability Class: Ambulatory Difficulty
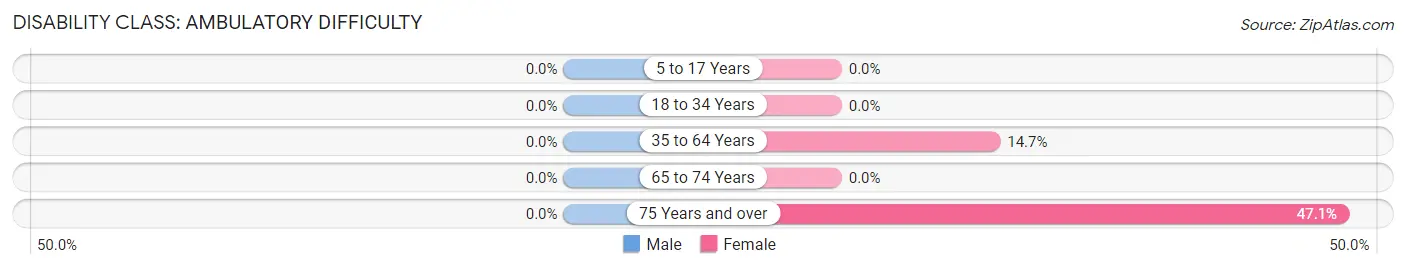
| Age Bracket | Male | Female |
| 5 to 17 Years | 0 (0.0%) | 0 (0.0%) |
| 18 to 34 Years | 0 (0.0%) | 0 (0.0%) |
| 35 to 64 Years | 0 (0.0%) | 20 (14.7%) |
| 65 to 74 Years | 0 (0.0%) | 0 (0.0%) |
| 75 Years and over | 0 (0.0%) | 8 (47.1%) |
Disability Class: Self-Care Difficulty
| Age Bracket | Male | Female |
| 5 to 17 Years | 0 (0.0%) | 0 (0.0%) |
| 18 to 34 Years | 0 (0.0%) | 0 (0.0%) |
| 35 to 64 Years | 0 (0.0%) | 0 (0.0%) |
| 65 to 74 Years | 0 (0.0%) | 0 (0.0%) |
| 75 Years and over | 0 (0.0%) | 0 (0.0%) |
Technology Access in Roeville
Computing Device Access in Roeville
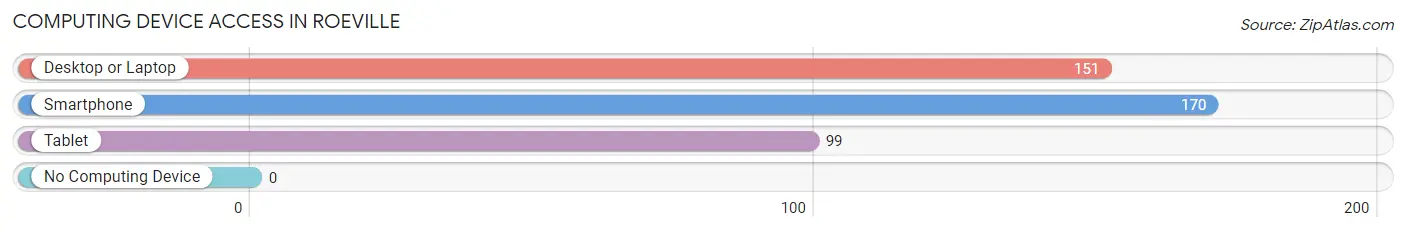
| Device Type | # Households | % Households |
| Desktop or Laptop | 151 | 83.4% |
| Smartphone | 170 | 93.9% |
| Tablet | 99 | 54.7% |
| No Computing Device | 0 | 0.0% |
| Total | 181 | 100.0% |
Internet Access in Roeville
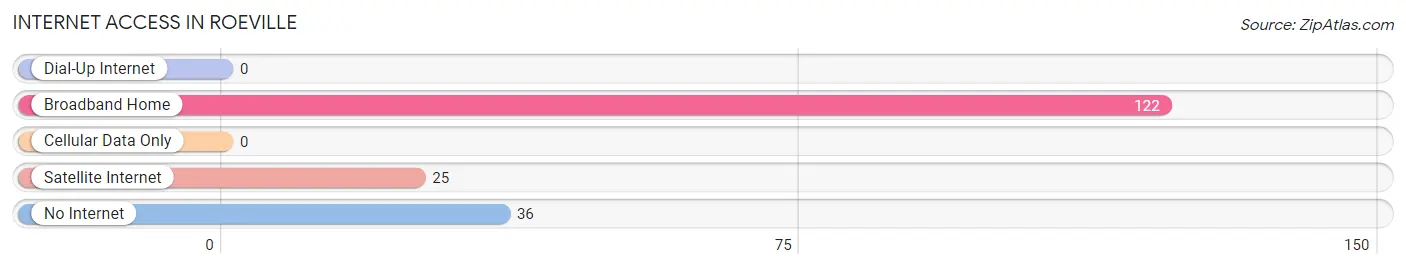
| Internet Type | # Households | % Households |
| Dial-Up Internet | 0 | 0.0% |
| Broadband Home | 122 | 67.4% |
| Cellular Data Only | 0 | 0.0% |
| Satellite Internet | 25 | 13.8% |
| No Internet | 36 | 19.9% |
| Total | 181 | 100.0% |
Roeville Summary
Roeville is a small town located in the state of Florida, United States. It is situated in the northern part of the state, in the county of Polk. The town has a population of approximately 1,000 people, and is located about 25 miles east of Tampa.
History
The town of Roeville was founded in 1883 by a group of settlers from the nearby town of Fort Meade. The settlers were looking for a place to settle and start a new life, and they chose the area around Roeville because of its fertile soil and abundant natural resources. The town was named after the first settler, Robert Roe, who was a former Confederate soldier.
The town grew slowly but steadily over the years, and by the early 1900s it had become a thriving agricultural community. The town was home to several farms, as well as a few small businesses. The town also had a post office, a school, and a few churches.
In the 1950s, the town began to experience a decline in population as many of the younger residents moved away to larger cities in search of better job opportunities. This trend continued until the late 1980s, when the town began to experience a resurgence in population growth. This was due in part to the influx of retirees who were attracted to the area by its mild climate and low cost of living.
Geography
Roeville is located in the northern part of the state of Florida, in the county of Polk. The town is situated on the banks of the Peace River, which flows through the area. The town is surrounded by a number of small lakes, including Lake Hancock, Lake Pierce, and Lake Reedy. The town is also located near the Green Swamp, which is a large wetland area that is home to a variety of wildlife.
The town has a total area of 1.2 square miles, all of which is land. The town has a humid subtropical climate, with hot and humid summers and mild winters. The average temperature in the summer is around 90 degrees Fahrenheit, while the average temperature in the winter is around 60 degrees Fahrenheit.
Economy
The economy of Roeville is largely based on agriculture and tourism. The town is home to several farms, which produce a variety of crops, including citrus fruits, vegetables, and hay. The town is also home to a number of small businesses, including restaurants, shops, and other services.
The town is also a popular tourist destination, as it is located near several popular attractions, including the Florida Aquarium, Busch Gardens, and the Tampa Bay Buccaneers. The town also hosts a number of festivals and events throughout the year, including the annual Roeville Festival of Lights.
Demographics
As of the 2010 census, the population of Roeville was 1,000 people. The racial makeup of the town was 94.2% White, 2.2% African American, 0.2% Native American, 0.2% Asian, 0.2% from other races, and 2.2% from two or more races. The median household income in the town was $37,500, and the median family income was $45,000. The per capita income in the town was $19,000.
Roeville is a small town with a rich history and a bright future. The town is home to a diverse population, and is a popular tourist destination. The town is also home to a number of small businesses, which provide employment opportunities for the local residents. The town is also home to a number of farms, which produce a variety of crops. The town is a great place to live, work, and raise a family.
Common Questions
What is Per Capita Income in Roeville?
Per Capita income in Roeville is $30,828.
What is the Median Family Income in Roeville?
Median Family Income in Roeville is $48,750.
What is the Median Household income in Roeville?
Median Household Income in Roeville is $85,379.
What is Income or Wage Gap in Roeville?
Income or Wage Gap in Roeville is 14.1%.
Women in Roeville earn 85.9 cents for every dollar earned by a man.
What is Inequality or Gini Index in Roeville?
Inequality or Gini Index in Roeville is 0.26.
What is the Total Population of Roeville?
Total Population of Roeville is 425.
What is the Total Male Population of Roeville?
Total Male Population of Roeville is 199.
What is the Total Female Population of Roeville?
Total Female Population of Roeville is 226.
What is the Ratio of Males per 100 Females in Roeville?
There are 88.05 Males per 100 Females in Roeville.
What is the Ratio of Females per 100 Males in Roeville?
There are 113.57 Females per 100 Males in Roeville.
What is the Median Population Age in Roeville?
Median Population Age in Roeville is 45.2 Years.
What is the Average Family Size in Roeville
Average Family Size in Roeville is 3.3 People.
What is the Average Household Size in Roeville
Average Household Size in Roeville is 2.4 People.
How Large is the Labor Force in Roeville?
There are 284 People in the Labor Forcein in Roeville.
What is the Percentage of People in the Labor Force in Roeville?
77.8% of People are in the Labor Force in Roeville.
What is the Unemployment Rate in Roeville?
Unemployment Rate in Roeville is 3.9%.