Port Charlotte, FL Map & Demographics
Port Charlotte Map
Port Charlotte Overview
$32,626
PER CAPITA INCOME
$67,305
AVG FAMILY INCOME
$58,799
AVG HOUSEHOLD INCOME
14.8%
WAGE / INCOME GAP [ % ]
85.2¢/ $1
WAGE / INCOME GAP [ $ ]
$12,005
FAMILY INCOME DEFICIT
0.43
INEQUALITY / GINI INDEX
63,913
TOTAL POPULATION
31,111
MALE POPULATION
32,802
FEMALE POPULATION
94.84
MALES / 100 FEMALES
105.44
FEMALES / 100 MALES
55.6
MEDIAN AGE
2.9
AVG FAMILY SIZE
2.4
AVG HOUSEHOLD SIZE
27,087
LABOR FORCE [ PEOPLE ]
48.3%
PERCENT IN LABOR FORCE
7.0%
UNEMPLOYMENT RATE
Port Charlotte Area Codes
Income in Port Charlotte
Income Overview in Port Charlotte
Per Capita Income in Port Charlotte is $32,626, while median incomes of families and households are $67,305 and $58,799 respectively.
| Characteristic | Number | Measure |
| Per Capita Income | 63,913 | $32,626 |
| Median Family Income | 17,423 | $67,305 |
| Mean Family Income | 17,423 | $84,257 |
| Median Household Income | 26,838 | $58,799 |
| Mean Household Income | 26,838 | $74,424 |
| Income Deficit | 17,423 | $12,005 |
| Wage / Income Gap (%) | 63,913 | 14.82% |
| Wage / Income Gap ($) | 63,913 | 85.18¢ per $1 |
| Gini / Inequality Index | 63,913 | 0.43 |
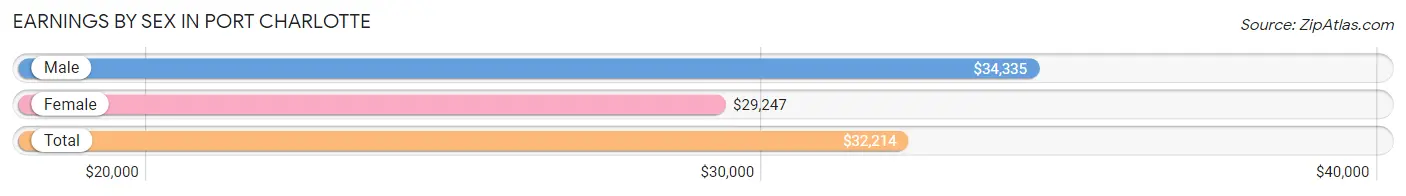
Earnings by Sex in Port Charlotte
Average Earnings in Port Charlotte are $32,214, $34,335 for men and $29,247 for women, a difference of 14.8%.
| Sex | Number | Average Earnings |
| Male | 15,059 (53.0%) | $34,335 |
| Female | 13,350 (47.0%) | $29,247 |
| Total | 28,409 (100.0%) | $32,214 |
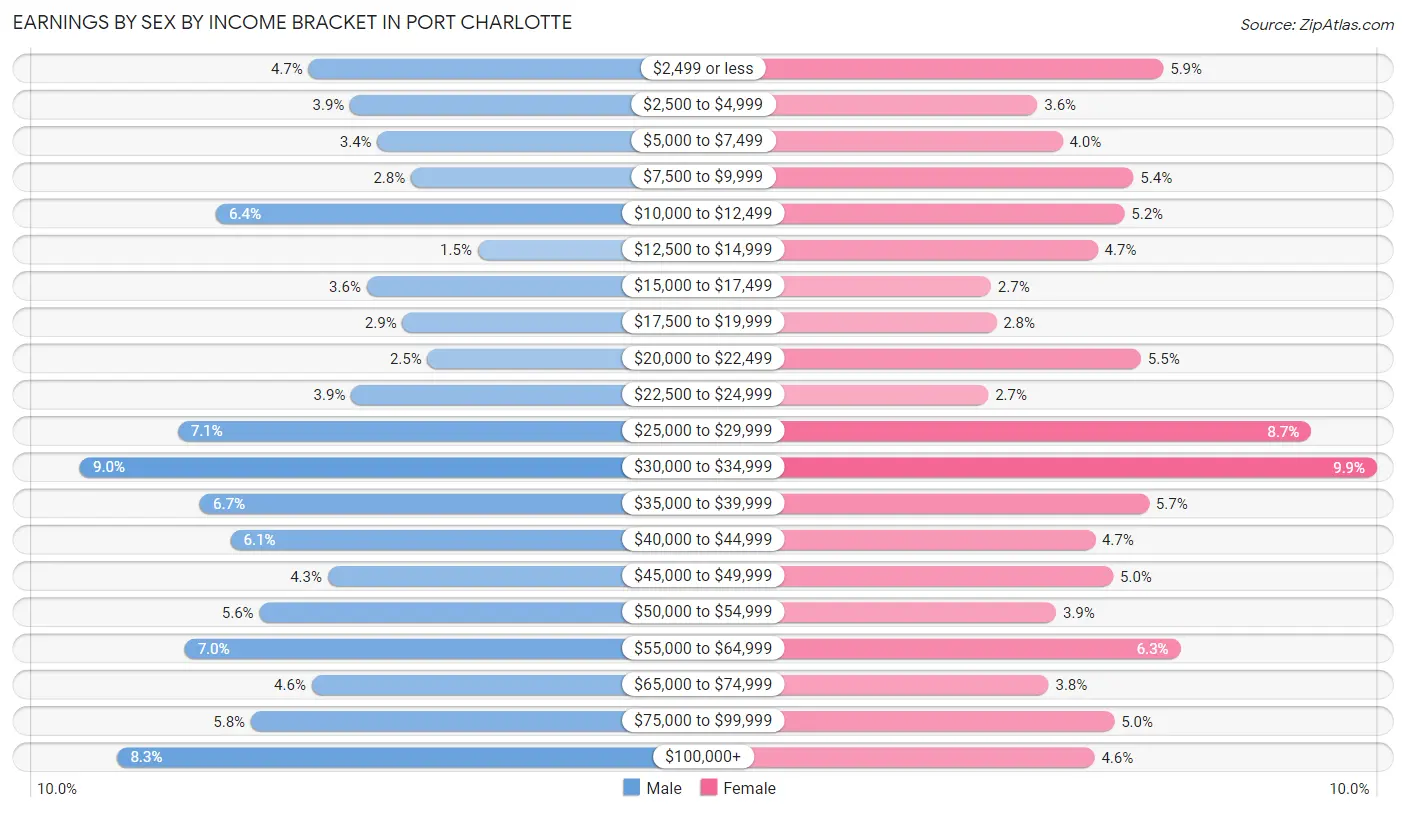
Earnings by Sex by Income Bracket in Port Charlotte
The most common earnings brackets in Port Charlotte are $30,000 to $34,999 for men (1,350 | 9.0%) and $30,000 to $34,999 for women (1,325 | 9.9%).
| Income | Male | Female |
| $2,499 or less | 705 (4.7%) | 791 (5.9%) |
| $2,500 to $4,999 | 587 (3.9%) | 476 (3.6%) |
| $5,000 to $7,499 | 510 (3.4%) | 540 (4.0%) |
| $7,500 to $9,999 | 416 (2.8%) | 717 (5.4%) |
| $10,000 to $12,499 | 966 (6.4%) | 694 (5.2%) |
| $12,500 to $14,999 | 228 (1.5%) | 627 (4.7%) |
| $15,000 to $17,499 | 540 (3.6%) | 361 (2.7%) |
| $17,500 to $19,999 | 439 (2.9%) | 374 (2.8%) |
| $20,000 to $22,499 | 369 (2.5%) | 736 (5.5%) |
| $22,500 to $24,999 | 584 (3.9%) | 354 (2.6%) |
| $25,000 to $29,999 | 1,074 (7.1%) | 1,162 (8.7%) |
| $30,000 to $34,999 | 1,350 (9.0%) | 1,325 (9.9%) |
| $35,000 to $39,999 | 1,011 (6.7%) | 756 (5.7%) |
| $40,000 to $44,999 | 924 (6.1%) | 621 (4.6%) |
| $45,000 to $49,999 | 650 (4.3%) | 666 (5.0%) |
| $50,000 to $54,999 | 844 (5.6%) | 523 (3.9%) |
| $55,000 to $64,999 | 1,054 (7.0%) | 835 (6.2%) |
| $65,000 to $74,999 | 696 (4.6%) | 504 (3.8%) |
| $75,000 to $99,999 | 868 (5.8%) | 669 (5.0%) |
| $100,000+ | 1,244 (8.3%) | 619 (4.6%) |
| Total | 15,059 (100.0%) | 13,350 (100.0%) |
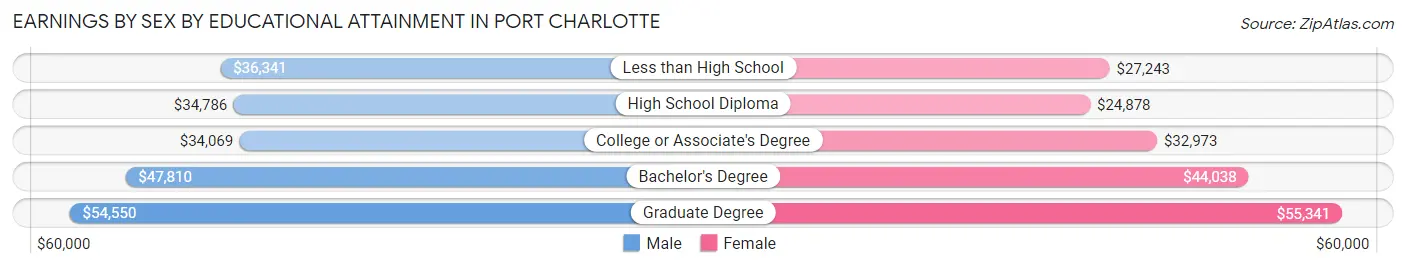
Earnings by Sex by Educational Attainment in Port Charlotte
Average earnings in Port Charlotte are $36,793 for men and $31,652 for women, a difference of 14.0%. Men with an educational attainment of graduate degree enjoy the highest average annual earnings of $54,550, while those with college or associate's degree education earn the least with $34,069. Women with an educational attainment of graduate degree earn the most with the average annual earnings of $55,341, while those with high school diploma education have the smallest earnings of $24,878.
| Educational Attainment | Male Income | Female Income |
| Less than High School | $36,341 | $27,243 |
| High School Diploma | $34,786 | $24,878 |
| College or Associate's Degree | $34,069 | $32,973 |
| Bachelor's Degree | $47,810 | $44,038 |
| Graduate Degree | $54,550 | $55,341 |
| Total | $36,793 | $31,652 |
Family Income in Port Charlotte
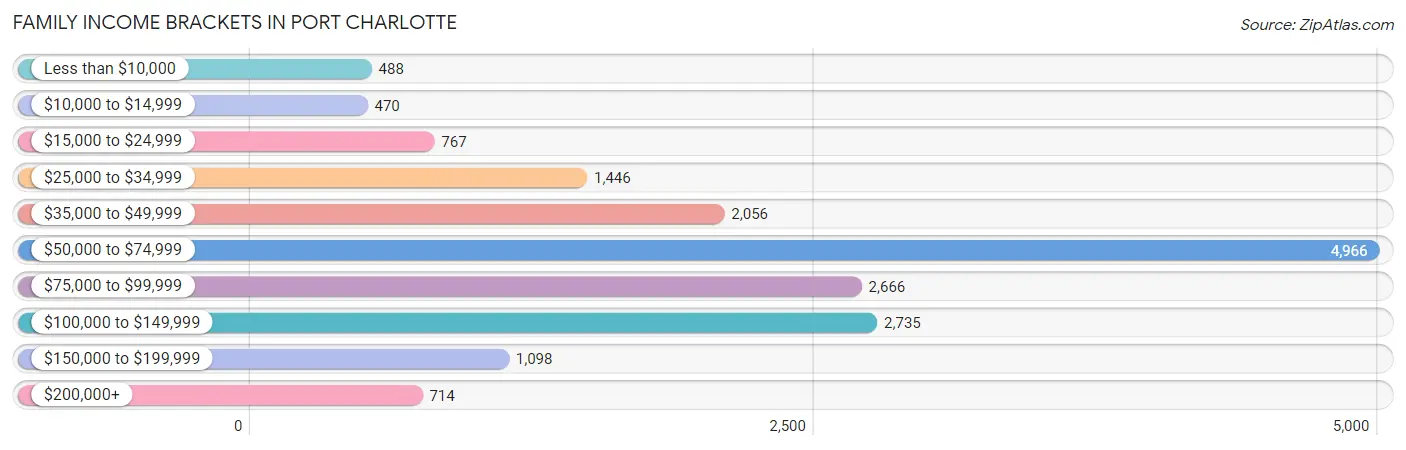
Family Income Brackets in Port Charlotte
According to the Port Charlotte family income data, there are 4,966 families falling into the $50,000 to $74,999 income range, which is the most common income bracket and makes up 28.5% of all families. Conversely, the $10,000 to $14,999 income bracket is the least frequent group with only 470 families (2.7%) belonging to this category.
| Income Bracket | # Families | % Families |
| Less than $10,000 | 488 | 2.8% |
| $10,000 to $14,999 | 470 | 2.7% |
| $15,000 to $24,999 | 767 | 4.4% |
| $25,000 to $34,999 | 1,446 | 8.3% |
| $35,000 to $49,999 | 2,056 | 11.8% |
| $50,000 to $74,999 | 4,966 | 28.5% |
| $75,000 to $99,999 | 2,666 | 15.3% |
| $100,000 to $149,999 | 2,735 | 15.7% |
| $150,000 to $199,999 | 1,098 | 6.3% |
| $200,000+ | 714 | 4.1% |
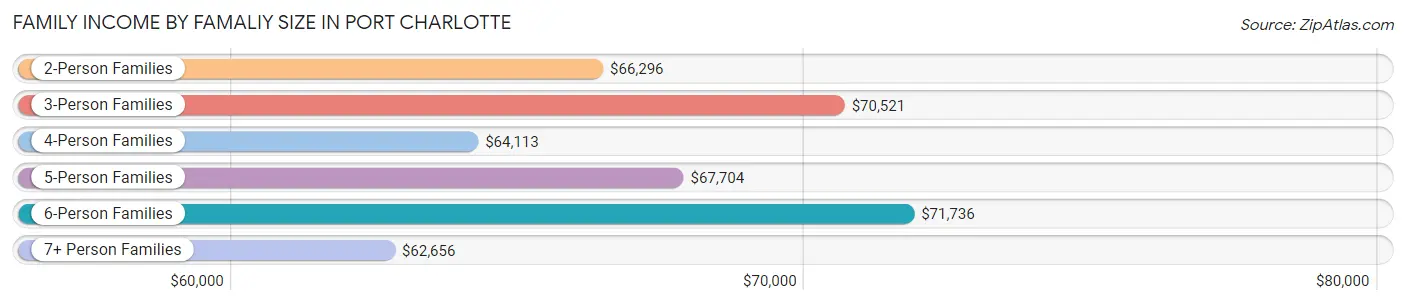
Family Income by Famaliy Size in Port Charlotte
6-person families (247 | 1.4%) account for the highest median family income in Port Charlotte with $71,736 per family, while 2-person families (10,398 | 59.7%) have the highest median income of $33,148 per family member.
| Income Bracket | # Families | Median Income |
| 2-Person Families | 10,398 (59.7%) | $66,296 |
| 3-Person Families | 3,860 (22.2%) | $70,521 |
| 4-Person Families | 1,904 (10.9%) | $64,113 |
| 5-Person Families | 856 (4.9%) | $67,704 |
| 6-Person Families | 247 (1.4%) | $71,736 |
| 7+ Person Families | 158 (0.9%) | $62,656 |
| Total | 17,423 (100.0%) | $67,305 |
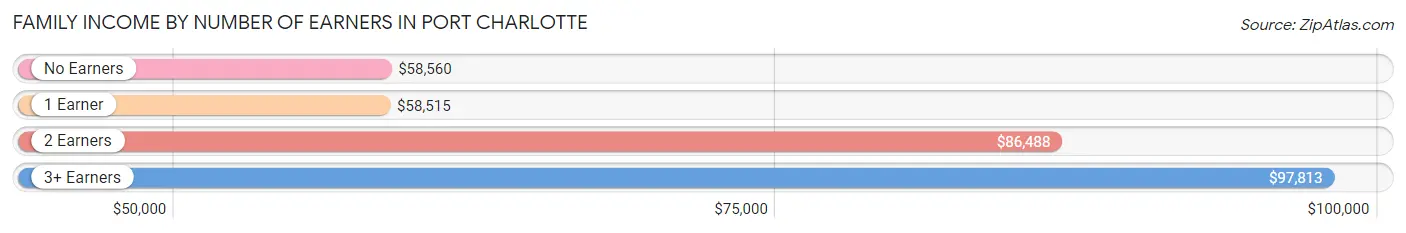
Family Income by Number of Earners in Port Charlotte
The median family income in Port Charlotte is $67,305, with families comprising 3+ earners (1,525) having the highest median family income of $97,813, while families with 1 earner (5,694) have the lowest median family income of $58,515, accounting for 8.7% and 32.7% of families, respectively.
| Number of Earners | # Families | Median Income |
| No Earners | 5,180 (29.7%) | $58,560 |
| 1 Earner | 5,694 (32.7%) | $58,515 |
| 2 Earners | 5,024 (28.8%) | $86,488 |
| 3+ Earners | 1,525 (8.7%) | $97,813 |
| Total | 17,423 (100.0%) | $67,305 |
Household Income in Port Charlotte
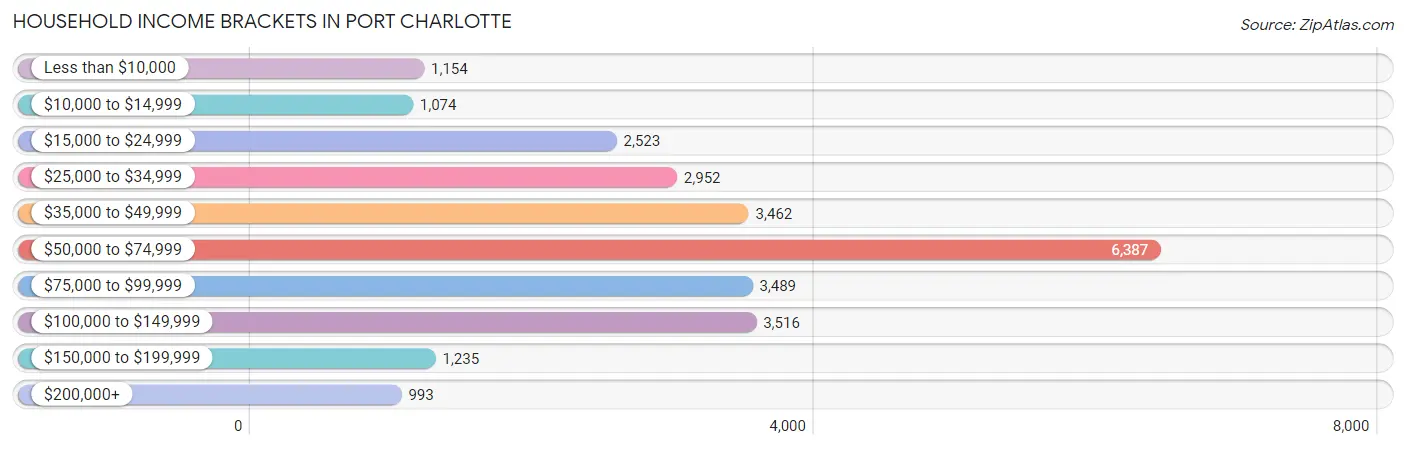
Household Income Brackets in Port Charlotte
With 6,387 households falling in the category, the $50,000 to $74,999 income range is the most frequent in Port Charlotte, accounting for 23.8% of all households. In contrast, only 993 households (3.7%) fall into the $200,000+ income bracket, making it the least populous group.
| Income Bracket | # Households | % Households |
| Less than $10,000 | 1,154 | 4.3% |
| $10,000 to $14,999 | 1,074 | 4.0% |
| $15,000 to $24,999 | 2,523 | 9.4% |
| $25,000 to $34,999 | 2,952 | 11.0% |
| $35,000 to $49,999 | 3,462 | 12.9% |
| $50,000 to $74,999 | 6,387 | 23.8% |
| $75,000 to $99,999 | 3,489 | 13.0% |
| $100,000 to $149,999 | 3,516 | 13.1% |
| $150,000 to $199,999 | 1,235 | 4.6% |
| $200,000+ | 993 | 3.7% |
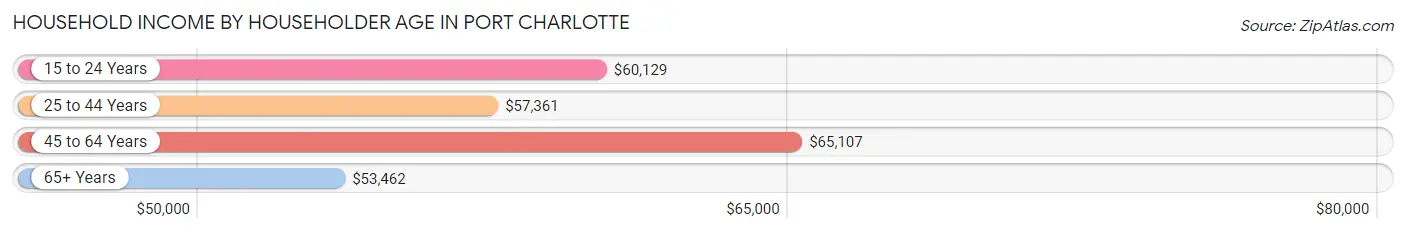
Household Income by Householder Age in Port Charlotte
The median household income in Port Charlotte is $58,799, with the highest median household income of $65,107 found in the 45 to 64 years age bracket for the primary householder. A total of 9,471 households (35.3%) fall into this category. Meanwhile, the 65+ years age bracket for the primary householder has the lowest median household income of $53,462, with 12,610 households (47.0%) in this group.
| Income Bracket | # Households | Median Income |
| 15 to 24 Years | 257 (1.0%) | $60,129 |
| 25 to 44 Years | 4,500 (16.8%) | $57,361 |
| 45 to 64 Years | 9,471 (35.3%) | $65,107 |
| 65+ Years | 12,610 (47.0%) | $53,462 |
| Total | 26,838 (100.0%) | $58,799 |
Poverty in Port Charlotte
Income Below Poverty by Sex and Age in Port Charlotte
With 11.8% poverty level for males and 12.1% for females among the residents of Port Charlotte, 5 year old males and 15 year old females are the most vulnerable to poverty, with 89 males (40.6%) and 121 females (28.4%) in their respective age groups living below the poverty level.
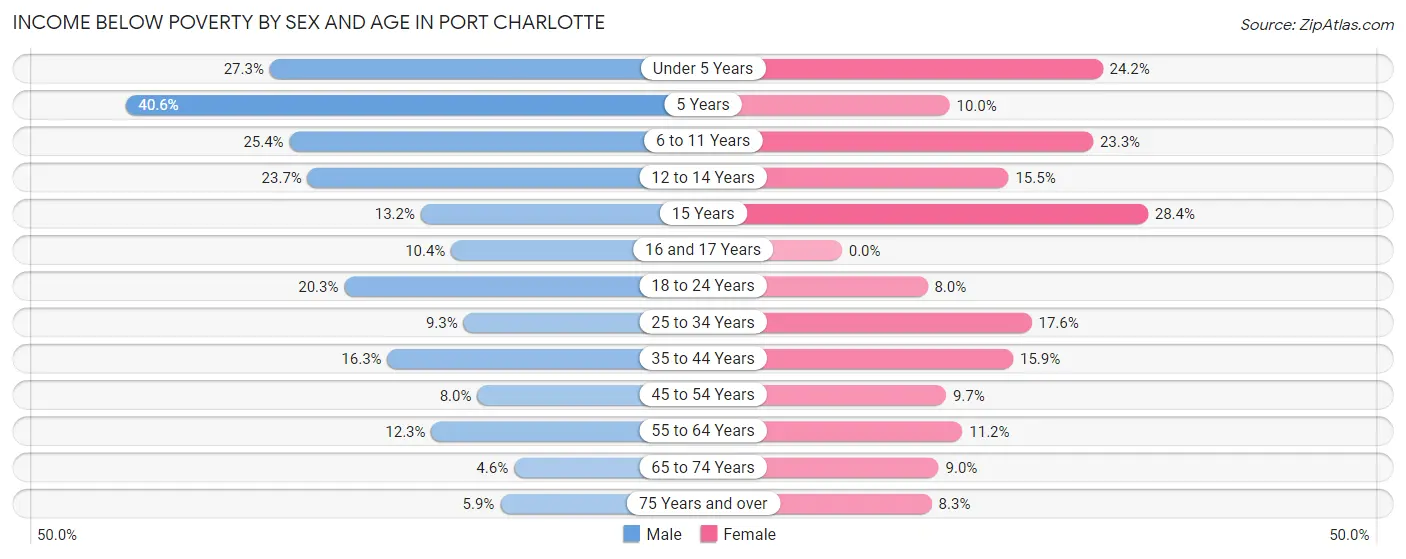
| Age Bracket | Male | Female |
| Under 5 Years | 303 (27.3%) | 342 (24.2%) |
| 5 Years | 89 (40.6%) | 14 (10.0%) |
| 6 to 11 Years | 375 (25.4%) | 251 (23.3%) |
| 12 to 14 Years | 168 (23.7%) | 134 (15.5%) |
| 15 Years | 34 (13.2%) | 121 (28.4%) |
| 16 and 17 Years | 51 (10.4%) | 0 (0.0%) |
| 18 to 24 Years | 423 (20.3%) | 133 (8.0%) |
| 25 to 34 Years | 311 (9.3%) | 468 (17.6%) |
| 35 to 44 Years | 459 (16.3%) | 478 (15.9%) |
| 45 to 54 Years | 254 (8.0%) | 355 (9.7%) |
| 55 to 64 Years | 697 (12.2%) | 674 (11.2%) |
| 65 to 74 Years | 261 (4.6%) | 570 (9.0%) |
| 75 Years and over | 223 (5.9%) | 376 (8.3%) |
| Total | 3,648 (11.8%) | 3,916 (12.1%) |
Income Above Poverty by Sex and Age in Port Charlotte
According to the poverty statistics in Port Charlotte, males aged 65 to 74 years and females aged 16 and 17 years are the age groups that are most secure financially, with 95.4% of males and 100.0% of females in these age groups living above the poverty line.
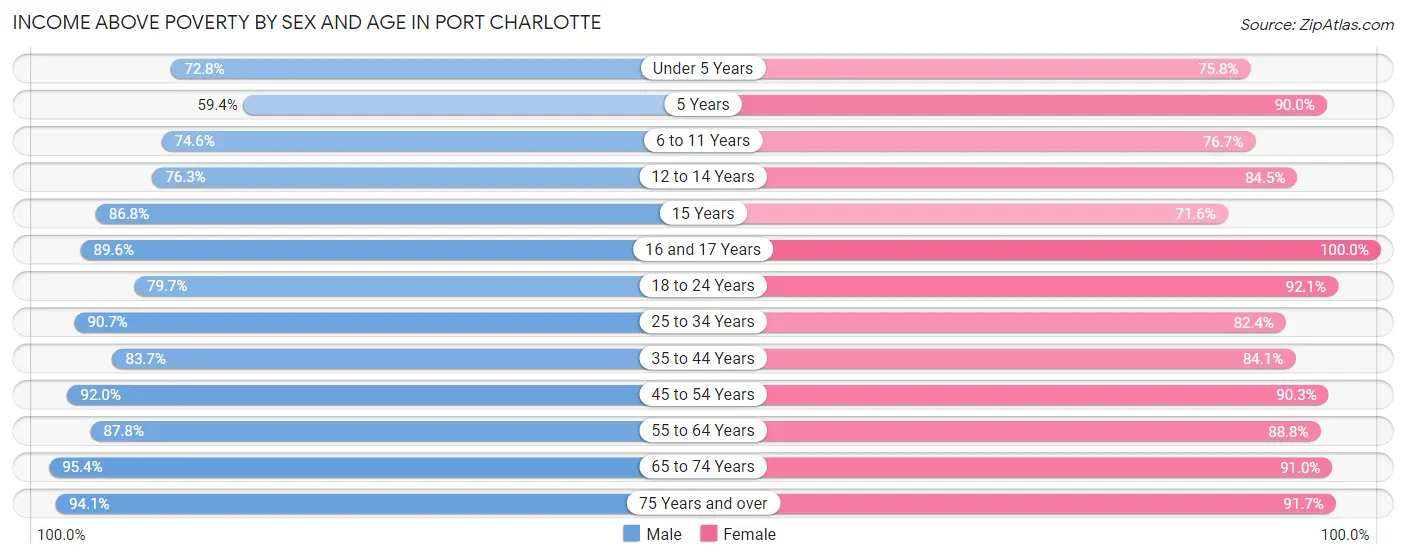
| Age Bracket | Male | Female |
| Under 5 Years | 809 (72.8%) | 1,071 (75.8%) |
| 5 Years | 130 (59.4%) | 126 (90.0%) |
| 6 to 11 Years | 1,100 (74.6%) | 826 (76.7%) |
| 12 to 14 Years | 540 (76.3%) | 732 (84.5%) |
| 15 Years | 223 (86.8%) | 305 (71.6%) |
| 16 and 17 Years | 439 (89.6%) | 551 (100.0%) |
| 18 to 24 Years | 1,658 (79.7%) | 1,540 (92.0%) |
| 25 to 34 Years | 3,047 (90.7%) | 2,190 (82.4%) |
| 35 to 44 Years | 2,351 (83.7%) | 2,531 (84.1%) |
| 45 to 54 Years | 2,925 (92.0%) | 3,317 (90.3%) |
| 55 to 64 Years | 4,995 (87.7%) | 5,350 (88.8%) |
| 65 to 74 Years | 5,433 (95.4%) | 5,776 (91.0%) |
| 75 Years and over | 3,581 (94.1%) | 4,134 (91.7%) |
| Total | 27,231 (88.2%) | 28,449 (87.9%) |
Income Below Poverty Among Married-Couple Families in Port Charlotte
The poverty statistics for married-couple families in Port Charlotte show that 5.8% or 791 of the total 13,573 families live below the poverty line. Families with 5 or more children have the highest poverty rate of 100.0%, comprising of 44 families. On the other hand, families with no children have the lowest poverty rate of 3.9%, which includes 403 families.
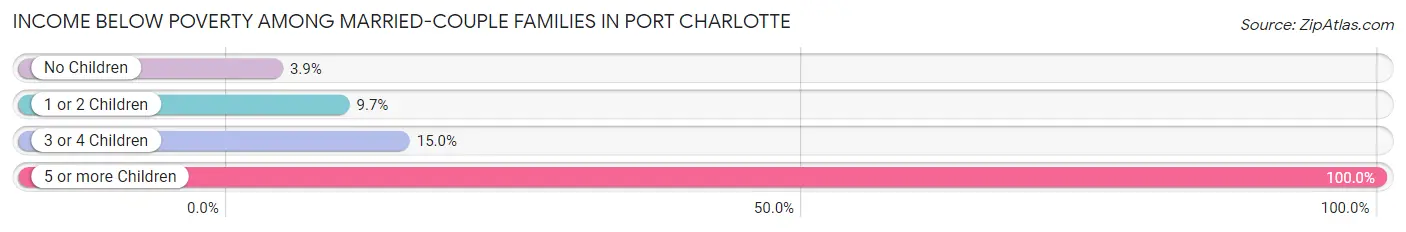
| Children | Above Poverty | Below Poverty |
| No Children | 9,908 (96.1%) | 403 (3.9%) |
| 1 or 2 Children | 2,362 (90.3%) | 254 (9.7%) |
| 3 or 4 Children | 512 (85.1%) | 90 (14.9%) |
| 5 or more Children | 0 (0.0%) | 44 (100.0%) |
| Total | 12,782 (94.2%) | 791 (5.8%) |
Income Below Poverty Among Single-Parent Households in Port Charlotte
According to the poverty data in Port Charlotte, 19.3% or 203 single-father households and 16.8% or 470 single-mother households are living below the poverty line. Among single-father households, those with 3 or 4 children have the highest poverty rate, with 26 households (43.3%) experiencing poverty. Likewise, among single-mother households, those with 5 or more children have the highest poverty rate, with 11 households (100.0%) falling below the poverty line.
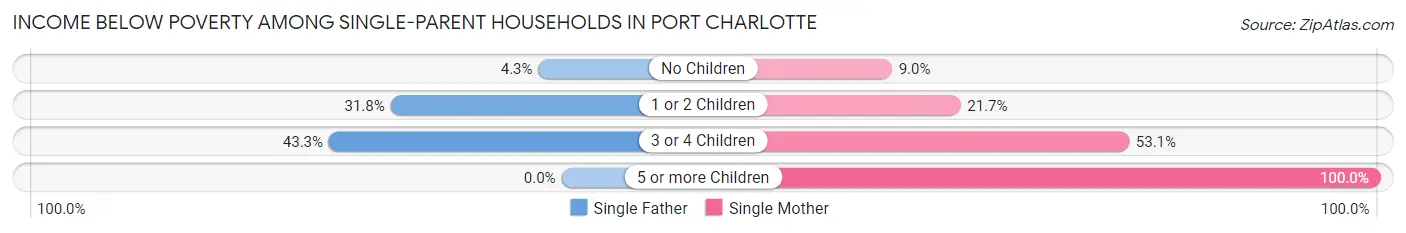
| Children | Single Father | Single Mother |
| No Children | 21 (4.3%) | 131 (8.9%) |
| 1 or 2 Children | 156 (31.8%) | 260 (21.7%) |
| 3 or 4 Children | 26 (43.3%) | 68 (53.1%) |
| 5 or more Children | 0 (0.0%) | 11 (100.0%) |
| Total | 203 (19.3%) | 470 (16.8%) |
Income Below Poverty Among Married-Couple vs Single-Parent Households in Port Charlotte
The poverty data for Port Charlotte shows that 791 of the married-couple family households (5.8%) and 673 of the single-parent households (17.5%) are living below the poverty level. Within the married-couple family households, those with 5 or more children have the highest poverty rate, with 44 households (100.0%) falling below the poverty line. Among the single-parent households, those with 3 or 4 children have the highest poverty rate, with 94 household (50.0%) living below poverty.
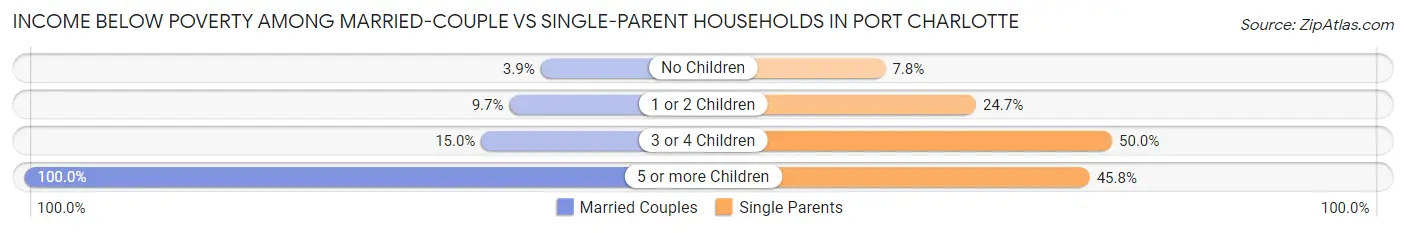
| Children | Married-Couple Families | Single-Parent Households |
| No Children | 403 (3.9%) | 152 (7.8%) |
| 1 or 2 Children | 254 (9.7%) | 416 (24.7%) |
| 3 or 4 Children | 90 (14.9%) | 94 (50.0%) |
| 5 or more Children | 44 (100.0%) | 11 (45.8%) |
| Total | 791 (5.8%) | 673 (17.5%) |
Race in Port Charlotte
The most populous races in Port Charlotte are White / Caucasian (51,140 | 80.0%), Hispanic or Latino (7,531 | 11.8%), and Two or more Races (5,202 | 8.1%).
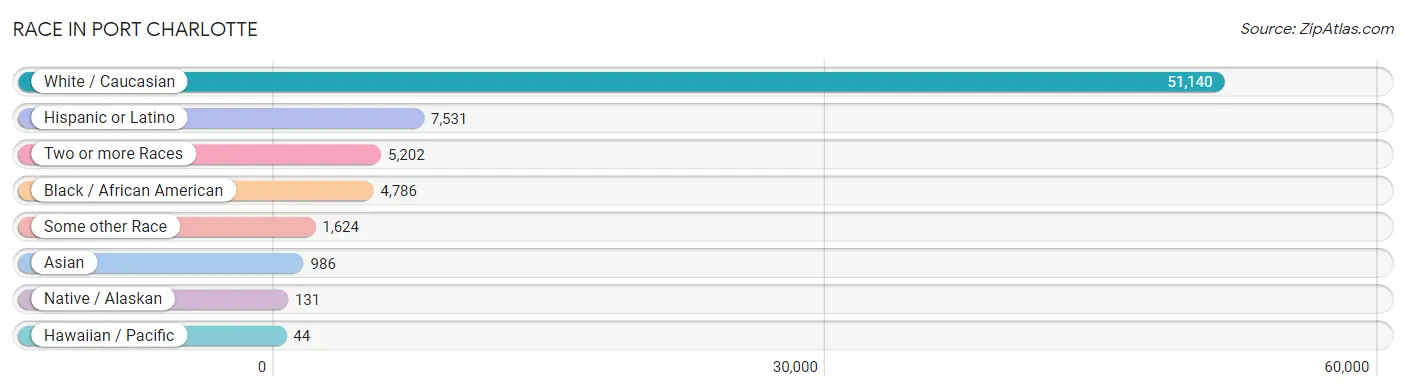
| Race | # Population | % Population |
| Asian | 986 | 1.5% |
| Black / African American | 4,786 | 7.5% |
| Hawaiian / Pacific | 44 | 0.1% |
| Hispanic or Latino | 7,531 | 11.8% |
| Native / Alaskan | 131 | 0.2% |
| White / Caucasian | 51,140 | 80.0% |
| Two or more Races | 5,202 | 8.1% |
| Some other Race | 1,624 | 2.5% |
| Total | 63,913 | 100.0% |
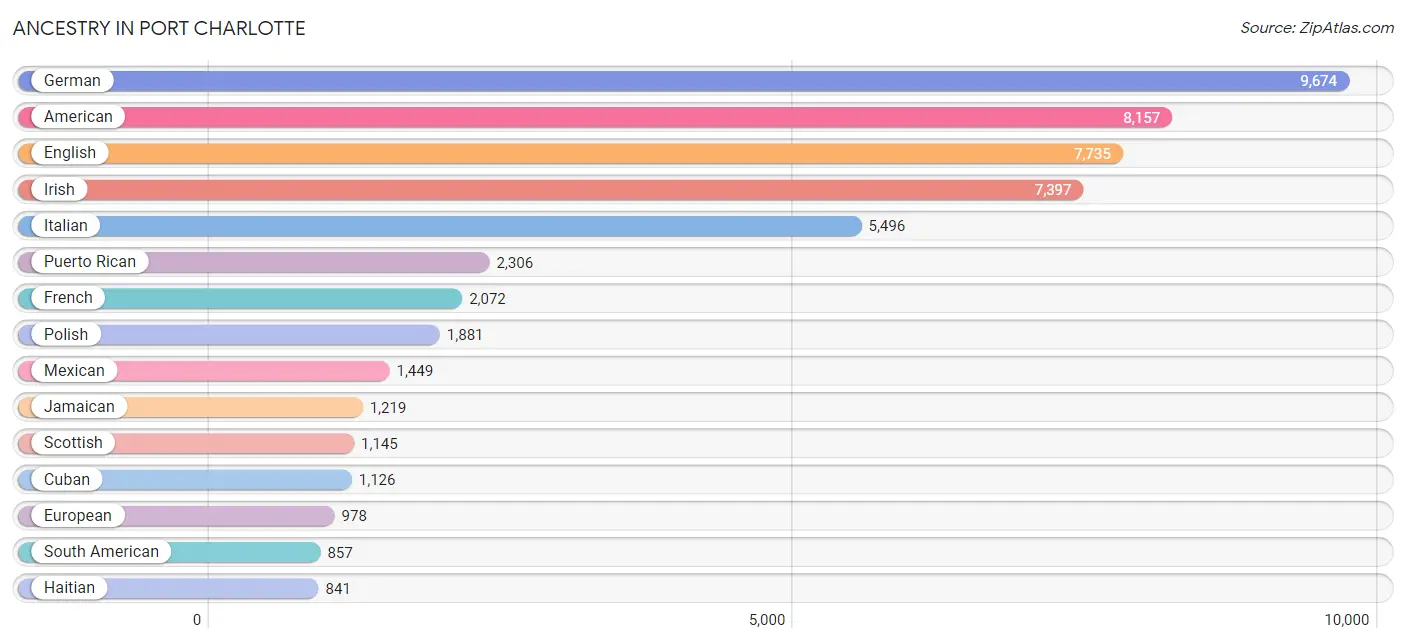
Ancestry in Port Charlotte
The most populous ancestries reported in Port Charlotte are German (9,674 | 15.1%), American (8,157 | 12.8%), English (7,735 | 12.1%), Irish (7,397 | 11.6%), and Italian (5,496 | 8.6%), together accounting for 60.2% of all Port Charlotte residents.
| Ancestry | # Population | % Population |
| African | 29 | 0.1% |
| American | 8,157 | 12.8% |
| Arab | 336 | 0.5% |
| Argentinean | 52 | 0.1% |
| Armenian | 51 | 0.1% |
| Australian | 62 | 0.1% |
| Austrian | 200 | 0.3% |
| Bahamian | 1 | 0.0% |
| Barbadian | 69 | 0.1% |
| Belgian | 132 | 0.2% |
| Bhutanese | 94 | 0.2% |
| Blackfeet | 19 | 0.0% |
| Brazilian | 3 | 0.0% |
| British | 327 | 0.5% |
| British West Indian | 76 | 0.1% |
| Burmese | 28 | 0.0% |
| Canadian | 170 | 0.3% |
| Cape Verdean | 83 | 0.1% |
| Celtic | 9 | 0.0% |
| Central American | 654 | 1.0% |
| Cherokee | 72 | 0.1% |
| Chickasaw | 37 | 0.1% |
| Chilean | 66 | 0.1% |
| Chippewa | 16 | 0.0% |
| Colombian | 110 | 0.2% |
| Creek | 94 | 0.2% |
| Croatian | 26 | 0.0% |
| Cuban | 1,126 | 1.8% |
| Czech | 294 | 0.5% |
| Czechoslovakian | 91 | 0.1% |
| Danish | 299 | 0.5% |
| Delaware | 12 | 0.0% |
| Dominican | 546 | 0.9% |
| Dutch | 831 | 1.3% |
| Eastern European | 76 | 0.1% |
| Ecuadorian | 19 | 0.0% |
| English | 7,735 | 12.1% |
| Estonian | 45 | 0.1% |
| European | 978 | 1.5% |
| Finnish | 169 | 0.3% |
| French | 2,072 | 3.2% |
| French Canadian | 634 | 1.0% |
| German | 9,674 | 15.1% |
| Greek | 252 | 0.4% |
| Guamanian / Chamorro | 36 | 0.1% |
| Guatemalan | 92 | 0.1% |
| Guyanese | 363 | 0.6% |
| Haitian | 841 | 1.3% |
| Honduran | 166 | 0.3% |
| Hungarian | 525 | 0.8% |
| Indian (Asian) | 284 | 0.4% |
| Iranian | 60 | 0.1% |
| Irish | 7,397 | 11.6% |
| Iroquois | 24 | 0.0% |
| Italian | 5,496 | 8.6% |
| Jamaican | 1,219 | 1.9% |
| Kiowa | 9 | 0.0% |
| Korean | 504 | 0.8% |
| Laotian | 77 | 0.1% |
| Latvian | 97 | 0.2% |
| Lebanese | 222 | 0.4% |
| Lithuanian | 76 | 0.1% |
| Macedonian | 29 | 0.1% |
| Maltese | 31 | 0.1% |
| Mexican | 1,449 | 2.3% |
| Mexican American Indian | 10 | 0.0% |
| Native Hawaiian | 51 | 0.1% |
| Nigerian | 32 | 0.1% |
| Northern European | 80 | 0.1% |
| Norwegian | 569 | 0.9% |
| Pakistani | 73 | 0.1% |
| Palestinian | 101 | 0.2% |
| Panamanian | 109 | 0.2% |
| Peruvian | 185 | 0.3% |
| Polish | 1,881 | 2.9% |
| Portuguese | 400 | 0.6% |
| Puerto Rican | 2,306 | 3.6% |
| Romanian | 26 | 0.0% |
| Russian | 640 | 1.0% |
| Salvadoran | 287 | 0.4% |
| Scandinavian | 524 | 0.8% |
| Scotch-Irish | 666 | 1.0% |
| Scottish | 1,145 | 1.8% |
| Serbian | 46 | 0.1% |
| Slavic | 35 | 0.1% |
| Slovak | 119 | 0.2% |
| Slovene | 57 | 0.1% |
| South American | 857 | 1.3% |
| South American Indian | 30 | 0.1% |
| Spaniard | 72 | 0.1% |
| Spanish | 39 | 0.1% |
| Sri Lankan | 251 | 0.4% |
| Subsaharan African | 144 | 0.2% |
| Swedish | 512 | 0.8% |
| Swiss | 118 | 0.2% |
| Thai | 126 | 0.2% |
| Trinidadian and Tobagonian | 56 | 0.1% |
| Ukrainian | 95 | 0.2% |
| Uruguayan | 38 | 0.1% |
| Venezuelan | 387 | 0.6% |
| Welsh | 212 | 0.3% |
| West Indian | 435 | 0.7% | View All 102 Rows |
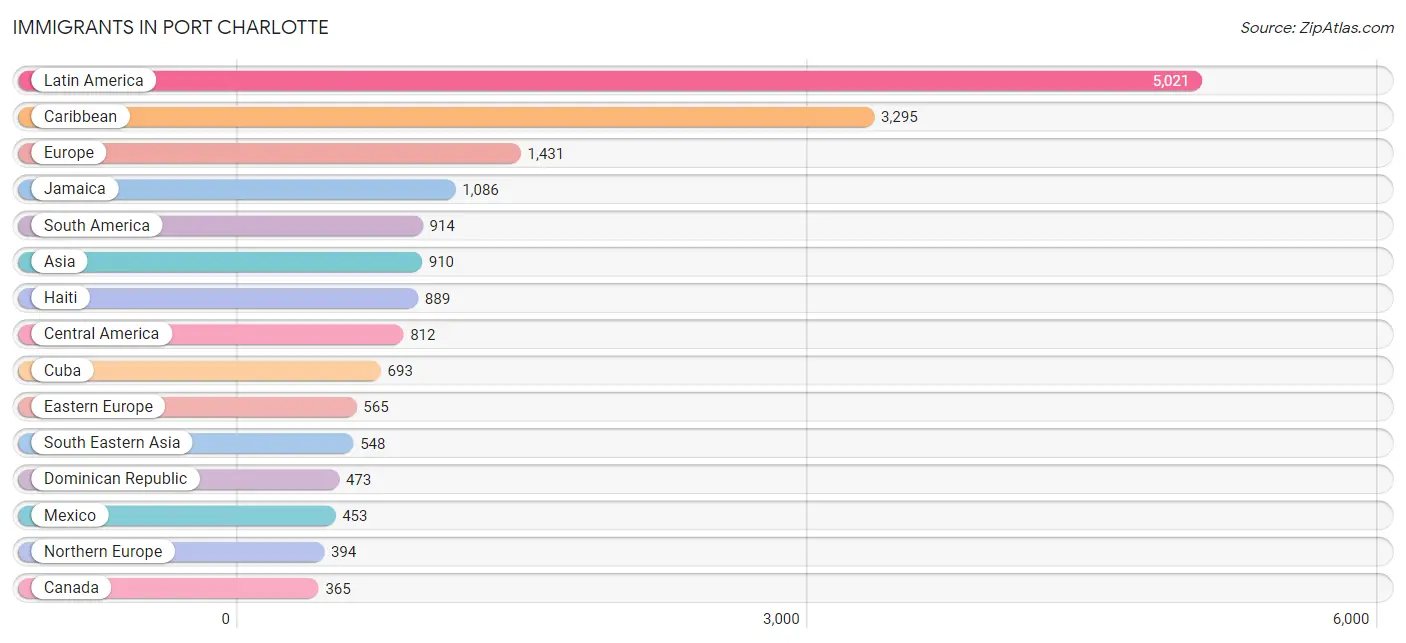
Immigrants in Port Charlotte
The most numerous immigrant groups reported in Port Charlotte came from Latin America (5,021 | 7.9%), Caribbean (3,295 | 5.2%), Europe (1,431 | 2.2%), Jamaica (1,086 | 1.7%), and South America (914 | 1.4%), together accounting for 18.4% of all Port Charlotte residents.
| Immigration Origin | # Population | % Population |
| Africa | 99 | 0.2% |
| Armenia | 2 | 0.0% |
| Asia | 910 | 1.4% |
| Australia | 48 | 0.1% |
| Austria | 10 | 0.0% |
| Barbados | 69 | 0.1% |
| Brazil | 3 | 0.0% |
| Cabo Verde | 20 | 0.0% |
| Canada | 365 | 0.6% |
| Caribbean | 3,295 | 5.2% |
| Central America | 812 | 1.3% |
| Chile | 46 | 0.1% |
| China | 92 | 0.1% |
| Colombia | 75 | 0.1% |
| Cuba | 693 | 1.1% |
| Czechoslovakia | 73 | 0.1% |
| Dominican Republic | 473 | 0.7% |
| Eastern Africa | 5 | 0.0% |
| Eastern Asia | 122 | 0.2% |
| Eastern Europe | 565 | 0.9% |
| Ecuador | 19 | 0.0% |
| El Salvador | 229 | 0.4% |
| England | 191 | 0.3% |
| Europe | 1,431 | 2.2% |
| France | 29 | 0.1% |
| Germany | 192 | 0.3% |
| Grenada | 16 | 0.0% |
| Guatemala | 25 | 0.0% |
| Guyana | 258 | 0.4% |
| Haiti | 889 | 1.4% |
| Honduras | 84 | 0.1% |
| Hong Kong | 6 | 0.0% |
| Hungary | 24 | 0.0% |
| India | 57 | 0.1% |
| Iran | 58 | 0.1% |
| Italy | 179 | 0.3% |
| Jamaica | 1,086 | 1.7% |
| Japan | 14 | 0.0% |
| Korea | 16 | 0.0% |
| Kuwait | 18 | 0.0% |
| Latin America | 5,021 | 7.9% |
| Latvia | 59 | 0.1% |
| Lebanon | 9 | 0.0% |
| Mexico | 453 | 0.7% |
| Netherlands | 14 | 0.0% |
| Nigeria | 61 | 0.1% |
| Northern Europe | 394 | 0.6% |
| Norway | 13 | 0.0% |
| Oceania | 48 | 0.1% |
| Panama | 21 | 0.0% |
| Peru | 187 | 0.3% |
| Philippines | 333 | 0.5% |
| Poland | 86 | 0.1% |
| Russia | 155 | 0.2% |
| Serbia | 46 | 0.1% |
| South Africa | 13 | 0.0% |
| South America | 914 | 1.4% |
| South Central Asia | 115 | 0.2% |
| South Eastern Asia | 548 | 0.9% |
| Southern Europe | 227 | 0.4% |
| Spain | 27 | 0.0% |
| Thailand | 29 | 0.1% |
| Trinidad and Tobago | 69 | 0.1% |
| Ukraine | 122 | 0.2% |
| Uruguay | 38 | 0.1% |
| Venezuela | 274 | 0.4% |
| Vietnam | 184 | 0.3% |
| Western Africa | 81 | 0.1% |
| Western Asia | 29 | 0.1% |
| Western Europe | 245 | 0.4% | View All 70 Rows |
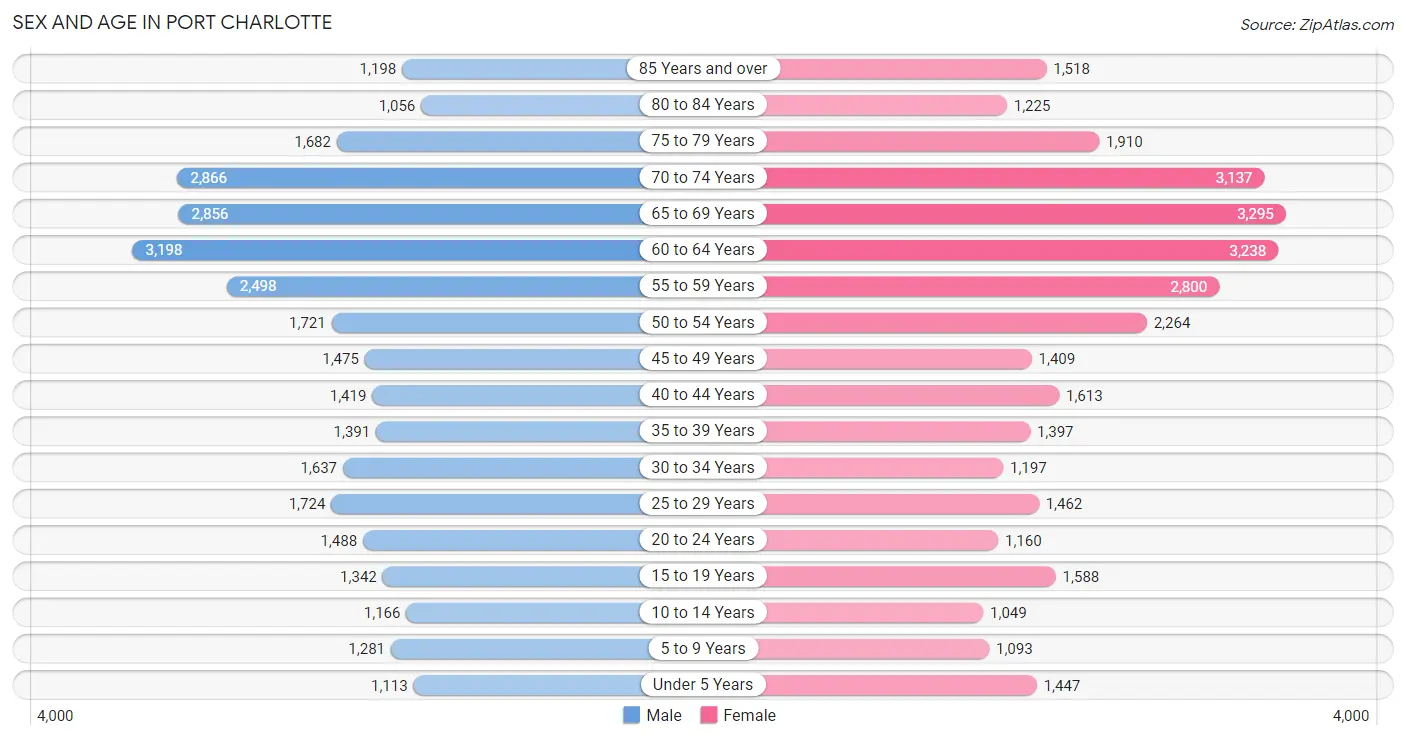
Sex and Age in Port Charlotte
Sex and Age in Port Charlotte
The most populous age groups in Port Charlotte are 60 to 64 Years (3,198 | 10.3%) for men and 65 to 69 Years (3,295 | 10.1%) for women.
| Age Bracket | Male | Female |
| Under 5 Years | 1,113 (3.6%) | 1,447 (4.4%) |
| 5 to 9 Years | 1,281 (4.1%) | 1,093 (3.3%) |
| 10 to 14 Years | 1,166 (3.7%) | 1,049 (3.2%) |
| 15 to 19 Years | 1,342 (4.3%) | 1,588 (4.8%) |
| 20 to 24 Years | 1,488 (4.8%) | 1,160 (3.5%) |
| 25 to 29 Years | 1,724 (5.5%) | 1,462 (4.5%) |
| 30 to 34 Years | 1,637 (5.3%) | 1,197 (3.6%) |
| 35 to 39 Years | 1,391 (4.5%) | 1,397 (4.3%) |
| 40 to 44 Years | 1,419 (4.6%) | 1,613 (4.9%) |
| 45 to 49 Years | 1,475 (4.7%) | 1,409 (4.3%) |
| 50 to 54 Years | 1,721 (5.5%) | 2,264 (6.9%) |
| 55 to 59 Years | 2,498 (8.0%) | 2,800 (8.5%) |
| 60 to 64 Years | 3,198 (10.3%) | 3,238 (9.9%) |
| 65 to 69 Years | 2,856 (9.2%) | 3,295 (10.1%) |
| 70 to 74 Years | 2,866 (9.2%) | 3,137 (9.6%) |
| 75 to 79 Years | 1,682 (5.4%) | 1,910 (5.8%) |
| 80 to 84 Years | 1,056 (3.4%) | 1,225 (3.7%) |
| 85 Years and over | 1,198 (3.8%) | 1,518 (4.6%) |
| Total | 31,111 (100.0%) | 32,802 (100.0%) |
Families and Households in Port Charlotte
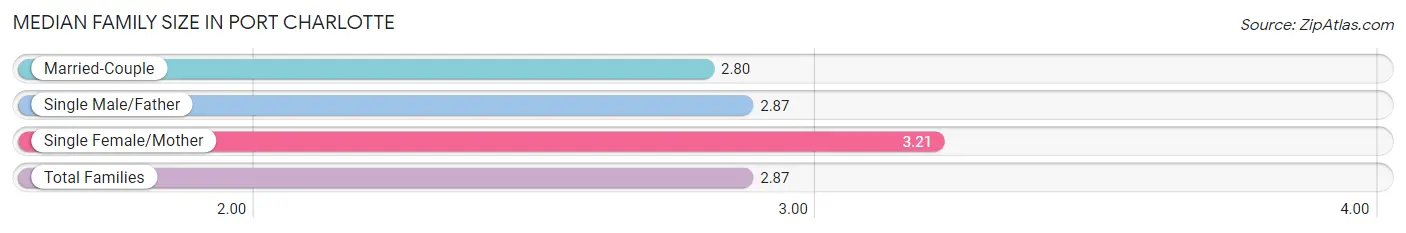
Median Family Size in Port Charlotte
The median family size in Port Charlotte is 2.87 persons per family, with single female/mother families (2,800 | 16.1%) accounting for the largest median family size of 3.21 persons per family. On the other hand, married-couple families (13,573 | 77.9%) represent the smallest median family size with 2.80 persons per family.
| Family Type | # Families | Family Size |
| Married-Couple | 13,573 (77.9%) | 2.80 |
| Single Male/Father | 1,050 (6.0%) | 2.87 |
| Single Female/Mother | 2,800 (16.1%) | 3.21 |
| Total Families | 17,423 (100.0%) | 2.87 |
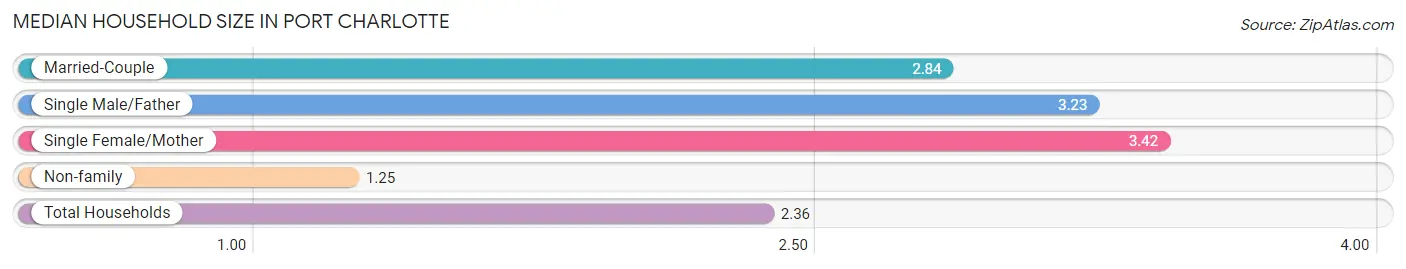
Median Household Size in Port Charlotte
The median household size in Port Charlotte is 2.36 persons per household, with single female/mother households (2,800 | 10.4%) accounting for the largest median household size of 3.42 persons per household. non-family households (9,415 | 35.1%) represent the smallest median household size with 1.25 persons per household.
| Household Type | # Households | Household Size |
| Married-Couple | 13,573 (50.6%) | 2.84 |
| Single Male/Father | 1,050 (3.9%) | 3.23 |
| Single Female/Mother | 2,800 (10.4%) | 3.42 |
| Non-family | 9,415 (35.1%) | 1.25 |
| Total Households | 26,838 (100.0%) | 2.36 |
Household Size by Marriage Status in Port Charlotte
Out of a total of 26,838 households in Port Charlotte, 17,423 (64.9%) are family households, while 9,415 (35.1%) are nonfamily households. The most numerous type of family households are 2-person households, comprising 9,991, and the most common type of nonfamily households are 1-person households, comprising 7,559.
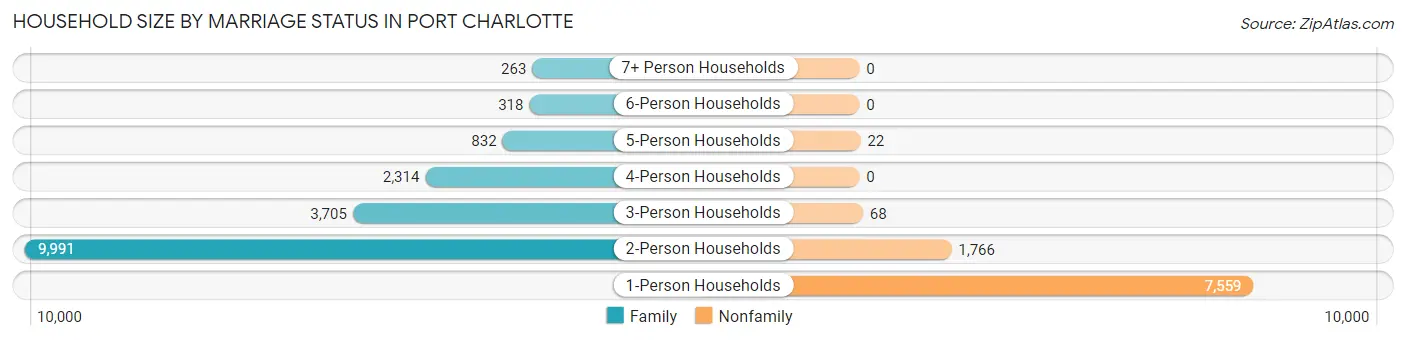
| Household Size | Family Households | Nonfamily Households |
| 1-Person Households | - | 7,559 (28.2%) |
| 2-Person Households | 9,991 (37.2%) | 1,766 (6.6%) |
| 3-Person Households | 3,705 (13.8%) | 68 (0.3%) |
| 4-Person Households | 2,314 (8.6%) | 0 (0.0%) |
| 5-Person Households | 832 (3.1%) | 22 (0.1%) |
| 6-Person Households | 318 (1.2%) | 0 (0.0%) |
| 7+ Person Households | 263 (1.0%) | 0 (0.0%) |
| Total | 17,423 (64.9%) | 9,415 (35.1%) |
Female Fertility in Port Charlotte
Fertility by Age in Port Charlotte
Average fertility rate in Port Charlotte is 87.0 births per 1,000 women. Women in the age bracket of 20 to 34 years have the highest fertility rate with 206.0 births per 1,000 women. Women in the age bracket of 20 to 34 years acount for 88.1% of all women with births.
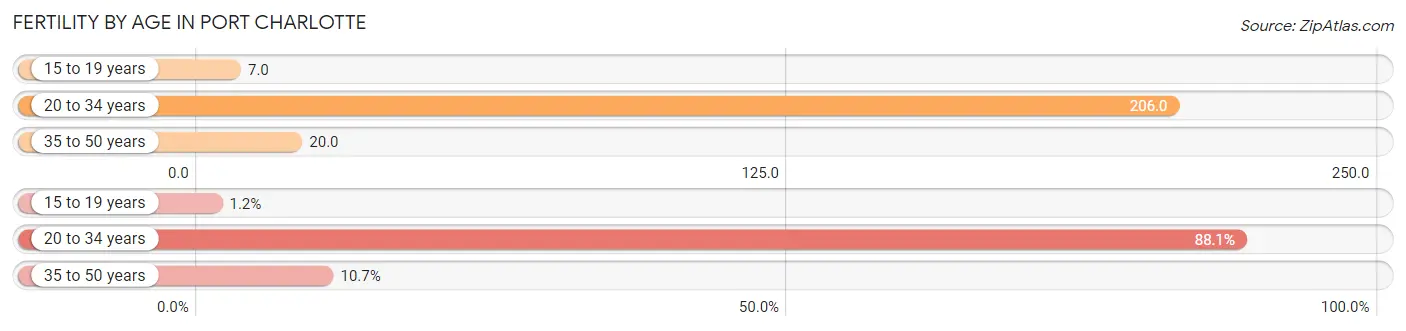
| Age Bracket | Women with Births | Births / 1,000 Women |
| 15 to 19 years | 11 (1.2%) | 7.0 |
| 20 to 34 years | 786 (88.1%) | 206.0 |
| 35 to 50 years | 95 (10.6%) | 20.0 |
| Total | 892 (100.0%) | 87.0 |
Fertility by Age by Marriage Status in Port Charlotte
51.6% of women with births (892) in Port Charlotte are married. The highest percentage of unmarried women with births falls into 15 to 19 years age bracket with 100.0% of them unmarried at the time of birth, while the lowest percentage of unmarried women with births belong to 20 to 34 years age bracket with 41.5% of them unmarried.
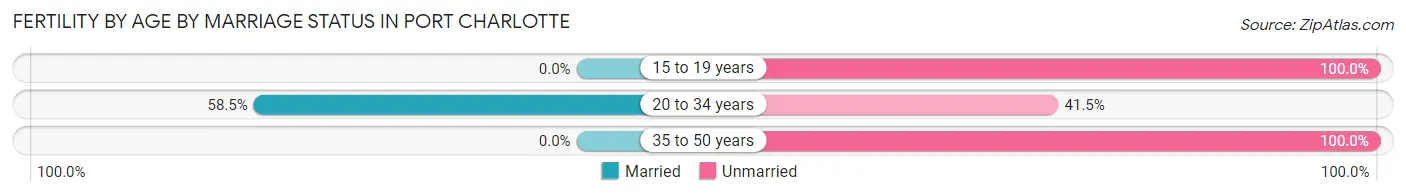
| Age Bracket | Married | Unmarried |
| 15 to 19 years | 0 (0.0%) | 11 (100.0%) |
| 20 to 34 years | 460 (58.5%) | 326 (41.5%) |
| 35 to 50 years | 0 (0.0%) | 95 (100.0%) |
| Total | 460 (51.6%) | 432 (48.4%) |
Fertility by Education in Port Charlotte
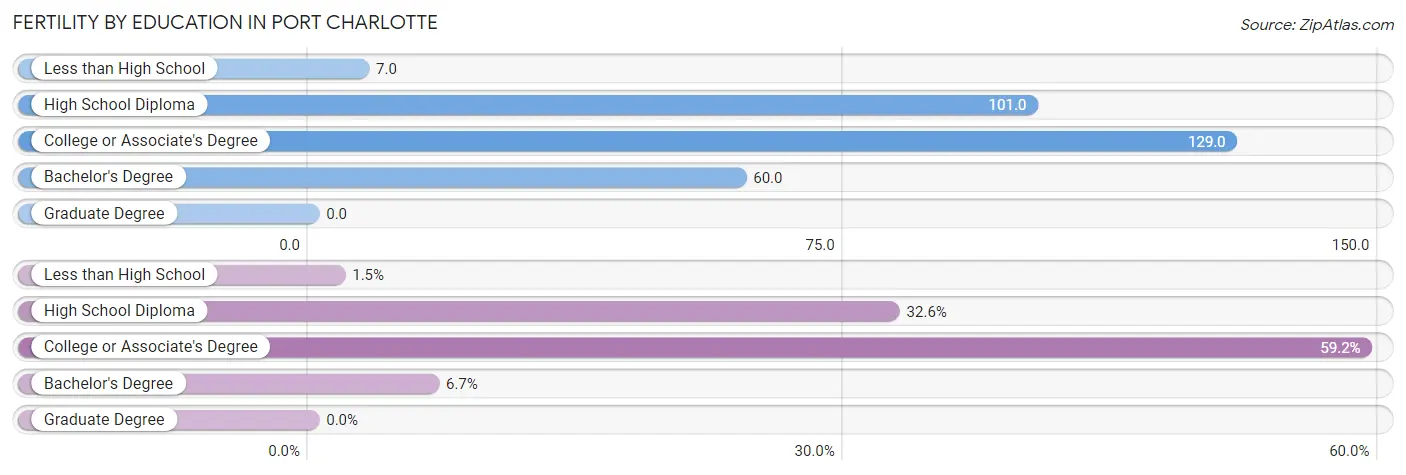
| Educational Attainment | Women with Births | Births / 1,000 Women |
| Less than High School | 13 (1.5%) | 7.0 |
| High School Diploma | 291 (32.6%) | 101.0 |
| College or Associate's Degree | 528 (59.2%) | 129.0 |
| Bachelor's Degree | 60 (6.7%) | 60.0 |
| Graduate Degree | 0 (0.0%) | 0.0 |
| Total | 892 (100.0%) | 87.0 |
Fertility by Education by Marriage Status in Port Charlotte
48.4% of women with births in Port Charlotte are unmarried. Women with the educational attainment of college or associate's degree are most likely to be married with 67.6% of them married at childbirth, while women with the educational attainment of less than high school are least likely to be married with 100.0% of them unmarried at childbirth.
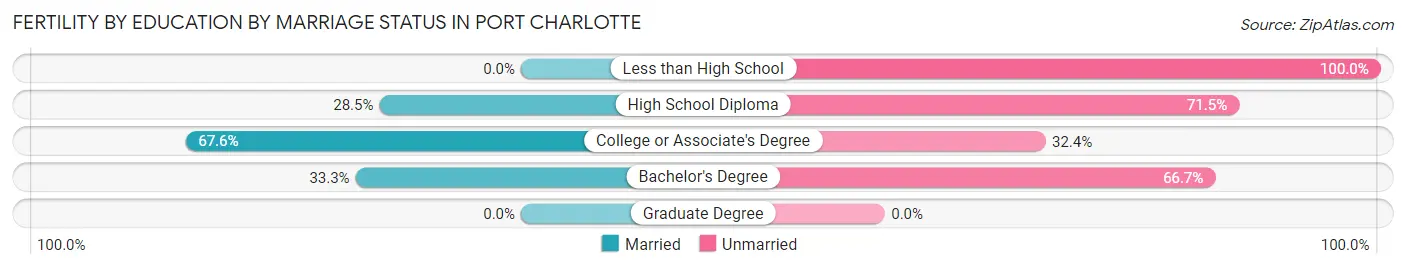
| Educational Attainment | Married | Unmarried |
| Less than High School | 0 (0.0%) | 13 (100.0%) |
| High School Diploma | 83 (28.5%) | 208 (71.5%) |
| College or Associate's Degree | 357 (67.6%) | 171 (32.4%) |
| Bachelor's Degree | 20 (33.3%) | 40 (66.7%) |
| Graduate Degree | 0 (0.0%) | 0 (0.0%) |
| Total | 460 (51.6%) | 432 (48.4%) |
Employment Characteristics in Port Charlotte
Employment by Class of Employer in Port Charlotte
Among the 24,655 employed individuals in Port Charlotte, private company employees (17,100 | 69.4%), self-employed (not incorporated) (2,333 | 9.5%), and local government employees (1,588 | 6.4%) make up the most common classes of employment.
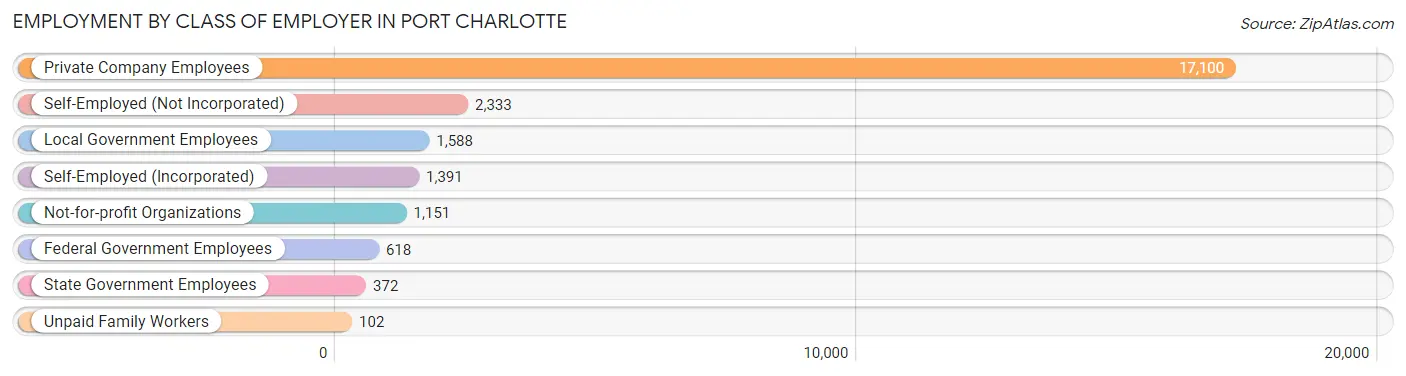
| Employer Class | # Employees | % Employees |
| Private Company Employees | 17,100 | 69.4% |
| Self-Employed (Incorporated) | 1,391 | 5.6% |
| Self-Employed (Not Incorporated) | 2,333 | 9.5% |
| Not-for-profit Organizations | 1,151 | 4.7% |
| Local Government Employees | 1,588 | 6.4% |
| State Government Employees | 372 | 1.5% |
| Federal Government Employees | 618 | 2.5% |
| Unpaid Family Workers | 102 | 0.4% |
| Total | 24,655 | 100.0% |
Employment Status by Age in Port Charlotte
According to the labor force statistics for Port Charlotte, out of the total population over 16 years of age (56,081), 48.3% or 27,087 individuals are in the labor force, with 7.0% or 1,896 of them unemployed. The age group with the highest labor force participation rate is 25 to 29 years, with 87.3% or 2,781 individuals in the labor force. Within the labor force, the 20 to 24 years age range has the highest percentage of unemployed individuals, with 12.3% or 260 of them being unemployed.
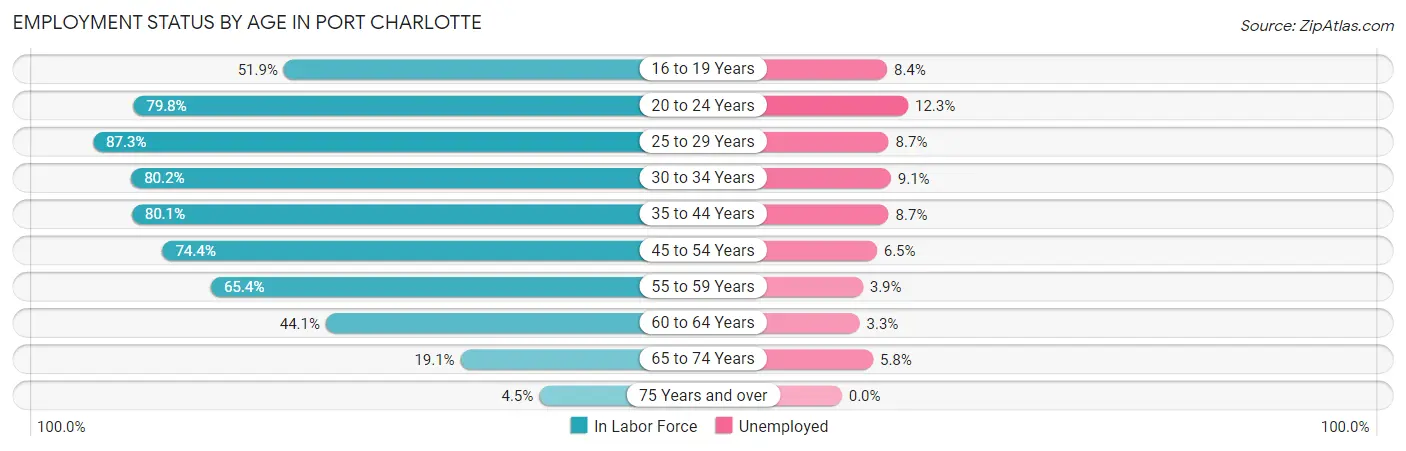
| Age Bracket | In Labor Force | Unemployed |
| 16 to 19 Years | 1,166 (51.9%) | 98 (8.4%) |
| 20 to 24 Years | 2,113 (79.8%) | 260 (12.3%) |
| 25 to 29 Years | 2,781 (87.3%) | 242 (8.7%) |
| 30 to 34 Years | 2,273 (80.2%) | 207 (9.1%) |
| 35 to 44 Years | 4,662 (80.1%) | 406 (8.7%) |
| 45 to 54 Years | 5,111 (74.4%) | 332 (6.5%) |
| 55 to 59 Years | 3,465 (65.4%) | 135 (3.9%) |
| 60 to 64 Years | 2,838 (44.1%) | 94 (3.3%) |
| 65 to 74 Years | 2,321 (19.1%) | 135 (5.8%) |
| 75 Years and over | 387 (4.5%) | 0 (0.0%) |
| Total | 27,087 (48.3%) | 1,896 (7.0%) |
Employment Status by Educational Attainment in Port Charlotte
According to labor force statistics for Port Charlotte, 69.4% of individuals (21,127) out of the total population between 25 and 64 years of age (30,443) are in the labor force, with 6.7% or 1,416 of them being unemployed. The group with the highest labor force participation rate are those with the educational attainment of bachelor's degree or higher, with 75.0% or 4,094 individuals in the labor force. Within the labor force, individuals with less than high school education have the highest percentage of unemployment, with 12.2% or 187 of them being unemployed.
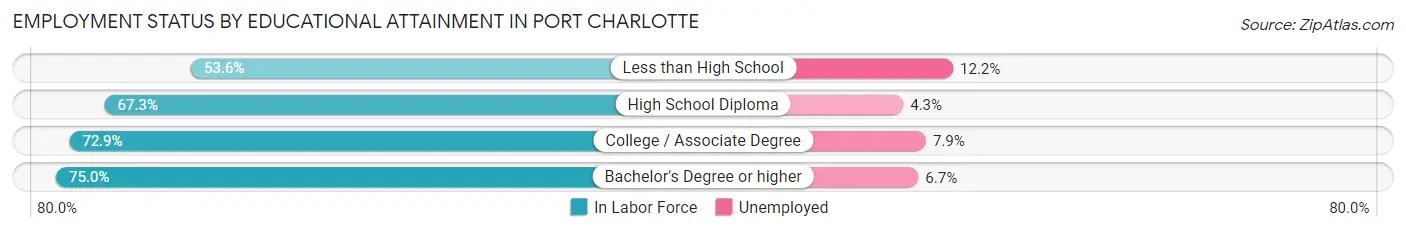
| Educational Attainment | In Labor Force | Unemployed |
| Less than High School | 1,532 (53.6%) | 349 (12.2%) |
| High School Diploma | 7,599 (67.3%) | 486 (4.3%) |
| College / Associate Degree | 7,899 (72.9%) | 856 (7.9%) |
| Bachelor's Degree or higher | 4,094 (75.0%) | 366 (6.7%) |
| Total | 21,127 (69.4%) | 2,040 (6.7%) |
Employment Occupations by Sex in Port Charlotte
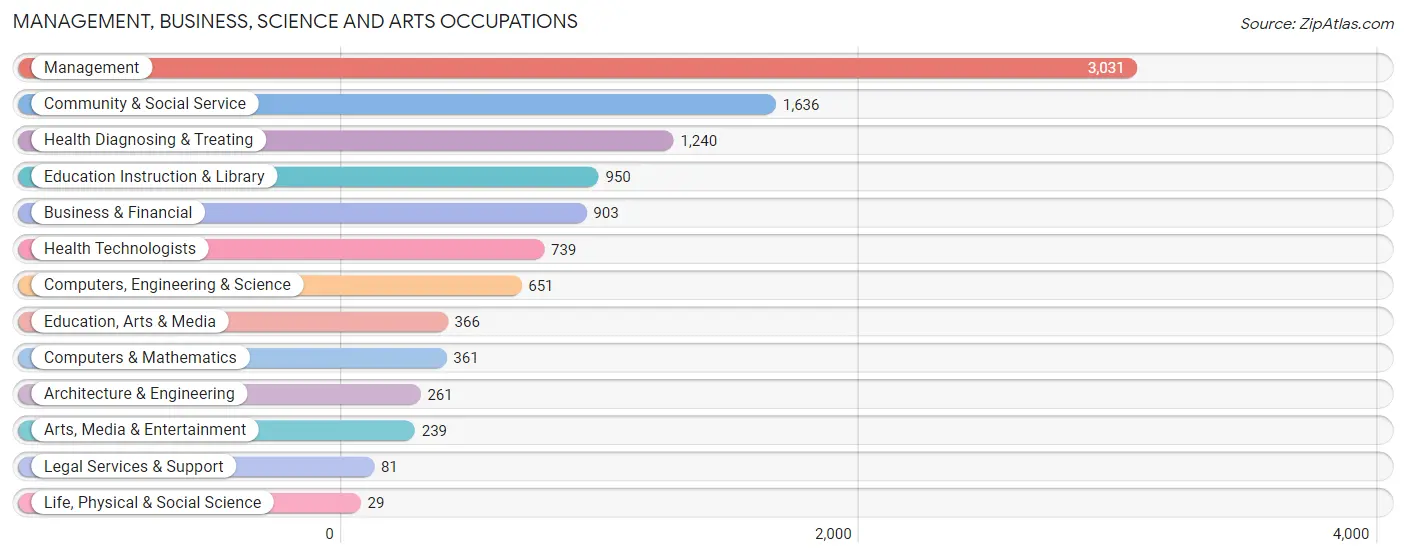
Management, Business, Science and Arts Occupations
The most common Management, Business, Science and Arts occupations in Port Charlotte are Management (3,031 | 12.0%), Community & Social Service (1,636 | 6.5%), Health Diagnosing & Treating (1,240 | 4.9%), Education Instruction & Library (950 | 3.8%), and Business & Financial (903 | 3.6%).
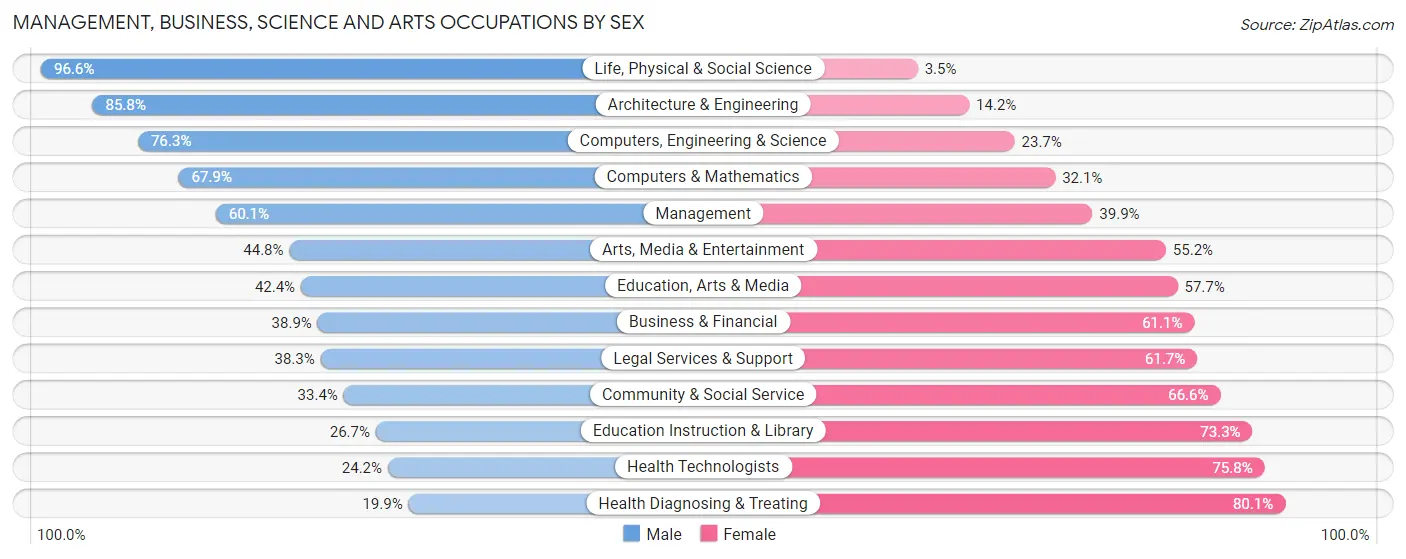
Management, Business, Science and Arts Occupations by Sex
Within the Management, Business, Science and Arts occupations in Port Charlotte, the most male-oriented occupations are Life, Physical & Social Science (96.6%), Architecture & Engineering (85.8%), and Computers, Engineering & Science (76.3%), while the most female-oriented occupations are Health Diagnosing & Treating (80.1%), Health Technologists (75.8%), and Education Instruction & Library (73.3%).
| Occupation | Male | Female |
| Management | 1,822 (60.1%) | 1,209 (39.9%) |
| Business & Financial | 351 (38.9%) | 552 (61.1%) |
| Computers, Engineering & Science | 497 (76.3%) | 154 (23.7%) |
| Computers & Mathematics | 245 (67.9%) | 116 (32.1%) |
| Architecture & Engineering | 224 (85.8%) | 37 (14.2%) |
| Life, Physical & Social Science | 28 (96.6%) | 1 (3.5%) |
| Community & Social Service | 547 (33.4%) | 1,089 (66.6%) |
| Education, Arts & Media | 155 (42.3%) | 211 (57.7%) |
| Legal Services & Support | 31 (38.3%) | 50 (61.7%) |
| Education Instruction & Library | 254 (26.7%) | 696 (73.3%) |
| Arts, Media & Entertainment | 107 (44.8%) | 132 (55.2%) |
| Health Diagnosing & Treating | 247 (19.9%) | 993 (80.1%) |
| Health Technologists | 179 (24.2%) | 560 (75.8%) |
| Total (Category) | 3,464 (46.4%) | 3,997 (53.6%) |
| Total (Overall) | 13,109 (52.1%) | 12,052 (47.9%) |
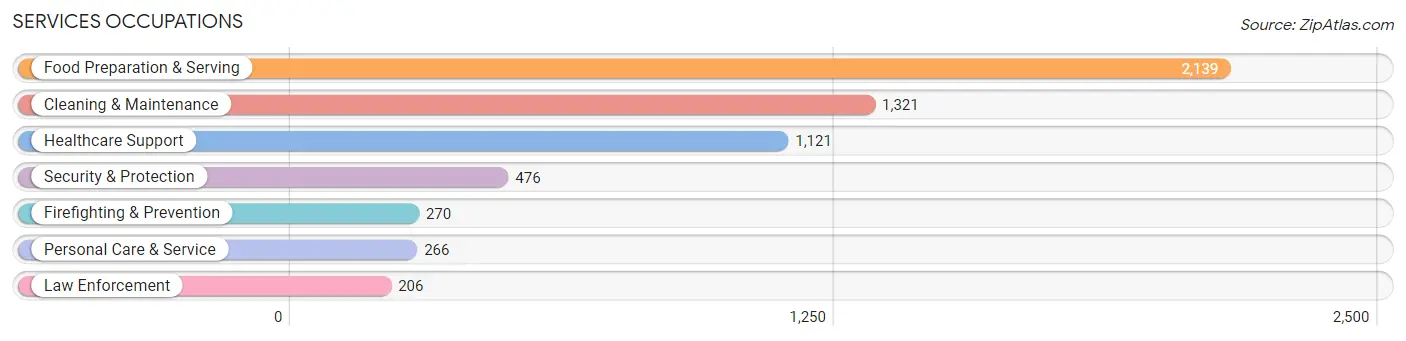
Services Occupations
The most common Services occupations in Port Charlotte are Food Preparation & Serving (2,139 | 8.5%), Cleaning & Maintenance (1,321 | 5.2%), Healthcare Support (1,121 | 4.5%), Security & Protection (476 | 1.9%), and Firefighting & Prevention (270 | 1.1%).
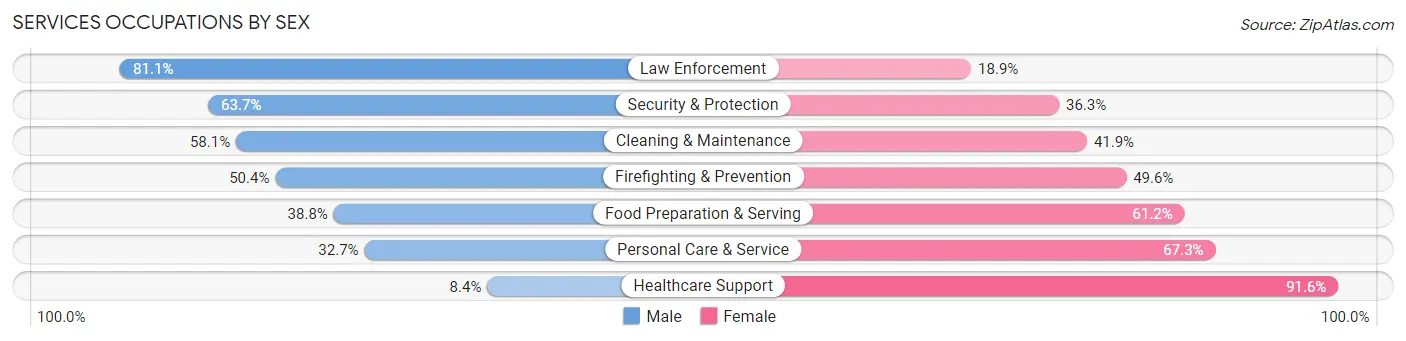
Services Occupations by Sex
Within the Services occupations in Port Charlotte, the most male-oriented occupations are Law Enforcement (81.1%), Security & Protection (63.7%), and Cleaning & Maintenance (58.1%), while the most female-oriented occupations are Healthcare Support (91.6%), Personal Care & Service (67.3%), and Food Preparation & Serving (61.2%).
| Occupation | Male | Female |
| Healthcare Support | 94 (8.4%) | 1,027 (91.6%) |
| Security & Protection | 303 (63.7%) | 173 (36.3%) |
| Firefighting & Prevention | 136 (50.4%) | 134 (49.6%) |
| Law Enforcement | 167 (81.1%) | 39 (18.9%) |
| Food Preparation & Serving | 830 (38.8%) | 1,309 (61.2%) |
| Cleaning & Maintenance | 768 (58.1%) | 553 (41.9%) |
| Personal Care & Service | 87 (32.7%) | 179 (67.3%) |
| Total (Category) | 2,082 (39.1%) | 3,241 (60.9%) |
| Total (Overall) | 13,109 (52.1%) | 12,052 (47.9%) |
Sales and Office Occupations
The most common Sales and Office occupations in Port Charlotte are Office & Administration (3,065 | 12.2%), and Sales & Related (3,063 | 12.2%).

Sales and Office Occupations by Sex
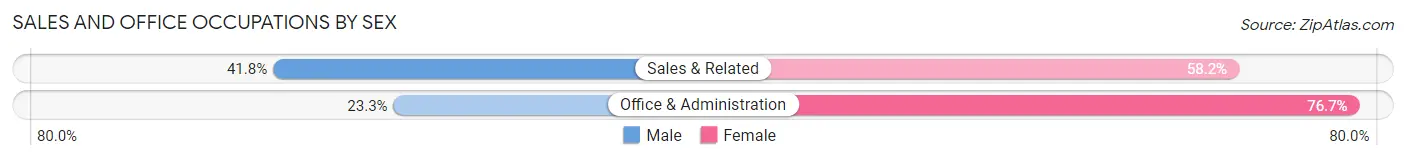
| Occupation | Male | Female |
| Sales & Related | 1,280 (41.8%) | 1,783 (58.2%) |
| Office & Administration | 713 (23.3%) | 2,352 (76.7%) |
| Total (Category) | 1,993 (32.5%) | 4,135 (67.5%) |
| Total (Overall) | 13,109 (52.1%) | 12,052 (47.9%) |
Natural Resources, Construction and Maintenance Occupations
The most common Natural Resources, Construction and Maintenance occupations in Port Charlotte are Construction & Extraction (2,013 | 8.0%), Installation, Maintenance & Repair (1,091 | 4.3%), and Farming, Fishing & Forestry (146 | 0.6%).

Natural Resources, Construction and Maintenance Occupations by Sex

| Occupation | Male | Female |
| Farming, Fishing & Forestry | 58 (39.7%) | 88 (60.3%) |
| Construction & Extraction | 1,919 (95.3%) | 94 (4.7%) |
| Installation, Maintenance & Repair | 1,044 (95.7%) | 47 (4.3%) |
| Total (Category) | 3,021 (92.9%) | 229 (7.0%) |
| Total (Overall) | 13,109 (52.1%) | 12,052 (47.9%) |
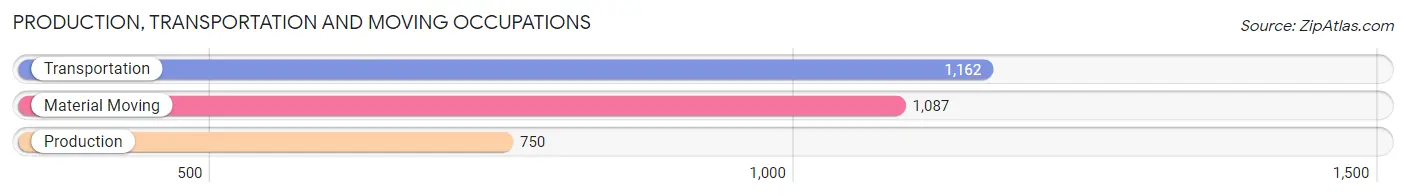
Production, Transportation and Moving Occupations
The most common Production, Transportation and Moving occupations in Port Charlotte are Transportation (1,162 | 4.6%), Material Moving (1,087 | 4.3%), and Production (750 | 3.0%).
Production, Transportation and Moving Occupations by Sex
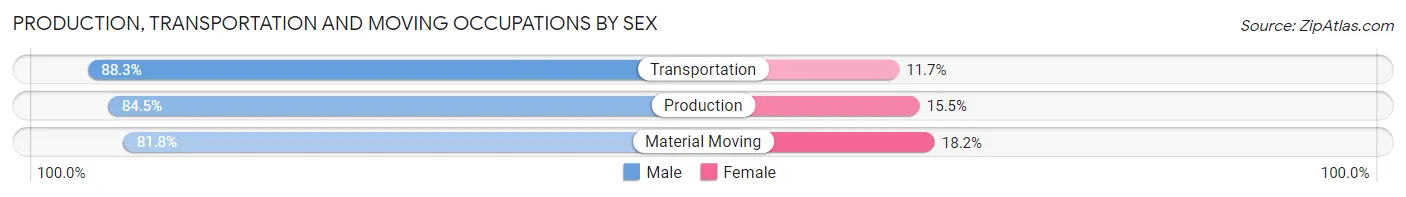
| Occupation | Male | Female |
| Production | 634 (84.5%) | 116 (15.5%) |
| Transportation | 1,026 (88.3%) | 136 (11.7%) |
| Material Moving | 889 (81.8%) | 198 (18.2%) |
| Total (Category) | 2,549 (85.0%) | 450 (15.0%) |
| Total (Overall) | 13,109 (52.1%) | 12,052 (47.9%) |
Employment Industries by Sex in Port Charlotte
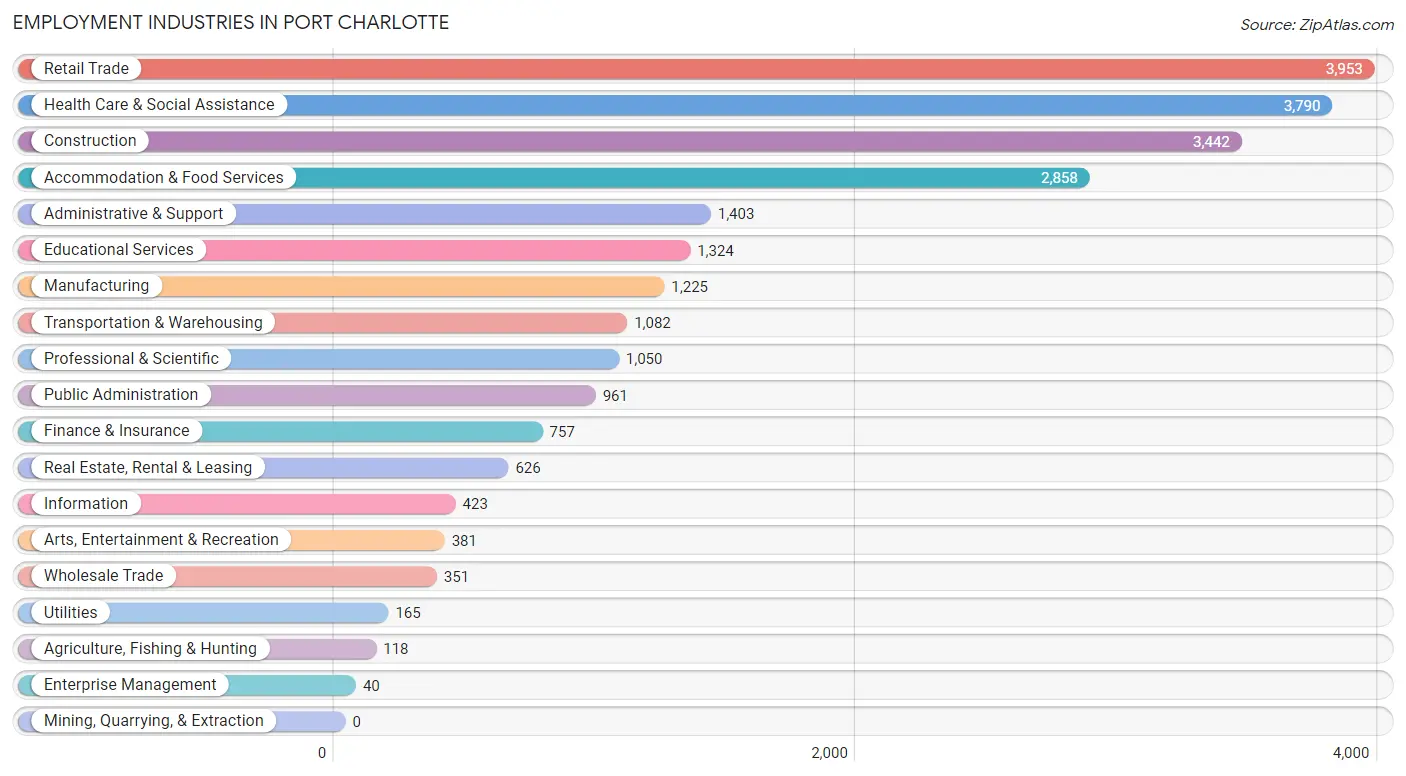
Employment Industries in Port Charlotte
The major employment industries in Port Charlotte include Retail Trade (3,953 | 15.7%), Health Care & Social Assistance (3,790 | 15.1%), Construction (3,442 | 13.7%), Accommodation & Food Services (2,858 | 11.4%), and Administrative & Support (1,403 | 5.6%).
Employment Industries by Sex in Port Charlotte
The Port Charlotte industries that see more men than women are Utilities (88.5%), Construction (86.0%), and Manufacturing (84.5%), whereas the industries that tend to have a higher number of women are Enterprise Management (100.0%), Health Care & Social Assistance (84.5%), and Agriculture, Fishing & Hunting (80.5%).
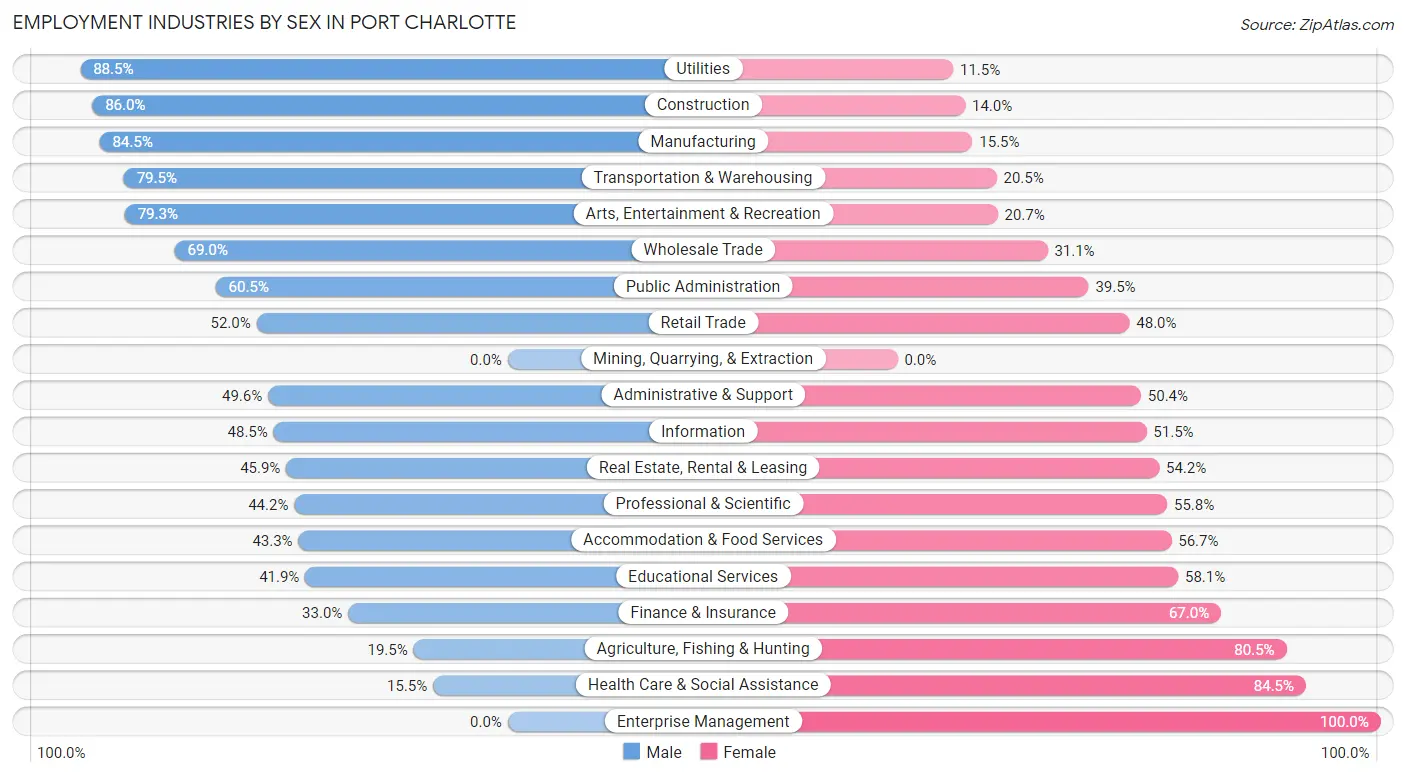
| Industry | Male | Female |
| Agriculture, Fishing & Hunting | 23 (19.5%) | 95 (80.5%) |
| Mining, Quarrying, & Extraction | 0 (0.0%) | 0 (0.0%) |
| Construction | 2,960 (86.0%) | 482 (14.0%) |
| Manufacturing | 1,035 (84.5%) | 190 (15.5%) |
| Wholesale Trade | 242 (69.0%) | 109 (31.0%) |
| Retail Trade | 2,055 (52.0%) | 1,898 (48.0%) |
| Transportation & Warehousing | 860 (79.5%) | 222 (20.5%) |
| Utilities | 146 (88.5%) | 19 (11.5%) |
| Information | 205 (48.5%) | 218 (51.5%) |
| Finance & Insurance | 250 (33.0%) | 507 (67.0%) |
| Real Estate, Rental & Leasing | 287 (45.9%) | 339 (54.1%) |
| Professional & Scientific | 464 (44.2%) | 586 (55.8%) |
| Enterprise Management | 0 (0.0%) | 40 (100.0%) |
| Administrative & Support | 696 (49.6%) | 707 (50.4%) |
| Educational Services | 555 (41.9%) | 769 (58.1%) |
| Health Care & Social Assistance | 586 (15.5%) | 3,204 (84.5%) |
| Arts, Entertainment & Recreation | 302 (79.3%) | 79 (20.7%) |
| Accommodation & Food Services | 1,238 (43.3%) | 1,620 (56.7%) |
| Public Administration | 581 (60.5%) | 380 (39.5%) |
| Total | 13,109 (52.1%) | 12,052 (47.9%) |
Education in Port Charlotte
School Enrollment in Port Charlotte
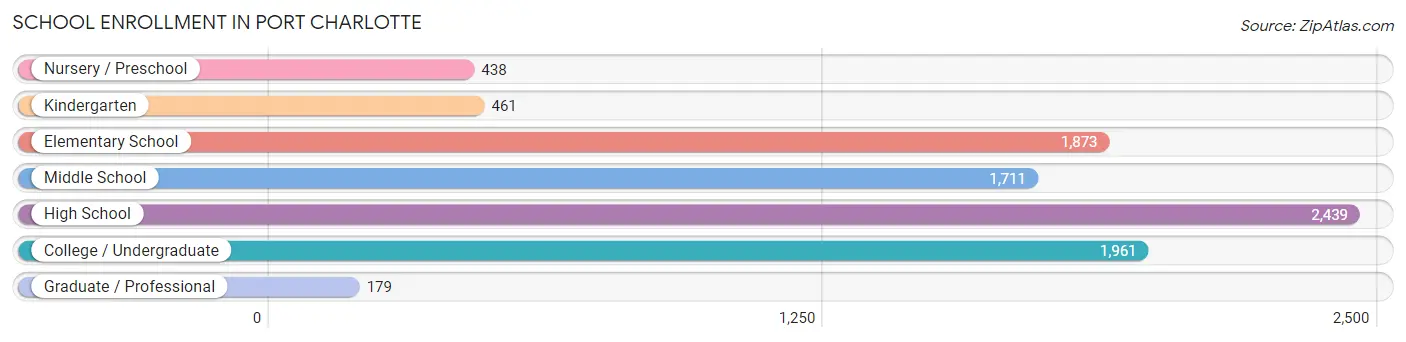
The most common levels of schooling among the 9,062 students in Port Charlotte are high school (2,439 | 26.9%), college / undergraduate (1,961 | 21.6%), and elementary school (1,873 | 20.7%).
| School Level | # Students | % Students |
| Nursery / Preschool | 438 | 4.8% |
| Kindergarten | 461 | 5.1% |
| Elementary School | 1,873 | 20.7% |
| Middle School | 1,711 | 18.9% |
| High School | 2,439 | 26.9% |
| College / Undergraduate | 1,961 | 21.6% |
| Graduate / Professional | 179 | 2.0% |
| Total | 9,062 | 100.0% |
School Enrollment by Age by Funding Source in Port Charlotte
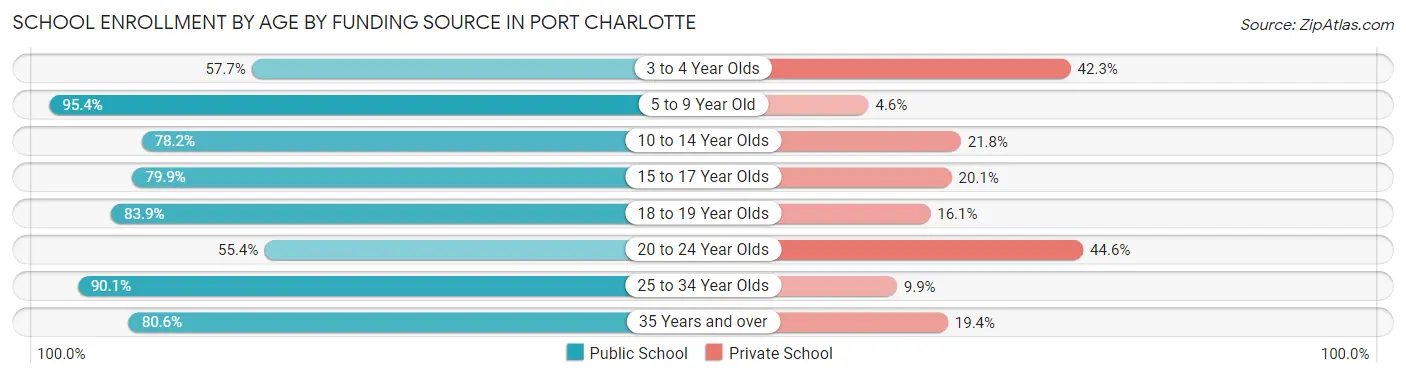
Out of a total of 9,062 students who are enrolled in schools in Port Charlotte, 1,667 (18.4%) attend a private institution, while the remaining 7,395 (81.6%) are enrolled in public schools. The age group of 20 to 24 year olds has the highest likelihood of being enrolled in private schools, with 306 (44.6% in the age bracket) enrolled. Conversely, the age group of 5 to 9 year old has the lowest likelihood of being enrolled in a private school, with 2,059 (95.4% in the age bracket) attending a public institution.
| Age Bracket | Public School | Private School |
| 3 to 4 Year Olds | 213 (57.7%) | 156 (42.3%) |
| 5 to 9 Year Old | 2,059 (95.4%) | 100 (4.6%) |
| 10 to 14 Year Olds | 1,681 (78.2%) | 469 (21.8%) |
| 15 to 17 Year Olds | 1,313 (79.9%) | 330 (20.1%) |
| 18 to 19 Year Olds | 702 (83.9%) | 135 (16.1%) |
| 20 to 24 Year Olds | 380 (55.4%) | 306 (44.6%) |
| 25 to 34 Year Olds | 610 (90.1%) | 67 (9.9%) |
| 35 Years and over | 436 (80.6%) | 105 (19.4%) |
| Total | 7,395 (81.6%) | 1,667 (18.4%) |
Educational Attainment by Field of Study in Port Charlotte
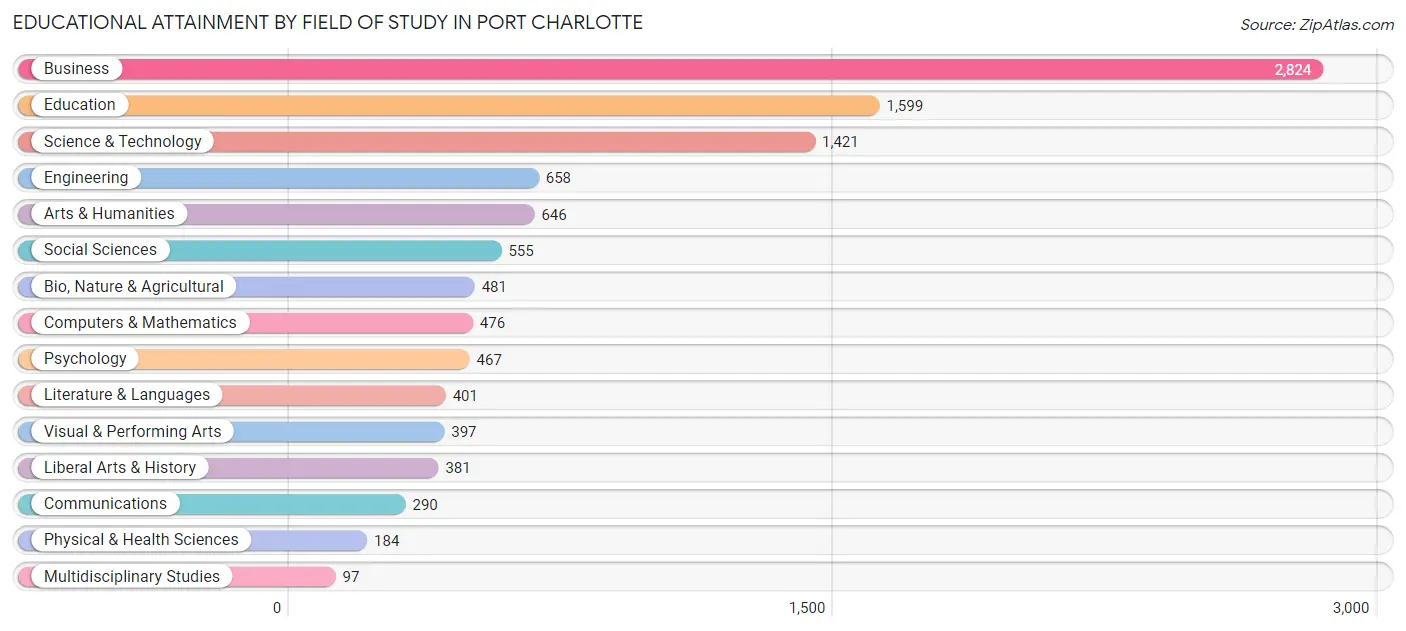
Business (2,824 | 26.0%), education (1,599 | 14.7%), science & technology (1,421 | 13.1%), engineering (658 | 6.0%), and arts & humanities (646 | 5.9%) are the most common fields of study among 10,877 individuals in Port Charlotte who have obtained a bachelor's degree or higher.
| Field of Study | # Graduates | % Graduates |
| Computers & Mathematics | 476 | 4.4% |
| Bio, Nature & Agricultural | 481 | 4.4% |
| Physical & Health Sciences | 184 | 1.7% |
| Psychology | 467 | 4.3% |
| Social Sciences | 555 | 5.1% |
| Engineering | 658 | 6.0% |
| Multidisciplinary Studies | 97 | 0.9% |
| Science & Technology | 1,421 | 13.1% |
| Business | 2,824 | 26.0% |
| Education | 1,599 | 14.7% |
| Literature & Languages | 401 | 3.7% |
| Liberal Arts & History | 381 | 3.5% |
| Visual & Performing Arts | 397 | 3.6% |
| Communications | 290 | 2.7% |
| Arts & Humanities | 646 | 5.9% |
| Total | 10,877 | 100.0% |
Transportation & Commute in Port Charlotte
Vehicle Availability by Sex in Port Charlotte
The most prevalent vehicle ownership categories in Port Charlotte are males with 2 vehicles (5,691, accounting for 44.2%) and females with 2 vehicles (4,867, making up 48.5%).
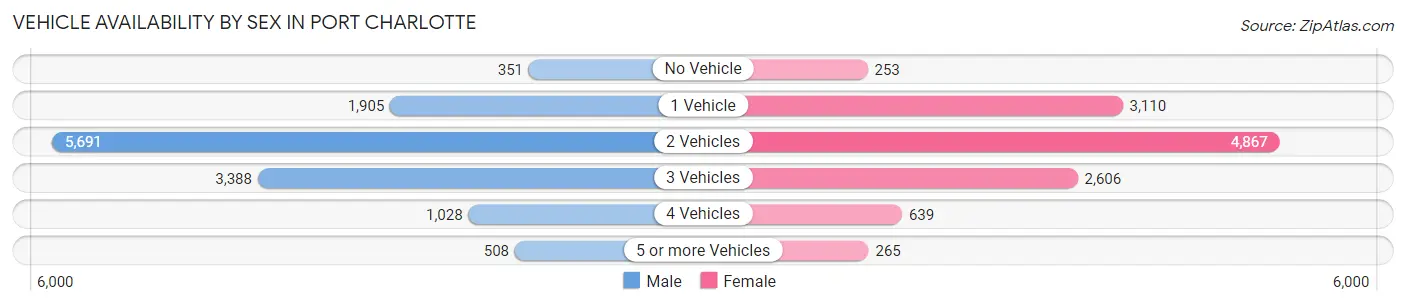
| Vehicles Available | Male | Female |
| No Vehicle | 351 (2.7%) | 253 (2.2%) |
| 1 Vehicle | 1,905 (14.8%) | 3,110 (26.5%) |
| 2 Vehicles | 5,691 (44.2%) | 4,867 (41.5%) |
| 3 Vehicles | 3,388 (26.3%) | 2,606 (22.2%) |
| 4 Vehicles | 1,028 (8.0%) | 639 (5.4%) |
| 5 or more Vehicles | 508 (4.0%) | 265 (2.3%) |
| Total | 12,871 (100.0%) | 11,740 (100.0%) |
Commute Time in Port Charlotte
The most frequently occuring commute durations in Port Charlotte are 15 to 19 minutes (4,491 commuters, 20.7%), 10 to 14 minutes (4,380 commuters, 20.2%), and 20 to 24 minutes (3,128 commuters, 14.4%).
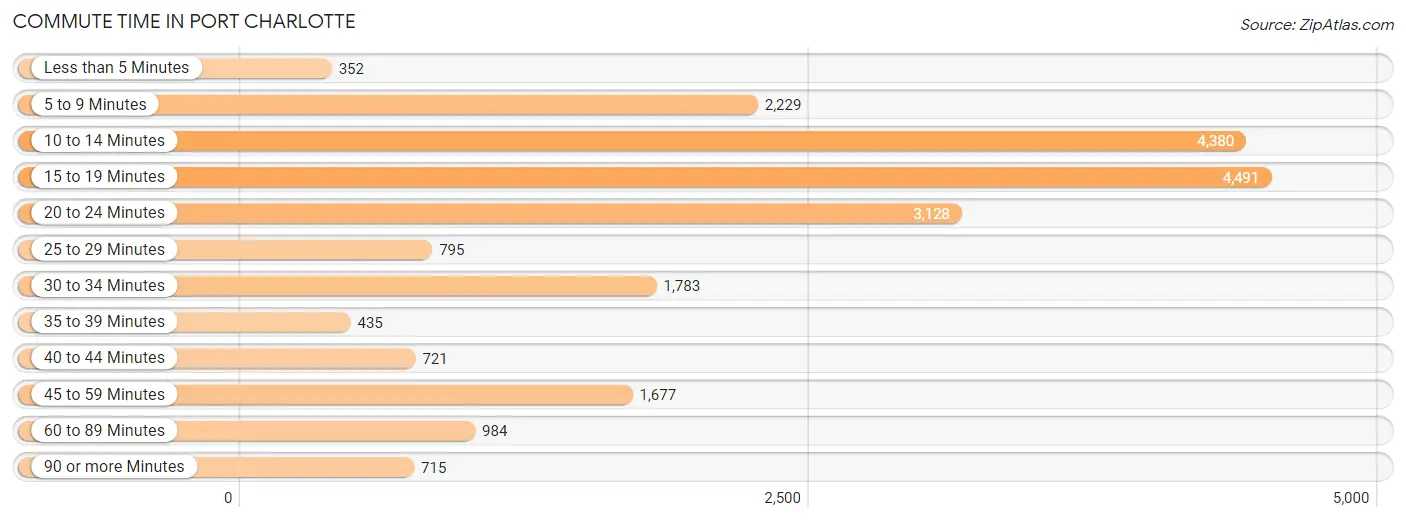
| Commute Time | # Commuters | % Commuters |
| Less than 5 Minutes | 352 | 1.6% |
| 5 to 9 Minutes | 2,229 | 10.3% |
| 10 to 14 Minutes | 4,380 | 20.2% |
| 15 to 19 Minutes | 4,491 | 20.7% |
| 20 to 24 Minutes | 3,128 | 14.4% |
| 25 to 29 Minutes | 795 | 3.7% |
| 30 to 34 Minutes | 1,783 | 8.2% |
| 35 to 39 Minutes | 435 | 2.0% |
| 40 to 44 Minutes | 721 | 3.3% |
| 45 to 59 Minutes | 1,677 | 7.7% |
| 60 to 89 Minutes | 984 | 4.5% |
| 90 or more Minutes | 715 | 3.3% |
Commute Time by Sex in Port Charlotte
The most common commute times in Port Charlotte are 15 to 19 minutes (2,101 commuters, 18.6%) for males and 10 to 14 minutes (2,608 commuters, 25.1%) for females.
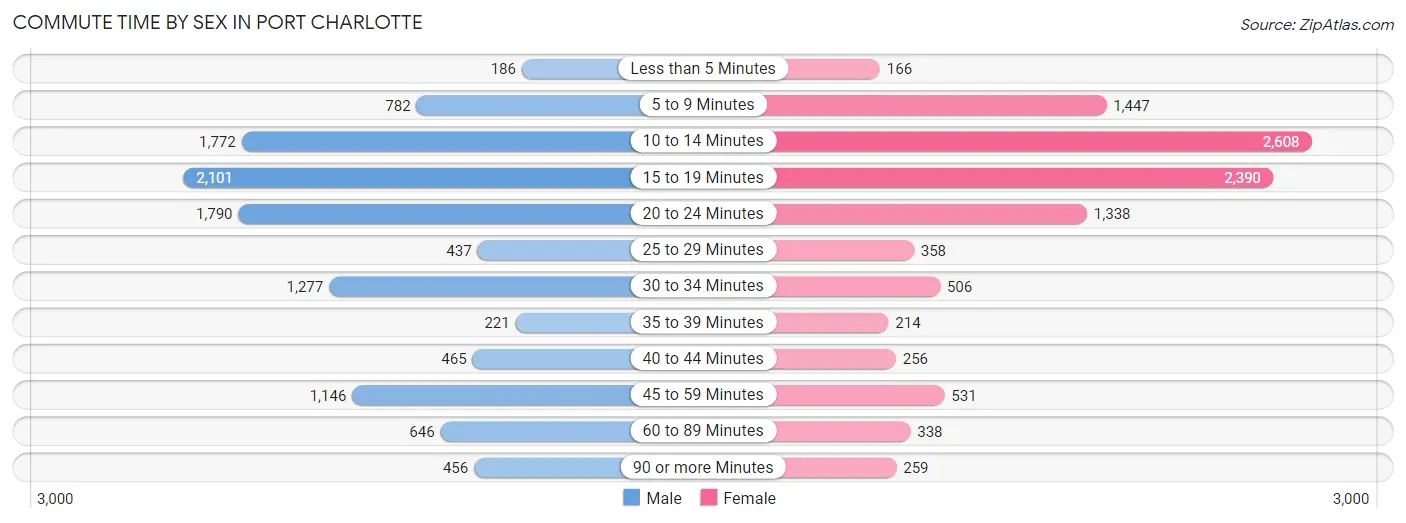
| Commute Time | Male | Female |
| Less than 5 Minutes | 186 (1.7%) | 166 (1.6%) |
| 5 to 9 Minutes | 782 (6.9%) | 1,447 (13.9%) |
| 10 to 14 Minutes | 1,772 (15.7%) | 2,608 (25.1%) |
| 15 to 19 Minutes | 2,101 (18.6%) | 2,390 (23.0%) |
| 20 to 24 Minutes | 1,790 (15.9%) | 1,338 (12.9%) |
| 25 to 29 Minutes | 437 (3.9%) | 358 (3.4%) |
| 30 to 34 Minutes | 1,277 (11.3%) | 506 (4.9%) |
| 35 to 39 Minutes | 221 (2.0%) | 214 (2.1%) |
| 40 to 44 Minutes | 465 (4.1%) | 256 (2.5%) |
| 45 to 59 Minutes | 1,146 (10.2%) | 531 (5.1%) |
| 60 to 89 Minutes | 646 (5.7%) | 338 (3.3%) |
| 90 or more Minutes | 456 (4.0%) | 259 (2.5%) |
Time of Departure to Work by Sex in Port Charlotte
The most frequent times of departure to work in Port Charlotte are 7:00 AM to 7:29 AM (1,561, 13.8%) for males and 7:30 AM to 7:59 AM (1,521, 14.6%) for females.
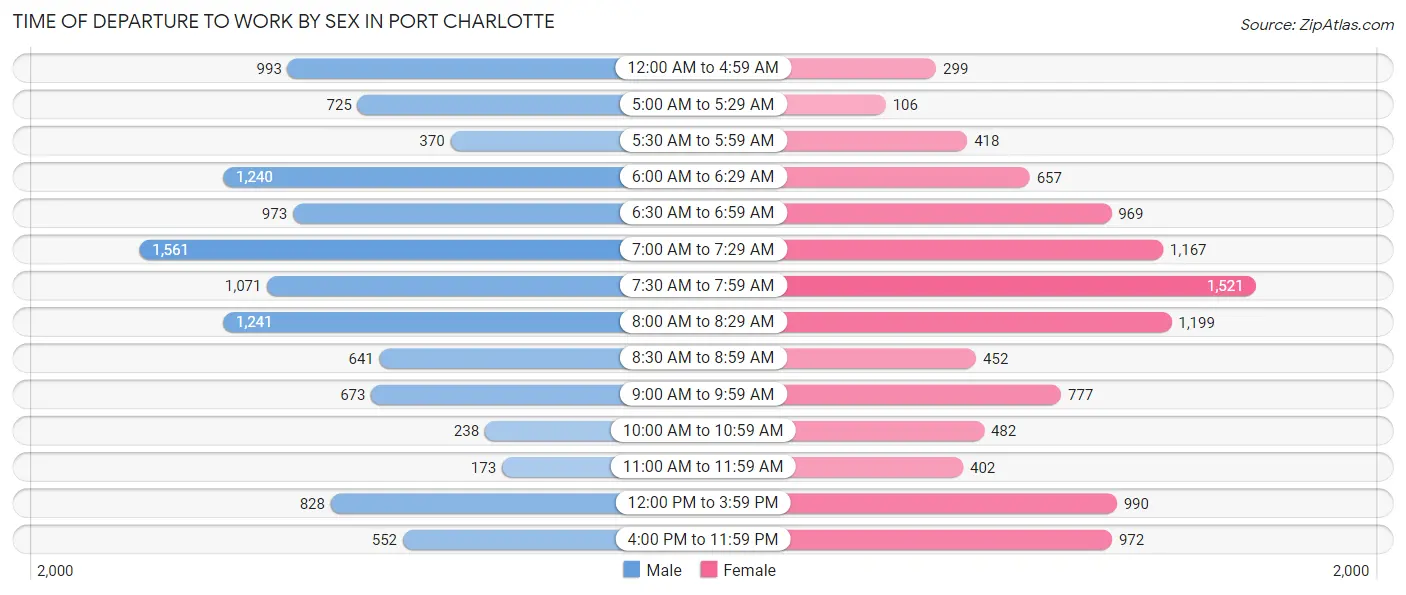
| Time of Departure | Male | Female |
| 12:00 AM to 4:59 AM | 993 (8.8%) | 299 (2.9%) |
| 5:00 AM to 5:29 AM | 725 (6.4%) | 106 (1.0%) |
| 5:30 AM to 5:59 AM | 370 (3.3%) | 418 (4.0%) |
| 6:00 AM to 6:29 AM | 1,240 (11.0%) | 657 (6.3%) |
| 6:30 AM to 6:59 AM | 973 (8.6%) | 969 (9.3%) |
| 7:00 AM to 7:29 AM | 1,561 (13.8%) | 1,167 (11.2%) |
| 7:30 AM to 7:59 AM | 1,071 (9.5%) | 1,521 (14.6%) |
| 8:00 AM to 8:29 AM | 1,241 (11.0%) | 1,199 (11.5%) |
| 8:30 AM to 8:59 AM | 641 (5.7%) | 452 (4.3%) |
| 9:00 AM to 9:59 AM | 673 (6.0%) | 777 (7.5%) |
| 10:00 AM to 10:59 AM | 238 (2.1%) | 482 (4.6%) |
| 11:00 AM to 11:59 AM | 173 (1.5%) | 402 (3.9%) |
| 12:00 PM to 3:59 PM | 828 (7.3%) | 990 (9.5%) |
| 4:00 PM to 11:59 PM | 552 (4.9%) | 972 (9.3%) |
| Total | 11,279 (100.0%) | 10,411 (100.0%) |
Housing Occupancy in Port Charlotte
Occupancy by Ownership in Port Charlotte
Of the total 26,838 dwellings in Port Charlotte, owner-occupied units account for 21,839 (81.4%), while renter-occupied units make up 4,999 (18.6%).
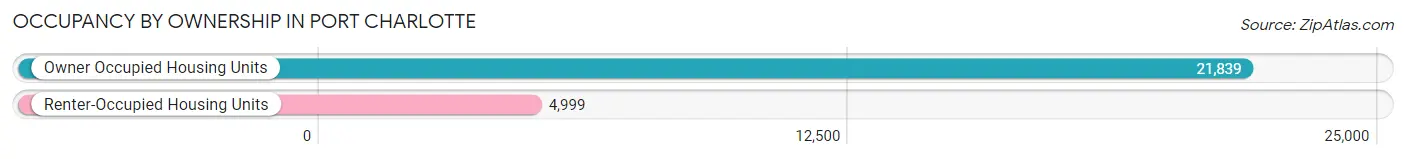
| Occupancy | # Housing Units | % Housing Units |
| Owner Occupied Housing Units | 21,839 | 81.4% |
| Renter-Occupied Housing Units | 4,999 | 18.6% |
| Total Occupied Housing Units | 26,838 | 100.0% |
Occupancy by Household Size in Port Charlotte
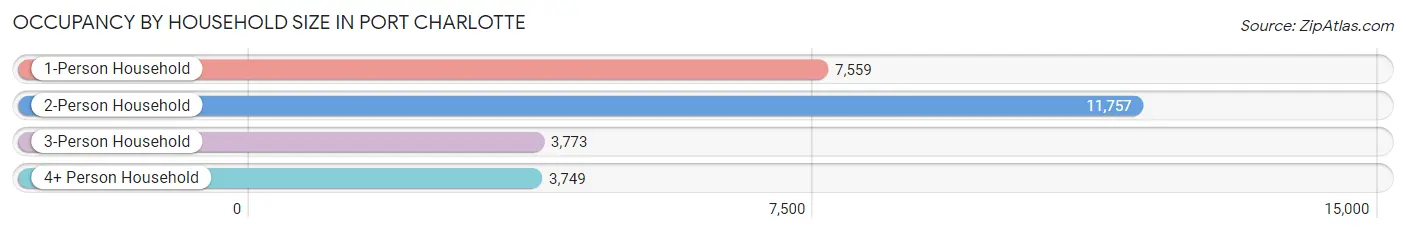
| Household Size | # Housing Units | % Housing Units |
| 1-Person Household | 7,559 | 28.2% |
| 2-Person Household | 11,757 | 43.8% |
| 3-Person Household | 3,773 | 14.1% |
| 4+ Person Household | 3,749 | 14.0% |
| Total Housing Units | 26,838 | 100.0% |
Occupancy by Ownership by Household Size in Port Charlotte
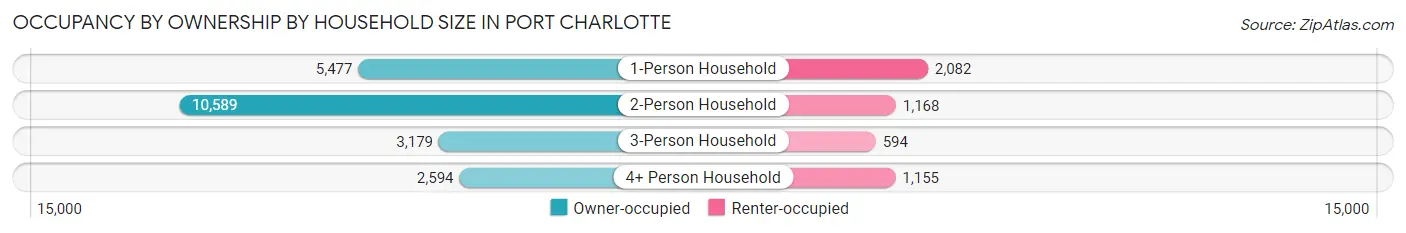
| Household Size | Owner-occupied | Renter-occupied |
| 1-Person Household | 5,477 (72.5%) | 2,082 (27.5%) |
| 2-Person Household | 10,589 (90.1%) | 1,168 (9.9%) |
| 3-Person Household | 3,179 (84.3%) | 594 (15.7%) |
| 4+ Person Household | 2,594 (69.2%) | 1,155 (30.8%) |
| Total Housing Units | 21,839 (81.4%) | 4,999 (18.6%) |
Occupancy by Educational Attainment in Port Charlotte
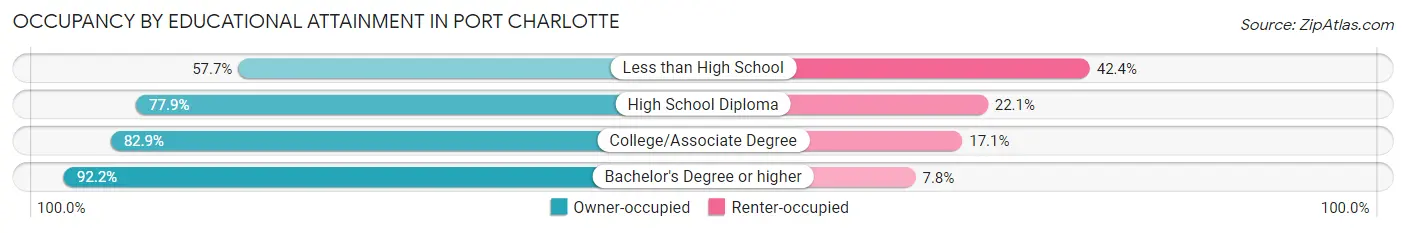
| Household Size | Owner-occupied | Renter-occupied |
| Less than High School | 1,168 (57.7%) | 858 (42.3%) |
| High School Diploma | 6,895 (77.9%) | 1,959 (22.1%) |
| College/Associate Degree | 8,374 (82.9%) | 1,725 (17.1%) |
| Bachelor's Degree or higher | 5,402 (92.2%) | 457 (7.8%) |
Occupancy by Age of Householder in Port Charlotte
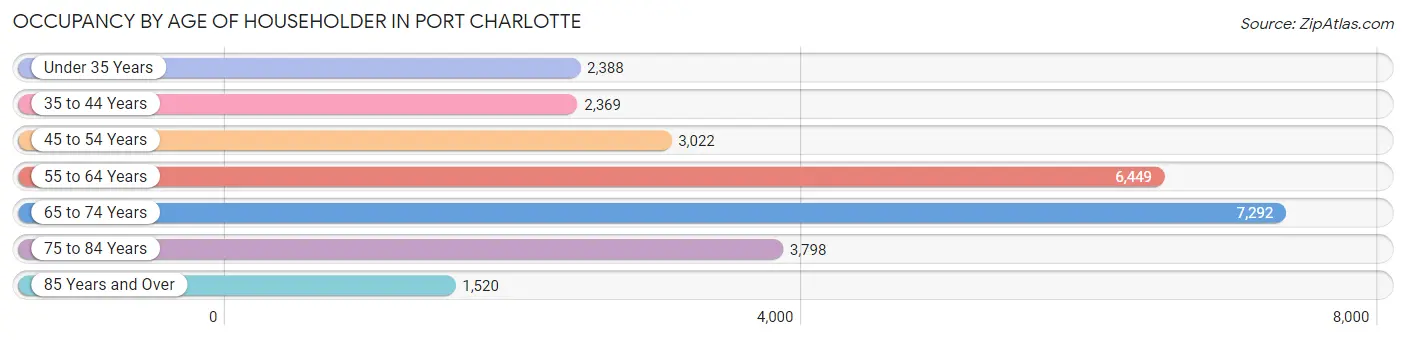
| Age Bracket | # Households | % Households |
| Under 35 Years | 2,388 | 8.9% |
| 35 to 44 Years | 2,369 | 8.8% |
| 45 to 54 Years | 3,022 | 11.3% |
| 55 to 64 Years | 6,449 | 24.0% |
| 65 to 74 Years | 7,292 | 27.2% |
| 75 to 84 Years | 3,798 | 14.1% |
| 85 Years and Over | 1,520 | 5.7% |
| Total | 26,838 | 100.0% |
Housing Finances in Port Charlotte
Median Income by Occupancy in Port Charlotte
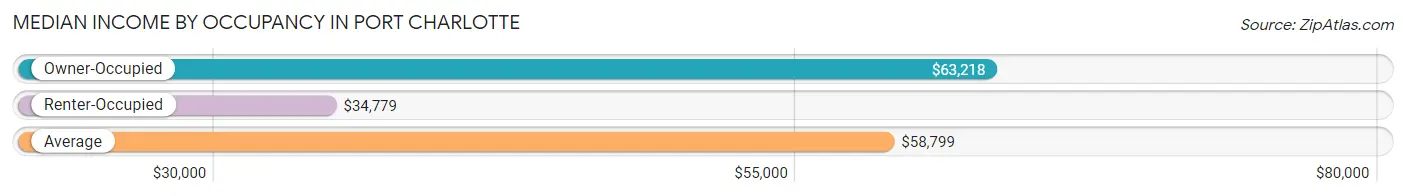
| Occupancy Type | # Households | Median Income |
| Owner-Occupied | 21,839 (81.4%) | $63,218 |
| Renter-Occupied | 4,999 (18.6%) | $34,779 |
| Average | 26,838 (100.0%) | $58,799 |
Occupancy by Householder Income Bracket in Port Charlotte
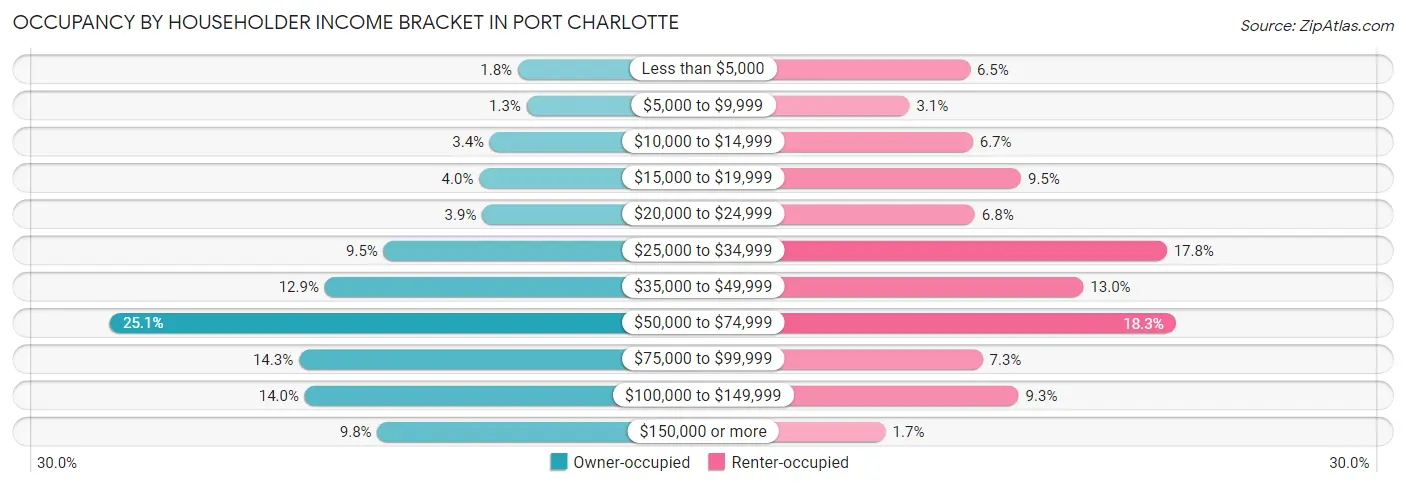
| Income Bracket | Owner-occupied | Renter-occupied |
| Less than $5,000 | 395 (1.8%) | 327 (6.5%) |
| $5,000 to $9,999 | 287 (1.3%) | 154 (3.1%) |
| $10,000 to $14,999 | 744 (3.4%) | 335 (6.7%) |
| $15,000 to $19,999 | 878 (4.0%) | 473 (9.5%) |
| $20,000 to $24,999 | 841 (3.8%) | 341 (6.8%) |
| $25,000 to $34,999 | 2,070 (9.5%) | 889 (17.8%) |
| $35,000 to $49,999 | 2,806 (12.9%) | 651 (13.0%) |
| $50,000 to $74,999 | 5,486 (25.1%) | 914 (18.3%) |
| $75,000 to $99,999 | 3,128 (14.3%) | 363 (7.3%) |
| $100,000 to $149,999 | 3,056 (14.0%) | 466 (9.3%) |
| $150,000 or more | 2,148 (9.8%) | 86 (1.7%) |
| Total | 21,839 (100.0%) | 4,999 (100.0%) |
Monthly Housing Cost Tiers in Port Charlotte
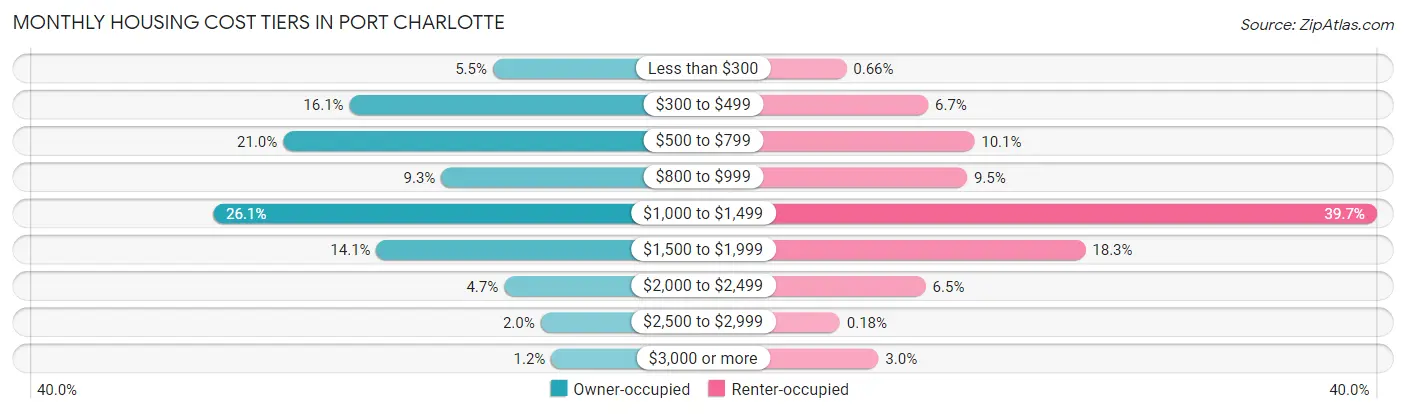
| Monthly Cost | Owner-occupied | Renter-occupied |
| Less than $300 | 1,205 (5.5%) | 33 (0.7%) |
| $300 to $499 | 3,511 (16.1%) | 334 (6.7%) |
| $500 to $799 | 4,578 (21.0%) | 504 (10.1%) |
| $800 to $999 | 2,035 (9.3%) | 477 (9.5%) |
| $1,000 to $1,499 | 5,705 (26.1%) | 1,985 (39.7%) |
| $1,500 to $1,999 | 3,078 (14.1%) | 913 (18.3%) |
| $2,000 to $2,499 | 1,024 (4.7%) | 325 (6.5%) |
| $2,500 to $2,999 | 437 (2.0%) | 9 (0.2%) |
| $3,000 or more | 266 (1.2%) | 151 (3.0%) |
| Total | 21,839 (100.0%) | 4,999 (100.0%) |
Physical Housing Characteristics in Port Charlotte
Housing Structures in Port Charlotte
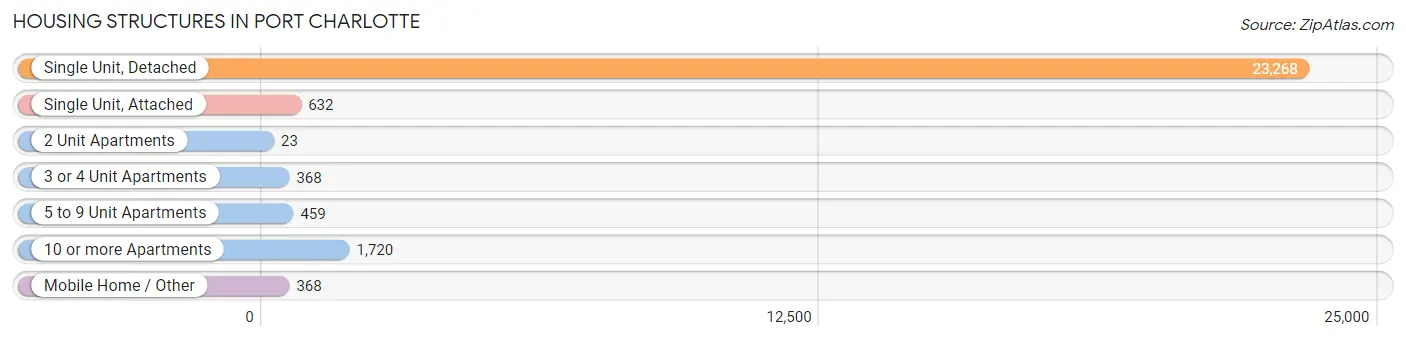
| Structure Type | # Housing Units | % Housing Units |
| Single Unit, Detached | 23,268 | 86.7% |
| Single Unit, Attached | 632 | 2.4% |
| 2 Unit Apartments | 23 | 0.1% |
| 3 or 4 Unit Apartments | 368 | 1.4% |
| 5 to 9 Unit Apartments | 459 | 1.7% |
| 10 or more Apartments | 1,720 | 6.4% |
| Mobile Home / Other | 368 | 1.4% |
| Total | 26,838 | 100.0% |
Housing Structures by Occupancy in Port Charlotte
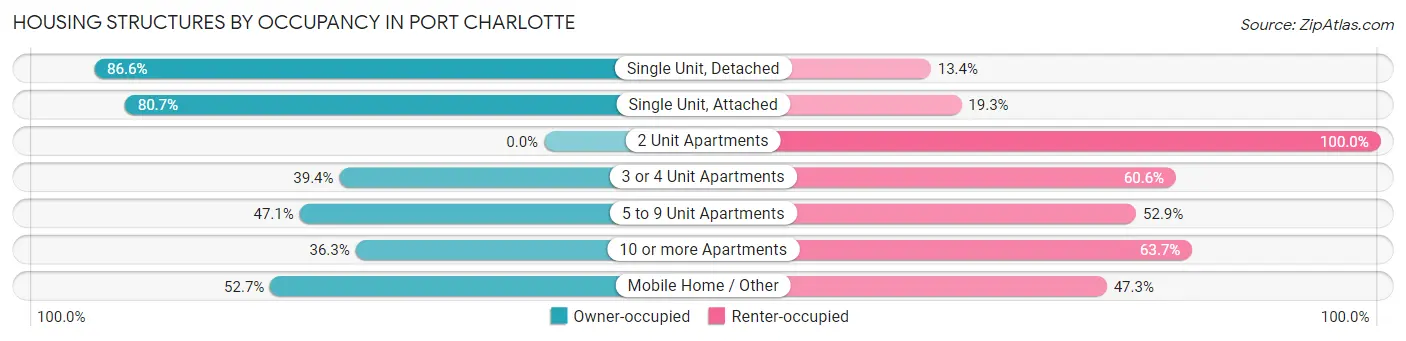
| Structure Type | Owner-occupied | Renter-occupied |
| Single Unit, Detached | 20,150 (86.6%) | 3,118 (13.4%) |
| Single Unit, Attached | 510 (80.7%) | 122 (19.3%) |
| 2 Unit Apartments | 0 (0.0%) | 23 (100.0%) |
| 3 or 4 Unit Apartments | 145 (39.4%) | 223 (60.6%) |
| 5 to 9 Unit Apartments | 216 (47.1%) | 243 (52.9%) |
| 10 or more Apartments | 624 (36.3%) | 1,096 (63.7%) |
| Mobile Home / Other | 194 (52.7%) | 174 (47.3%) |
| Total | 21,839 (81.4%) | 4,999 (18.6%) |
Housing Structures by Number of Rooms in Port Charlotte
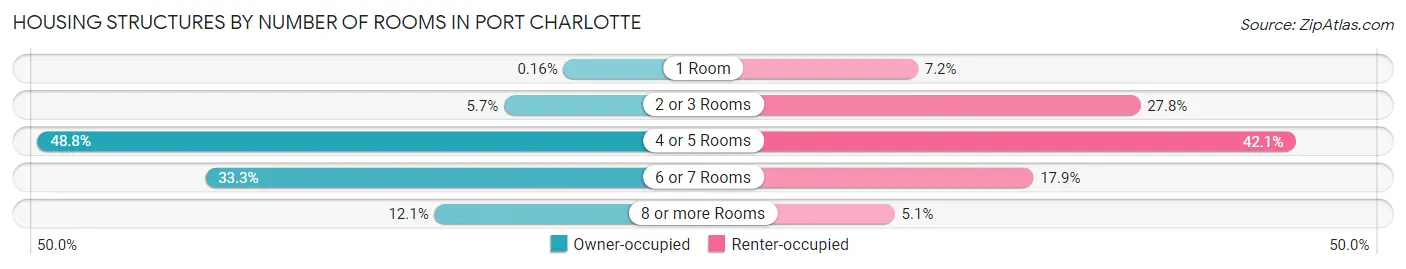
| Number of Rooms | Owner-occupied | Renter-occupied |
| 1 Room | 35 (0.2%) | 360 (7.2%) |
| 2 or 3 Rooms | 1,237 (5.7%) | 1,388 (27.8%) |
| 4 or 5 Rooms | 10,657 (48.8%) | 2,104 (42.1%) |
| 6 or 7 Rooms | 7,270 (33.3%) | 894 (17.9%) |
| 8 or more Rooms | 2,640 (12.1%) | 253 (5.1%) |
| Total | 21,839 (100.0%) | 4,999 (100.0%) |
Housing Structure by Heating Type in Port Charlotte
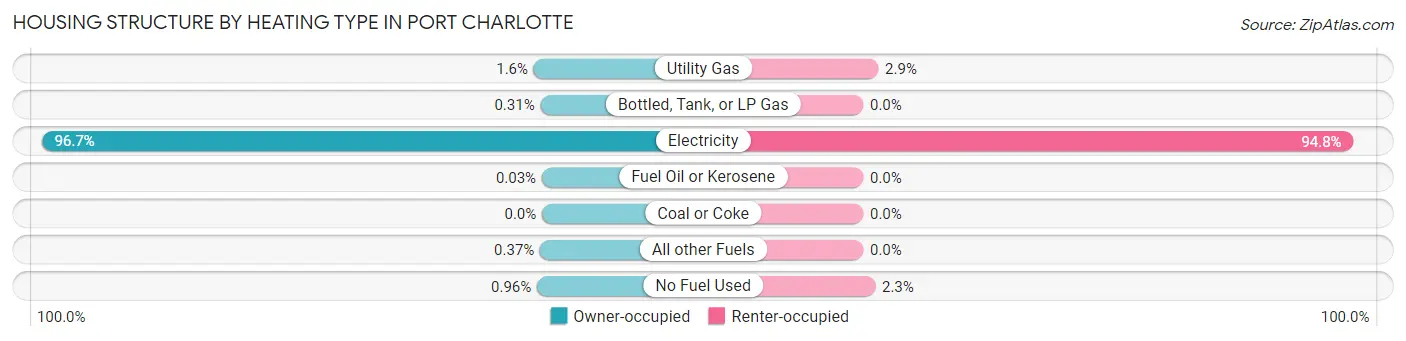
| Heating Type | Owner-occupied | Renter-occupied |
| Utility Gas | 347 (1.6%) | 146 (2.9%) |
| Bottled, Tank, or LP Gas | 67 (0.3%) | 0 (0.0%) |
| Electricity | 21,128 (96.7%) | 4,737 (94.8%) |
| Fuel Oil or Kerosene | 6 (0.0%) | 0 (0.0%) |
| Coal or Coke | 0 (0.0%) | 0 (0.0%) |
| All other Fuels | 81 (0.4%) | 0 (0.0%) |
| No Fuel Used | 210 (1.0%) | 116 (2.3%) |
| Total | 21,839 (100.0%) | 4,999 (100.0%) |
Household Vehicle Usage in Port Charlotte
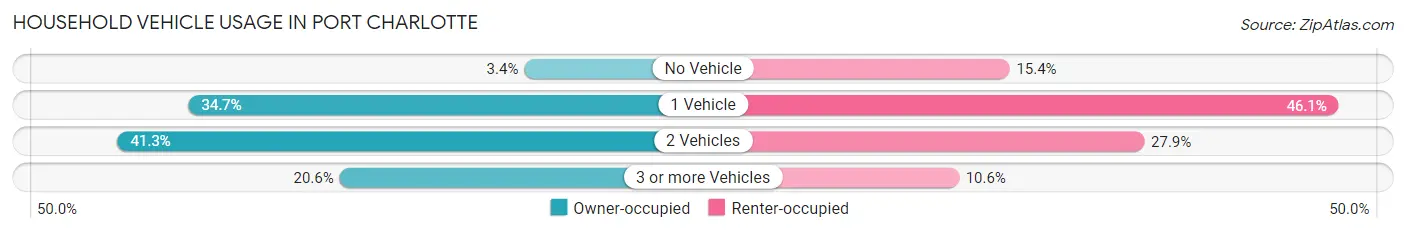
| Vehicles per Household | Owner-occupied | Renter-occupied |
| No Vehicle | 733 (3.4%) | 768 (15.4%) |
| 1 Vehicle | 7,581 (34.7%) | 2,304 (46.1%) |
| 2 Vehicles | 9,026 (41.3%) | 1,396 (27.9%) |
| 3 or more Vehicles | 4,499 (20.6%) | 531 (10.6%) |
| Total | 21,839 (100.0%) | 4,999 (100.0%) |
Real Estate & Mortgages in Port Charlotte
Real Estate and Mortgage Overview in Port Charlotte
| Characteristic | Without Mortgage | With Mortgage |
| Housing Units | 9,681 | 12,158 |
| Median Property Value | $232,300 | $228,000 |
| Median Household Income | $52,748 | $1,433 |
| Monthly Housing Costs | $517 | $242 |
| Real Estate Taxes | $1,927 | $232 |
Property Value by Mortgage Status in Port Charlotte
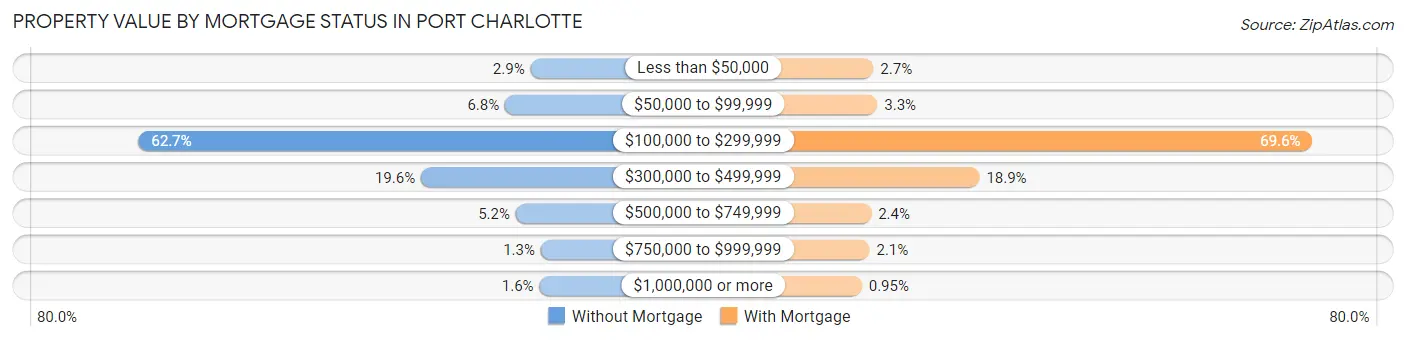
| Property Value | Without Mortgage | With Mortgage |
| Less than $50,000 | 282 (2.9%) | 331 (2.7%) |
| $50,000 to $99,999 | 657 (6.8%) | 404 (3.3%) |
| $100,000 to $299,999 | 6,066 (62.7%) | 8,463 (69.6%) |
| $300,000 to $499,999 | 1,897 (19.6%) | 2,295 (18.9%) |
| $500,000 to $749,999 | 499 (5.1%) | 291 (2.4%) |
| $750,000 to $999,999 | 130 (1.3%) | 259 (2.1%) |
| $1,000,000 or more | 150 (1.5%) | 115 (0.9%) |
| Total | 9,681 (100.0%) | 12,158 (100.0%) |
Household Income by Mortgage Status in Port Charlotte
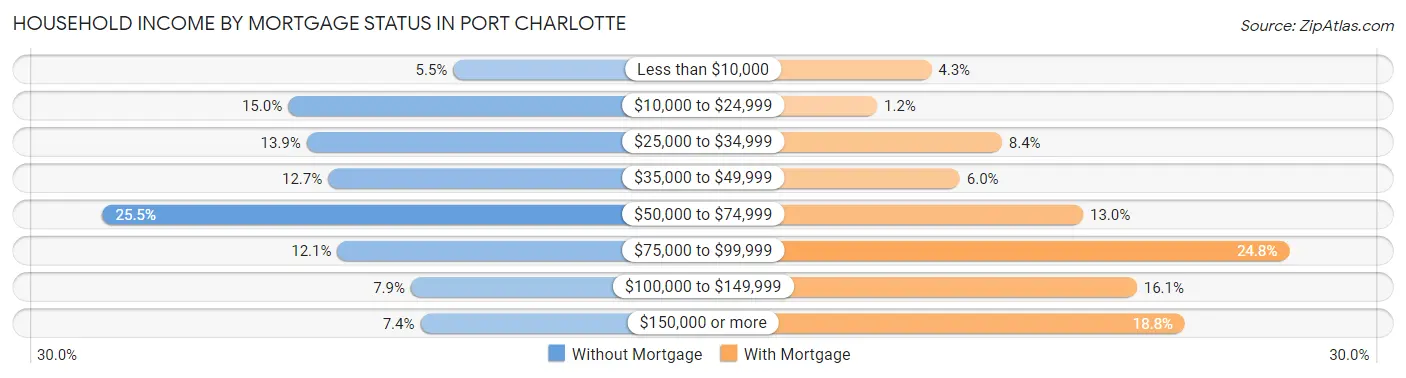
| Household Income | Without Mortgage | With Mortgage |
| Less than $10,000 | 533 (5.5%) | 527 (4.3%) |
| $10,000 to $24,999 | 1,447 (14.9%) | 149 (1.2%) |
| $25,000 to $34,999 | 1,345 (13.9%) | 1,016 (8.4%) |
| $35,000 to $49,999 | 1,226 (12.7%) | 725 (6.0%) |
| $50,000 to $74,999 | 2,473 (25.5%) | 1,580 (13.0%) |
| $75,000 to $99,999 | 1,174 (12.1%) | 3,013 (24.8%) |
| $100,000 to $149,999 | 768 (7.9%) | 1,954 (16.1%) |
| $150,000 or more | 715 (7.4%) | 2,288 (18.8%) |
| Total | 9,681 (100.0%) | 12,158 (100.0%) |
Property Value to Household Income Ratio in Port Charlotte
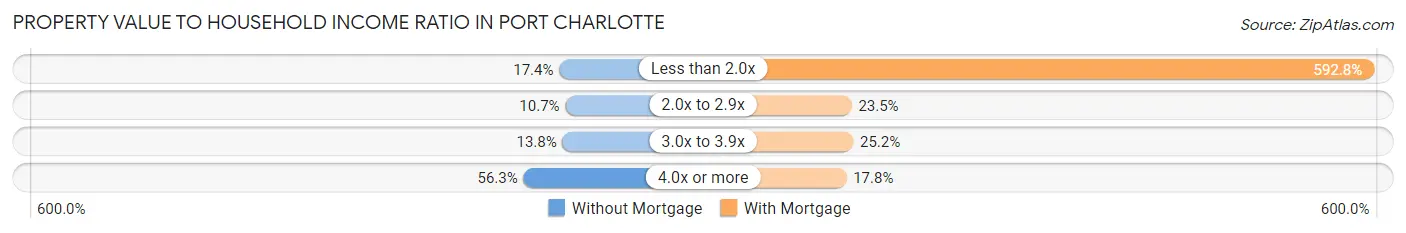
| Value-to-Income Ratio | Without Mortgage | With Mortgage |
| Less than 2.0x | 1,681 (17.4%) | 72,076 (592.8%) |
| 2.0x to 2.9x | 1,037 (10.7%) | 2,853 (23.5%) |
| 3.0x to 3.9x | 1,335 (13.8%) | 3,066 (25.2%) |
| 4.0x or more | 5,449 (56.3%) | 2,159 (17.8%) |
| Total | 9,681 (100.0%) | 12,158 (100.0%) |
Real Estate Taxes by Mortgage Status in Port Charlotte
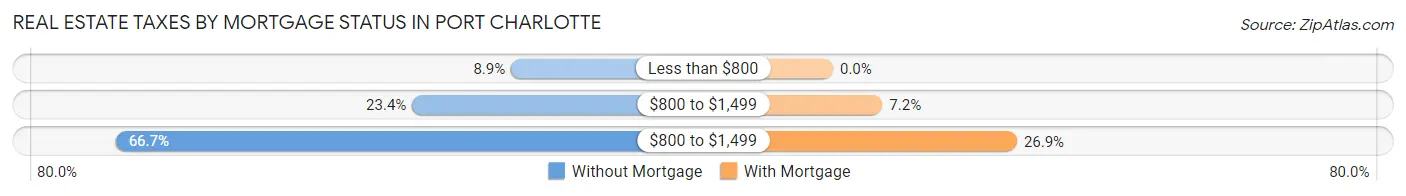
| Property Taxes | Without Mortgage | With Mortgage |
| Less than $800 | 864 (8.9%) | 0 (0.0%) |
| $800 to $1,499 | 2,262 (23.4%) | 877 (7.2%) |
| $800 to $1,499 | 6,455 (66.7%) | 3,267 (26.9%) |
| Total | 9,681 (100.0%) | 12,158 (100.0%) |
Health & Disability in Port Charlotte
Health Insurance Coverage by Age in Port Charlotte
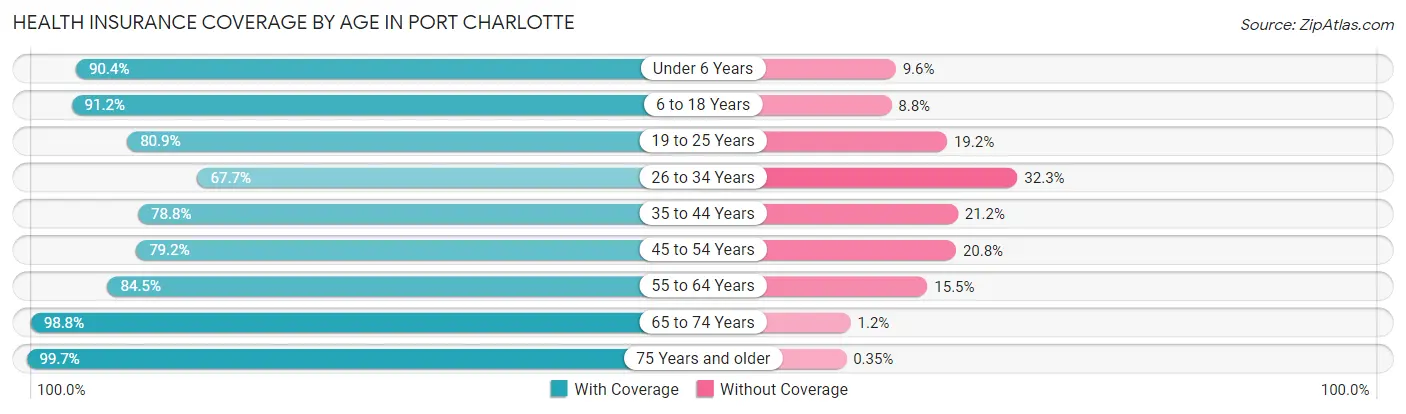
| Age Bracket | With Coverage | Without Coverage |
| Under 6 Years | 2,639 (90.4%) | 280 (9.6%) |
| 6 to 18 Years | 6,012 (91.2%) | 579 (8.8%) |
| 19 to 25 Years | 3,159 (80.8%) | 748 (19.2%) |
| 26 to 34 Years | 3,605 (67.7%) | 1,718 (32.3%) |
| 35 to 44 Years | 4,576 (78.8%) | 1,229 (21.2%) |
| 45 to 54 Years | 5,395 (79.2%) | 1,419 (20.8%) |
| 55 to 64 Years | 9,901 (84.5%) | 1,815 (15.5%) |
| 65 to 74 Years | 11,899 (98.8%) | 141 (1.2%) |
| 75 Years and older | 8,285 (99.7%) | 29 (0.4%) |
| Total | 55,471 (87.5%) | 7,958 (12.6%) |
Health Insurance Coverage by Citizenship Status in Port Charlotte

| Citizenship Status | With Coverage | Without Coverage |
| Native Born | 2,639 (90.4%) | 280 (9.6%) |
| Foreign Born, Citizen | 6,012 (91.2%) | 579 (8.8%) |
| Foreign Born, not a Citizen | 3,159 (80.8%) | 748 (19.2%) |
Health Insurance Coverage by Household Income in Port Charlotte
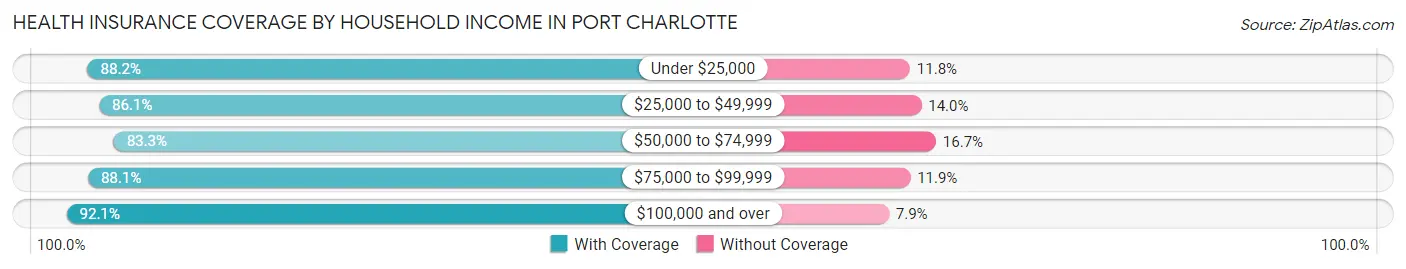
| Household Income | With Coverage | Without Coverage |
| Under $25,000 | 6,689 (88.2%) | 897 (11.8%) |
| $25,000 to $49,999 | 11,902 (86.1%) | 1,929 (14.0%) |
| $50,000 to $74,999 | 13,471 (83.3%) | 2,701 (16.7%) |
| $75,000 to $99,999 | 7,714 (88.1%) | 1,040 (11.9%) |
| $100,000 and over | 15,496 (92.1%) | 1,325 (7.9%) |
Public vs Private Health Insurance Coverage by Age in Port Charlotte
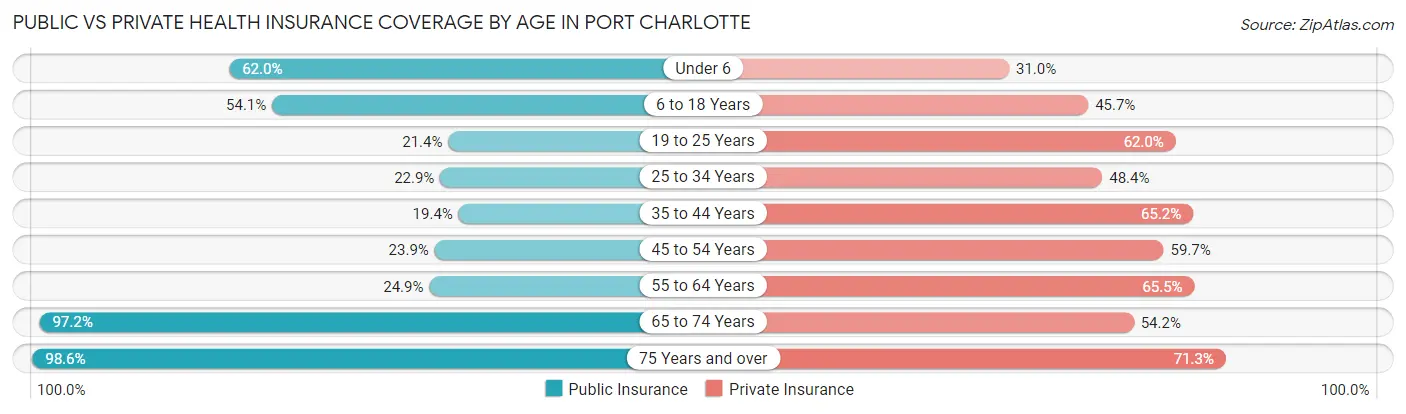
| Age Bracket | Public Insurance | Private Insurance |
| Under 6 | 1,810 (62.0%) | 906 (31.0%) |
| 6 to 18 Years | 3,563 (54.1%) | 3,015 (45.7%) |
| 19 to 25 Years | 834 (21.3%) | 2,421 (62.0%) |
| 25 to 34 Years | 1,217 (22.9%) | 2,574 (48.4%) |
| 35 to 44 Years | 1,128 (19.4%) | 3,785 (65.2%) |
| 45 to 54 Years | 1,628 (23.9%) | 4,069 (59.7%) |
| 55 to 64 Years | 2,916 (24.9%) | 7,668 (65.4%) |
| 65 to 74 Years | 11,706 (97.2%) | 6,525 (54.2%) |
| 75 Years and over | 8,195 (98.6%) | 5,925 (71.3%) |
| Total | 32,997 (52.0%) | 36,888 (58.2%) |
Disability Status by Sex by Age in Port Charlotte
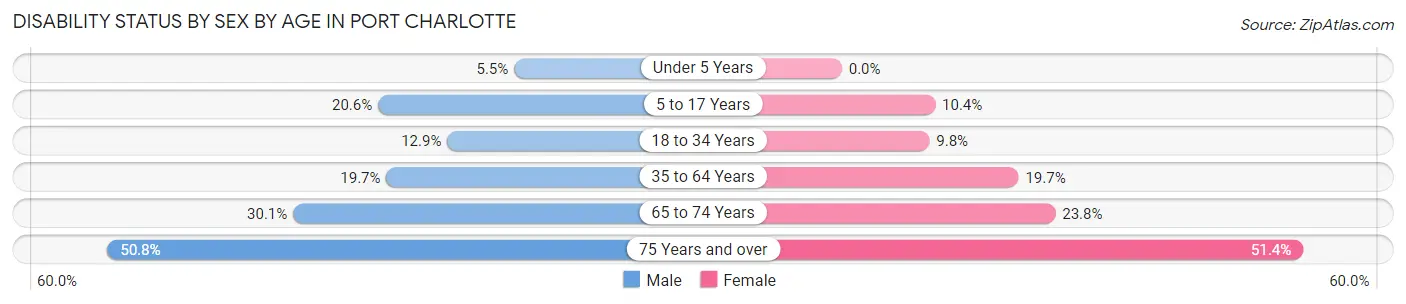
| Age Bracket | Male | Female |
| Under 5 Years | 61 (5.5%) | 0 (0.0%) |
| 5 to 17 Years | 659 (20.6%) | 324 (10.4%) |
| 18 to 34 Years | 703 (12.9%) | 432 (9.8%) |
| 35 to 64 Years | 2,292 (19.7%) | 2,500 (19.7%) |
| 65 to 74 Years | 1,714 (30.1%) | 1,509 (23.8%) |
| 75 Years and over | 1,932 (50.8%) | 2,317 (51.4%) |
Disability Class by Sex by Age in Port Charlotte
Disability Class: Hearing Difficulty
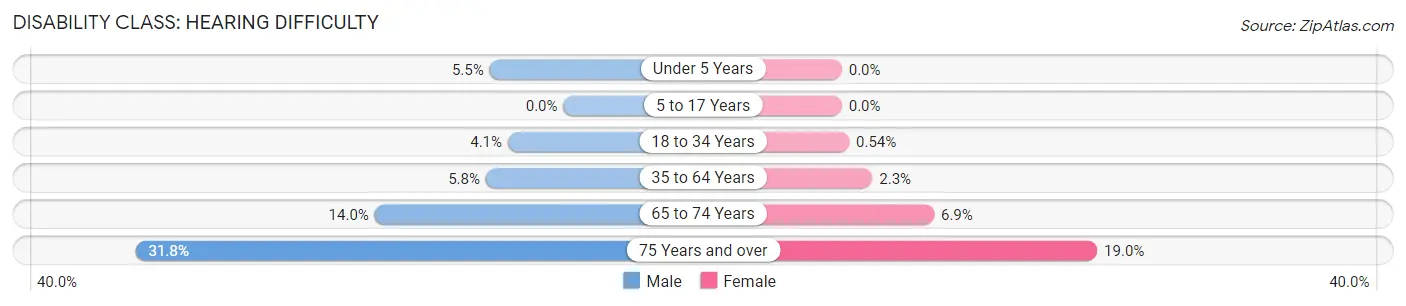
| Age Bracket | Male | Female |
| Under 5 Years | 61 (5.5%) | 0 (0.0%) |
| 5 to 17 Years | 0 (0.0%) | 0 (0.0%) |
| 18 to 34 Years | 224 (4.1%) | 24 (0.5%) |
| 35 to 64 Years | 670 (5.8%) | 288 (2.3%) |
| 65 to 74 Years | 798 (14.0%) | 435 (6.9%) |
| 75 Years and over | 1,208 (31.8%) | 855 (19.0%) |
Disability Class: Vision Difficulty
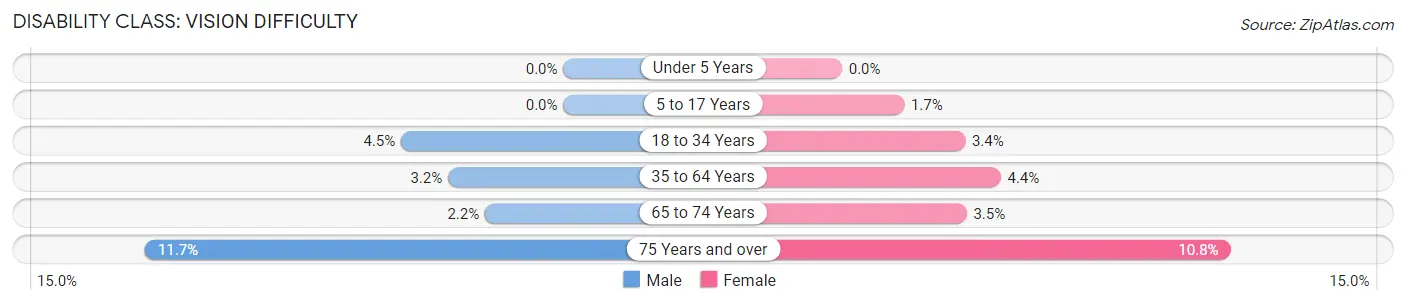
| Age Bracket | Male | Female |
| Under 5 Years | 0 (0.0%) | 0 (0.0%) |
| 5 to 17 Years | 0 (0.0%) | 54 (1.7%) |
| 18 to 34 Years | 246 (4.5%) | 152 (3.4%) |
| 35 to 64 Years | 373 (3.2%) | 562 (4.4%) |
| 65 to 74 Years | 124 (2.2%) | 220 (3.5%) |
| 75 Years and over | 443 (11.7%) | 488 (10.8%) |
Disability Class: Cognitive Difficulty
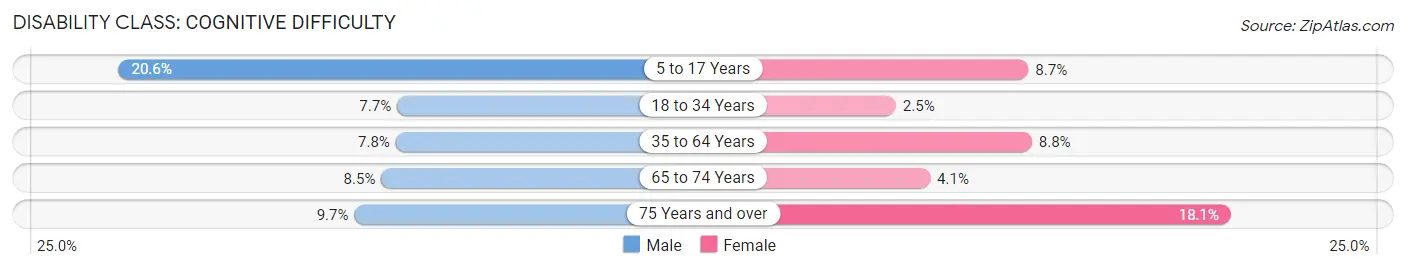
| Age Bracket | Male | Female |
| 5 to 17 Years | 659 (20.6%) | 270 (8.7%) |
| 18 to 34 Years | 420 (7.7%) | 111 (2.5%) |
| 35 to 64 Years | 905 (7.8%) | 1,121 (8.8%) |
| 65 to 74 Years | 481 (8.5%) | 260 (4.1%) |
| 75 Years and over | 369 (9.7%) | 814 (18.0%) |
Disability Class: Ambulatory Difficulty
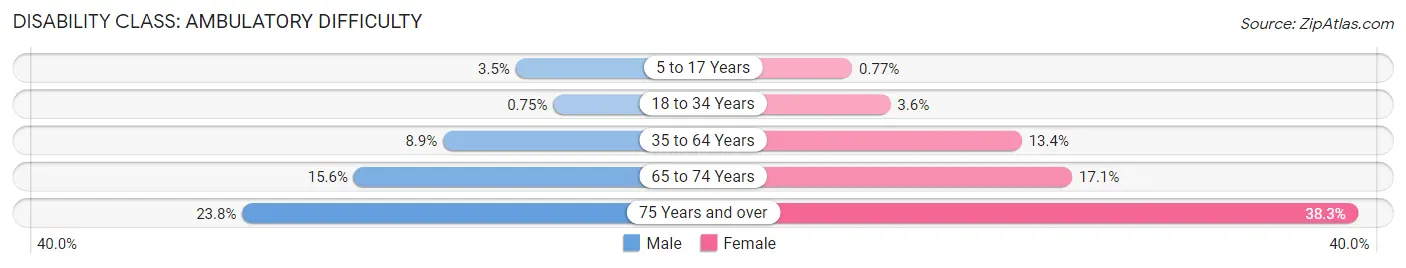
| Age Bracket | Male | Female |
| 5 to 17 Years | 113 (3.5%) | 24 (0.8%) |
| 18 to 34 Years | 41 (0.7%) | 160 (3.6%) |
| 35 to 64 Years | 1,039 (8.9%) | 1,697 (13.4%) |
| 65 to 74 Years | 886 (15.6%) | 1,085 (17.1%) |
| 75 Years and over | 907 (23.8%) | 1,727 (38.3%) |
Disability Class: Self-Care Difficulty
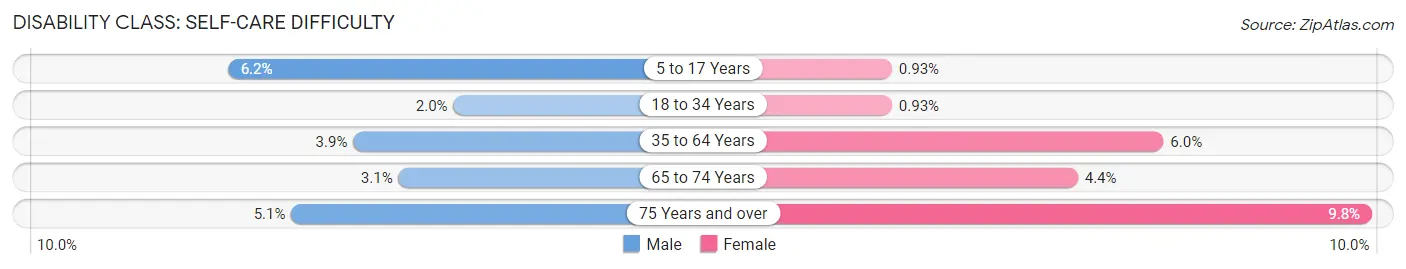
| Age Bracket | Male | Female |
| 5 to 17 Years | 199 (6.2%) | 29 (0.9%) |
| 18 to 34 Years | 111 (2.0%) | 41 (0.9%) |
| 35 to 64 Years | 453 (3.9%) | 758 (6.0%) |
| 65 to 74 Years | 174 (3.1%) | 278 (4.4%) |
| 75 Years and over | 192 (5.1%) | 444 (9.8%) |
Technology Access in Port Charlotte
Computing Device Access in Port Charlotte
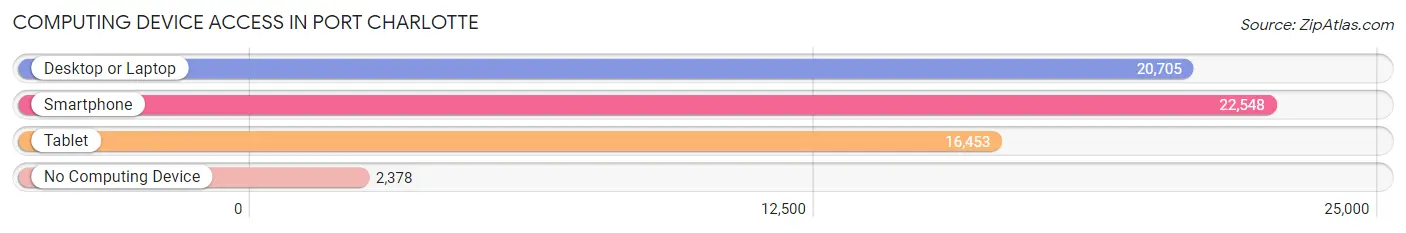
| Device Type | # Households | % Households |
| Desktop or Laptop | 20,705 | 77.1% |
| Smartphone | 22,548 | 84.0% |
| Tablet | 16,453 | 61.3% |
| No Computing Device | 2,378 | 8.9% |
| Total | 26,838 | 100.0% |
Internet Access in Port Charlotte
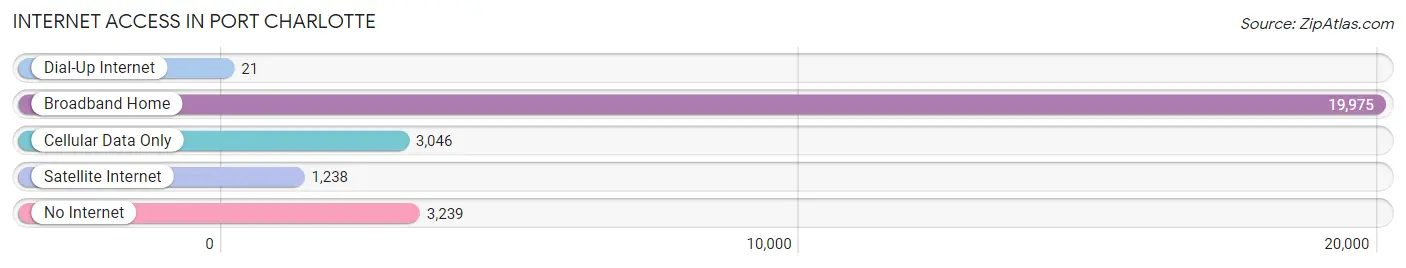
| Internet Type | # Households | % Households |
| Dial-Up Internet | 21 | 0.1% |
| Broadband Home | 19,975 | 74.4% |
| Cellular Data Only | 3,046 | 11.4% |
| Satellite Internet | 1,238 | 4.6% |
| No Internet | 3,239 | 12.1% |
| Total | 26,838 | 100.0% |
Port Charlotte Summary
Charlotte County, Florida is located on the Gulf Coast of Florida, just south of Sarasota and north of Fort Myers. It is part of the Tampa Bay metropolitan area and is home to the cities of Port Charlotte, Punta Gorda, and Englewood. The county has a population of approximately 160,000 people and covers an area of 858 square miles.
History
The area that is now Charlotte County was originally inhabited by the Calusa Indians. The first European settlers arrived in the area in the late 1700s and early 1800s. The first permanent settlement was established in 1821 when the U.S. government purchased the land from the Calusa Indians. The county was officially established in 1921 and was named after Charlotte Harbor, which was named after the wife of the first governor of Florida, William Pope Duval.
The area was largely rural until the 1950s when the population began to grow rapidly due to the development of the Port Charlotte area. The city of Port Charlotte was incorporated in 1959 and the population continued to grow throughout the 1960s and 1970s. The county experienced a population boom in the 1980s and 1990s due to the influx of retirees and other people looking for a more relaxed lifestyle.
Geography
Charlotte County is located on the Gulf Coast of Florida, just south of Sarasota and north of Fort Myers. It is part of the Tampa Bay metropolitan area and is bordered by Lee County to the north, DeSoto County to the east, and Sarasota County to the south. The county is divided into two distinct regions: the mainland and the barrier islands. The mainland is largely rural and is home to the cities of Port Charlotte, Punta Gorda, and Englewood. The barrier islands are located off the coast and are home to several popular beach communities, including Boca Grande, Manasota Key, and Gasparilla Island.
The county is home to several rivers, including the Peace River, Myakka River, and Charlotte Harbor. The county also contains several lakes, including Lake Tippecanoe, Lake Suzy, and Lake June. The county is also home to several state parks, including Myakka River State Park, Charlotte Harbor State Park, and Gasparilla Island State Park.
Economy
Charlotte County has a diverse economy that is largely driven by tourism, agriculture, and manufacturing. The county is home to several large employers, including Charlotte County Public Schools, Charlotte County Government, and Peace River Electric Cooperative. The county is also home to several major manufacturing companies, including Tropicana Products, Inc., and Charlotte Pipe and Foundry.
The county is also home to several popular tourist attractions, including the Charlotte Harbor Aquatic Preserve, the Charlotte County Historical Center, and the Charlotte County Speedway. The county is also home to several popular golf courses, including the Kingsway Country Club and the Charlotte Harbor National Golf Club.
Demographics
As of the 2010 census, Charlotte County had a population of 159,978. The population was spread out with 24.3% under the age of 18, 8.2% from 18 to 24, 28.2% from 25 to 44, 24.3% from 45 to 64, and 14.0% who were 65 years of age or older. The median age was 39.2 years.
The racial makeup of the county was 87.2% White, 8.2% African American, 0.4% Native American, 1.3% Asian, 0.1% Pacific Islander, 1.7% from other races, and 1.1% from two or more races. Hispanic or Latino of any race were 8.2% of the population.
The median income for a household in the county was $45,890 and the median income for a family was $54,817. The per capita income for the county was $25,945. About 11.2% of families and 14.7% of the population were below the poverty line, including 21.2% of those under age 18 and 6.7% of those age 65 or over.
Common Questions
What is Per Capita Income in Port Charlotte?
Per Capita income in Port Charlotte is $32,626.
What is the Median Family Income in Port Charlotte?
Median Family Income in Port Charlotte is $67,305.
What is the Median Household income in Port Charlotte?
Median Household Income in Port Charlotte is $58,799.
What is Income or Wage Gap in Port Charlotte?
Income or Wage Gap in Port Charlotte is 14.8%.
Women in Port Charlotte earn 85.2 cents for every dollar earned by a man.
What is Family Income Deficit in Port Charlotte?
Family Income Deficit in Port Charlotte is $12,005.
Families that are below poverty line in Port Charlotte earn $12,005 less on average than the poverty threshold level.
What is Inequality or Gini Index in Port Charlotte?
Inequality or Gini Index in Port Charlotte is 0.43.
What is the Total Population of Port Charlotte?
Total Population of Port Charlotte is 63,913.
What is the Total Male Population of Port Charlotte?
Total Male Population of Port Charlotte is 31,111.
What is the Total Female Population of Port Charlotte?
Total Female Population of Port Charlotte is 32,802.
What is the Ratio of Males per 100 Females in Port Charlotte?
There are 94.84 Males per 100 Females in Port Charlotte.
What is the Ratio of Females per 100 Males in Port Charlotte?
There are 105.44 Females per 100 Males in Port Charlotte.
What is the Median Population Age in Port Charlotte?
Median Population Age in Port Charlotte is 55.6 Years.
What is the Average Family Size in Port Charlotte
Average Family Size in Port Charlotte is 2.9 People.
What is the Average Household Size in Port Charlotte
Average Household Size in Port Charlotte is 2.4 People.
How Large is the Labor Force in Port Charlotte?
There are 27,087 People in the Labor Forcein in Port Charlotte.
What is the Percentage of People in the Labor Force in Port Charlotte?
48.3% of People are in the Labor Force in Port Charlotte.
What is the Unemployment Rate in Port Charlotte?
Unemployment Rate in Port Charlotte is 7.0%.