Ponce De Leon, FL Map & Demographics
Ponce De Leon Map
Ponce De Leon Overview
$23,302
PER CAPITA INCOME
$66,875
AVG FAMILY INCOME
$53,438
AVG HOUSEHOLD INCOME
0.41
INEQUALITY / GINI INDEX
775
TOTAL POPULATION
420
MALE POPULATION
355
FEMALE POPULATION
118.31
MALES / 100 FEMALES
84.52
FEMALES / 100 MALES
27.9
MEDIAN AGE
4.3
AVG FAMILY SIZE
3.6
AVG HOUSEHOLD SIZE
399
LABOR FORCE [ PEOPLE ]
63.4%
PERCENT IN LABOR FORCE
15.0%
UNEMPLOYMENT RATE
Ponce De Leon Zip Codes
Ponce De Leon Area Codes
Income in Ponce De Leon
Income Overview in Ponce De Leon
Per Capita Income in Ponce De Leon is $23,302, while median incomes of families and households are $66,875 and $53,438 respectively.
| Characteristic | Number | Measure |
| Per Capita Income | 775 | $23,302 |
| Median Family Income | 163 | $66,875 |
| Mean Family Income | 163 | $77,181 |
| Median Household Income | 217 | $53,438 |
| Mean Household Income | 217 | $67,652 |
| Income Deficit | 163 | $0 |
| Wage / Income Gap (%) | 775 | 0.00% |
| Wage / Income Gap ($) | 775 | 100.00¢ per $1 |
| Gini / Inequality Index | 775 | 0.41 |
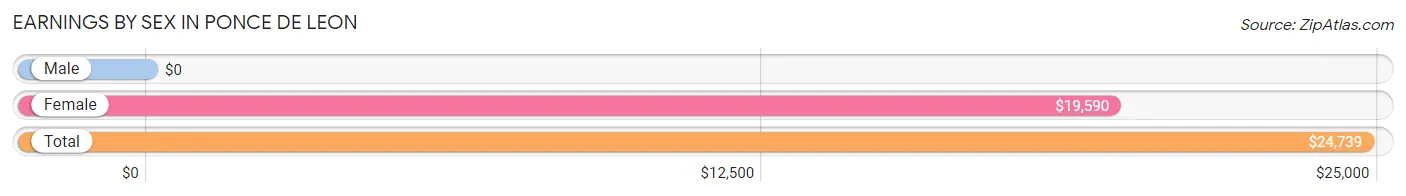
Earnings by Sex in Ponce De Leon
| Sex | Number | Average Earnings |
| Male | 229 (56.5%) | $0 |
| Female | 176 (43.5%) | $19,590 |
| Total | 405 (100.0%) | $24,739 |
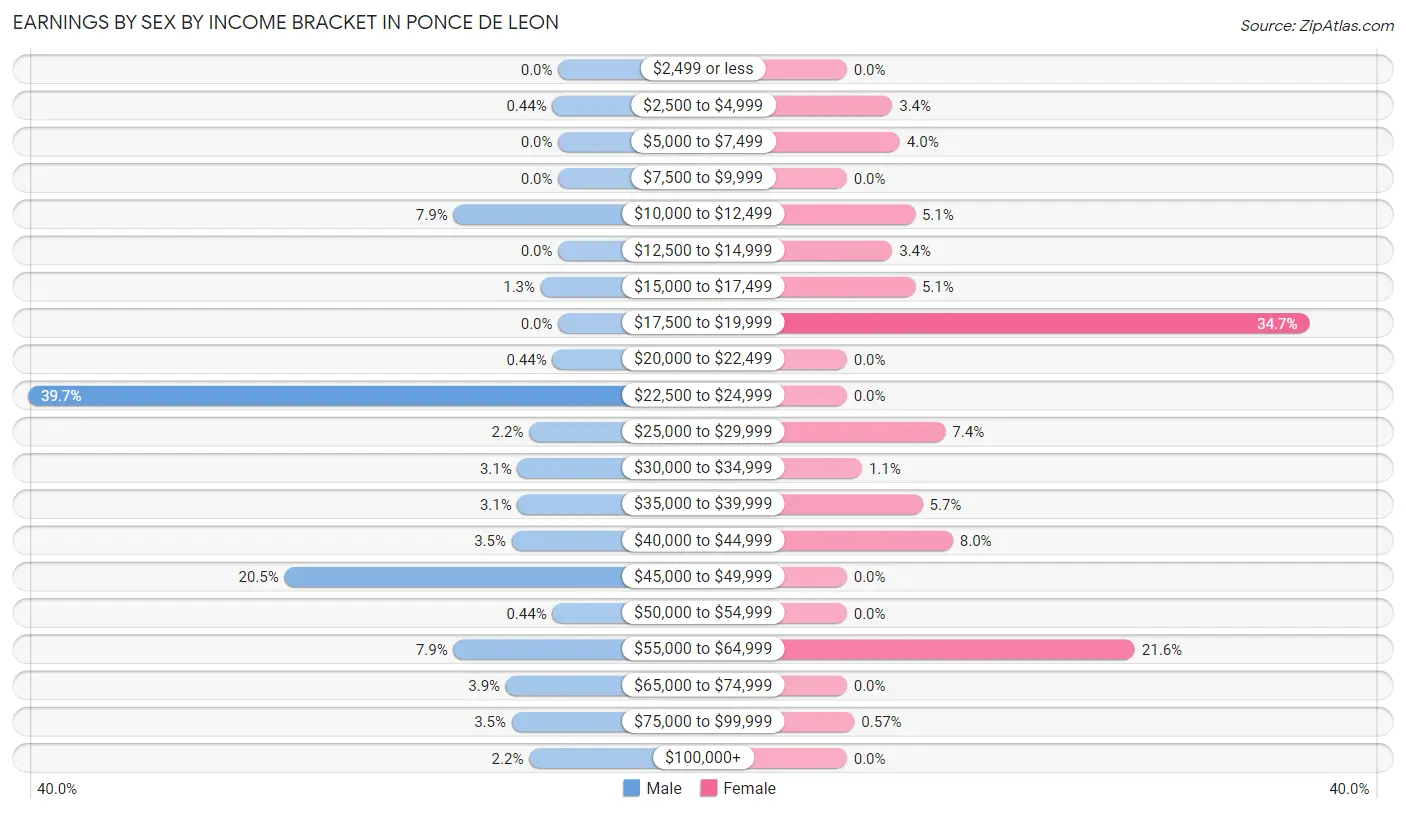
Earnings by Sex by Income Bracket in Ponce De Leon
The most common earnings brackets in Ponce De Leon are $22,500 to $24,999 for men (91 | 39.7%) and $17,500 to $19,999 for women (61 | 34.7%).
| Income | Male | Female |
| $2,499 or less | 0 (0.0%) | 0 (0.0%) |
| $2,500 to $4,999 | 1 (0.4%) | 6 (3.4%) |
| $5,000 to $7,499 | 0 (0.0%) | 7 (4.0%) |
| $7,500 to $9,999 | 0 (0.0%) | 0 (0.0%) |
| $10,000 to $12,499 | 18 (7.9%) | 9 (5.1%) |
| $12,500 to $14,999 | 0 (0.0%) | 6 (3.4%) |
| $15,000 to $17,499 | 3 (1.3%) | 9 (5.1%) |
| $17,500 to $19,999 | 0 (0.0%) | 61 (34.7%) |
| $20,000 to $22,499 | 1 (0.4%) | 0 (0.0%) |
| $22,500 to $24,999 | 91 (39.7%) | 0 (0.0%) |
| $25,000 to $29,999 | 5 (2.2%) | 13 (7.4%) |
| $30,000 to $34,999 | 7 (3.1%) | 2 (1.1%) |
| $35,000 to $39,999 | 7 (3.1%) | 10 (5.7%) |
| $40,000 to $44,999 | 8 (3.5%) | 14 (8.0%) |
| $45,000 to $49,999 | 47 (20.5%) | 0 (0.0%) |
| $50,000 to $54,999 | 1 (0.4%) | 0 (0.0%) |
| $55,000 to $64,999 | 18 (7.9%) | 38 (21.6%) |
| $65,000 to $74,999 | 9 (3.9%) | 0 (0.0%) |
| $75,000 to $99,999 | 8 (3.5%) | 1 (0.6%) |
| $100,000+ | 5 (2.2%) | 0 (0.0%) |
| Total | 229 (100.0%) | 176 (100.0%) |
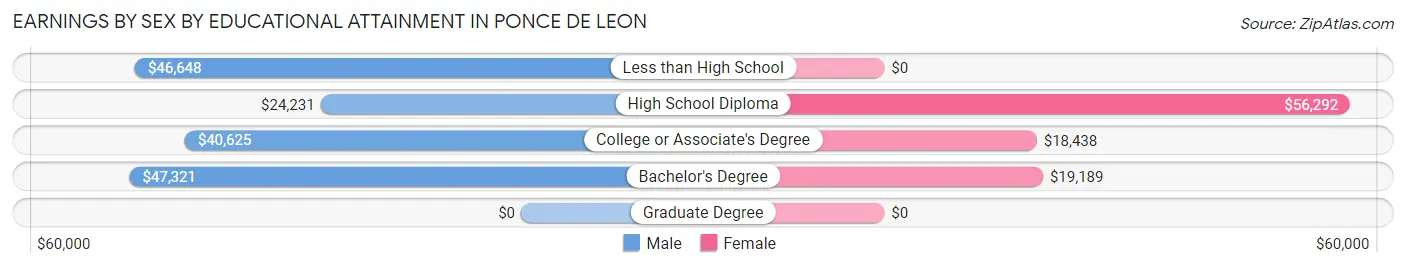
Earnings by Sex by Educational Attainment in Ponce De Leon
Average earnings in Ponce De Leon are $33,571 for men and $27,596 for women, a difference of 17.8%. Men with an educational attainment of bachelor's degree enjoy the highest average annual earnings of $47,321, while those with high school diploma education earn the least with $24,231. Women with an educational attainment of high school diploma earn the most with the average annual earnings of $56,292, while those with college or associate's degree education have the smallest earnings of $18,438.
| Educational Attainment | Male Income | Female Income |
| Less than High School | $46,648 | $0 |
| High School Diploma | $24,231 | $56,292 |
| College or Associate's Degree | $40,625 | $18,438 |
| Bachelor's Degree | $47,321 | $19,189 |
| Graduate Degree | - | - |
| Total | $33,571 | $27,596 |
Family Income in Ponce De Leon
Family Income Brackets in Ponce De Leon
According to the Ponce De Leon family income data, there are 43 families falling into the $75,000 to $99,999 income range, which is the most common income bracket and makes up 26.4% of all families.
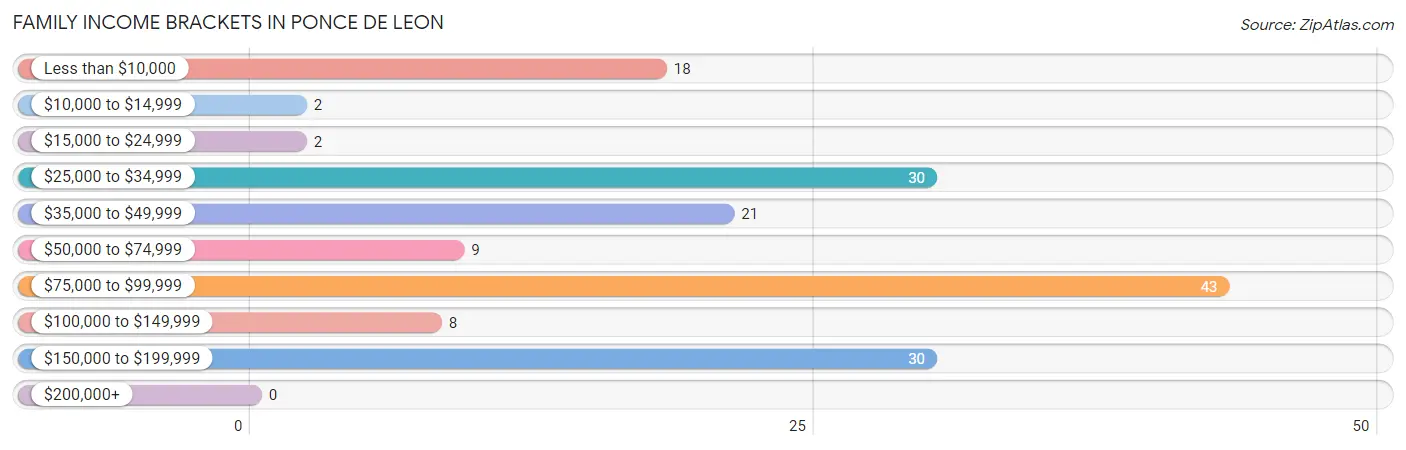
| Income Bracket | # Families | % Families |
| Less than $10,000 | 18 | 11.0% |
| $10,000 to $14,999 | 2 | 1.2% |
| $15,000 to $24,999 | 2 | 1.2% |
| $25,000 to $34,999 | 30 | 18.4% |
| $35,000 to $49,999 | 21 | 12.9% |
| $50,000 to $74,999 | 9 | 5.5% |
| $75,000 to $99,999 | 43 | 26.4% |
| $100,000 to $149,999 | 8 | 4.9% |
| $150,000 to $199,999 | 30 | 18.4% |
| $200,000+ | 0 | 0.0% |
Family Income by Famaliy Size in Ponce De Leon
4-person families (34 | 20.9%) account for the highest median family income in Ponce De Leon with $85,833 per family, while 4-person families (34 | 20.9%) have the highest median income of $21,458 per family member.
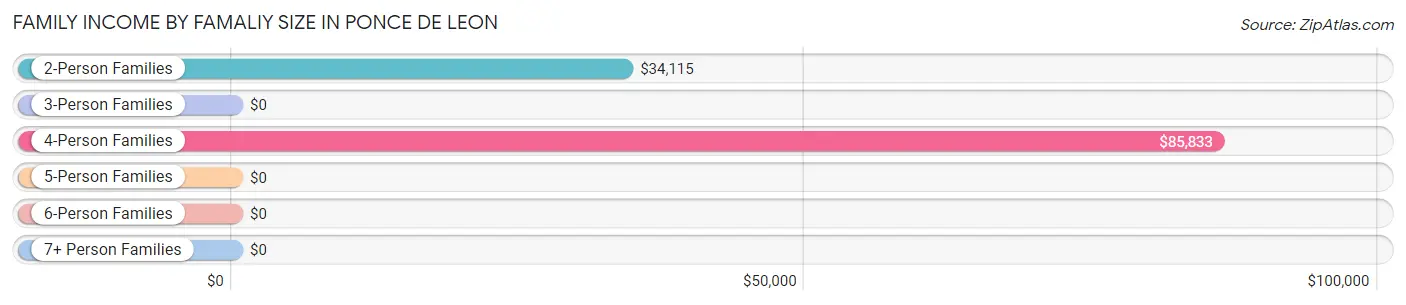
| Income Bracket | # Families | Median Income |
| 2-Person Families | 47 (28.8%) | $34,115 |
| 3-Person Families | 57 (35.0%) | $0 |
| 4-Person Families | 34 (20.9%) | $85,833 |
| 5-Person Families | 12 (7.4%) | $0 |
| 6-Person Families | 7 (4.3%) | $0 |
| 7+ Person Families | 6 (3.7%) | $0 |
| Total | 163 (100.0%) | $66,875 |
Family Income by Number of Earners in Ponce De Leon
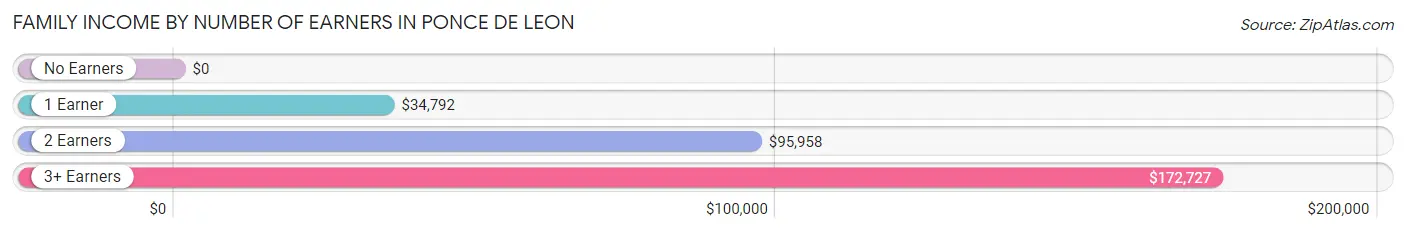
| Number of Earners | # Families | Median Income |
| No Earners | 23 (14.1%) | $0 |
| 1 Earner | 57 (35.0%) | $34,792 |
| 2 Earners | 63 (38.7%) | $95,958 |
| 3+ Earners | 20 (12.3%) | $172,727 |
| Total | 163 (100.0%) | $66,875 |
Household Income in Ponce De Leon
Household Income Brackets in Ponce De Leon
With 48 households falling in the category, the $75,000 to $99,999 income range is the most frequent in Ponce De Leon, accounting for 22.1% of all households.
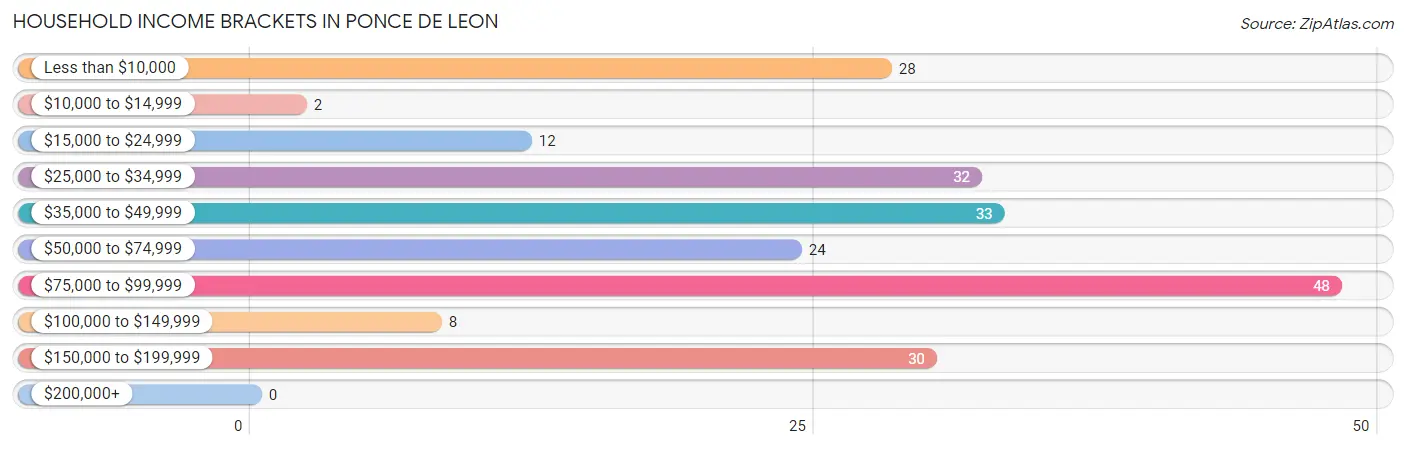
| Income Bracket | # Households | % Households |
| Less than $10,000 | 28 | 12.9% |
| $10,000 to $14,999 | 2 | 0.9% |
| $15,000 to $24,999 | 12 | 5.5% |
| $25,000 to $34,999 | 32 | 14.7% |
| $35,000 to $49,999 | 33 | 15.2% |
| $50,000 to $74,999 | 24 | 11.1% |
| $75,000 to $99,999 | 48 | 22.1% |
| $100,000 to $149,999 | 8 | 3.7% |
| $150,000 to $199,999 | 30 | 13.8% |
| $200,000+ | 0 | 0.0% |
Household Income by Householder Age in Ponce De Leon
The median household income in Ponce De Leon is $53,438, with the highest median household income of $57,500 found in the 25 to 44 years age bracket for the primary householder. A total of 68 households (31.3%) fall into this category. Meanwhile, the 15 to 24 years age bracket for the primary householder has the lowest median household income of $0, with 8 households (3.7%) in this group.
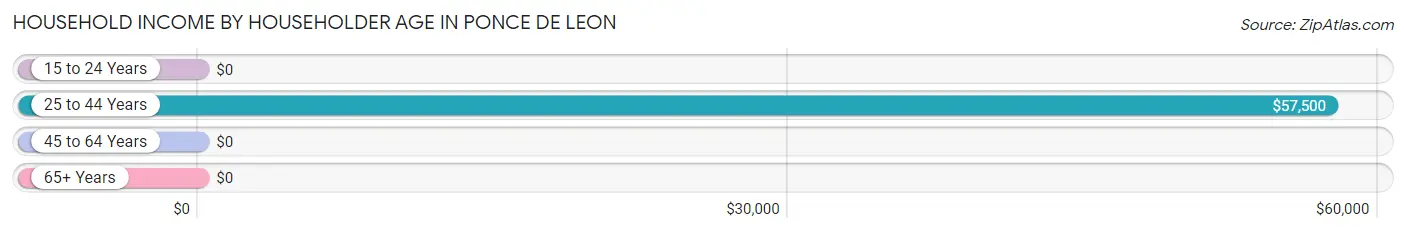
| Income Bracket | # Households | Median Income |
| 15 to 24 Years | 8 (3.7%) | $0 |
| 25 to 44 Years | 68 (31.3%) | $57,500 |
| 45 to 64 Years | 72 (33.2%) | $0 |
| 65+ Years | 69 (31.8%) | $0 |
| Total | 217 (100.0%) | $53,438 |
Poverty in Ponce De Leon
Income Below Poverty by Sex and Age in Ponce De Leon
With 12.1% poverty level for males and 16.3% for females among the residents of Ponce De Leon, 15 year old males and 16 and 17 year old females are the most vulnerable to poverty, with 14 males (93.3%) and 5 females (71.4%) in their respective age groups living below the poverty level.
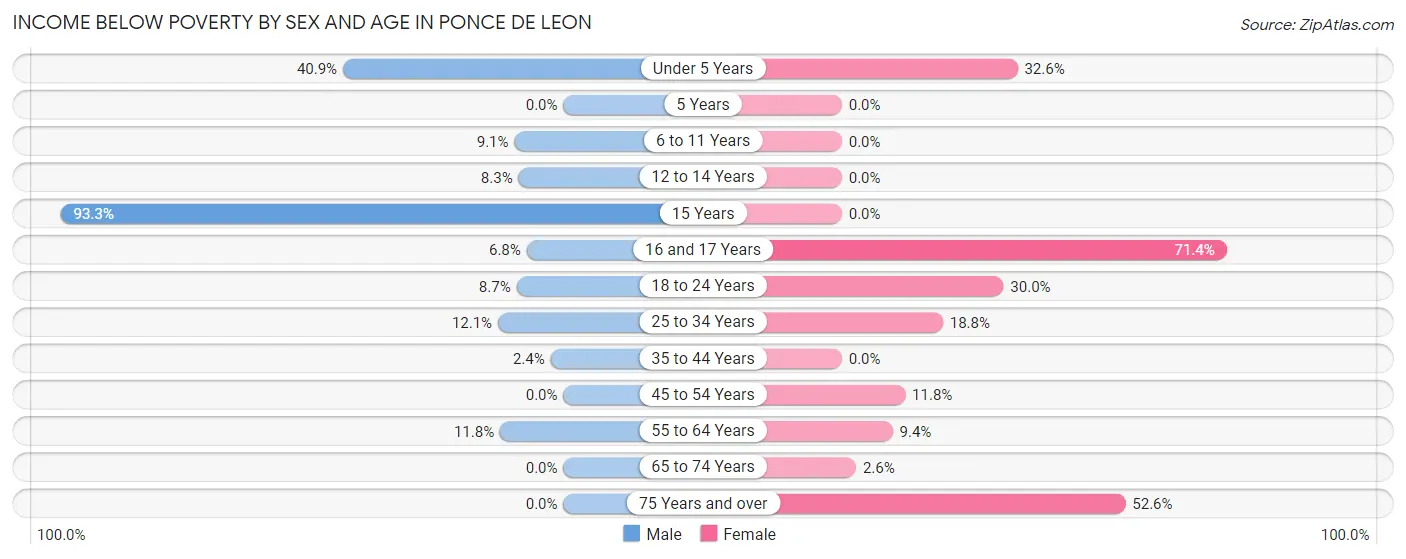
| Age Bracket | Male | Female |
| Under 5 Years | 9 (40.9%) | 15 (32.6%) |
| 5 Years | 0 (0.0%) | 0 (0.0%) |
| 6 to 11 Years | 2 (9.1%) | 0 (0.0%) |
| 12 to 14 Years | 1 (8.3%) | 0 (0.0%) |
| 15 Years | 14 (93.3%) | 0 (0.0%) |
| 16 and 17 Years | 3 (6.8%) | 5 (71.4%) |
| 18 to 24 Years | 2 (8.7%) | 9 (30.0%) |
| 25 to 34 Years | 17 (12.1%) | 3 (18.8%) |
| 35 to 44 Years | 1 (2.4%) | 0 (0.0%) |
| 45 to 54 Years | 0 (0.0%) | 10 (11.8%) |
| 55 to 64 Years | 2 (11.8%) | 5 (9.4%) |
| 65 to 74 Years | 0 (0.0%) | 1 (2.6%) |
| 75 Years and over | 0 (0.0%) | 10 (52.6%) |
| Total | 51 (12.1%) | 58 (16.3%) |
Income Above Poverty by Sex and Age in Ponce De Leon
According to the poverty statistics in Ponce De Leon, males aged 5 years and females aged 6 to 11 years are the age groups that are most secure financially, with 100.0% of males and 100.0% of females in these age groups living above the poverty line.
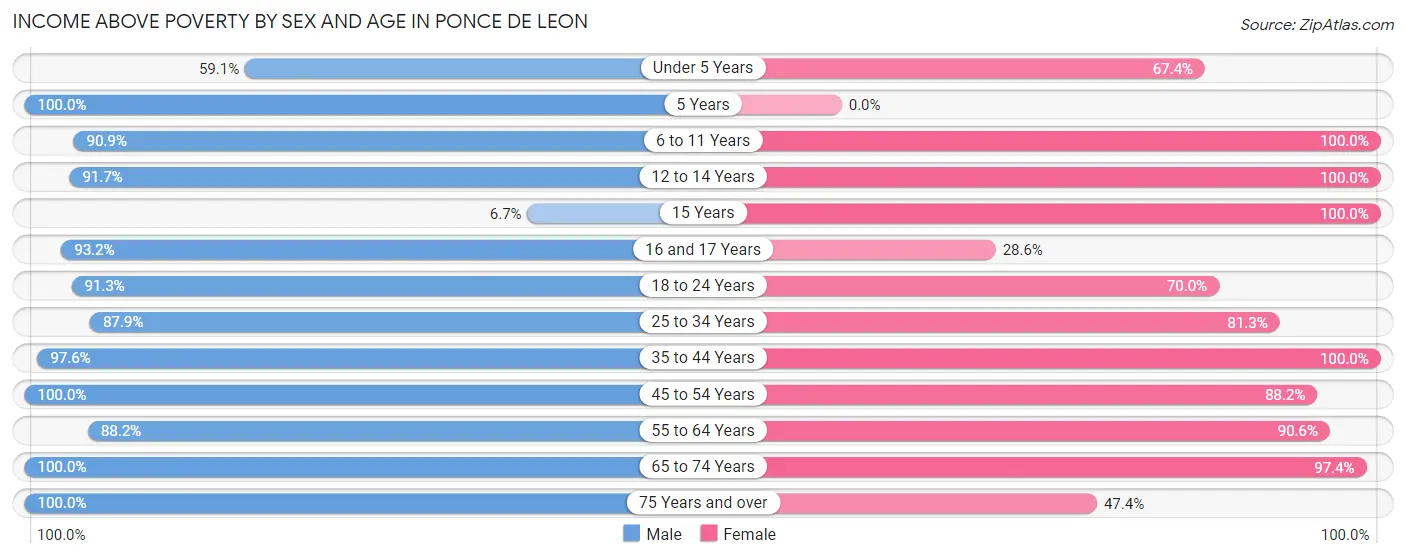
| Age Bracket | Male | Female |
| Under 5 Years | 13 (59.1%) | 31 (67.4%) |
| 5 Years | 8 (100.0%) | 0 (0.0%) |
| 6 to 11 Years | 20 (90.9%) | 15 (100.0%) |
| 12 to 14 Years | 11 (91.7%) | 3 (100.0%) |
| 15 Years | 1 (6.7%) | 3 (100.0%) |
| 16 and 17 Years | 41 (93.2%) | 2 (28.6%) |
| 18 to 24 Years | 21 (91.3%) | 21 (70.0%) |
| 25 to 34 Years | 123 (87.9%) | 13 (81.2%) |
| 35 to 44 Years | 41 (97.6%) | 40 (100.0%) |
| 45 to 54 Years | 56 (100.0%) | 75 (88.2%) |
| 55 to 64 Years | 15 (88.2%) | 48 (90.6%) |
| 65 to 74 Years | 17 (100.0%) | 37 (97.4%) |
| 75 Years and over | 2 (100.0%) | 9 (47.4%) |
| Total | 369 (87.9%) | 297 (83.7%) |
Income Below Poverty Among Married-Couple Families in Ponce De Leon
The poverty statistics for married-couple families in Ponce De Leon show that 1.2% or 1 of the total 86 families live below the poverty line. Families with 1 or 2 children have the highest poverty rate of 2.2%, comprising of 1 families. On the other hand, families with no children have the lowest poverty rate of 0.0%, which includes 0 families.
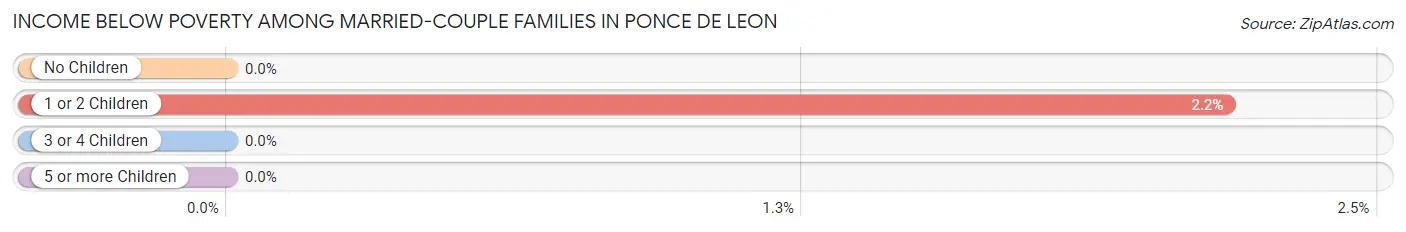
| Children | Above Poverty | Below Poverty |
| No Children | 23 (100.0%) | 0 (0.0%) |
| 1 or 2 Children | 45 (97.8%) | 1 (2.2%) |
| 3 or 4 Children | 17 (100.0%) | 0 (0.0%) |
| 5 or more Children | 0 (0.0%) | 0 (0.0%) |
| Total | 85 (98.8%) | 1 (1.2%) |
Income Below Poverty Among Single-Parent Households in Ponce De Leon
According to the poverty data in Ponce De Leon, 50.0% or 2 single-father households and 26.0% or 19 single-mother households are living below the poverty line. Among single-father households, those with no children have the highest poverty rate, with 2 households (100.0%) experiencing poverty. Likewise, among single-mother households, those with 1 or 2 children have the highest poverty rate, with 14 households (30.4%) falling below the poverty line.
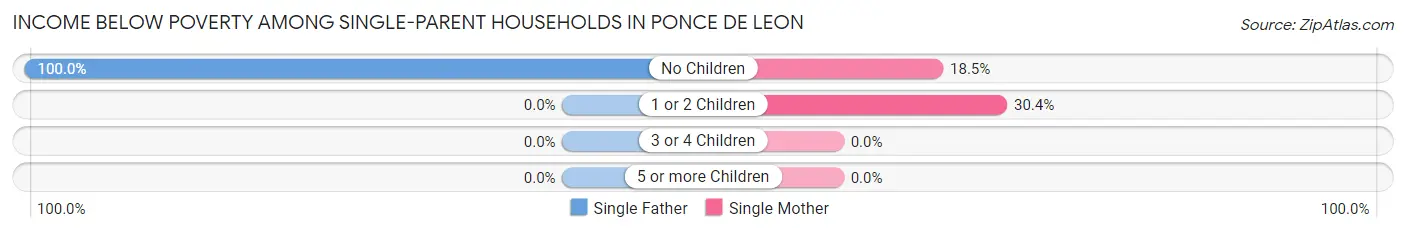
| Children | Single Father | Single Mother |
| No Children | 2 (100.0%) | 5 (18.5%) |
| 1 or 2 Children | 0 (0.0%) | 14 (30.4%) |
| 3 or 4 Children | 0 (0.0%) | 0 (0.0%) |
| 5 or more Children | 0 (0.0%) | 0 (0.0%) |
| Total | 2 (50.0%) | 19 (26.0%) |
Income Below Poverty Among Married-Couple vs Single-Parent Households in Ponce De Leon
The poverty data for Ponce De Leon shows that 1 of the married-couple family households (1.2%) and 21 of the single-parent households (27.3%) are living below the poverty level. Within the married-couple family households, those with 1 or 2 children have the highest poverty rate, with 1 households (2.2%) falling below the poverty line. Among the single-parent households, those with 1 or 2 children have the highest poverty rate, with 14 household (30.4%) living below poverty.
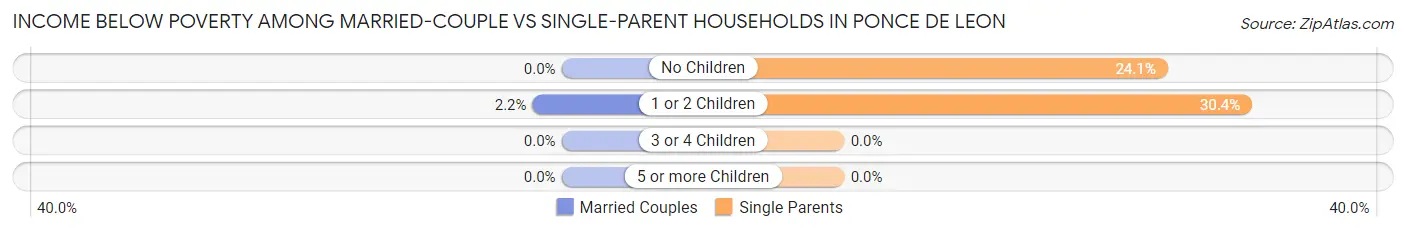
| Children | Married-Couple Families | Single-Parent Households |
| No Children | 0 (0.0%) | 7 (24.1%) |
| 1 or 2 Children | 1 (2.2%) | 14 (30.4%) |
| 3 or 4 Children | 0 (0.0%) | 0 (0.0%) |
| 5 or more Children | 0 (0.0%) | 0 (0.0%) |
| Total | 1 (1.2%) | 21 (27.3%) |
Race in Ponce De Leon
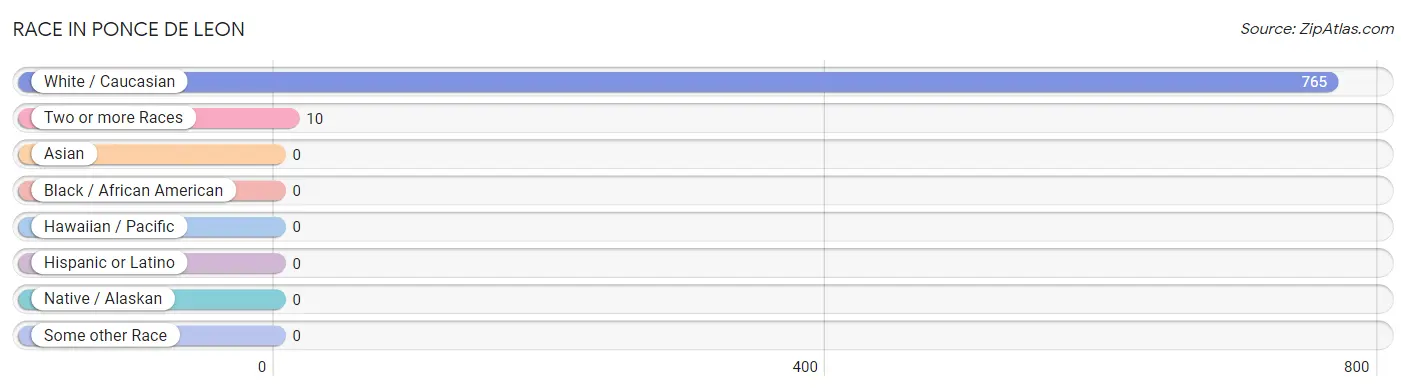
The most populous races in Ponce De Leon are White / Caucasian (765 | 98.7%), and Two or more Races (10 | 1.3%).
| Race | # Population | % Population |
| Asian | 0 | 0.0% |
| Black / African American | 0 | 0.0% |
| Hawaiian / Pacific | 0 | 0.0% |
| Hispanic or Latino | 0 | 0.0% |
| Native / Alaskan | 0 | 0.0% |
| White / Caucasian | 765 | 98.7% |
| Two or more Races | 10 | 1.3% |
| Some other Race | 0 | 0.0% |
| Total | 775 | 100.0% |
Ancestry in Ponce De Leon
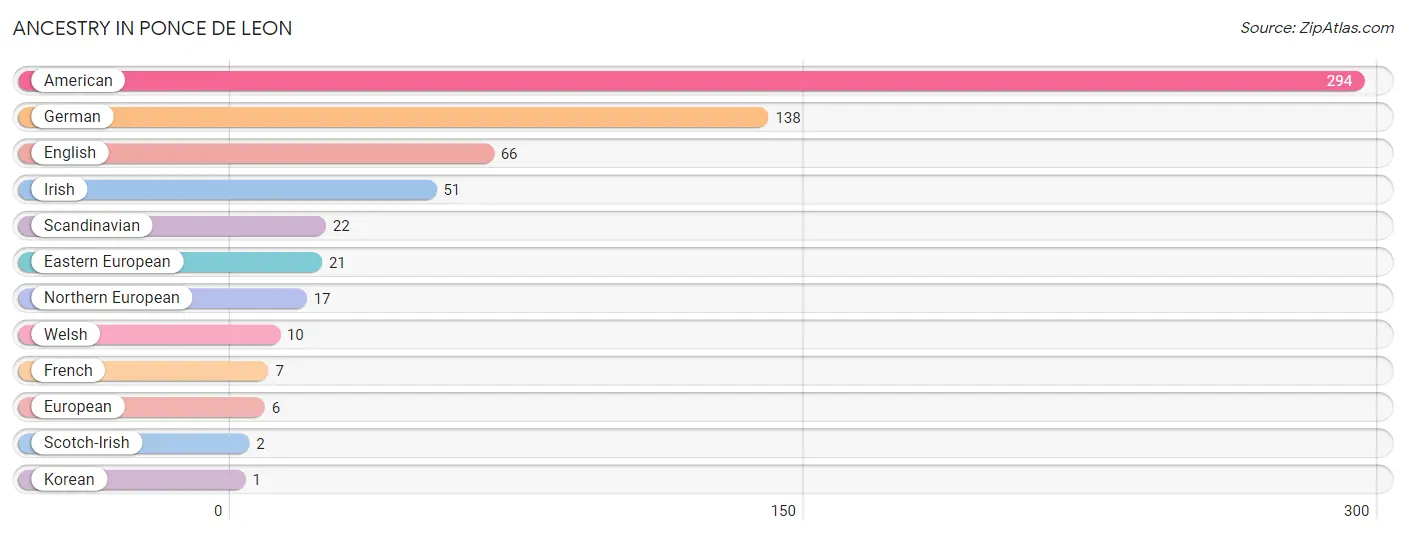
The most populous ancestries reported in Ponce De Leon are American (294 | 37.9%), German (138 | 17.8%), English (66 | 8.5%), Irish (51 | 6.6%), and Scandinavian (22 | 2.8%), together accounting for 73.7% of all Ponce De Leon residents.
| Ancestry | # Population | % Population |
| American | 294 | 37.9% |
| Eastern European | 21 | 2.7% |
| English | 66 | 8.5% |
| European | 6 | 0.8% |
| French | 7 | 0.9% |
| German | 138 | 17.8% |
| Irish | 51 | 6.6% |
| Korean | 1 | 0.1% |
| Northern European | 17 | 2.2% |
| Scandinavian | 22 | 2.8% |
| Scotch-Irish | 2 | 0.3% |
| Welsh | 10 | 1.3% | View All 12 Rows |
Immigrants in Ponce De Leon

| Immigration Origin | # Population | % Population | View All 0 Rows |
Sex and Age in Ponce De Leon
Sex and Age in Ponce De Leon
The most populous age groups in Ponce De Leon are 25 to 29 Years (140 | 33.3%) for men and 45 to 49 Years (75 | 21.1%) for women.
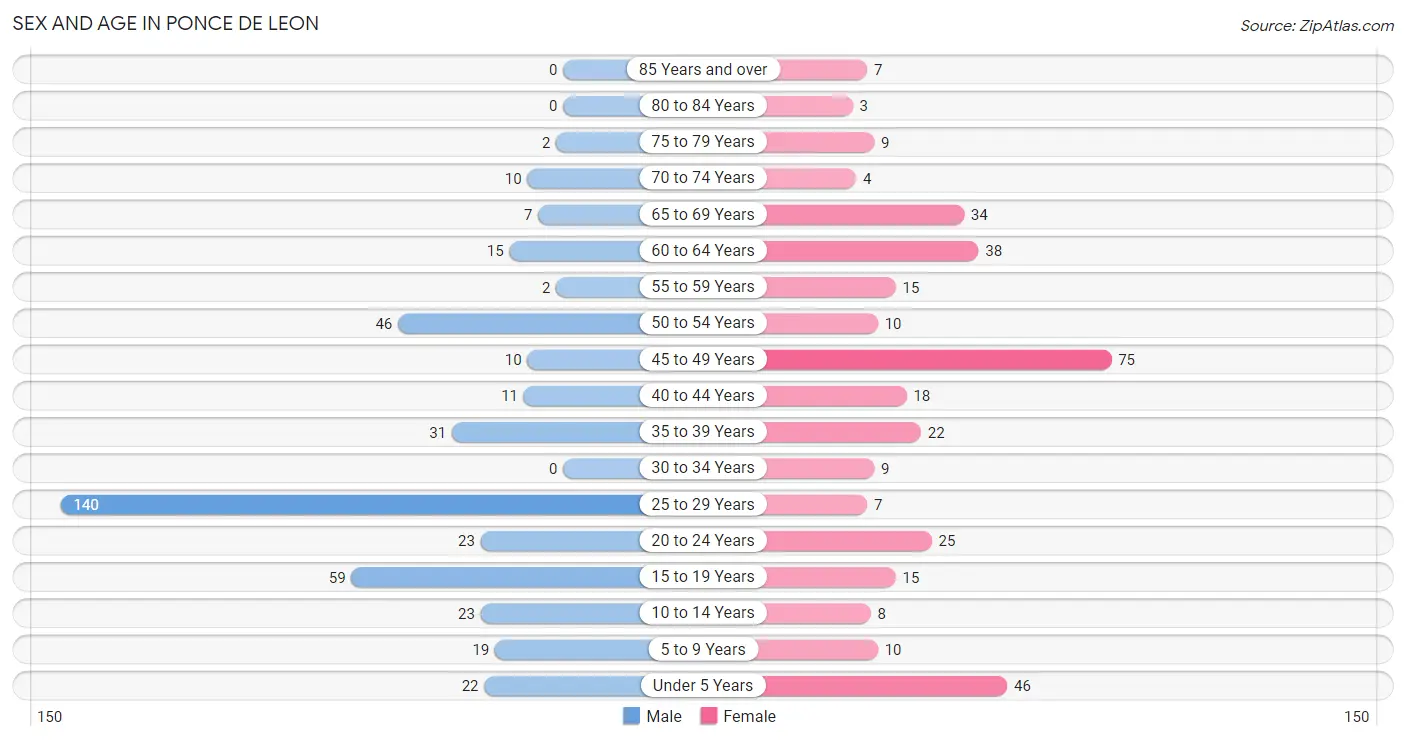
| Age Bracket | Male | Female |
| Under 5 Years | 22 (5.2%) | 46 (13.0%) |
| 5 to 9 Years | 19 (4.5%) | 10 (2.8%) |
| 10 to 14 Years | 23 (5.5%) | 8 (2.2%) |
| 15 to 19 Years | 59 (14.1%) | 15 (4.2%) |
| 20 to 24 Years | 23 (5.5%) | 25 (7.0%) |
| 25 to 29 Years | 140 (33.3%) | 7 (2.0%) |
| 30 to 34 Years | 0 (0.0%) | 9 (2.5%) |
| 35 to 39 Years | 31 (7.4%) | 22 (6.2%) |
| 40 to 44 Years | 11 (2.6%) | 18 (5.1%) |
| 45 to 49 Years | 10 (2.4%) | 75 (21.1%) |
| 50 to 54 Years | 46 (11.0%) | 10 (2.8%) |
| 55 to 59 Years | 2 (0.5%) | 15 (4.2%) |
| 60 to 64 Years | 15 (3.6%) | 38 (10.7%) |
| 65 to 69 Years | 7 (1.7%) | 34 (9.6%) |
| 70 to 74 Years | 10 (2.4%) | 4 (1.1%) |
| 75 to 79 Years | 2 (0.5%) | 9 (2.5%) |
| 80 to 84 Years | 0 (0.0%) | 3 (0.9%) |
| 85 Years and over | 0 (0.0%) | 7 (2.0%) |
| Total | 420 (100.0%) | 355 (100.0%) |
Families and Households in Ponce De Leon
Median Family Size in Ponce De Leon
The median family size in Ponce De Leon is 4.29 persons per family, with married-couple families (86 | 52.8%) accounting for the largest median family size of 4.56 persons per family. On the other hand, single male/father families (4 | 2.5%) represent the smallest median family size with 3.75 persons per family.
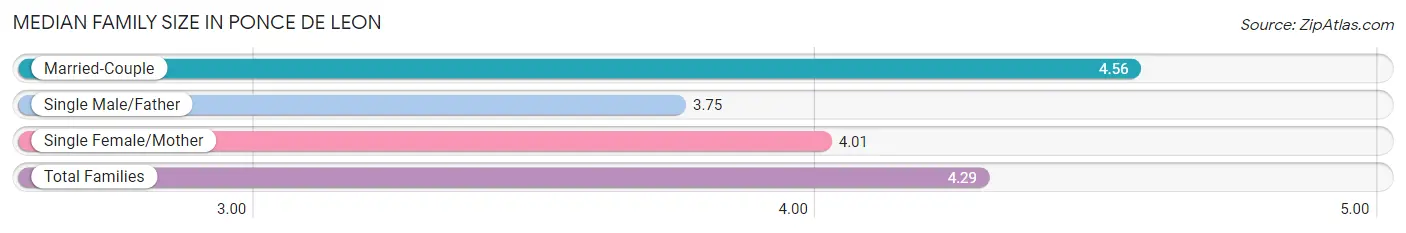
| Family Type | # Families | Family Size |
| Married-Couple | 86 (52.8%) | 4.56 |
| Single Male/Father | 4 (2.5%) | 3.75 |
| Single Female/Mother | 73 (44.8%) | 4.01 |
| Total Families | 163 (100.0%) | 4.29 |
Median Household Size in Ponce De Leon
The median household size in Ponce De Leon is 3.57 persons per household, with married-couple households (86 | 39.6%) accounting for the largest median household size of 4.56 persons per household. non-family households (54 | 24.9%) represent the smallest median household size with 1.02 persons per household.
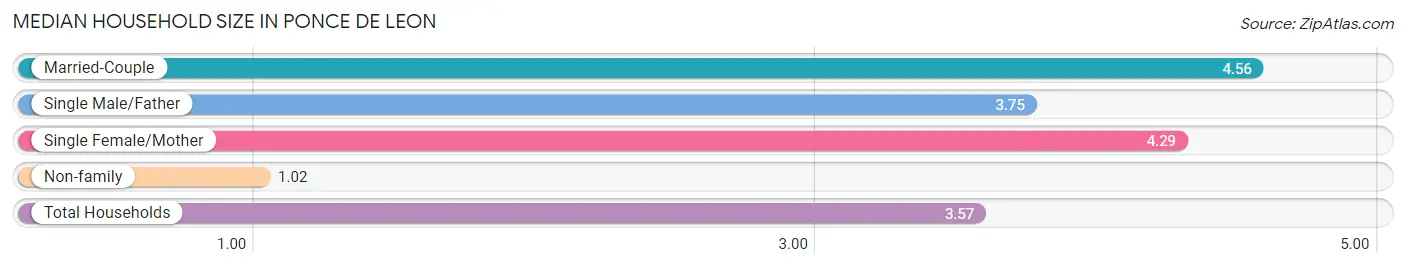
| Household Type | # Households | Household Size |
| Married-Couple | 86 (39.6%) | 4.56 |
| Single Male/Father | 4 (1.8%) | 3.75 |
| Single Female/Mother | 73 (33.6%) | 4.29 |
| Non-family | 54 (24.9%) | 1.02 |
| Total Households | 217 (100.0%) | 3.57 |
Household Size by Marriage Status in Ponce De Leon
Out of a total of 217 households in Ponce De Leon, 163 (75.1%) are family households, while 54 (24.9%) are nonfamily households. The most numerous type of family households are 4-person households, comprising 64, and the most common type of nonfamily households are 1-person households, comprising 51.
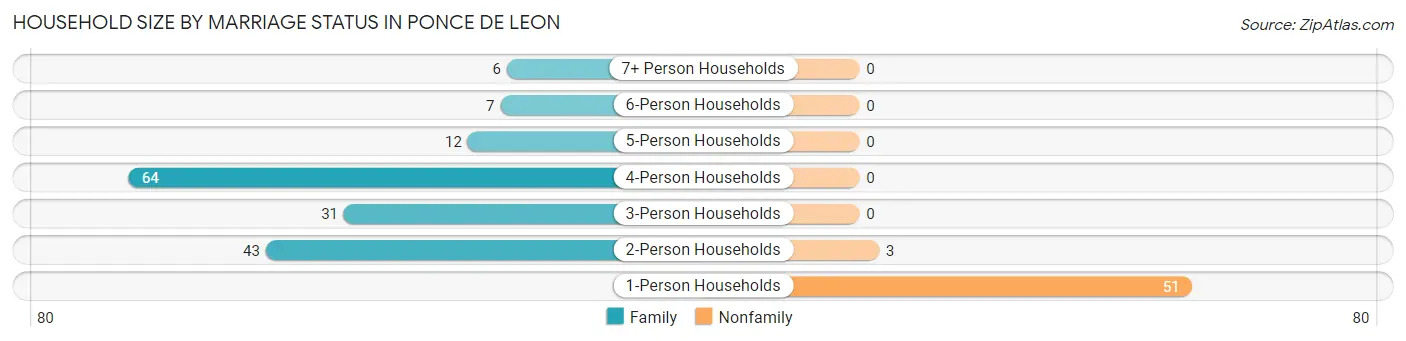
| Household Size | Family Households | Nonfamily Households |
| 1-Person Households | - | 51 (23.5%) |
| 2-Person Households | 43 (19.8%) | 3 (1.4%) |
| 3-Person Households | 31 (14.3%) | 0 (0.0%) |
| 4-Person Households | 64 (29.5%) | 0 (0.0%) |
| 5-Person Households | 12 (5.5%) | 0 (0.0%) |
| 6-Person Households | 7 (3.2%) | 0 (0.0%) |
| 7+ Person Households | 6 (2.8%) | 0 (0.0%) |
| Total | 163 (75.1%) | 54 (24.9%) |
Female Fertility in Ponce De Leon
Fertility by Age in Ponce De Leon
Average fertility rate in Ponce De Leon is 333.0 births per 1,000 women. Women in the age bracket of 35 to 50 years have the highest fertility rate with 471.0 births per 1,000 women. Women in the age bracket of 35 to 50 years acount for 96.6% of all women with births.
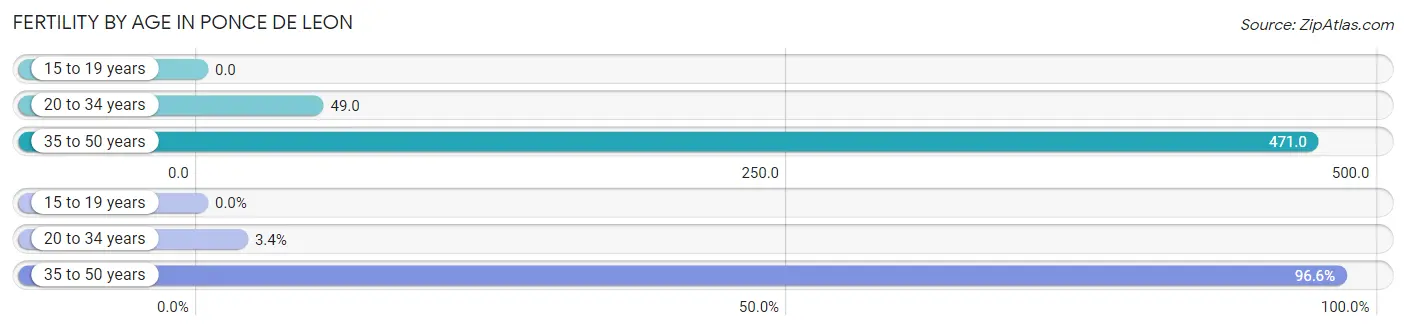
| Age Bracket | Women with Births | Births / 1,000 Women |
| 15 to 19 years | 0 (0.0%) | 0.0 |
| 20 to 34 years | 2 (3.4%) | 49.0 |
| 35 to 50 years | 57 (96.6%) | 471.0 |
| Total | 59 (100.0%) | 333.0 |
Fertility by Age by Marriage Status in Ponce De Leon
3.4% of women with births (59) in Ponce De Leon are married. The highest percentage of unmarried women with births falls into 35 to 50 years age bracket with 100.0% of them unmarried at the time of birth, while the lowest percentage of unmarried women with births belong to 20 to 34 years age bracket with 0.0% of them unmarried.
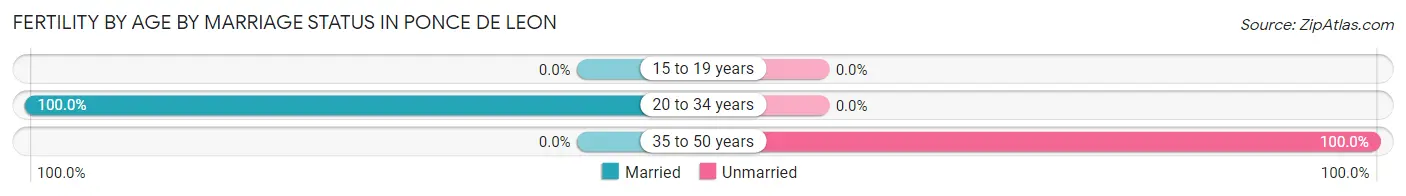
| Age Bracket | Married | Unmarried |
| 15 to 19 years | 0 (0.0%) | 0 (0.0%) |
| 20 to 34 years | 2 (100.0%) | 0 (0.0%) |
| 35 to 50 years | 0 (0.0%) | 57 (100.0%) |
| Total | 2 (3.4%) | 57 (96.6%) |
Fertility by Education in Ponce De Leon
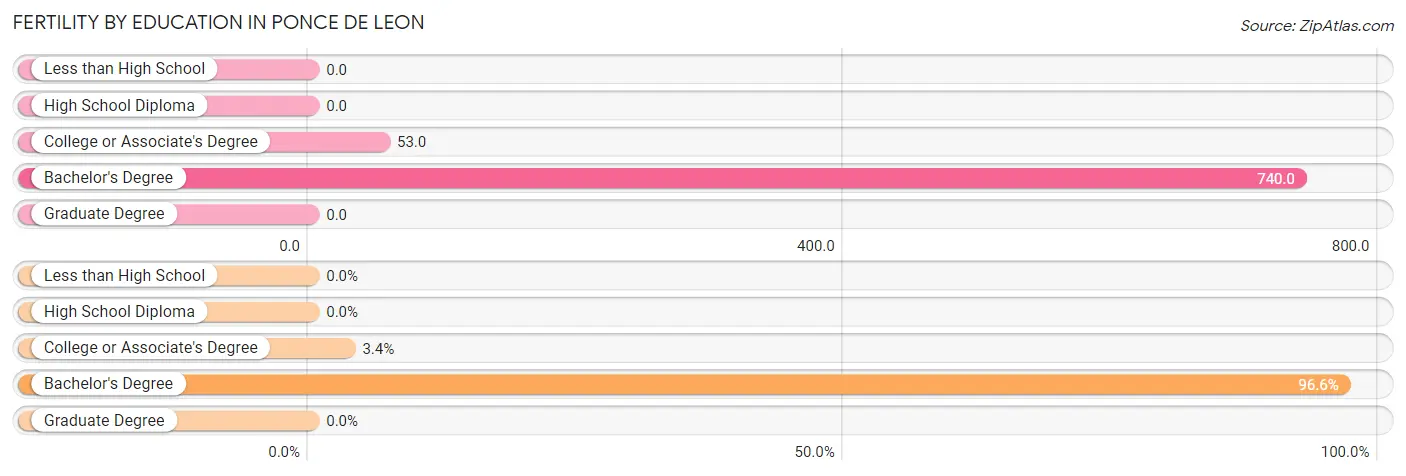
| Educational Attainment | Women with Births | Births / 1,000 Women |
| Less than High School | 0 (0.0%) | 0.0 |
| High School Diploma | 0 (0.0%) | 0.0 |
| College or Associate's Degree | 2 (3.4%) | 53.0 |
| Bachelor's Degree | 57 (96.6%) | 740.0 |
| Graduate Degree | 0 (0.0%) | 0.0 |
| Total | 59 (100.0%) | 333.0 |
Fertility by Education by Marriage Status in Ponce De Leon
96.6% of women with births in Ponce De Leon are unmarried. Women with the educational attainment of college or associate's degree are most likely to be married with 100.0% of them married at childbirth, while women with the educational attainment of bachelor's degree are least likely to be married with 100.0% of them unmarried at childbirth.
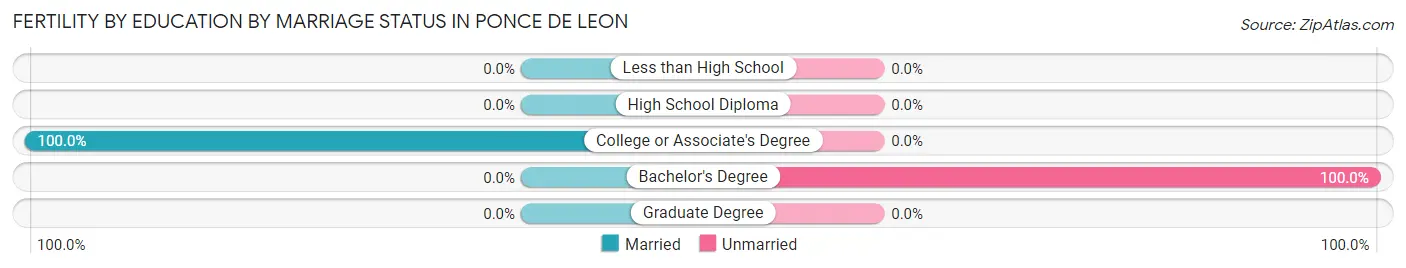
| Educational Attainment | Married | Unmarried |
| Less than High School | 0 (0.0%) | 0 (0.0%) |
| High School Diploma | 0 (0.0%) | 0 (0.0%) |
| College or Associate's Degree | 2 (100.0%) | 0 (0.0%) |
| Bachelor's Degree | 0 (0.0%) | 57 (100.0%) |
| Graduate Degree | 0 (0.0%) | 0 (0.0%) |
| Total | 2 (3.4%) | 57 (96.6%) |
Employment Characteristics in Ponce De Leon
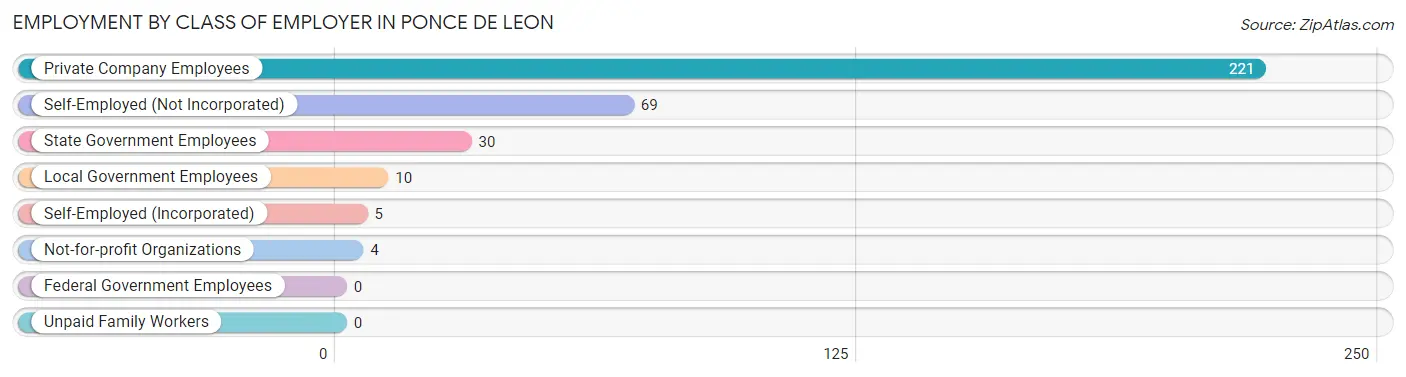
Employment by Class of Employer in Ponce De Leon
Among the 339 employed individuals in Ponce De Leon, private company employees (221 | 65.2%), self-employed (not incorporated) (69 | 20.3%), and state government employees (30 | 8.8%) make up the most common classes of employment.
| Employer Class | # Employees | % Employees |
| Private Company Employees | 221 | 65.2% |
| Self-Employed (Incorporated) | 5 | 1.5% |
| Self-Employed (Not Incorporated) | 69 | 20.3% |
| Not-for-profit Organizations | 4 | 1.2% |
| Local Government Employees | 10 | 2.9% |
| State Government Employees | 30 | 8.8% |
| Federal Government Employees | 0 | 0.0% |
| Unpaid Family Workers | 0 | 0.0% |
| Total | 339 | 100.0% |
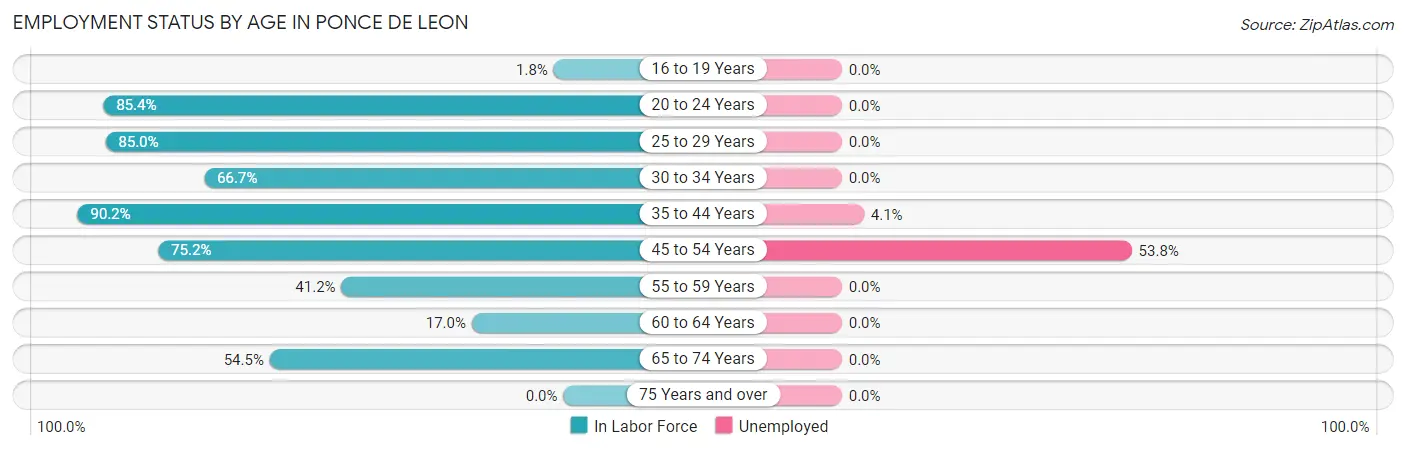
Employment Status by Age in Ponce De Leon
According to the labor force statistics for Ponce De Leon, out of the total population over 16 years of age (629), 63.4% or 399 individuals are in the labor force, with 15.0% or 60 of them unemployed. The age group with the highest labor force participation rate is 35 to 44 years, with 90.2% or 74 individuals in the labor force. Within the labor force, the 45 to 54 years age range has the highest percentage of unemployed individuals, with 53.8% or 57 of them being unemployed.
| Age Bracket | In Labor Force | Unemployed |
| 16 to 19 Years | 1 (1.8%) | 0 (0.0%) |
| 20 to 24 Years | 41 (85.4%) | 0 (0.0%) |
| 25 to 29 Years | 125 (85.0%) | 0 (0.0%) |
| 30 to 34 Years | 6 (66.7%) | 0 (0.0%) |
| 35 to 44 Years | 74 (90.2%) | 3 (4.1%) |
| 45 to 54 Years | 106 (75.2%) | 57 (53.8%) |
| 55 to 59 Years | 7 (41.2%) | 0 (0.0%) |
| 60 to 64 Years | 9 (17.0%) | 0 (0.0%) |
| 65 to 74 Years | 30 (54.5%) | 0 (0.0%) |
| 75 Years and over | 0 (0.0%) | 0 (0.0%) |
| Total | 399 (63.4%) | 60 (15.0%) |
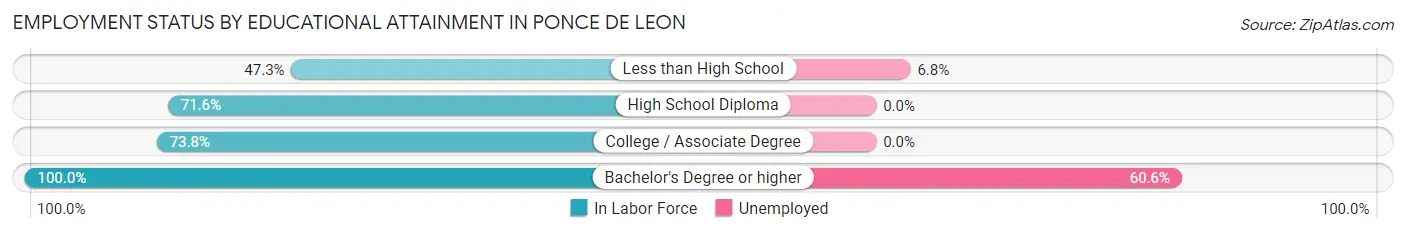
Employment Status by Educational Attainment in Ponce De Leon
According to labor force statistics for Ponce De Leon, 72.8% of individuals (327) out of the total population between 25 and 64 years of age (449) are in the labor force, with 18.3% or 60 of them being unemployed. The group with the highest labor force participation rate are those with the educational attainment of bachelor's degree or higher, with 100.0% or 94 individuals in the labor force. Within the labor force, individuals with bachelor's degree or higher education have the highest percentage of unemployment, with 60.6% or 57 of them being unemployed.
| Educational Attainment | In Labor Force | Unemployed |
| Less than High School | 44 (47.3%) | 6 (6.8%) |
| High School Diploma | 141 (71.6%) | 0 (0.0%) |
| College / Associate Degree | 48 (73.8%) | 0 (0.0%) |
| Bachelor's Degree or higher | 94 (100.0%) | 57 (60.6%) |
| Total | 327 (72.8%) | 82 (18.3%) |
Employment Occupations by Sex in Ponce De Leon
Management, Business, Science and Arts Occupations
The most common Management, Business, Science and Arts occupations in Ponce De Leon are Community & Social Service (19 | 5.6%), Education Instruction & Library (19 | 5.6%), Business & Financial (7 | 2.1%), Management (5 | 1.5%), and Health Diagnosing & Treating (5 | 1.5%).
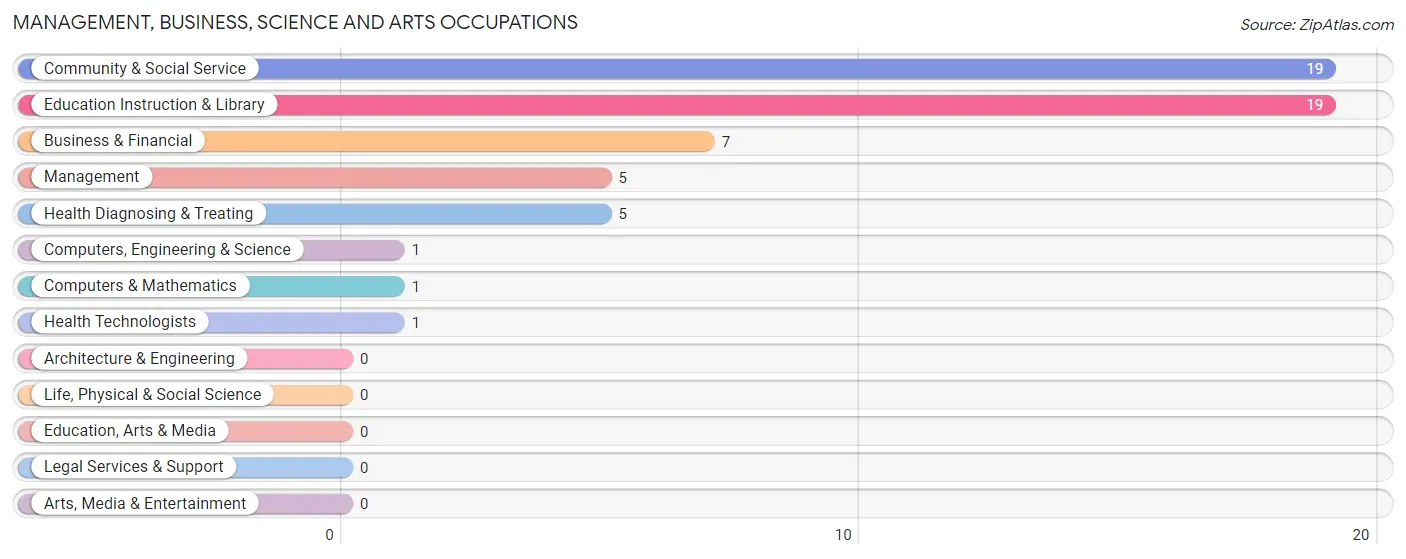
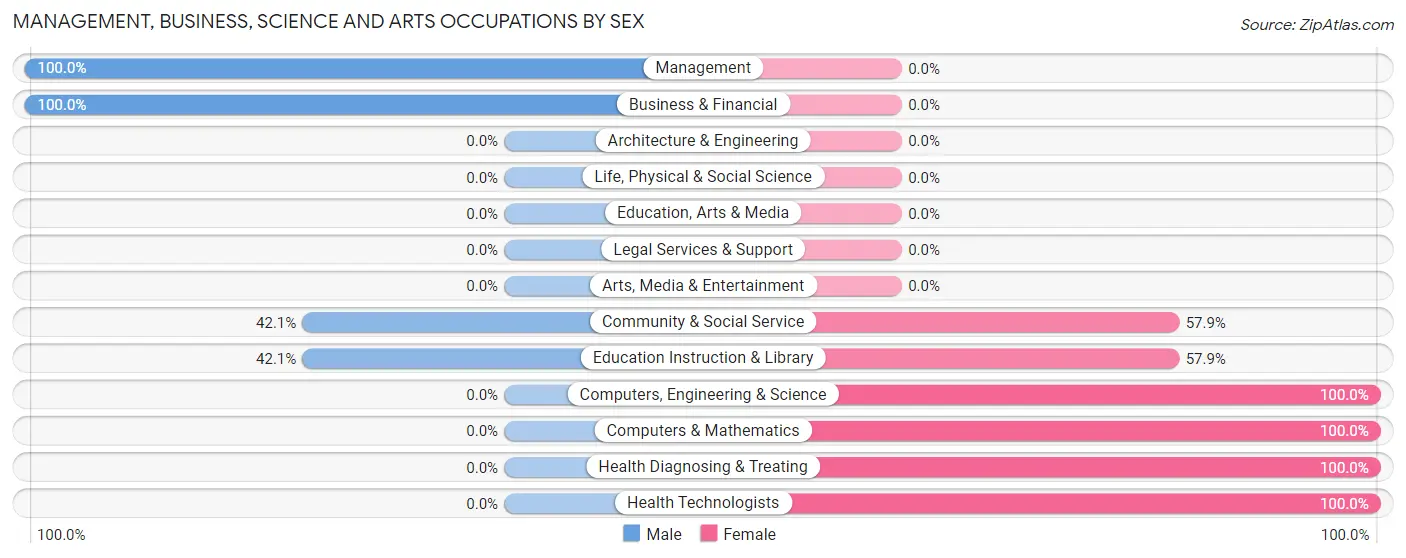
Management, Business, Science and Arts Occupations by Sex
Within the Management, Business, Science and Arts occupations in Ponce De Leon, the most male-oriented occupations are Management (100.0%), Business & Financial (100.0%), and Community & Social Service (42.1%), while the most female-oriented occupations are Computers, Engineering & Science (100.0%), Computers & Mathematics (100.0%), and Health Diagnosing & Treating (100.0%).
| Occupation | Male | Female |
| Management | 5 (100.0%) | 0 (0.0%) |
| Business & Financial | 7 (100.0%) | 0 (0.0%) |
| Computers, Engineering & Science | 0 (0.0%) | 1 (100.0%) |
| Computers & Mathematics | 0 (0.0%) | 1 (100.0%) |
| Architecture & Engineering | 0 (0.0%) | 0 (0.0%) |
| Life, Physical & Social Science | 0 (0.0%) | 0 (0.0%) |
| Community & Social Service | 8 (42.1%) | 11 (57.9%) |
| Education, Arts & Media | 0 (0.0%) | 0 (0.0%) |
| Legal Services & Support | 0 (0.0%) | 0 (0.0%) |
| Education Instruction & Library | 8 (42.1%) | 11 (57.9%) |
| Arts, Media & Entertainment | 0 (0.0%) | 0 (0.0%) |
| Health Diagnosing & Treating | 0 (0.0%) | 5 (100.0%) |
| Health Technologists | 0 (0.0%) | 1 (100.0%) |
| Total (Category) | 20 (54.0%) | 17 (46.0%) |
| Total (Overall) | 226 (66.7%) | 113 (33.3%) |
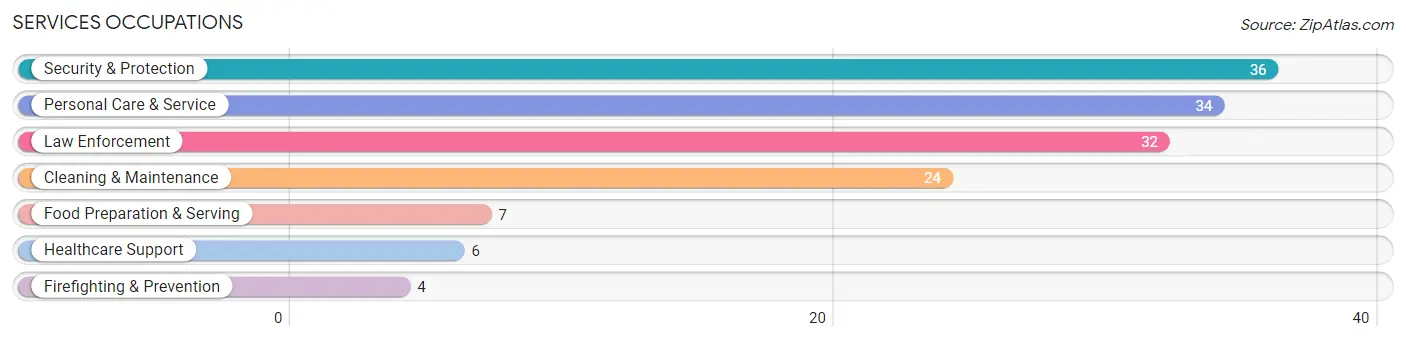
Services Occupations
The most common Services occupations in Ponce De Leon are Security & Protection (36 | 10.6%), Personal Care & Service (34 | 10.0%), Law Enforcement (32 | 9.4%), Cleaning & Maintenance (24 | 7.1%), and Food Preparation & Serving (7 | 2.1%).
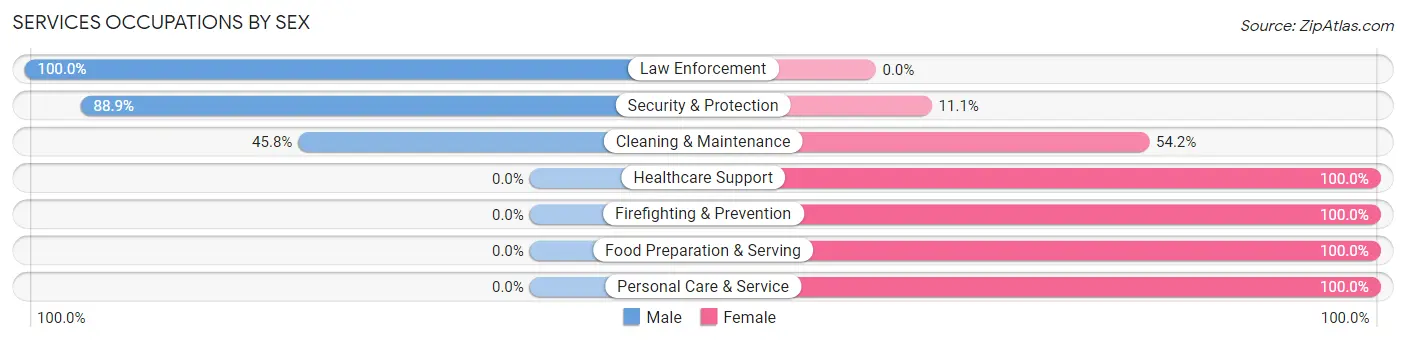
Services Occupations by Sex
Within the Services occupations in Ponce De Leon, the most male-oriented occupations are Law Enforcement (100.0%), Security & Protection (88.9%), and Cleaning & Maintenance (45.8%), while the most female-oriented occupations are Healthcare Support (100.0%), Firefighting & Prevention (100.0%), and Food Preparation & Serving (100.0%).
| Occupation | Male | Female |
| Healthcare Support | 0 (0.0%) | 6 (100.0%) |
| Security & Protection | 32 (88.9%) | 4 (11.1%) |
| Firefighting & Prevention | 0 (0.0%) | 4 (100.0%) |
| Law Enforcement | 32 (100.0%) | 0 (0.0%) |
| Food Preparation & Serving | 0 (0.0%) | 7 (100.0%) |
| Cleaning & Maintenance | 11 (45.8%) | 13 (54.2%) |
| Personal Care & Service | 0 (0.0%) | 34 (100.0%) |
| Total (Category) | 43 (40.2%) | 64 (59.8%) |
| Total (Overall) | 226 (66.7%) | 113 (33.3%) |
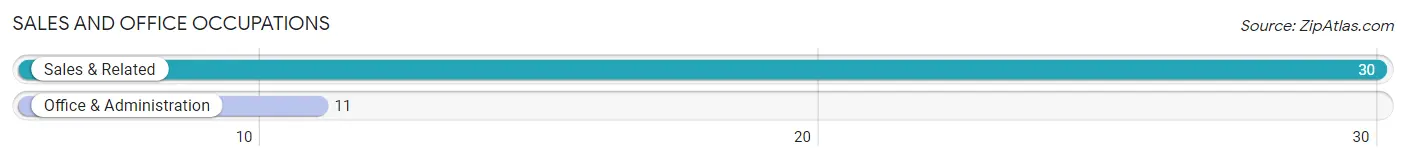
Sales and Office Occupations
The most common Sales and Office occupations in Ponce De Leon are Sales & Related (30 | 8.8%), and Office & Administration (11 | 3.2%).
Sales and Office Occupations by Sex
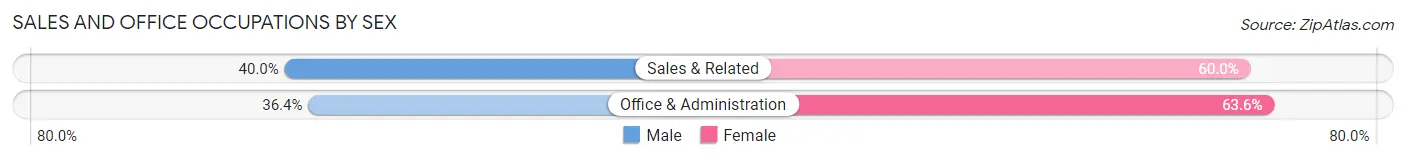
| Occupation | Male | Female |
| Sales & Related | 12 (40.0%) | 18 (60.0%) |
| Office & Administration | 4 (36.4%) | 7 (63.6%) |
| Total (Category) | 16 (39.0%) | 25 (61.0%) |
| Total (Overall) | 226 (66.7%) | 113 (33.3%) |
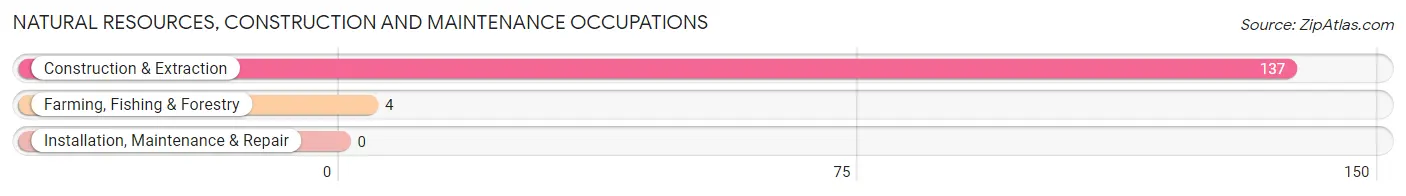
Natural Resources, Construction and Maintenance Occupations
The most common Natural Resources, Construction and Maintenance occupations in Ponce De Leon are Construction & Extraction (137 | 40.4%), and Farming, Fishing & Forestry (4 | 1.2%).
Natural Resources, Construction and Maintenance Occupations by Sex
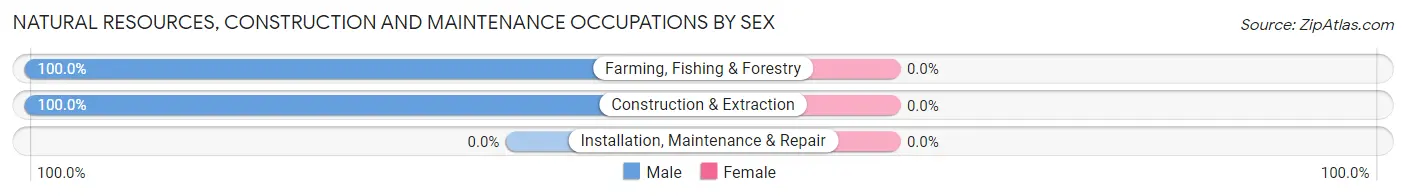
| Occupation | Male | Female |
| Farming, Fishing & Forestry | 4 (100.0%) | 0 (0.0%) |
| Construction & Extraction | 137 (100.0%) | 0 (0.0%) |
| Installation, Maintenance & Repair | 0 (0.0%) | 0 (0.0%) |
| Total (Category) | 141 (100.0%) | 0 (0.0%) |
| Total (Overall) | 226 (66.7%) | 113 (33.3%) |
Production, Transportation and Moving Occupations
The most common Production, Transportation and Moving occupations in Ponce De Leon are Production (7 | 2.1%), and Material Moving (6 | 1.8%).
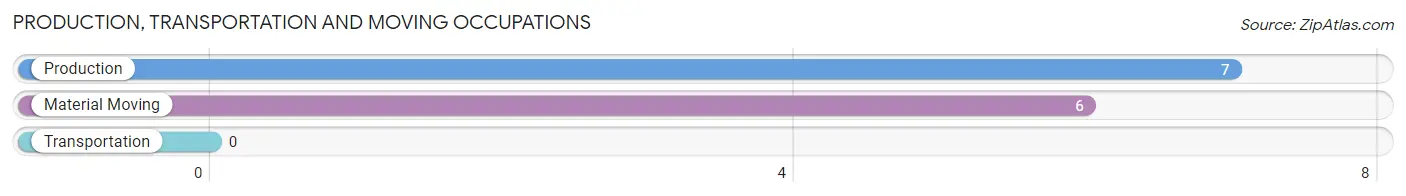
Production, Transportation and Moving Occupations by Sex
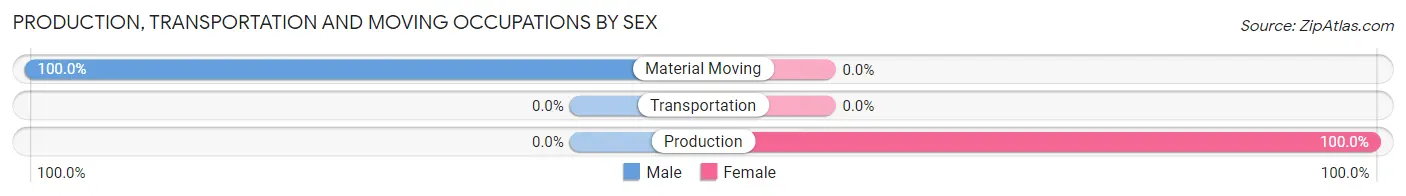
| Occupation | Male | Female |
| Production | 0 (0.0%) | 7 (100.0%) |
| Transportation | 0 (0.0%) | 0 (0.0%) |
| Material Moving | 6 (100.0%) | 0 (0.0%) |
| Total (Category) | 6 (46.2%) | 7 (53.8%) |
| Total (Overall) | 226 (66.7%) | 113 (33.3%) |
Employment Industries by Sex in Ponce De Leon
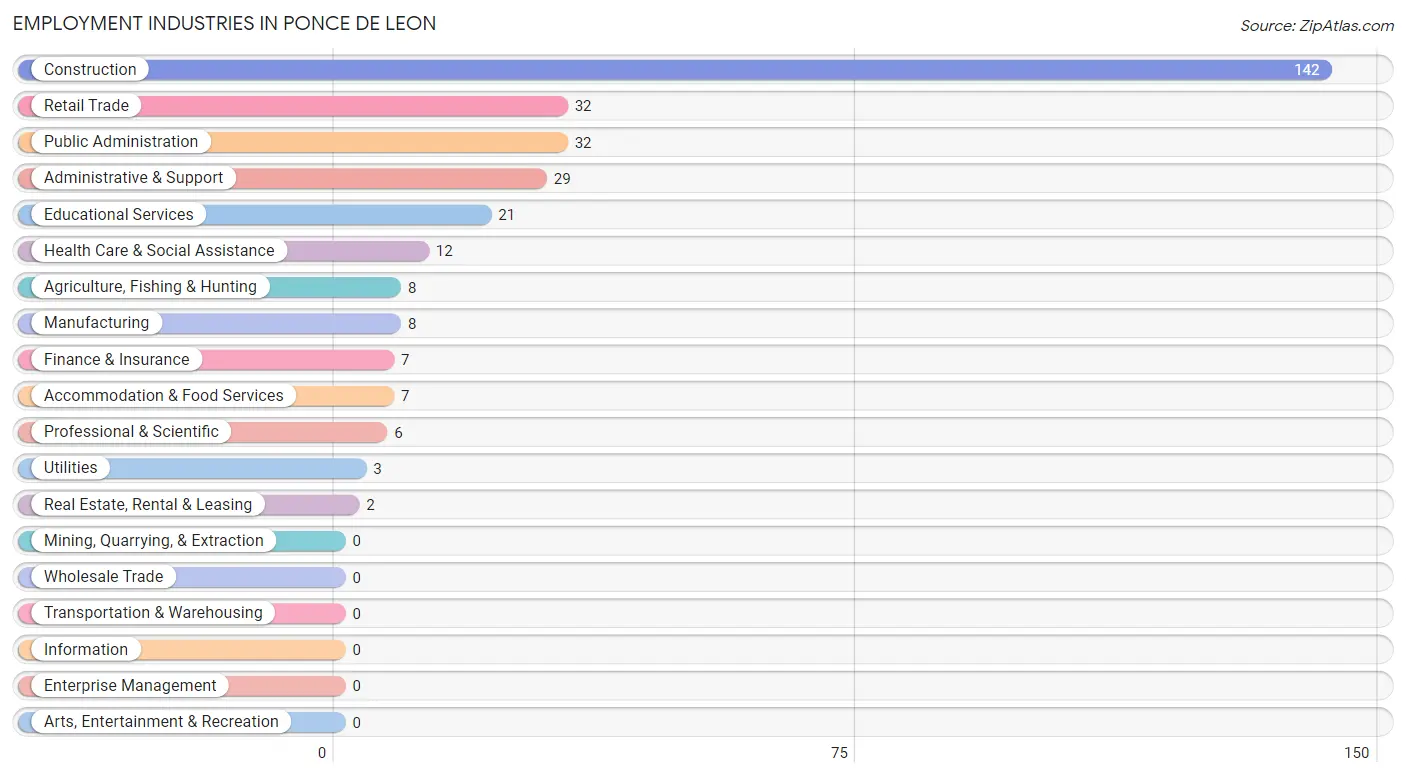
Employment Industries in Ponce De Leon
The major employment industries in Ponce De Leon include Construction (142 | 41.9%), Retail Trade (32 | 9.4%), Public Administration (32 | 9.4%), Administrative & Support (29 | 8.6%), and Educational Services (21 | 6.2%).
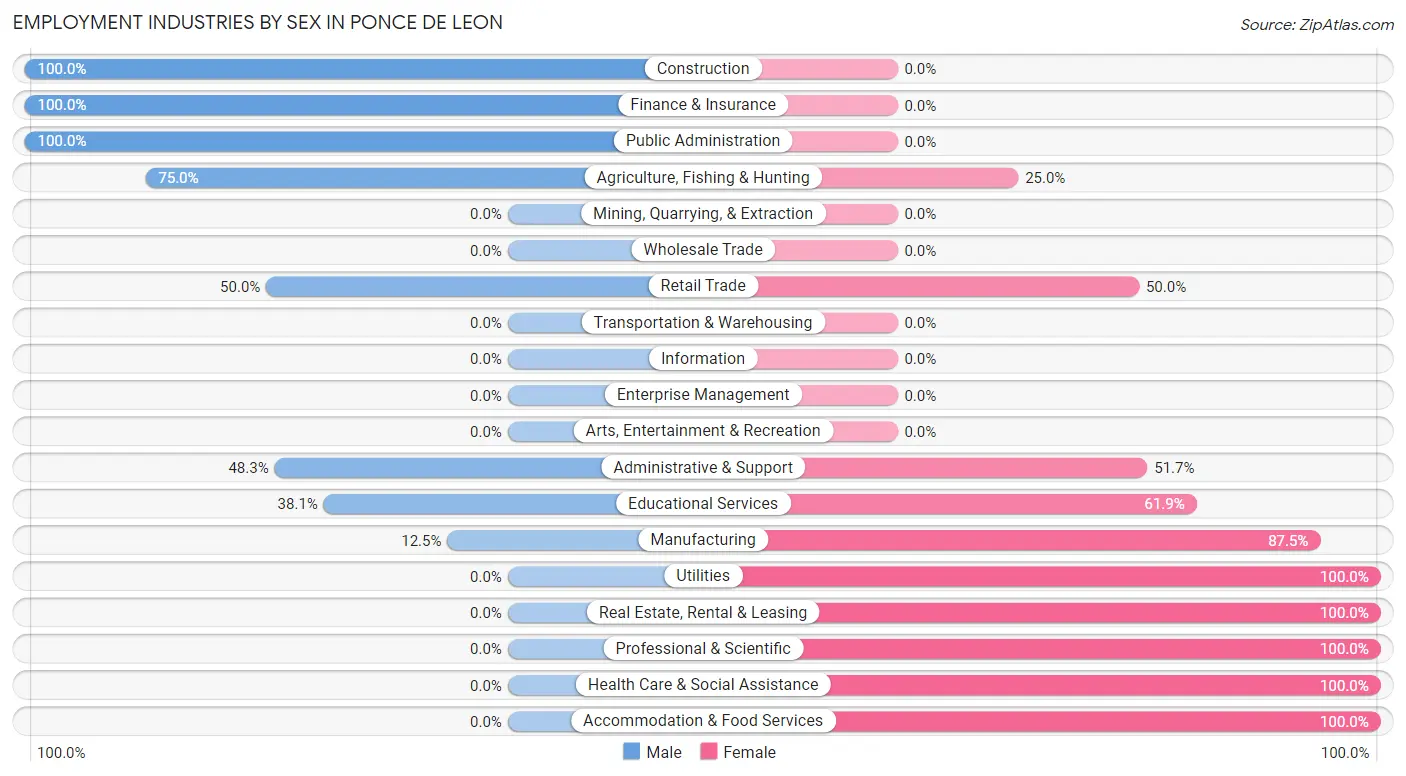
Employment Industries by Sex in Ponce De Leon
The Ponce De Leon industries that see more men than women are Construction (100.0%), Finance & Insurance (100.0%), and Public Administration (100.0%), whereas the industries that tend to have a higher number of women are Utilities (100.0%), Real Estate, Rental & Leasing (100.0%), and Professional & Scientific (100.0%).
| Industry | Male | Female |
| Agriculture, Fishing & Hunting | 6 (75.0%) | 2 (25.0%) |
| Mining, Quarrying, & Extraction | 0 (0.0%) | 0 (0.0%) |
| Construction | 142 (100.0%) | 0 (0.0%) |
| Manufacturing | 1 (12.5%) | 7 (87.5%) |
| Wholesale Trade | 0 (0.0%) | 0 (0.0%) |
| Retail Trade | 16 (50.0%) | 16 (50.0%) |
| Transportation & Warehousing | 0 (0.0%) | 0 (0.0%) |
| Utilities | 0 (0.0%) | 3 (100.0%) |
| Information | 0 (0.0%) | 0 (0.0%) |
| Finance & Insurance | 7 (100.0%) | 0 (0.0%) |
| Real Estate, Rental & Leasing | 0 (0.0%) | 2 (100.0%) |
| Professional & Scientific | 0 (0.0%) | 6 (100.0%) |
| Enterprise Management | 0 (0.0%) | 0 (0.0%) |
| Administrative & Support | 14 (48.3%) | 15 (51.7%) |
| Educational Services | 8 (38.1%) | 13 (61.9%) |
| Health Care & Social Assistance | 0 (0.0%) | 12 (100.0%) |
| Arts, Entertainment & Recreation | 0 (0.0%) | 0 (0.0%) |
| Accommodation & Food Services | 0 (0.0%) | 7 (100.0%) |
| Public Administration | 32 (100.0%) | 0 (0.0%) |
| Total | 226 (66.7%) | 113 (33.3%) |
Education in Ponce De Leon
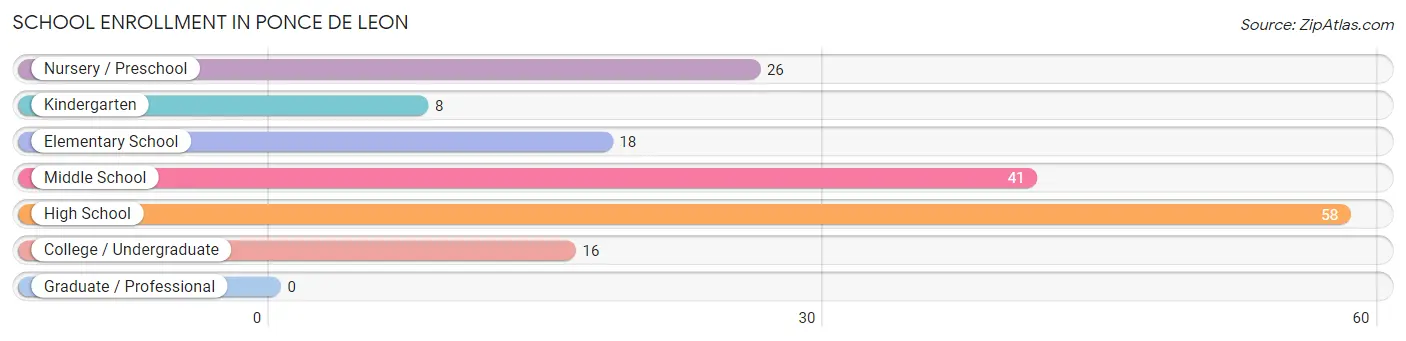
School Enrollment in Ponce De Leon
The most common levels of schooling among the 167 students in Ponce De Leon are high school (58 | 34.7%), middle school (41 | 24.5%), and nursery / preschool (26 | 15.6%).
| School Level | # Students | % Students |
| Nursery / Preschool | 26 | 15.6% |
| Kindergarten | 8 | 4.8% |
| Elementary School | 18 | 10.8% |
| Middle School | 41 | 24.5% |
| High School | 58 | 34.7% |
| College / Undergraduate | 16 | 9.6% |
| Graduate / Professional | 0 | 0.0% |
| Total | 167 | 100.0% |
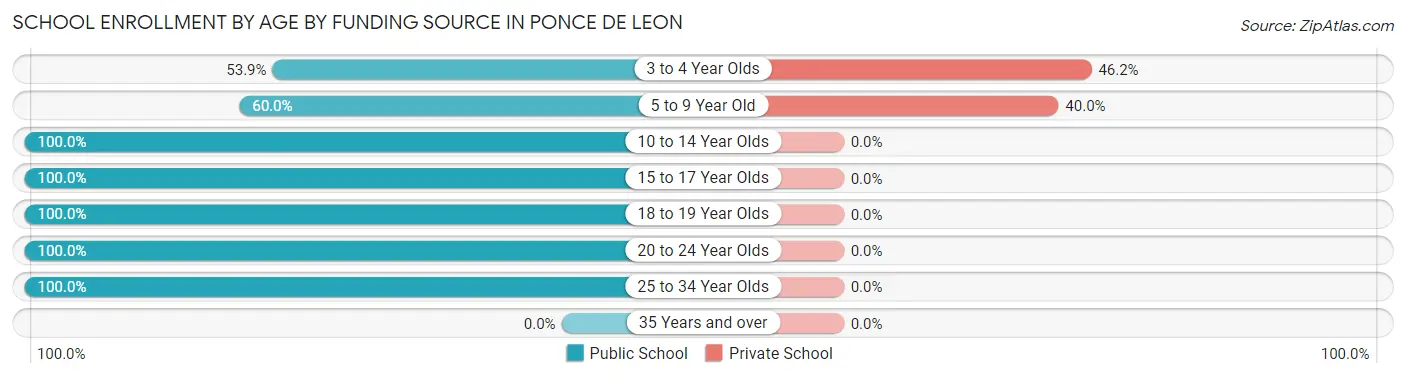
School Enrollment by Age by Funding Source in Ponce De Leon
Out of a total of 167 students who are enrolled in schools in Ponce De Leon, 22 (13.2%) attend a private institution, while the remaining 145 (86.8%) are enrolled in public schools. The age group of 3 to 4 year olds has the highest likelihood of being enrolled in private schools, with 12 (46.2% in the age bracket) enrolled. Conversely, the age group of 10 to 14 year olds has the lowest likelihood of being enrolled in a private school, with 31 (100.0% in the age bracket) attending a public institution.
| Age Bracket | Public School | Private School |
| 3 to 4 Year Olds | 14 (53.8%) | 12 (46.2%) |
| 5 to 9 Year Old | 15 (60.0%) | 10 (40.0%) |
| 10 to 14 Year Olds | 31 (100.0%) | 0 (0.0%) |
| 15 to 17 Year Olds | 69 (100.0%) | 0 (0.0%) |
| 18 to 19 Year Olds | 1 (100.0%) | 0 (0.0%) |
| 20 to 24 Year Olds | 9 (100.0%) | 0 (0.0%) |
| 25 to 34 Year Olds | 6 (100.0%) | 0 (0.0%) |
| 35 Years and over | 0 (0.0%) | 0 (0.0%) |
| Total | 145 (86.8%) | 22 (13.2%) |
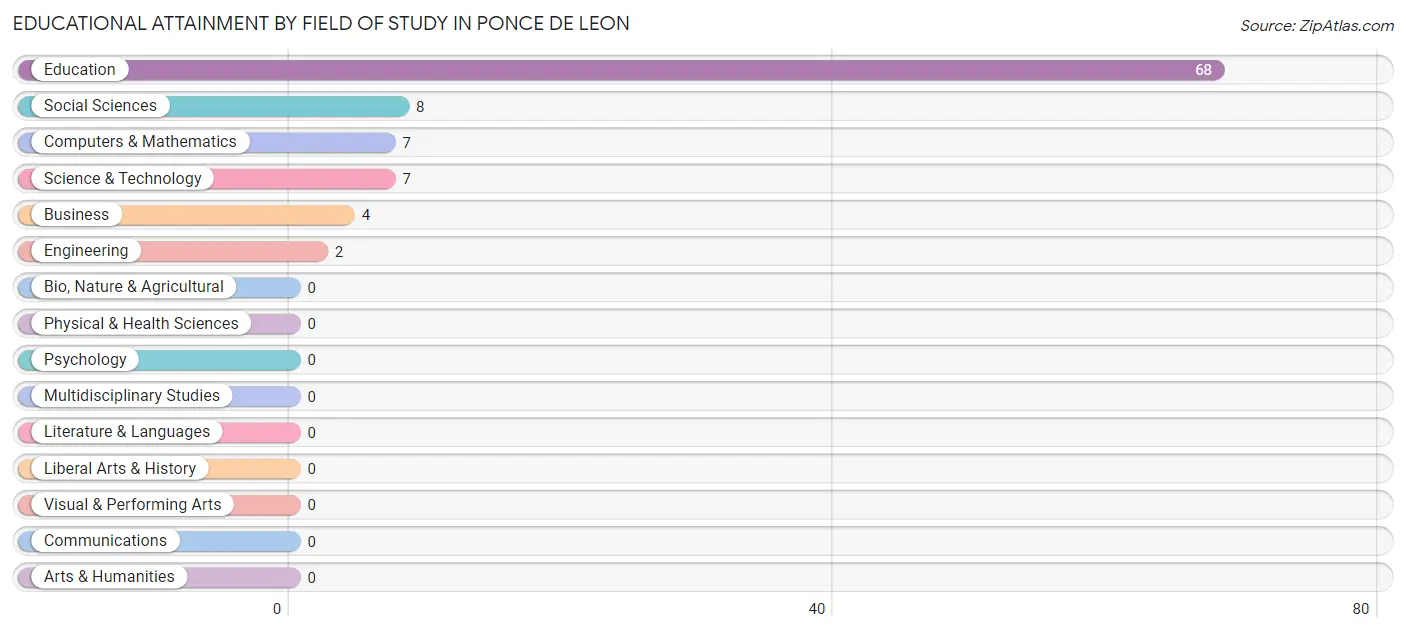
Educational Attainment by Field of Study in Ponce De Leon
Education (68 | 70.8%), social sciences (8 | 8.3%), computers & mathematics (7 | 7.3%), science & technology (7 | 7.3%), and business (4 | 4.2%) are the most common fields of study among 96 individuals in Ponce De Leon who have obtained a bachelor's degree or higher.
| Field of Study | # Graduates | % Graduates |
| Computers & Mathematics | 7 | 7.3% |
| Bio, Nature & Agricultural | 0 | 0.0% |
| Physical & Health Sciences | 0 | 0.0% |
| Psychology | 0 | 0.0% |
| Social Sciences | 8 | 8.3% |
| Engineering | 2 | 2.1% |
| Multidisciplinary Studies | 0 | 0.0% |
| Science & Technology | 7 | 7.3% |
| Business | 4 | 4.2% |
| Education | 68 | 70.8% |
| Literature & Languages | 0 | 0.0% |
| Liberal Arts & History | 0 | 0.0% |
| Visual & Performing Arts | 0 | 0.0% |
| Communications | 0 | 0.0% |
| Arts & Humanities | 0 | 0.0% |
| Total | 96 | 100.0% |
Transportation & Commute in Ponce De Leon
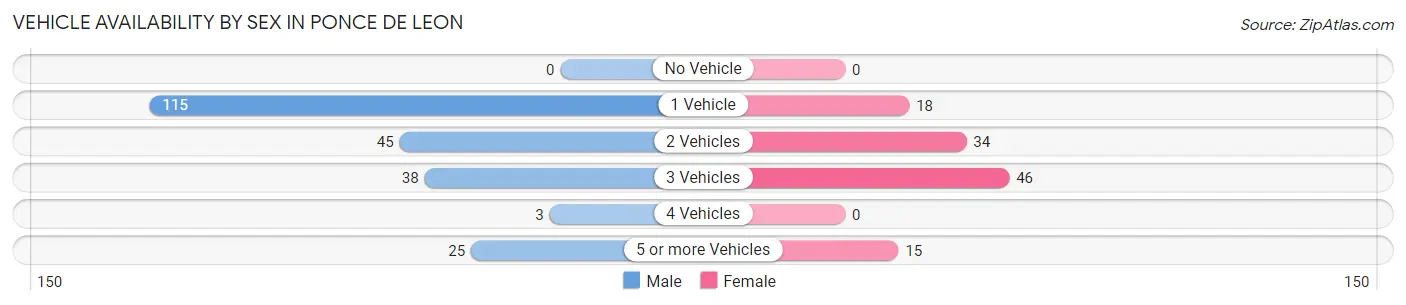
Vehicle Availability by Sex in Ponce De Leon
The most prevalent vehicle ownership categories in Ponce De Leon are males with 1 vehicle (115, accounting for 50.9%) and females with 1 vehicle (18, making up 101.8%).
| Vehicles Available | Male | Female |
| No Vehicle | 0 (0.0%) | 0 (0.0%) |
| 1 Vehicle | 115 (50.9%) | 18 (15.9%) |
| 2 Vehicles | 45 (19.9%) | 34 (30.1%) |
| 3 Vehicles | 38 (16.8%) | 46 (40.7%) |
| 4 Vehicles | 3 (1.3%) | 0 (0.0%) |
| 5 or more Vehicles | 25 (11.1%) | 15 (13.3%) |
| Total | 226 (100.0%) | 113 (100.0%) |
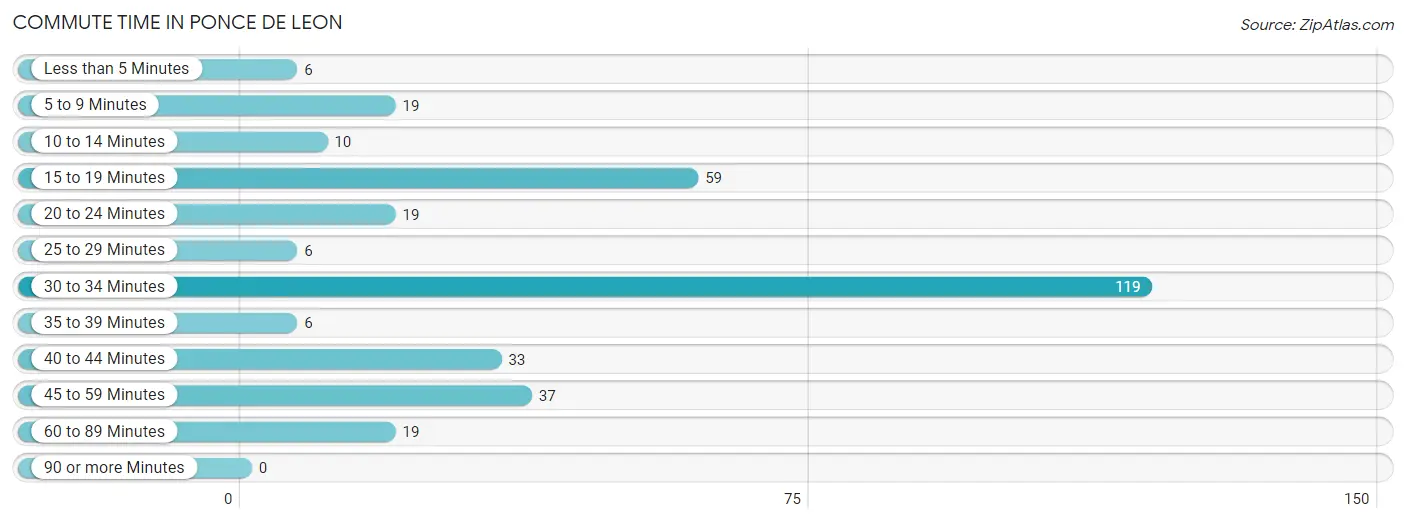
Commute Time in Ponce De Leon
The most frequently occuring commute durations in Ponce De Leon are 30 to 34 minutes (119 commuters, 35.7%), 15 to 19 minutes (59 commuters, 17.7%), and 45 to 59 minutes (37 commuters, 11.1%).
| Commute Time | # Commuters | % Commuters |
| Less than 5 Minutes | 6 | 1.8% |
| 5 to 9 Minutes | 19 | 5.7% |
| 10 to 14 Minutes | 10 | 3.0% |
| 15 to 19 Minutes | 59 | 17.7% |
| 20 to 24 Minutes | 19 | 5.7% |
| 25 to 29 Minutes | 6 | 1.8% |
| 30 to 34 Minutes | 119 | 35.7% |
| 35 to 39 Minutes | 6 | 1.8% |
| 40 to 44 Minutes | 33 | 9.9% |
| 45 to 59 Minutes | 37 | 11.1% |
| 60 to 89 Minutes | 19 | 5.7% |
| 90 or more Minutes | 0 | 0.0% |
Commute Time by Sex in Ponce De Leon
The most common commute times in Ponce De Leon are 30 to 34 minutes (98 commuters, 43.4%) for males and 15 to 19 minutes (41 commuters, 38.3%) for females.
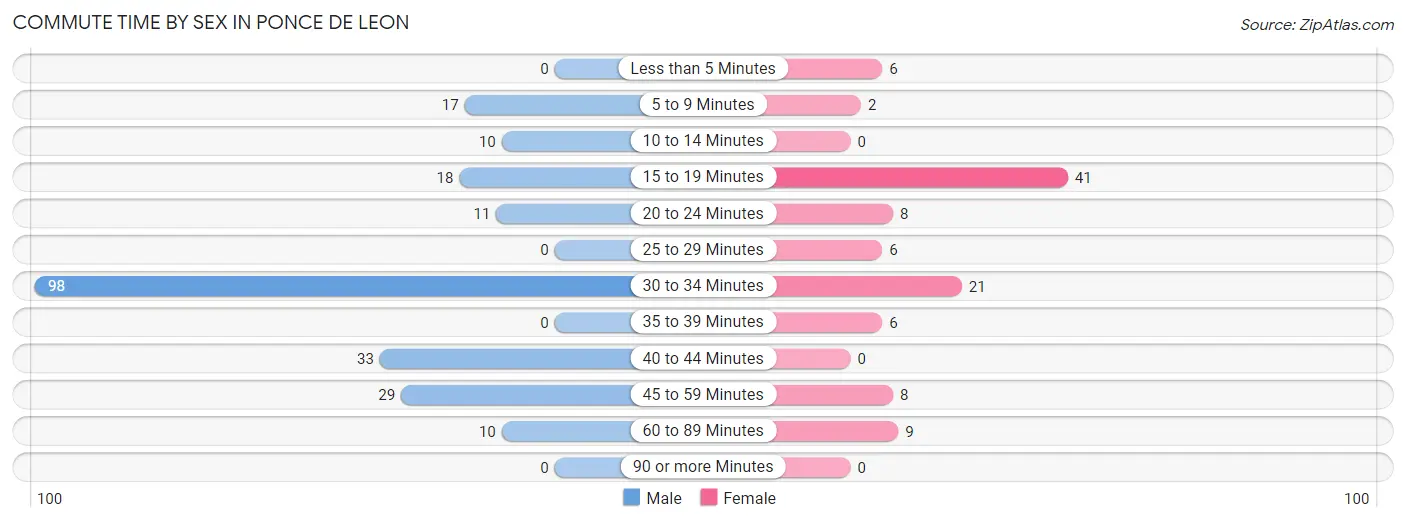
| Commute Time | Male | Female |
| Less than 5 Minutes | 0 (0.0%) | 6 (5.6%) |
| 5 to 9 Minutes | 17 (7.5%) | 2 (1.9%) |
| 10 to 14 Minutes | 10 (4.4%) | 0 (0.0%) |
| 15 to 19 Minutes | 18 (8.0%) | 41 (38.3%) |
| 20 to 24 Minutes | 11 (4.9%) | 8 (7.5%) |
| 25 to 29 Minutes | 0 (0.0%) | 6 (5.6%) |
| 30 to 34 Minutes | 98 (43.4%) | 21 (19.6%) |
| 35 to 39 Minutes | 0 (0.0%) | 6 (5.6%) |
| 40 to 44 Minutes | 33 (14.6%) | 0 (0.0%) |
| 45 to 59 Minutes | 29 (12.8%) | 8 (7.5%) |
| 60 to 89 Minutes | 10 (4.4%) | 9 (8.4%) |
| 90 or more Minutes | 0 (0.0%) | 0 (0.0%) |
Time of Departure to Work by Sex in Ponce De Leon
The most frequent times of departure to work in Ponce De Leon are 6:00 AM to 6:29 AM (114, 50.4%) for males and 8:00 AM to 8:29 AM (37, 34.6%) for females.
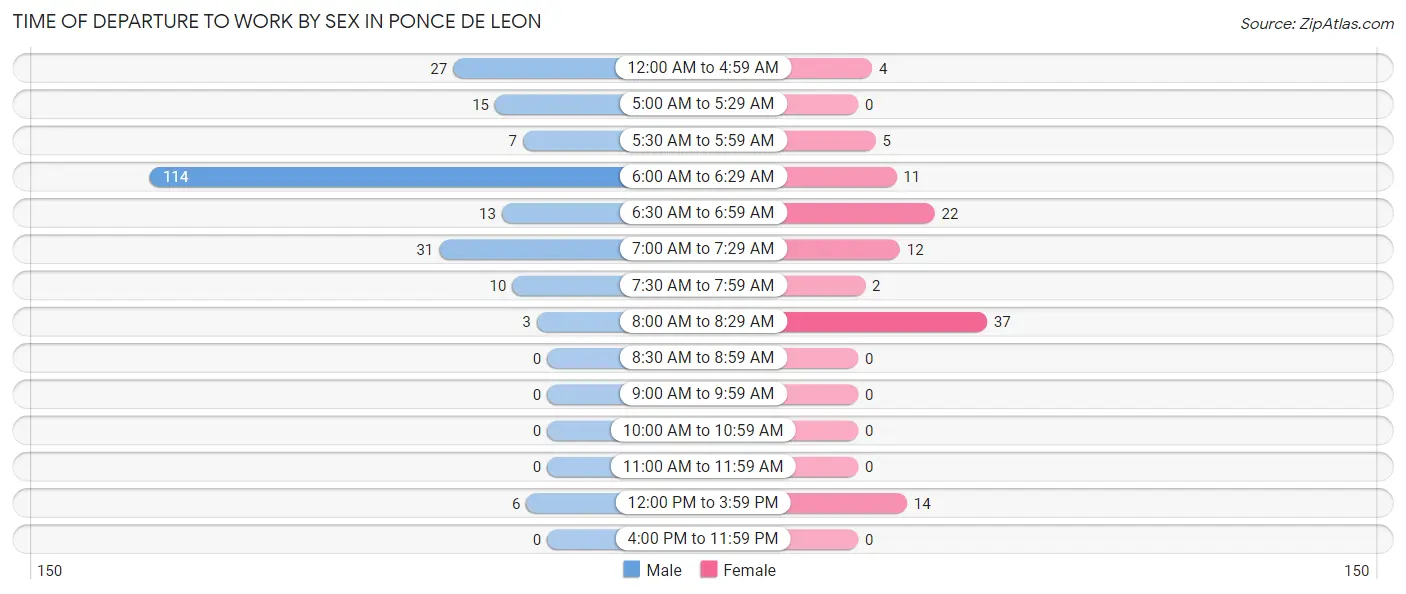
| Time of Departure | Male | Female |
| 12:00 AM to 4:59 AM | 27 (11.9%) | 4 (3.7%) |
| 5:00 AM to 5:29 AM | 15 (6.6%) | 0 (0.0%) |
| 5:30 AM to 5:59 AM | 7 (3.1%) | 5 (4.7%) |
| 6:00 AM to 6:29 AM | 114 (50.4%) | 11 (10.3%) |
| 6:30 AM to 6:59 AM | 13 (5.8%) | 22 (20.6%) |
| 7:00 AM to 7:29 AM | 31 (13.7%) | 12 (11.2%) |
| 7:30 AM to 7:59 AM | 10 (4.4%) | 2 (1.9%) |
| 8:00 AM to 8:29 AM | 3 (1.3%) | 37 (34.6%) |
| 8:30 AM to 8:59 AM | 0 (0.0%) | 0 (0.0%) |
| 9:00 AM to 9:59 AM | 0 (0.0%) | 0 (0.0%) |
| 10:00 AM to 10:59 AM | 0 (0.0%) | 0 (0.0%) |
| 11:00 AM to 11:59 AM | 0 (0.0%) | 0 (0.0%) |
| 12:00 PM to 3:59 PM | 6 (2.6%) | 14 (13.1%) |
| 4:00 PM to 11:59 PM | 0 (0.0%) | 0 (0.0%) |
| Total | 226 (100.0%) | 107 (100.0%) |
Housing Occupancy in Ponce De Leon
Occupancy by Ownership in Ponce De Leon
Of the total 217 dwellings in Ponce De Leon, owner-occupied units account for 171 (78.8%), while renter-occupied units make up 46 (21.2%).
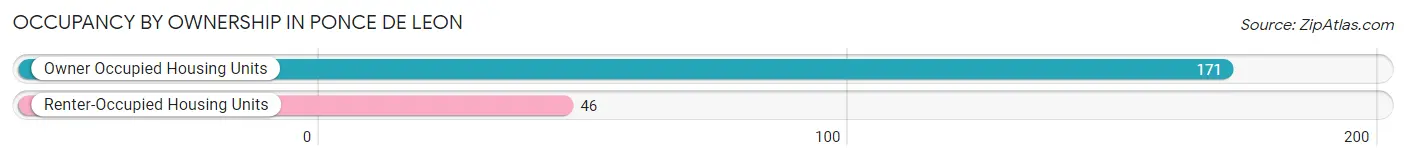
| Occupancy | # Housing Units | % Housing Units |
| Owner Occupied Housing Units | 171 | 78.8% |
| Renter-Occupied Housing Units | 46 | 21.2% |
| Total Occupied Housing Units | 217 | 100.0% |
Occupancy by Household Size in Ponce De Leon
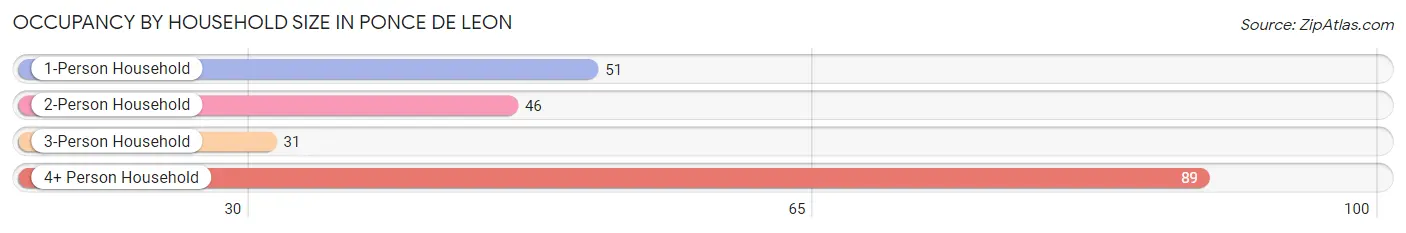
| Household Size | # Housing Units | % Housing Units |
| 1-Person Household | 51 | 23.5% |
| 2-Person Household | 46 | 21.2% |
| 3-Person Household | 31 | 14.3% |
| 4+ Person Household | 89 | 41.0% |
| Total Housing Units | 217 | 100.0% |
Occupancy by Ownership by Household Size in Ponce De Leon
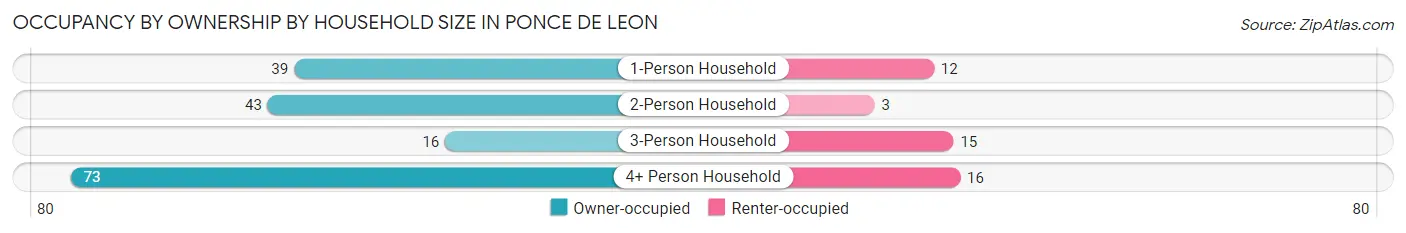
| Household Size | Owner-occupied | Renter-occupied |
| 1-Person Household | 39 (76.5%) | 12 (23.5%) |
| 2-Person Household | 43 (93.5%) | 3 (6.5%) |
| 3-Person Household | 16 (51.6%) | 15 (48.4%) |
| 4+ Person Household | 73 (82.0%) | 16 (18.0%) |
| Total Housing Units | 171 (78.8%) | 46 (21.2%) |
Occupancy by Educational Attainment in Ponce De Leon
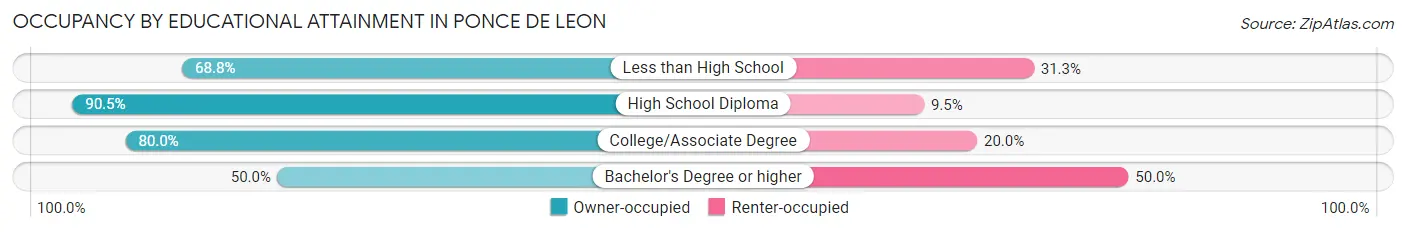
| Household Size | Owner-occupied | Renter-occupied |
| Less than High School | 22 (68.8%) | 10 (31.2%) |
| High School Diploma | 86 (90.5%) | 9 (9.5%) |
| College/Associate Degree | 48 (80.0%) | 12 (20.0%) |
| Bachelor's Degree or higher | 15 (50.0%) | 15 (50.0%) |
Occupancy by Age of Householder in Ponce De Leon
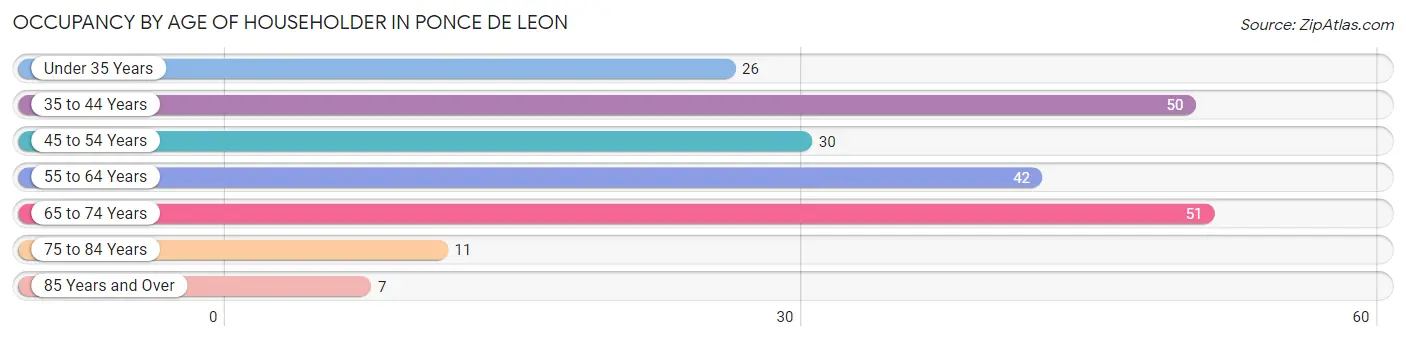
| Age Bracket | # Households | % Households |
| Under 35 Years | 26 | 12.0% |
| 35 to 44 Years | 50 | 23.0% |
| 45 to 54 Years | 30 | 13.8% |
| 55 to 64 Years | 42 | 19.4% |
| 65 to 74 Years | 51 | 23.5% |
| 75 to 84 Years | 11 | 5.1% |
| 85 Years and Over | 7 | 3.2% |
| Total | 217 | 100.0% |
Housing Finances in Ponce De Leon
Median Income by Occupancy in Ponce De Leon
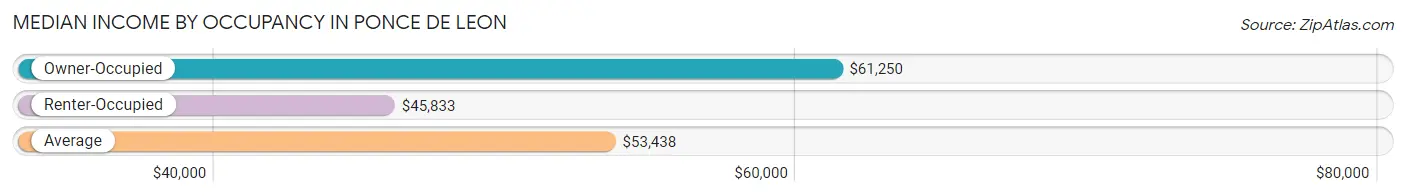
| Occupancy Type | # Households | Median Income |
| Owner-Occupied | 171 (78.8%) | $61,250 |
| Renter-Occupied | 46 (21.2%) | $45,833 |
| Average | 217 (100.0%) | $53,438 |
Occupancy by Householder Income Bracket in Ponce De Leon
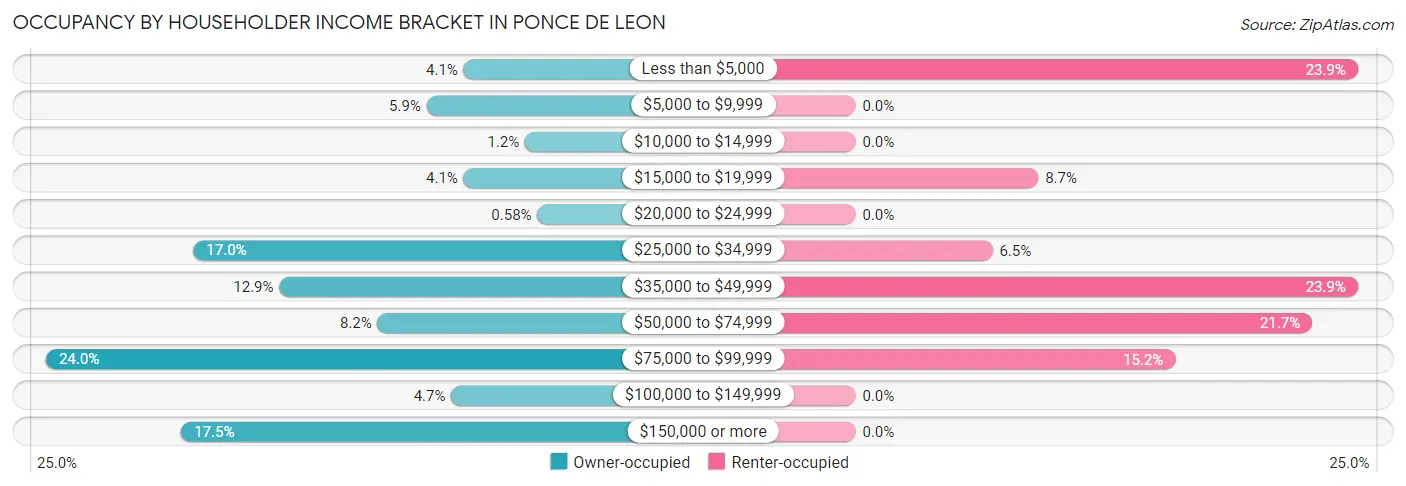
| Income Bracket | Owner-occupied | Renter-occupied |
| Less than $5,000 | 7 (4.1%) | 11 (23.9%) |
| $5,000 to $9,999 | 10 (5.9%) | 0 (0.0%) |
| $10,000 to $14,999 | 2 (1.2%) | 0 (0.0%) |
| $15,000 to $19,999 | 7 (4.1%) | 4 (8.7%) |
| $20,000 to $24,999 | 1 (0.6%) | 0 (0.0%) |
| $25,000 to $34,999 | 29 (17.0%) | 3 (6.5%) |
| $35,000 to $49,999 | 22 (12.9%) | 11 (23.9%) |
| $50,000 to $74,999 | 14 (8.2%) | 10 (21.7%) |
| $75,000 to $99,999 | 41 (24.0%) | 7 (15.2%) |
| $100,000 to $149,999 | 8 (4.7%) | 0 (0.0%) |
| $150,000 or more | 30 (17.5%) | 0 (0.0%) |
| Total | 171 (100.0%) | 46 (100.0%) |
Monthly Housing Cost Tiers in Ponce De Leon
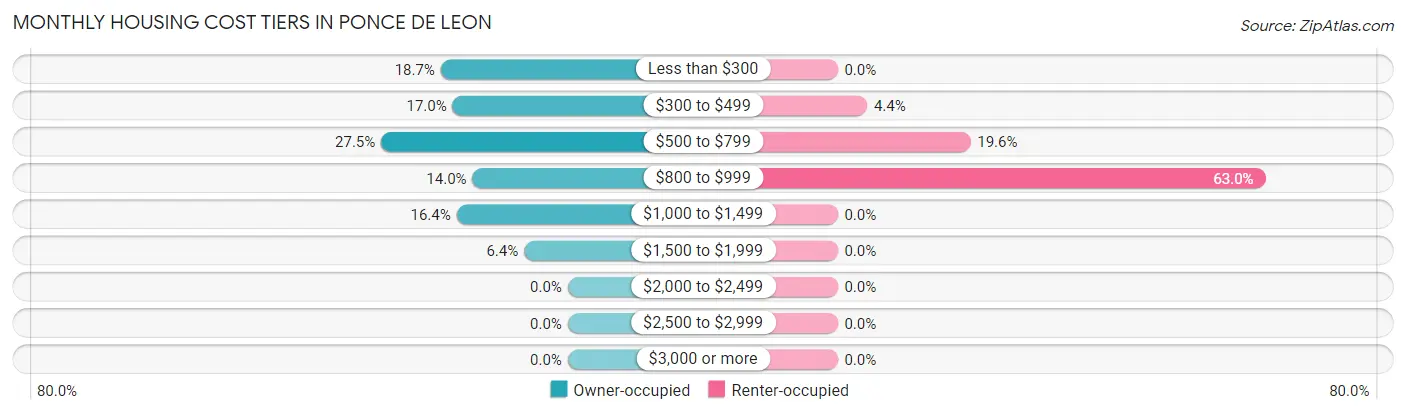
| Monthly Cost | Owner-occupied | Renter-occupied |
| Less than $300 | 32 (18.7%) | 0 (0.0%) |
| $300 to $499 | 29 (17.0%) | 2 (4.3%) |
| $500 to $799 | 47 (27.5%) | 9 (19.6%) |
| $800 to $999 | 24 (14.0%) | 29 (63.0%) |
| $1,000 to $1,499 | 28 (16.4%) | 0 (0.0%) |
| $1,500 to $1,999 | 11 (6.4%) | 0 (0.0%) |
| $2,000 to $2,499 | 0 (0.0%) | 0 (0.0%) |
| $2,500 to $2,999 | 0 (0.0%) | 0 (0.0%) |
| $3,000 or more | 0 (0.0%) | 0 (0.0%) |
| Total | 171 (100.0%) | 46 (100.0%) |
Physical Housing Characteristics in Ponce De Leon
Housing Structures in Ponce De Leon
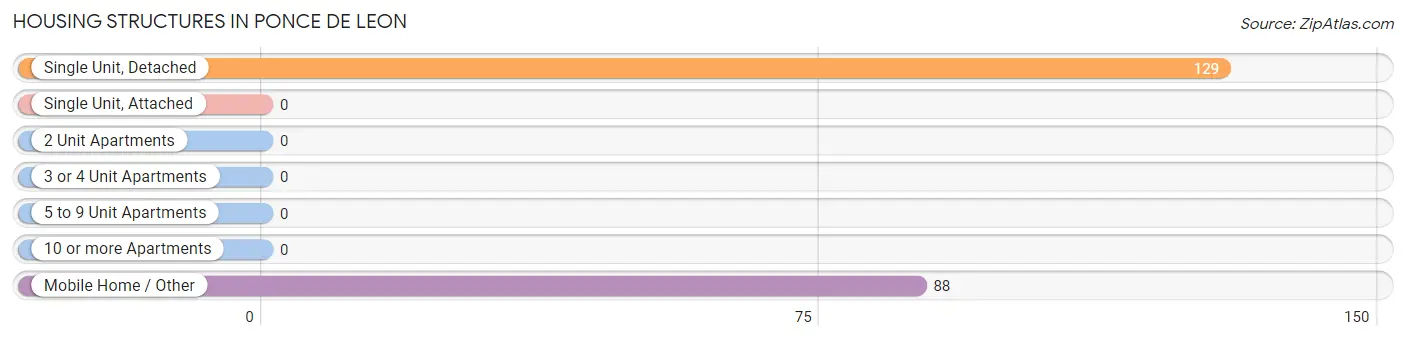
| Structure Type | # Housing Units | % Housing Units |
| Single Unit, Detached | 129 | 59.5% |
| Single Unit, Attached | 0 | 0.0% |
| 2 Unit Apartments | 0 | 0.0% |
| 3 or 4 Unit Apartments | 0 | 0.0% |
| 5 to 9 Unit Apartments | 0 | 0.0% |
| 10 or more Apartments | 0 | 0.0% |
| Mobile Home / Other | 88 | 40.6% |
| Total | 217 | 100.0% |
Housing Structures by Occupancy in Ponce De Leon
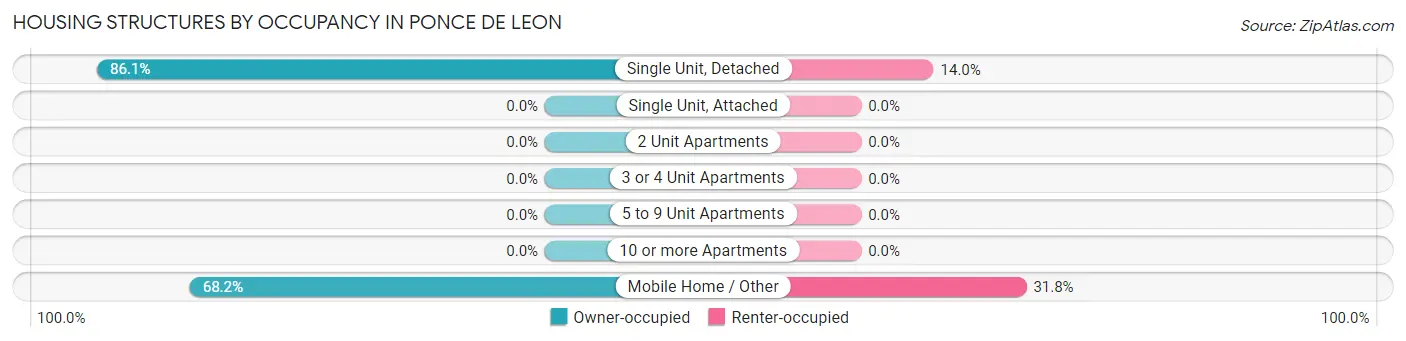
| Structure Type | Owner-occupied | Renter-occupied |
| Single Unit, Detached | 111 (86.1%) | 18 (14.0%) |
| Single Unit, Attached | 0 (0.0%) | 0 (0.0%) |
| 2 Unit Apartments | 0 (0.0%) | 0 (0.0%) |
| 3 or 4 Unit Apartments | 0 (0.0%) | 0 (0.0%) |
| 5 to 9 Unit Apartments | 0 (0.0%) | 0 (0.0%) |
| 10 or more Apartments | 0 (0.0%) | 0 (0.0%) |
| Mobile Home / Other | 60 (68.2%) | 28 (31.8%) |
| Total | 171 (78.8%) | 46 (21.2%) |
Housing Structures by Number of Rooms in Ponce De Leon
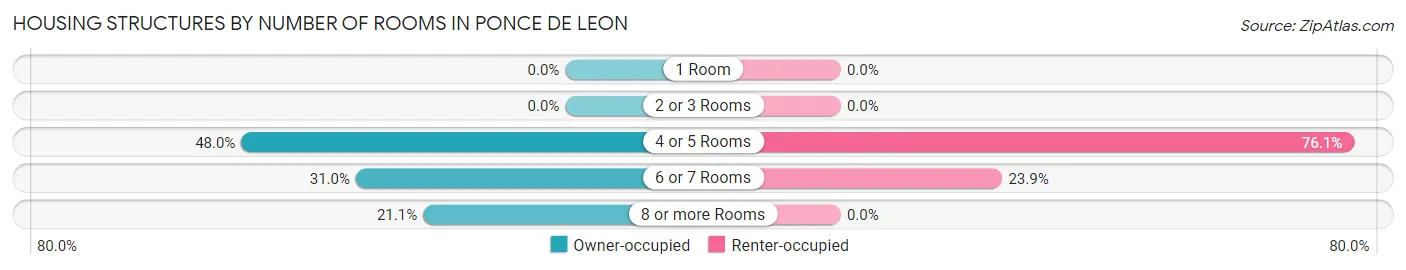
| Number of Rooms | Owner-occupied | Renter-occupied |
| 1 Room | 0 (0.0%) | 0 (0.0%) |
| 2 or 3 Rooms | 0 (0.0%) | 0 (0.0%) |
| 4 or 5 Rooms | 82 (47.9%) | 35 (76.1%) |
| 6 or 7 Rooms | 53 (31.0%) | 11 (23.9%) |
| 8 or more Rooms | 36 (21.0%) | 0 (0.0%) |
| Total | 171 (100.0%) | 46 (100.0%) |
Housing Structure by Heating Type in Ponce De Leon
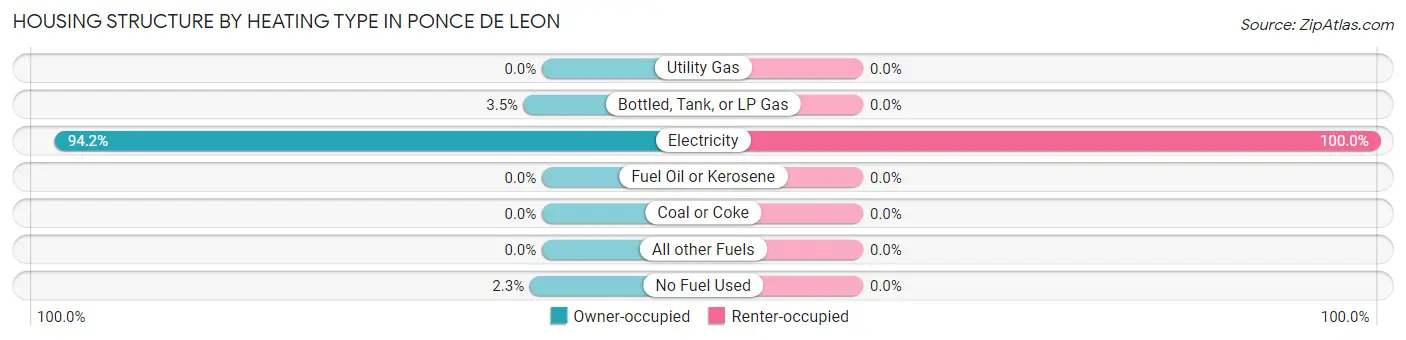
| Heating Type | Owner-occupied | Renter-occupied |
| Utility Gas | 0 (0.0%) | 0 (0.0%) |
| Bottled, Tank, or LP Gas | 6 (3.5%) | 0 (0.0%) |
| Electricity | 161 (94.2%) | 46 (100.0%) |
| Fuel Oil or Kerosene | 0 (0.0%) | 0 (0.0%) |
| Coal or Coke | 0 (0.0%) | 0 (0.0%) |
| All other Fuels | 0 (0.0%) | 0 (0.0%) |
| No Fuel Used | 4 (2.3%) | 0 (0.0%) |
| Total | 171 (100.0%) | 46 (100.0%) |
Household Vehicle Usage in Ponce De Leon
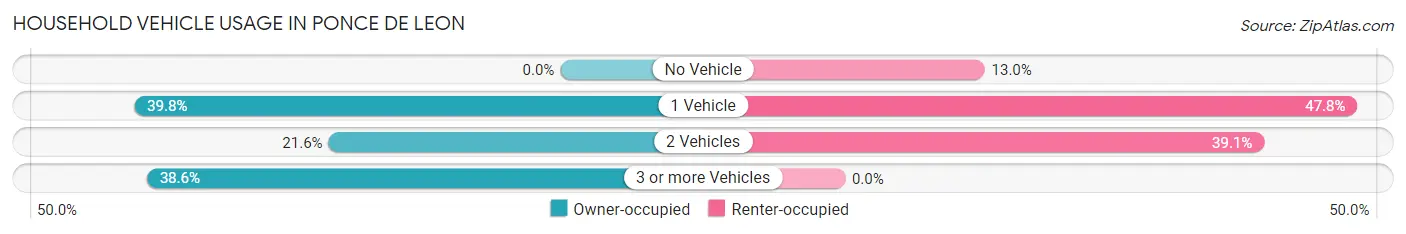
| Vehicles per Household | Owner-occupied | Renter-occupied |
| No Vehicle | 0 (0.0%) | 6 (13.0%) |
| 1 Vehicle | 68 (39.8%) | 22 (47.8%) |
| 2 Vehicles | 37 (21.6%) | 18 (39.1%) |
| 3 or more Vehicles | 66 (38.6%) | 0 (0.0%) |
| Total | 171 (100.0%) | 46 (100.0%) |
Real Estate & Mortgages in Ponce De Leon
Real Estate and Mortgage Overview in Ponce De Leon
| Characteristic | Without Mortgage | With Mortgage |
| Housing Units | 108 | 63 |
| Median Property Value | $82,000 | $128,900 |
| Median Household Income | - | - |
| Monthly Housing Costs | $413 | $0 |
| Real Estate Taxes | - | - |
Property Value by Mortgage Status in Ponce De Leon
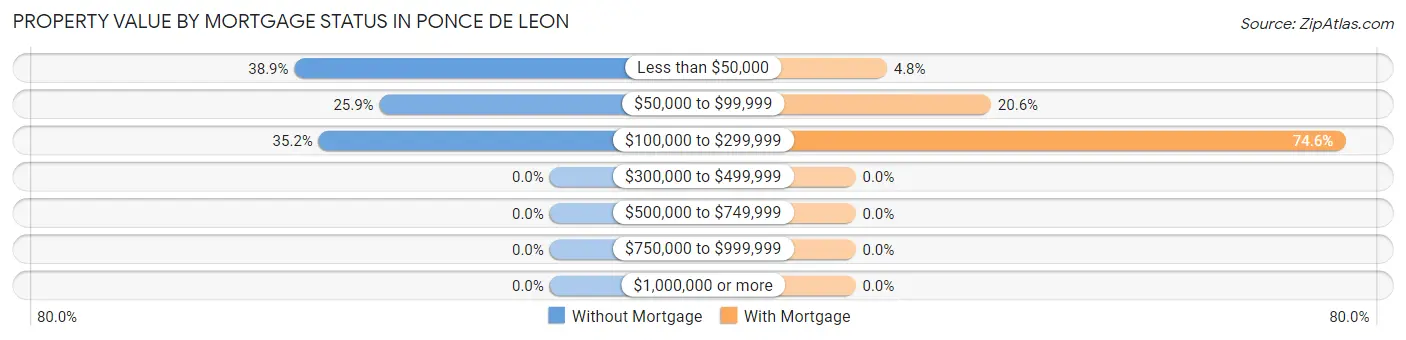
| Property Value | Without Mortgage | With Mortgage |
| Less than $50,000 | 42 (38.9%) | 3 (4.8%) |
| $50,000 to $99,999 | 28 (25.9%) | 13 (20.6%) |
| $100,000 to $299,999 | 38 (35.2%) | 47 (74.6%) |
| $300,000 to $499,999 | 0 (0.0%) | 0 (0.0%) |
| $500,000 to $749,999 | 0 (0.0%) | 0 (0.0%) |
| $750,000 to $999,999 | 0 (0.0%) | 0 (0.0%) |
| $1,000,000 or more | 0 (0.0%) | 0 (0.0%) |
| Total | 108 (100.0%) | 63 (100.0%) |
Household Income by Mortgage Status in Ponce De Leon
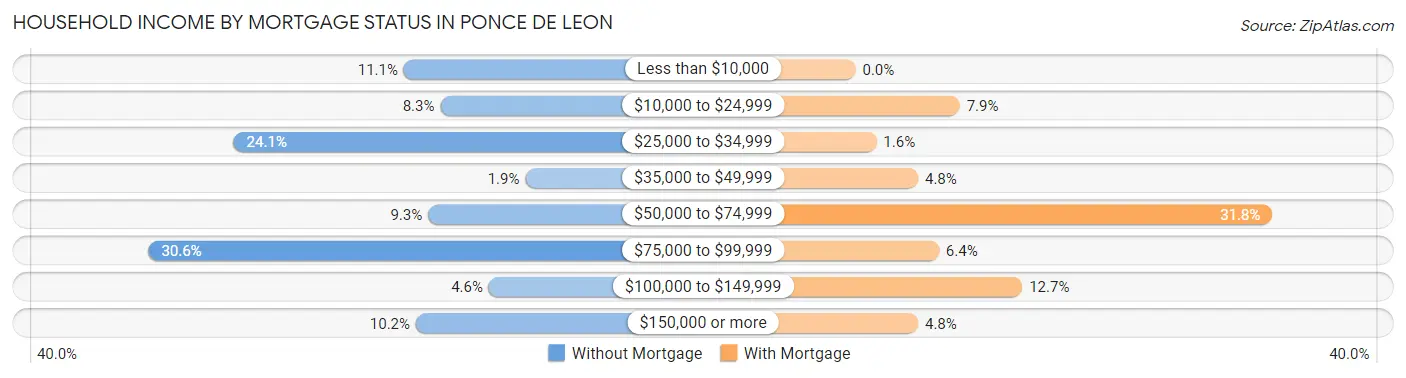
| Household Income | Without Mortgage | With Mortgage |
| Less than $10,000 | 12 (11.1%) | 0 (0.0%) |
| $10,000 to $24,999 | 9 (8.3%) | 5 (7.9%) |
| $25,000 to $34,999 | 26 (24.1%) | 1 (1.6%) |
| $35,000 to $49,999 | 2 (1.8%) | 3 (4.8%) |
| $50,000 to $74,999 | 10 (9.3%) | 20 (31.8%) |
| $75,000 to $99,999 | 33 (30.6%) | 4 (6.4%) |
| $100,000 to $149,999 | 5 (4.6%) | 8 (12.7%) |
| $150,000 or more | 11 (10.2%) | 3 (4.8%) |
| Total | 108 (100.0%) | 63 (100.0%) |
Property Value to Household Income Ratio in Ponce De Leon
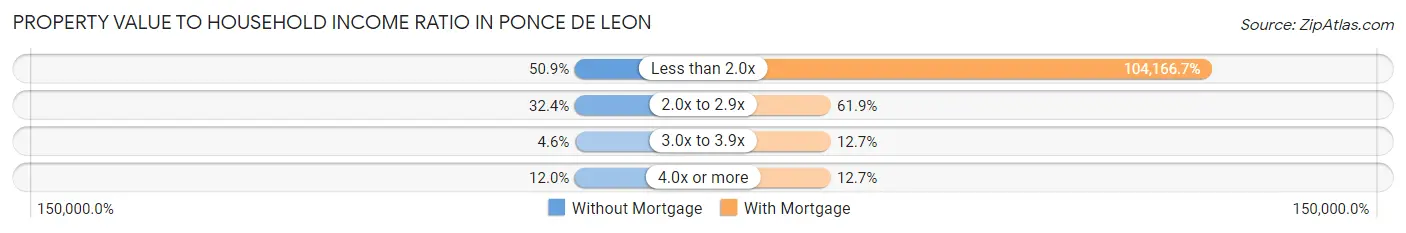
| Value-to-Income Ratio | Without Mortgage | With Mortgage |
| Less than 2.0x | 55 (50.9%) | 65,625 (104,166.7%) |
| 2.0x to 2.9x | 35 (32.4%) | 39 (61.9%) |
| 3.0x to 3.9x | 5 (4.6%) | 8 (12.7%) |
| 4.0x or more | 13 (12.0%) | 8 (12.7%) |
| Total | 108 (100.0%) | 63 (100.0%) |
Real Estate Taxes by Mortgage Status in Ponce De Leon
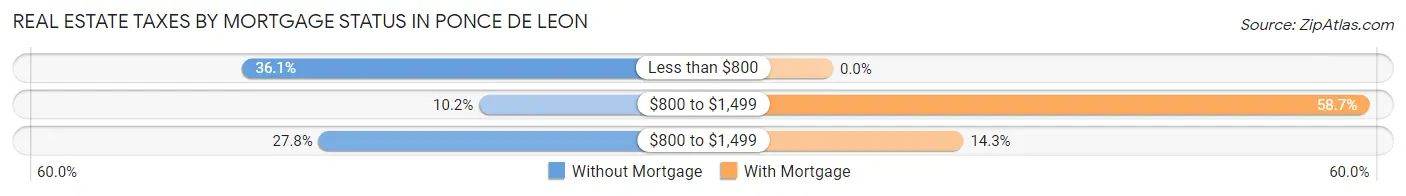
| Property Taxes | Without Mortgage | With Mortgage |
| Less than $800 | 39 (36.1%) | 0 (0.0%) |
| $800 to $1,499 | 11 (10.2%) | 37 (58.7%) |
| $800 to $1,499 | 30 (27.8%) | 9 (14.3%) |
| Total | 108 (100.0%) | 63 (100.0%) |
Health & Disability in Ponce De Leon
Health Insurance Coverage by Age in Ponce De Leon
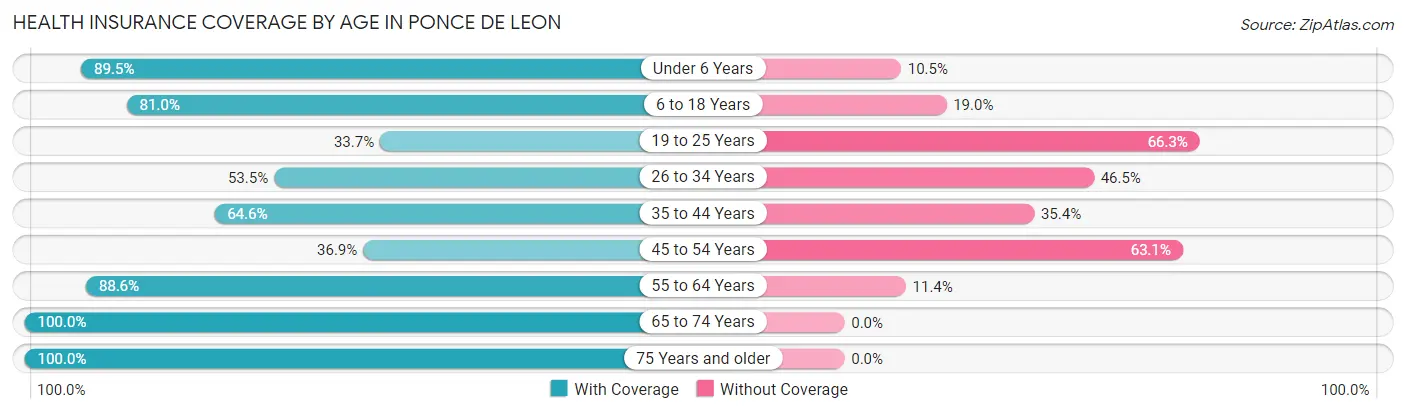
| Age Bracket | With Coverage | Without Coverage |
| Under 6 Years | 68 (89.5%) | 8 (10.5%) |
| 6 to 18 Years | 98 (81.0%) | 23 (19.0%) |
| 19 to 25 Years | 56 (33.7%) | 110 (66.3%) |
| 26 to 34 Years | 23 (53.5%) | 20 (46.5%) |
| 35 to 44 Years | 53 (64.6%) | 29 (35.4%) |
| 45 to 54 Years | 52 (36.9%) | 89 (63.1%) |
| 55 to 64 Years | 62 (88.6%) | 8 (11.4%) |
| 65 to 74 Years | 55 (100.0%) | 0 (0.0%) |
| 75 Years and older | 21 (100.0%) | 0 (0.0%) |
| Total | 488 (63.0%) | 287 (37.0%) |
Health Insurance Coverage by Citizenship Status in Ponce De Leon
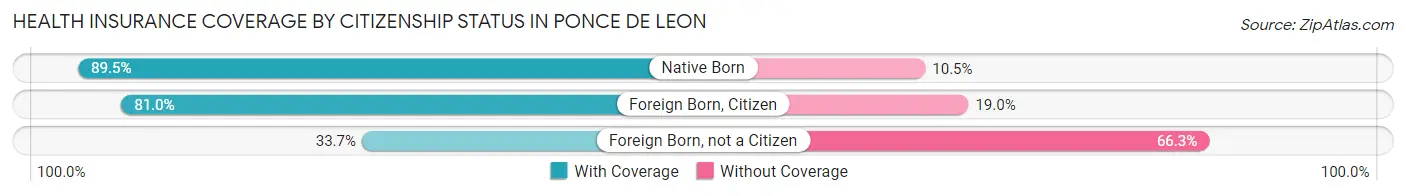
| Citizenship Status | With Coverage | Without Coverage |
| Native Born | 68 (89.5%) | 8 (10.5%) |
| Foreign Born, Citizen | 98 (81.0%) | 23 (19.0%) |
| Foreign Born, not a Citizen | 56 (33.7%) | 110 (66.3%) |
Health Insurance Coverage by Household Income in Ponce De Leon
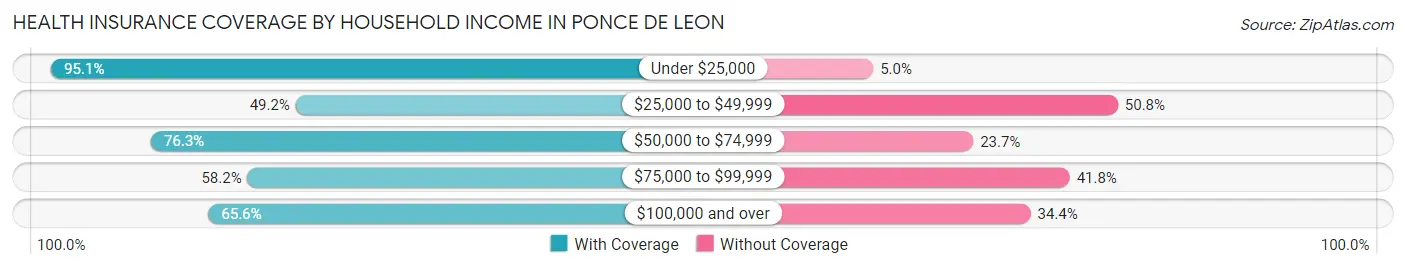
| Household Income | With Coverage | Without Coverage |
| Under $25,000 | 96 (95.1%) | 5 (5.0%) |
| $25,000 to $49,999 | 125 (49.2%) | 129 (50.8%) |
| $50,000 to $74,999 | 29 (76.3%) | 9 (23.7%) |
| $75,000 to $99,999 | 99 (58.2%) | 71 (41.8%) |
| $100,000 and over | 139 (65.6%) | 73 (34.4%) |
Public vs Private Health Insurance Coverage by Age in Ponce De Leon
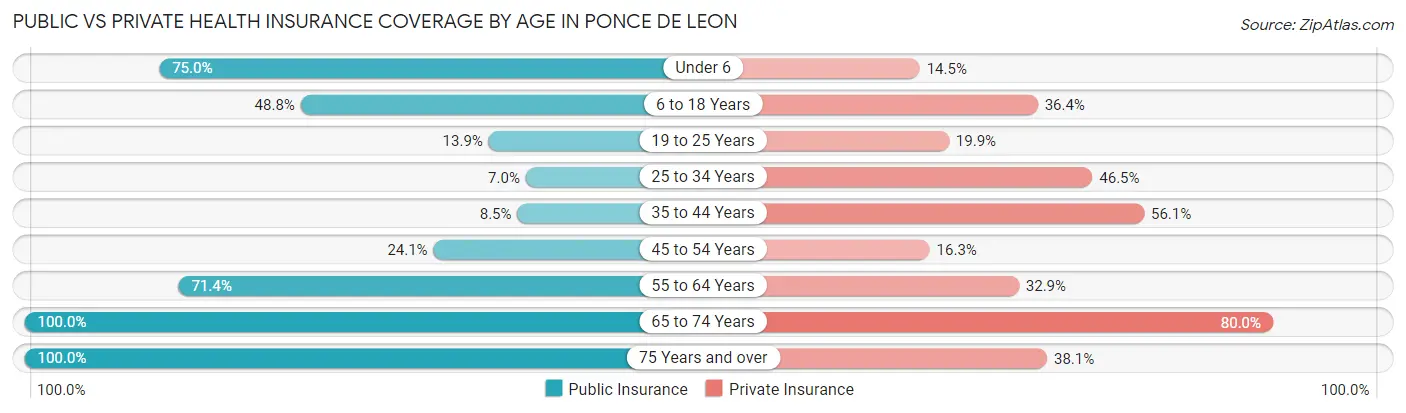
| Age Bracket | Public Insurance | Private Insurance |
| Under 6 | 57 (75.0%) | 11 (14.5%) |
| 6 to 18 Years | 59 (48.8%) | 44 (36.4%) |
| 19 to 25 Years | 23 (13.9%) | 33 (19.9%) |
| 25 to 34 Years | 3 (7.0%) | 20 (46.5%) |
| 35 to 44 Years | 7 (8.5%) | 46 (56.1%) |
| 45 to 54 Years | 34 (24.1%) | 23 (16.3%) |
| 55 to 64 Years | 50 (71.4%) | 23 (32.9%) |
| 65 to 74 Years | 55 (100.0%) | 44 (80.0%) |
| 75 Years and over | 21 (100.0%) | 8 (38.1%) |
| Total | 309 (39.9%) | 252 (32.5%) |
Disability Status by Sex by Age in Ponce De Leon
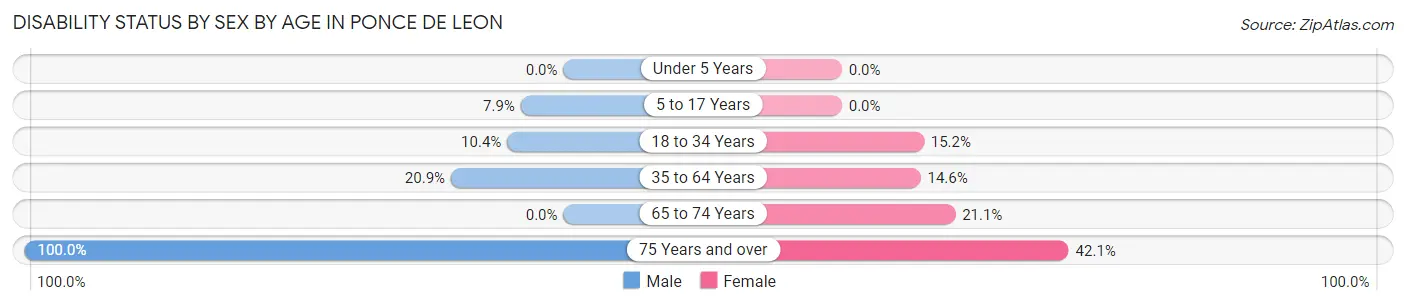
| Age Bracket | Male | Female |
| Under 5 Years | 0 (0.0%) | 0 (0.0%) |
| 5 to 17 Years | 8 (7.9%) | 0 (0.0%) |
| 18 to 34 Years | 17 (10.4%) | 7 (15.2%) |
| 35 to 64 Years | 24 (20.9%) | 26 (14.6%) |
| 65 to 74 Years | 0 (0.0%) | 8 (21.0%) |
| 75 Years and over | 2 (100.0%) | 8 (42.1%) |
Disability Class by Sex by Age in Ponce De Leon
Disability Class: Hearing Difficulty
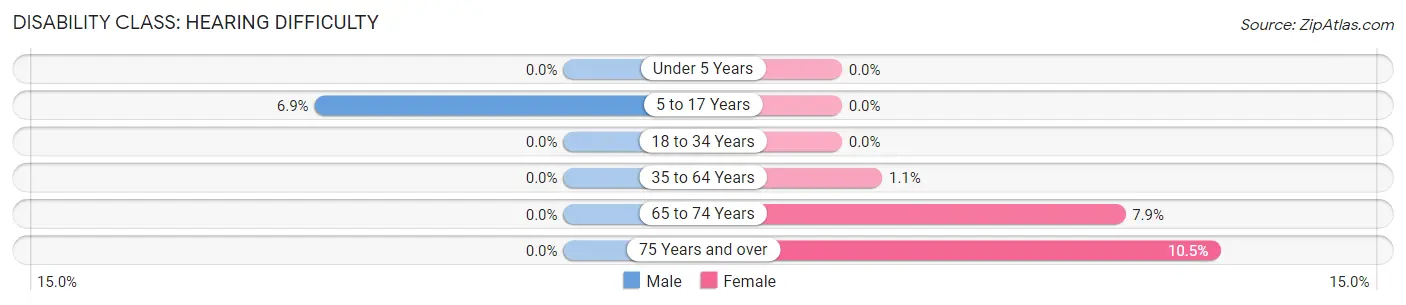
| Age Bracket | Male | Female |
| Under 5 Years | 0 (0.0%) | 0 (0.0%) |
| 5 to 17 Years | 7 (6.9%) | 0 (0.0%) |
| 18 to 34 Years | 0 (0.0%) | 0 (0.0%) |
| 35 to 64 Years | 0 (0.0%) | 2 (1.1%) |
| 65 to 74 Years | 0 (0.0%) | 3 (7.9%) |
| 75 Years and over | 0 (0.0%) | 2 (10.5%) |
Disability Class: Vision Difficulty
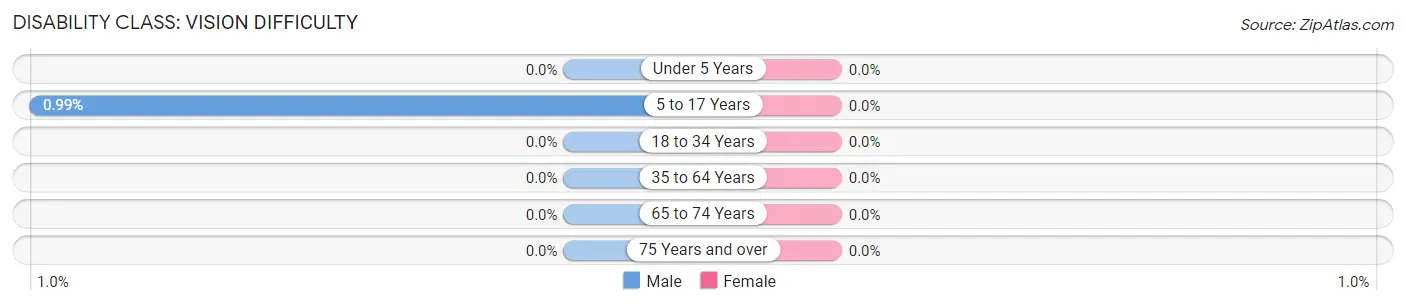
| Age Bracket | Male | Female |
| Under 5 Years | 0 (0.0%) | 0 (0.0%) |
| 5 to 17 Years | 1 (1.0%) | 0 (0.0%) |
| 18 to 34 Years | 0 (0.0%) | 0 (0.0%) |
| 35 to 64 Years | 0 (0.0%) | 0 (0.0%) |
| 65 to 74 Years | 0 (0.0%) | 0 (0.0%) |
| 75 Years and over | 0 (0.0%) | 0 (0.0%) |
Disability Class: Cognitive Difficulty
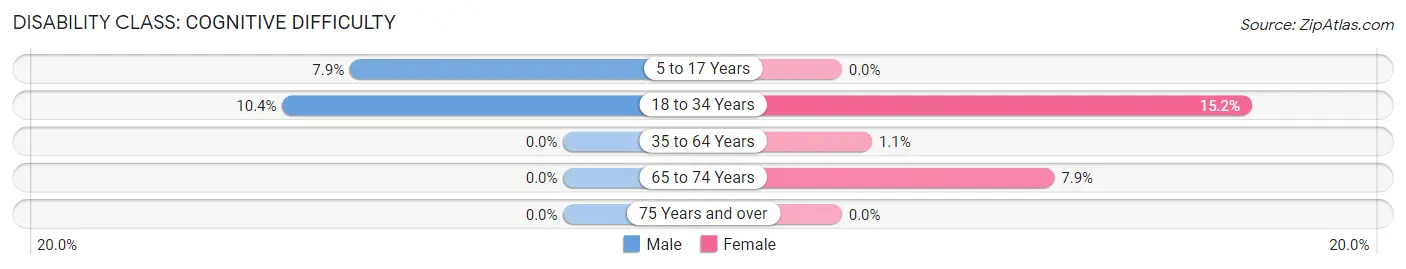
| Age Bracket | Male | Female |
| 5 to 17 Years | 8 (7.9%) | 0 (0.0%) |
| 18 to 34 Years | 17 (10.4%) | 7 (15.2%) |
| 35 to 64 Years | 0 (0.0%) | 2 (1.1%) |
| 65 to 74 Years | 0 (0.0%) | 3 (7.9%) |
| 75 Years and over | 0 (0.0%) | 0 (0.0%) |
Disability Class: Ambulatory Difficulty
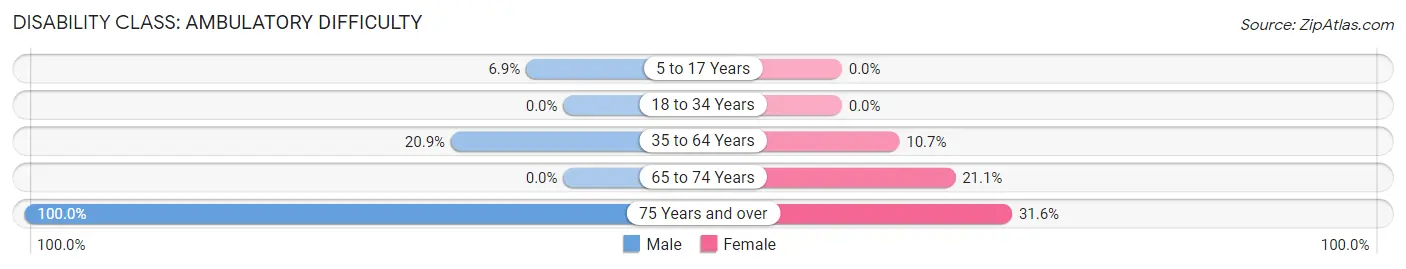
| Age Bracket | Male | Female |
| 5 to 17 Years | 7 (6.9%) | 0 (0.0%) |
| 18 to 34 Years | 0 (0.0%) | 0 (0.0%) |
| 35 to 64 Years | 24 (20.9%) | 19 (10.7%) |
| 65 to 74 Years | 0 (0.0%) | 8 (21.0%) |
| 75 Years and over | 2 (100.0%) | 6 (31.6%) |
Disability Class: Self-Care Difficulty
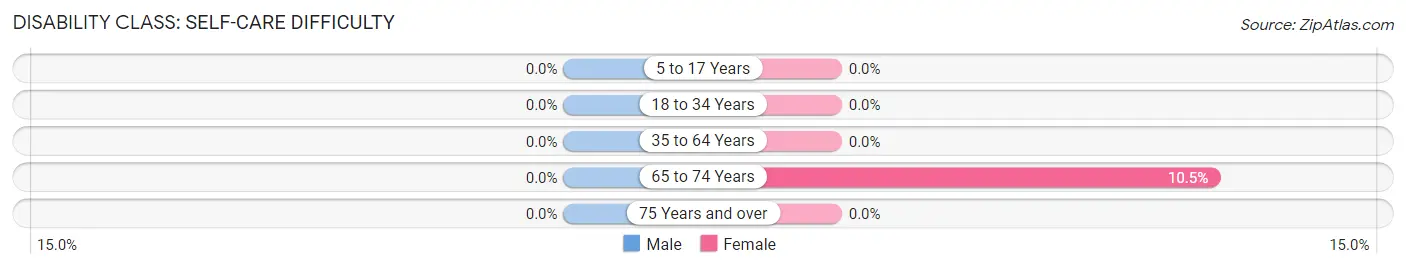
| Age Bracket | Male | Female |
| 5 to 17 Years | 0 (0.0%) | 0 (0.0%) |
| 18 to 34 Years | 0 (0.0%) | 0 (0.0%) |
| 35 to 64 Years | 0 (0.0%) | 0 (0.0%) |
| 65 to 74 Years | 0 (0.0%) | 4 (10.5%) |
| 75 Years and over | 0 (0.0%) | 0 (0.0%) |
Technology Access in Ponce De Leon
Computing Device Access in Ponce De Leon
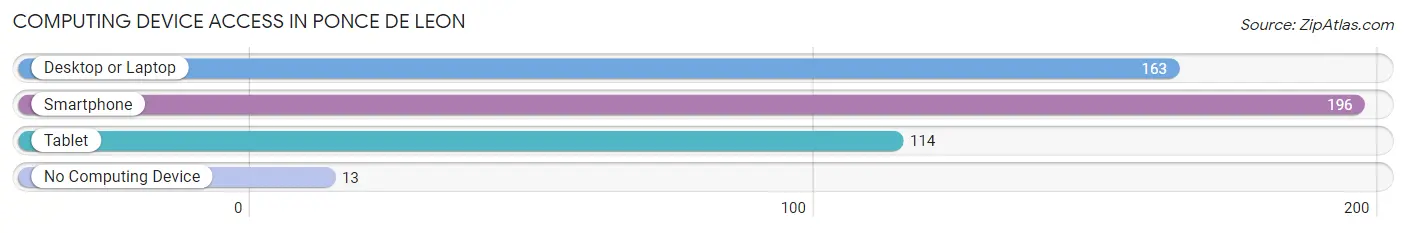
| Device Type | # Households | % Households |
| Desktop or Laptop | 163 | 75.1% |
| Smartphone | 196 | 90.3% |
| Tablet | 114 | 52.5% |
| No Computing Device | 13 | 6.0% |
| Total | 217 | 100.0% |
Internet Access in Ponce De Leon
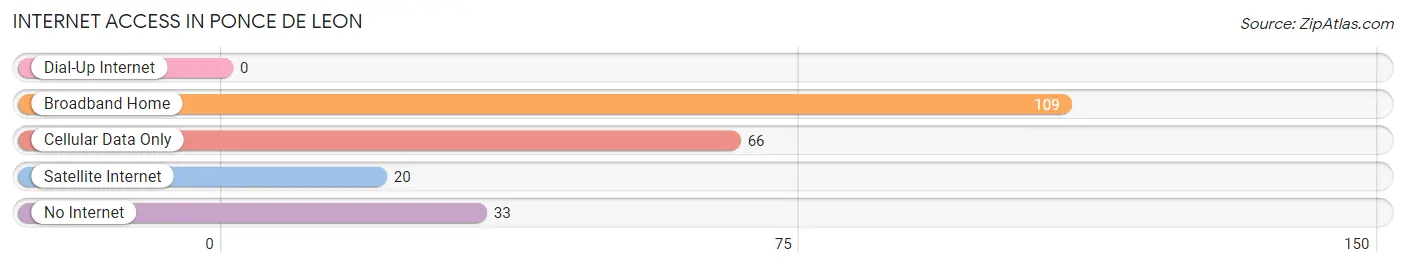
| Internet Type | # Households | % Households |
| Dial-Up Internet | 0 | 0.0% |
| Broadband Home | 109 | 50.2% |
| Cellular Data Only | 66 | 30.4% |
| Satellite Internet | 20 | 9.2% |
| No Internet | 33 | 15.2% |
| Total | 217 | 100.0% |
Ponce De Leon Summary
Ponce De Leon, Florida is a small town located in the panhandle of Florida, in Holmes County. It is situated on the banks of the Choctawhatchee River, and is home to a population of just over 500 people. The town was founded in 1882 by a group of settlers from Georgia, and was named after the Spanish explorer, Juan Ponce de Leon.
Geography
Ponce De Leon is located in the panhandle of Florida, in Holmes County. It is situated on the banks of the Choctawhatchee River, and is bordered by the towns of Bonifay, Westville, and Caryville. The town is located at an elevation of approximately 100 feet above sea level. The climate in Ponce De Leon is classified as humid subtropical, with hot, humid summers and mild winters. The average annual temperature is around 70 degrees Fahrenheit, with an average high of around 90 degrees in the summer months and an average low of around 50 degrees in the winter months.
Economy
The economy of Ponce De Leon is largely based on agriculture and forestry. The town is home to several farms, which produce a variety of crops, including corn, soybeans, cotton, and peanuts. The town is also home to several timber companies, which harvest timber from the surrounding forests. In addition to agriculture and forestry, the town is also home to several small businesses, including restaurants, convenience stores, and gas stations.
Demographics
As of the 2010 census, the population of Ponce De Leon was 514 people. The racial makeup of the town was 94.3% White, 3.3% African American, 0.4% Native American, 0.2% Asian, and 1.8% from other races. The median household income in Ponce De Leon was $30,938, and the median family income was $37,500. The per capita income in the town was $14,945.
History
Ponce De Leon was founded in 1882 by a group of settlers from Georgia. The town was named after the Spanish explorer, Juan Ponce de Leon, who is credited with discovering Florida in 1513. The town was originally a small farming community, and the main crops grown were cotton, corn, and peanuts. In the early 1900s, the town began to grow and develop, and several businesses were established, including a sawmill, a gristmill, and a general store. In the 1950s, the town began to decline, and many of the businesses closed. In the late 1990s, the town began to experience a resurgence, and several new businesses opened, including restaurants, convenience stores, and gas stations.
Today, Ponce De Leon is a small, rural town with a population of just over 500 people. The town is home to several farms, timber companies, and small businesses. The town is also home to several churches, a library, and a museum. The town is a popular destination for tourists, who come to enjoy the natural beauty of the area, as well as the many outdoor activities available, such as fishing, hunting, and camping.
Common Questions
What is Per Capita Income in Ponce De Leon?
Per Capita income in Ponce De Leon is $23,302.
What is the Median Family Income in Ponce De Leon?
Median Family Income in Ponce De Leon is $66,875.
What is the Median Household income in Ponce De Leon?
Median Household Income in Ponce De Leon is $53,438.
What is Inequality or Gini Index in Ponce De Leon?
Inequality or Gini Index in Ponce De Leon is 0.41.
What is the Total Population of Ponce De Leon?
Total Population of Ponce De Leon is 775.
What is the Total Male Population of Ponce De Leon?
Total Male Population of Ponce De Leon is 420.
What is the Total Female Population of Ponce De Leon?
Total Female Population of Ponce De Leon is 355.
What is the Ratio of Males per 100 Females in Ponce De Leon?
There are 118.31 Males per 100 Females in Ponce De Leon.
What is the Ratio of Females per 100 Males in Ponce De Leon?
There are 84.52 Females per 100 Males in Ponce De Leon.
What is the Median Population Age in Ponce De Leon?
Median Population Age in Ponce De Leon is 27.9 Years.
What is the Average Family Size in Ponce De Leon
Average Family Size in Ponce De Leon is 4.3 People.
What is the Average Household Size in Ponce De Leon
Average Household Size in Ponce De Leon is 3.6 People.
How Large is the Labor Force in Ponce De Leon?
There are 399 People in the Labor Forcein in Ponce De Leon.
What is the Percentage of People in the Labor Force in Ponce De Leon?
63.4% of People are in the Labor Force in Ponce De Leon.
What is the Unemployment Rate in Ponce De Leon?
Unemployment Rate in Ponce De Leon is 15.0%.