Paxton, FL Map & Demographics
Paxton Map
Paxton Overview
$25,383
PER CAPITA INCOME
$57,266
AVG FAMILY INCOME
$53,295
AVG HOUSEHOLD INCOME
23.9%
WAGE / INCOME GAP [ % ]
76.1¢/ $1
WAGE / INCOME GAP [ $ ]
0.40
INEQUALITY / GINI INDEX
583
TOTAL POPULATION
294
MALE POPULATION
289
FEMALE POPULATION
101.73
MALES / 100 FEMALES
98.30
FEMALES / 100 MALES
49.4
MEDIAN AGE
2.6
AVG FAMILY SIZE
2.3
AVG HOUSEHOLD SIZE
279
LABOR FORCE [ PEOPLE ]
52.7%
PERCENT IN LABOR FORCE
12.2%
UNEMPLOYMENT RATE
Paxton Area Codes
Income in Paxton
Income Overview in Paxton
Per Capita Income in Paxton is $25,383, while median incomes of families and households are $57,266 and $53,295 respectively.
| Characteristic | Number | Measure |
| Per Capita Income | 583 | $25,383 |
| Median Family Income | 189 | $57,266 |
| Mean Family Income | 189 | $65,248 |
| Median Household Income | 257 | $53,295 |
| Mean Household Income | 257 | $58,021 |
| Income Deficit | 189 | $0 |
| Wage / Income Gap (%) | 583 | 23.89% |
| Wage / Income Gap ($) | 583 | 76.11¢ per $1 |
| Gini / Inequality Index | 583 | 0.40 |
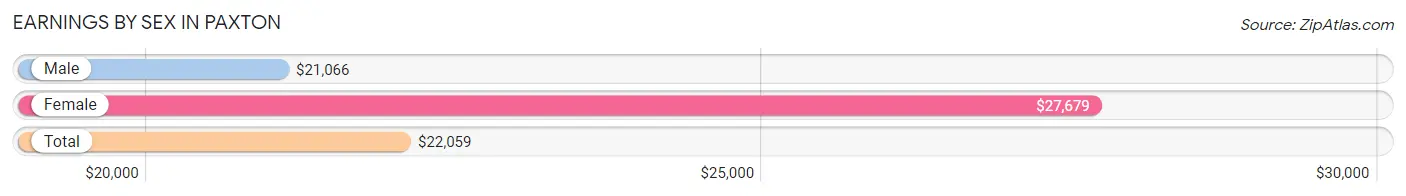
Earnings by Sex in Paxton
Average Earnings in Paxton are $22,059, $21,066 for men and $27,679 for women, a difference of 23.9%.
| Sex | Number | Average Earnings |
| Male | 171 (59.4%) | $21,066 |
| Female | 117 (40.6%) | $27,679 |
| Total | 288 (100.0%) | $22,059 |
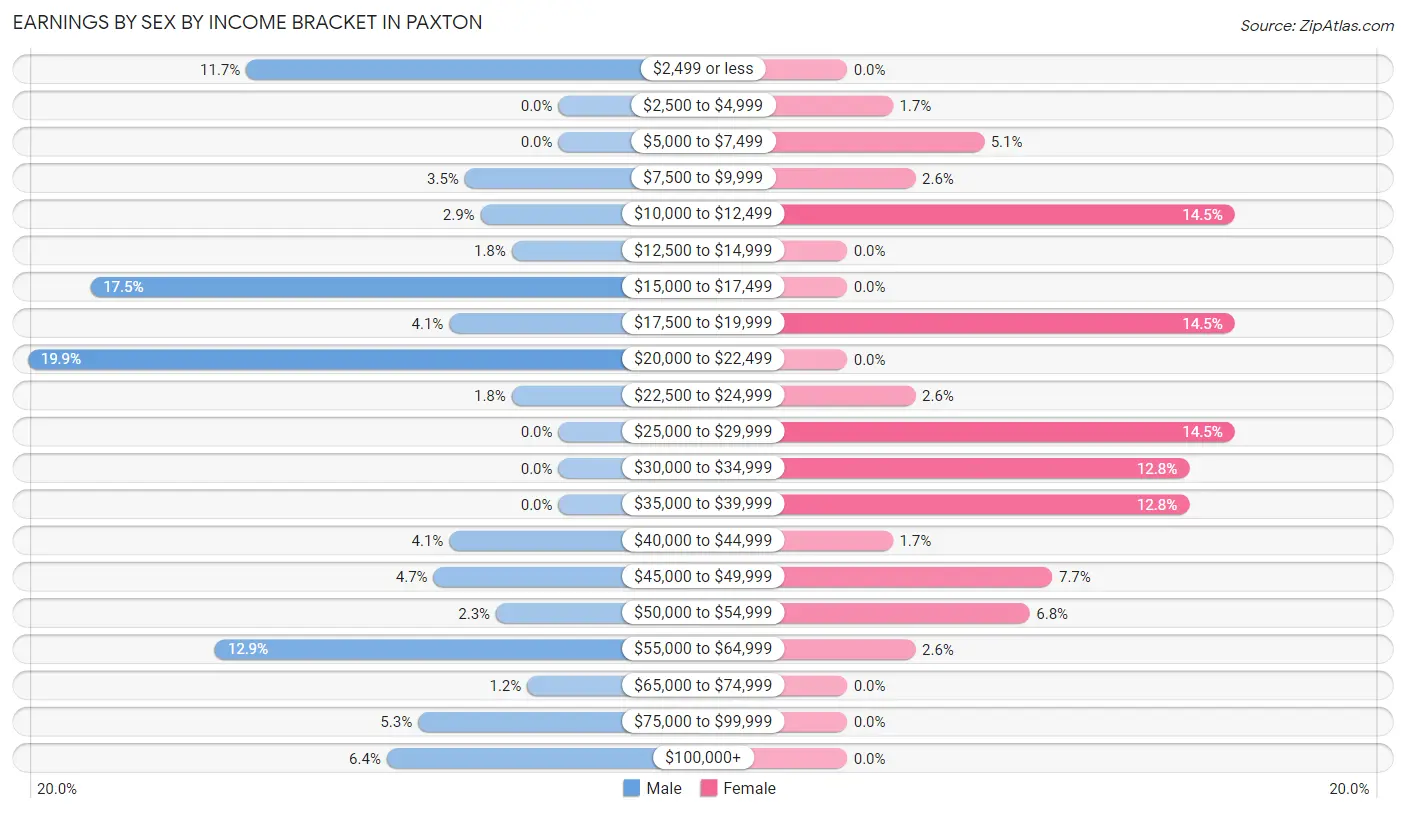
Earnings by Sex by Income Bracket in Paxton
The most common earnings brackets in Paxton are $20,000 to $22,499 for men (34 | 19.9%) and $10,000 to $12,499 for women (17 | 14.5%).
| Income | Male | Female |
| $2,499 or less | 20 (11.7%) | 0 (0.0%) |
| $2,500 to $4,999 | 0 (0.0%) | 2 (1.7%) |
| $5,000 to $7,499 | 0 (0.0%) | 6 (5.1%) |
| $7,500 to $9,999 | 6 (3.5%) | 3 (2.6%) |
| $10,000 to $12,499 | 5 (2.9%) | 17 (14.5%) |
| $12,500 to $14,999 | 3 (1.8%) | 0 (0.0%) |
| $15,000 to $17,499 | 30 (17.5%) | 0 (0.0%) |
| $17,500 to $19,999 | 7 (4.1%) | 17 (14.5%) |
| $20,000 to $22,499 | 34 (19.9%) | 0 (0.0%) |
| $22,500 to $24,999 | 3 (1.8%) | 3 (2.6%) |
| $25,000 to $29,999 | 0 (0.0%) | 17 (14.5%) |
| $30,000 to $34,999 | 0 (0.0%) | 15 (12.8%) |
| $35,000 to $39,999 | 0 (0.0%) | 15 (12.8%) |
| $40,000 to $44,999 | 7 (4.1%) | 2 (1.7%) |
| $45,000 to $49,999 | 8 (4.7%) | 9 (7.7%) |
| $50,000 to $54,999 | 4 (2.3%) | 8 (6.8%) |
| $55,000 to $64,999 | 22 (12.9%) | 3 (2.6%) |
| $65,000 to $74,999 | 2 (1.2%) | 0 (0.0%) |
| $75,000 to $99,999 | 9 (5.3%) | 0 (0.0%) |
| $100,000+ | 11 (6.4%) | 0 (0.0%) |
| Total | 171 (100.0%) | 117 (100.0%) |
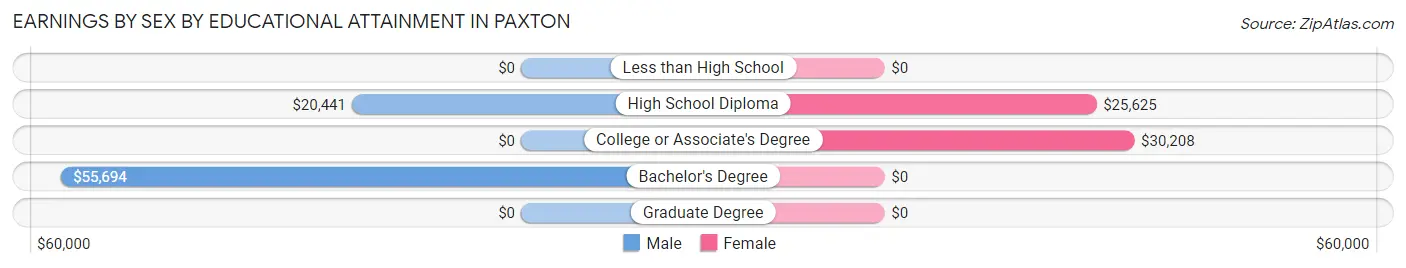
Earnings by Sex by Educational Attainment in Paxton
Average earnings in Paxton are $21,066 for men and $28,929 for women, a difference of 27.2%. Men with an educational attainment of bachelor's degree enjoy the highest average annual earnings of $55,694, while those with high school diploma education earn the least with $20,441. Women with an educational attainment of college or associate's degree earn the most with the average annual earnings of $30,208, while those with high school diploma education have the smallest earnings of $25,625.
| Educational Attainment | Male Income | Female Income |
| Less than High School | - | - |
| High School Diploma | $20,441 | $25,625 |
| College or Associate's Degree | - | - |
| Bachelor's Degree | $55,694 | $0 |
| Graduate Degree | - | - |
| Total | $21,066 | $28,929 |
Family Income in Paxton
Family Income Brackets in Paxton
According to the Paxton family income data, there are 62 families falling into the $50,000 to $74,999 income range, which is the most common income bracket and makes up 32.8% of all families.
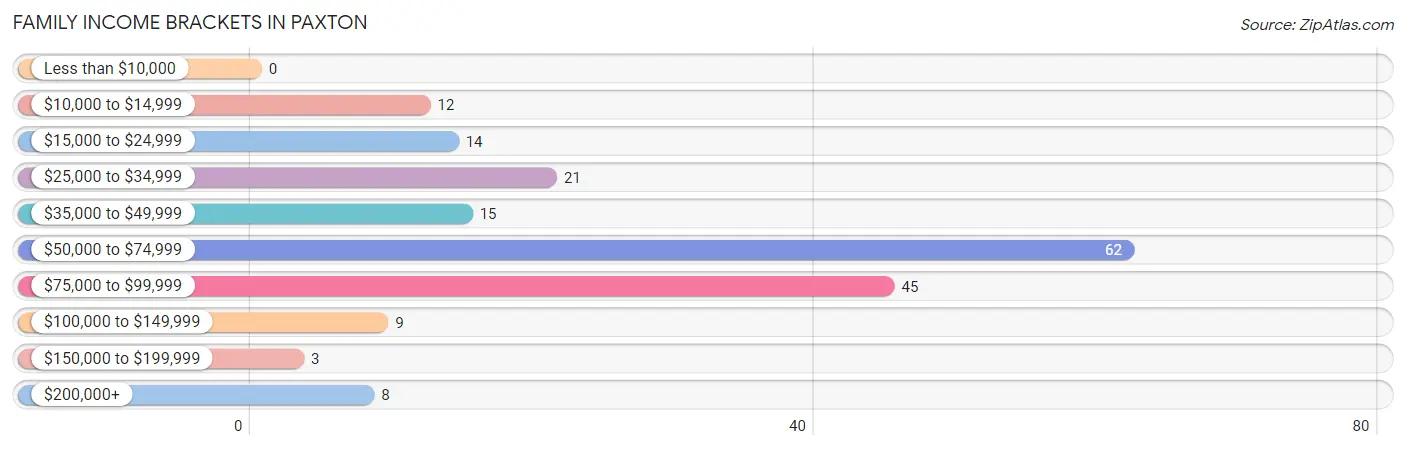
| Income Bracket | # Families | % Families |
| Less than $10,000 | 0 | 0.0% |
| $10,000 to $14,999 | 12 | 6.3% |
| $15,000 to $24,999 | 14 | 7.4% |
| $25,000 to $34,999 | 21 | 11.1% |
| $35,000 to $49,999 | 15 | 7.9% |
| $50,000 to $74,999 | 62 | 32.8% |
| $75,000 to $99,999 | 45 | 23.8% |
| $100,000 to $149,999 | 9 | 4.8% |
| $150,000 to $199,999 | 3 | 1.6% |
| $200,000+ | 8 | 4.2% |
Family Income by Famaliy Size in Paxton
3-person families (40 | 21.2%) account for the highest median family income in Paxton with $79,583 per family, while 3-person families (40 | 21.2%) have the highest median income of $26,528 per family member.
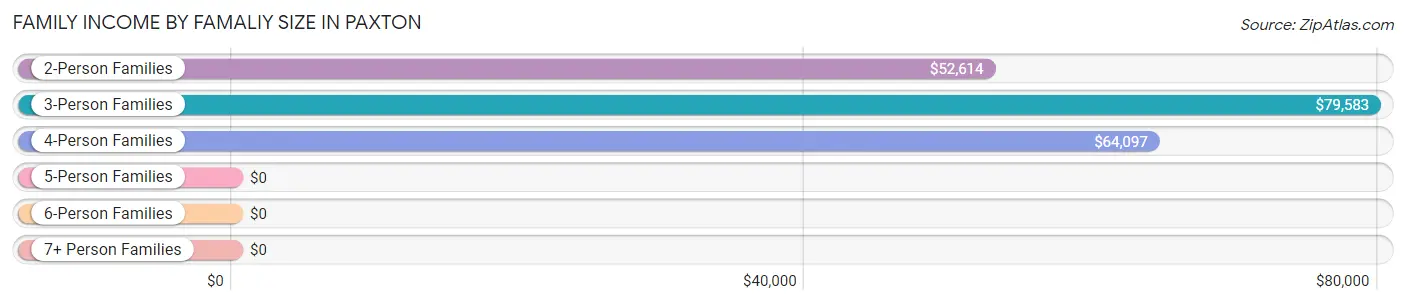
| Income Bracket | # Families | Median Income |
| 2-Person Families | 103 (54.5%) | $52,614 |
| 3-Person Families | 40 (21.2%) | $79,583 |
| 4-Person Families | 39 (20.6%) | $64,097 |
| 5-Person Families | 7 (3.7%) | $0 |
| 6-Person Families | 0 (0.0%) | $0 |
| 7+ Person Families | 0 (0.0%) | $0 |
| Total | 189 (100.0%) | $57,266 |
Family Income by Number of Earners in Paxton
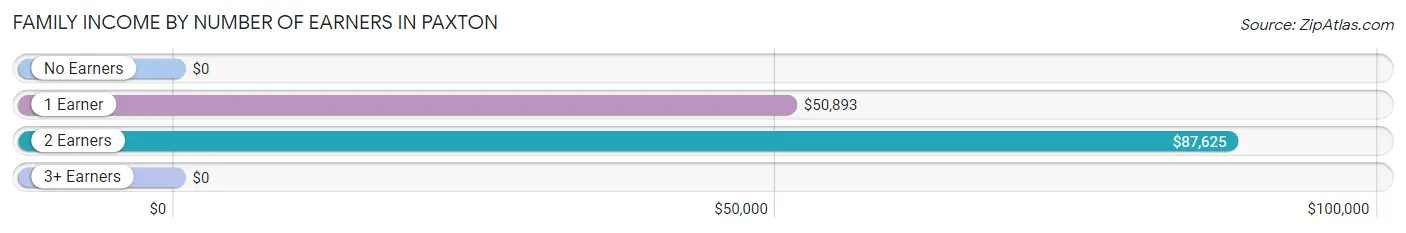
| Number of Earners | # Families | Median Income |
| No Earners | 41 (21.7%) | $0 |
| 1 Earner | 65 (34.4%) | $50,893 |
| 2 Earners | 65 (34.4%) | $87,625 |
| 3+ Earners | 18 (9.5%) | $0 |
| Total | 189 (100.0%) | $57,266 |
Household Income in Paxton
Household Income Brackets in Paxton
With 70 households falling in the category, the $50,000 to $74,999 income range is the most frequent in Paxton, accounting for 27.2% of all households. In contrast, only 6 households (2.3%) fall into the $150,000 to $199,999 income bracket, making it the least populous group.
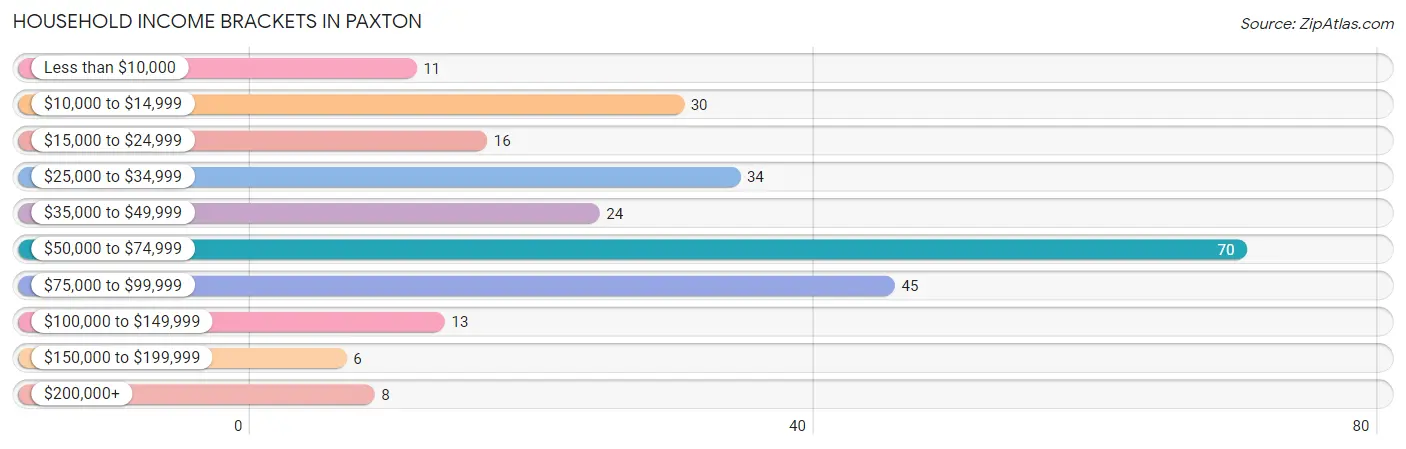
| Income Bracket | # Households | % Households |
| Less than $10,000 | 11 | 4.3% |
| $10,000 to $14,999 | 30 | 11.7% |
| $15,000 to $24,999 | 16 | 6.2% |
| $25,000 to $34,999 | 34 | 13.2% |
| $35,000 to $49,999 | 24 | 9.3% |
| $50,000 to $74,999 | 70 | 27.2% |
| $75,000 to $99,999 | 45 | 17.5% |
| $100,000 to $149,999 | 13 | 5.1% |
| $150,000 to $199,999 | 6 | 2.3% |
| $200,000+ | 8 | 3.1% |
Household Income by Householder Age in Paxton
The median household income in Paxton is $53,295, with the highest median household income of $63,819 found in the 45 to 64 years age bracket for the primary householder. A total of 135 households (52.5%) fall into this category.
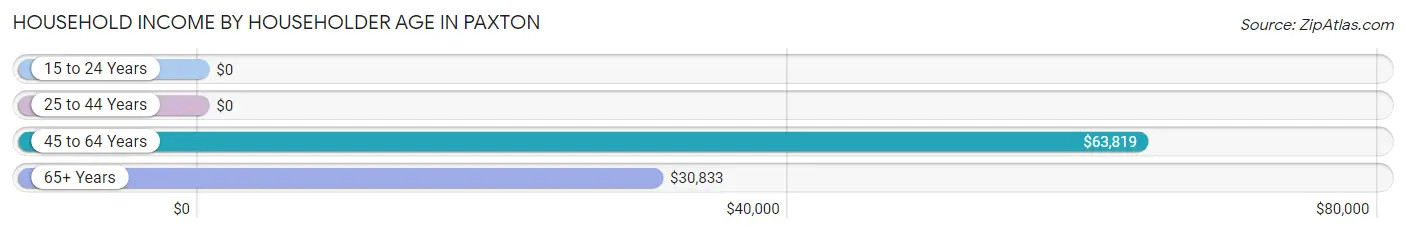
| Income Bracket | # Households | Median Income |
| 15 to 24 Years | 0 (0.0%) | $0 |
| 25 to 44 Years | 38 (14.8%) | $0 |
| 45 to 64 Years | 135 (52.5%) | $63,819 |
| 65+ Years | 84 (32.7%) | $30,833 |
| Total | 257 (100.0%) | $53,295 |
Poverty in Paxton
Income Below Poverty by Sex and Age in Paxton
With 12.5% poverty level for males and 8.2% for females among the residents of Paxton, under 5 year old males and 25 to 34 year old females are the most vulnerable to poverty, with 14 males (73.7%) and 10 females (52.6%) in their respective age groups living below the poverty level.
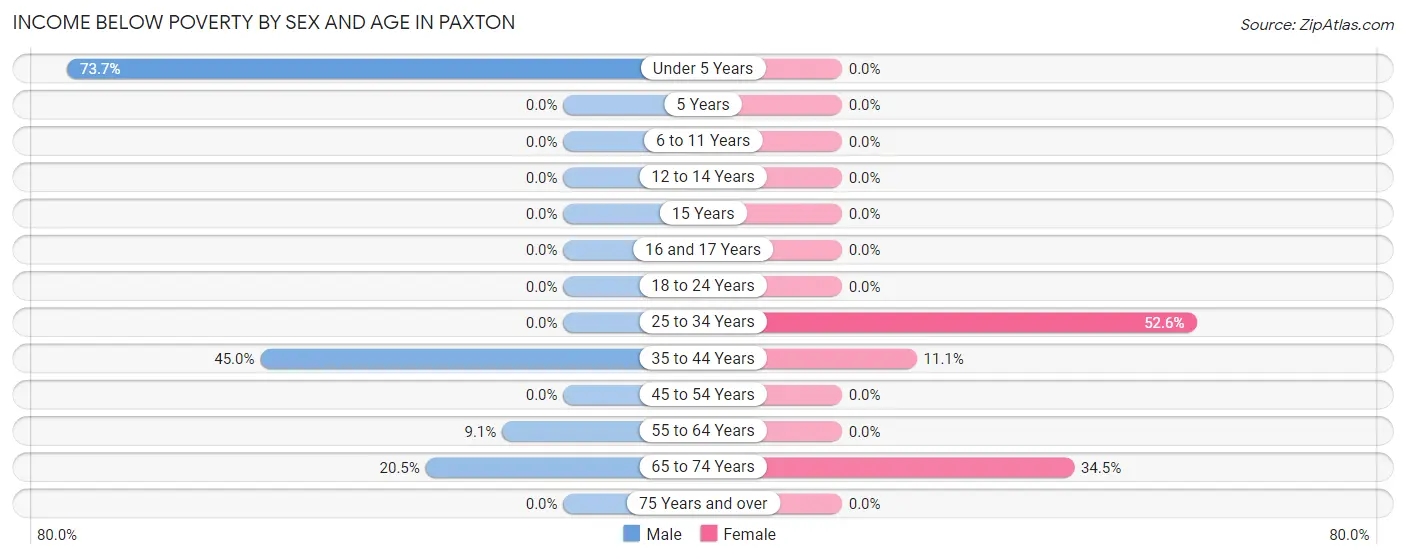
| Age Bracket | Male | Female |
| Under 5 Years | 14 (73.7%) | 0 (0.0%) |
| 5 Years | 0 (0.0%) | 0 (0.0%) |
| 6 to 11 Years | 0 (0.0%) | 0 (0.0%) |
| 12 to 14 Years | 0 (0.0%) | 0 (0.0%) |
| 15 Years | 0 (0.0%) | 0 (0.0%) |
| 16 and 17 Years | 0 (0.0%) | 0 (0.0%) |
| 18 to 24 Years | 0 (0.0%) | 0 (0.0%) |
| 25 to 34 Years | 0 (0.0%) | 10 (52.6%) |
| 35 to 44 Years | 9 (45.0%) | 3 (11.1%) |
| 45 to 54 Years | 0 (0.0%) | 0 (0.0%) |
| 55 to 64 Years | 4 (9.1%) | 0 (0.0%) |
| 65 to 74 Years | 9 (20.4%) | 10 (34.5%) |
| 75 Years and over | 0 (0.0%) | 0 (0.0%) |
| Total | 36 (12.5%) | 23 (8.2%) |
Income Above Poverty by Sex and Age in Paxton
According to the poverty statistics in Paxton, males aged 6 to 11 years and females aged 6 to 11 years are the age groups that are most secure financially, with 100.0% of males and 100.0% of females in these age groups living above the poverty line.
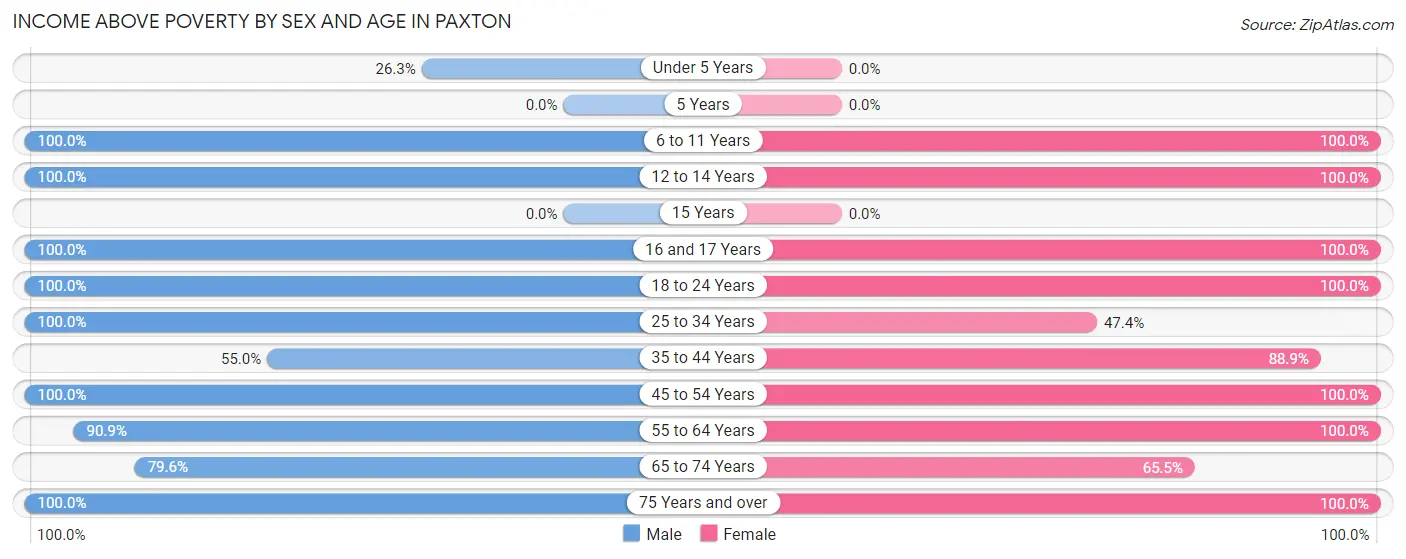
| Age Bracket | Male | Female |
| Under 5 Years | 5 (26.3%) | 0 (0.0%) |
| 5 Years | 0 (0.0%) | 0 (0.0%) |
| 6 to 11 Years | 4 (100.0%) | 5 (100.0%) |
| 12 to 14 Years | 4 (100.0%) | 9 (100.0%) |
| 15 Years | 0 (0.0%) | 0 (0.0%) |
| 16 and 17 Years | 7 (100.0%) | 20 (100.0%) |
| 18 to 24 Years | 7 (100.0%) | 18 (100.0%) |
| 25 to 34 Years | 47 (100.0%) | 9 (47.4%) |
| 35 to 44 Years | 11 (55.0%) | 24 (88.9%) |
| 45 to 54 Years | 70 (100.0%) | 53 (100.0%) |
| 55 to 64 Years | 40 (90.9%) | 63 (100.0%) |
| 65 to 74 Years | 35 (79.5%) | 19 (65.5%) |
| 75 Years and over | 23 (100.0%) | 38 (100.0%) |
| Total | 253 (87.5%) | 258 (91.8%) |
Income Below Poverty Among Married-Couple Families in Paxton
The poverty statistics for married-couple families in Paxton show that 8.2% or 10 of the total 122 families live below the poverty line. Families with no children have the highest poverty rate of 11.8%, comprising of 10 families. On the other hand, families with 1 or 2 children have the lowest poverty rate of 0.0%, which includes 0 families.
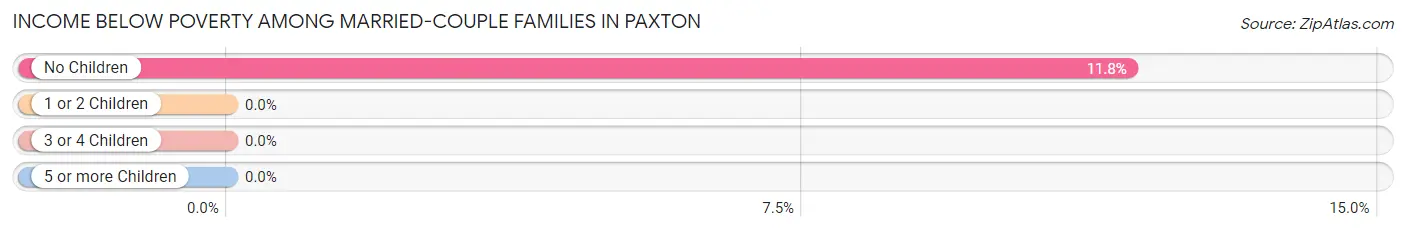
| Children | Above Poverty | Below Poverty |
| No Children | 75 (88.2%) | 10 (11.8%) |
| 1 or 2 Children | 37 (100.0%) | 0 (0.0%) |
| 3 or 4 Children | 0 (0.0%) | 0 (0.0%) |
| 5 or more Children | 0 (0.0%) | 0 (0.0%) |
| Total | 112 (91.8%) | 10 (8.2%) |
Income Below Poverty Among Single-Parent Households in Paxton
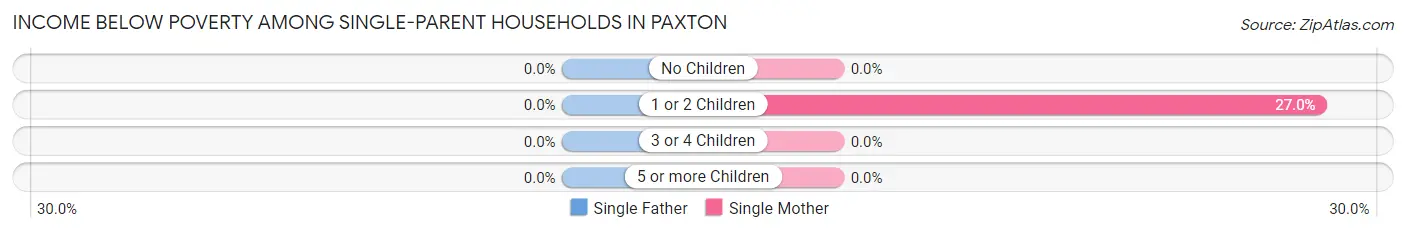
| Children | Single Father | Single Mother |
| No Children | 0 (0.0%) | 0 (0.0%) |
| 1 or 2 Children | 0 (0.0%) | 10 (27.0%) |
| 3 or 4 Children | 0 (0.0%) | 0 (0.0%) |
| 5 or more Children | 0 (0.0%) | 0 (0.0%) |
| Total | 0 (0.0%) | 10 (18.5%) |
Income Below Poverty Among Married-Couple vs Single-Parent Households in Paxton
The poverty data for Paxton shows that 10 of the married-couple family households (8.2%) and 10 of the single-parent households (14.9%) are living below the poverty level. Within the married-couple family households, those with no children have the highest poverty rate, with 10 households (11.8%) falling below the poverty line. Among the single-parent households, those with 1 or 2 children have the highest poverty rate, with 10 household (27.0%) living below poverty.
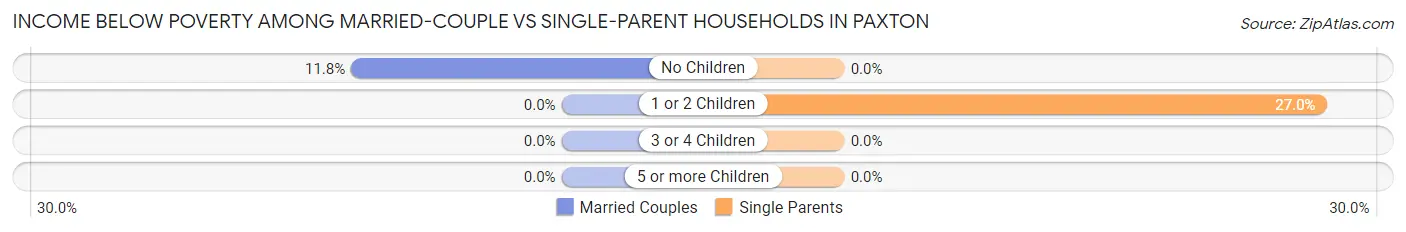
| Children | Married-Couple Families | Single-Parent Households |
| No Children | 10 (11.8%) | 0 (0.0%) |
| 1 or 2 Children | 0 (0.0%) | 10 (27.0%) |
| 3 or 4 Children | 0 (0.0%) | 0 (0.0%) |
| 5 or more Children | 0 (0.0%) | 0 (0.0%) |
| Total | 10 (8.2%) | 10 (14.9%) |
Race in Paxton
The most populous races in Paxton are White / Caucasian (490 | 84.1%), Hispanic or Latino (71 | 12.2%), and Two or more Races (71 | 12.2%).
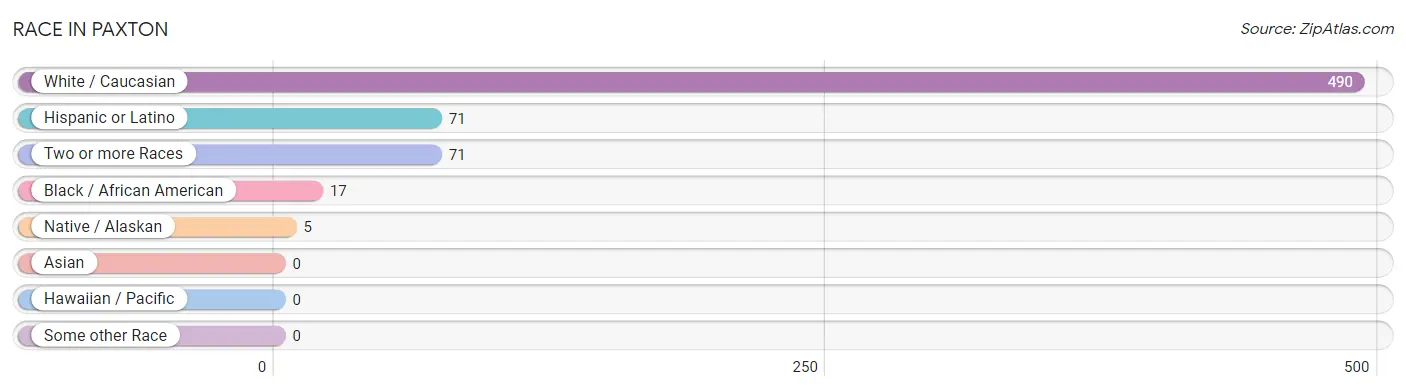
| Race | # Population | % Population |
| Asian | 0 | 0.0% |
| Black / African American | 17 | 2.9% |
| Hawaiian / Pacific | 0 | 0.0% |
| Hispanic or Latino | 71 | 12.2% |
| Native / Alaskan | 5 | 0.9% |
| White / Caucasian | 490 | 84.1% |
| Two or more Races | 71 | 12.2% |
| Some other Race | 0 | 0.0% |
| Total | 583 | 100.0% |
Ancestry in Paxton
The most populous ancestries reported in Paxton are Irish (78 | 13.4%), English (76 | 13.0%), Cuban (71 | 12.2%), American (46 | 7.9%), and German (35 | 6.0%), together accounting for 52.5% of all Paxton residents.
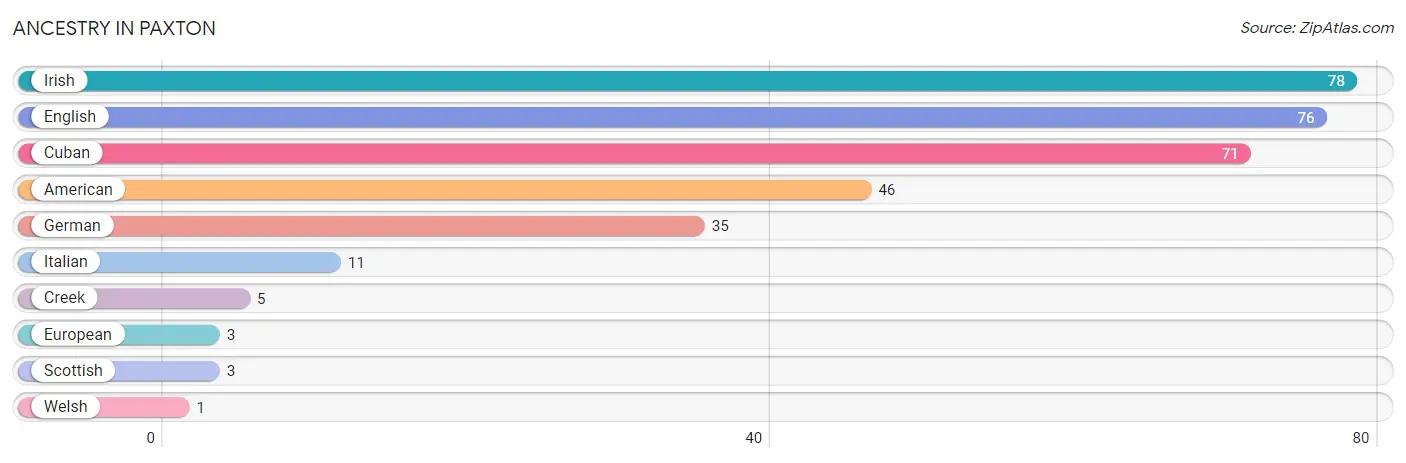
| Ancestry | # Population | % Population |
| American | 46 | 7.9% |
| Creek | 5 | 0.9% |
| Cuban | 71 | 12.2% |
| English | 76 | 13.0% |
| European | 3 | 0.5% |
| German | 35 | 6.0% |
| Irish | 78 | 13.4% |
| Italian | 11 | 1.9% |
| Scottish | 3 | 0.5% |
| Welsh | 1 | 0.2% | View All 10 Rows |
Immigrants in Paxton
The most numerous immigrant groups reported in Paxton came from Caribbean (71 | 12.2%), Cuba (71 | 12.2%), and Latin America (71 | 12.2%), together accounting for 36.5% of all Paxton residents.
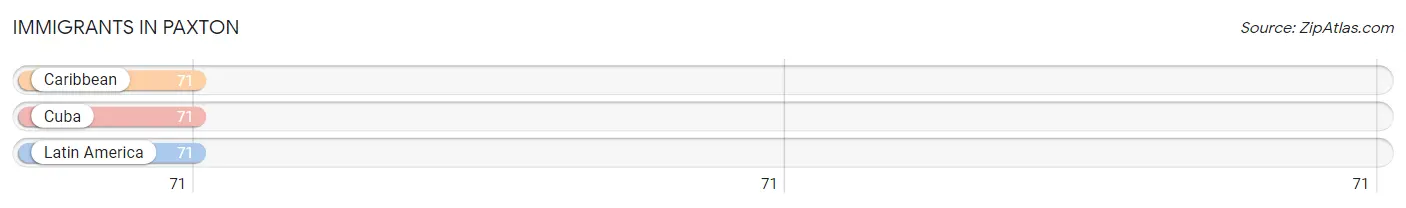
| Immigration Origin | # Population | % Population |
| Caribbean | 71 | 12.2% |
| Cuba | 71 | 12.2% |
| Latin America | 71 | 12.2% | View All 3 Rows |
Sex and Age in Paxton
Sex and Age in Paxton
The most populous age groups in Paxton are 45 to 49 Years (46 | 15.7%) for men and 60 to 64 Years (45 | 15.6%) for women.
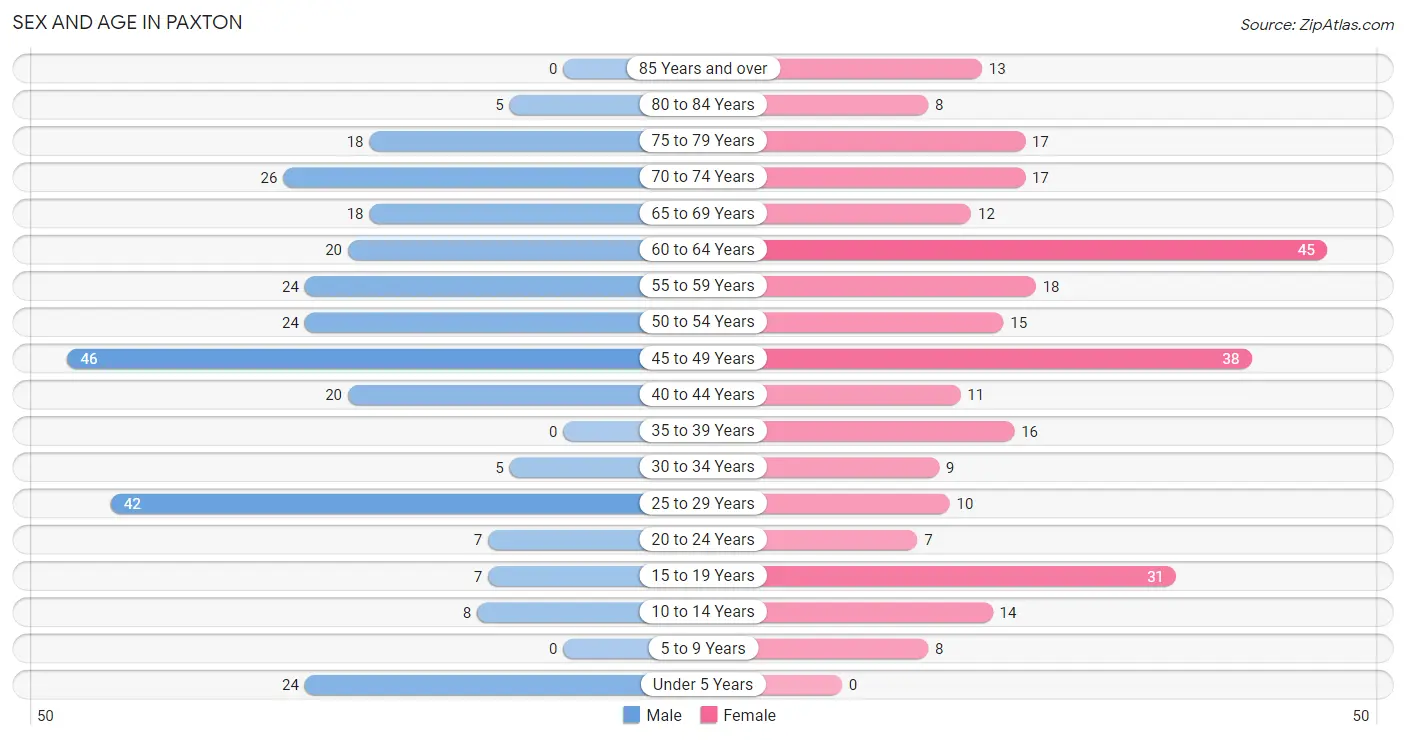
| Age Bracket | Male | Female |
| Under 5 Years | 24 (8.2%) | 0 (0.0%) |
| 5 to 9 Years | 0 (0.0%) | 8 (2.8%) |
| 10 to 14 Years | 8 (2.7%) | 14 (4.8%) |
| 15 to 19 Years | 7 (2.4%) | 31 (10.7%) |
| 20 to 24 Years | 7 (2.4%) | 7 (2.4%) |
| 25 to 29 Years | 42 (14.3%) | 10 (3.5%) |
| 30 to 34 Years | 5 (1.7%) | 9 (3.1%) |
| 35 to 39 Years | 0 (0.0%) | 16 (5.5%) |
| 40 to 44 Years | 20 (6.8%) | 11 (3.8%) |
| 45 to 49 Years | 46 (15.7%) | 38 (13.2%) |
| 50 to 54 Years | 24 (8.2%) | 15 (5.2%) |
| 55 to 59 Years | 24 (8.2%) | 18 (6.2%) |
| 60 to 64 Years | 20 (6.8%) | 45 (15.6%) |
| 65 to 69 Years | 18 (6.1%) | 12 (4.2%) |
| 70 to 74 Years | 26 (8.8%) | 17 (5.9%) |
| 75 to 79 Years | 18 (6.1%) | 17 (5.9%) |
| 80 to 84 Years | 5 (1.7%) | 8 (2.8%) |
| 85 Years and over | 0 (0.0%) | 13 (4.5%) |
| Total | 294 (100.0%) | 289 (100.0%) |
Families and Households in Paxton
Median Family Size in Paxton
The median family size in Paxton is 2.64 persons per family, with single male/father families (13 | 6.9%) accounting for the largest median family size of 3.31 persons per family. On the other hand, single female/mother families (54 | 28.6%) represent the smallest median family size with 2.37 persons per family.
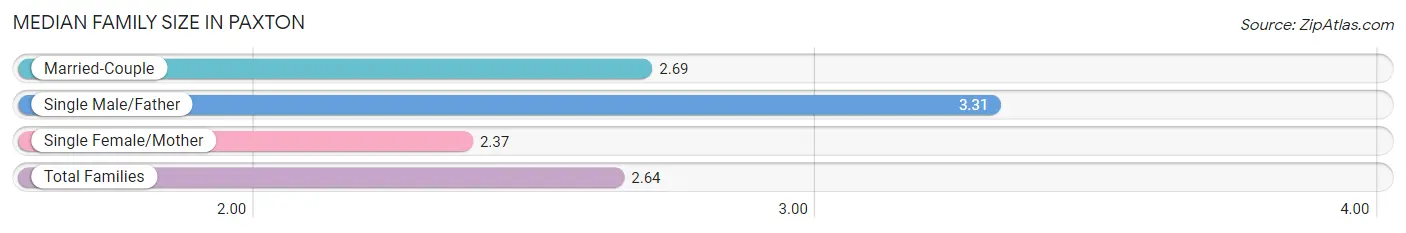
| Family Type | # Families | Family Size |
| Married-Couple | 122 (64.5%) | 2.69 |
| Single Male/Father | 13 (6.9%) | 3.31 |
| Single Female/Mother | 54 (28.6%) | 2.37 |
| Total Families | 189 (100.0%) | 2.64 |
Median Household Size in Paxton
The median household size in Paxton is 2.27 persons per household, with single male/father households (13 | 5.1%) accounting for the largest median household size of 3.31 persons per household. non-family households (68 | 26.5%) represent the smallest median household size with 1.04 persons per household.
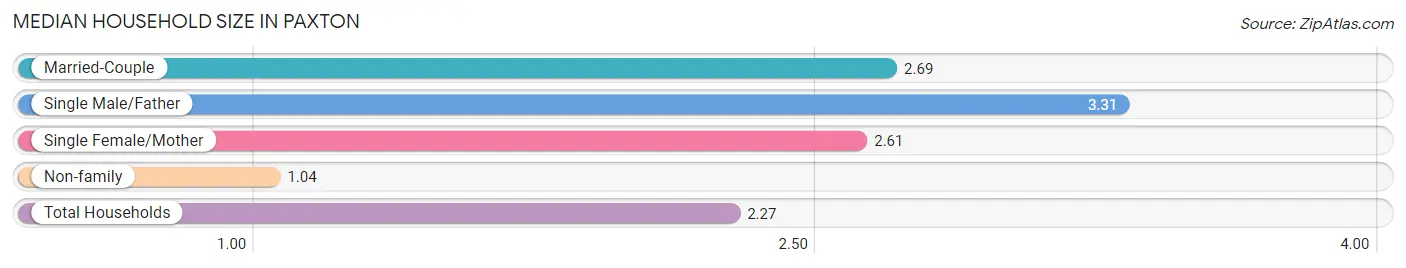
| Household Type | # Households | Household Size |
| Married-Couple | 122 (47.5%) | 2.69 |
| Single Male/Father | 13 (5.1%) | 3.31 |
| Single Female/Mother | 54 (21.0%) | 2.61 |
| Non-family | 68 (26.5%) | 1.04 |
| Total Households | 257 (100.0%) | 2.27 |
Household Size by Marriage Status in Paxton
Out of a total of 257 households in Paxton, 189 (73.5%) are family households, while 68 (26.5%) are nonfamily households. The most numerous type of family households are 2-person households, comprising 103, and the most common type of nonfamily households are 1-person households, comprising 66.
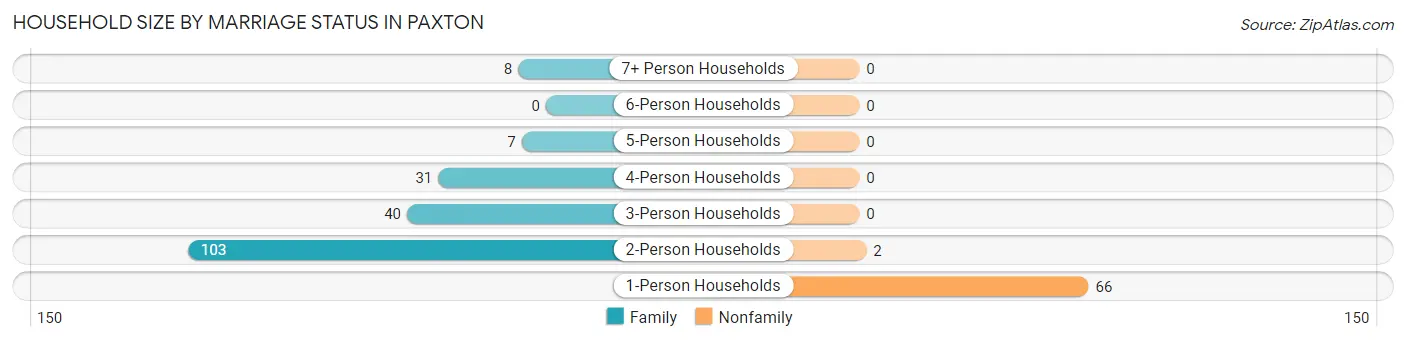
| Household Size | Family Households | Nonfamily Households |
| 1-Person Households | - | 66 (25.7%) |
| 2-Person Households | 103 (40.1%) | 2 (0.8%) |
| 3-Person Households | 40 (15.6%) | 0 (0.0%) |
| 4-Person Households | 31 (12.1%) | 0 (0.0%) |
| 5-Person Households | 7 (2.7%) | 0 (0.0%) |
| 6-Person Households | 0 (0.0%) | 0 (0.0%) |
| 7+ Person Households | 8 (3.1%) | 0 (0.0%) |
| Total | 189 (73.5%) | 68 (26.5%) |
Female Fertility in Paxton
Fertility by Age in Paxton
| Age Bracket | Women with Births | Births / 1,000 Women |
| 15 to 19 years | 0 (0.0%) | 0.0 |
| 20 to 34 years | 0 (0.0%) | 0.0 |
| 35 to 50 years | 0 (0.0%) | 0.0 |
| Total | 0 (0.0%) | 0.0 |
Fertility by Age by Marriage Status in Paxton
| Age Bracket | Married | Unmarried |
| 15 to 19 years | 0 (0.0%) | 0 (0.0%) |
| 20 to 34 years | 0 (0.0%) | 0 (0.0%) |
| 35 to 50 years | 0 (0.0%) | 0 (0.0%) |
| Total | 0 (0.0%) | 0 (0.0%) |
Fertility by Education in Paxton
| Educational Attainment | Women with Births | Births / 1,000 Women |
| Less than High School | 0 (0.0%) | 0.0 |
| High School Diploma | 0 (0.0%) | 0.0 |
| College or Associate's Degree | 0 (0.0%) | 0.0 |
| Bachelor's Degree | 0 (0.0%) | 0.0 |
| Graduate Degree | 0 (0.0%) | 0.0 |
| Total | 0 (0.0%) | 0.0 |
Fertility by Education by Marriage Status in Paxton
| Educational Attainment | Married | Unmarried |
| Less than High School | 0 (0.0%) | 0 (0.0%) |
| High School Diploma | 0 (0.0%) | 0 (0.0%) |
| College or Associate's Degree | 0 (0.0%) | 0 (0.0%) |
| Bachelor's Degree | 0 (0.0%) | 0 (0.0%) |
| Graduate Degree | 0 (0.0%) | 0 (0.0%) |
| Total | 0 (0.0%) | 0 (0.0%) |
Employment Characteristics in Paxton
Employment by Class of Employer in Paxton
Among the 193 employed individuals in Paxton, private company employees (110 | 57.0%), state government employees (25 | 13.0%), and self-employed (incorporated) (17 | 8.8%) make up the most common classes of employment.
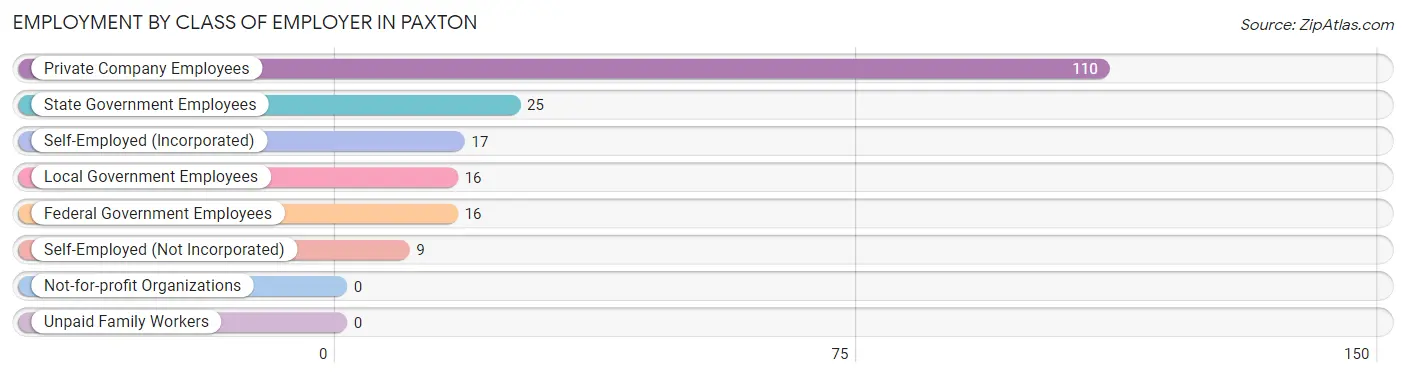
| Employer Class | # Employees | % Employees |
| Private Company Employees | 110 | 57.0% |
| Self-Employed (Incorporated) | 17 | 8.8% |
| Self-Employed (Not Incorporated) | 9 | 4.7% |
| Not-for-profit Organizations | 0 | 0.0% |
| Local Government Employees | 16 | 8.3% |
| State Government Employees | 25 | 13.0% |
| Federal Government Employees | 16 | 8.3% |
| Unpaid Family Workers | 0 | 0.0% |
| Total | 193 | 100.0% |
Employment Status by Age in Paxton
According to the labor force statistics for Paxton, out of the total population over 16 years of age (529), 52.7% or 279 individuals are in the labor force, with 12.2% or 34 of them unemployed. The age group with the highest labor force participation rate is 30 to 34 years, with 100.0% or 14 individuals in the labor force. Within the labor force, the 20 to 24 years age range has the highest percentage of unemployed individuals, with 100.0% or 7 of them being unemployed.
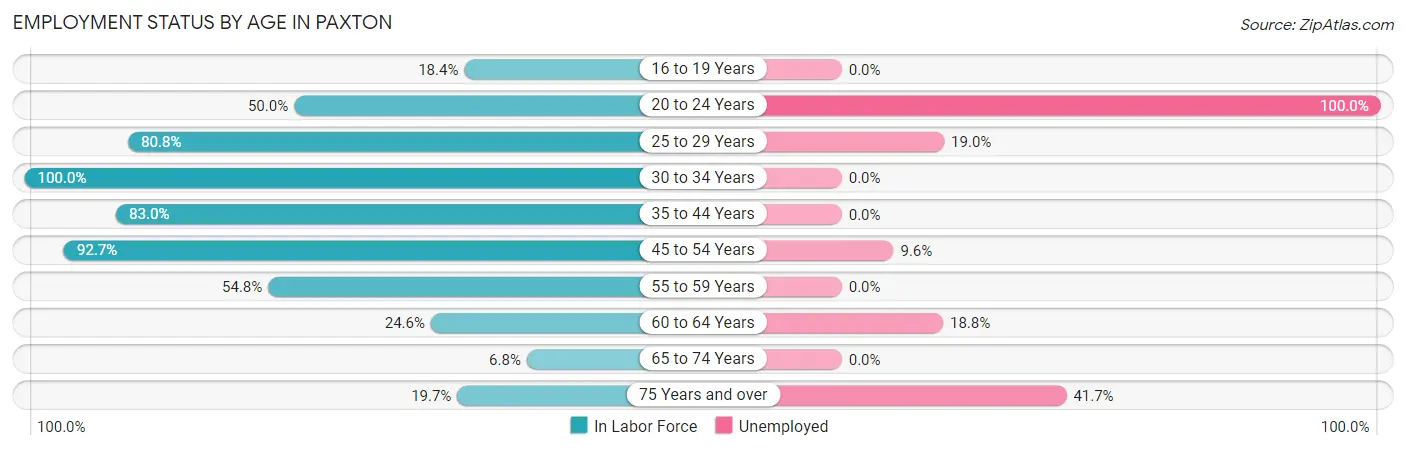
| Age Bracket | In Labor Force | Unemployed |
| 16 to 19 Years | 7 (18.4%) | 0 (0.0%) |
| 20 to 24 Years | 7 (50.0%) | 7 (100.0%) |
| 25 to 29 Years | 42 (80.8%) | 8 (19.0%) |
| 30 to 34 Years | 14 (100.0%) | 0 (0.0%) |
| 35 to 44 Years | 39 (83.0%) | 0 (0.0%) |
| 45 to 54 Years | 114 (92.7%) | 11 (9.6%) |
| 55 to 59 Years | 23 (54.8%) | 0 (0.0%) |
| 60 to 64 Years | 16 (24.6%) | 3 (18.8%) |
| 65 to 74 Years | 5 (6.8%) | 0 (0.0%) |
| 75 Years and over | 12 (19.7%) | 5 (41.7%) |
| Total | 279 (52.7%) | 34 (12.2%) |
Employment Status by Educational Attainment in Paxton
According to labor force statistics for Paxton, 72.3% of individuals (248) out of the total population between 25 and 64 years of age (343) are in the labor force, with 8.9% or 22 of them being unemployed. The group with the highest labor force participation rate are those with the educational attainment of less than high school, with 100.0% or 7 individuals in the labor force. Within the labor force, individuals with college / associate degree education have the highest percentage of unemployment, with 12.6% or 14 of them being unemployed.
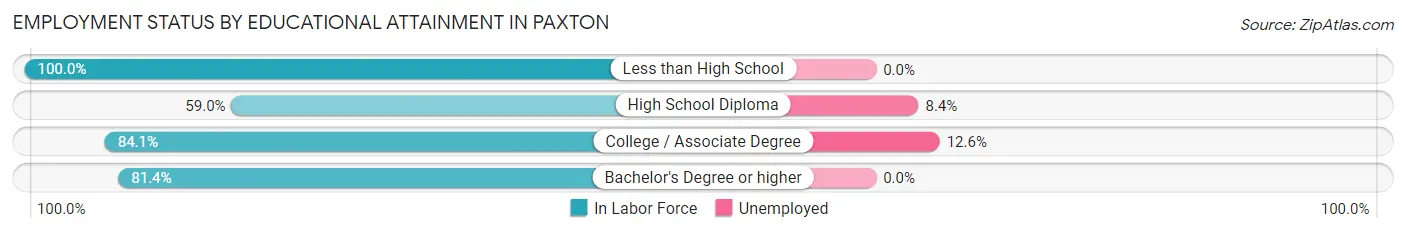
| Educational Attainment | In Labor Force | Unemployed |
| Less than High School | 7 (100.0%) | 0 (0.0%) |
| High School Diploma | 95 (59.0%) | 14 (8.4%) |
| College / Associate Degree | 111 (84.1%) | 17 (12.6%) |
| Bachelor's Degree or higher | 35 (81.4%) | 0 (0.0%) |
| Total | 248 (72.3%) | 31 (8.9%) |
Employment Occupations by Sex in Paxton
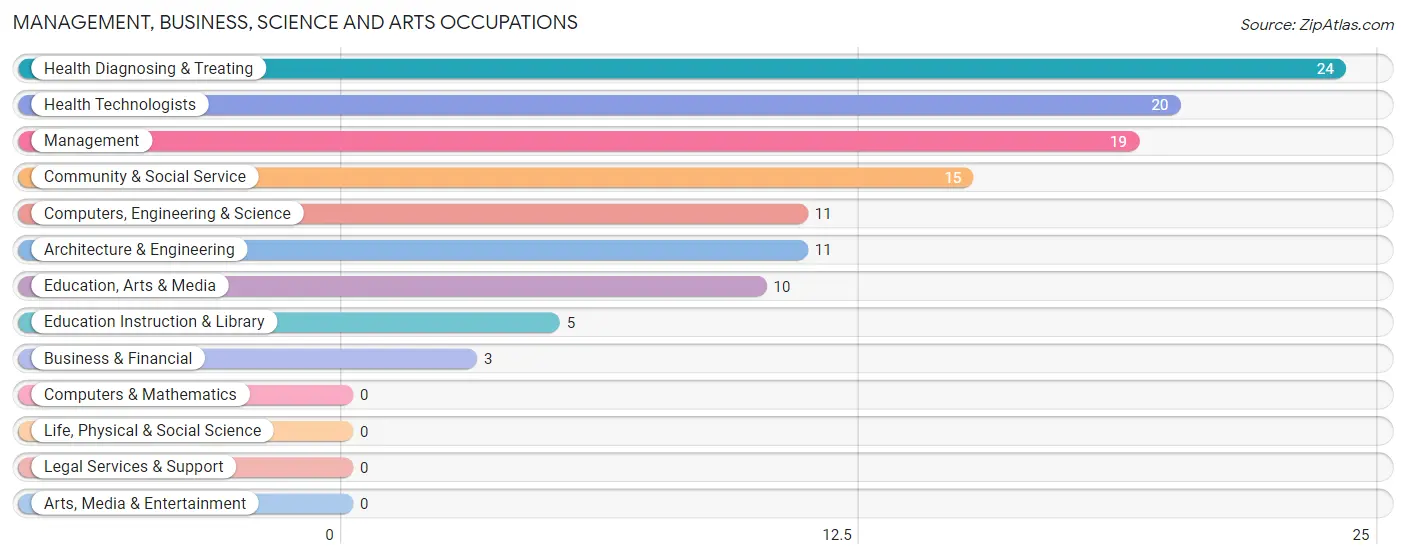
Management, Business, Science and Arts Occupations
The most common Management, Business, Science and Arts occupations in Paxton are Health Diagnosing & Treating (24 | 9.8%), Health Technologists (20 | 8.2%), Management (19 | 7.8%), Community & Social Service (15 | 6.1%), and Computers, Engineering & Science (11 | 4.5%).
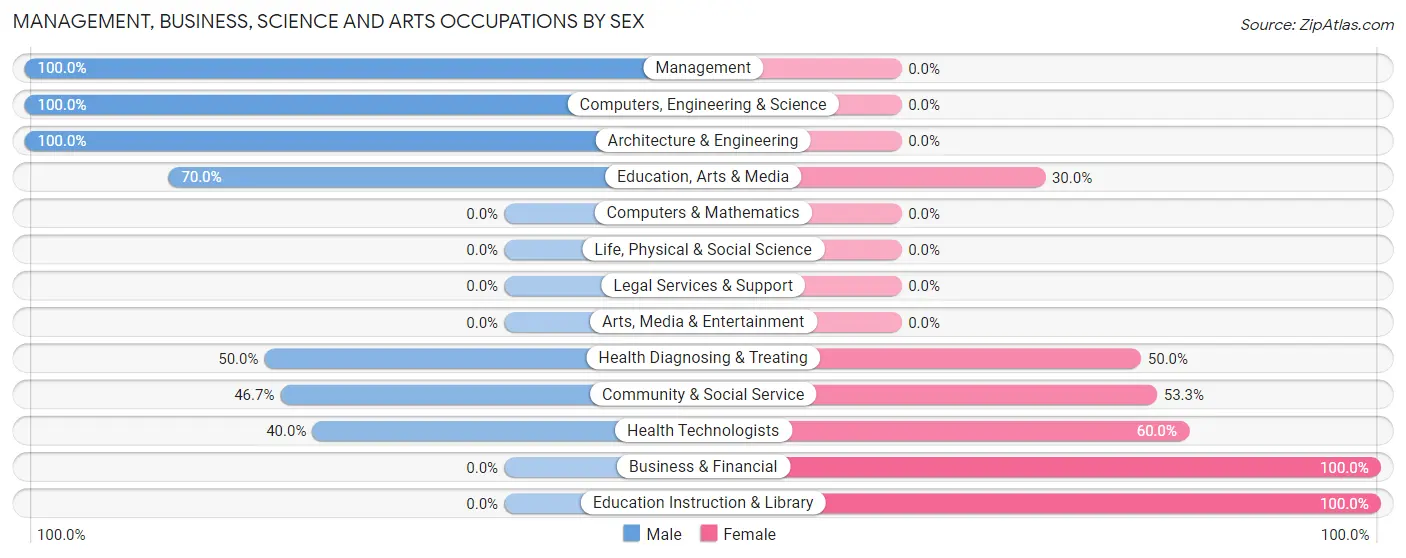
Management, Business, Science and Arts Occupations by Sex
Within the Management, Business, Science and Arts occupations in Paxton, the most male-oriented occupations are Management (100.0%), Computers, Engineering & Science (100.0%), and Architecture & Engineering (100.0%), while the most female-oriented occupations are Business & Financial (100.0%), Education Instruction & Library (100.0%), and Health Technologists (60.0%).
| Occupation | Male | Female |
| Management | 19 (100.0%) | 0 (0.0%) |
| Business & Financial | 0 (0.0%) | 3 (100.0%) |
| Computers, Engineering & Science | 11 (100.0%) | 0 (0.0%) |
| Computers & Mathematics | 0 (0.0%) | 0 (0.0%) |
| Architecture & Engineering | 11 (100.0%) | 0 (0.0%) |
| Life, Physical & Social Science | 0 (0.0%) | 0 (0.0%) |
| Community & Social Service | 7 (46.7%) | 8 (53.3%) |
| Education, Arts & Media | 7 (70.0%) | 3 (30.0%) |
| Legal Services & Support | 0 (0.0%) | 0 (0.0%) |
| Education Instruction & Library | 0 (0.0%) | 5 (100.0%) |
| Arts, Media & Entertainment | 0 (0.0%) | 0 (0.0%) |
| Health Diagnosing & Treating | 12 (50.0%) | 12 (50.0%) |
| Health Technologists | 8 (40.0%) | 12 (60.0%) |
| Total (Category) | 49 (68.1%) | 23 (31.9%) |
| Total (Overall) | 149 (60.8%) | 96 (39.2%) |
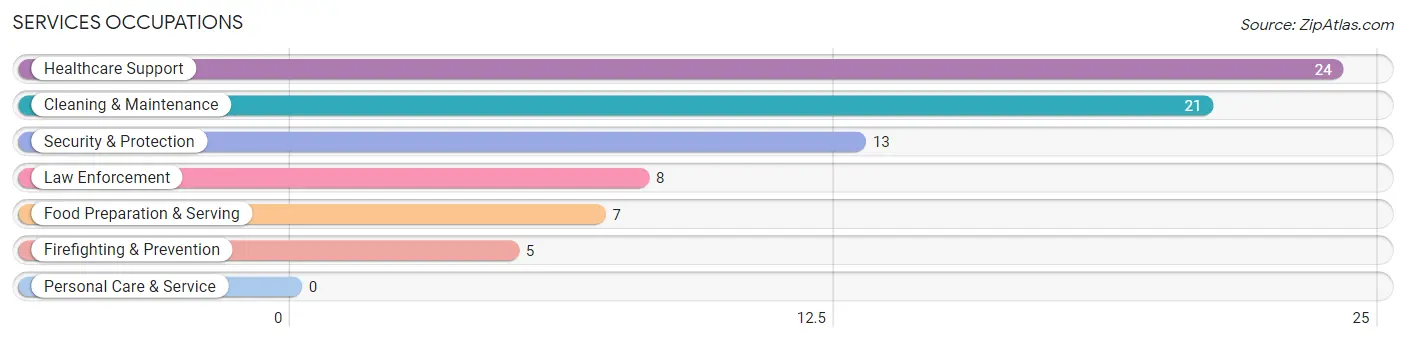
Services Occupations
The most common Services occupations in Paxton are Healthcare Support (24 | 9.8%), Cleaning & Maintenance (21 | 8.6%), Security & Protection (13 | 5.3%), Law Enforcement (8 | 3.3%), and Food Preparation & Serving (7 | 2.9%).
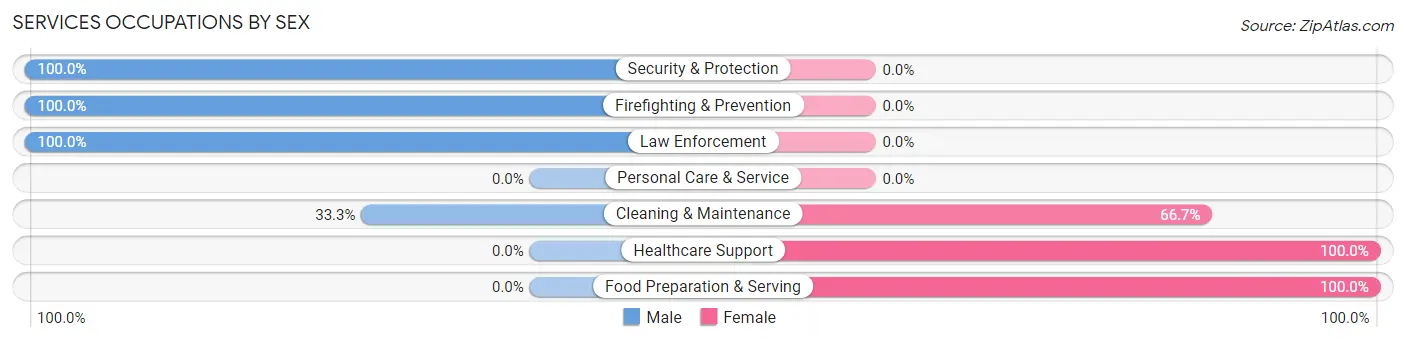
Services Occupations by Sex
Within the Services occupations in Paxton, the most male-oriented occupations are Security & Protection (100.0%), Firefighting & Prevention (100.0%), and Law Enforcement (100.0%), while the most female-oriented occupations are Healthcare Support (100.0%), Food Preparation & Serving (100.0%), and Cleaning & Maintenance (66.7%).
| Occupation | Male | Female |
| Healthcare Support | 0 (0.0%) | 24 (100.0%) |
| Security & Protection | 13 (100.0%) | 0 (0.0%) |
| Firefighting & Prevention | 5 (100.0%) | 0 (0.0%) |
| Law Enforcement | 8 (100.0%) | 0 (0.0%) |
| Food Preparation & Serving | 0 (0.0%) | 7 (100.0%) |
| Cleaning & Maintenance | 7 (33.3%) | 14 (66.7%) |
| Personal Care & Service | 0 (0.0%) | 0 (0.0%) |
| Total (Category) | 20 (30.8%) | 45 (69.2%) |
| Total (Overall) | 149 (60.8%) | 96 (39.2%) |
Sales and Office Occupations
The most common Sales and Office occupations in Paxton are Office & Administration (10 | 4.1%), and Sales & Related (9 | 3.7%).
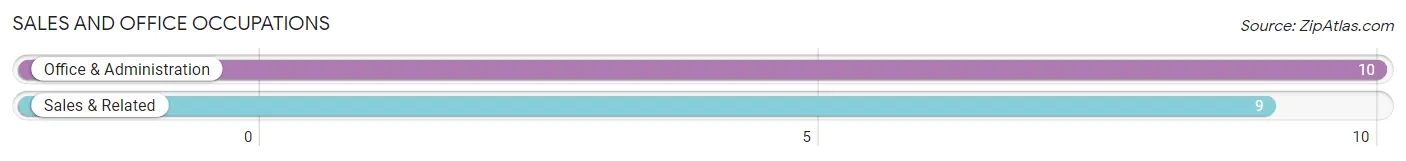
Sales and Office Occupations by Sex
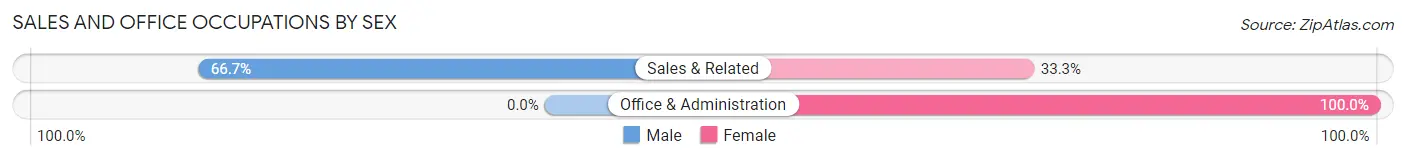
| Occupation | Male | Female |
| Sales & Related | 6 (66.7%) | 3 (33.3%) |
| Office & Administration | 0 (0.0%) | 10 (100.0%) |
| Total (Category) | 6 (31.6%) | 13 (68.4%) |
| Total (Overall) | 149 (60.8%) | 96 (39.2%) |
Natural Resources, Construction and Maintenance Occupations
The most common Natural Resources, Construction and Maintenance occupations in Paxton are Construction & Extraction (7 | 2.9%), and Installation, Maintenance & Repair (2 | 0.8%).
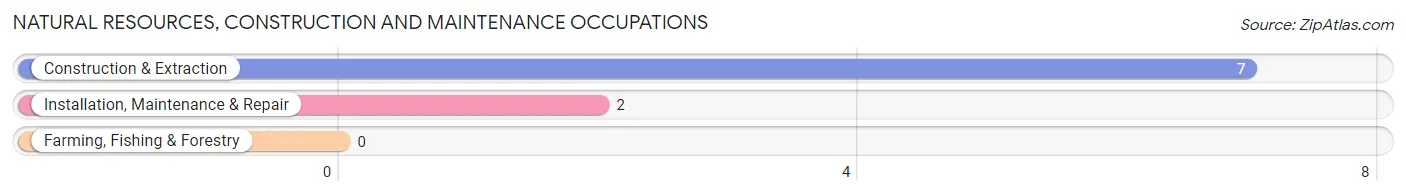
Natural Resources, Construction and Maintenance Occupations by Sex
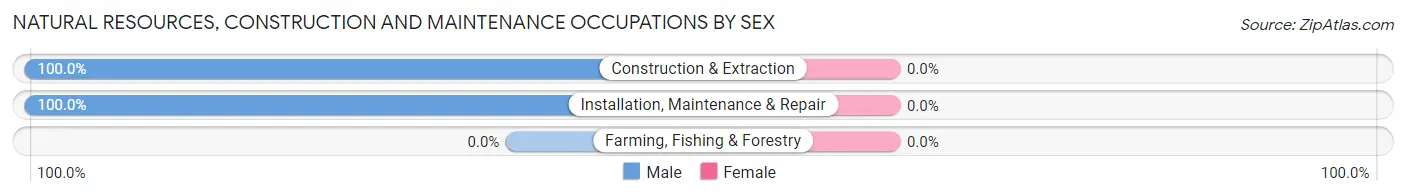
| Occupation | Male | Female |
| Farming, Fishing & Forestry | 0 (0.0%) | 0 (0.0%) |
| Construction & Extraction | 7 (100.0%) | 0 (0.0%) |
| Installation, Maintenance & Repair | 2 (100.0%) | 0 (0.0%) |
| Total (Category) | 9 (100.0%) | 0 (0.0%) |
| Total (Overall) | 149 (60.8%) | 96 (39.2%) |
Production, Transportation and Moving Occupations
The most common Production, Transportation and Moving occupations in Paxton are Transportation (52 | 21.2%), and Production (28 | 11.4%).
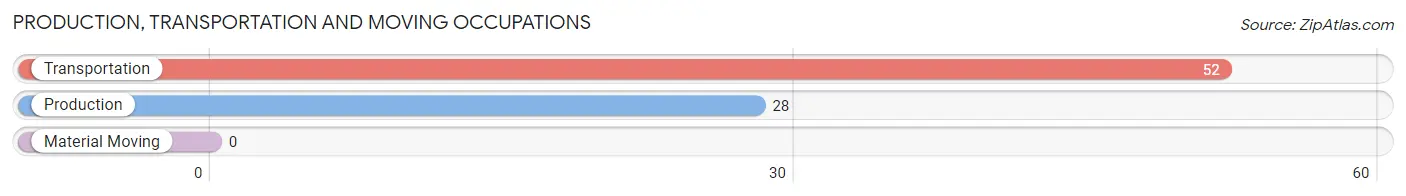
Production, Transportation and Moving Occupations by Sex
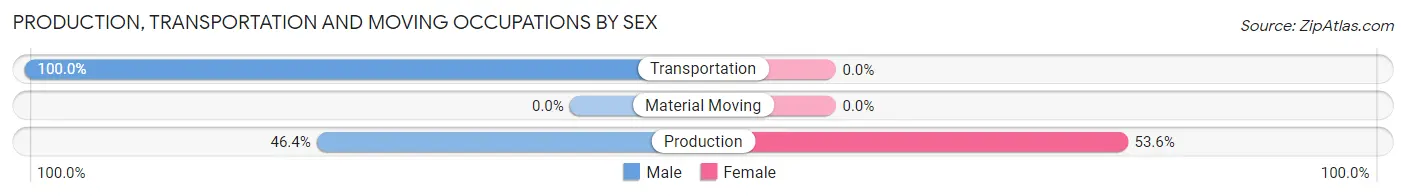
| Occupation | Male | Female |
| Production | 13 (46.4%) | 15 (53.6%) |
| Transportation | 52 (100.0%) | 0 (0.0%) |
| Material Moving | 0 (0.0%) | 0 (0.0%) |
| Total (Category) | 65 (81.2%) | 15 (18.8%) |
| Total (Overall) | 149 (60.8%) | 96 (39.2%) |
Employment Industries by Sex in Paxton
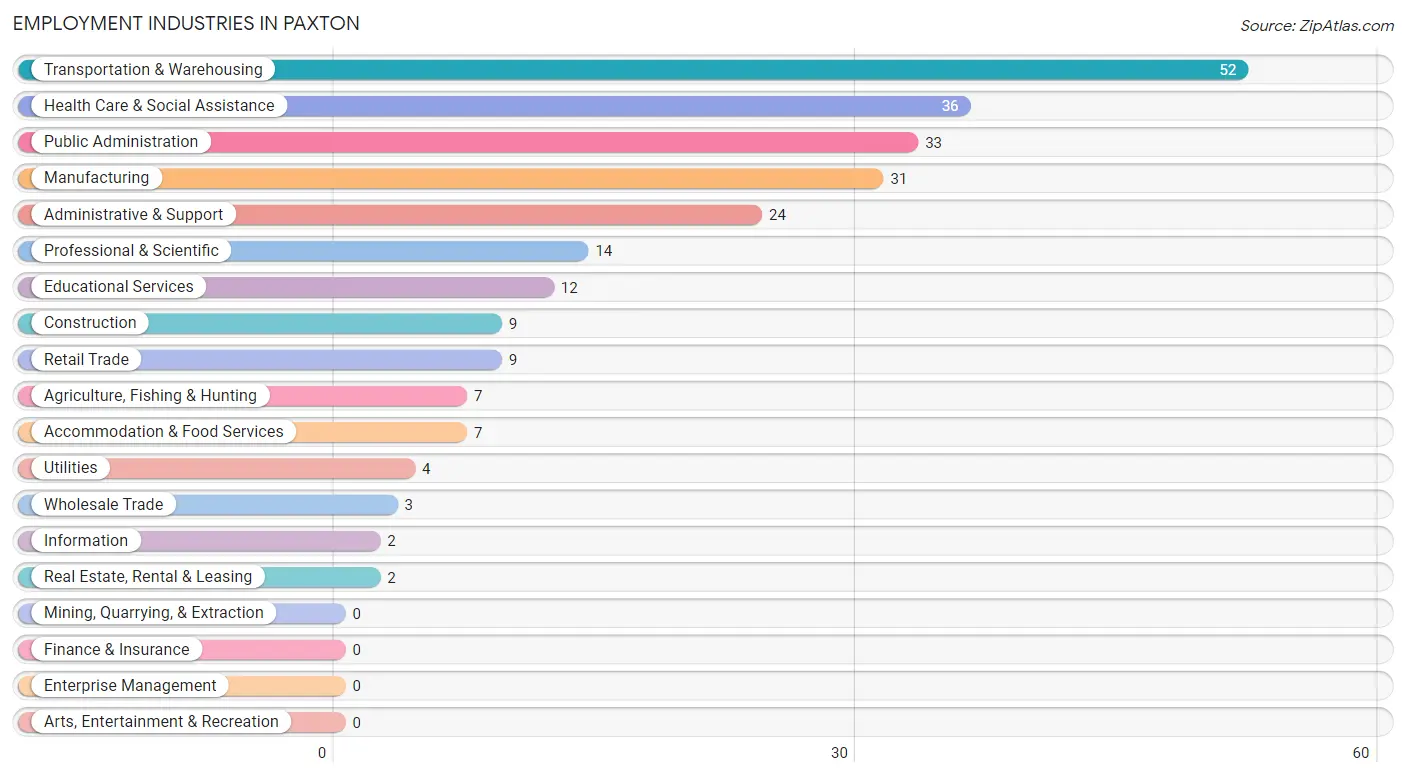
Employment Industries in Paxton
The major employment industries in Paxton include Transportation & Warehousing (52 | 21.2%), Health Care & Social Assistance (36 | 14.7%), Public Administration (33 | 13.5%), Manufacturing (31 | 12.7%), and Administrative & Support (24 | 9.8%).
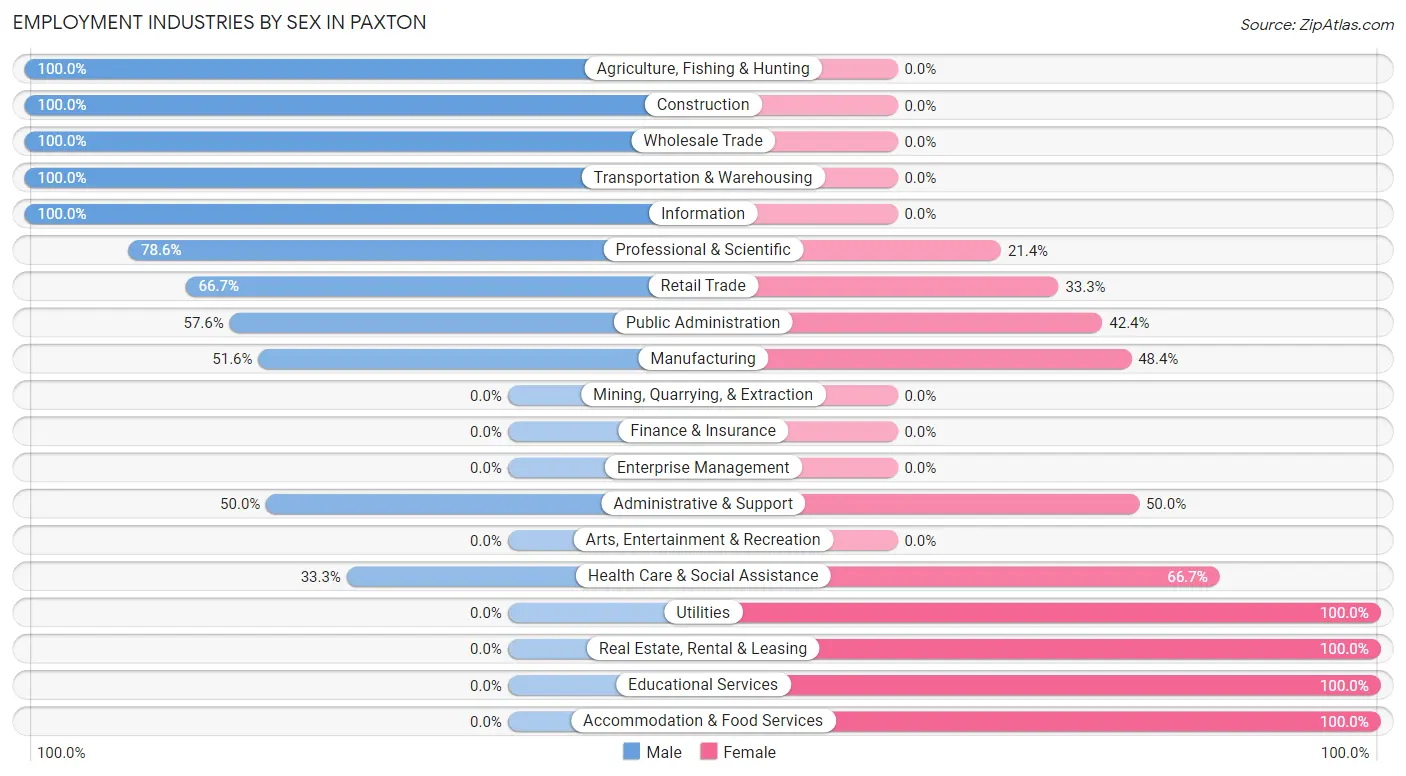
Employment Industries by Sex in Paxton
The Paxton industries that see more men than women are Agriculture, Fishing & Hunting (100.0%), Construction (100.0%), and Wholesale Trade (100.0%), whereas the industries that tend to have a higher number of women are Utilities (100.0%), Real Estate, Rental & Leasing (100.0%), and Educational Services (100.0%).
| Industry | Male | Female |
| Agriculture, Fishing & Hunting | 7 (100.0%) | 0 (0.0%) |
| Mining, Quarrying, & Extraction | 0 (0.0%) | 0 (0.0%) |
| Construction | 9 (100.0%) | 0 (0.0%) |
| Manufacturing | 16 (51.6%) | 15 (48.4%) |
| Wholesale Trade | 3 (100.0%) | 0 (0.0%) |
| Retail Trade | 6 (66.7%) | 3 (33.3%) |
| Transportation & Warehousing | 52 (100.0%) | 0 (0.0%) |
| Utilities | 0 (0.0%) | 4 (100.0%) |
| Information | 2 (100.0%) | 0 (0.0%) |
| Finance & Insurance | 0 (0.0%) | 0 (0.0%) |
| Real Estate, Rental & Leasing | 0 (0.0%) | 2 (100.0%) |
| Professional & Scientific | 11 (78.6%) | 3 (21.4%) |
| Enterprise Management | 0 (0.0%) | 0 (0.0%) |
| Administrative & Support | 12 (50.0%) | 12 (50.0%) |
| Educational Services | 0 (0.0%) | 12 (100.0%) |
| Health Care & Social Assistance | 12 (33.3%) | 24 (66.7%) |
| Arts, Entertainment & Recreation | 0 (0.0%) | 0 (0.0%) |
| Accommodation & Food Services | 0 (0.0%) | 7 (100.0%) |
| Public Administration | 19 (57.6%) | 14 (42.4%) |
| Total | 149 (60.8%) | 96 (39.2%) |
Education in Paxton
School Enrollment in Paxton
The most common levels of schooling among the 70 students in Paxton are high school (31 | 44.3%), middle school (22 | 31.4%), and nursery / preschool (5 | 7.1%).
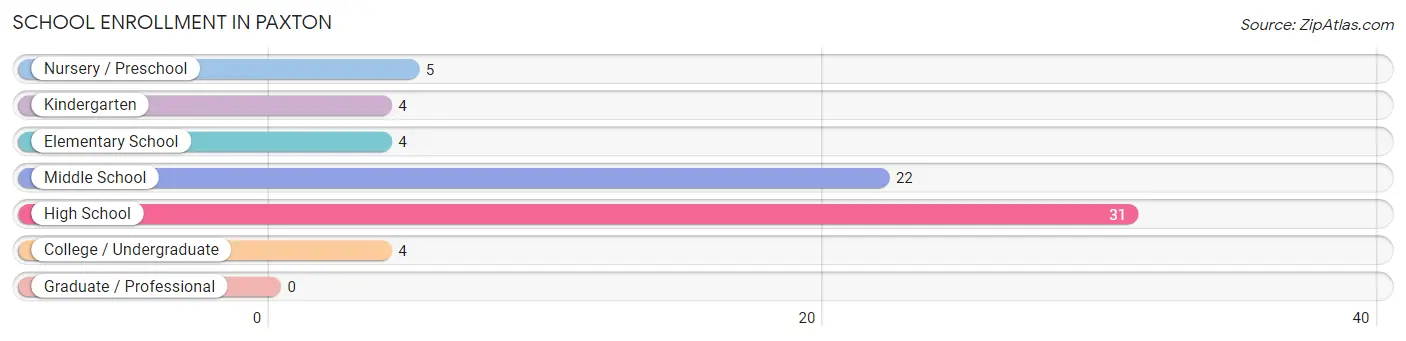
| School Level | # Students | % Students |
| Nursery / Preschool | 5 | 7.1% |
| Kindergarten | 4 | 5.7% |
| Elementary School | 4 | 5.7% |
| Middle School | 22 | 31.4% |
| High School | 31 | 44.3% |
| College / Undergraduate | 4 | 5.7% |
| Graduate / Professional | 0 | 0.0% |
| Total | 70 | 100.0% |
School Enrollment by Age by Funding Source in Paxton
Out of a total of 70 students who are enrolled in schools in Paxton, 5 (7.1%) attend a private institution, while the remaining 65 (92.9%) are enrolled in public schools. The age group of 3 to 4 year olds has the highest likelihood of being enrolled in private schools, with 5 (100.0% in the age bracket) enrolled. Conversely, the age group of 5 to 9 year old has the lowest likelihood of being enrolled in a private school, with 8 (100.0% in the age bracket) attending a public institution.
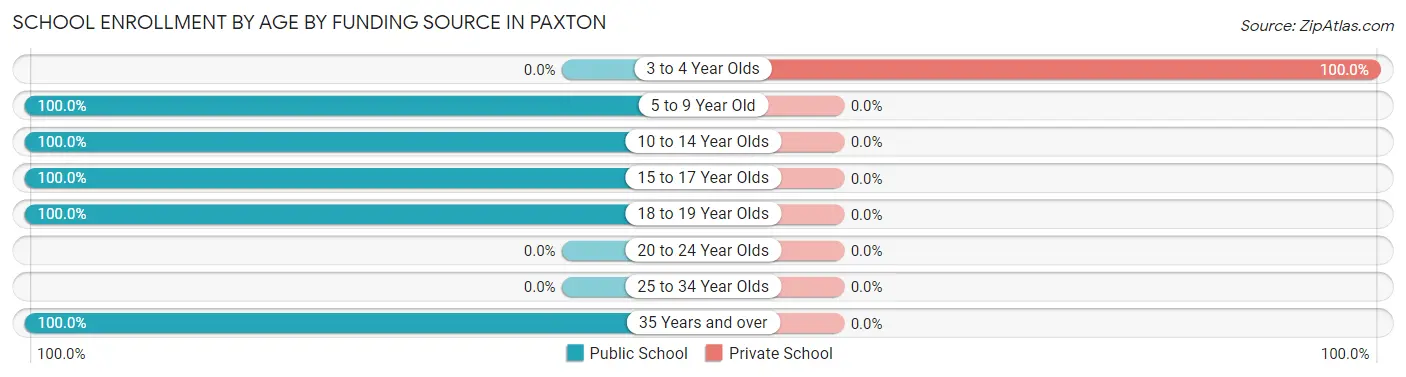
| Age Bracket | Public School | Private School |
| 3 to 4 Year Olds | 0 (0.0%) | 5 (100.0%) |
| 5 to 9 Year Old | 8 (100.0%) | 0 (0.0%) |
| 10 to 14 Year Olds | 22 (100.0%) | 0 (0.0%) |
| 15 to 17 Year Olds | 27 (100.0%) | 0 (0.0%) |
| 18 to 19 Year Olds | 4 (100.0%) | 0 (0.0%) |
| 20 to 24 Year Olds | 0 (0.0%) | 0 (0.0%) |
| 25 to 34 Year Olds | 0 (0.0%) | 0 (0.0%) |
| 35 Years and over | 4 (100.0%) | 0 (0.0%) |
| Total | 65 (92.9%) | 5 (7.1%) |
Educational Attainment by Field of Study in Paxton
Science & technology (14 | 25.5%), education (13 | 23.6%), business (9 | 16.4%), arts & humanities (7 | 12.7%), and bio, nature & agricultural (6 | 10.9%) are the most common fields of study among 55 individuals in Paxton who have obtained a bachelor's degree or higher.
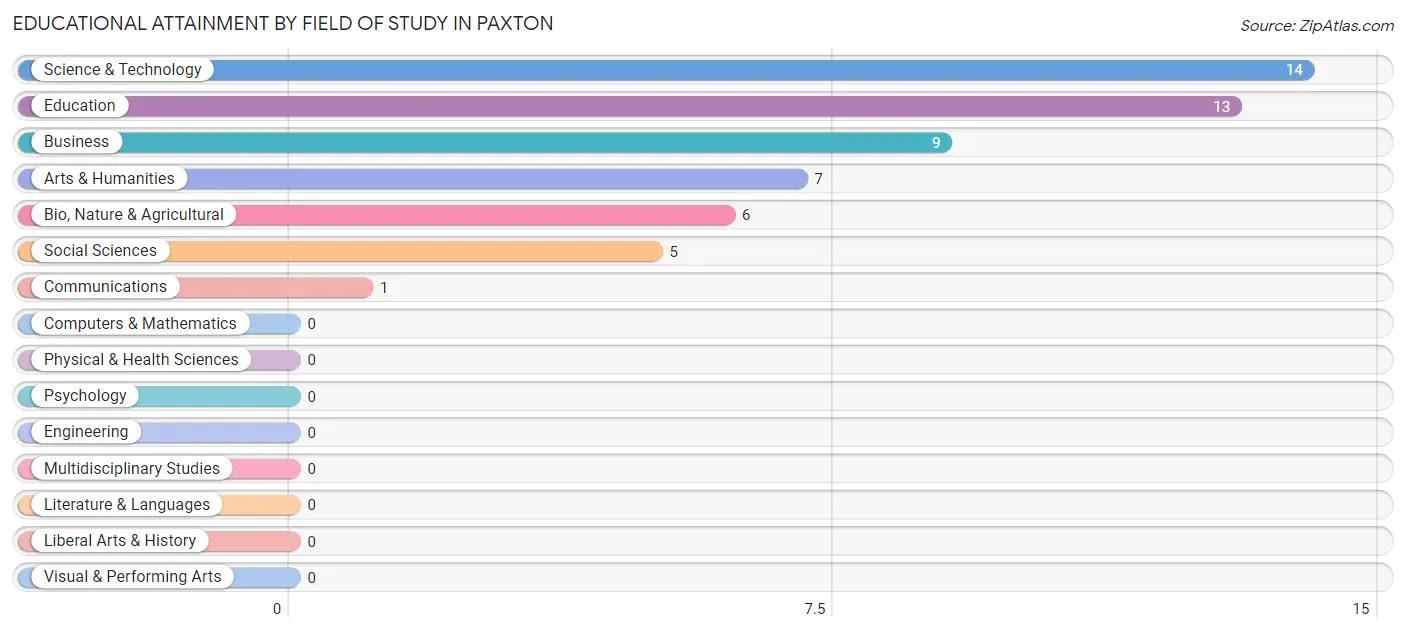
| Field of Study | # Graduates | % Graduates |
| Computers & Mathematics | 0 | 0.0% |
| Bio, Nature & Agricultural | 6 | 10.9% |
| Physical & Health Sciences | 0 | 0.0% |
| Psychology | 0 | 0.0% |
| Social Sciences | 5 | 9.1% |
| Engineering | 0 | 0.0% |
| Multidisciplinary Studies | 0 | 0.0% |
| Science & Technology | 14 | 25.5% |
| Business | 9 | 16.4% |
| Education | 13 | 23.6% |
| Literature & Languages | 0 | 0.0% |
| Liberal Arts & History | 0 | 0.0% |
| Visual & Performing Arts | 0 | 0.0% |
| Communications | 1 | 1.8% |
| Arts & Humanities | 7 | 12.7% |
| Total | 55 | 100.0% |
Transportation & Commute in Paxton
Vehicle Availability by Sex in Paxton
The most prevalent vehicle ownership categories in Paxton are males with 4 vehicles (34, accounting for 35.0%) and females with 4 vehicles (43, making up 35.4%).
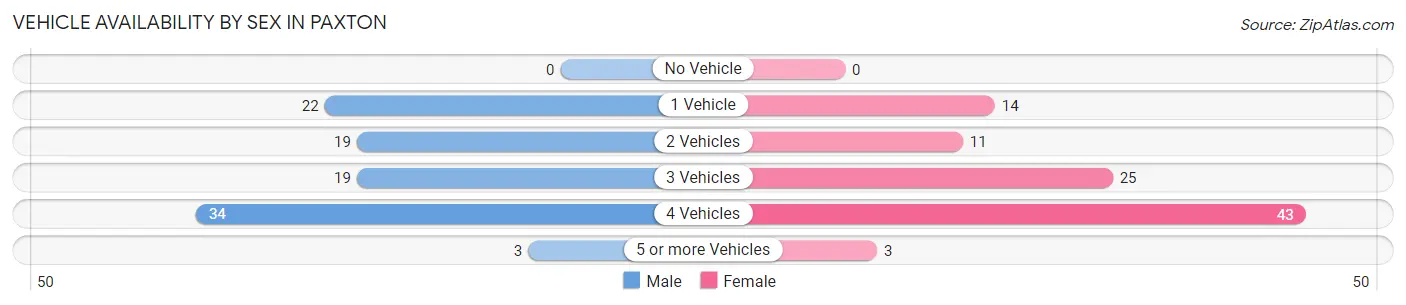
| Vehicles Available | Male | Female |
| No Vehicle | 0 (0.0%) | 0 (0.0%) |
| 1 Vehicle | 22 (22.7%) | 14 (14.6%) |
| 2 Vehicles | 19 (19.6%) | 11 (11.5%) |
| 3 Vehicles | 19 (19.6%) | 25 (26.0%) |
| 4 Vehicles | 34 (35.0%) | 43 (44.8%) |
| 5 or more Vehicles | 3 (3.1%) | 3 (3.1%) |
| Total | 97 (100.0%) | 96 (100.0%) |
Commute Time in Paxton
The most frequently occuring commute durations in Paxton are 10 to 14 minutes (55 commuters, 30.6%), 30 to 34 minutes (40 commuters, 22.2%), and 5 to 9 minutes (21 commuters, 11.7%).
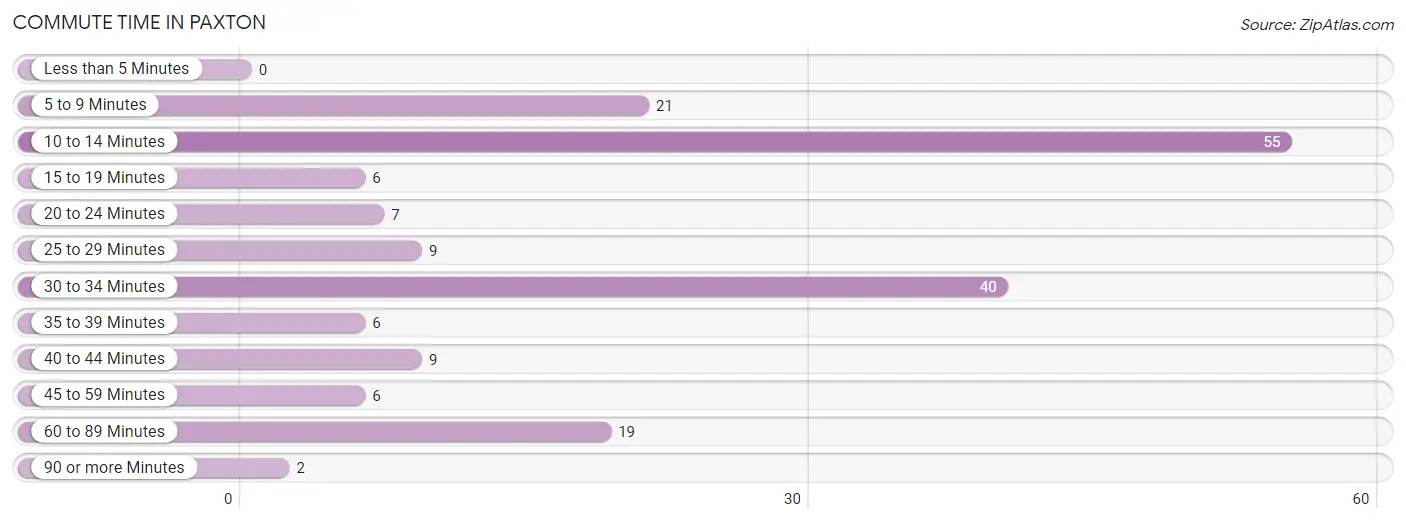
| Commute Time | # Commuters | % Commuters |
| Less than 5 Minutes | 0 | 0.0% |
| 5 to 9 Minutes | 21 | 11.7% |
| 10 to 14 Minutes | 55 | 30.6% |
| 15 to 19 Minutes | 6 | 3.3% |
| 20 to 24 Minutes | 7 | 3.9% |
| 25 to 29 Minutes | 9 | 5.0% |
| 30 to 34 Minutes | 40 | 22.2% |
| 35 to 39 Minutes | 6 | 3.3% |
| 40 to 44 Minutes | 9 | 5.0% |
| 45 to 59 Minutes | 6 | 3.3% |
| 60 to 89 Minutes | 19 | 10.6% |
| 90 or more Minutes | 2 | 1.1% |
Commute Time by Sex in Paxton
The most common commute times in Paxton are 30 to 34 minutes (23 commuters, 26.4%) for males and 10 to 14 minutes (34 commuters, 36.6%) for females.
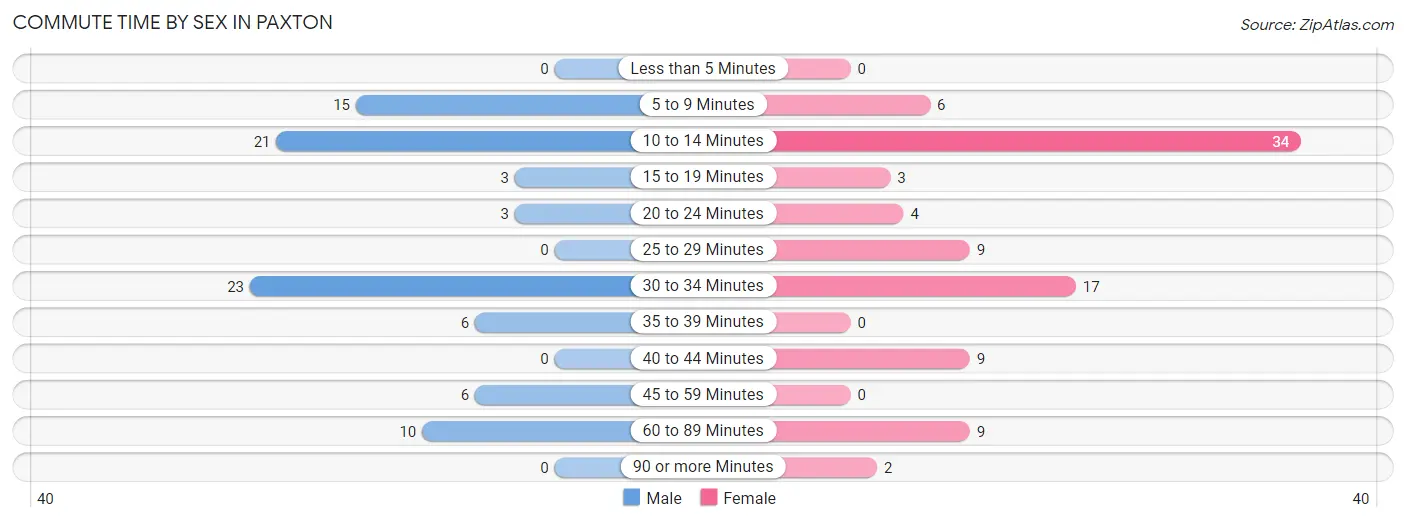
| Commute Time | Male | Female |
| Less than 5 Minutes | 0 (0.0%) | 0 (0.0%) |
| 5 to 9 Minutes | 15 (17.2%) | 6 (6.5%) |
| 10 to 14 Minutes | 21 (24.1%) | 34 (36.6%) |
| 15 to 19 Minutes | 3 (3.5%) | 3 (3.2%) |
| 20 to 24 Minutes | 3 (3.5%) | 4 (4.3%) |
| 25 to 29 Minutes | 0 (0.0%) | 9 (9.7%) |
| 30 to 34 Minutes | 23 (26.4%) | 17 (18.3%) |
| 35 to 39 Minutes | 6 (6.9%) | 0 (0.0%) |
| 40 to 44 Minutes | 0 (0.0%) | 9 (9.7%) |
| 45 to 59 Minutes | 6 (6.9%) | 0 (0.0%) |
| 60 to 89 Minutes | 10 (11.5%) | 9 (9.7%) |
| 90 or more Minutes | 0 (0.0%) | 2 (2.1%) |
Time of Departure to Work by Sex in Paxton
The most frequent times of departure to work in Paxton are 5:00 AM to 5:29 AM (18, 20.7%) for males and 7:00 AM to 7:29 AM (30, 32.3%) for females.
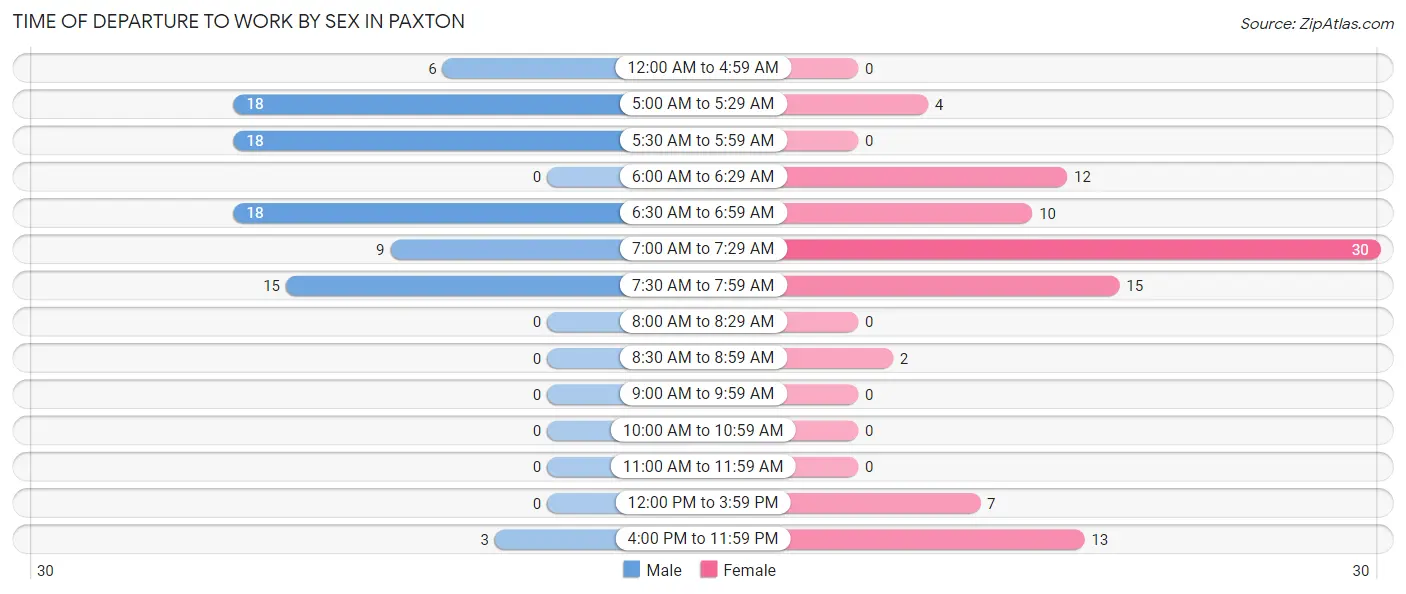
| Time of Departure | Male | Female |
| 12:00 AM to 4:59 AM | 6 (6.9%) | 0 (0.0%) |
| 5:00 AM to 5:29 AM | 18 (20.7%) | 4 (4.3%) |
| 5:30 AM to 5:59 AM | 18 (20.7%) | 0 (0.0%) |
| 6:00 AM to 6:29 AM | 0 (0.0%) | 12 (12.9%) |
| 6:30 AM to 6:59 AM | 18 (20.7%) | 10 (10.7%) |
| 7:00 AM to 7:29 AM | 9 (10.3%) | 30 (32.3%) |
| 7:30 AM to 7:59 AM | 15 (17.2%) | 15 (16.1%) |
| 8:00 AM to 8:29 AM | 0 (0.0%) | 0 (0.0%) |
| 8:30 AM to 8:59 AM | 0 (0.0%) | 2 (2.1%) |
| 9:00 AM to 9:59 AM | 0 (0.0%) | 0 (0.0%) |
| 10:00 AM to 10:59 AM | 0 (0.0%) | 0 (0.0%) |
| 11:00 AM to 11:59 AM | 0 (0.0%) | 0 (0.0%) |
| 12:00 PM to 3:59 PM | 0 (0.0%) | 7 (7.5%) |
| 4:00 PM to 11:59 PM | 3 (3.5%) | 13 (14.0%) |
| Total | 87 (100.0%) | 93 (100.0%) |
Housing Occupancy in Paxton
Occupancy by Ownership in Paxton
Of the total 257 dwellings in Paxton, owner-occupied units account for 185 (72.0%), while renter-occupied units make up 72 (28.0%).
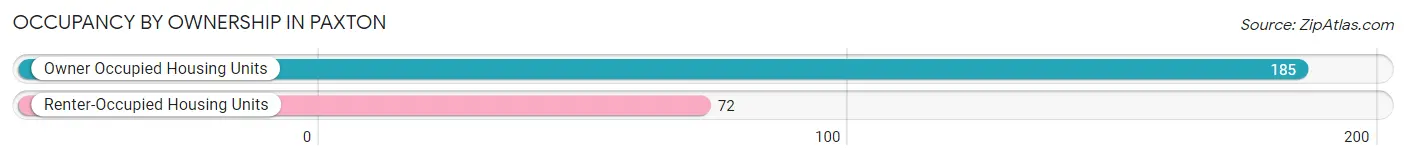
| Occupancy | # Housing Units | % Housing Units |
| Owner Occupied Housing Units | 185 | 72.0% |
| Renter-Occupied Housing Units | 72 | 28.0% |
| Total Occupied Housing Units | 257 | 100.0% |
Occupancy by Household Size in Paxton
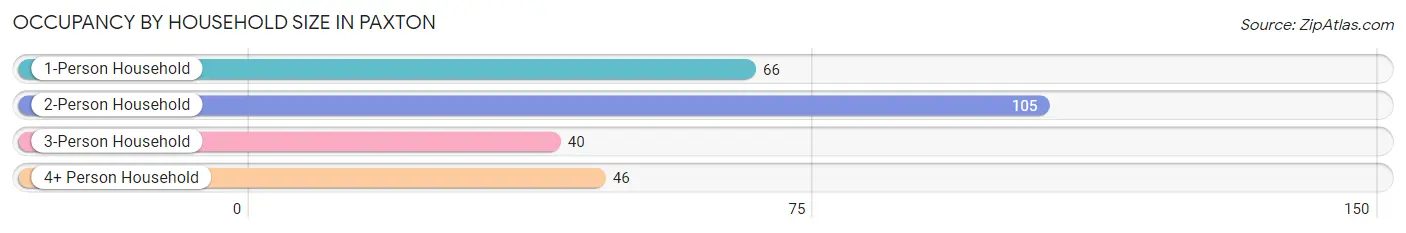
| Household Size | # Housing Units | % Housing Units |
| 1-Person Household | 66 | 25.7% |
| 2-Person Household | 105 | 40.9% |
| 3-Person Household | 40 | 15.6% |
| 4+ Person Household | 46 | 17.9% |
| Total Housing Units | 257 | 100.0% |
Occupancy by Ownership by Household Size in Paxton
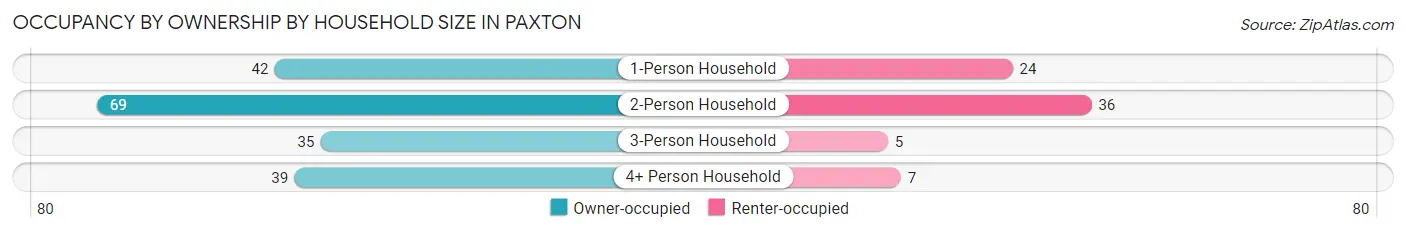
| Household Size | Owner-occupied | Renter-occupied |
| 1-Person Household | 42 (63.6%) | 24 (36.4%) |
| 2-Person Household | 69 (65.7%) | 36 (34.3%) |
| 3-Person Household | 35 (87.5%) | 5 (12.5%) |
| 4+ Person Household | 39 (84.8%) | 7 (15.2%) |
| Total Housing Units | 185 (72.0%) | 72 (28.0%) |
Occupancy by Educational Attainment in Paxton
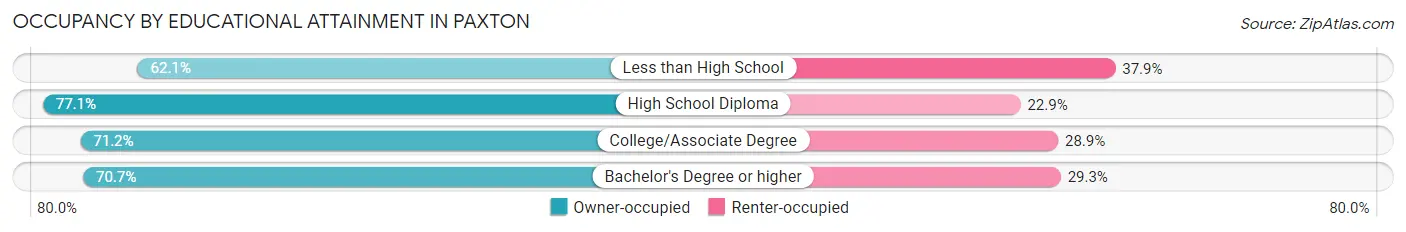
| Household Size | Owner-occupied | Renter-occupied |
| Less than High School | 18 (62.1%) | 11 (37.9%) |
| High School Diploma | 64 (77.1%) | 19 (22.9%) |
| College/Associate Degree | 74 (71.2%) | 30 (28.8%) |
| Bachelor's Degree or higher | 29 (70.7%) | 12 (29.3%) |
Occupancy by Age of Householder in Paxton
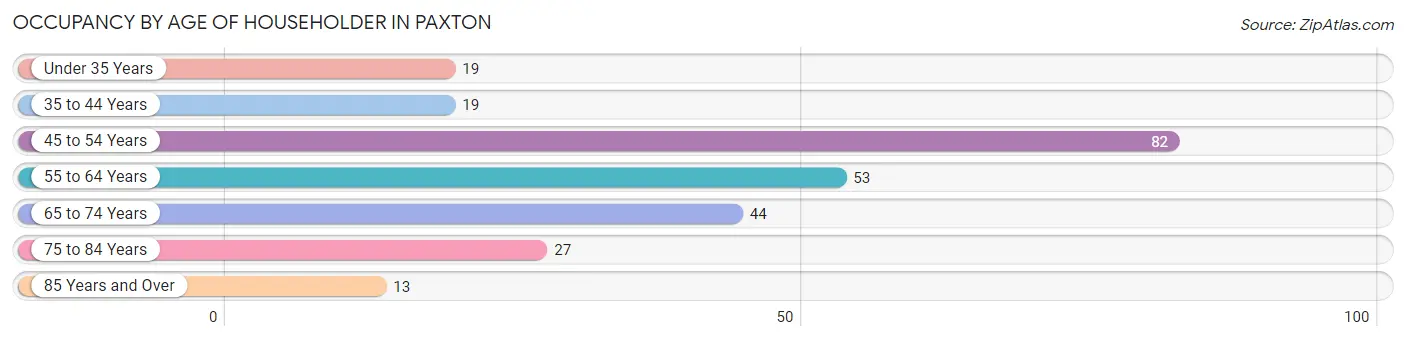
| Age Bracket | # Households | % Households |
| Under 35 Years | 19 | 7.4% |
| 35 to 44 Years | 19 | 7.4% |
| 45 to 54 Years | 82 | 31.9% |
| 55 to 64 Years | 53 | 20.6% |
| 65 to 74 Years | 44 | 17.1% |
| 75 to 84 Years | 27 | 10.5% |
| 85 Years and Over | 13 | 5.1% |
| Total | 257 | 100.0% |
Housing Finances in Paxton
Median Income by Occupancy in Paxton
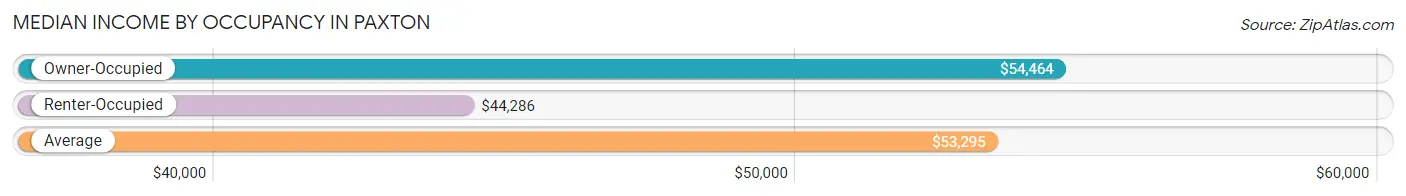
| Occupancy Type | # Households | Median Income |
| Owner-Occupied | 185 (72.0%) | $54,464 |
| Renter-Occupied | 72 (28.0%) | $44,286 |
| Average | 257 (100.0%) | $53,295 |
Occupancy by Householder Income Bracket in Paxton
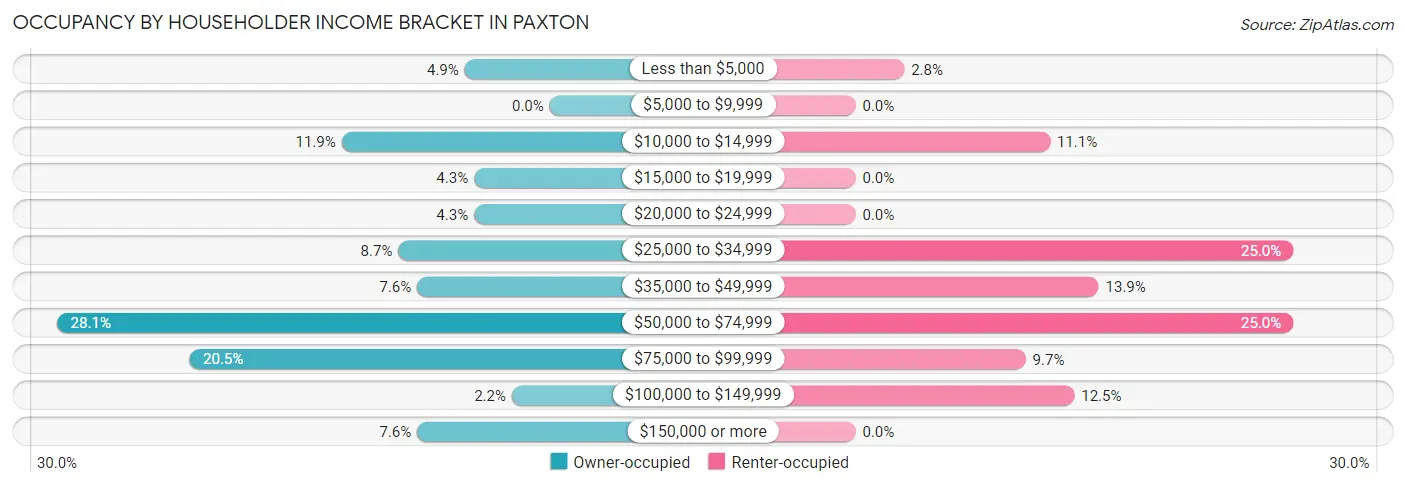
| Income Bracket | Owner-occupied | Renter-occupied |
| Less than $5,000 | 9 (4.9%) | 2 (2.8%) |
| $5,000 to $9,999 | 0 (0.0%) | 0 (0.0%) |
| $10,000 to $14,999 | 22 (11.9%) | 8 (11.1%) |
| $15,000 to $19,999 | 8 (4.3%) | 0 (0.0%) |
| $20,000 to $24,999 | 8 (4.3%) | 0 (0.0%) |
| $25,000 to $34,999 | 16 (8.6%) | 18 (25.0%) |
| $35,000 to $49,999 | 14 (7.6%) | 10 (13.9%) |
| $50,000 to $74,999 | 52 (28.1%) | 18 (25.0%) |
| $75,000 to $99,999 | 38 (20.5%) | 7 (9.7%) |
| $100,000 to $149,999 | 4 (2.2%) | 9 (12.5%) |
| $150,000 or more | 14 (7.6%) | 0 (0.0%) |
| Total | 185 (100.0%) | 72 (100.0%) |
Monthly Housing Cost Tiers in Paxton
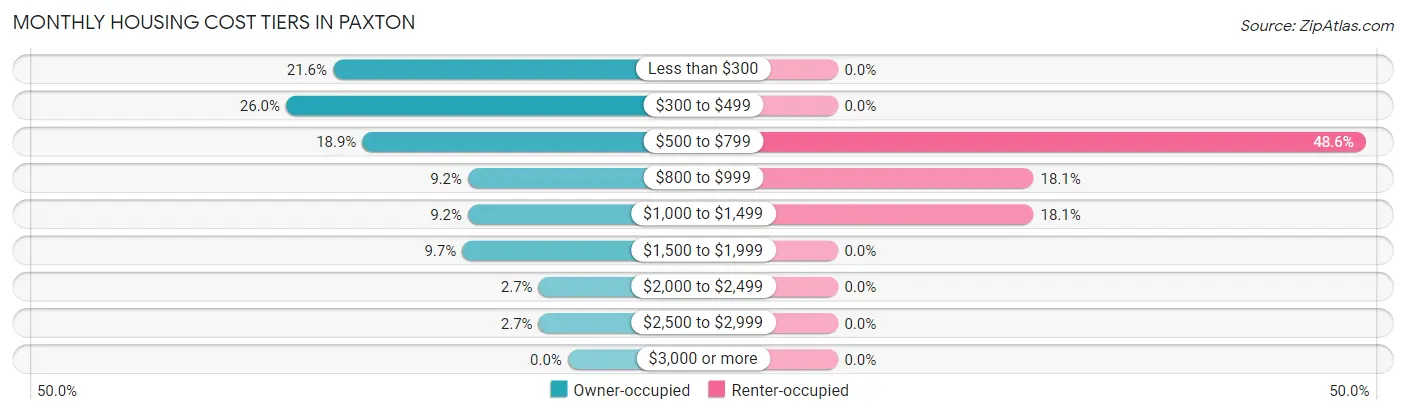
| Monthly Cost | Owner-occupied | Renter-occupied |
| Less than $300 | 40 (21.6%) | 0 (0.0%) |
| $300 to $499 | 48 (26.0%) | 0 (0.0%) |
| $500 to $799 | 35 (18.9%) | 35 (48.6%) |
| $800 to $999 | 17 (9.2%) | 13 (18.1%) |
| $1,000 to $1,499 | 17 (9.2%) | 13 (18.1%) |
| $1,500 to $1,999 | 18 (9.7%) | 0 (0.0%) |
| $2,000 to $2,499 | 5 (2.7%) | 0 (0.0%) |
| $2,500 to $2,999 | 5 (2.7%) | 0 (0.0%) |
| $3,000 or more | 0 (0.0%) | 0 (0.0%) |
| Total | 185 (100.0%) | 72 (100.0%) |
Physical Housing Characteristics in Paxton
Housing Structures in Paxton
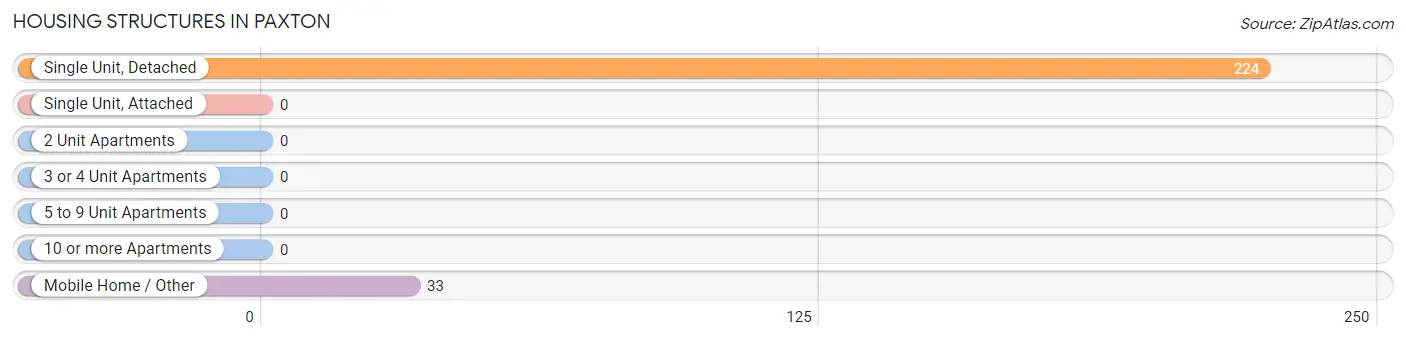
| Structure Type | # Housing Units | % Housing Units |
| Single Unit, Detached | 224 | 87.2% |
| Single Unit, Attached | 0 | 0.0% |
| 2 Unit Apartments | 0 | 0.0% |
| 3 or 4 Unit Apartments | 0 | 0.0% |
| 5 to 9 Unit Apartments | 0 | 0.0% |
| 10 or more Apartments | 0 | 0.0% |
| Mobile Home / Other | 33 | 12.8% |
| Total | 257 | 100.0% |
Housing Structures by Occupancy in Paxton
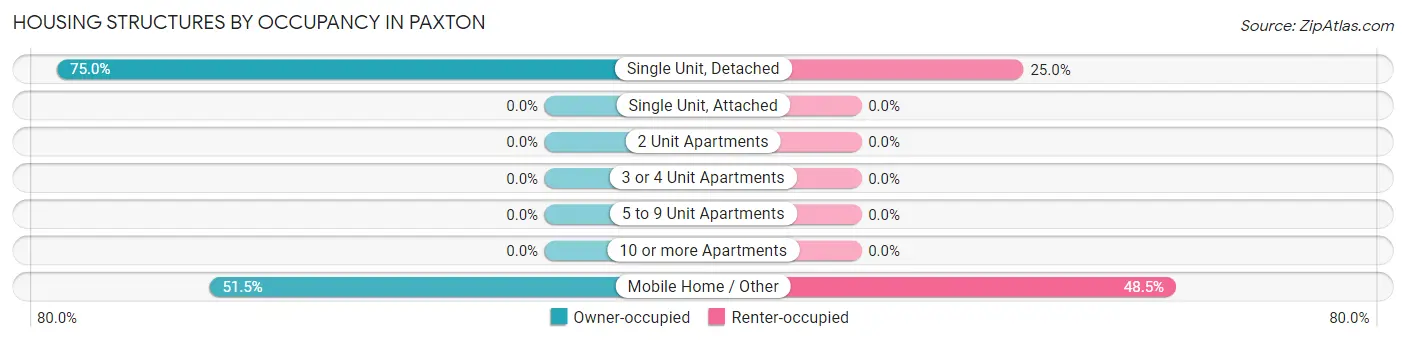
| Structure Type | Owner-occupied | Renter-occupied |
| Single Unit, Detached | 168 (75.0%) | 56 (25.0%) |
| Single Unit, Attached | 0 (0.0%) | 0 (0.0%) |
| 2 Unit Apartments | 0 (0.0%) | 0 (0.0%) |
| 3 or 4 Unit Apartments | 0 (0.0%) | 0 (0.0%) |
| 5 to 9 Unit Apartments | 0 (0.0%) | 0 (0.0%) |
| 10 or more Apartments | 0 (0.0%) | 0 (0.0%) |
| Mobile Home / Other | 17 (51.5%) | 16 (48.5%) |
| Total | 185 (72.0%) | 72 (28.0%) |
Housing Structures by Number of Rooms in Paxton
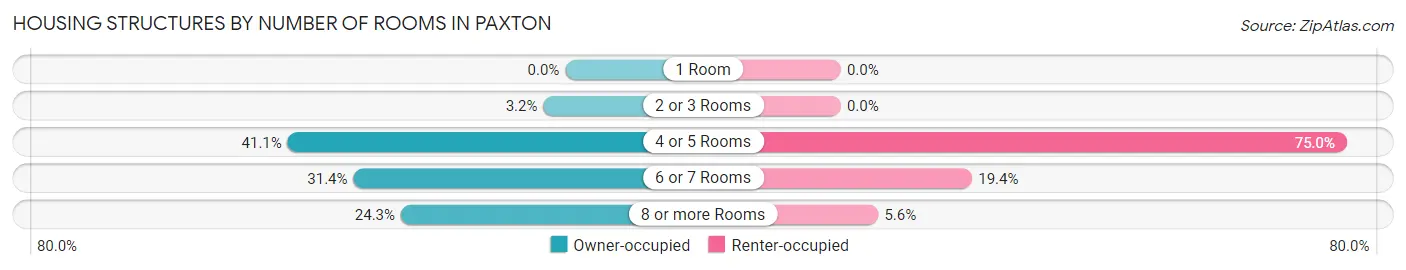
| Number of Rooms | Owner-occupied | Renter-occupied |
| 1 Room | 0 (0.0%) | 0 (0.0%) |
| 2 or 3 Rooms | 6 (3.2%) | 0 (0.0%) |
| 4 or 5 Rooms | 76 (41.1%) | 54 (75.0%) |
| 6 or 7 Rooms | 58 (31.4%) | 14 (19.4%) |
| 8 or more Rooms | 45 (24.3%) | 4 (5.6%) |
| Total | 185 (100.0%) | 72 (100.0%) |
Housing Structure by Heating Type in Paxton
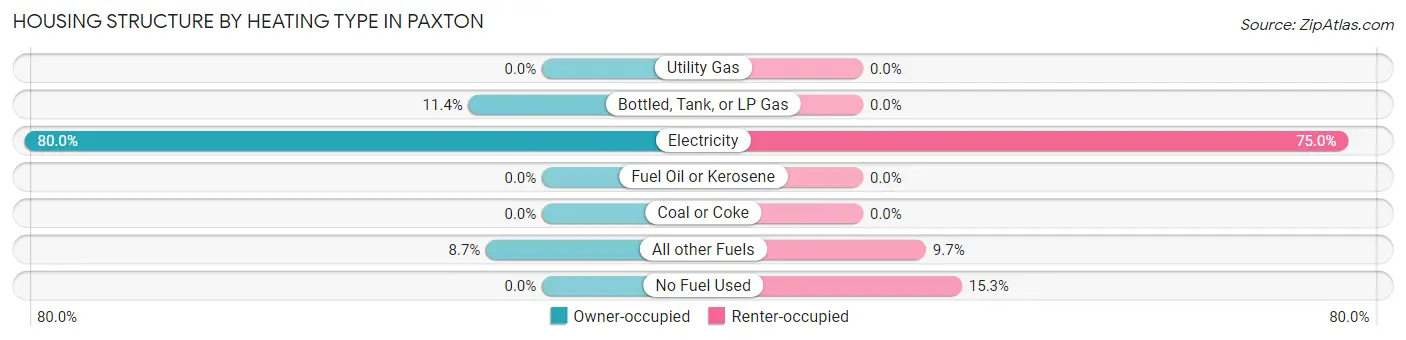
| Heating Type | Owner-occupied | Renter-occupied |
| Utility Gas | 0 (0.0%) | 0 (0.0%) |
| Bottled, Tank, or LP Gas | 21 (11.4%) | 0 (0.0%) |
| Electricity | 148 (80.0%) | 54 (75.0%) |
| Fuel Oil or Kerosene | 0 (0.0%) | 0 (0.0%) |
| Coal or Coke | 0 (0.0%) | 0 (0.0%) |
| All other Fuels | 16 (8.6%) | 7 (9.7%) |
| No Fuel Used | 0 (0.0%) | 11 (15.3%) |
| Total | 185 (100.0%) | 72 (100.0%) |
Household Vehicle Usage in Paxton
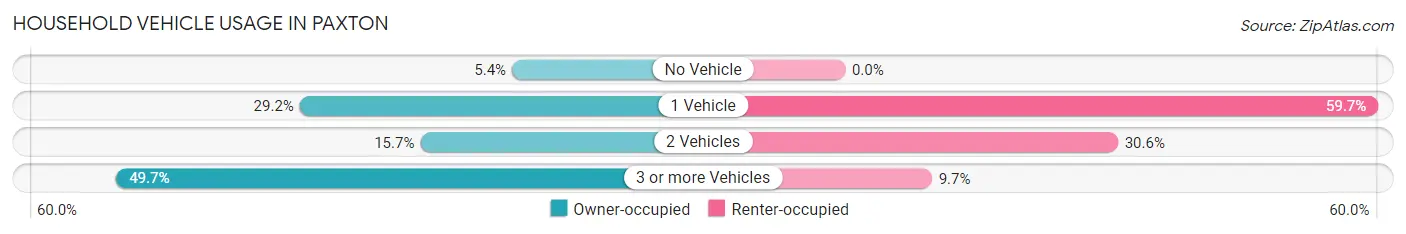
| Vehicles per Household | Owner-occupied | Renter-occupied |
| No Vehicle | 10 (5.4%) | 0 (0.0%) |
| 1 Vehicle | 54 (29.2%) | 43 (59.7%) |
| 2 Vehicles | 29 (15.7%) | 22 (30.6%) |
| 3 or more Vehicles | 92 (49.7%) | 7 (9.7%) |
| Total | 185 (100.0%) | 72 (100.0%) |
Real Estate & Mortgages in Paxton
Real Estate and Mortgage Overview in Paxton
| Characteristic | Without Mortgage | With Mortgage |
| Housing Units | 114 | 71 |
| Median Property Value | $111,500 | $193,800 |
| Median Household Income | $54,286 | $3 |
| Monthly Housing Costs | $350 | $0 |
| Real Estate Taxes | $364 | $5 |
Property Value by Mortgage Status in Paxton
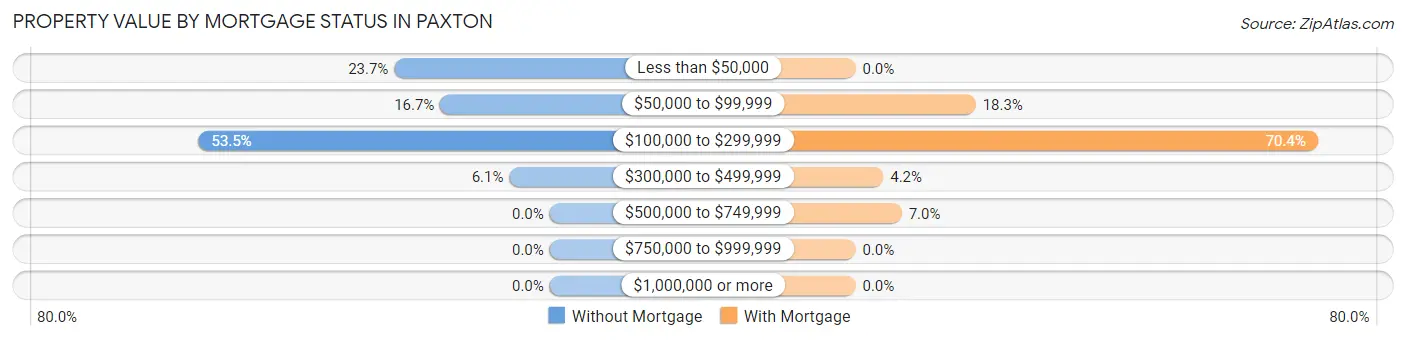
| Property Value | Without Mortgage | With Mortgage |
| Less than $50,000 | 27 (23.7%) | 0 (0.0%) |
| $50,000 to $99,999 | 19 (16.7%) | 13 (18.3%) |
| $100,000 to $299,999 | 61 (53.5%) | 50 (70.4%) |
| $300,000 to $499,999 | 7 (6.1%) | 3 (4.2%) |
| $500,000 to $749,999 | 0 (0.0%) | 5 (7.0%) |
| $750,000 to $999,999 | 0 (0.0%) | 0 (0.0%) |
| $1,000,000 or more | 0 (0.0%) | 0 (0.0%) |
| Total | 114 (100.0%) | 71 (100.0%) |
Household Income by Mortgage Status in Paxton
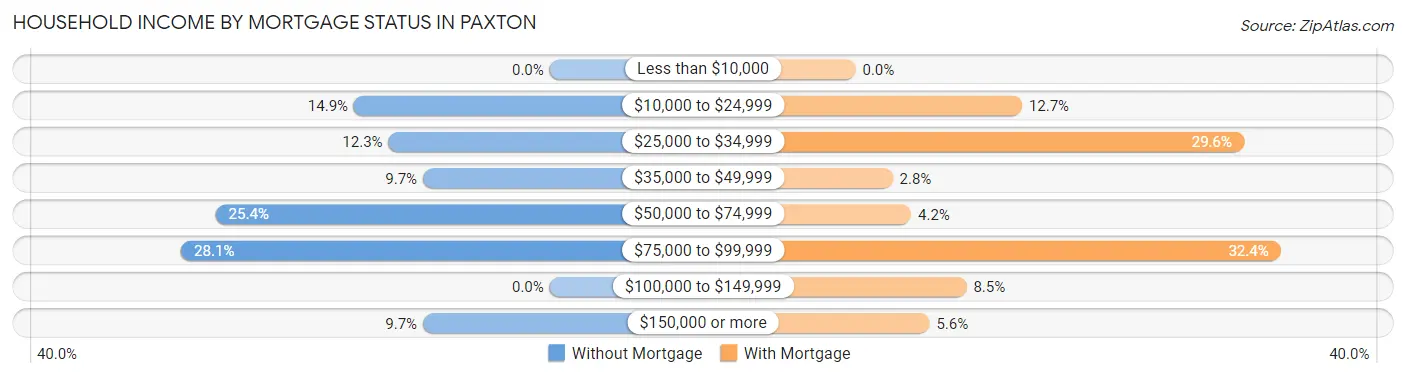
| Household Income | Without Mortgage | With Mortgage |
| Less than $10,000 | 0 (0.0%) | 0 (0.0%) |
| $10,000 to $24,999 | 17 (14.9%) | 9 (12.7%) |
| $25,000 to $34,999 | 14 (12.3%) | 21 (29.6%) |
| $35,000 to $49,999 | 11 (9.7%) | 2 (2.8%) |
| $50,000 to $74,999 | 29 (25.4%) | 3 (4.2%) |
| $75,000 to $99,999 | 32 (28.1%) | 23 (32.4%) |
| $100,000 to $149,999 | 0 (0.0%) | 6 (8.5%) |
| $150,000 or more | 11 (9.7%) | 4 (5.6%) |
| Total | 114 (100.0%) | 71 (100.0%) |
Property Value to Household Income Ratio in Paxton
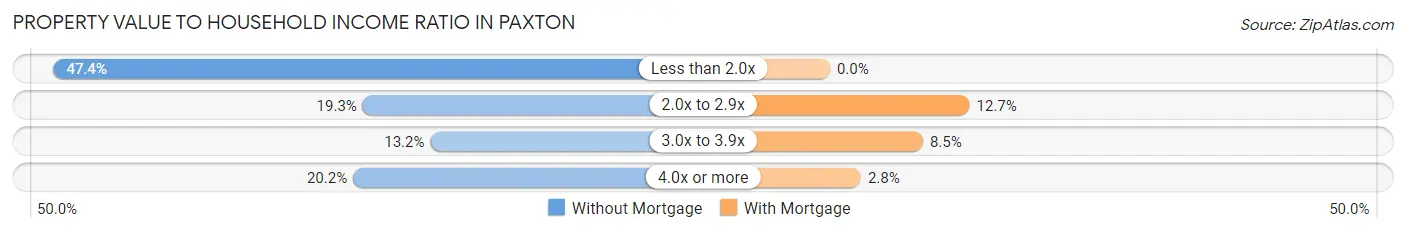
| Value-to-Income Ratio | Without Mortgage | With Mortgage |
| Less than 2.0x | 54 (47.4%) | 0 (0.0%) |
| 2.0x to 2.9x | 22 (19.3%) | 9 (12.7%) |
| 3.0x to 3.9x | 15 (13.2%) | 6 (8.5%) |
| 4.0x or more | 23 (20.2%) | 2 (2.8%) |
| Total | 114 (100.0%) | 71 (100.0%) |
Real Estate Taxes by Mortgage Status in Paxton
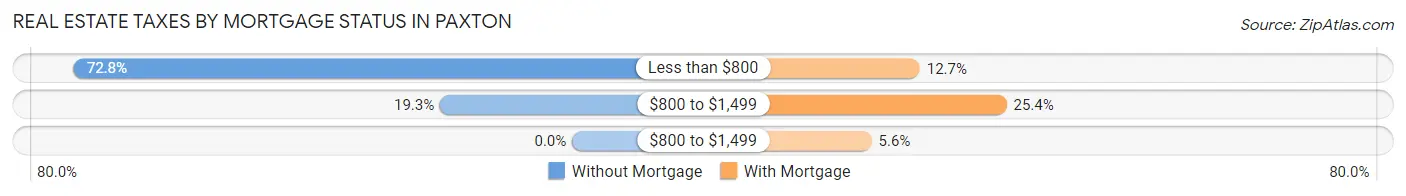
| Property Taxes | Without Mortgage | With Mortgage |
| Less than $800 | 83 (72.8%) | 9 (12.7%) |
| $800 to $1,499 | 22 (19.3%) | 18 (25.4%) |
| $800 to $1,499 | 0 (0.0%) | 4 (5.6%) |
| Total | 114 (100.0%) | 71 (100.0%) |
Health & Disability in Paxton
Health Insurance Coverage by Age in Paxton
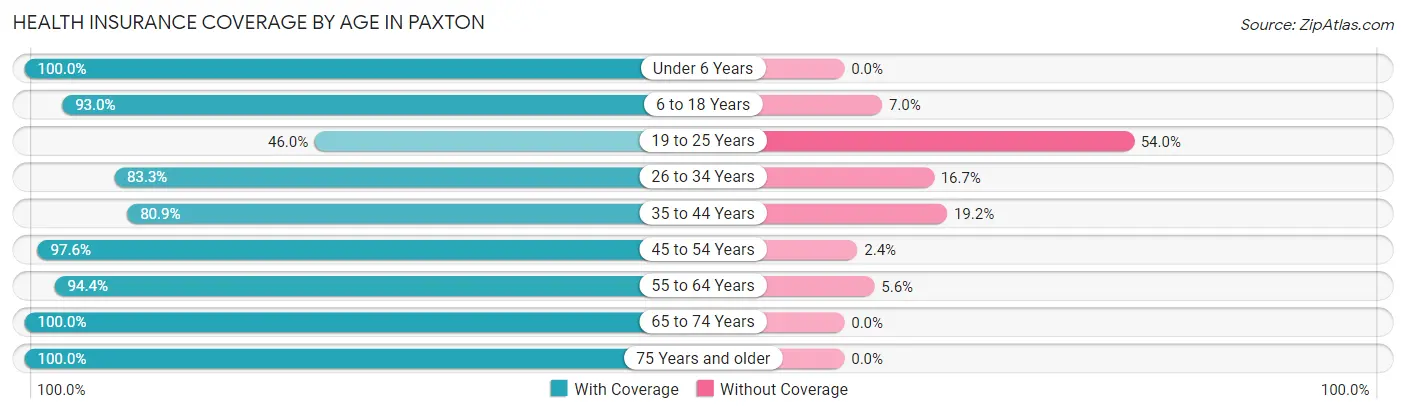
| Age Bracket | With Coverage | Without Coverage |
| Under 6 Years | 28 (100.0%) | 0 (0.0%) |
| 6 to 18 Years | 53 (93.0%) | 4 (7.0%) |
| 19 to 25 Years | 29 (46.0%) | 34 (54.0%) |
| 26 to 34 Years | 20 (83.3%) | 4 (16.7%) |
| 35 to 44 Years | 38 (80.8%) | 9 (19.2%) |
| 45 to 54 Years | 120 (97.6%) | 3 (2.4%) |
| 55 to 64 Years | 101 (94.4%) | 6 (5.6%) |
| 65 to 74 Years | 73 (100.0%) | 0 (0.0%) |
| 75 Years and older | 61 (100.0%) | 0 (0.0%) |
| Total | 523 (89.7%) | 60 (10.3%) |
Health Insurance Coverage by Citizenship Status in Paxton
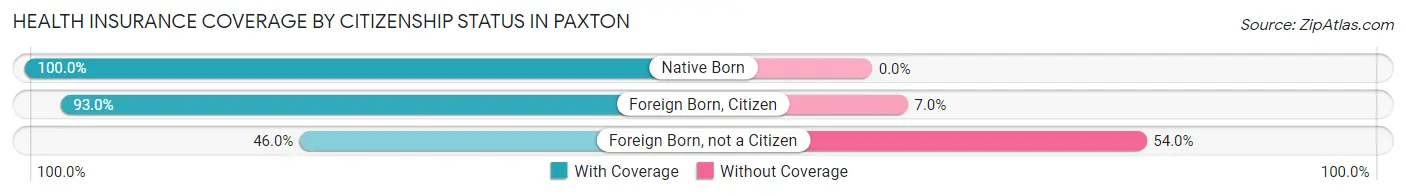
| Citizenship Status | With Coverage | Without Coverage |
| Native Born | 28 (100.0%) | 0 (0.0%) |
| Foreign Born, Citizen | 53 (93.0%) | 4 (7.0%) |
| Foreign Born, not a Citizen | 29 (46.0%) | 34 (54.0%) |
Health Insurance Coverage by Household Income in Paxton
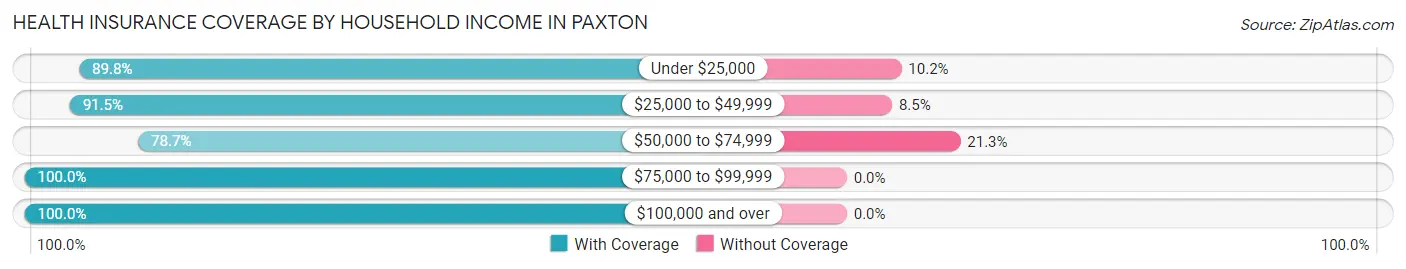
| Household Income | With Coverage | Without Coverage |
| Under $25,000 | 79 (89.8%) | 9 (10.2%) |
| $25,000 to $49,999 | 119 (91.5%) | 11 (8.5%) |
| $50,000 to $74,999 | 148 (78.7%) | 40 (21.3%) |
| $75,000 to $99,999 | 119 (100.0%) | 0 (0.0%) |
| $100,000 and over | 58 (100.0%) | 0 (0.0%) |
Public vs Private Health Insurance Coverage by Age in Paxton
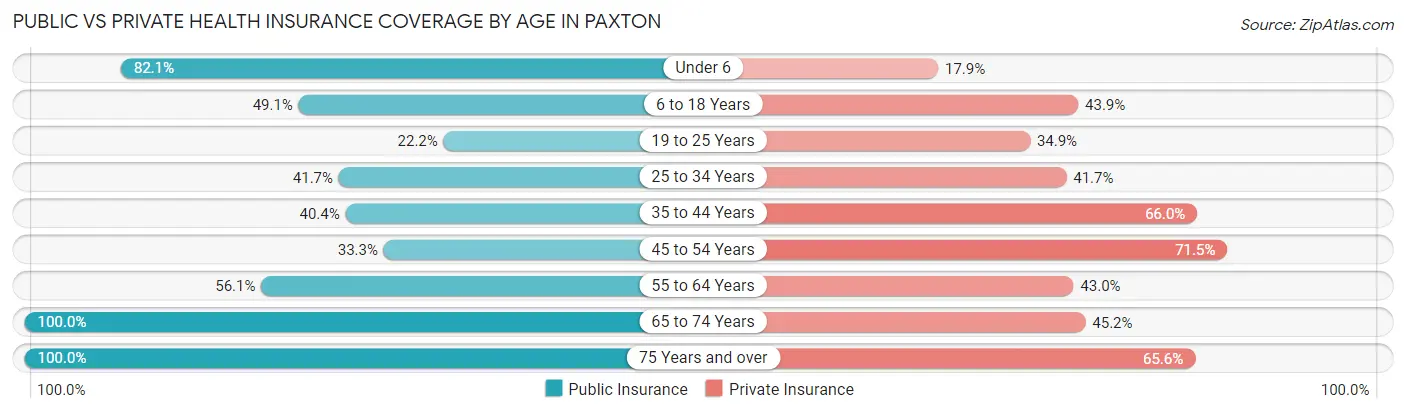
| Age Bracket | Public Insurance | Private Insurance |
| Under 6 | 23 (82.1%) | 5 (17.9%) |
| 6 to 18 Years | 28 (49.1%) | 25 (43.9%) |
| 19 to 25 Years | 14 (22.2%) | 22 (34.9%) |
| 25 to 34 Years | 10 (41.7%) | 10 (41.7%) |
| 35 to 44 Years | 19 (40.4%) | 31 (66.0%) |
| 45 to 54 Years | 41 (33.3%) | 88 (71.5%) |
| 55 to 64 Years | 60 (56.1%) | 46 (43.0%) |
| 65 to 74 Years | 73 (100.0%) | 33 (45.2%) |
| 75 Years and over | 61 (100.0%) | 40 (65.6%) |
| Total | 329 (56.4%) | 300 (51.5%) |
Disability Status by Sex by Age in Paxton
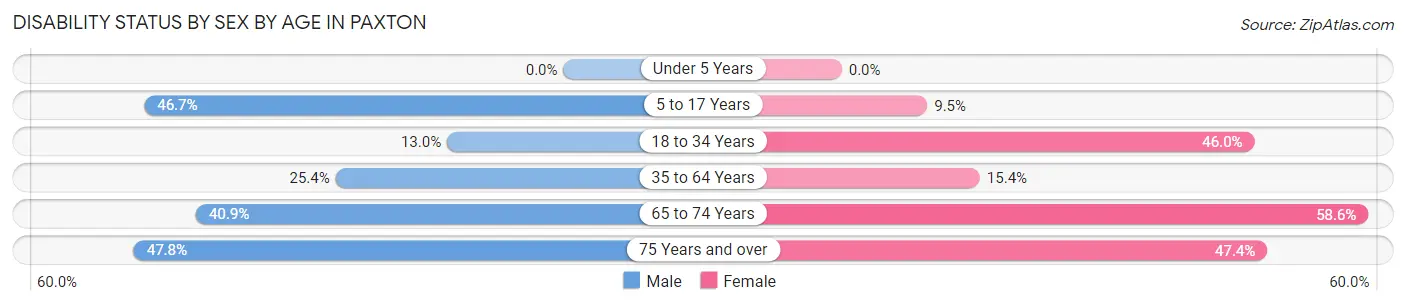
| Age Bracket | Male | Female |
| Under 5 Years | 0 (0.0%) | 0 (0.0%) |
| 5 to 17 Years | 7 (46.7%) | 4 (9.5%) |
| 18 to 34 Years | 7 (13.0%) | 17 (46.0%) |
| 35 to 64 Years | 34 (25.4%) | 22 (15.4%) |
| 65 to 74 Years | 18 (40.9%) | 17 (58.6%) |
| 75 Years and over | 11 (47.8%) | 18 (47.4%) |
Disability Class by Sex by Age in Paxton
Disability Class: Hearing Difficulty
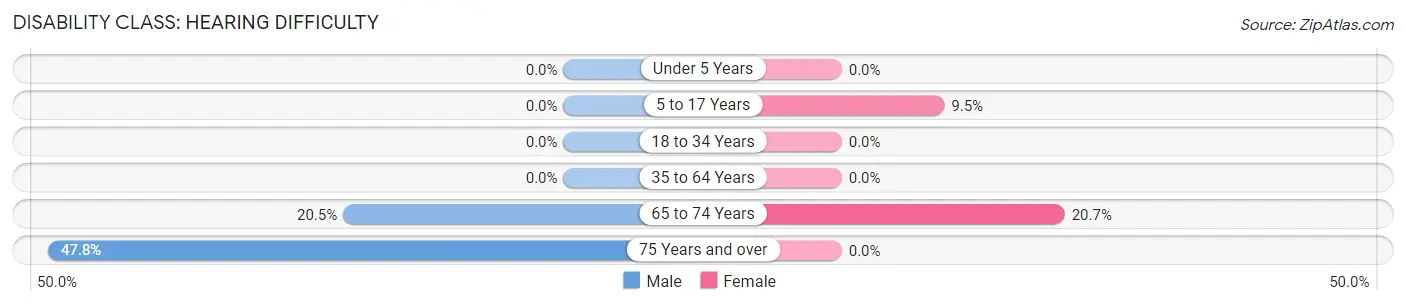
| Age Bracket | Male | Female |
| Under 5 Years | 0 (0.0%) | 0 (0.0%) |
| 5 to 17 Years | 0 (0.0%) | 4 (9.5%) |
| 18 to 34 Years | 0 (0.0%) | 0 (0.0%) |
| 35 to 64 Years | 0 (0.0%) | 0 (0.0%) |
| 65 to 74 Years | 9 (20.4%) | 6 (20.7%) |
| 75 Years and over | 11 (47.8%) | 0 (0.0%) |
Disability Class: Vision Difficulty
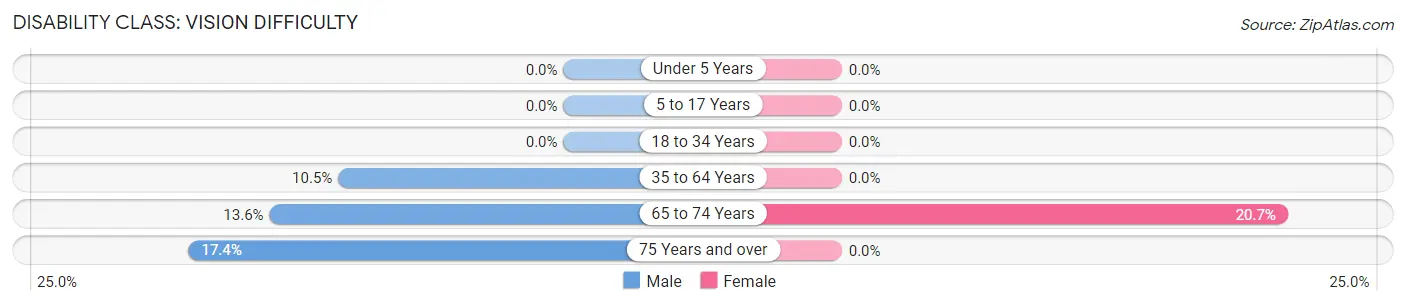
| Age Bracket | Male | Female |
| Under 5 Years | 0 (0.0%) | 0 (0.0%) |
| 5 to 17 Years | 0 (0.0%) | 0 (0.0%) |
| 18 to 34 Years | 0 (0.0%) | 0 (0.0%) |
| 35 to 64 Years | 14 (10.4%) | 0 (0.0%) |
| 65 to 74 Years | 6 (13.6%) | 6 (20.7%) |
| 75 Years and over | 4 (17.4%) | 0 (0.0%) |
Disability Class: Cognitive Difficulty
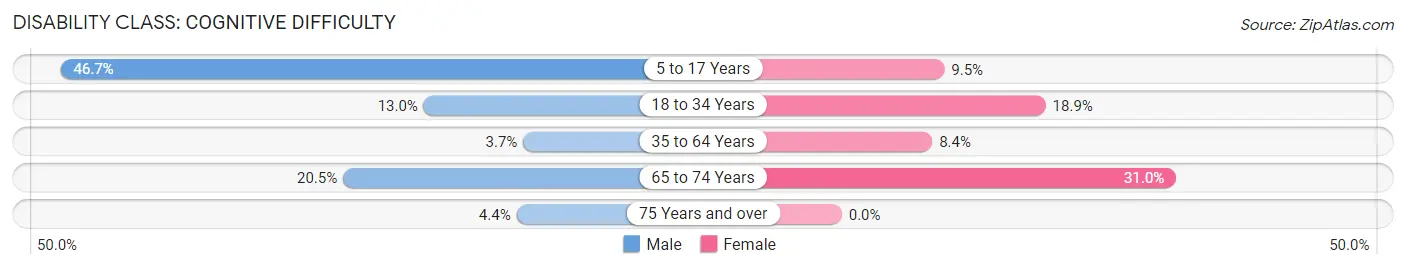
| Age Bracket | Male | Female |
| 5 to 17 Years | 7 (46.7%) | 4 (9.5%) |
| 18 to 34 Years | 7 (13.0%) | 7 (18.9%) |
| 35 to 64 Years | 5 (3.7%) | 12 (8.4%) |
| 65 to 74 Years | 9 (20.4%) | 9 (31.0%) |
| 75 Years and over | 1 (4.3%) | 0 (0.0%) |
Disability Class: Ambulatory Difficulty
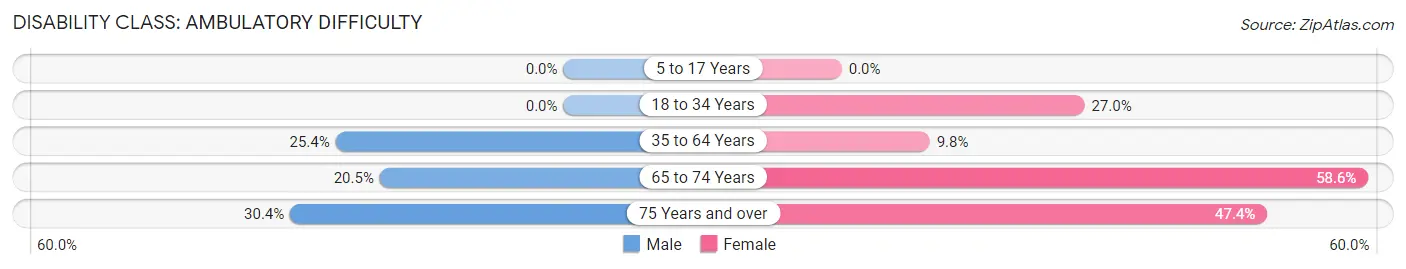
| Age Bracket | Male | Female |
| 5 to 17 Years | 0 (0.0%) | 0 (0.0%) |
| 18 to 34 Years | 0 (0.0%) | 10 (27.0%) |
| 35 to 64 Years | 34 (25.4%) | 14 (9.8%) |
| 65 to 74 Years | 9 (20.4%) | 17 (58.6%) |
| 75 Years and over | 7 (30.4%) | 18 (47.4%) |
Disability Class: Self-Care Difficulty
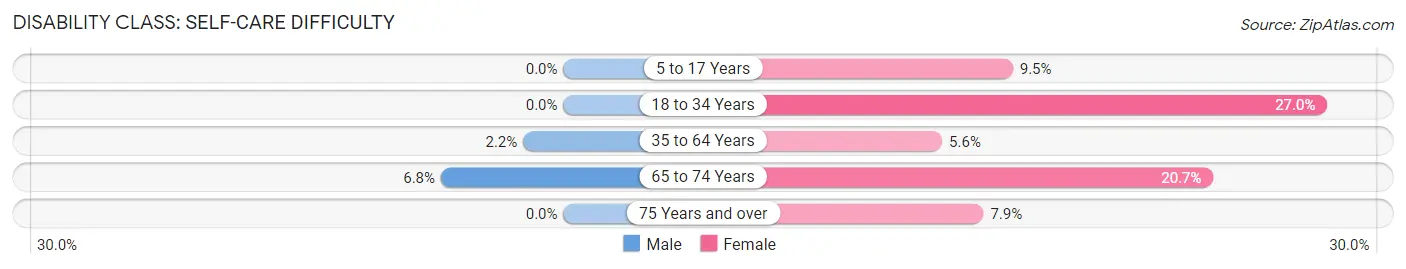
| Age Bracket | Male | Female |
| 5 to 17 Years | 0 (0.0%) | 4 (9.5%) |
| 18 to 34 Years | 0 (0.0%) | 10 (27.0%) |
| 35 to 64 Years | 3 (2.2%) | 8 (5.6%) |
| 65 to 74 Years | 3 (6.8%) | 6 (20.7%) |
| 75 Years and over | 0 (0.0%) | 3 (7.9%) |
Technology Access in Paxton
Computing Device Access in Paxton
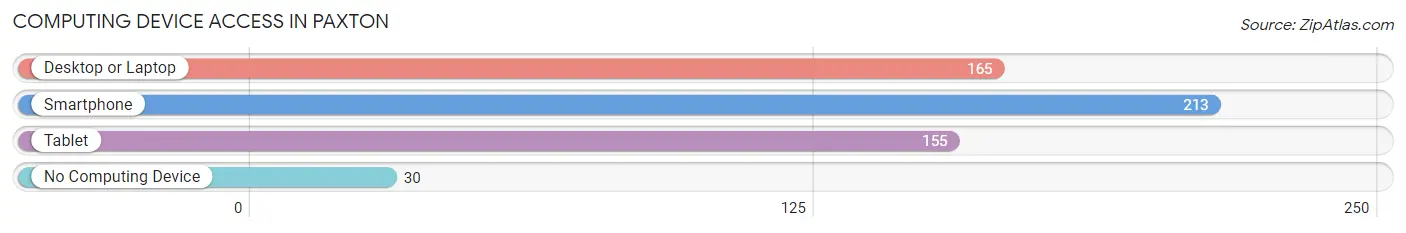
| Device Type | # Households | % Households |
| Desktop or Laptop | 165 | 64.2% |
| Smartphone | 213 | 82.9% |
| Tablet | 155 | 60.3% |
| No Computing Device | 30 | 11.7% |
| Total | 257 | 100.0% |
Internet Access in Paxton
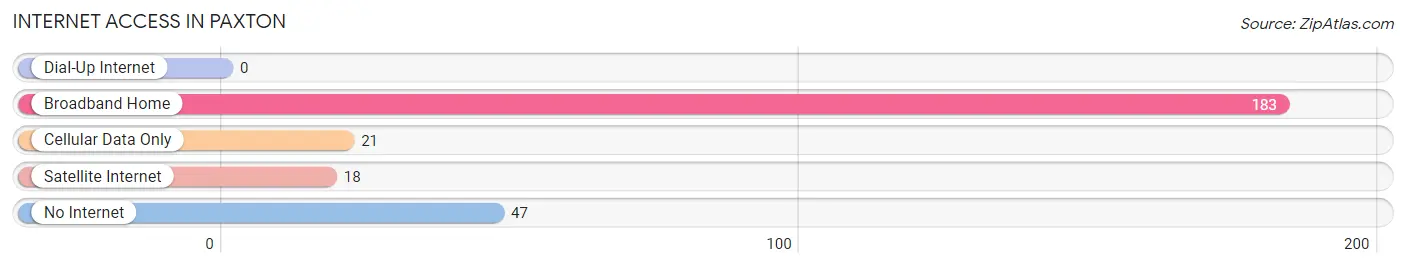
| Internet Type | # Households | % Households |
| Dial-Up Internet | 0 | 0.0% |
| Broadband Home | 183 | 71.2% |
| Cellular Data Only | 21 | 8.2% |
| Satellite Internet | 18 | 7.0% |
| No Internet | 47 | 18.3% |
| Total | 257 | 100.0% |
Paxton Summary
Paxton is a small town located in Walton County, Florida. It is situated on the Choctawhatchee Bay, about 20 miles east of the state capital, Tallahassee. The town was founded in 1883 and was named after the first postmaster, William Paxton. The population of Paxton was estimated to be 1,093 in 2019.
Geography
Paxton is located in the Florida Panhandle, in the northwest corner of Walton County. It is situated on the Choctawhatchee Bay, about 20 miles east of the state capital, Tallahassee. The town is bordered by the Choctawhatchee Bay to the north, the Choctawhatchee River to the east, and the Blackwater River to the south. The town is located in a rural area, with the nearest major city being Pensacola, which is about 50 miles away.
The terrain of Paxton is mostly flat, with some rolling hills. The town is located in a humid subtropical climate zone, with hot, humid summers and mild winters. The average annual temperature is around 70 degrees Fahrenheit, with the average high in the summer months reaching around 90 degrees Fahrenheit.
Economy
The economy of Paxton is largely based on agriculture and tourism. The town is home to several farms, which produce a variety of crops, including corn, soybeans, cotton, and peanuts. The town is also home to several seafood processing plants, which process and package seafood for local restaurants and markets.
Tourism is also an important part of the local economy. The town is home to several popular attractions, including the Paxton Beach, which is a popular spot for swimming, fishing, and boating. The town is also home to several parks, including the Paxton Park, which features a playground, picnic areas, and a walking trail.
Demographics
As of 2019, the population of Paxton was estimated to be 1,093. The population is predominantly white, with about 85% of the population identifying as white. The remaining 15% of the population is made up of African Americans, Hispanics, and other races. The median household income in Paxton is around $37,000, which is slightly lower than the national average.
The town is served by the Walton County School District, which operates several elementary, middle, and high schools in the area. The town is also home to several churches, including the First Baptist Church of Paxton, which was founded in 1883.
Conclusion
Paxton is a small town located in Walton County, Florida. It is situated on the Choctawhatchee Bay, about 20 miles east of the state capital, Tallahassee. The town was founded in 1883 and was named after the first postmaster, William Paxton. The population of Paxton was estimated to be 1,093 in 2019. The economy of Paxton is largely based on agriculture and tourism, and the population is predominantly white. The town is served by the Walton County School District, and is home to several churches and popular attractions.
Common Questions
What is Per Capita Income in Paxton?
Per Capita income in Paxton is $25,383.
What is the Median Family Income in Paxton?
Median Family Income in Paxton is $57,266.
What is the Median Household income in Paxton?
Median Household Income in Paxton is $53,295.
What is Income or Wage Gap in Paxton?
Income or Wage Gap in Paxton is 23.9%.
Women in Paxton earn 76.1 cents for every dollar earned by a man.
What is Inequality or Gini Index in Paxton?
Inequality or Gini Index in Paxton is 0.40.
What is the Total Population of Paxton?
Total Population of Paxton is 583.
What is the Total Male Population of Paxton?
Total Male Population of Paxton is 294.
What is the Total Female Population of Paxton?
Total Female Population of Paxton is 289.
What is the Ratio of Males per 100 Females in Paxton?
There are 101.73 Males per 100 Females in Paxton.
What is the Ratio of Females per 100 Males in Paxton?
There are 98.30 Females per 100 Males in Paxton.
What is the Median Population Age in Paxton?
Median Population Age in Paxton is 49.4 Years.
What is the Average Family Size in Paxton
Average Family Size in Paxton is 2.6 People.
What is the Average Household Size in Paxton
Average Household Size in Paxton is 2.3 People.
How Large is the Labor Force in Paxton?
There are 279 People in the Labor Forcein in Paxton.
What is the Percentage of People in the Labor Force in Paxton?
52.7% of People are in the Labor Force in Paxton.
What is the Unemployment Rate in Paxton?
Unemployment Rate in Paxton is 12.2%.