Patrick AFB, FL Map & Demographics
Patrick AFB Map
Patrick AFB Overview
$33,688
PER CAPITA INCOME
$79,271
AVG FAMILY INCOME
$76,667
AVG HOUSEHOLD INCOME
20.1%
WAGE / INCOME GAP [ % ]
79.9¢/ $1
WAGE / INCOME GAP [ $ ]
0.42
INEQUALITY / GINI INDEX
1,606
TOTAL POPULATION
906
MALE POPULATION
700
FEMALE POPULATION
129.43
MALES / 100 FEMALES
77.26
FEMALES / 100 MALES
25.8
MEDIAN AGE
3.2
AVG FAMILY SIZE
2.9
AVG HOUSEHOLD SIZE
756
LABOR FORCE [ PEOPLE ]
63.0%
PERCENT IN LABOR FORCE
1.7%
UNEMPLOYMENT RATE
Patrick AFB Zip Codes
Income in Patrick AFB
Income Overview in Patrick AFB
Per Capita Income in Patrick AFB is $33,688, while median incomes of families and households are $79,271 and $76,667 respectively.
| Characteristic | Number | Measure |
| Per Capita Income | 1,606 | $33,688 |
| Median Family Income | 425 | $79,271 |
| Mean Family Income | 425 | $103,143 |
| Median Household Income | 516 | $76,667 |
| Mean Household Income | 516 | $97,785 |
| Income Deficit | 425 | $0 |
| Wage / Income Gap (%) | 1,606 | 20.07% |
| Wage / Income Gap ($) | 1,606 | 79.93¢ per $1 |
| Gini / Inequality Index | 1,606 | 0.42 |
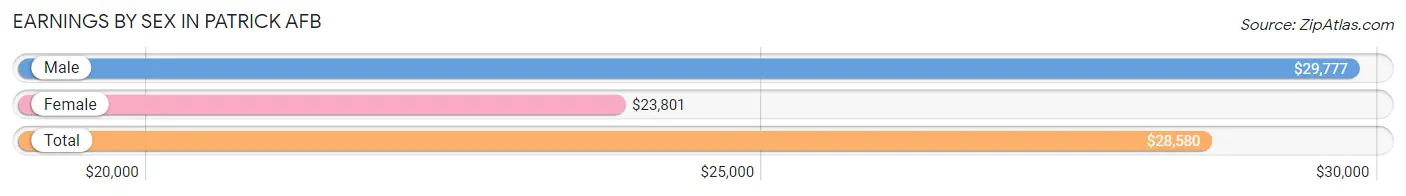
Earnings by Sex in Patrick AFB
Average Earnings in Patrick AFB are $28,580, $29,777 for men and $23,801 for women, a difference of 20.1%.
| Sex | Number | Average Earnings |
| Male | 495 (61.3%) | $29,777 |
| Female | 313 (38.7%) | $23,801 |
| Total | 808 (100.0%) | $28,580 |
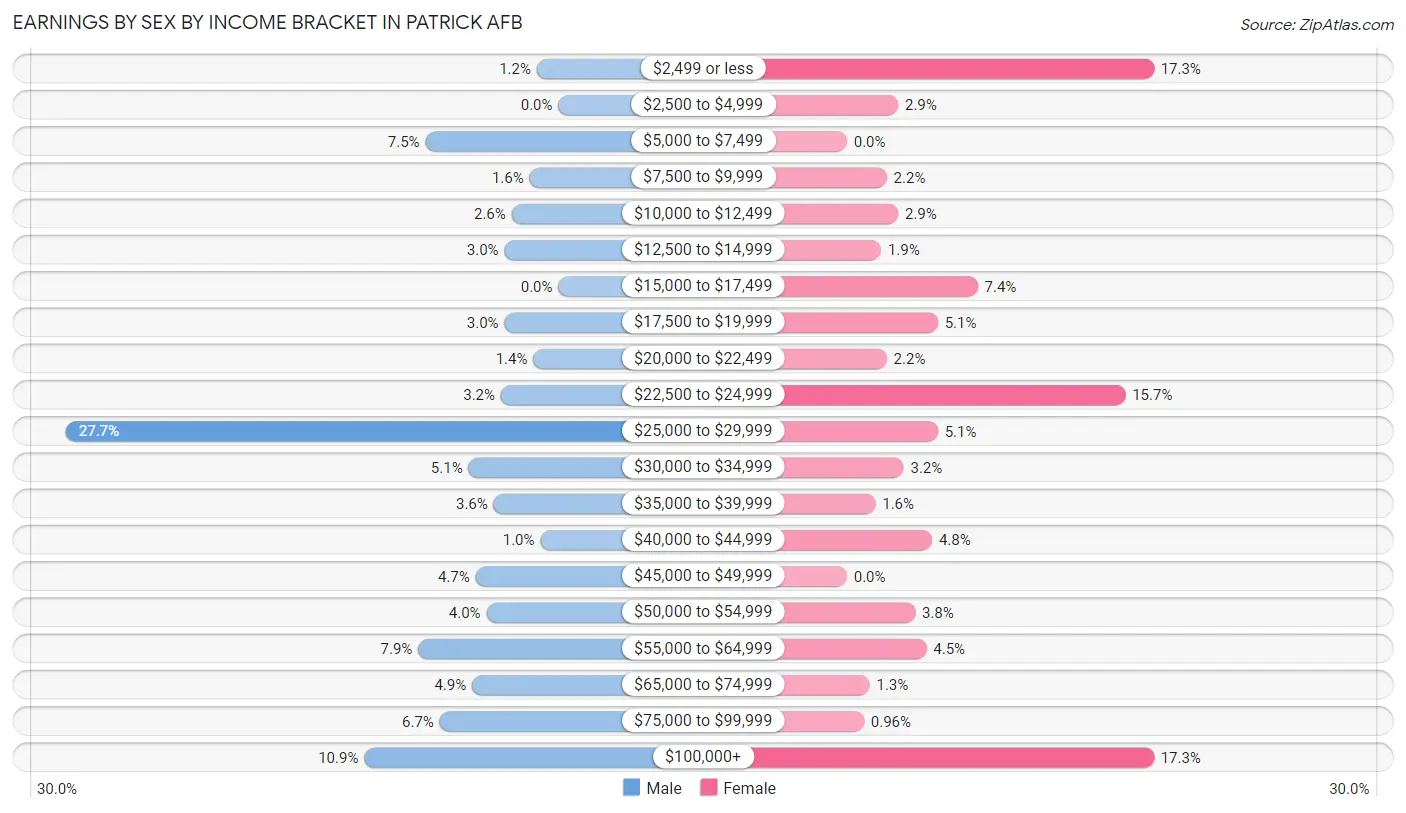
Earnings by Sex by Income Bracket in Patrick AFB
The most common earnings brackets in Patrick AFB are $25,000 to $29,999 for men (137 | 27.7%) and $2,499 or less for women (54 | 17.2%).
| Income | Male | Female |
| $2,499 or less | 6 (1.2%) | 54 (17.2%) |
| $2,500 to $4,999 | 0 (0.0%) | 9 (2.9%) |
| $5,000 to $7,499 | 37 (7.5%) | 0 (0.0%) |
| $7,500 to $9,999 | 8 (1.6%) | 7 (2.2%) |
| $10,000 to $12,499 | 13 (2.6%) | 9 (2.9%) |
| $12,500 to $14,999 | 15 (3.0%) | 6 (1.9%) |
| $15,000 to $17,499 | 0 (0.0%) | 23 (7.3%) |
| $17,500 to $19,999 | 15 (3.0%) | 16 (5.1%) |
| $20,000 to $22,499 | 7 (1.4%) | 7 (2.2%) |
| $22,500 to $24,999 | 16 (3.2%) | 49 (15.7%) |
| $25,000 to $29,999 | 137 (27.7%) | 16 (5.1%) |
| $30,000 to $34,999 | 25 (5.1%) | 10 (3.2%) |
| $35,000 to $39,999 | 18 (3.6%) | 5 (1.6%) |
| $40,000 to $44,999 | 5 (1.0%) | 15 (4.8%) |
| $45,000 to $49,999 | 23 (4.6%) | 0 (0.0%) |
| $50,000 to $54,999 | 20 (4.0%) | 12 (3.8%) |
| $55,000 to $64,999 | 39 (7.9%) | 14 (4.5%) |
| $65,000 to $74,999 | 24 (4.9%) | 4 (1.3%) |
| $75,000 to $99,999 | 33 (6.7%) | 3 (1.0%) |
| $100,000+ | 54 (10.9%) | 54 (17.2%) |
| Total | 495 (100.0%) | 313 (100.0%) |
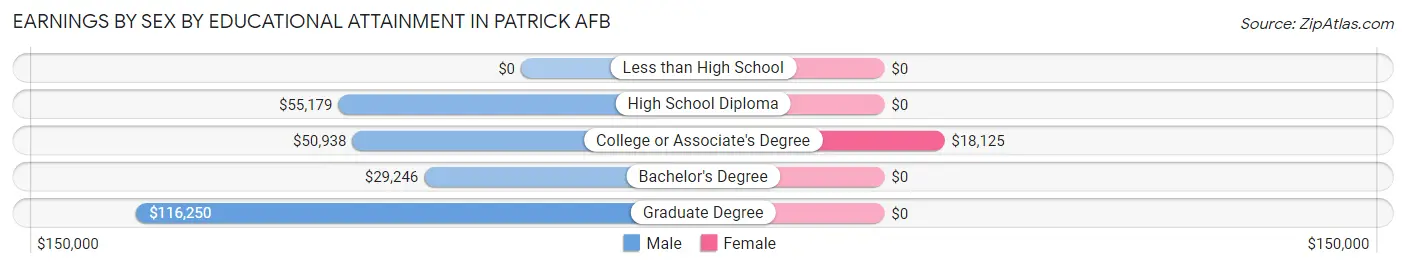
Earnings by Sex by Educational Attainment in Patrick AFB
Average earnings in Patrick AFB are $50,313 for men and $26,250 for women, a difference of 47.8%. Men with an educational attainment of graduate degree enjoy the highest average annual earnings of $116,250, while those with bachelor's degree education earn the least with $29,246. Women with an educational attainment of college or associate's degree earn the most with the average annual earnings of $18,125, while those with college or associate's degree education have the smallest earnings of $18,125.
| Educational Attainment | Male Income | Female Income |
| Less than High School | - | - |
| High School Diploma | $55,179 | $0 |
| College or Associate's Degree | $50,938 | $18,125 |
| Bachelor's Degree | $29,246 | $0 |
| Graduate Degree | $116,250 | $0 |
| Total | $50,313 | $26,250 |
Family Income in Patrick AFB
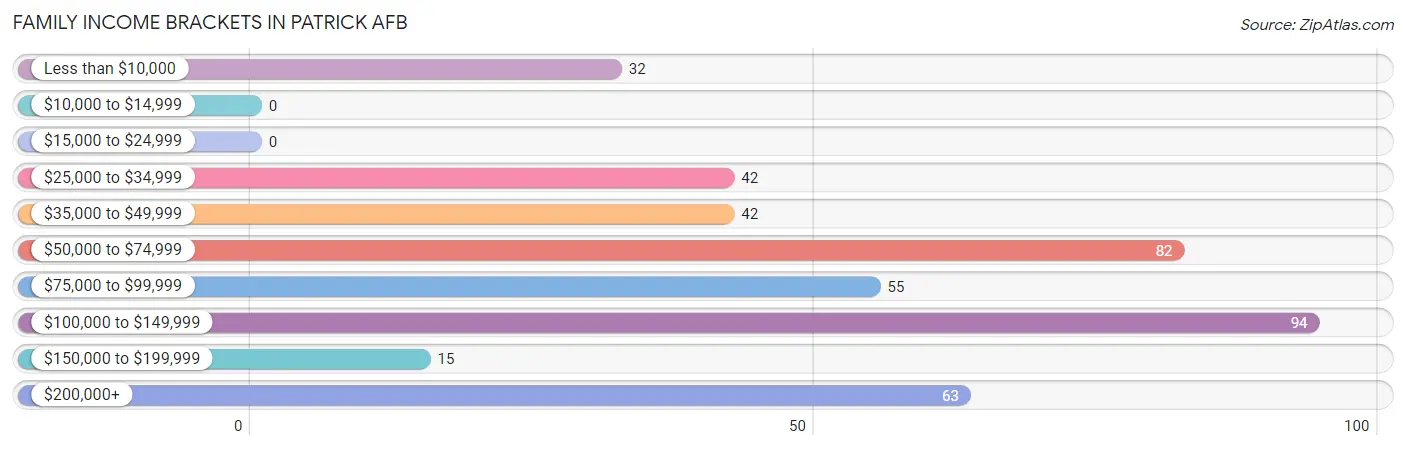
Family Income Brackets in Patrick AFB
According to the Patrick AFB family income data, there are 94 families falling into the $100,000 to $149,999 income range, which is the most common income bracket and makes up 22.1% of all families.
| Income Bracket | # Families | % Families |
| Less than $10,000 | 32 | 7.5% |
| $10,000 to $14,999 | 0 | 0.0% |
| $15,000 to $24,999 | 0 | 0.0% |
| $25,000 to $34,999 | 42 | 9.9% |
| $35,000 to $49,999 | 42 | 9.9% |
| $50,000 to $74,999 | 82 | 19.3% |
| $75,000 to $99,999 | 55 | 12.9% |
| $100,000 to $149,999 | 94 | 22.1% |
| $150,000 to $199,999 | 15 | 3.5% |
| $200,000+ | 63 | 14.8% |
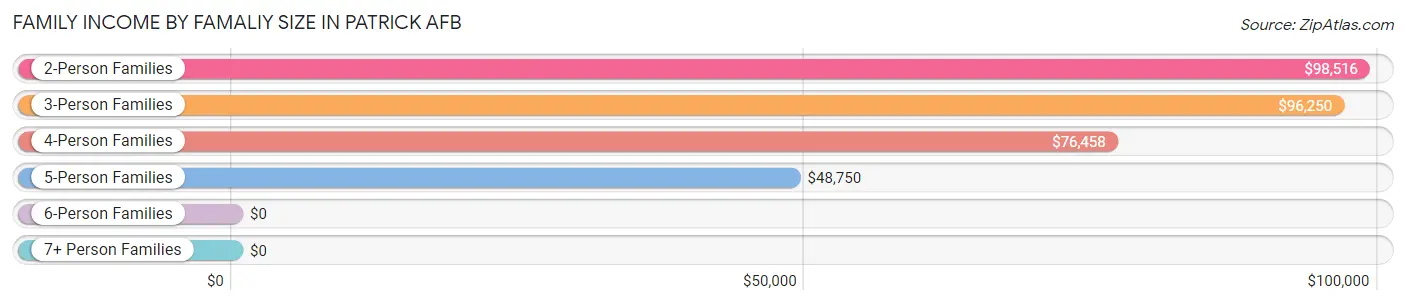
Family Income by Famaliy Size in Patrick AFB
2-person families (183 | 43.1%) account for the highest median family income in Patrick AFB with $98,516 per family, while 2-person families (183 | 43.1%) have the highest median income of $49,258 per family member.
| Income Bracket | # Families | Median Income |
| 2-Person Families | 183 (43.1%) | $98,516 |
| 3-Person Families | 86 (20.2%) | $96,250 |
| 4-Person Families | 119 (28.0%) | $76,458 |
| 5-Person Families | 37 (8.7%) | $48,750 |
| 6-Person Families | 0 (0.0%) | $0 |
| 7+ Person Families | 0 (0.0%) | $0 |
| Total | 425 (100.0%) | $79,271 |
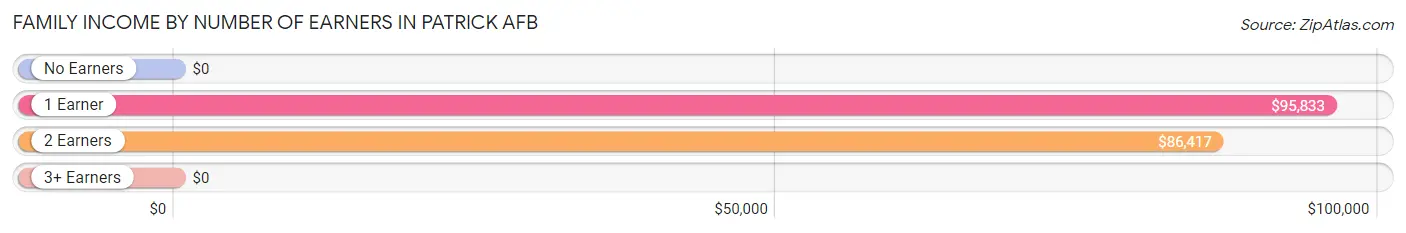
Family Income by Number of Earners in Patrick AFB
| Number of Earners | # Families | Median Income |
| No Earners | 44 (10.3%) | $0 |
| 1 Earner | 208 (48.9%) | $95,833 |
| 2 Earners | 159 (37.4%) | $86,417 |
| 3+ Earners | 14 (3.3%) | $0 |
| Total | 425 (100.0%) | $79,271 |
Household Income in Patrick AFB
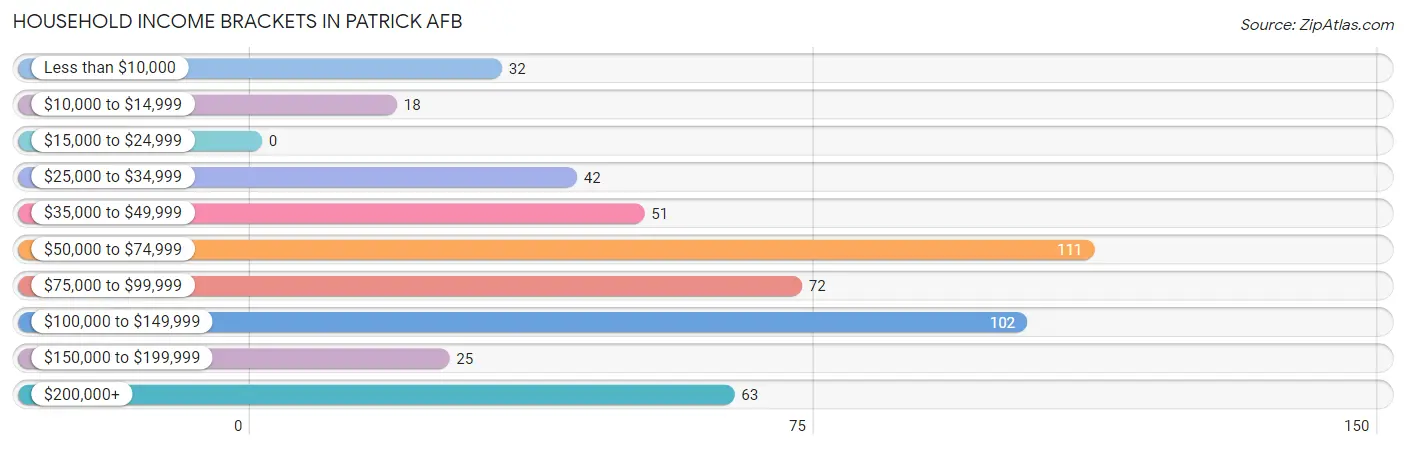
Household Income Brackets in Patrick AFB
With 111 households falling in the category, the $50,000 to $74,999 income range is the most frequent in Patrick AFB, accounting for 21.5% of all households.
| Income Bracket | # Households | % Households |
| Less than $10,000 | 32 | 6.2% |
| $10,000 to $14,999 | 18 | 3.5% |
| $15,000 to $24,999 | 0 | 0.0% |
| $25,000 to $34,999 | 42 | 8.1% |
| $35,000 to $49,999 | 51 | 9.9% |
| $50,000 to $74,999 | 111 | 21.5% |
| $75,000 to $99,999 | 72 | 14.0% |
| $100,000 to $149,999 | 102 | 19.8% |
| $150,000 to $199,999 | 25 | 4.8% |
| $200,000+ | 63 | 12.2% |
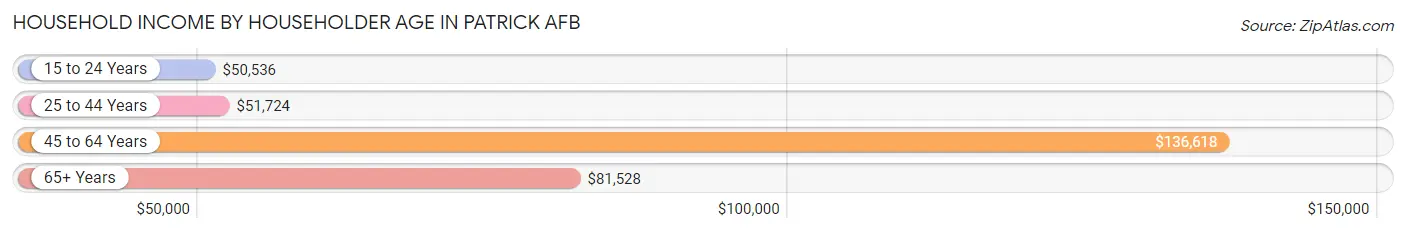
Household Income by Householder Age in Patrick AFB
The median household income in Patrick AFB is $76,667, with the highest median household income of $136,618 found in the 45 to 64 years age bracket for the primary householder. A total of 150 households (29.1%) fall into this category. Meanwhile, the 15 to 24 years age bracket for the primary householder has the lowest median household income of $50,536, with 59 households (11.4%) in this group.
| Income Bracket | # Households | Median Income |
| 15 to 24 Years | 59 (11.4%) | $50,536 |
| 25 to 44 Years | 220 (42.6%) | $51,724 |
| 45 to 64 Years | 150 (29.1%) | $136,618 |
| 65+ Years | 87 (16.9%) | $81,528 |
| Total | 516 (100.0%) | $76,667 |
Poverty in Patrick AFB
Income Below Poverty by Sex and Age in Patrick AFB
With 7.7% poverty level for males and 21.1% for females among the residents of Patrick AFB, under 5 year old males and under 5 year old females are the most vulnerable to poverty, with 23 males (23.7%) and 55 females (78.6%) in their respective age groups living below the poverty level.
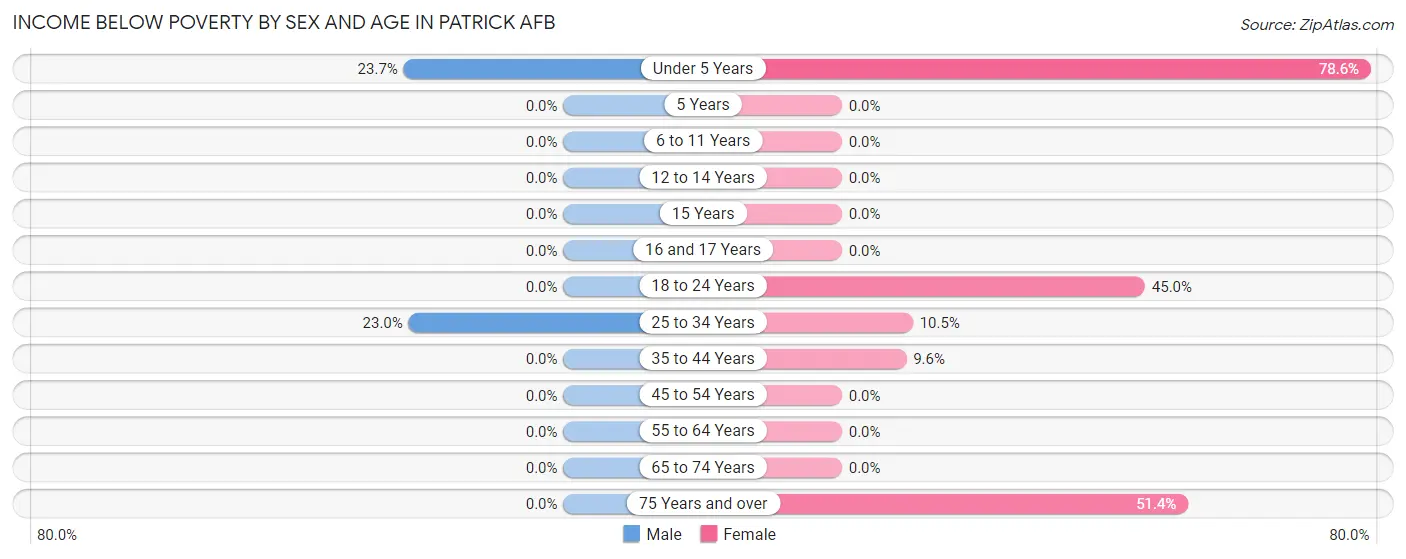
| Age Bracket | Male | Female |
| Under 5 Years | 23 (23.7%) | 55 (78.6%) |
| 5 Years | 0 (0.0%) | 0 (0.0%) |
| 6 to 11 Years | 0 (0.0%) | 0 (0.0%) |
| 12 to 14 Years | 0 (0.0%) | 0 (0.0%) |
| 15 Years | 0 (0.0%) | 0 (0.0%) |
| 16 and 17 Years | 0 (0.0%) | 0 (0.0%) |
| 18 to 24 Years | 0 (0.0%) | 54 (45.0%) |
| 25 to 34 Years | 37 (23.0%) | 12 (10.5%) |
| 35 to 44 Years | 0 (0.0%) | 9 (9.6%) |
| 45 to 54 Years | 0 (0.0%) | 0 (0.0%) |
| 55 to 64 Years | 0 (0.0%) | 0 (0.0%) |
| 65 to 74 Years | 0 (0.0%) | 0 (0.0%) |
| 75 Years and over | 0 (0.0%) | 18 (51.4%) |
| Total | 60 (7.7%) | 148 (21.1%) |
Income Above Poverty by Sex and Age in Patrick AFB
According to the poverty statistics in Patrick AFB, males aged 5 years and females aged 5 years are the age groups that are most secure financially, with 100.0% of males and 100.0% of females in these age groups living above the poverty line.
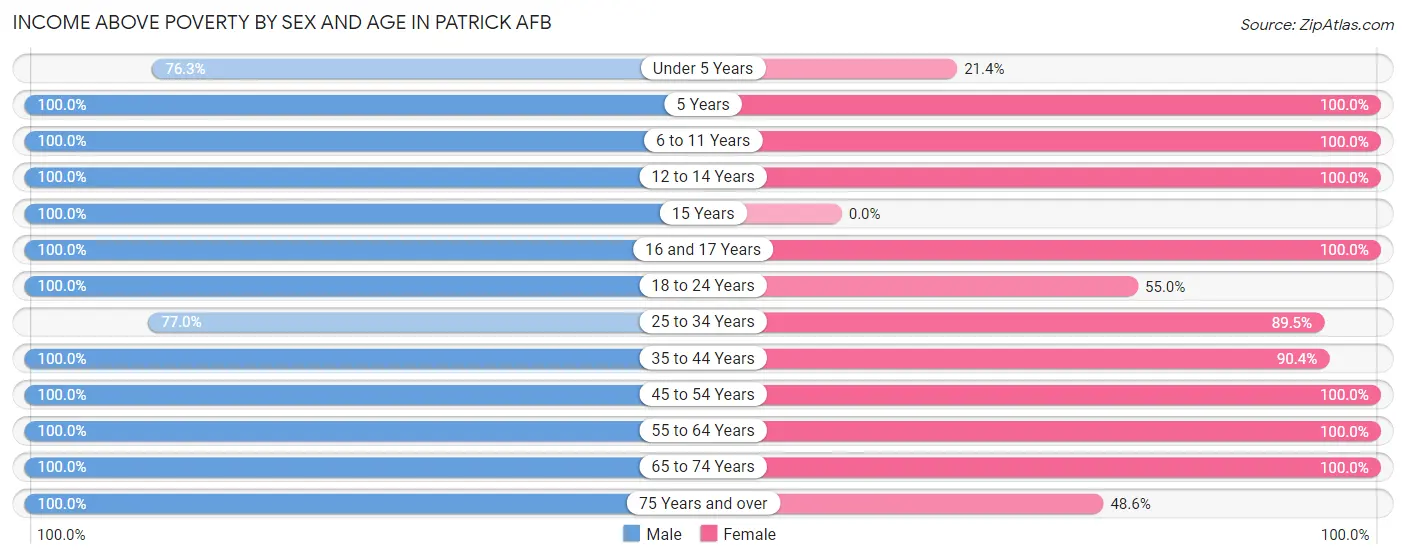
| Age Bracket | Male | Female |
| Under 5 Years | 74 (76.3%) | 15 (21.4%) |
| 5 Years | 36 (100.0%) | 7 (100.0%) |
| 6 to 11 Years | 20 (100.0%) | 64 (100.0%) |
| 12 to 14 Years | 56 (100.0%) | 28 (100.0%) |
| 15 Years | 28 (100.0%) | 0 (0.0%) |
| 16 and 17 Years | 28 (100.0%) | 8 (100.0%) |
| 18 to 24 Years | 84 (100.0%) | 66 (55.0%) |
| 25 to 34 Years | 124 (77.0%) | 102 (89.5%) |
| 35 to 44 Years | 63 (100.0%) | 85 (90.4%) |
| 45 to 54 Years | 70 (100.0%) | 95 (100.0%) |
| 55 to 64 Years | 81 (100.0%) | 42 (100.0%) |
| 65 to 74 Years | 37 (100.0%) | 23 (100.0%) |
| 75 Years and over | 13 (100.0%) | 17 (48.6%) |
| Total | 714 (92.2%) | 552 (78.9%) |
Income Below Poverty Among Married-Couple Families in Patrick AFB
The poverty statistics for married-couple families in Patrick AFB show that 10.4% or 37 of the total 354 families live below the poverty line. Families with 1 or 2 children have the highest poverty rate of 23.6%, comprising of 37 families. On the other hand, families with no children have the lowest poverty rate of 0.0%, which includes 0 families.
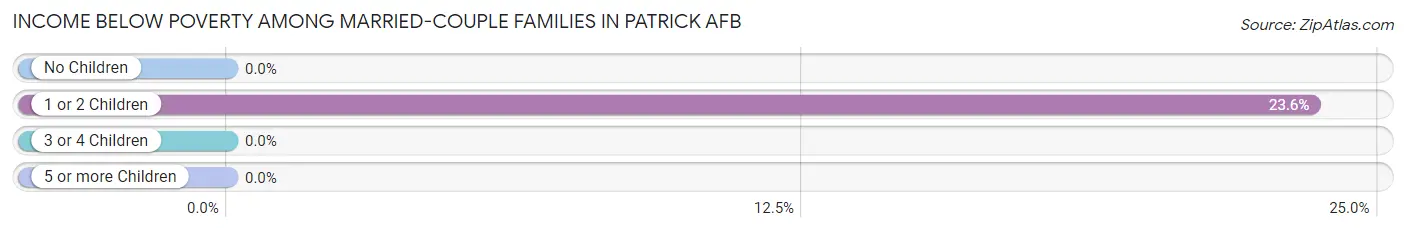
| Children | Above Poverty | Below Poverty |
| No Children | 167 (100.0%) | 0 (0.0%) |
| 1 or 2 Children | 120 (76.4%) | 37 (23.6%) |
| 3 or 4 Children | 30 (100.0%) | 0 (0.0%) |
| 5 or more Children | 0 (0.0%) | 0 (0.0%) |
| Total | 317 (89.5%) | 37 (10.4%) |
Income Below Poverty Among Single-Parent Households in Patrick AFB
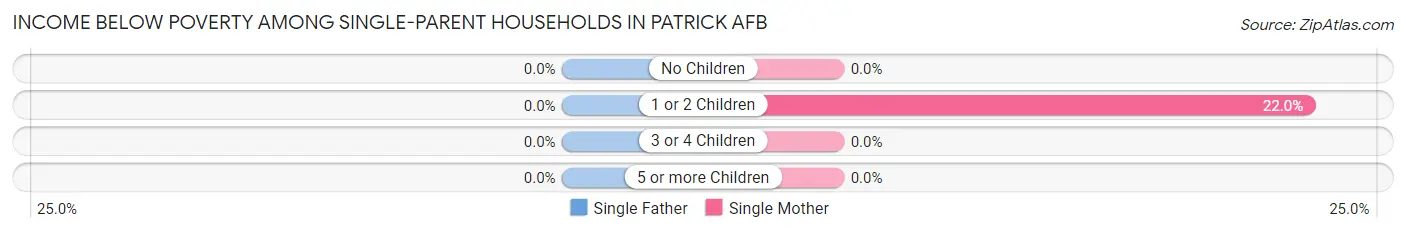
| Children | Single Father | Single Mother |
| No Children | 0 (0.0%) | 0 (0.0%) |
| 1 or 2 Children | 0 (0.0%) | 9 (22.0%) |
| 3 or 4 Children | 0 (0.0%) | 0 (0.0%) |
| 5 or more Children | 0 (0.0%) | 0 (0.0%) |
| Total | 0 (0.0%) | 9 (22.0%) |
Income Below Poverty Among Married-Couple vs Single-Parent Households in Patrick AFB
The poverty data for Patrick AFB shows that 37 of the married-couple family households (10.4%) and 9 of the single-parent households (12.7%) are living below the poverty level. Within the married-couple family households, those with 1 or 2 children have the highest poverty rate, with 37 households (23.6%) falling below the poverty line. Among the single-parent households, those with 1 or 2 children have the highest poverty rate, with 9 household (15.5%) living below poverty.
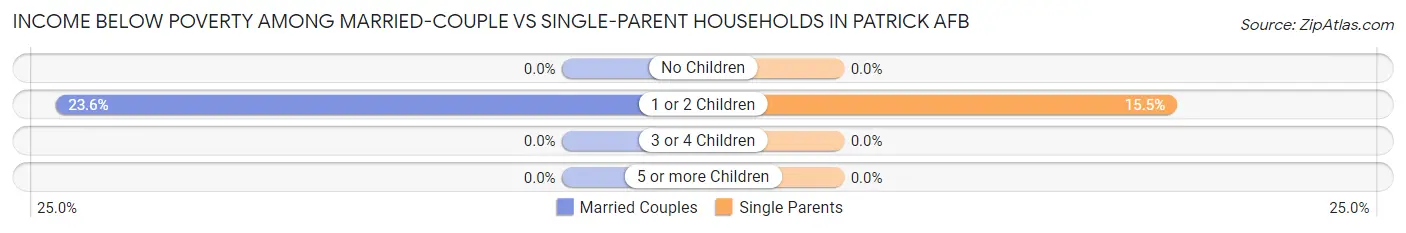
| Children | Married-Couple Families | Single-Parent Households |
| No Children | 0 (0.0%) | 0 (0.0%) |
| 1 or 2 Children | 37 (23.6%) | 9 (15.5%) |
| 3 or 4 Children | 0 (0.0%) | 0 (0.0%) |
| 5 or more Children | 0 (0.0%) | 0 (0.0%) |
| Total | 37 (10.4%) | 9 (12.7%) |
Race in Patrick AFB
The most populous races in Patrick AFB are White / Caucasian (1,074 | 66.9%), Hispanic or Latino (466 | 29.0%), and Two or more Races (211 | 13.1%).
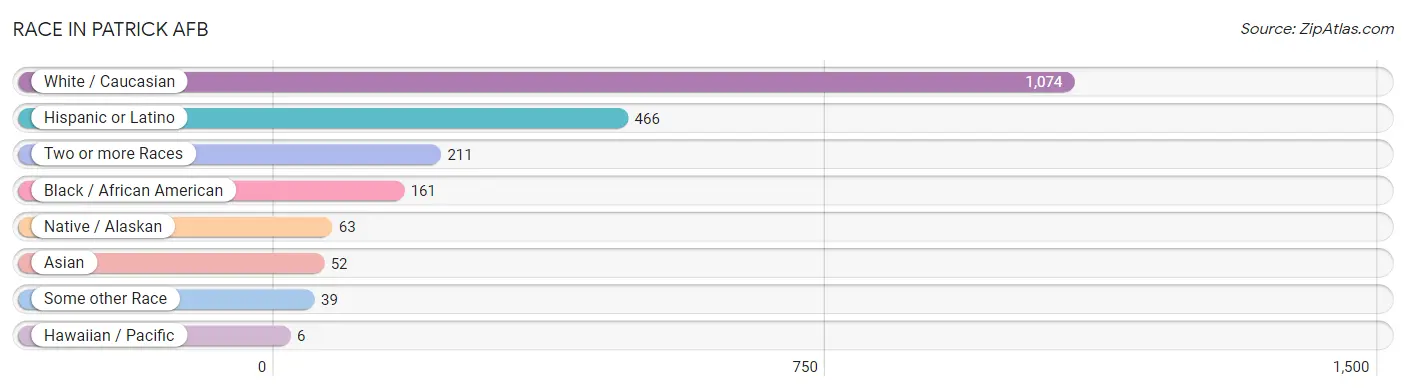
| Race | # Population | % Population |
| Asian | 52 | 3.2% |
| Black / African American | 161 | 10.0% |
| Hawaiian / Pacific | 6 | 0.4% |
| Hispanic or Latino | 466 | 29.0% |
| Native / Alaskan | 63 | 3.9% |
| White / Caucasian | 1,074 | 66.9% |
| Two or more Races | 211 | 13.1% |
| Some other Race | 39 | 2.4% |
| Total | 1,606 | 100.0% |
Ancestry in Patrick AFB
The most populous ancestries reported in Patrick AFB are German (259 | 16.1%), Mexican (228 | 14.2%), Irish (205 | 12.8%), American (159 | 9.9%), and Puerto Rican (150 | 9.3%), together accounting for 62.3% of all Patrick AFB residents.
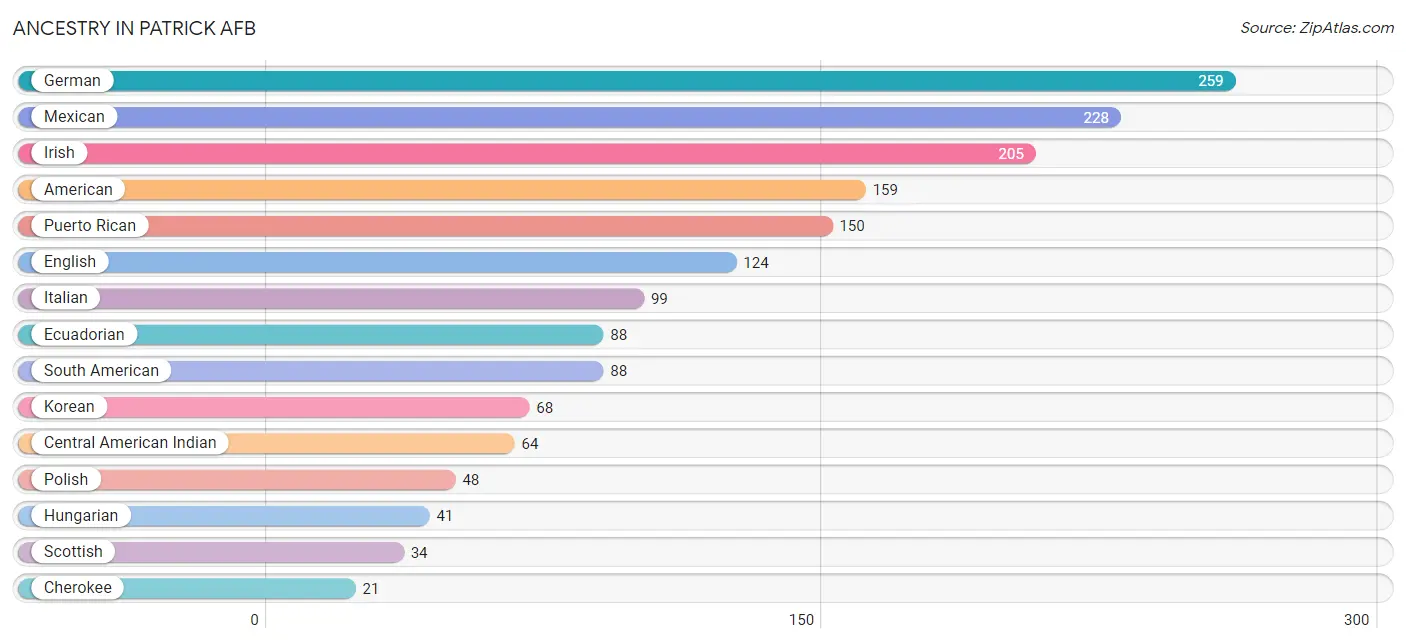
| Ancestry | # Population | % Population |
| American | 159 | 9.9% |
| Bhutanese | 8 | 0.5% |
| British | 5 | 0.3% |
| Burmese | 16 | 1.0% |
| Central American Indian | 64 | 4.0% |
| Cherokee | 21 | 1.3% |
| Dutch | 11 | 0.7% |
| Ecuadorian | 88 | 5.5% |
| English | 124 | 7.7% |
| European | 16 | 1.0% |
| French | 18 | 1.1% |
| German | 259 | 16.1% |
| Greek | 8 | 0.5% |
| Hungarian | 41 | 2.5% |
| Irish | 205 | 12.8% |
| Italian | 99 | 6.2% |
| Korean | 68 | 4.2% |
| Mexican | 228 | 14.2% |
| Mexican American Indian | 16 | 1.0% |
| Native Hawaiian | 8 | 0.5% |
| Polish | 48 | 3.0% |
| Puerto Rican | 150 | 9.3% |
| Scotch-Irish | 19 | 1.2% |
| Scottish | 34 | 2.1% |
| Slavic | 7 | 0.4% |
| South American | 88 | 5.5% |
| Swedish | 3 | 0.2% |
| Swiss | 15 | 0.9% |
| Ukrainian | 11 | 0.7% |
| Welsh | 19 | 1.2% |
| West Indian | 10 | 0.6% | View All 31 Rows |
Immigrants in Patrick AFB
The most numerous immigrant groups reported in Patrick AFB came from Europe (52 | 3.2%), Northern Europe (19 | 1.2%), Italy (18 | 1.1%), Southern Europe (18 | 1.1%), and Latin America (15 | 0.9%), together accounting for 7.6% of all Patrick AFB residents.
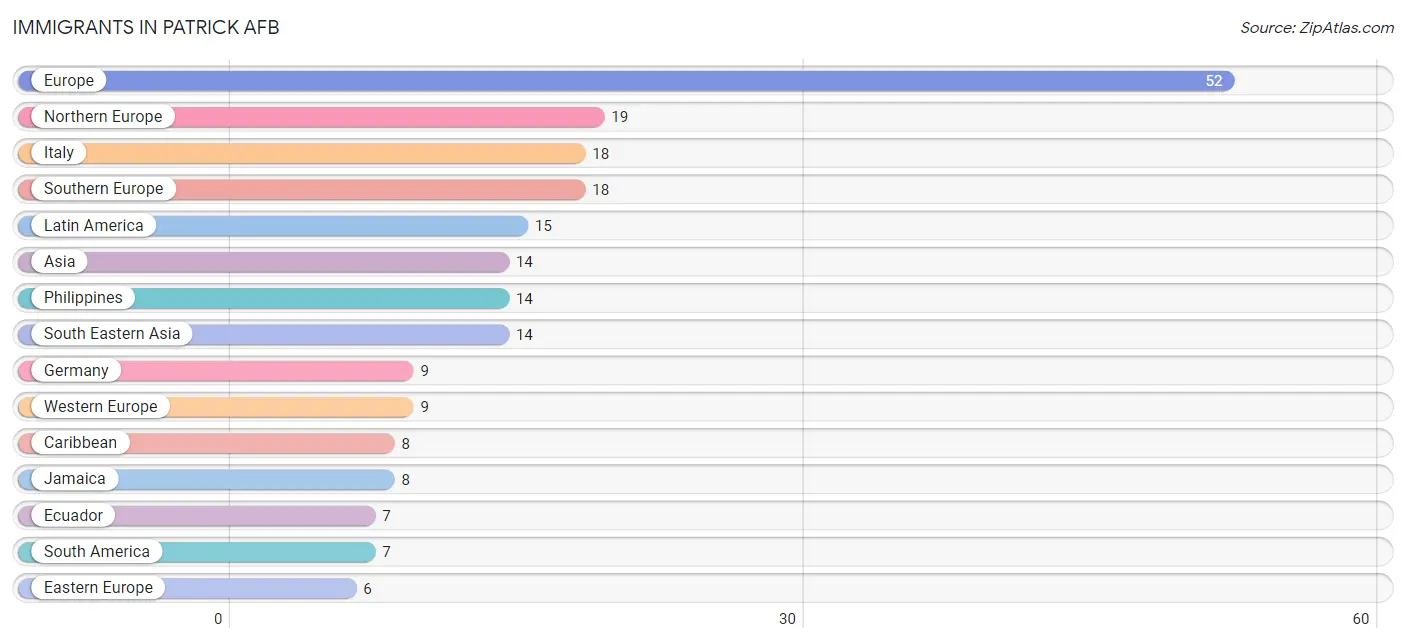
| Immigration Origin | # Population | % Population |
| Asia | 14 | 0.9% |
| Caribbean | 8 | 0.5% |
| Eastern Europe | 6 | 0.4% |
| Ecuador | 7 | 0.4% |
| Europe | 52 | 3.2% |
| Germany | 9 | 0.6% |
| Ireland | 4 | 0.3% |
| Italy | 18 | 1.1% |
| Jamaica | 8 | 0.5% |
| Latin America | 15 | 0.9% |
| Micronesia | 6 | 0.4% |
| Northern Europe | 19 | 1.2% |
| Oceania | 6 | 0.4% |
| Philippines | 14 | 0.9% |
| South America | 7 | 0.4% |
| South Eastern Asia | 14 | 0.9% |
| Southern Europe | 18 | 1.1% |
| Ukraine | 6 | 0.4% |
| Western Europe | 9 | 0.6% | View All 19 Rows |
Sex and Age in Patrick AFB
Sex and Age in Patrick AFB
The most populous age groups in Patrick AFB are 15 to 19 Years (154 | 17.0%) for men and 20 to 24 Years (108 | 15.4%) for women.
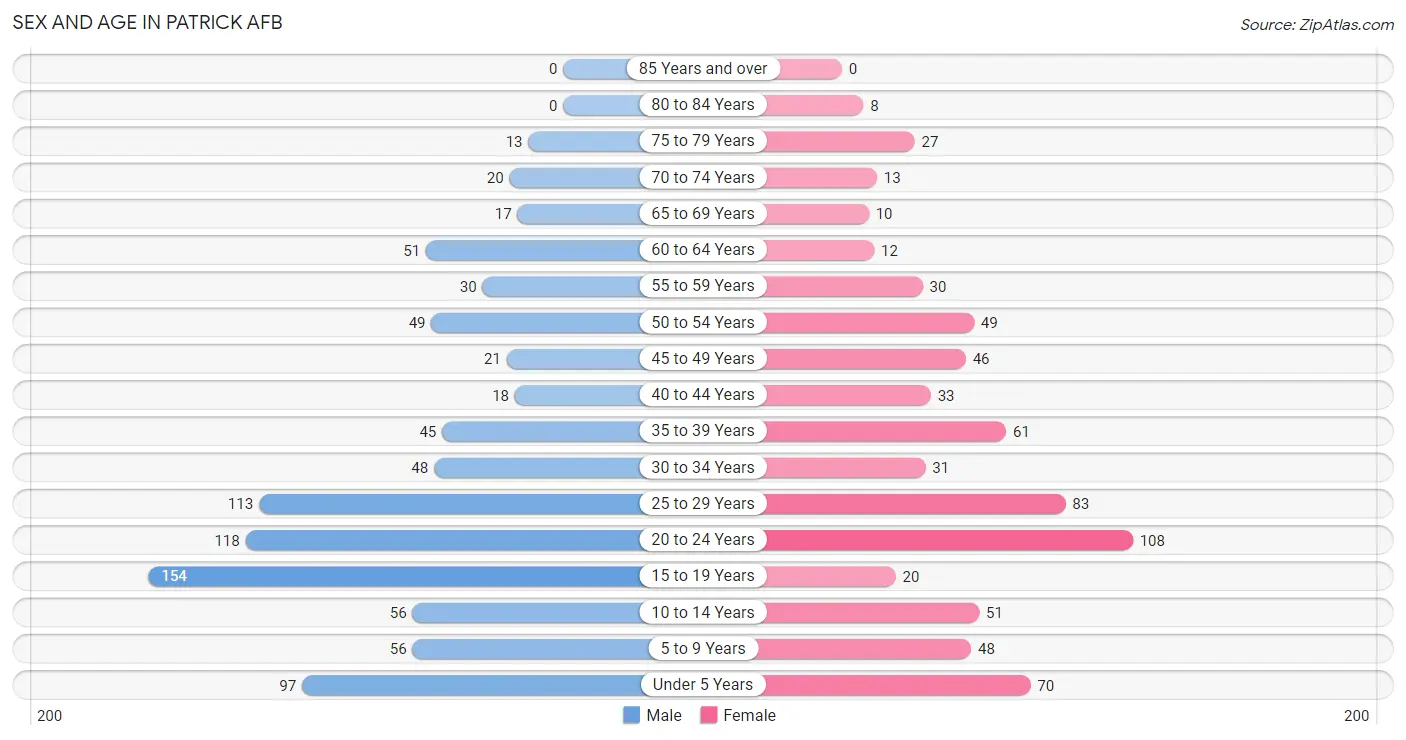
| Age Bracket | Male | Female |
| Under 5 Years | 97 (10.7%) | 70 (10.0%) |
| 5 to 9 Years | 56 (6.2%) | 48 (6.9%) |
| 10 to 14 Years | 56 (6.2%) | 51 (7.3%) |
| 15 to 19 Years | 154 (17.0%) | 20 (2.9%) |
| 20 to 24 Years | 118 (13.0%) | 108 (15.4%) |
| 25 to 29 Years | 113 (12.5%) | 83 (11.9%) |
| 30 to 34 Years | 48 (5.3%) | 31 (4.4%) |
| 35 to 39 Years | 45 (5.0%) | 61 (8.7%) |
| 40 to 44 Years | 18 (2.0%) | 33 (4.7%) |
| 45 to 49 Years | 21 (2.3%) | 46 (6.6%) |
| 50 to 54 Years | 49 (5.4%) | 49 (7.0%) |
| 55 to 59 Years | 30 (3.3%) | 30 (4.3%) |
| 60 to 64 Years | 51 (5.6%) | 12 (1.7%) |
| 65 to 69 Years | 17 (1.9%) | 10 (1.4%) |
| 70 to 74 Years | 20 (2.2%) | 13 (1.9%) |
| 75 to 79 Years | 13 (1.4%) | 27 (3.9%) |
| 80 to 84 Years | 0 (0.0%) | 8 (1.1%) |
| 85 Years and over | 0 (0.0%) | 0 (0.0%) |
| Total | 906 (100.0%) | 700 (100.0%) |
Families and Households in Patrick AFB
Median Family Size in Patrick AFB
The median family size in Patrick AFB is 3.22 persons per family, with single male/father families (30 | 7.1%) accounting for the largest median family size of 3.43 persons per family. On the other hand, single female/mother families (41 | 9.7%) represent the smallest median family size with 3.02 persons per family.
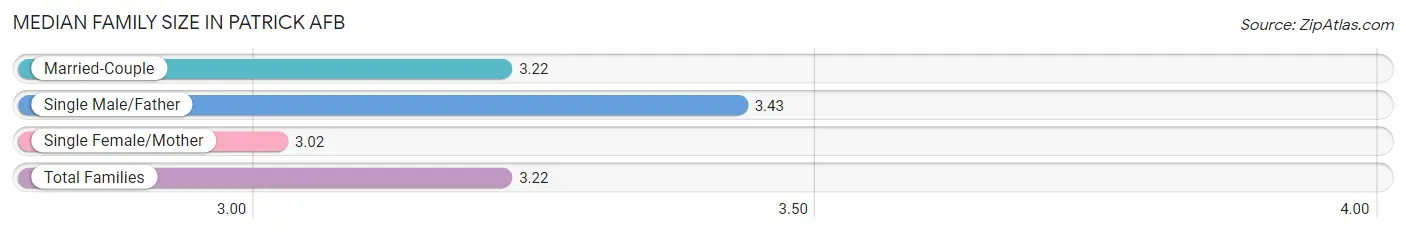
| Family Type | # Families | Family Size |
| Married-Couple | 354 (83.3%) | 3.22 |
| Single Male/Father | 30 (7.1%) | 3.43 |
| Single Female/Mother | 41 (9.7%) | 3.02 |
| Total Families | 425 (100.0%) | 3.22 |
Median Household Size in Patrick AFB
The median household size in Patrick AFB is 2.86 persons per household, with single male/father households (30 | 5.8%) accounting for the largest median household size of 3.43 persons per household. non-family households (91 | 17.6%) represent the smallest median household size with 1.18 persons per household.
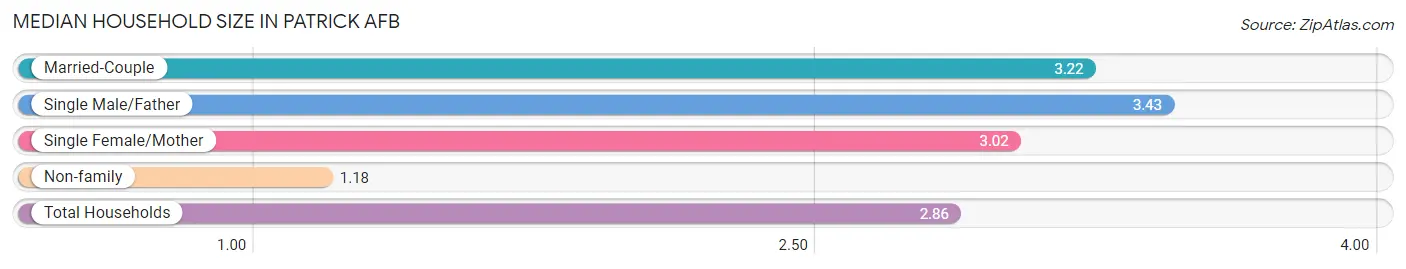
| Household Type | # Households | Household Size |
| Married-Couple | 354 (68.6%) | 3.22 |
| Single Male/Father | 30 (5.8%) | 3.43 |
| Single Female/Mother | 41 (8.0%) | 3.02 |
| Non-family | 91 (17.6%) | 1.18 |
| Total Households | 516 (100.0%) | 2.86 |
Household Size by Marriage Status in Patrick AFB
Out of a total of 516 households in Patrick AFB, 425 (82.4%) are family households, while 91 (17.6%) are nonfamily households. The most numerous type of family households are 2-person households, comprising 183, and the most common type of nonfamily households are 1-person households, comprising 86.

| Household Size | Family Households | Nonfamily Households |
| 1-Person Households | - | 86 (16.7%) |
| 2-Person Households | 183 (35.5%) | 0 (0.0%) |
| 3-Person Households | 86 (16.7%) | 5 (1.0%) |
| 4-Person Households | 119 (23.1%) | 0 (0.0%) |
| 5-Person Households | 37 (7.2%) | 0 (0.0%) |
| 6-Person Households | 0 (0.0%) | 0 (0.0%) |
| 7+ Person Households | 0 (0.0%) | 0 (0.0%) |
| Total | 425 (82.4%) | 91 (17.6%) |
Female Fertility in Patrick AFB
Fertility by Age in Patrick AFB
Average fertility rate in Patrick AFB is 62.0 births per 1,000 women. Women in the age bracket of 20 to 34 years have the highest fertility rate with 68.0 births per 1,000 women. Women in the age bracket of 20 to 34 years acount for 62.5% of all women with births.
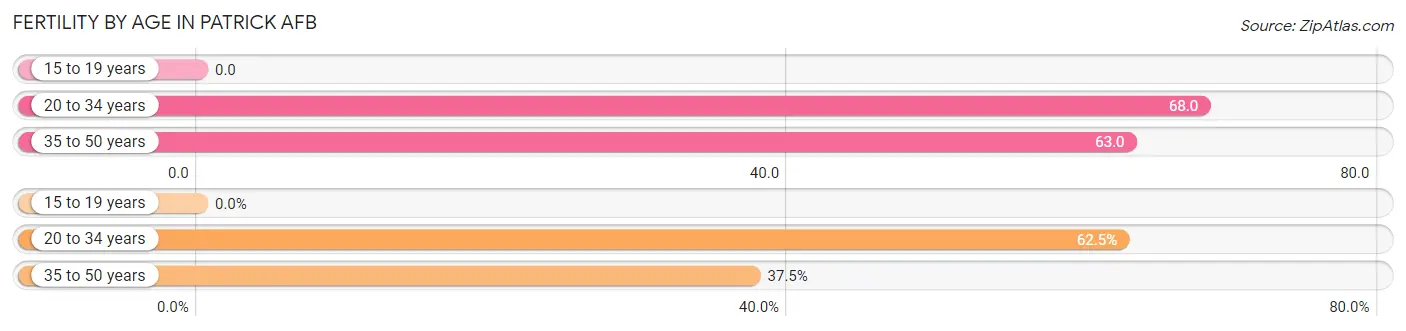
| Age Bracket | Women with Births | Births / 1,000 Women |
| 15 to 19 years | 0 (0.0%) | 0.0 |
| 20 to 34 years | 15 (62.5%) | 68.0 |
| 35 to 50 years | 9 (37.5%) | 63.0 |
| Total | 24 (100.0%) | 62.0 |
Fertility by Age by Marriage Status in Patrick AFB
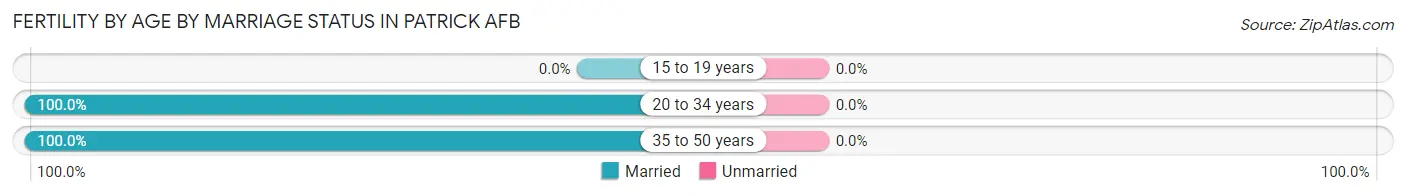
| Age Bracket | Married | Unmarried |
| 15 to 19 years | 0 (0.0%) | 0 (0.0%) |
| 20 to 34 years | 15 (100.0%) | 0 (0.0%) |
| 35 to 50 years | 9 (100.0%) | 0 (0.0%) |
| Total | 24 (100.0%) | 0 (0.0%) |
Fertility by Education in Patrick AFB
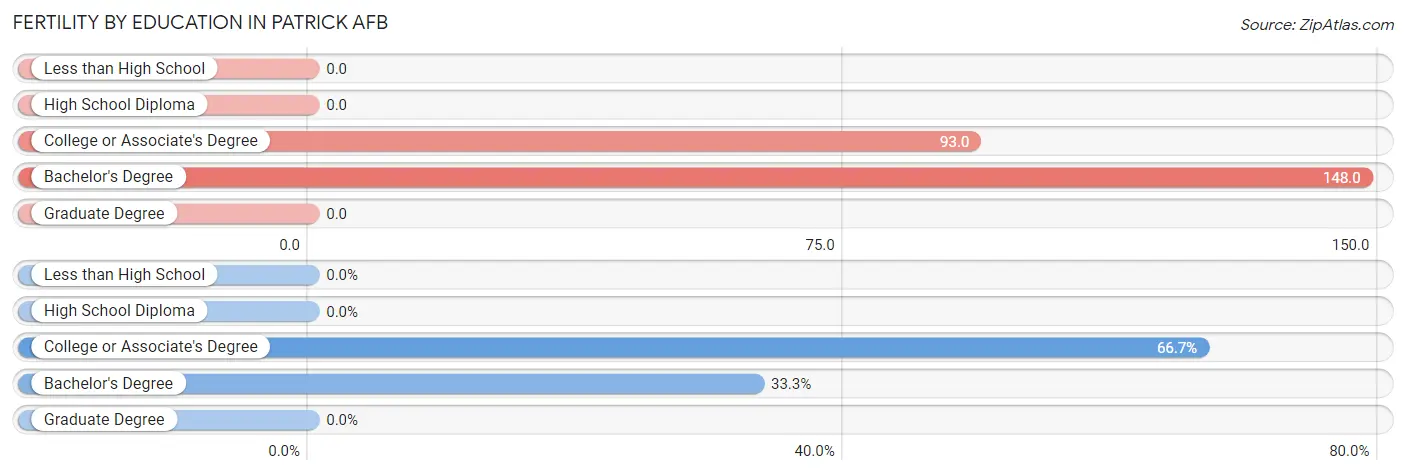
| Educational Attainment | Women with Births | Births / 1,000 Women |
| Less than High School | 0 (0.0%) | 0.0 |
| High School Diploma | 0 (0.0%) | 0.0 |
| College or Associate's Degree | 16 (66.7%) | 93.0 |
| Bachelor's Degree | 8 (33.3%) | 148.0 |
| Graduate Degree | 0 (0.0%) | 0.0 |
| Total | 24 (100.0%) | 62.0 |
Fertility by Education by Marriage Status in Patrick AFB
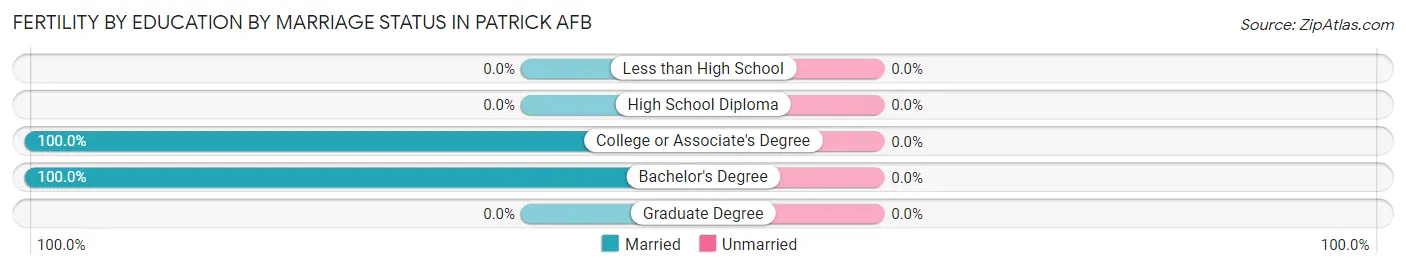
| Educational Attainment | Married | Unmarried |
| Less than High School | 0 (0.0%) | 0 (0.0%) |
| High School Diploma | 0 (0.0%) | 0 (0.0%) |
| College or Associate's Degree | 16 (100.0%) | 0 (0.0%) |
| Bachelor's Degree | 8 (100.0%) | 0 (0.0%) |
| Graduate Degree | 0 (0.0%) | 0 (0.0%) |
| Total | 24 (100.0%) | 0 (0.0%) |
Employment Characteristics in Patrick AFB
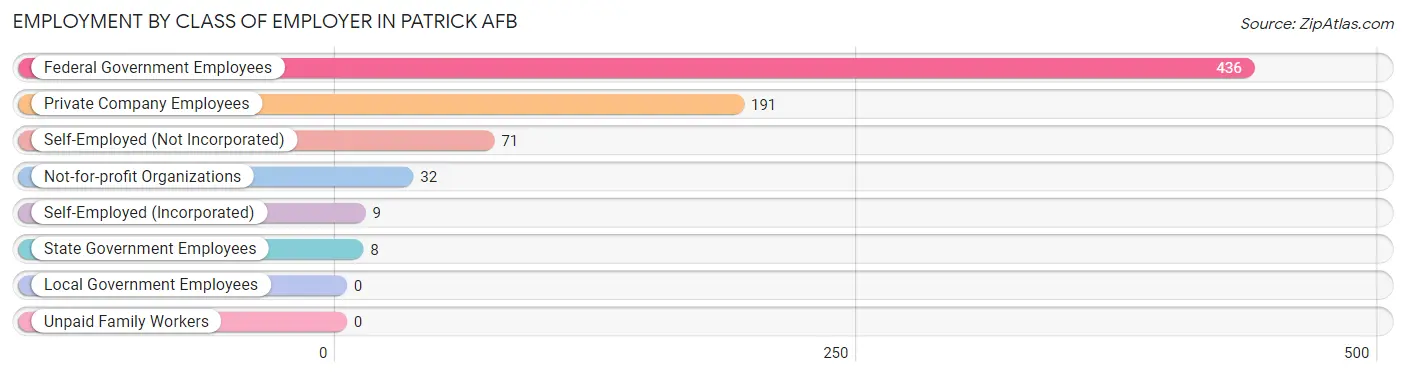
Employment by Class of Employer in Patrick AFB
Among the 747 employed individuals in Patrick AFB, federal government employees (436 | 58.4%), private company employees (191 | 25.6%), and self-employed (not incorporated) (71 | 9.5%) make up the most common classes of employment.
| Employer Class | # Employees | % Employees |
| Private Company Employees | 191 | 25.6% |
| Self-Employed (Incorporated) | 9 | 1.2% |
| Self-Employed (Not Incorporated) | 71 | 9.5% |
| Not-for-profit Organizations | 32 | 4.3% |
| Local Government Employees | 0 | 0.0% |
| State Government Employees | 8 | 1.1% |
| Federal Government Employees | 436 | 58.4% |
| Unpaid Family Workers | 0 | 0.0% |
| Total | 747 | 100.0% |
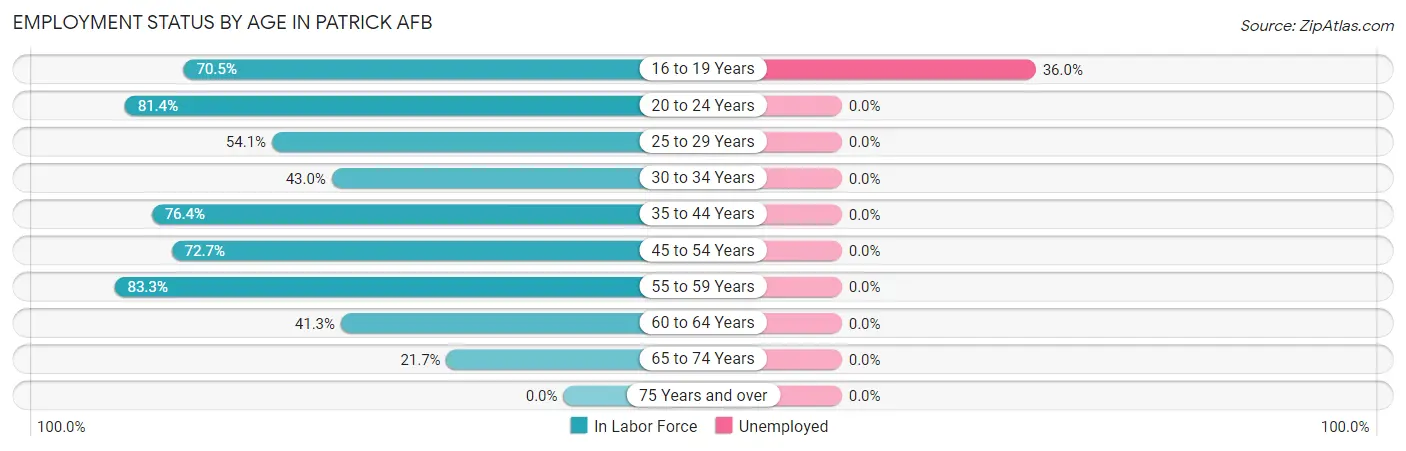
Employment Status by Age in Patrick AFB
According to the labor force statistics for Patrick AFB, out of the total population over 16 years of age (1,200), 63.0% or 756 individuals are in the labor force, with 1.7% or 13 of them unemployed. The age group with the highest labor force participation rate is 55 to 59 years, with 83.3% or 50 individuals in the labor force. Within the labor force, the 16 to 19 years age range has the highest percentage of unemployed individuals, with 36.0% or 37 of them being unemployed.
| Age Bracket | In Labor Force | Unemployed |
| 16 to 19 Years | 103 (70.5%) | 37 (36.0%) |
| 20 to 24 Years | 184 (81.4%) | 0 (0.0%) |
| 25 to 29 Years | 106 (54.1%) | 0 (0.0%) |
| 30 to 34 Years | 34 (43.0%) | 0 (0.0%) |
| 35 to 44 Years | 120 (76.4%) | 0 (0.0%) |
| 45 to 54 Years | 120 (72.7%) | 0 (0.0%) |
| 55 to 59 Years | 50 (83.3%) | 0 (0.0%) |
| 60 to 64 Years | 26 (41.3%) | 0 (0.0%) |
| 65 to 74 Years | 13 (21.7%) | 0 (0.0%) |
| 75 Years and over | 0 (0.0%) | 0 (0.0%) |
| Total | 756 (63.0%) | 13 (1.7%) |
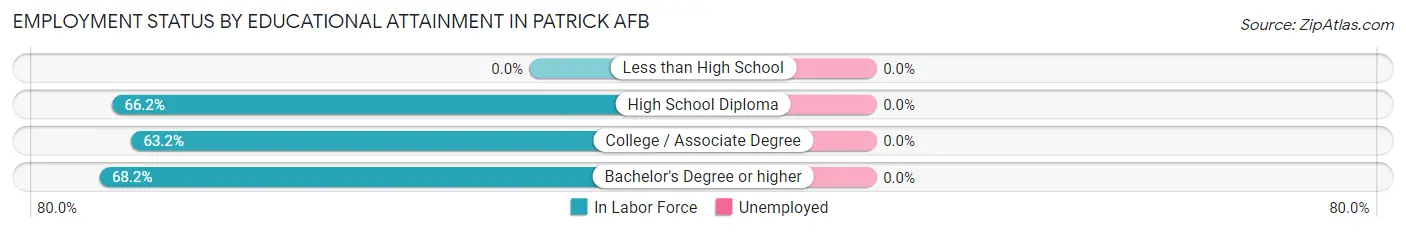
Employment Status by Educational Attainment in Patrick AFB
| Educational Attainment | In Labor Force | Unemployed |
| Less than High School | 0 (0.0%) | 0 (0.0%) |
| High School Diploma | 49 (66.2%) | 0 (0.0%) |
| College / Associate Degree | 165 (63.2%) | 0 (0.0%) |
| Bachelor's Degree or higher | 242 (68.2%) | 0 (0.0%) |
| Total | 456 (63.3%) | 0 (0.0%) |
Employment Occupations by Sex in Patrick AFB
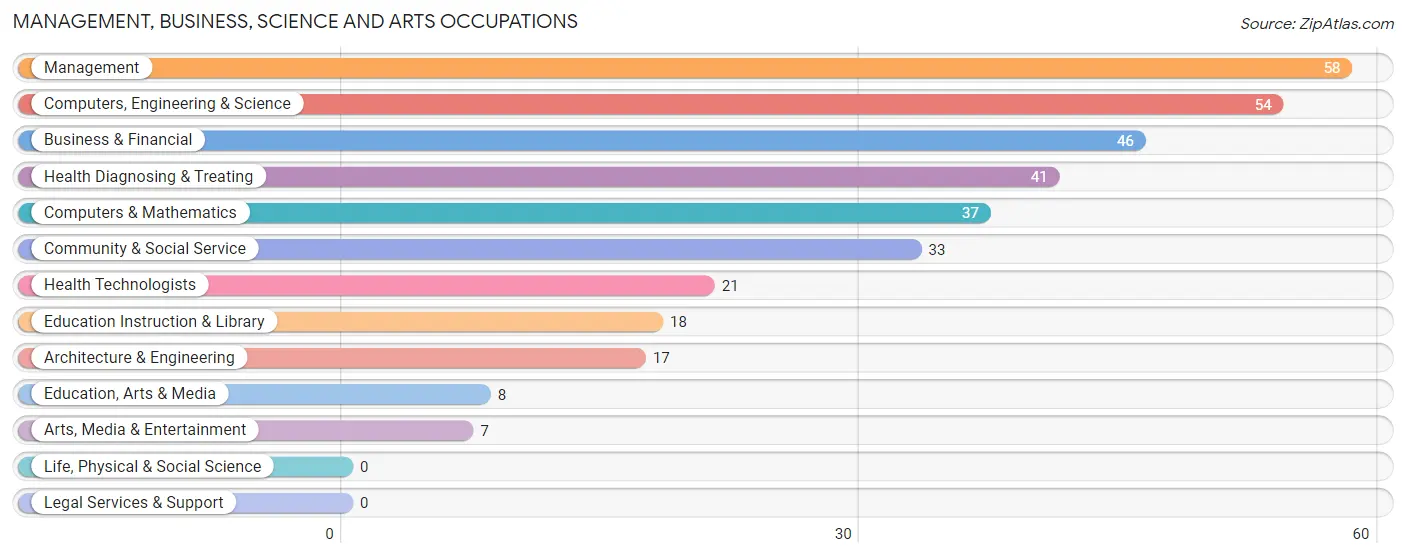
Management, Business, Science and Arts Occupations
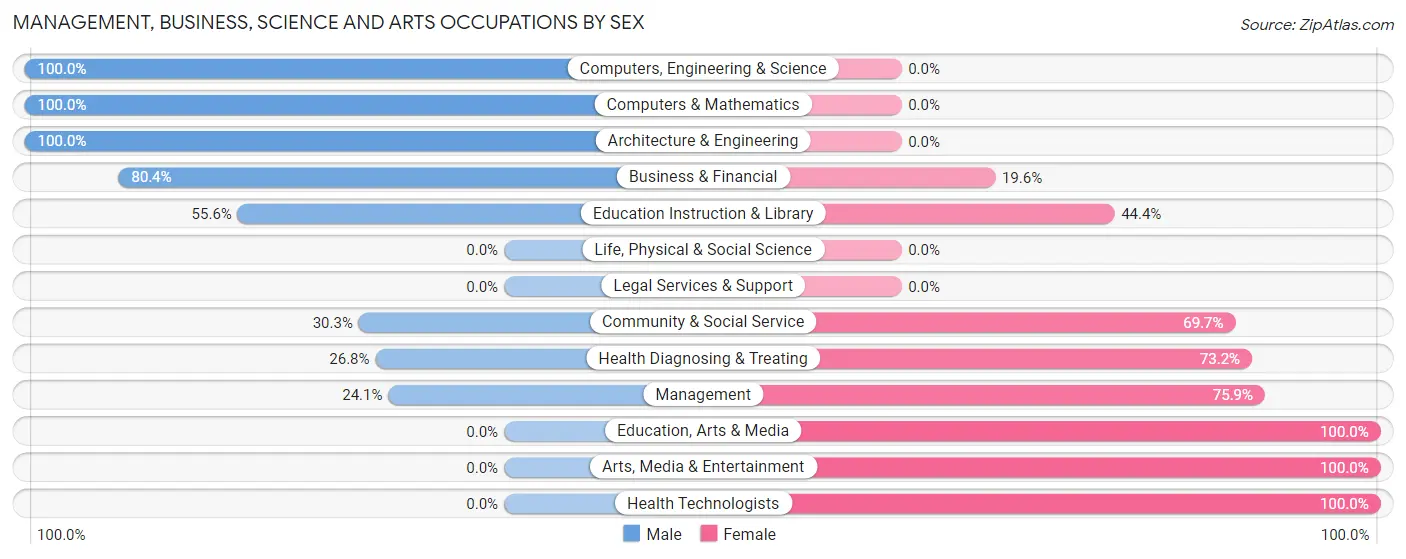
The most common Management, Business, Science and Arts occupations in Patrick AFB are Management (58 | 11.3%), Computers, Engineering & Science (54 | 10.5%), Business & Financial (46 | 9.0%), Health Diagnosing & Treating (41 | 8.0%), and Computers & Mathematics (37 | 7.2%).
Management, Business, Science and Arts Occupations by Sex
Within the Management, Business, Science and Arts occupations in Patrick AFB, the most male-oriented occupations are Computers, Engineering & Science (100.0%), Computers & Mathematics (100.0%), and Architecture & Engineering (100.0%), while the most female-oriented occupations are Education, Arts & Media (100.0%), Arts, Media & Entertainment (100.0%), and Health Technologists (100.0%).
| Occupation | Male | Female |
| Management | 14 (24.1%) | 44 (75.9%) |
| Business & Financial | 37 (80.4%) | 9 (19.6%) |
| Computers, Engineering & Science | 54 (100.0%) | 0 (0.0%) |
| Computers & Mathematics | 37 (100.0%) | 0 (0.0%) |
| Architecture & Engineering | 17 (100.0%) | 0 (0.0%) |
| Life, Physical & Social Science | 0 (0.0%) | 0 (0.0%) |
| Community & Social Service | 10 (30.3%) | 23 (69.7%) |
| Education, Arts & Media | 0 (0.0%) | 8 (100.0%) |
| Legal Services & Support | 0 (0.0%) | 0 (0.0%) |
| Education Instruction & Library | 10 (55.6%) | 8 (44.4%) |
| Arts, Media & Entertainment | 0 (0.0%) | 7 (100.0%) |
| Health Diagnosing & Treating | 11 (26.8%) | 30 (73.2%) |
| Health Technologists | 0 (0.0%) | 21 (100.0%) |
| Total (Category) | 126 (54.3%) | 106 (45.7%) |
| Total (Overall) | 262 (51.1%) | 251 (48.9%) |
Services Occupations
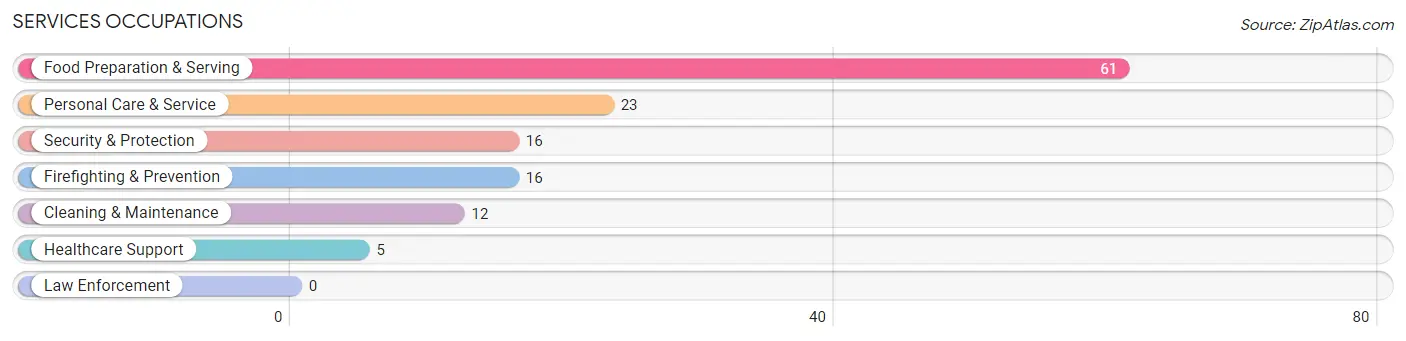
The most common Services occupations in Patrick AFB are Food Preparation & Serving (61 | 11.9%), Personal Care & Service (23 | 4.5%), Security & Protection (16 | 3.1%), Firefighting & Prevention (16 | 3.1%), and Cleaning & Maintenance (12 | 2.3%).
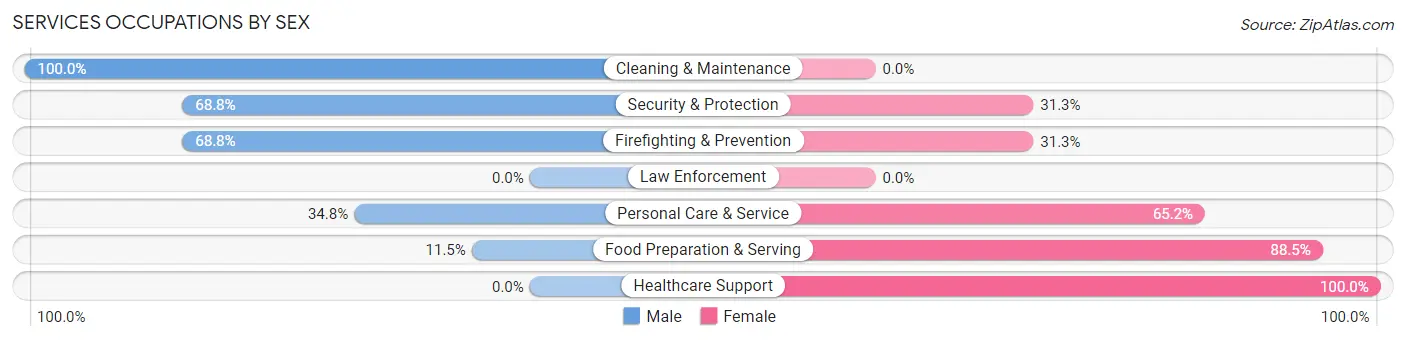
Services Occupations by Sex
Within the Services occupations in Patrick AFB, the most male-oriented occupations are Cleaning & Maintenance (100.0%), Security & Protection (68.8%), and Firefighting & Prevention (68.8%), while the most female-oriented occupations are Healthcare Support (100.0%), Food Preparation & Serving (88.5%), and Personal Care & Service (65.2%).
| Occupation | Male | Female |
| Healthcare Support | 0 (0.0%) | 5 (100.0%) |
| Security & Protection | 11 (68.8%) | 5 (31.2%) |
| Firefighting & Prevention | 11 (68.8%) | 5 (31.2%) |
| Law Enforcement | 0 (0.0%) | 0 (0.0%) |
| Food Preparation & Serving | 7 (11.5%) | 54 (88.5%) |
| Cleaning & Maintenance | 12 (100.0%) | 0 (0.0%) |
| Personal Care & Service | 8 (34.8%) | 15 (65.2%) |
| Total (Category) | 38 (32.5%) | 79 (67.5%) |
| Total (Overall) | 262 (51.1%) | 251 (48.9%) |
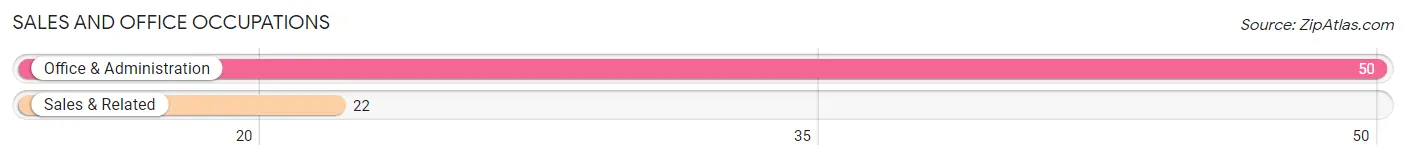
Sales and Office Occupations
The most common Sales and Office occupations in Patrick AFB are Office & Administration (50 | 9.8%), and Sales & Related (22 | 4.3%).
Sales and Office Occupations by Sex
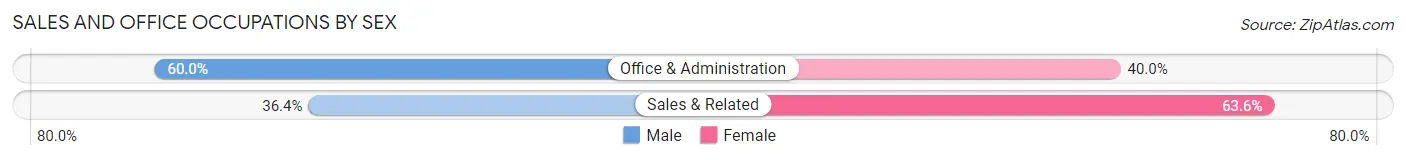
| Occupation | Male | Female |
| Sales & Related | 8 (36.4%) | 14 (63.6%) |
| Office & Administration | 30 (60.0%) | 20 (40.0%) |
| Total (Category) | 38 (52.8%) | 34 (47.2%) |
| Total (Overall) | 262 (51.1%) | 251 (48.9%) |
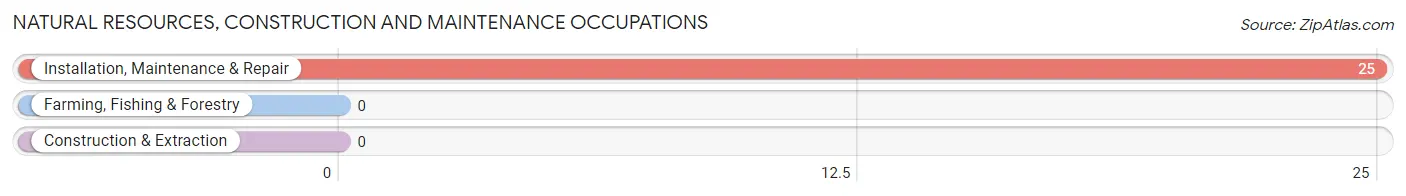
Natural Resources, Construction and Maintenance Occupations
The most common Natural Resources, Construction and Maintenance occupations in Patrick AFB are , and Installation, Maintenance & Repair (25 | 4.9%).
Natural Resources, Construction and Maintenance Occupations by Sex
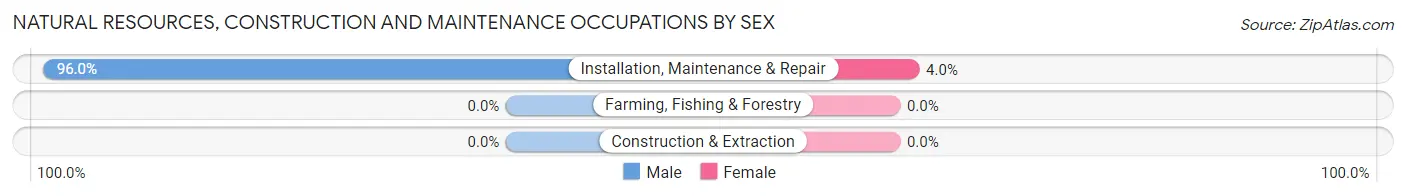
| Occupation | Male | Female |
| Farming, Fishing & Forestry | 0 (0.0%) | 0 (0.0%) |
| Construction & Extraction | 0 (0.0%) | 0 (0.0%) |
| Installation, Maintenance & Repair | 24 (96.0%) | 1 (4.0%) |
| Total (Category) | 24 (96.0%) | 1 (4.0%) |
| Total (Overall) | 262 (51.1%) | 251 (48.9%) |
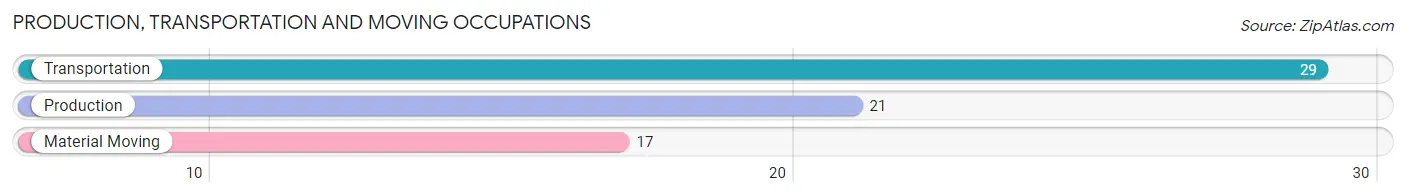
Production, Transportation and Moving Occupations
The most common Production, Transportation and Moving occupations in Patrick AFB are Transportation (29 | 5.7%), Production (21 | 4.1%), and Material Moving (17 | 3.3%).
Production, Transportation and Moving Occupations by Sex
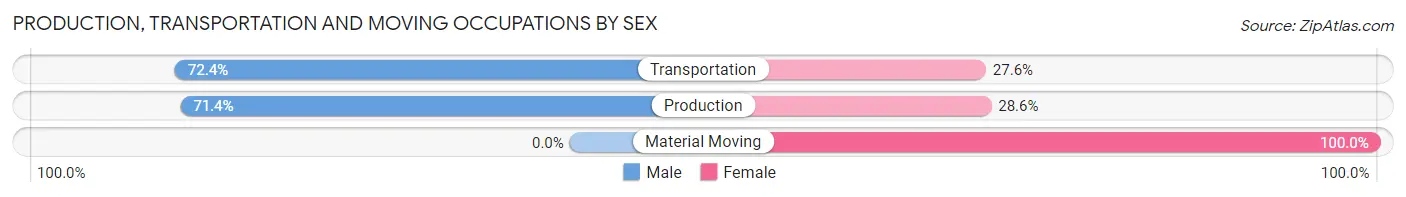
| Occupation | Male | Female |
| Production | 15 (71.4%) | 6 (28.6%) |
| Transportation | 21 (72.4%) | 8 (27.6%) |
| Material Moving | 0 (0.0%) | 17 (100.0%) |
| Total (Category) | 36 (53.7%) | 31 (46.3%) |
| Total (Overall) | 262 (51.1%) | 251 (48.9%) |
Employment Industries by Sex in Patrick AFB
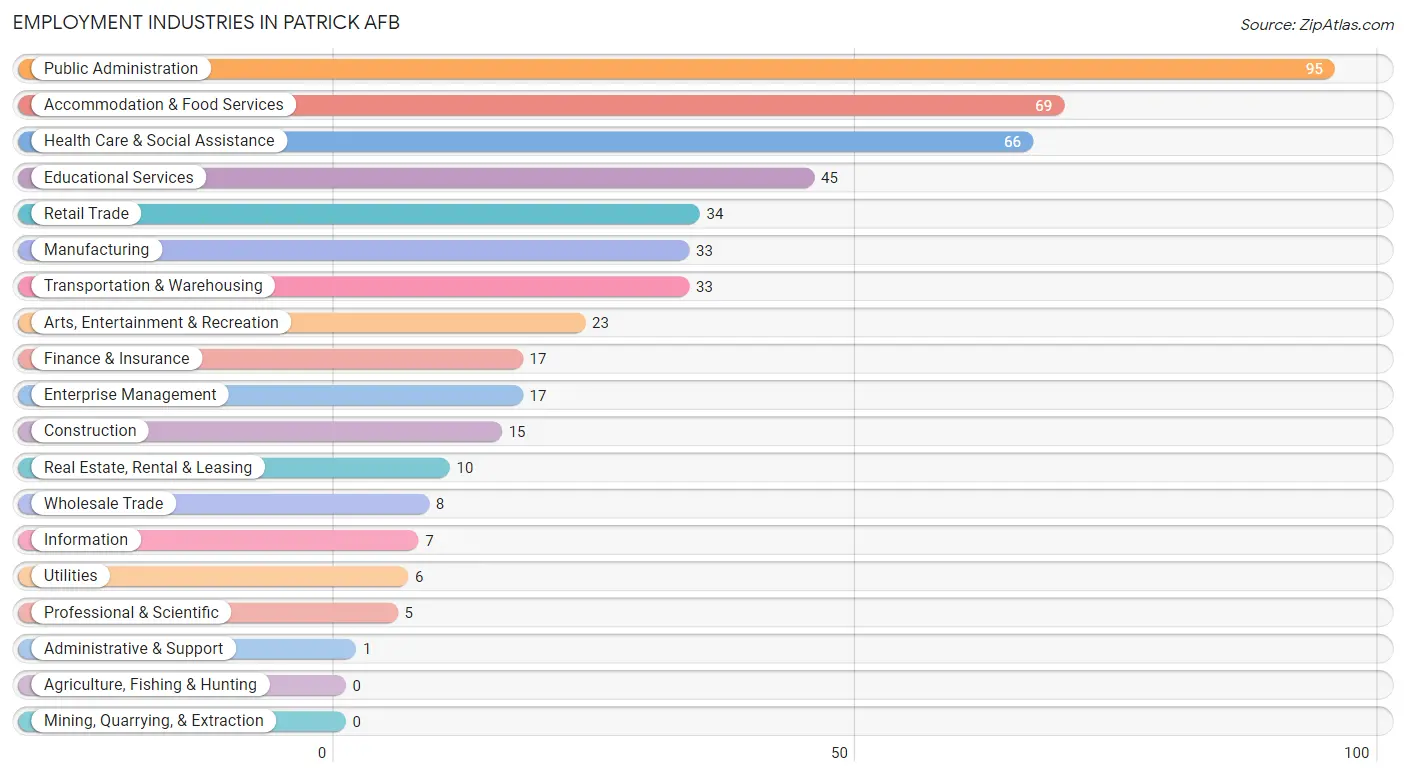
Employment Industries in Patrick AFB
The major employment industries in Patrick AFB include Public Administration (95 | 18.5%), Accommodation & Food Services (69 | 13.5%), Health Care & Social Assistance (66 | 12.9%), Educational Services (45 | 8.8%), and Retail Trade (34 | 6.6%).
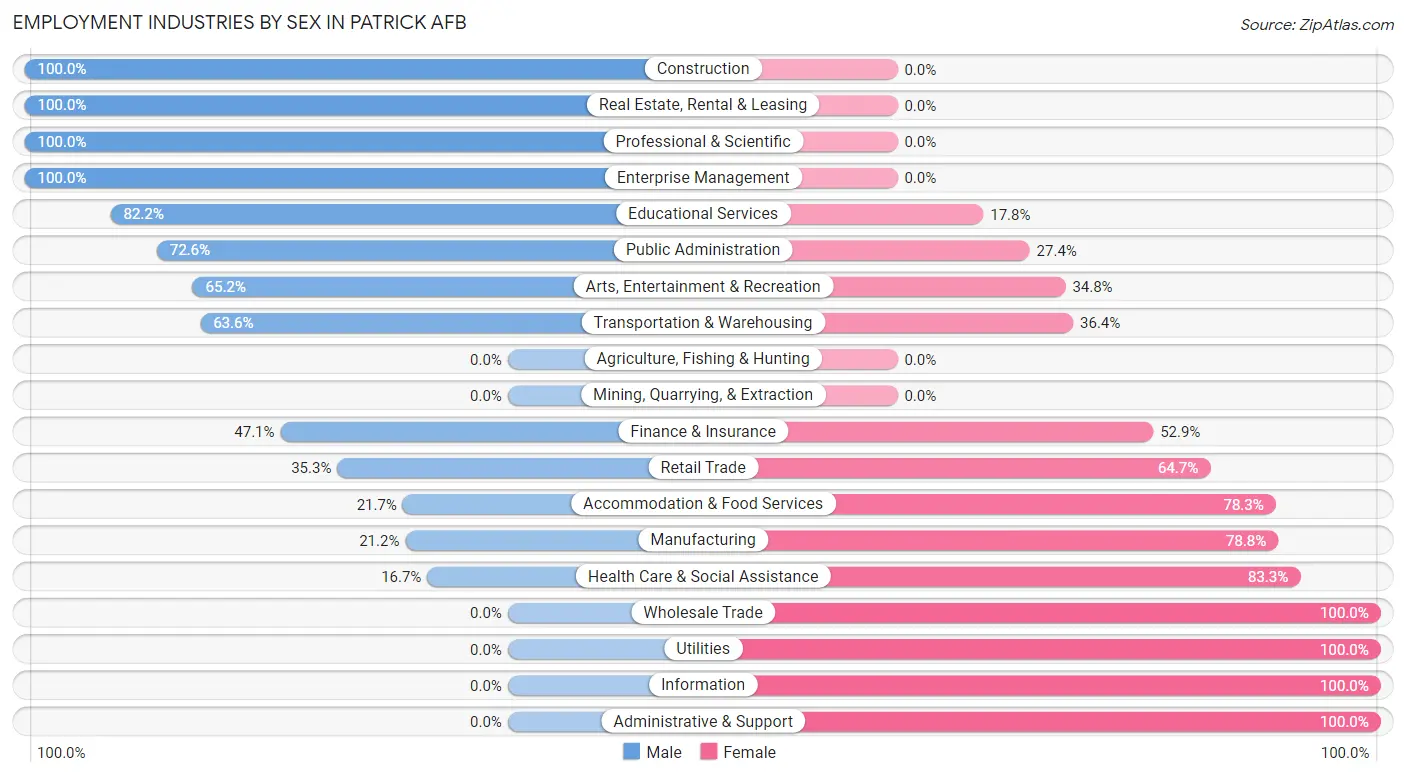
Employment Industries by Sex in Patrick AFB
The Patrick AFB industries that see more men than women are Construction (100.0%), Real Estate, Rental & Leasing (100.0%), and Professional & Scientific (100.0%), whereas the industries that tend to have a higher number of women are Wholesale Trade (100.0%), Utilities (100.0%), and Information (100.0%).
| Industry | Male | Female |
| Agriculture, Fishing & Hunting | 0 (0.0%) | 0 (0.0%) |
| Mining, Quarrying, & Extraction | 0 (0.0%) | 0 (0.0%) |
| Construction | 15 (100.0%) | 0 (0.0%) |
| Manufacturing | 7 (21.2%) | 26 (78.8%) |
| Wholesale Trade | 0 (0.0%) | 8 (100.0%) |
| Retail Trade | 12 (35.3%) | 22 (64.7%) |
| Transportation & Warehousing | 21 (63.6%) | 12 (36.4%) |
| Utilities | 0 (0.0%) | 6 (100.0%) |
| Information | 0 (0.0%) | 7 (100.0%) |
| Finance & Insurance | 8 (47.1%) | 9 (52.9%) |
| Real Estate, Rental & Leasing | 10 (100.0%) | 0 (0.0%) |
| Professional & Scientific | 5 (100.0%) | 0 (0.0%) |
| Enterprise Management | 17 (100.0%) | 0 (0.0%) |
| Administrative & Support | 0 (0.0%) | 1 (100.0%) |
| Educational Services | 37 (82.2%) | 8 (17.8%) |
| Health Care & Social Assistance | 11 (16.7%) | 55 (83.3%) |
| Arts, Entertainment & Recreation | 15 (65.2%) | 8 (34.8%) |
| Accommodation & Food Services | 15 (21.7%) | 54 (78.3%) |
| Public Administration | 69 (72.6%) | 26 (27.4%) |
| Total | 262 (51.1%) | 251 (48.9%) |
Education in Patrick AFB
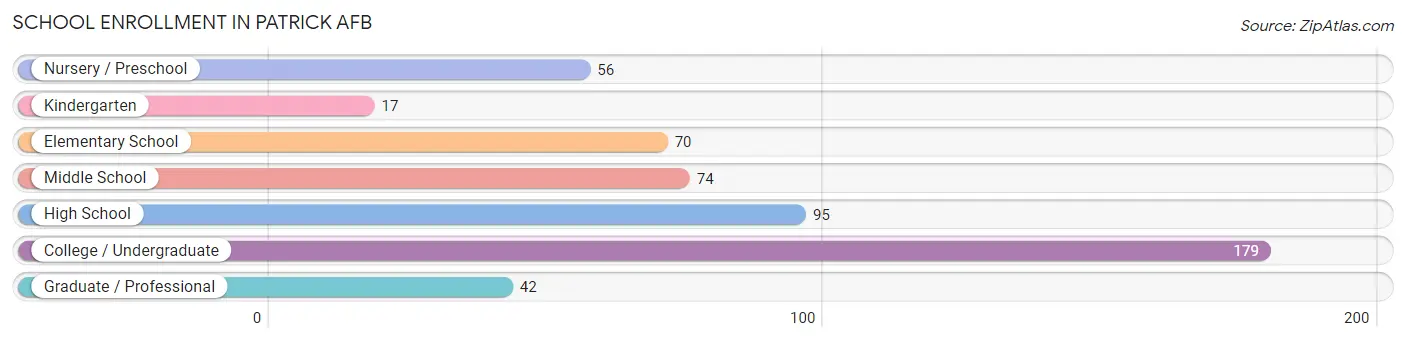
School Enrollment in Patrick AFB
The most common levels of schooling among the 533 students in Patrick AFB are college / undergraduate (179 | 33.6%), high school (95 | 17.8%), and middle school (74 | 13.9%).
| School Level | # Students | % Students |
| Nursery / Preschool | 56 | 10.5% |
| Kindergarten | 17 | 3.2% |
| Elementary School | 70 | 13.1% |
| Middle School | 74 | 13.9% |
| High School | 95 | 17.8% |
| College / Undergraduate | 179 | 33.6% |
| Graduate / Professional | 42 | 7.9% |
| Total | 533 | 100.0% |
School Enrollment by Age by Funding Source in Patrick AFB
Out of a total of 533 students who are enrolled in schools in Patrick AFB, 130 (24.4%) attend a private institution, while the remaining 403 (75.6%) are enrolled in public schools. The age group of 3 to 4 year olds has the highest likelihood of being enrolled in private schools, with 23 (92.0% in the age bracket) enrolled. Conversely, the age group of 15 to 17 year olds has the lowest likelihood of being enrolled in a private school, with 64 (100.0% in the age bracket) attending a public institution.
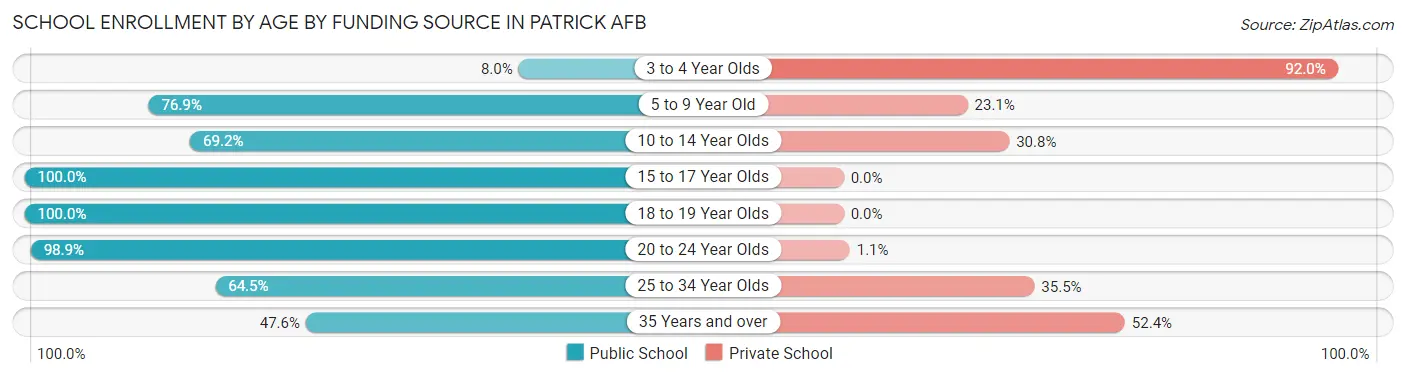
| Age Bracket | Public School | Private School |
| 3 to 4 Year Olds | 2 (8.0%) | 23 (92.0%) |
| 5 to 9 Year Old | 80 (76.9%) | 24 (23.1%) |
| 10 to 14 Year Olds | 74 (69.2%) | 33 (30.8%) |
| 15 to 17 Year Olds | 64 (100.0%) | 0 (0.0%) |
| 18 to 19 Year Olds | 27 (100.0%) | 0 (0.0%) |
| 20 to 24 Year Olds | 87 (98.9%) | 1 (1.1%) |
| 25 to 34 Year Olds | 49 (64.5%) | 27 (35.5%) |
| 35 Years and over | 20 (47.6%) | 22 (52.4%) |
| Total | 403 (75.6%) | 130 (24.4%) |
Educational Attainment by Field of Study in Patrick AFB
Education (78 | 18.1%), business (65 | 15.1%), social sciences (57 | 13.3%), psychology (40 | 9.3%), and computers & mathematics (34 | 7.9%) are the most common fields of study among 430 individuals in Patrick AFB who have obtained a bachelor's degree or higher.
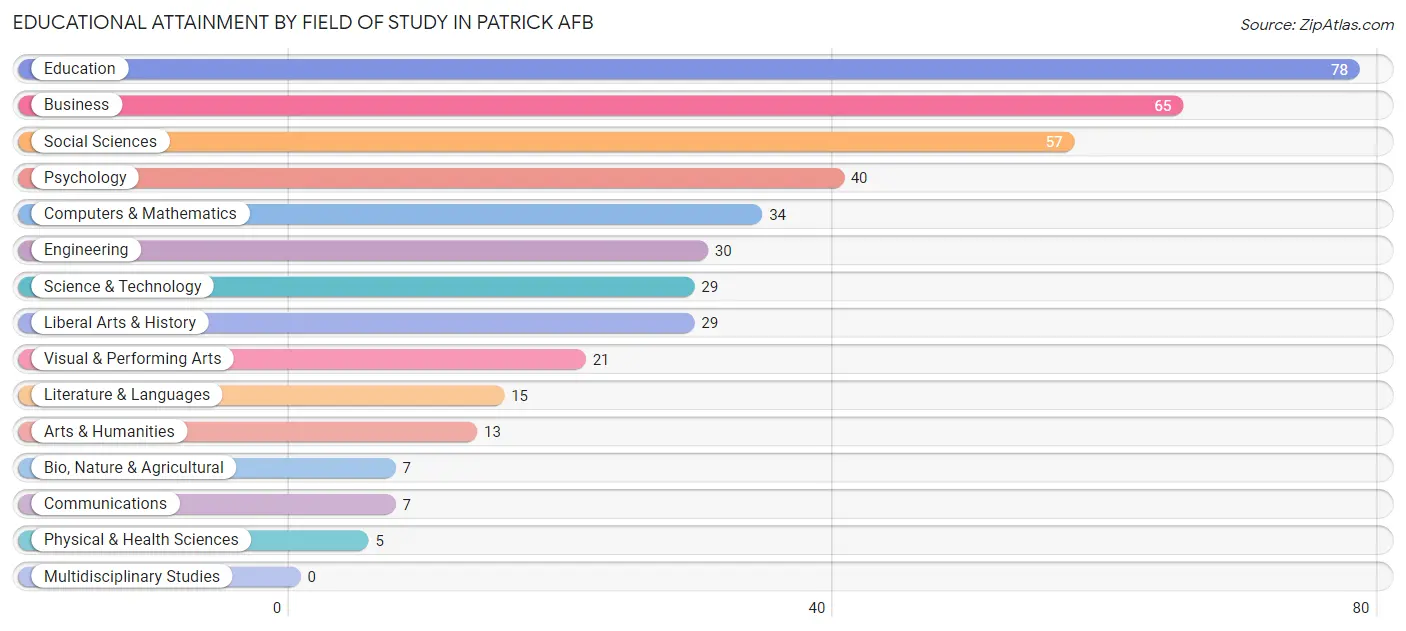
| Field of Study | # Graduates | % Graduates |
| Computers & Mathematics | 34 | 7.9% |
| Bio, Nature & Agricultural | 7 | 1.6% |
| Physical & Health Sciences | 5 | 1.2% |
| Psychology | 40 | 9.3% |
| Social Sciences | 57 | 13.3% |
| Engineering | 30 | 7.0% |
| Multidisciplinary Studies | 0 | 0.0% |
| Science & Technology | 29 | 6.7% |
| Business | 65 | 15.1% |
| Education | 78 | 18.1% |
| Literature & Languages | 15 | 3.5% |
| Liberal Arts & History | 29 | 6.7% |
| Visual & Performing Arts | 21 | 4.9% |
| Communications | 7 | 1.6% |
| Arts & Humanities | 13 | 3.0% |
| Total | 430 | 100.0% |
Transportation & Commute in Patrick AFB
Vehicle Availability by Sex in Patrick AFB
The most prevalent vehicle ownership categories in Patrick AFB are males with 2 vehicles (234, accounting for 65.0%) and females with 2 vehicles (118, making up 89.0%).
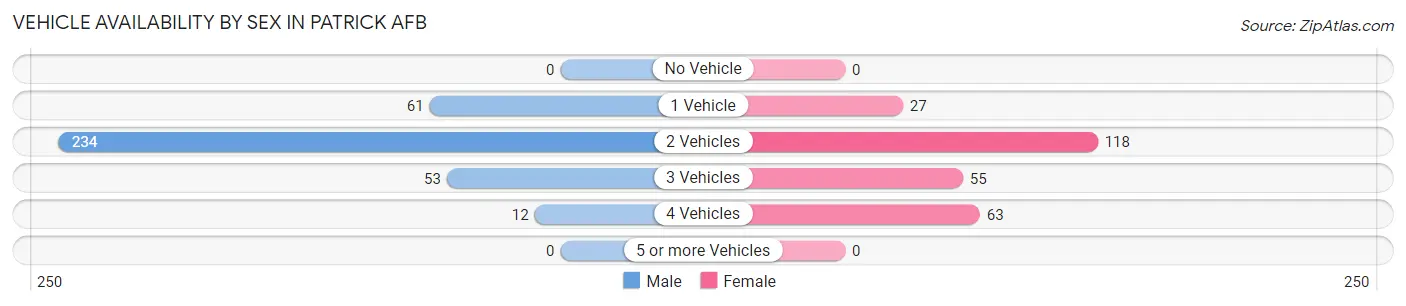
| Vehicles Available | Male | Female |
| No Vehicle | 0 (0.0%) | 0 (0.0%) |
| 1 Vehicle | 61 (16.9%) | 27 (10.3%) |
| 2 Vehicles | 234 (65.0%) | 118 (44.9%) |
| 3 Vehicles | 53 (14.7%) | 55 (20.9%) |
| 4 Vehicles | 12 (3.3%) | 63 (23.9%) |
| 5 or more Vehicles | 0 (0.0%) | 0 (0.0%) |
| Total | 360 (100.0%) | 263 (100.0%) |
Commute Time in Patrick AFB
The most frequently occuring commute durations in Patrick AFB are 5 to 9 minutes (272 commuters, 39.8%), 10 to 14 minutes (106 commuters, 15.5%), and 20 to 24 minutes (73 commuters, 10.7%).
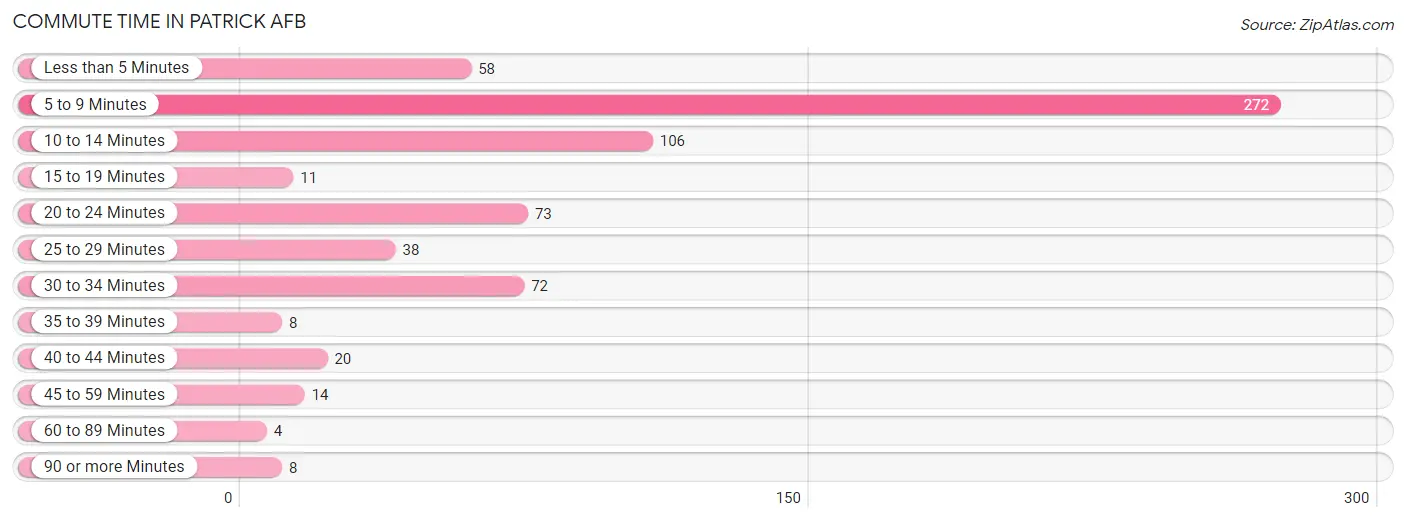
| Commute Time | # Commuters | % Commuters |
| Less than 5 Minutes | 58 | 8.5% |
| 5 to 9 Minutes | 272 | 39.8% |
| 10 to 14 Minutes | 106 | 15.5% |
| 15 to 19 Minutes | 11 | 1.6% |
| 20 to 24 Minutes | 73 | 10.7% |
| 25 to 29 Minutes | 38 | 5.6% |
| 30 to 34 Minutes | 72 | 10.5% |
| 35 to 39 Minutes | 8 | 1.2% |
| 40 to 44 Minutes | 20 | 2.9% |
| 45 to 59 Minutes | 14 | 2.1% |
| 60 to 89 Minutes | 4 | 0.6% |
| 90 or more Minutes | 8 | 1.2% |
Commute Time by Sex in Patrick AFB
The most common commute times in Patrick AFB are 5 to 9 minutes (201 commuters, 43.8%) for males and 5 to 9 minutes (71 commuters, 31.6%) for females.
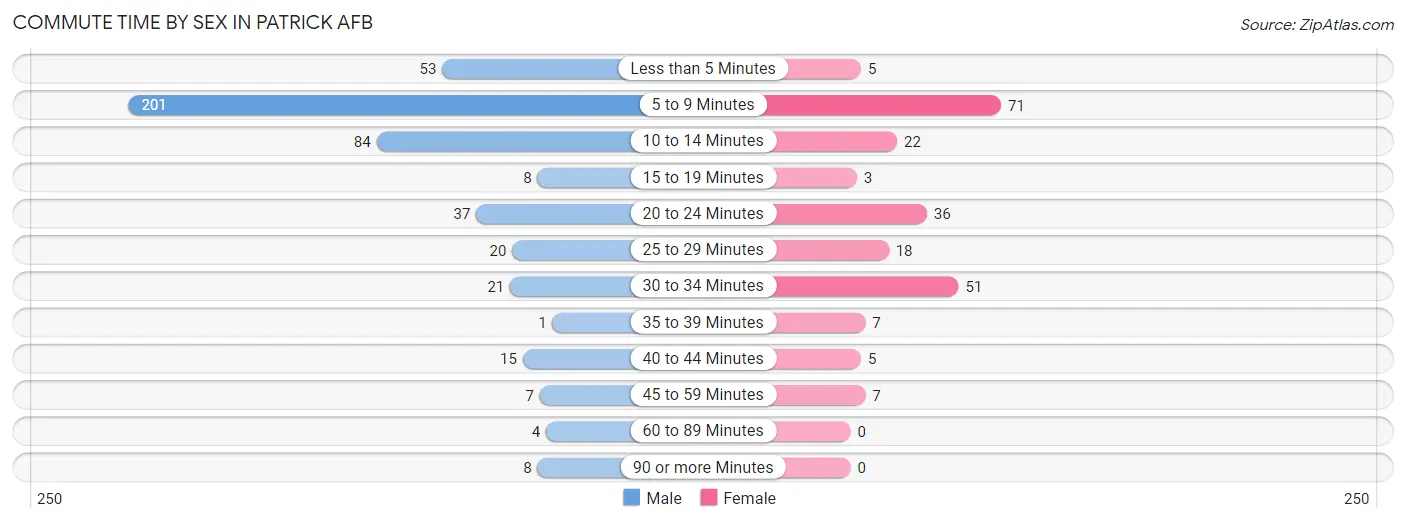
| Commute Time | Male | Female |
| Less than 5 Minutes | 53 (11.6%) | 5 (2.2%) |
| 5 to 9 Minutes | 201 (43.8%) | 71 (31.6%) |
| 10 to 14 Minutes | 84 (18.3%) | 22 (9.8%) |
| 15 to 19 Minutes | 8 (1.7%) | 3 (1.3%) |
| 20 to 24 Minutes | 37 (8.1%) | 36 (16.0%) |
| 25 to 29 Minutes | 20 (4.4%) | 18 (8.0%) |
| 30 to 34 Minutes | 21 (4.6%) | 51 (22.7%) |
| 35 to 39 Minutes | 1 (0.2%) | 7 (3.1%) |
| 40 to 44 Minutes | 15 (3.3%) | 5 (2.2%) |
| 45 to 59 Minutes | 7 (1.5%) | 7 (3.1%) |
| 60 to 89 Minutes | 4 (0.9%) | 0 (0.0%) |
| 90 or more Minutes | 8 (1.7%) | 0 (0.0%) |
Time of Departure to Work by Sex in Patrick AFB
The most frequent times of departure to work in Patrick AFB are 7:30 AM to 7:59 AM (133, 29.0%) for males and 7:00 AM to 7:29 AM (111, 49.3%) for females.
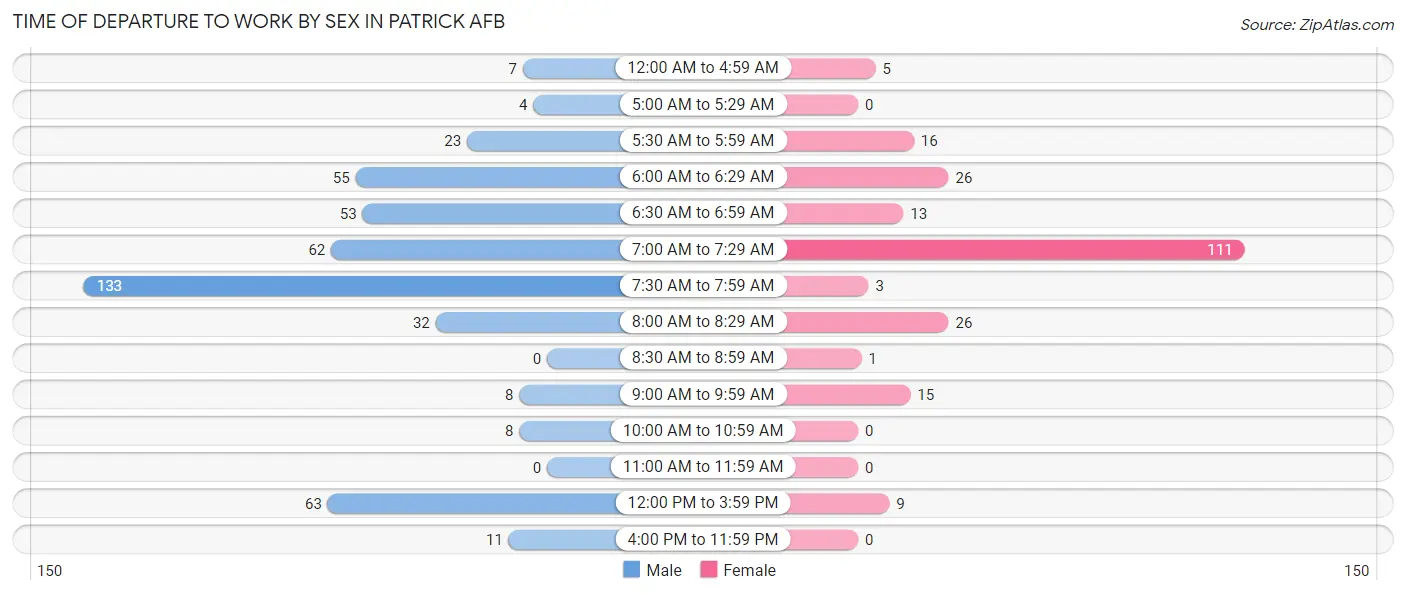
| Time of Departure | Male | Female |
| 12:00 AM to 4:59 AM | 7 (1.5%) | 5 (2.2%) |
| 5:00 AM to 5:29 AM | 4 (0.9%) | 0 (0.0%) |
| 5:30 AM to 5:59 AM | 23 (5.0%) | 16 (7.1%) |
| 6:00 AM to 6:29 AM | 55 (12.0%) | 26 (11.6%) |
| 6:30 AM to 6:59 AM | 53 (11.6%) | 13 (5.8%) |
| 7:00 AM to 7:29 AM | 62 (13.5%) | 111 (49.3%) |
| 7:30 AM to 7:59 AM | 133 (29.0%) | 3 (1.3%) |
| 8:00 AM to 8:29 AM | 32 (7.0%) | 26 (11.6%) |
| 8:30 AM to 8:59 AM | 0 (0.0%) | 1 (0.4%) |
| 9:00 AM to 9:59 AM | 8 (1.7%) | 15 (6.7%) |
| 10:00 AM to 10:59 AM | 8 (1.7%) | 0 (0.0%) |
| 11:00 AM to 11:59 AM | 0 (0.0%) | 0 (0.0%) |
| 12:00 PM to 3:59 PM | 63 (13.7%) | 9 (4.0%) |
| 4:00 PM to 11:59 PM | 11 (2.4%) | 0 (0.0%) |
| Total | 459 (100.0%) | 225 (100.0%) |
Housing Occupancy in Patrick AFB
Occupancy by Ownership in Patrick AFB
Of the total 516 dwellings in Patrick AFB, owner-occupied units account for 0 (0.0%), while renter-occupied units make up 516 (100.0%).
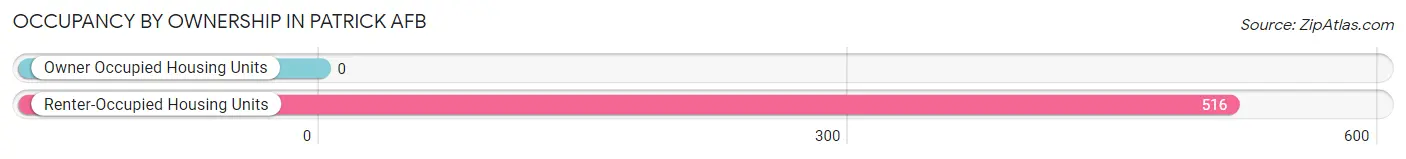
| Occupancy | # Housing Units | % Housing Units |
| Owner Occupied Housing Units | 0 | 0.0% |
| Renter-Occupied Housing Units | 516 | 100.0% |
| Total Occupied Housing Units | 516 | 100.0% |
Occupancy by Household Size in Patrick AFB
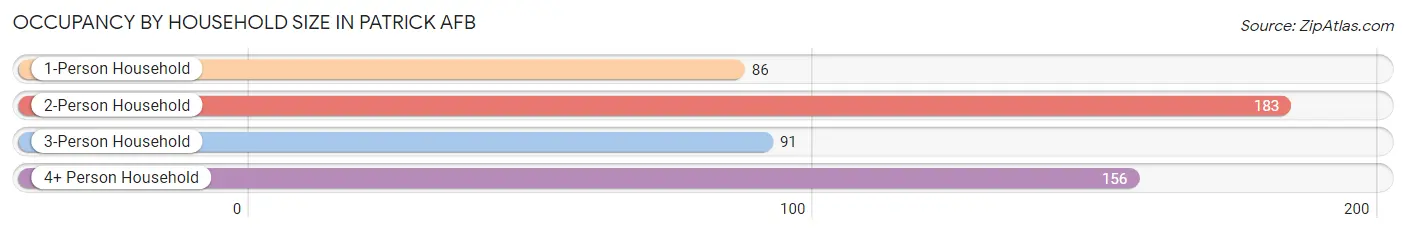
| Household Size | # Housing Units | % Housing Units |
| 1-Person Household | 86 | 16.7% |
| 2-Person Household | 183 | 35.5% |
| 3-Person Household | 91 | 17.6% |
| 4+ Person Household | 156 | 30.2% |
| Total Housing Units | 516 | 100.0% |
Occupancy by Ownership by Household Size in Patrick AFB
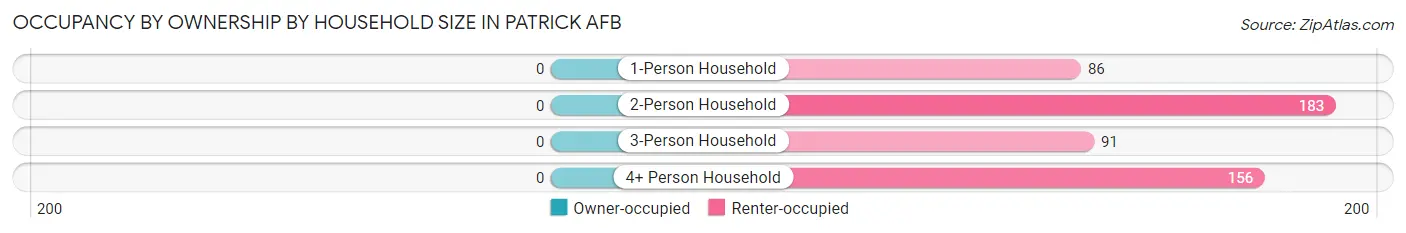
| Household Size | Owner-occupied | Renter-occupied |
| 1-Person Household | 0 (0.0%) | 86 (100.0%) |
| 2-Person Household | 0 (0.0%) | 183 (100.0%) |
| 3-Person Household | 0 (0.0%) | 91 (100.0%) |
| 4+ Person Household | 0 (0.0%) | 156 (100.0%) |
| Total Housing Units | 0 (0.0%) | 516 (100.0%) |
Occupancy by Educational Attainment in Patrick AFB
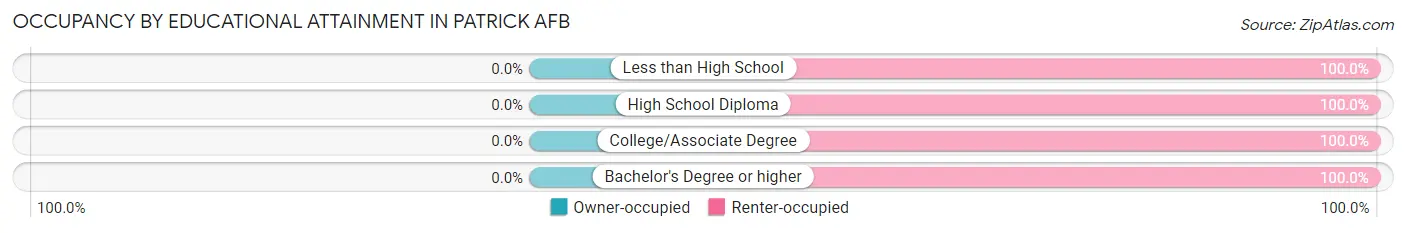
| Household Size | Owner-occupied | Renter-occupied |
| Less than High School | 0 (0.0%) | 23 (100.0%) |
| High School Diploma | 0 (0.0%) | 66 (100.0%) |
| College/Associate Degree | 0 (0.0%) | 209 (100.0%) |
| Bachelor's Degree or higher | 0 (0.0%) | 218 (100.0%) |
Occupancy by Age of Householder in Patrick AFB
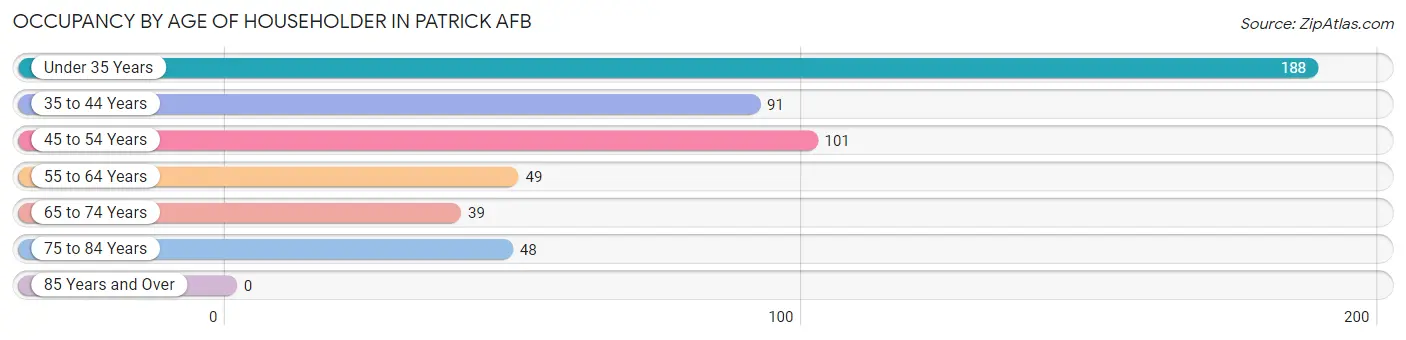
| Age Bracket | # Households | % Households |
| Under 35 Years | 188 | 36.4% |
| 35 to 44 Years | 91 | 17.6% |
| 45 to 54 Years | 101 | 19.6% |
| 55 to 64 Years | 49 | 9.5% |
| 65 to 74 Years | 39 | 7.6% |
| 75 to 84 Years | 48 | 9.3% |
| 85 Years and Over | 0 | 0.0% |
| Total | 516 | 100.0% |
Housing Finances in Patrick AFB
Median Income by Occupancy in Patrick AFB
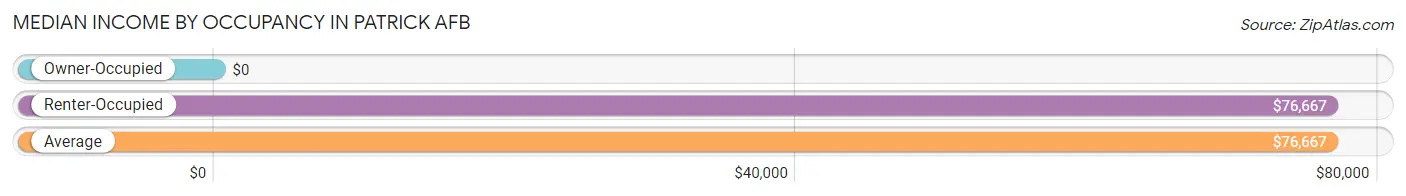
| Occupancy Type | # Households | Median Income |
| Owner-Occupied | 0 (0.0%) | $0 |
| Renter-Occupied | 516 (100.0%) | $76,667 |
| Average | 516 (100.0%) | $76,667 |
Occupancy by Householder Income Bracket in Patrick AFB
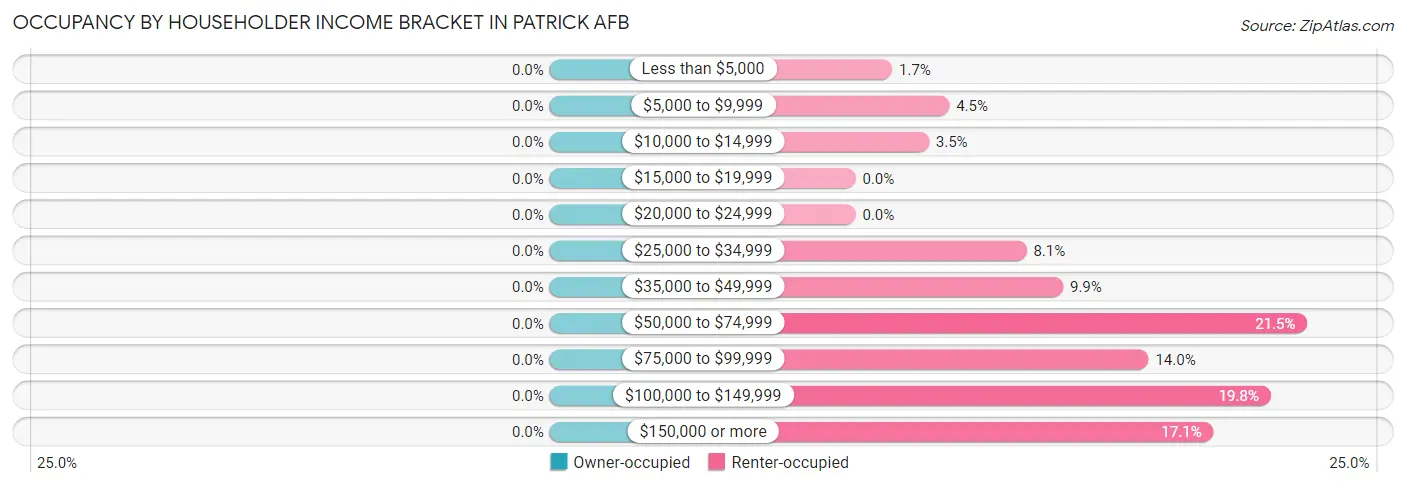
| Income Bracket | Owner-occupied | Renter-occupied |
| Less than $5,000 | 0 (0.0%) | 9 (1.7%) |
| $5,000 to $9,999 | 0 (0.0%) | 23 (4.5%) |
| $10,000 to $14,999 | 0 (0.0%) | 18 (3.5%) |
| $15,000 to $19,999 | 0 (0.0%) | 0 (0.0%) |
| $20,000 to $24,999 | 0 (0.0%) | 0 (0.0%) |
| $25,000 to $34,999 | 0 (0.0%) | 42 (8.1%) |
| $35,000 to $49,999 | 0 (0.0%) | 51 (9.9%) |
| $50,000 to $74,999 | 0 (0.0%) | 111 (21.5%) |
| $75,000 to $99,999 | 0 (0.0%) | 72 (14.0%) |
| $100,000 to $149,999 | 0 (0.0%) | 102 (19.8%) |
| $150,000 or more | 0 (0.0%) | 88 (17.1%) |
| Total | 0 (0.0%) | 516 (100.0%) |
Monthly Housing Cost Tiers in Patrick AFB
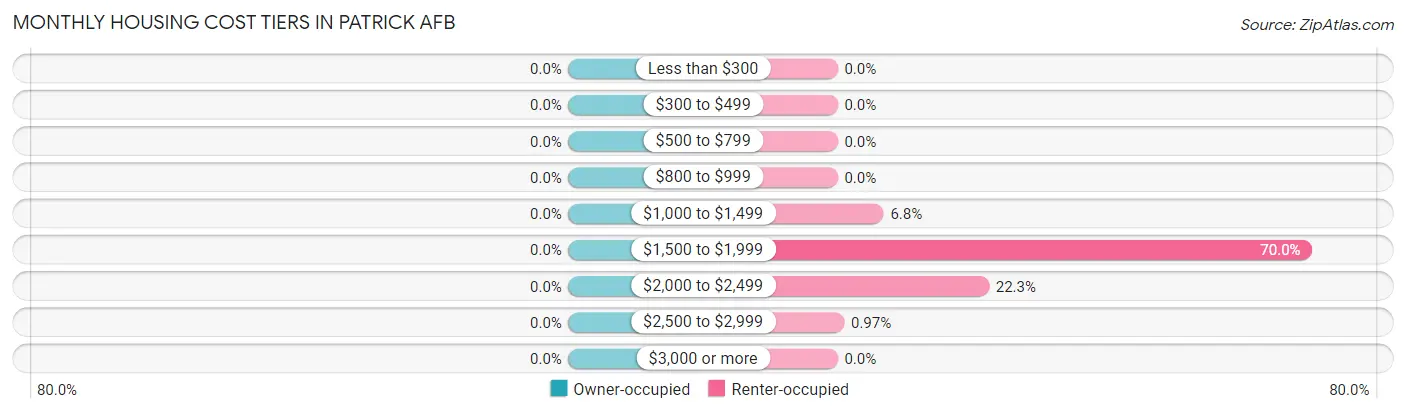
| Monthly Cost | Owner-occupied | Renter-occupied |
| Less than $300 | 0 (0.0%) | 0 (0.0%) |
| $300 to $499 | 0 (0.0%) | 0 (0.0%) |
| $500 to $799 | 0 (0.0%) | 0 (0.0%) |
| $800 to $999 | 0 (0.0%) | 0 (0.0%) |
| $1,000 to $1,499 | 0 (0.0%) | 35 (6.8%) |
| $1,500 to $1,999 | 0 (0.0%) | 361 (70.0%) |
| $2,000 to $2,499 | 0 (0.0%) | 115 (22.3%) |
| $2,500 to $2,999 | 0 (0.0%) | 5 (1.0%) |
| $3,000 or more | 0 (0.0%) | 0 (0.0%) |
| Total | 0 (0.0%) | 516 (100.0%) |
Physical Housing Characteristics in Patrick AFB
Housing Structures in Patrick AFB
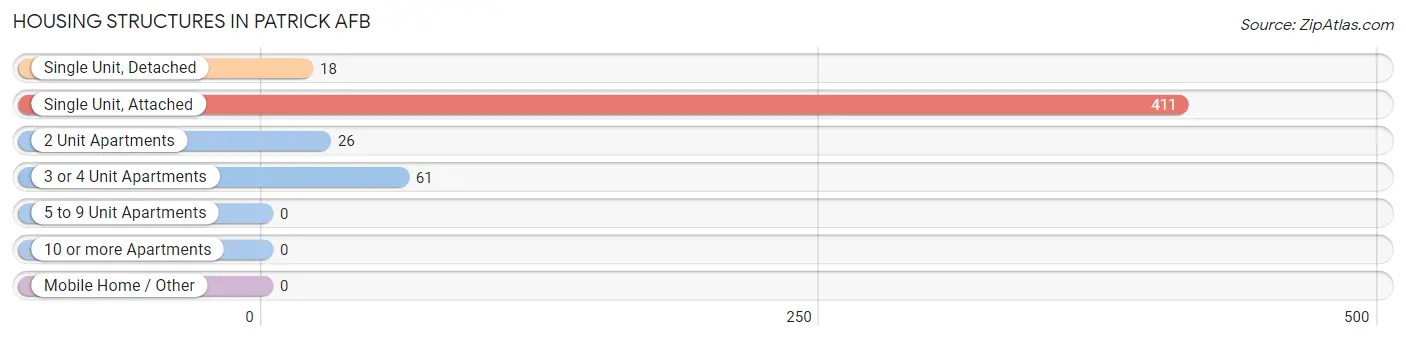
| Structure Type | # Housing Units | % Housing Units |
| Single Unit, Detached | 18 | 3.5% |
| Single Unit, Attached | 411 | 79.6% |
| 2 Unit Apartments | 26 | 5.0% |
| 3 or 4 Unit Apartments | 61 | 11.8% |
| 5 to 9 Unit Apartments | 0 | 0.0% |
| 10 or more Apartments | 0 | 0.0% |
| Mobile Home / Other | 0 | 0.0% |
| Total | 516 | 100.0% |
Housing Structures by Occupancy in Patrick AFB
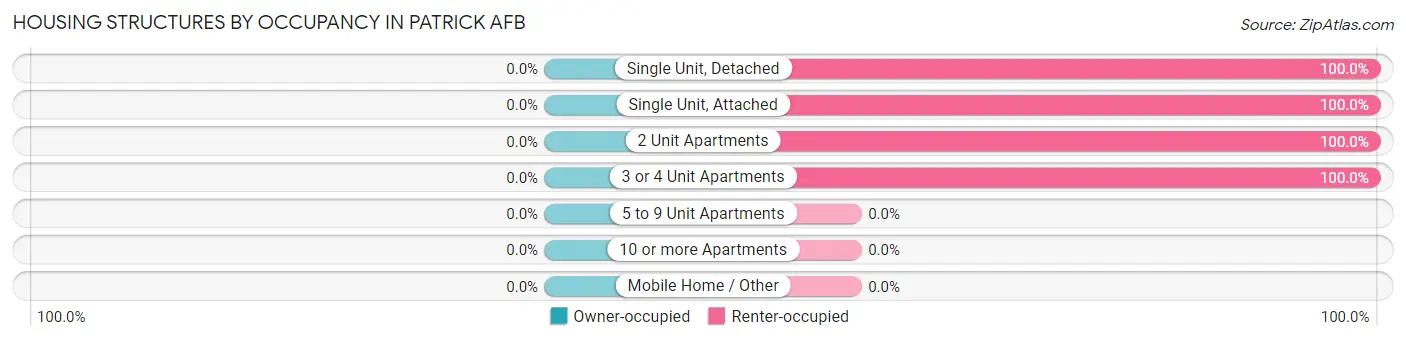
| Structure Type | Owner-occupied | Renter-occupied |
| Single Unit, Detached | 0 (0.0%) | 18 (100.0%) |
| Single Unit, Attached | 0 (0.0%) | 411 (100.0%) |
| 2 Unit Apartments | 0 (0.0%) | 26 (100.0%) |
| 3 or 4 Unit Apartments | 0 (0.0%) | 61 (100.0%) |
| 5 to 9 Unit Apartments | 0 (0.0%) | 0 (0.0%) |
| 10 or more Apartments | 0 (0.0%) | 0 (0.0%) |
| Mobile Home / Other | 0 (0.0%) | 0 (0.0%) |
| Total | 0 (0.0%) | 516 (100.0%) |
Housing Structures by Number of Rooms in Patrick AFB
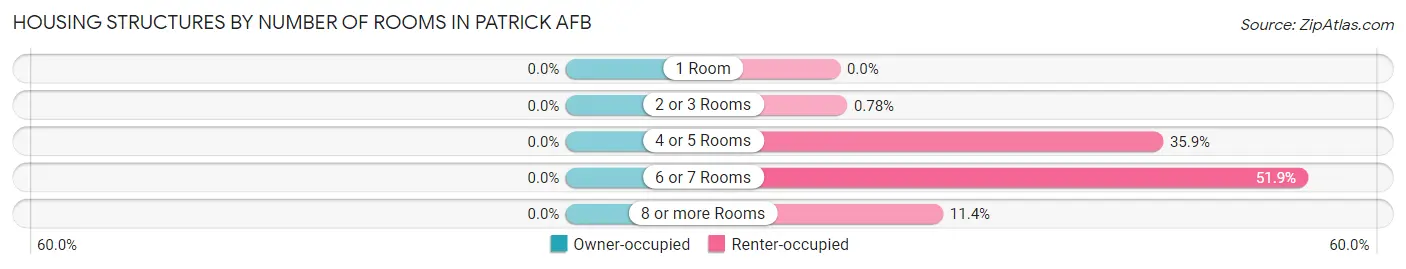
| Number of Rooms | Owner-occupied | Renter-occupied |
| 1 Room | 0 (0.0%) | 0 (0.0%) |
| 2 or 3 Rooms | 0 (0.0%) | 4 (0.8%) |
| 4 or 5 Rooms | 0 (0.0%) | 185 (35.8%) |
| 6 or 7 Rooms | 0 (0.0%) | 268 (51.9%) |
| 8 or more Rooms | 0 (0.0%) | 59 (11.4%) |
| Total | 0 (0.0%) | 516 (100.0%) |
Housing Structure by Heating Type in Patrick AFB
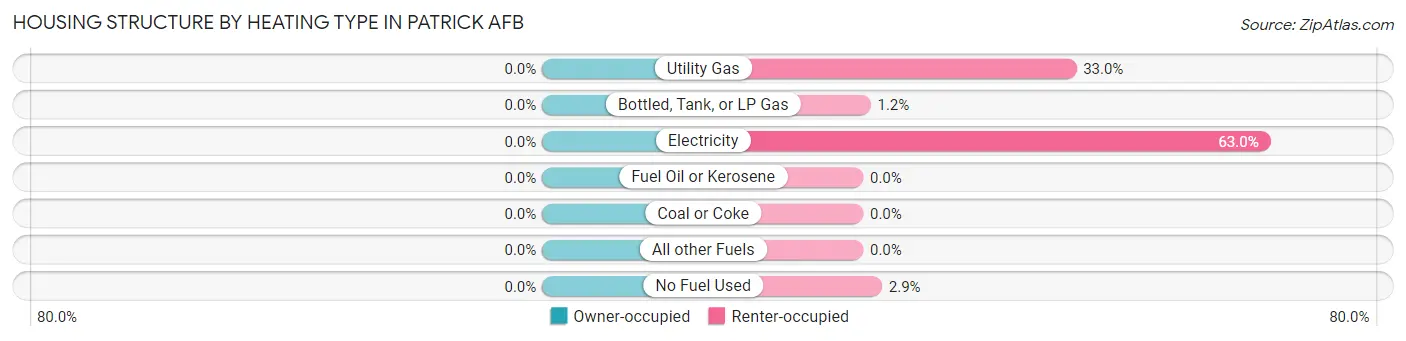
| Heating Type | Owner-occupied | Renter-occupied |
| Utility Gas | 0 (0.0%) | 170 (33.0%) |
| Bottled, Tank, or LP Gas | 0 (0.0%) | 6 (1.2%) |
| Electricity | 0 (0.0%) | 325 (63.0%) |
| Fuel Oil or Kerosene | 0 (0.0%) | 0 (0.0%) |
| Coal or Coke | 0 (0.0%) | 0 (0.0%) |
| All other Fuels | 0 (0.0%) | 0 (0.0%) |
| No Fuel Used | 0 (0.0%) | 15 (2.9%) |
| Total | 0 (0.0%) | 516 (100.0%) |
Household Vehicle Usage in Patrick AFB
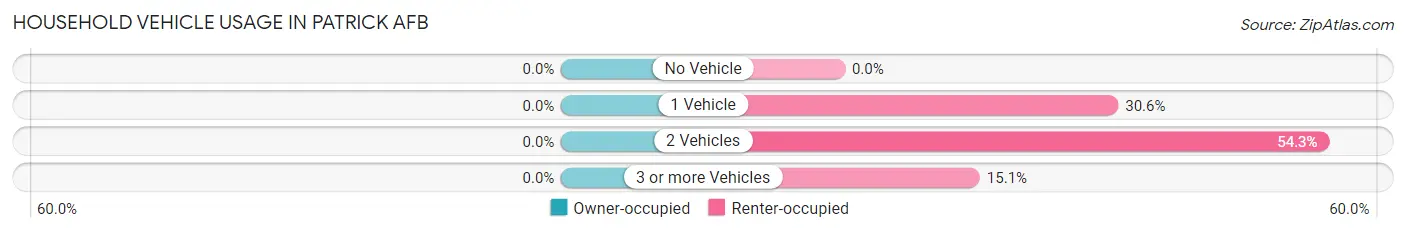
| Vehicles per Household | Owner-occupied | Renter-occupied |
| No Vehicle | 0 (0.0%) | 0 (0.0%) |
| 1 Vehicle | 0 (0.0%) | 158 (30.6%) |
| 2 Vehicles | 0 (0.0%) | 280 (54.3%) |
| 3 or more Vehicles | 0 (0.0%) | 78 (15.1%) |
| Total | 0 (0.0%) | 516 (100.0%) |
Real Estate & Mortgages in Patrick AFB
Real Estate and Mortgage Overview in Patrick AFB
| Characteristic | Without Mortgage | With Mortgage |
| Housing Units | 0 | 0 |
| Median Property Value | - | - |
| Median Household Income | - | - |
| Monthly Housing Costs | - | - |
| Real Estate Taxes | - | - |
Property Value by Mortgage Status in Patrick AFB
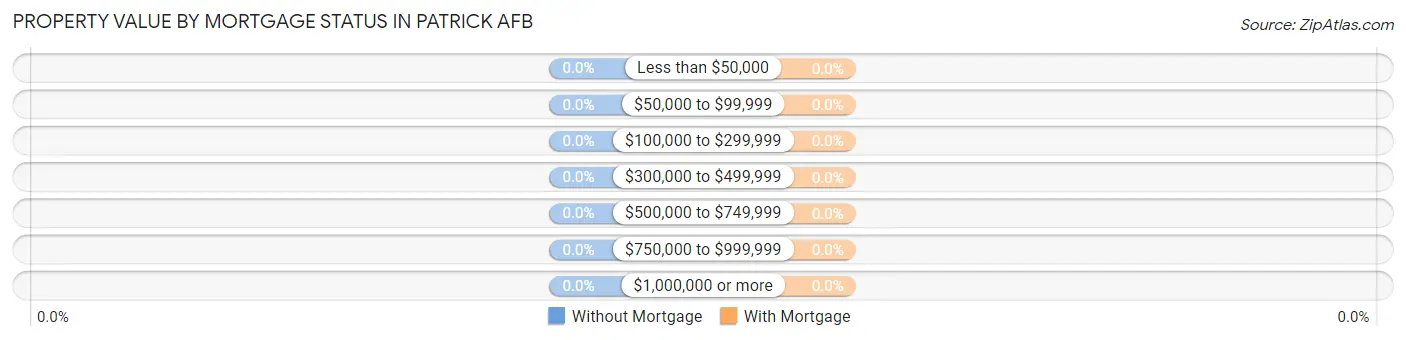
| Property Value | Without Mortgage | With Mortgage |
| Less than $50,000 | 0 (0.0%) | 0 (0.0%) |
| $50,000 to $99,999 | 0 (0.0%) | 0 (0.0%) |
| $100,000 to $299,999 | 0 (0.0%) | 0 (0.0%) |
| $300,000 to $499,999 | 0 (0.0%) | 0 (0.0%) |
| $500,000 to $749,999 | 0 (0.0%) | 0 (0.0%) |
| $750,000 to $999,999 | 0 (0.0%) | 0 (0.0%) |
| $1,000,000 or more | 0 (0.0%) | 0 (0.0%) |
| Total | 0 (0.0%) | 0 (0.0%) |
Household Income by Mortgage Status in Patrick AFB
| Household Income | Without Mortgage | With Mortgage |
| Less than $10,000 | 0 (0.0%) | 0 (0.0%) |
| $10,000 to $24,999 | 0 (0.0%) | 0 (0.0%) |
| $25,000 to $34,999 | 0 (0.0%) | 0 (0.0%) |
| $35,000 to $49,999 | 0 (0.0%) | 0 (0.0%) |
| $50,000 to $74,999 | 0 (0.0%) | 0 (0.0%) |
| $75,000 to $99,999 | 0 (0.0%) | 0 (0.0%) |
| $100,000 to $149,999 | 0 (0.0%) | 0 (0.0%) |
| $150,000 or more | 0 (0.0%) | 0 (0.0%) |
| Total | 0 (0.0%) | 0 (0.0%) |
Property Value to Household Income Ratio in Patrick AFB
| Value-to-Income Ratio | Without Mortgage | With Mortgage |
| Less than 2.0x | 0 (0.0%) | 0 (0.0%) |
| 2.0x to 2.9x | 0 (0.0%) | 0 (0.0%) |
| 3.0x to 3.9x | 0 (0.0%) | 0 (0.0%) |
| 4.0x or more | 0 (0.0%) | 0 (0.0%) |
| Total | 0 (0.0%) | 0 (0.0%) |
Real Estate Taxes by Mortgage Status in Patrick AFB
| Property Taxes | Without Mortgage | With Mortgage |
| Less than $800 | 0 (0.0%) | 0 (0.0%) |
| $800 to $1,499 | 0 (0.0%) | 0 (0.0%) |
| $800 to $1,499 | 0 (0.0%) | 0 (0.0%) |
| Total | 0 (0.0%) | 0 (0.0%) |
Health & Disability in Patrick AFB
Health Insurance Coverage by Age in Patrick AFB
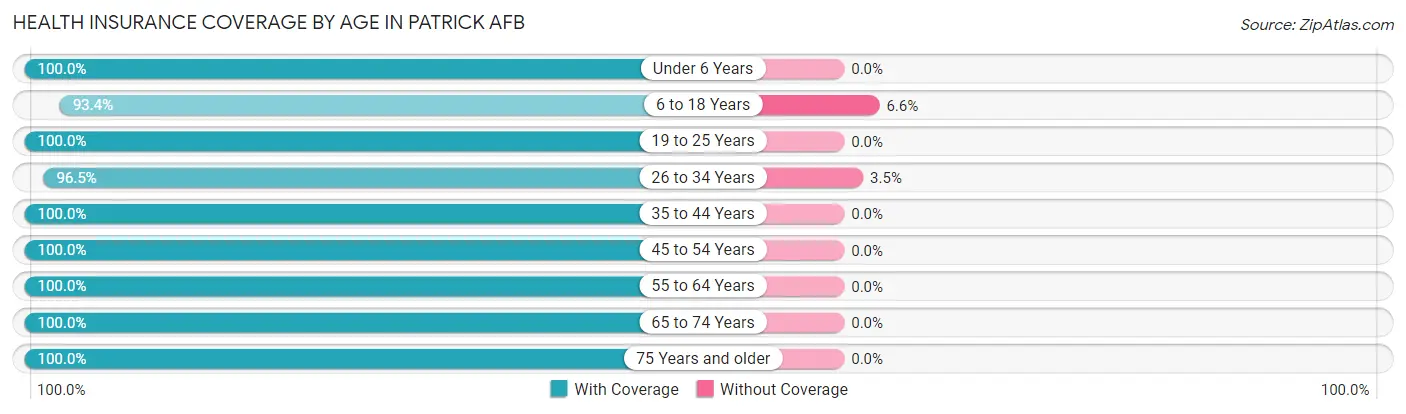
| Age Bracket | With Coverage | Without Coverage |
| Under 6 Years | 210 (100.0%) | 0 (0.0%) |
| 6 to 18 Years | 228 (93.4%) | 16 (6.6%) |
| 19 to 25 Years | 184 (100.0%) | 0 (0.0%) |
| 26 to 34 Years | 192 (96.5%) | 7 (3.5%) |
| 35 to 44 Years | 133 (100.0%) | 0 (0.0%) |
| 45 to 54 Years | 159 (100.0%) | 0 (0.0%) |
| 55 to 64 Years | 123 (100.0%) | 0 (0.0%) |
| 65 to 74 Years | 60 (100.0%) | 0 (0.0%) |
| 75 Years and older | 48 (100.0%) | 0 (0.0%) |
| Total | 1,337 (98.3%) | 23 (1.7%) |
Health Insurance Coverage by Citizenship Status in Patrick AFB
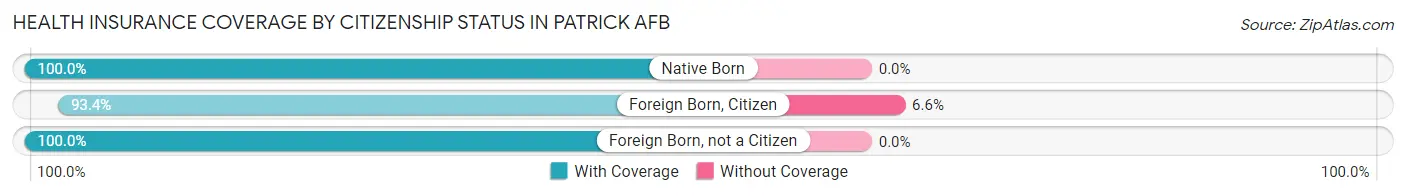
| Citizenship Status | With Coverage | Without Coverage |
| Native Born | 210 (100.0%) | 0 (0.0%) |
| Foreign Born, Citizen | 228 (93.4%) | 16 (6.6%) |
| Foreign Born, not a Citizen | 184 (100.0%) | 0 (0.0%) |
Health Insurance Coverage by Household Income in Patrick AFB
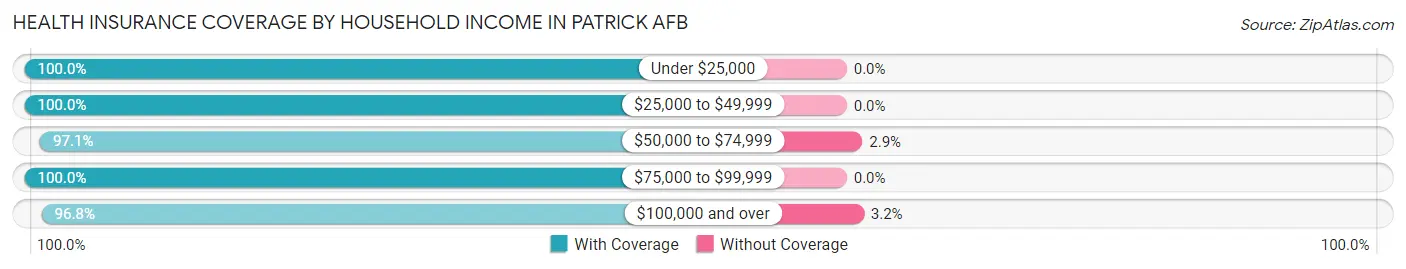
| Household Income | With Coverage | Without Coverage |
| Under $25,000 | 155 (100.0%) | 0 (0.0%) |
| $25,000 to $49,999 | 294 (100.0%) | 0 (0.0%) |
| $50,000 to $74,999 | 233 (97.1%) | 7 (2.9%) |
| $75,000 to $99,999 | 170 (100.0%) | 0 (0.0%) |
| $100,000 and over | 485 (96.8%) | 16 (3.2%) |
Public vs Private Health Insurance Coverage by Age in Patrick AFB
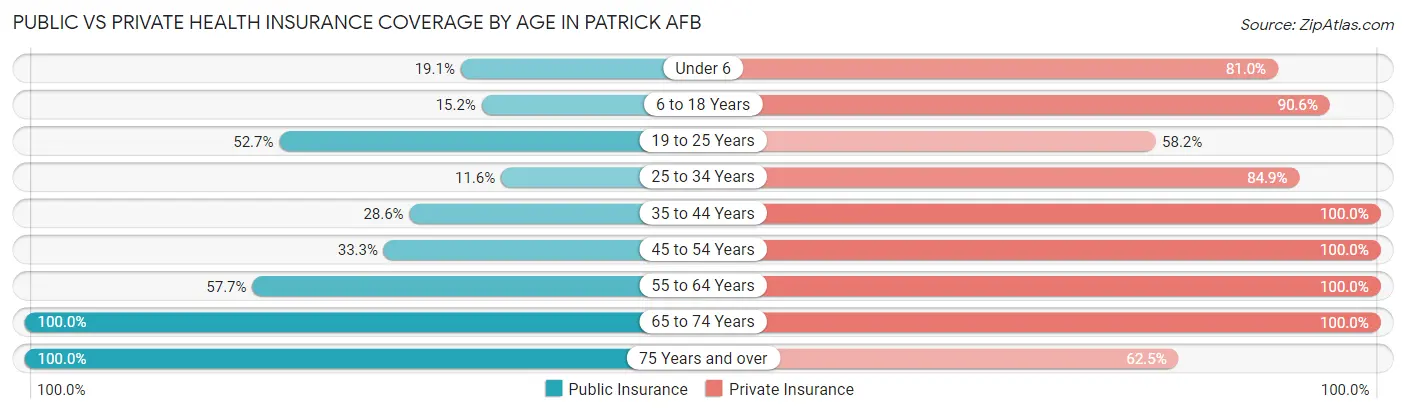
| Age Bracket | Public Insurance | Private Insurance |
| Under 6 | 40 (19.1%) | 170 (80.9%) |
| 6 to 18 Years | 37 (15.2%) | 221 (90.6%) |
| 19 to 25 Years | 97 (52.7%) | 107 (58.2%) |
| 25 to 34 Years | 23 (11.6%) | 169 (84.9%) |
| 35 to 44 Years | 38 (28.6%) | 133 (100.0%) |
| 45 to 54 Years | 53 (33.3%) | 159 (100.0%) |
| 55 to 64 Years | 71 (57.7%) | 123 (100.0%) |
| 65 to 74 Years | 60 (100.0%) | 60 (100.0%) |
| 75 Years and over | 48 (100.0%) | 30 (62.5%) |
| Total | 467 (34.3%) | 1,172 (86.2%) |
Disability Status by Sex by Age in Patrick AFB
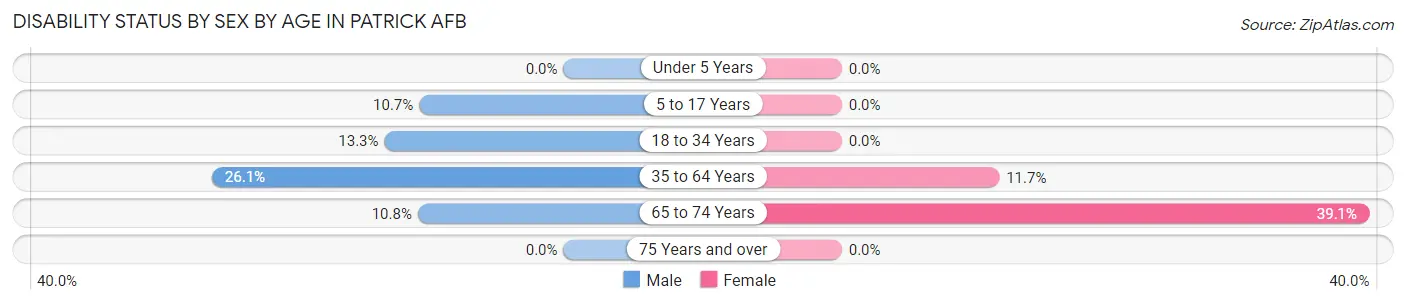
| Age Bracket | Male | Female |
| Under 5 Years | 0 (0.0%) | 0 (0.0%) |
| 5 to 17 Years | 18 (10.7%) | 0 (0.0%) |
| 18 to 34 Years | 23 (13.3%) | 0 (0.0%) |
| 35 to 64 Years | 48 (26.1%) | 27 (11.7%) |
| 65 to 74 Years | 4 (10.8%) | 9 (39.1%) |
| 75 Years and over | 0 (0.0%) | 0 (0.0%) |
Disability Class by Sex by Age in Patrick AFB
Disability Class: Hearing Difficulty
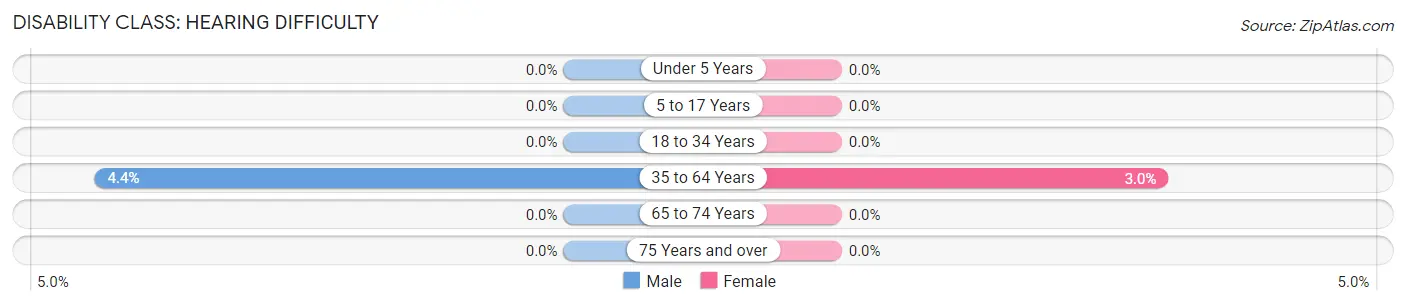
| Age Bracket | Male | Female |
| Under 5 Years | 0 (0.0%) | 0 (0.0%) |
| 5 to 17 Years | 0 (0.0%) | 0 (0.0%) |
| 18 to 34 Years | 0 (0.0%) | 0 (0.0%) |
| 35 to 64 Years | 8 (4.3%) | 7 (3.0%) |
| 65 to 74 Years | 0 (0.0%) | 0 (0.0%) |
| 75 Years and over | 0 (0.0%) | 0 (0.0%) |
Disability Class: Vision Difficulty
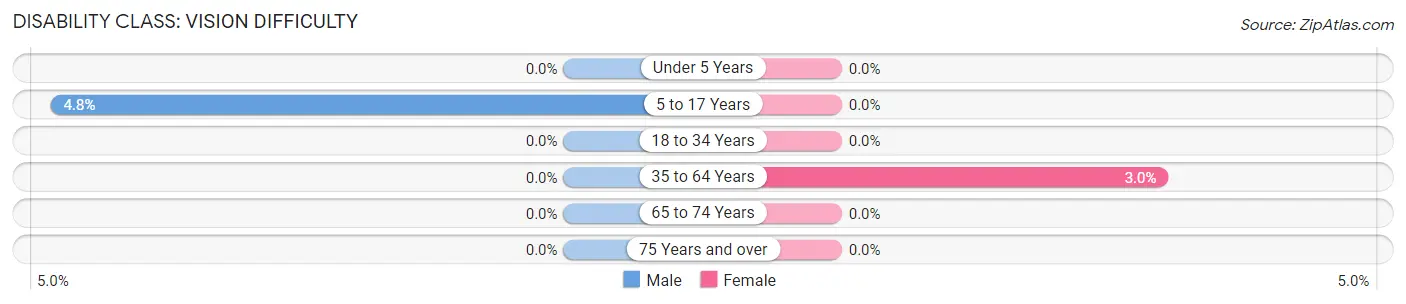
| Age Bracket | Male | Female |
| Under 5 Years | 0 (0.0%) | 0 (0.0%) |
| 5 to 17 Years | 8 (4.8%) | 0 (0.0%) |
| 18 to 34 Years | 0 (0.0%) | 0 (0.0%) |
| 35 to 64 Years | 0 (0.0%) | 7 (3.0%) |
| 65 to 74 Years | 0 (0.0%) | 0 (0.0%) |
| 75 Years and over | 0 (0.0%) | 0 (0.0%) |
Disability Class: Cognitive Difficulty
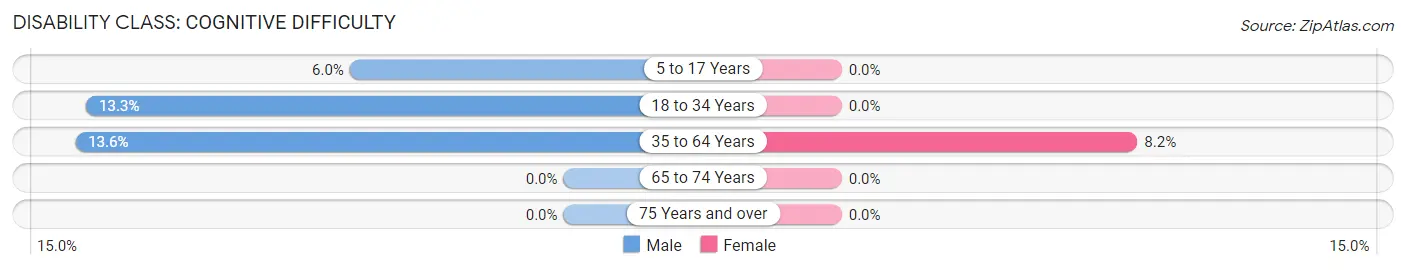
| Age Bracket | Male | Female |
| 5 to 17 Years | 10 (5.9%) | 0 (0.0%) |
| 18 to 34 Years | 23 (13.3%) | 0 (0.0%) |
| 35 to 64 Years | 25 (13.6%) | 19 (8.2%) |
| 65 to 74 Years | 0 (0.0%) | 0 (0.0%) |
| 75 Years and over | 0 (0.0%) | 0 (0.0%) |
Disability Class: Ambulatory Difficulty
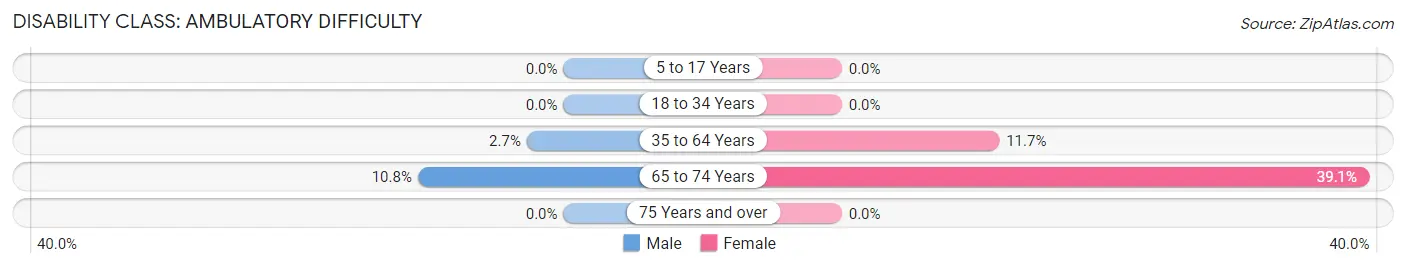
| Age Bracket | Male | Female |
| 5 to 17 Years | 0 (0.0%) | 0 (0.0%) |
| 18 to 34 Years | 0 (0.0%) | 0 (0.0%) |
| 35 to 64 Years | 5 (2.7%) | 27 (11.7%) |
| 65 to 74 Years | 4 (10.8%) | 9 (39.1%) |
| 75 Years and over | 0 (0.0%) | 0 (0.0%) |
Disability Class: Self-Care Difficulty
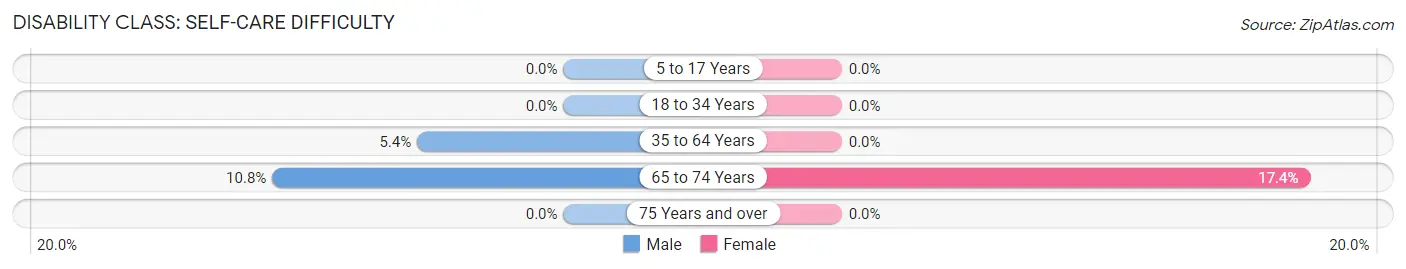
| Age Bracket | Male | Female |
| 5 to 17 Years | 0 (0.0%) | 0 (0.0%) |
| 18 to 34 Years | 0 (0.0%) | 0 (0.0%) |
| 35 to 64 Years | 10 (5.4%) | 0 (0.0%) |
| 65 to 74 Years | 4 (10.8%) | 4 (17.4%) |
| 75 Years and over | 0 (0.0%) | 0 (0.0%) |
Technology Access in Patrick AFB
Computing Device Access in Patrick AFB
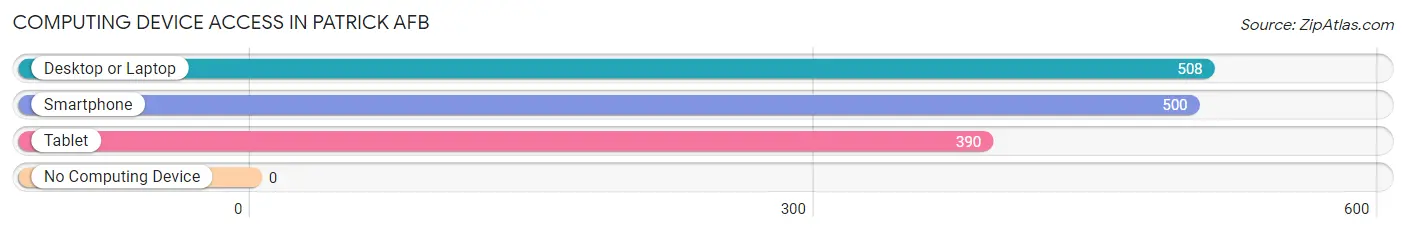
| Device Type | # Households | % Households |
| Desktop or Laptop | 508 | 98.5% |
| Smartphone | 500 | 96.9% |
| Tablet | 390 | 75.6% |
| No Computing Device | 0 | 0.0% |
| Total | 516 | 100.0% |
Internet Access in Patrick AFB
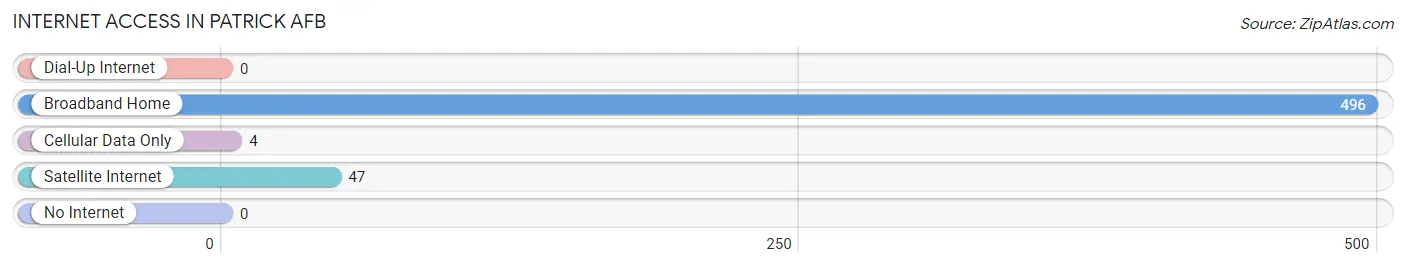
| Internet Type | # Households | % Households |
| Dial-Up Internet | 0 | 0.0% |
| Broadband Home | 496 | 96.1% |
| Cellular Data Only | 4 | 0.8% |
| Satellite Internet | 47 | 9.1% |
| No Internet | 0 | 0.0% |
| Total | 516 | 100.0% |
Patrick AFB Summary
History
Patrick Air Force Base (AFB) is located on the east coast of Florida, just south of the city of Cocoa Beach. It is the home of the 45th Space Wing, which is part of the Air Force Space Command. The base was originally established in 1940 as Naval Air Station Banana River, and was renamed in 1949 in honor of Major General Mason Patrick, the first Chief of the Army Air Service.
The base has a long and distinguished history of service to the United States. During World War II, the base was used as a training facility for Navy pilots and aircrews. After the war, the base was used as a missile testing facility, and was the site of the first successful launch of a ballistic missile from a submarine. During the Cold War, the base was used as a launch site for intercontinental ballistic missiles, and was the site of the first successful launch of a satellite from a submarine.
In the late 1950s, the base was transferred to the Air Force and renamed Patrick Air Force Base. Since then, the base has been used for a variety of missions, including space launch operations, satellite operations, and missile defense. The base is also home to the Air Force Technical Applications Center, which is responsible for monitoring nuclear weapons tests around the world.
Geography
Patrick Air Force Base is located on the east coast of Florida, just south of the city of Cocoa Beach. The base is situated on a barrier island, and is bordered by the Atlantic Ocean to the east and the Banana River to the west. The base covers an area of approximately 4,000 acres, and is home to a variety of military facilities, including a runway, a missile launch complex, and a satellite operations center.
The base is located in Brevard County, which is part of the Space Coast region of Florida. The Space Coast is known for its beautiful beaches, its vibrant culture, and its proximity to the Kennedy Space Center. The area is also home to a variety of wildlife, including manatees, dolphins, and sea turtles.
Economy
The economy of Patrick Air Force Base is largely driven by the military presence on the base. The base is home to a variety of military facilities, including a runway, a missile launch complex, and a satellite operations center. The base also serves as a training facility for the Air Force, and is home to a variety of research and development projects.
In addition to the military presence, the base is also home to a variety of businesses and organizations. These include a variety of retail stores, restaurants, and other services. The base also serves as a major employer in the area, providing jobs for both military personnel and civilians.
Demographics
As of the 2010 census, the population of Patrick Air Force Base was 4,945. The population is largely composed of military personnel and their families. The base is also home to a variety of civilian employees, including contractors and other service personnel.
The racial makeup of the base is predominantly white (83.3%), followed by African American (7.7%), Hispanic or Latino (4.2%), and Asian (2.2%). The median household income is $50,945, and the median age is 33. The base is also home to a variety of religious denominations, including Protestant (45.2%), Catholic (25.2%), and other (29.6%).
Common Questions
What is Per Capita Income in Patrick AFB?
Per Capita income in Patrick AFB is $33,688.
What is the Median Family Income in Patrick AFB?
Median Family Income in Patrick AFB is $79,271.
What is the Median Household income in Patrick AFB?
Median Household Income in Patrick AFB is $76,667.
What is Income or Wage Gap in Patrick AFB?
Income or Wage Gap in Patrick AFB is 20.1%.
Women in Patrick AFB earn 79.9 cents for every dollar earned by a man.
What is Inequality or Gini Index in Patrick AFB?
Inequality or Gini Index in Patrick AFB is 0.42.
What is the Total Population of Patrick AFB?
Total Population of Patrick AFB is 1,606.
What is the Total Male Population of Patrick AFB?
Total Male Population of Patrick AFB is 906.
What is the Total Female Population of Patrick AFB?
Total Female Population of Patrick AFB is 700.
What is the Ratio of Males per 100 Females in Patrick AFB?
There are 129.43 Males per 100 Females in Patrick AFB.
What is the Ratio of Females per 100 Males in Patrick AFB?
There are 77.26 Females per 100 Males in Patrick AFB.
What is the Median Population Age in Patrick AFB?
Median Population Age in Patrick AFB is 25.8 Years.
What is the Average Family Size in Patrick AFB
Average Family Size in Patrick AFB is 3.2 People.
What is the Average Household Size in Patrick AFB
Average Household Size in Patrick AFB is 2.9 People.
How Large is the Labor Force in Patrick AFB?
There are 756 People in the Labor Forcein in Patrick AFB.
What is the Percentage of People in the Labor Force in Patrick AFB?
63.0% of People are in the Labor Force in Patrick AFB.
What is the Unemployment Rate in Patrick AFB?
Unemployment Rate in Patrick AFB is 1.7%.