Parker, FL Map & Demographics
Parker Map
Parker Overview
$32,192
PER CAPITA INCOME
$71,979
AVG FAMILY INCOME
$64,478
AVG HOUSEHOLD INCOME
21.7%
WAGE / INCOME GAP [ % ]
78.3¢/ $1
WAGE / INCOME GAP [ $ ]
0.35
INEQUALITY / GINI INDEX
4,309
TOTAL POPULATION
2,029
MALE POPULATION
2,280
FEMALE POPULATION
88.99
MALES / 100 FEMALES
112.37
FEMALES / 100 MALES
36.0
MEDIAN AGE
3.0
AVG FAMILY SIZE
2.5
AVG HOUSEHOLD SIZE
2,222
LABOR FORCE [ PEOPLE ]
62.6%
PERCENT IN LABOR FORCE
5.9%
UNEMPLOYMENT RATE
Parker Area Codes
Income in Parker
Income Overview in Parker
Per Capita Income in Parker is $32,192, while median incomes of families and households are $71,979 and $64,478 respectively.
| Characteristic | Number | Measure |
| Per Capita Income | 4,309 | $32,192 |
| Median Family Income | 1,100 | $71,979 |
| Mean Family Income | 1,100 | $89,533 |
| Median Household Income | 1,693 | $64,478 |
| Mean Household Income | 1,693 | $78,184 |
| Income Deficit | 1,100 | $0 |
| Wage / Income Gap (%) | 4,309 | 21.69% |
| Wage / Income Gap ($) | 4,309 | 78.31¢ per $1 |
| Gini / Inequality Index | 4,309 | 0.35 |
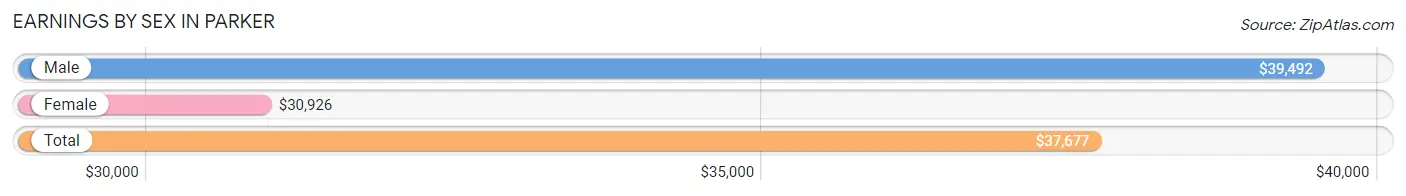
Earnings by Sex in Parker
Average Earnings in Parker are $37,677, $39,492 for men and $30,926 for women, a difference of 21.7%.
| Sex | Number | Average Earnings |
| Male | 1,330 (57.6%) | $39,492 |
| Female | 980 (42.4%) | $30,926 |
| Total | 2,310 (100.0%) | $37,677 |
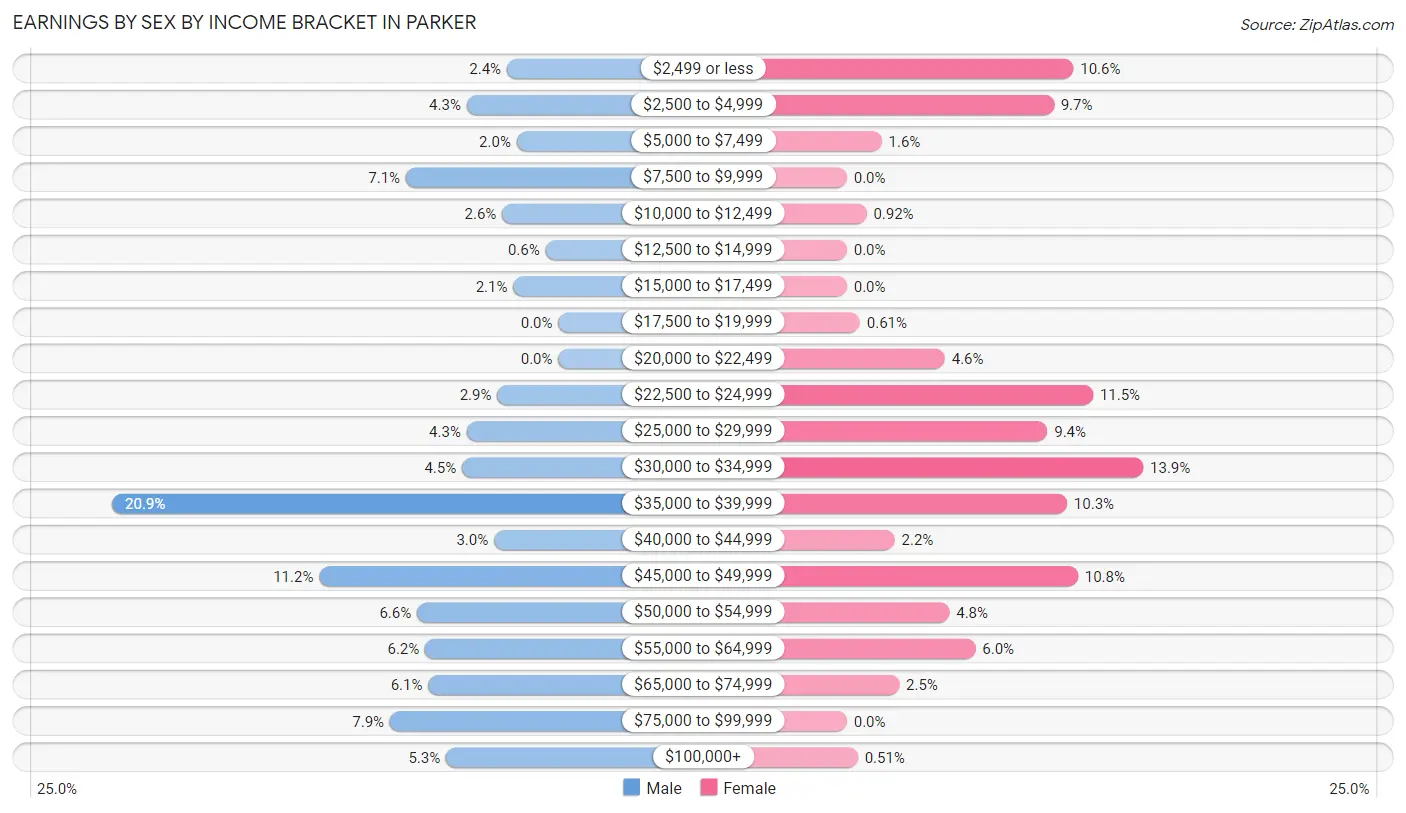
Earnings by Sex by Income Bracket in Parker
The most common earnings brackets in Parker are $35,000 to $39,999 for men (278 | 20.9%) and $30,000 to $34,999 for women (136 | 13.9%).
| Income | Male | Female |
| $2,499 or less | 32 (2.4%) | 104 (10.6%) |
| $2,500 to $4,999 | 57 (4.3%) | 95 (9.7%) |
| $5,000 to $7,499 | 26 (1.9%) | 16 (1.6%) |
| $7,500 to $9,999 | 95 (7.1%) | 0 (0.0%) |
| $10,000 to $12,499 | 35 (2.6%) | 9 (0.9%) |
| $12,500 to $14,999 | 8 (0.6%) | 0 (0.0%) |
| $15,000 to $17,499 | 28 (2.1%) | 0 (0.0%) |
| $17,500 to $19,999 | 0 (0.0%) | 6 (0.6%) |
| $20,000 to $22,499 | 0 (0.0%) | 45 (4.6%) |
| $22,500 to $24,999 | 38 (2.9%) | 113 (11.5%) |
| $25,000 to $29,999 | 57 (4.3%) | 92 (9.4%) |
| $30,000 to $34,999 | 60 (4.5%) | 136 (13.9%) |
| $35,000 to $39,999 | 278 (20.9%) | 101 (10.3%) |
| $40,000 to $44,999 | 40 (3.0%) | 22 (2.2%) |
| $45,000 to $49,999 | 149 (11.2%) | 106 (10.8%) |
| $50,000 to $54,999 | 88 (6.6%) | 47 (4.8%) |
| $55,000 to $64,999 | 83 (6.2%) | 59 (6.0%) |
| $65,000 to $74,999 | 81 (6.1%) | 24 (2.5%) |
| $75,000 to $99,999 | 105 (7.9%) | 0 (0.0%) |
| $100,000+ | 70 (5.3%) | 5 (0.5%) |
| Total | 1,330 (100.0%) | 980 (100.0%) |
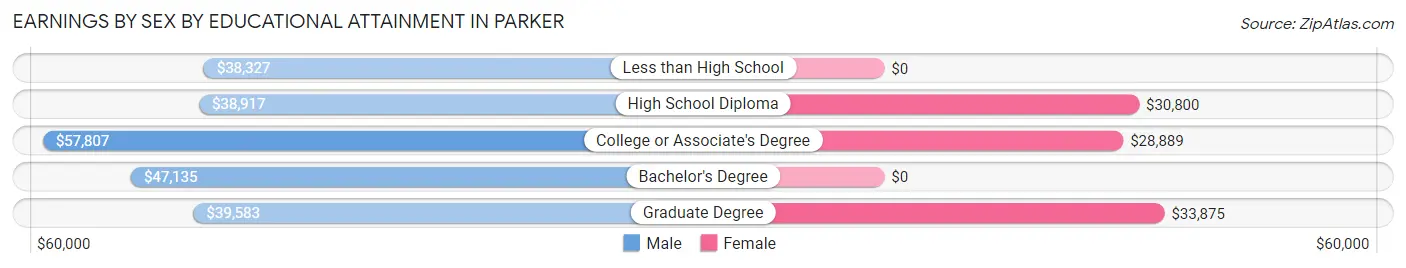
Earnings by Sex by Educational Attainment in Parker
Average earnings in Parker are $39,793 for men and $32,867 for women, a difference of 17.4%. Men with an educational attainment of college or associate's degree enjoy the highest average annual earnings of $57,807, while those with less than high school education earn the least with $38,327. Women with an educational attainment of graduate degree earn the most with the average annual earnings of $33,875, while those with college or associate's degree education have the smallest earnings of $28,889.
| Educational Attainment | Male Income | Female Income |
| Less than High School | $38,327 | $0 |
| High School Diploma | $38,917 | $30,800 |
| College or Associate's Degree | $57,807 | $28,889 |
| Bachelor's Degree | $47,135 | $0 |
| Graduate Degree | $39,583 | $33,875 |
| Total | $39,793 | $32,867 |
Family Income in Parker
Family Income Brackets in Parker
According to the Parker family income data, there are 377 families falling into the $50,000 to $74,999 income range, which is the most common income bracket and makes up 34.3% of all families.

| Income Bracket | # Families | % Families |
| Less than $10,000 | 0 | 0.0% |
| $10,000 to $14,999 | 0 | 0.0% |
| $15,000 to $24,999 | 13 | 1.2% |
| $25,000 to $34,999 | 104 | 9.5% |
| $35,000 to $49,999 | 85 | 7.7% |
| $50,000 to $74,999 | 377 | 34.3% |
| $75,000 to $99,999 | 155 | 14.1% |
| $100,000 to $149,999 | 230 | 20.9% |
| $150,000 to $199,999 | 47 | 4.3% |
| $200,000+ | 88 | 8.0% |
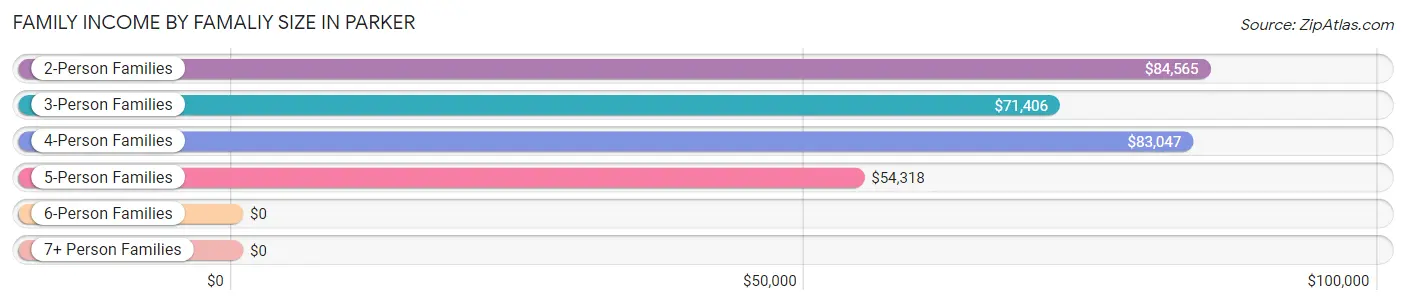
Family Income by Famaliy Size in Parker
2-person families (574 | 52.2%) account for the highest median family income in Parker with $84,565 per family, while 2-person families (574 | 52.2%) have the highest median income of $42,282 per family member.
| Income Bracket | # Families | Median Income |
| 2-Person Families | 574 (52.2%) | $84,565 |
| 3-Person Families | 181 (16.5%) | $71,406 |
| 4-Person Families | 211 (19.2%) | $83,047 |
| 5-Person Families | 132 (12.0%) | $54,318 |
| 6-Person Families | 0 (0.0%) | $0 |
| 7+ Person Families | 2 (0.2%) | $0 |
| Total | 1,100 (100.0%) | $71,979 |
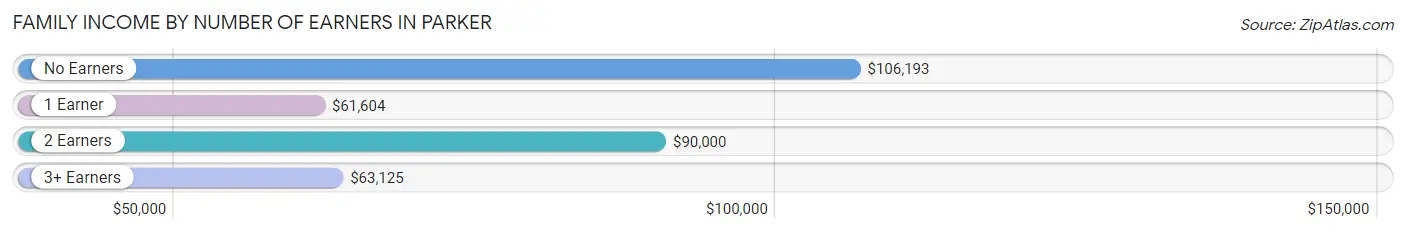
Family Income by Number of Earners in Parker
The median family income in Parker is $71,979, with families comprising no earners (155) having the highest median family income of $106,193, while families with 1 earner (372) have the lowest median family income of $61,604, accounting for 14.1% and 33.8% of families, respectively.
| Number of Earners | # Families | Median Income |
| No Earners | 155 (14.1%) | $106,193 |
| 1 Earner | 372 (33.8%) | $61,604 |
| 2 Earners | 482 (43.8%) | $90,000 |
| 3+ Earners | 91 (8.3%) | $63,125 |
| Total | 1,100 (100.0%) | $71,979 |
Household Income in Parker
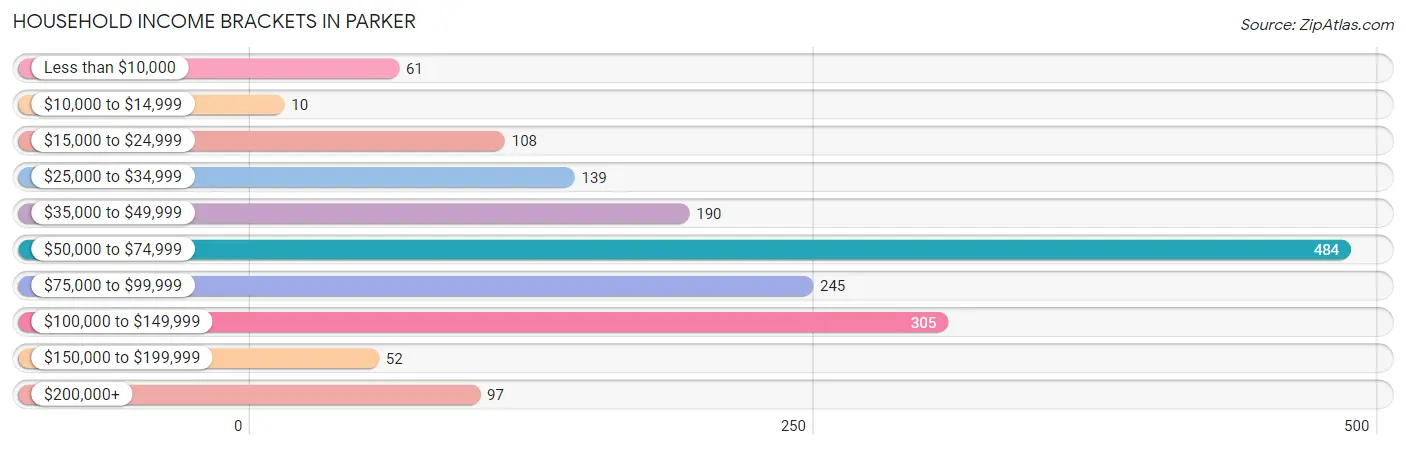
Household Income Brackets in Parker
With 484 households falling in the category, the $50,000 to $74,999 income range is the most frequent in Parker, accounting for 28.6% of all households. In contrast, only 10 households (0.6%) fall into the $10,000 to $14,999 income bracket, making it the least populous group.
| Income Bracket | # Households | % Households |
| Less than $10,000 | 61 | 3.6% |
| $10,000 to $14,999 | 10 | 0.6% |
| $15,000 to $24,999 | 108 | 6.4% |
| $25,000 to $34,999 | 139 | 8.2% |
| $35,000 to $49,999 | 190 | 11.2% |
| $50,000 to $74,999 | 484 | 28.6% |
| $75,000 to $99,999 | 245 | 14.5% |
| $100,000 to $149,999 | 305 | 18.0% |
| $150,000 to $199,999 | 52 | 3.1% |
| $200,000+ | 97 | 5.7% |
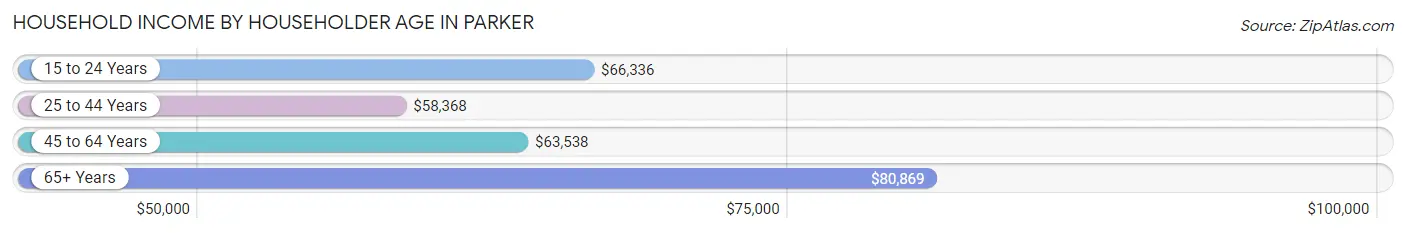
Household Income by Householder Age in Parker
The median household income in Parker is $64,478, with the highest median household income of $80,869 found in the 65+ years age bracket for the primary householder. A total of 453 households (26.8%) fall into this category. Meanwhile, the 25 to 44 years age bracket for the primary householder has the lowest median household income of $58,368, with 531 households (31.4%) in this group.
| Income Bracket | # Households | Median Income |
| 15 to 24 Years | 73 (4.3%) | $66,336 |
| 25 to 44 Years | 531 (31.4%) | $58,368 |
| 45 to 64 Years | 636 (37.6%) | $63,538 |
| 65+ Years | 453 (26.8%) | $80,869 |
| Total | 1,693 (100.0%) | $64,478 |
Poverty in Parker
Income Below Poverty by Sex and Age in Parker
With 9.0% poverty level for males and 10.7% for females among the residents of Parker, 16 and 17 year old males and 18 to 24 year old females are the most vulnerable to poverty, with 32 males (45.7%) and 25 females (25.5%) in their respective age groups living below the poverty level.
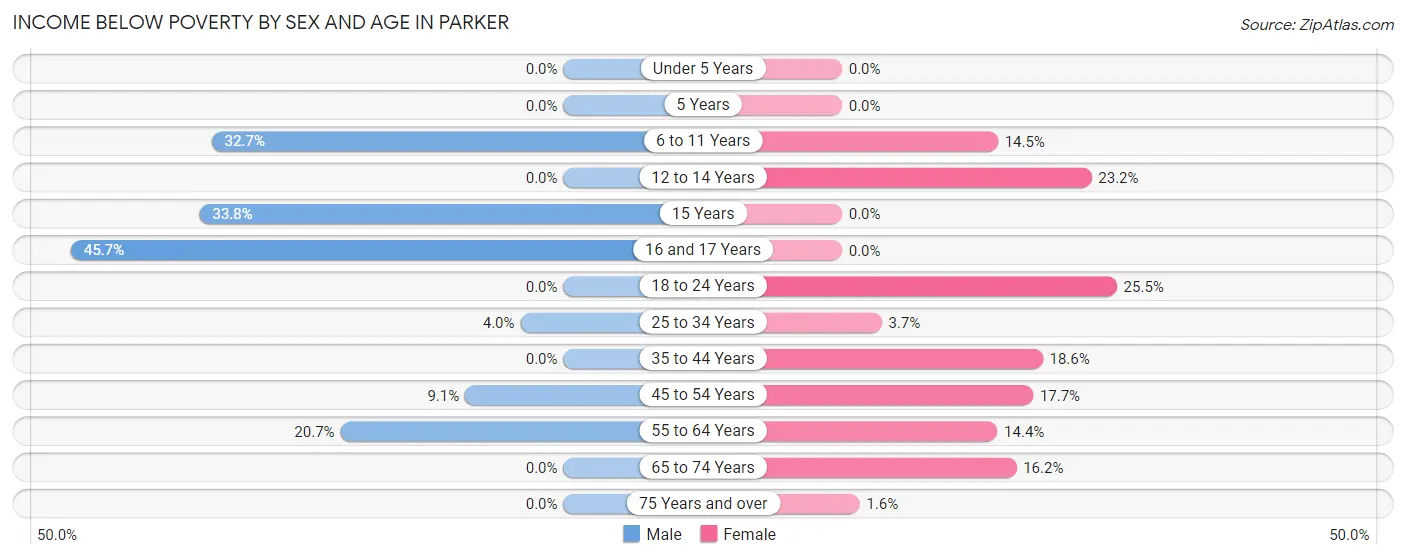
| Age Bracket | Male | Female |
| Under 5 Years | 0 (0.0%) | 0 (0.0%) |
| 5 Years | 0 (0.0%) | 0 (0.0%) |
| 6 to 11 Years | 16 (32.7%) | 23 (14.5%) |
| 12 to 14 Years | 0 (0.0%) | 22 (23.2%) |
| 15 Years | 25 (33.8%) | 0 (0.0%) |
| 16 and 17 Years | 32 (45.7%) | 0 (0.0%) |
| 18 to 24 Years | 0 (0.0%) | 25 (25.5%) |
| 25 to 34 Years | 18 (4.0%) | 13 (3.7%) |
| 35 to 44 Years | 0 (0.0%) | 30 (18.6%) |
| 45 to 54 Years | 29 (9.1%) | 44 (17.7%) |
| 55 to 64 Years | 60 (20.7%) | 45 (14.4%) |
| 65 to 74 Years | 0 (0.0%) | 40 (16.2%) |
| 75 Years and over | 0 (0.0%) | 3 (1.6%) |
| Total | 180 (9.0%) | 245 (10.7%) |
Income Above Poverty by Sex and Age in Parker
According to the poverty statistics in Parker, males aged under 5 years and females aged under 5 years are the age groups that are most secure financially, with 100.0% of males and 100.0% of females in these age groups living above the poverty line.
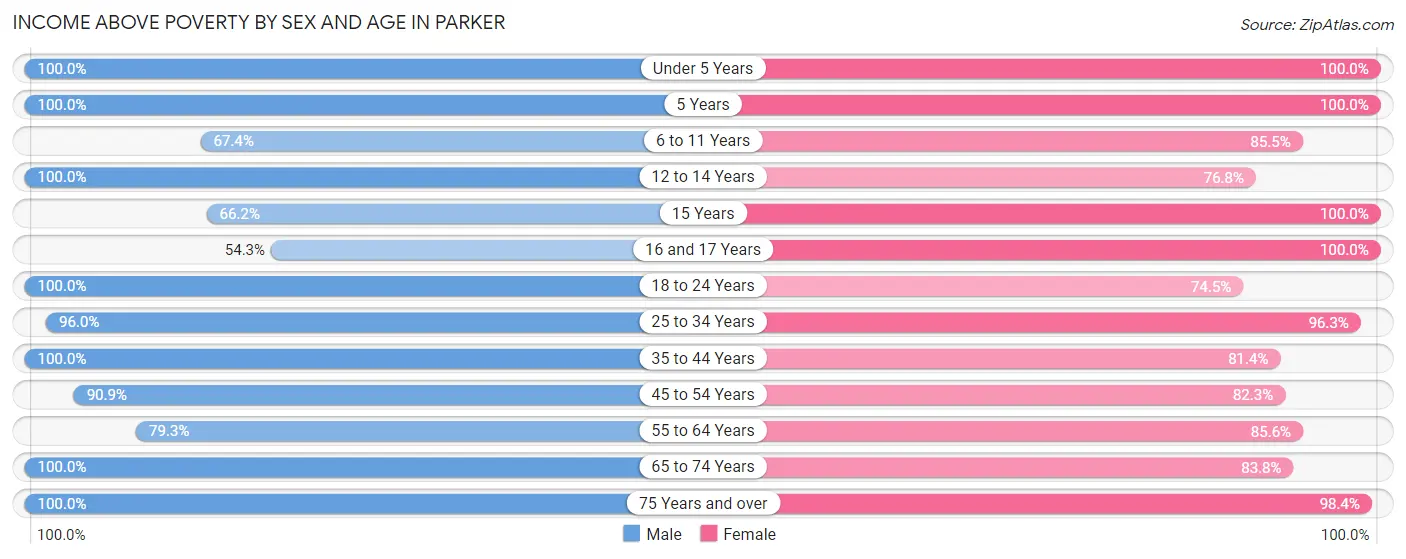
| Age Bracket | Male | Female |
| Under 5 Years | 30 (100.0%) | 221 (100.0%) |
| 5 Years | 10 (100.0%) | 60 (100.0%) |
| 6 to 11 Years | 33 (67.3%) | 136 (85.5%) |
| 12 to 14 Years | 33 (100.0%) | 73 (76.8%) |
| 15 Years | 49 (66.2%) | 9 (100.0%) |
| 16 and 17 Years | 38 (54.3%) | 135 (100.0%) |
| 18 to 24 Years | 97 (100.0%) | 73 (74.5%) |
| 25 to 34 Years | 433 (96.0%) | 339 (96.3%) |
| 35 to 44 Years | 287 (100.0%) | 131 (81.4%) |
| 45 to 54 Years | 289 (90.9%) | 204 (82.3%) |
| 55 to 64 Years | 230 (79.3%) | 267 (85.6%) |
| 65 to 74 Years | 176 (100.0%) | 207 (83.8%) |
| 75 Years and over | 125 (100.0%) | 180 (98.4%) |
| Total | 1,830 (91.0%) | 2,035 (89.2%) |
Income Below Poverty Among Married-Couple Families in Parker
The poverty statistics for married-couple families in Parker show that 4.3% or 36 of the total 836 families live below the poverty line. Families with 1 or 2 children have the highest poverty rate of 11.5%, comprising of 29 families. On the other hand, families with 3 or 4 children have the lowest poverty rate of 0.0%, which includes 0 families.
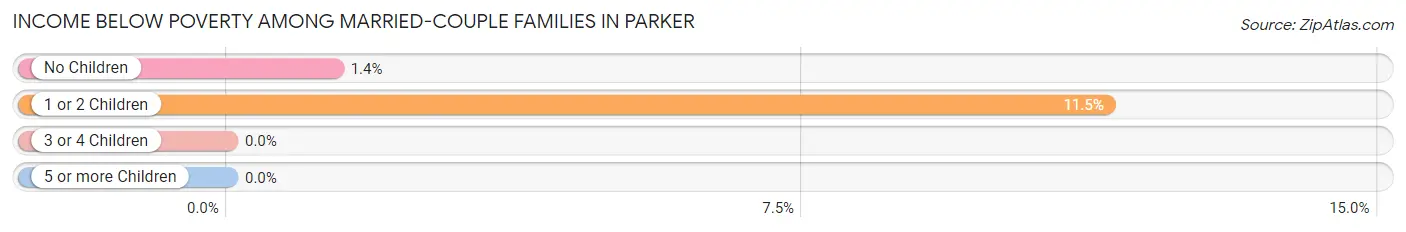
| Children | Above Poverty | Below Poverty |
| No Children | 502 (98.6%) | 7 (1.4%) |
| 1 or 2 Children | 224 (88.5%) | 29 (11.5%) |
| 3 or 4 Children | 74 (100.0%) | 0 (0.0%) |
| 5 or more Children | 0 (0.0%) | 0 (0.0%) |
| Total | 800 (95.7%) | 36 (4.3%) |
Income Below Poverty Among Single-Parent Households in Parker
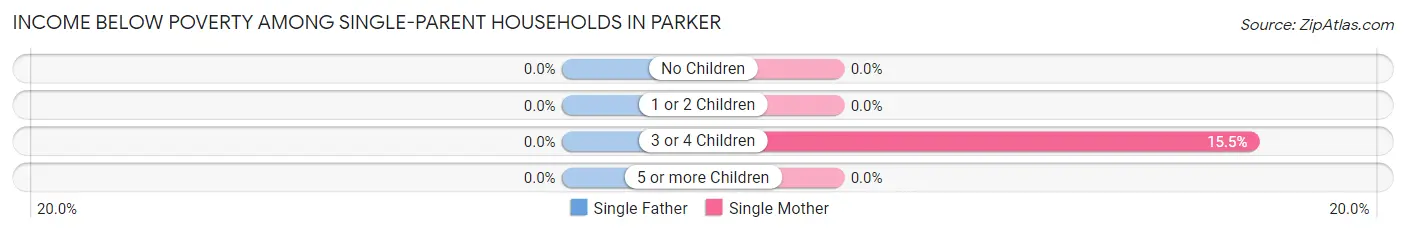
| Children | Single Father | Single Mother |
| No Children | 0 (0.0%) | 0 (0.0%) |
| 1 or 2 Children | 0 (0.0%) | 0 (0.0%) |
| 3 or 4 Children | 0 (0.0%) | 13 (15.5%) |
| 5 or more Children | 0 (0.0%) | 0 (0.0%) |
| Total | 0 (0.0%) | 13 (7.6%) |
Income Below Poverty Among Married-Couple vs Single-Parent Households in Parker
The poverty data for Parker shows that 36 of the married-couple family households (4.3%) and 13 of the single-parent households (4.9%) are living below the poverty level. Within the married-couple family households, those with 1 or 2 children have the highest poverty rate, with 29 households (11.5%) falling below the poverty line. Among the single-parent households, those with 3 or 4 children have the highest poverty rate, with 13 household (15.5%) living below poverty.
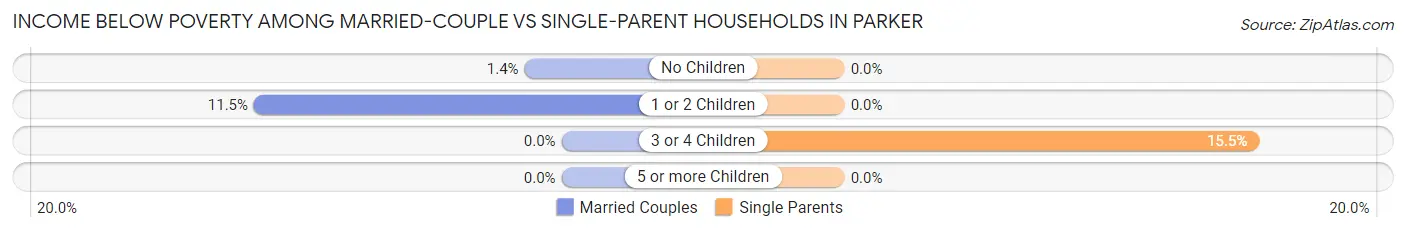
| Children | Married-Couple Families | Single-Parent Households |
| No Children | 7 (1.4%) | 0 (0.0%) |
| 1 or 2 Children | 29 (11.5%) | 0 (0.0%) |
| 3 or 4 Children | 0 (0.0%) | 13 (15.5%) |
| 5 or more Children | 0 (0.0%) | 0 (0.0%) |
| Total | 36 (4.3%) | 13 (4.9%) |
Race in Parker
The most populous races in Parker are White / Caucasian (3,277 | 76.0%), Black / African American (894 | 20.7%), and Hispanic or Latino (176 | 4.1%).
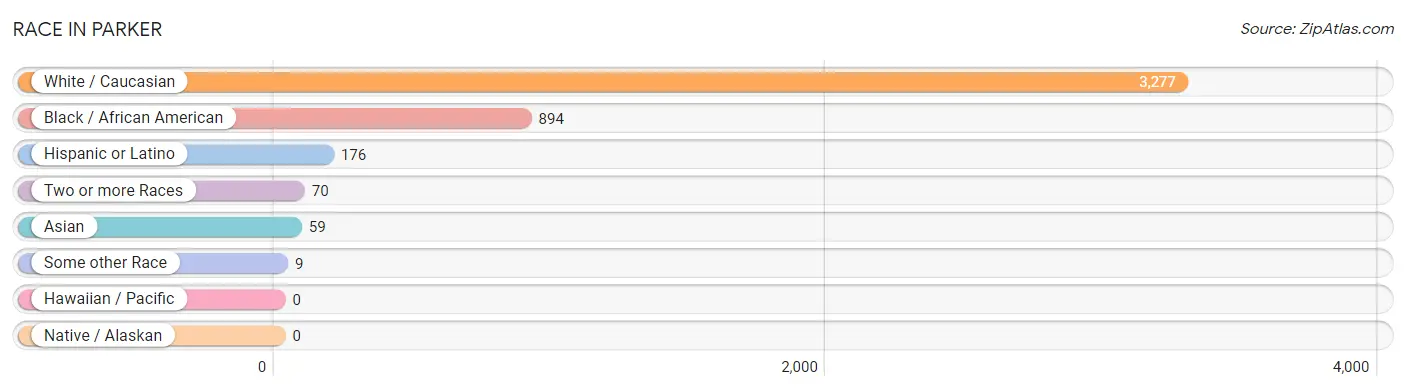
| Race | # Population | % Population |
| Asian | 59 | 1.4% |
| Black / African American | 894 | 20.7% |
| Hawaiian / Pacific | 0 | 0.0% |
| Hispanic or Latino | 176 | 4.1% |
| Native / Alaskan | 0 | 0.0% |
| White / Caucasian | 3,277 | 76.0% |
| Two or more Races | 70 | 1.6% |
| Some other Race | 9 | 0.2% |
| Total | 4,309 | 100.0% |
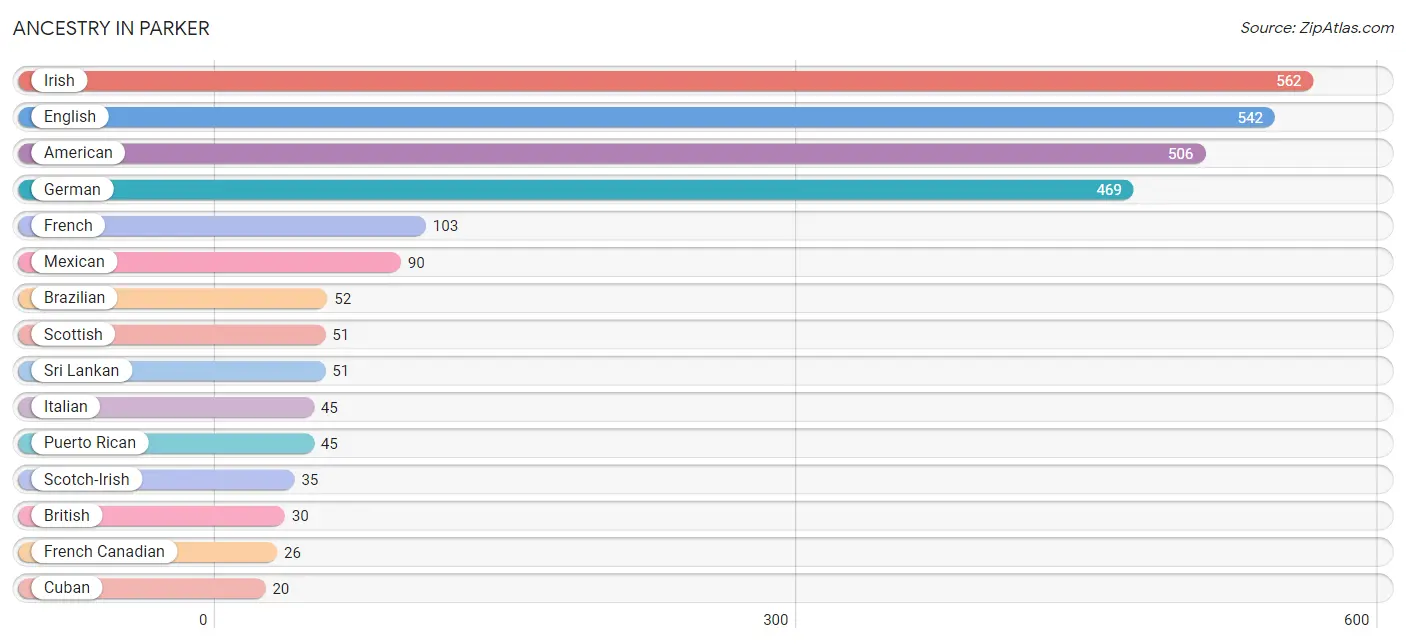
Ancestry in Parker
The most populous ancestries reported in Parker are Irish (562 | 13.0%), English (542 | 12.6%), American (506 | 11.7%), German (469 | 10.9%), and French (103 | 2.4%), together accounting for 50.6% of all Parker residents.
| Ancestry | # Population | % Population |
| American | 506 | 11.7% |
| Brazilian | 52 | 1.2% |
| British | 30 | 0.7% |
| Burmese | 8 | 0.2% |
| Canadian | 17 | 0.4% |
| Cherokee | 4 | 0.1% |
| Creek | 7 | 0.2% |
| Cuban | 20 | 0.5% |
| Dutch | 13 | 0.3% |
| English | 542 | 12.6% |
| French | 103 | 2.4% |
| French Canadian | 26 | 0.6% |
| German | 469 | 10.9% |
| Indian (Asian) | 4 | 0.1% |
| Irish | 562 | 13.0% |
| Italian | 45 | 1.0% |
| Jamaican | 13 | 0.3% |
| Mexican | 90 | 2.1% |
| Polish | 20 | 0.5% |
| Puerto Rican | 45 | 1.0% |
| Scotch-Irish | 35 | 0.8% |
| Scottish | 51 | 1.2% |
| South American | 11 | 0.3% |
| Spaniard | 10 | 0.2% |
| Sri Lankan | 51 | 1.2% |
| Swedish | 7 | 0.2% |
| Venezuelan | 11 | 0.3% |
| Welsh | 19 | 0.4% | View All 28 Rows |
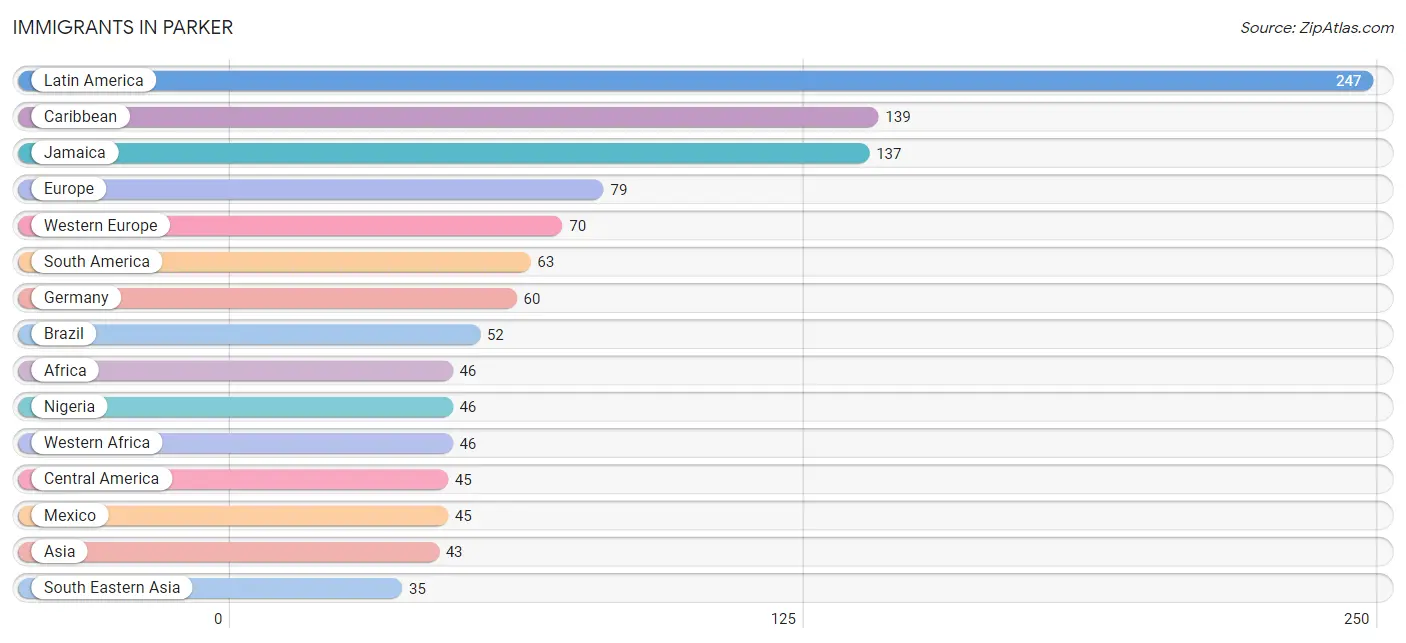
Immigrants in Parker
The most numerous immigrant groups reported in Parker came from Latin America (247 | 5.7%), Caribbean (139 | 3.2%), Jamaica (137 | 3.2%), Europe (79 | 1.8%), and Western Europe (70 | 1.6%), together accounting for 15.6% of all Parker residents.
| Immigration Origin | # Population | % Population |
| Africa | 46 | 1.1% |
| Asia | 43 | 1.0% |
| Brazil | 52 | 1.2% |
| Caribbean | 139 | 3.2% |
| Central America | 45 | 1.0% |
| Colombia | 11 | 0.3% |
| Cuba | 2 | 0.1% |
| Eastern Asia | 8 | 0.2% |
| England | 9 | 0.2% |
| Europe | 79 | 1.8% |
| France | 10 | 0.2% |
| Germany | 60 | 1.4% |
| Jamaica | 137 | 3.2% |
| Korea | 8 | 0.2% |
| Latin America | 247 | 5.7% |
| Mexico | 45 | 1.0% |
| Nigeria | 46 | 1.1% |
| Northern Europe | 9 | 0.2% |
| South America | 63 | 1.5% |
| South Eastern Asia | 35 | 0.8% |
| Vietnam | 35 | 0.8% |
| Western Africa | 46 | 1.1% |
| Western Europe | 70 | 1.6% | View All 23 Rows |
Sex and Age in Parker
Sex and Age in Parker
The most populous age groups in Parker are 35 to 39 Years (255 | 12.6%) for men and 60 to 64 Years (228 | 10.0%) for women.
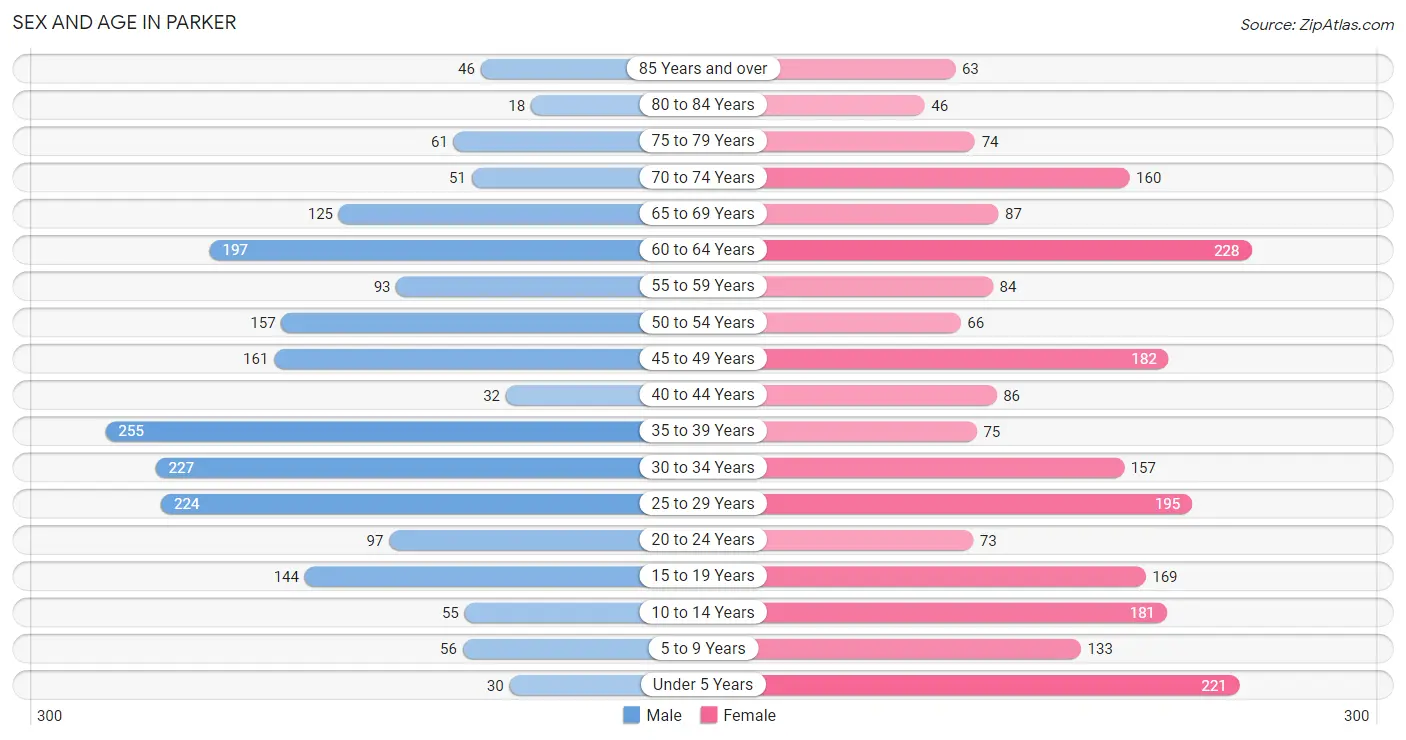
| Age Bracket | Male | Female |
| Under 5 Years | 30 (1.5%) | 221 (9.7%) |
| 5 to 9 Years | 56 (2.8%) | 133 (5.8%) |
| 10 to 14 Years | 55 (2.7%) | 181 (7.9%) |
| 15 to 19 Years | 144 (7.1%) | 169 (7.4%) |
| 20 to 24 Years | 97 (4.8%) | 73 (3.2%) |
| 25 to 29 Years | 224 (11.0%) | 195 (8.6%) |
| 30 to 34 Years | 227 (11.2%) | 157 (6.9%) |
| 35 to 39 Years | 255 (12.6%) | 75 (3.3%) |
| 40 to 44 Years | 32 (1.6%) | 86 (3.8%) |
| 45 to 49 Years | 161 (7.9%) | 182 (8.0%) |
| 50 to 54 Years | 157 (7.7%) | 66 (2.9%) |
| 55 to 59 Years | 93 (4.6%) | 84 (3.7%) |
| 60 to 64 Years | 197 (9.7%) | 228 (10.0%) |
| 65 to 69 Years | 125 (6.2%) | 87 (3.8%) |
| 70 to 74 Years | 51 (2.5%) | 160 (7.0%) |
| 75 to 79 Years | 61 (3.0%) | 74 (3.3%) |
| 80 to 84 Years | 18 (0.9%) | 46 (2.0%) |
| 85 Years and over | 46 (2.3%) | 63 (2.8%) |
| Total | 2,029 (100.0%) | 2,280 (100.0%) |
Families and Households in Parker
Median Family Size in Parker
The median family size in Parker is 3.00 persons per family, with single female/mother families (172 | 15.6%) accounting for the largest median family size of 3.79 persons per family. On the other hand, single male/father families (92 | 8.4%) represent the smallest median family size with 2.14 persons per family.
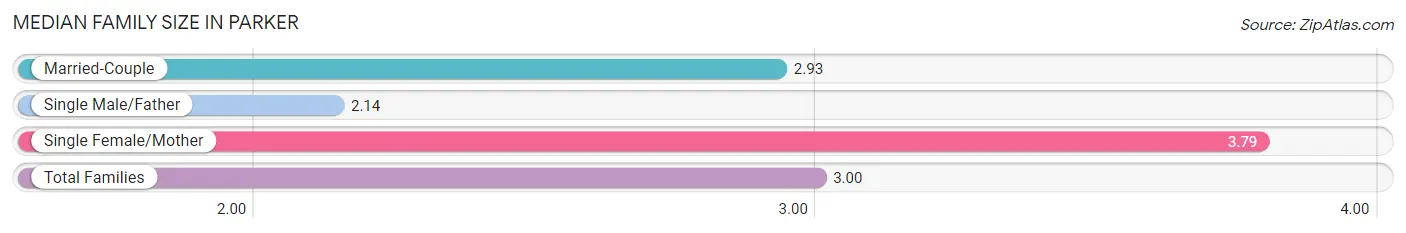
| Family Type | # Families | Family Size |
| Married-Couple | 836 (76.0%) | 2.93 |
| Single Male/Father | 92 (8.4%) | 2.14 |
| Single Female/Mother | 172 (15.6%) | 3.79 |
| Total Families | 1,100 (100.0%) | 3.00 |
Median Household Size in Parker
The median household size in Parker is 2.54 persons per household, with single female/mother households (172 | 10.2%) accounting for the largest median household size of 4.9 persons per household. non-family households (593 | 35.0%) represent the smallest median household size with 1.26 persons per household.
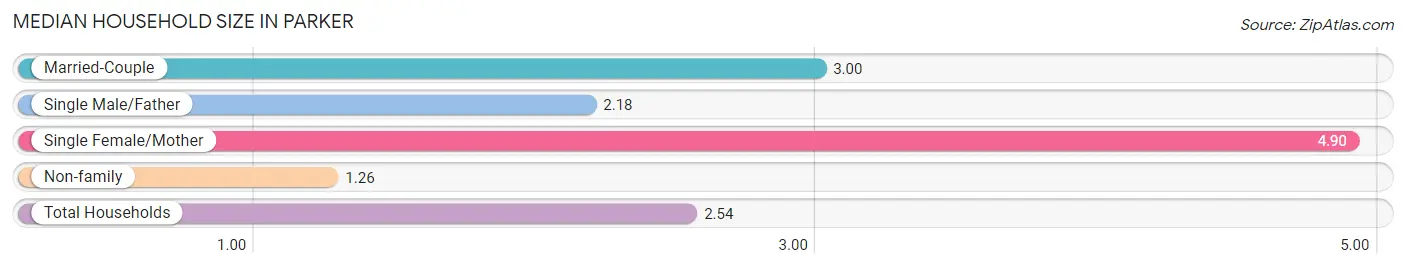
| Household Type | # Households | Household Size |
| Married-Couple | 836 (49.4%) | 3.00 |
| Single Male/Father | 92 (5.4%) | 2.18 |
| Single Female/Mother | 172 (10.2%) | 4.90 |
| Non-family | 593 (35.0%) | 1.26 |
| Total Households | 1,693 (100.0%) | 2.54 |
Household Size by Marriage Status in Parker
Out of a total of 1,693 households in Parker, 1,100 (65.0%) are family households, while 593 (35.0%) are nonfamily households. The most numerous type of family households are 2-person households, comprising 484, and the most common type of nonfamily households are 1-person households, comprising 534.
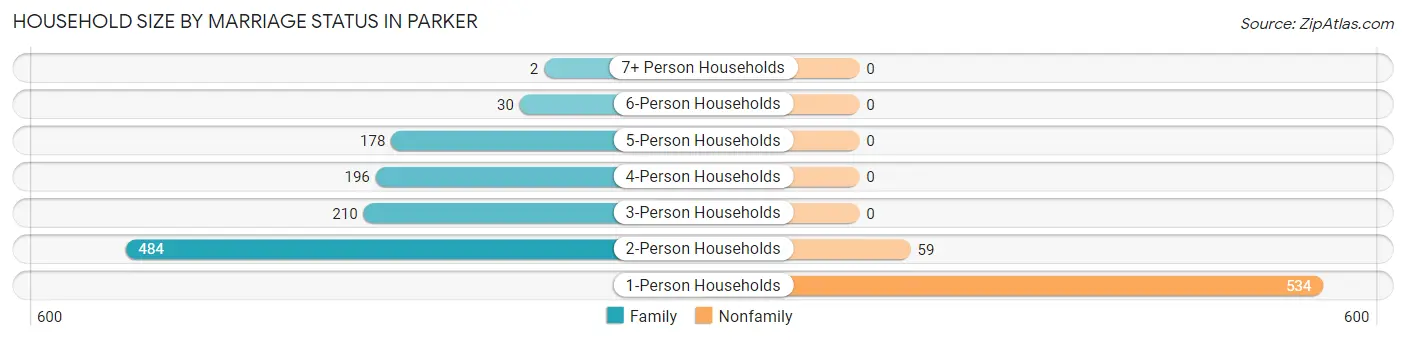
| Household Size | Family Households | Nonfamily Households |
| 1-Person Households | - | 534 (31.5%) |
| 2-Person Households | 484 (28.6%) | 59 (3.5%) |
| 3-Person Households | 210 (12.4%) | 0 (0.0%) |
| 4-Person Households | 196 (11.6%) | 0 (0.0%) |
| 5-Person Households | 178 (10.5%) | 0 (0.0%) |
| 6-Person Households | 30 (1.8%) | 0 (0.0%) |
| 7+ Person Households | 2 (0.1%) | 0 (0.0%) |
| Total | 1,100 (65.0%) | 593 (35.0%) |
Female Fertility in Parker
Fertility by Age in Parker
Average fertility rate in Parker is 133.0 births per 1,000 women. Women in the age bracket of 15 to 19 years have the highest fertility rate with 349.0 births per 1,000 women. Women in the age bracket of 20 to 34 years acount for 53.2% of all women with births.
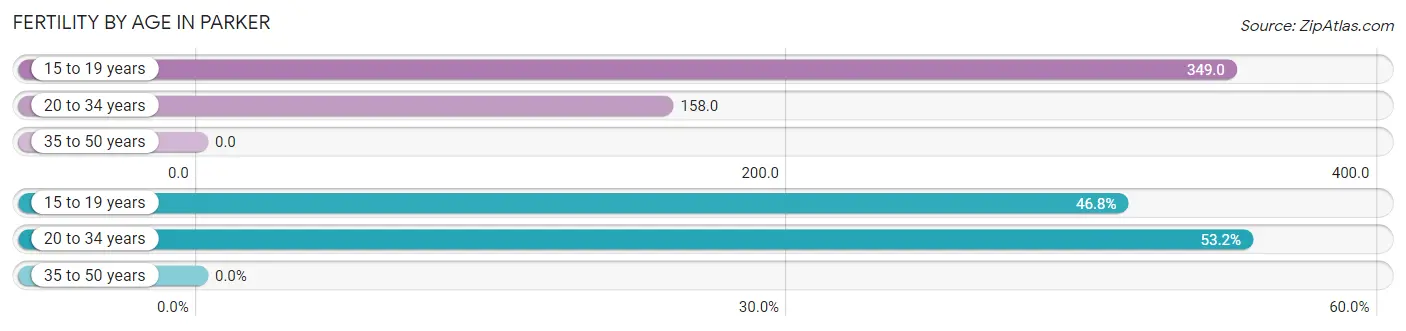
| Age Bracket | Women with Births | Births / 1,000 Women |
| 15 to 19 years | 59 (46.8%) | 349.0 |
| 20 to 34 years | 67 (53.2%) | 158.0 |
| 35 to 50 years | 0 (0.0%) | 0.0 |
| Total | 126 (100.0%) | 133.0 |
Fertility by Age by Marriage Status in Parker
53.2% of women with births (126) in Parker are married. The highest percentage of unmarried women with births falls into 15 to 19 years age bracket with 100.0% of them unmarried at the time of birth, while the lowest percentage of unmarried women with births belong to 20 to 34 years age bracket with 0.0% of them unmarried.
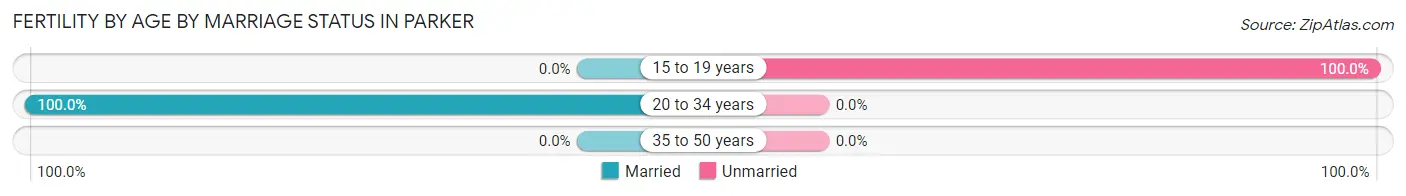
| Age Bracket | Married | Unmarried |
| 15 to 19 years | 0 (0.0%) | 59 (100.0%) |
| 20 to 34 years | 67 (100.0%) | 0 (0.0%) |
| 35 to 50 years | 0 (0.0%) | 0 (0.0%) |
| Total | 67 (53.2%) | 59 (46.8%) |
Fertility by Education in Parker
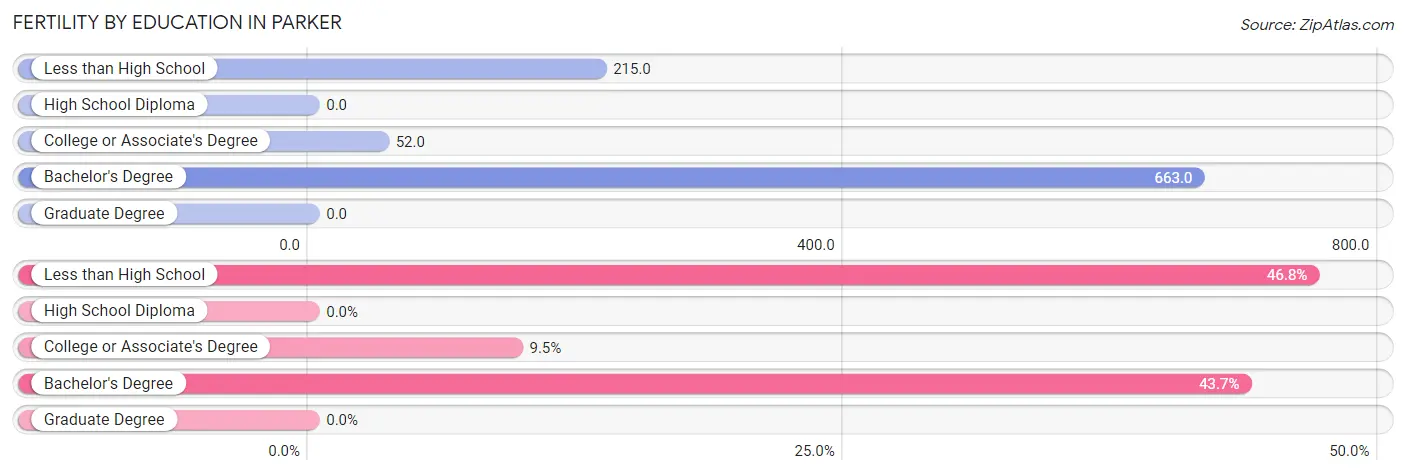
| Educational Attainment | Women with Births | Births / 1,000 Women |
| Less than High School | 59 (46.8%) | 215.0 |
| High School Diploma | 0 (0.0%) | 0.0 |
| College or Associate's Degree | 12 (9.5%) | 52.0 |
| Bachelor's Degree | 55 (43.6%) | 663.0 |
| Graduate Degree | 0 (0.0%) | 0.0 |
| Total | 126 (100.0%) | 133.0 |
Fertility by Education by Marriage Status in Parker
46.8% of women with births in Parker are unmarried. Women with the educational attainment of college or associate's degree are most likely to be married with 100.0% of them married at childbirth, while women with the educational attainment of less than high school are least likely to be married with 100.0% of them unmarried at childbirth.
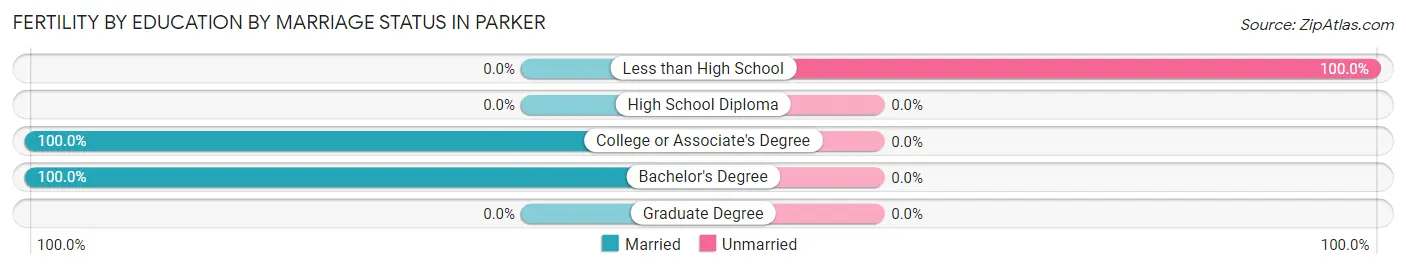
| Educational Attainment | Married | Unmarried |
| Less than High School | 0 (0.0%) | 59 (100.0%) |
| High School Diploma | 0 (0.0%) | 0 (0.0%) |
| College or Associate's Degree | 12 (100.0%) | 0 (0.0%) |
| Bachelor's Degree | 55 (100.0%) | 0 (0.0%) |
| Graduate Degree | 0 (0.0%) | 0 (0.0%) |
| Total | 67 (53.2%) | 59 (46.8%) |
Employment Characteristics in Parker
Employment by Class of Employer in Parker
Among the 2,052 employed individuals in Parker, private company employees (1,313 | 64.0%), local government employees (184 | 9.0%), and federal government employees (148 | 7.2%) make up the most common classes of employment.
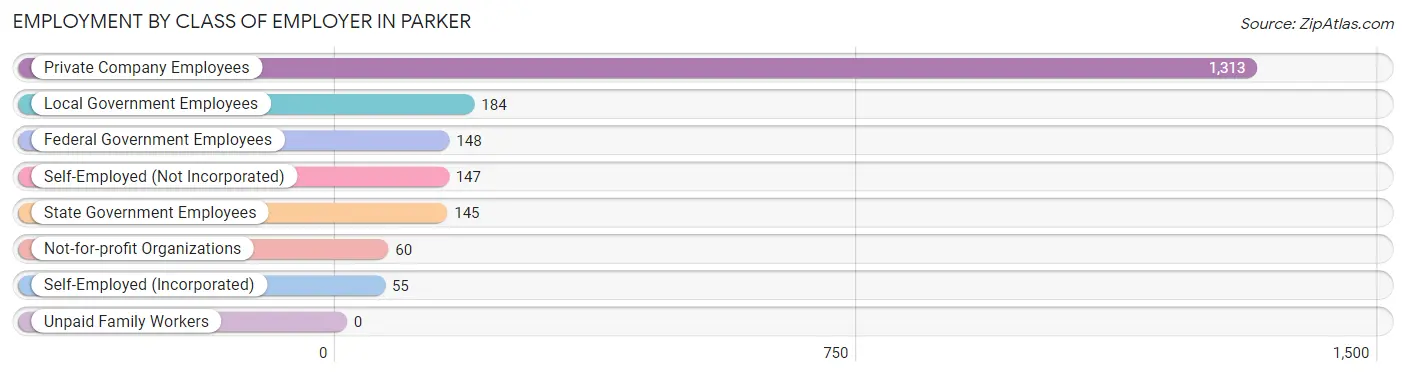
| Employer Class | # Employees | % Employees |
| Private Company Employees | 1,313 | 64.0% |
| Self-Employed (Incorporated) | 55 | 2.7% |
| Self-Employed (Not Incorporated) | 147 | 7.2% |
| Not-for-profit Organizations | 60 | 2.9% |
| Local Government Employees | 184 | 9.0% |
| State Government Employees | 145 | 7.1% |
| Federal Government Employees | 148 | 7.2% |
| Unpaid Family Workers | 0 | 0.0% |
| Total | 2,052 | 100.0% |
Employment Status by Age in Parker
According to the labor force statistics for Parker, out of the total population over 16 years of age (3,550), 62.6% or 2,222 individuals are in the labor force, with 5.9% or 131 of them unemployed. The age group with the highest labor force participation rate is 35 to 44 years, with 91.3% or 409 individuals in the labor force. Within the labor force, the 60 to 64 years age range has the highest percentage of unemployed individuals, with 18.9% or 43 of them being unemployed.
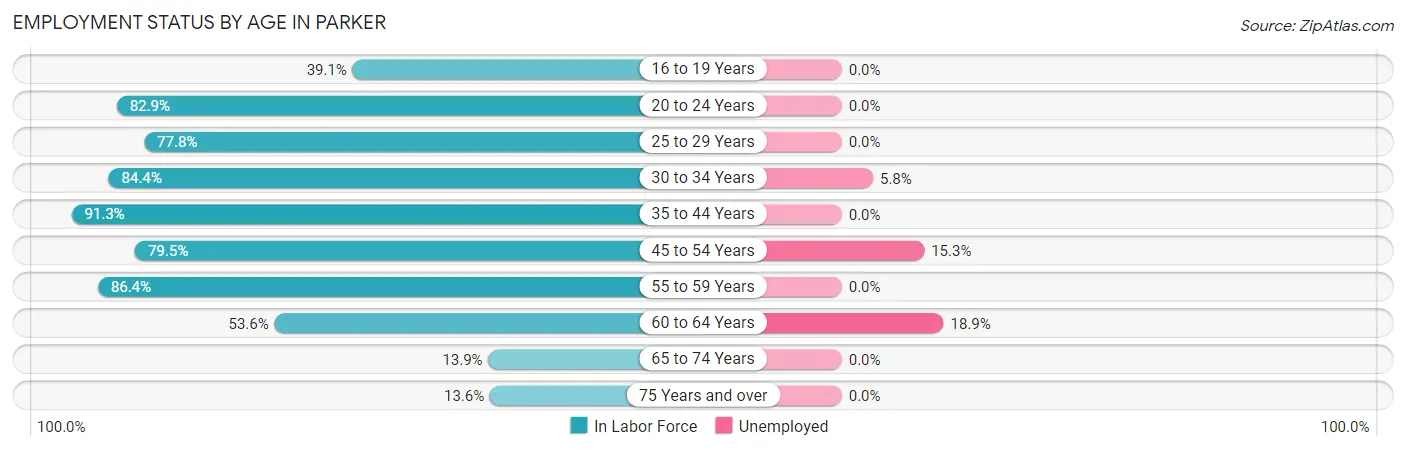
| Age Bracket | In Labor Force | Unemployed |
| 16 to 19 Years | 90 (39.1%) | 0 (0.0%) |
| 20 to 24 Years | 141 (82.9%) | 0 (0.0%) |
| 25 to 29 Years | 326 (77.8%) | 0 (0.0%) |
| 30 to 34 Years | 324 (84.4%) | 19 (5.8%) |
| 35 to 44 Years | 409 (91.3%) | 0 (0.0%) |
| 45 to 54 Years | 450 (79.5%) | 69 (15.3%) |
| 55 to 59 Years | 153 (86.4%) | 0 (0.0%) |
| 60 to 64 Years | 228 (53.6%) | 43 (18.9%) |
| 65 to 74 Years | 59 (13.9%) | 0 (0.0%) |
| 75 Years and over | 42 (13.6%) | 0 (0.0%) |
| Total | 2,222 (62.6%) | 131 (5.9%) |
Employment Status by Educational Attainment in Parker
According to labor force statistics for Parker, 78.1% of individuals (1,889) out of the total population between 25 and 64 years of age (2,419) are in the labor force, with 6.9% or 130 of them being unemployed. The group with the highest labor force participation rate are those with the educational attainment of bachelor's degree or higher, with 97.1% or 336 individuals in the labor force. Within the labor force, individuals with high school diploma education have the highest percentage of unemployment, with 13.0% or 87 of them being unemployed.
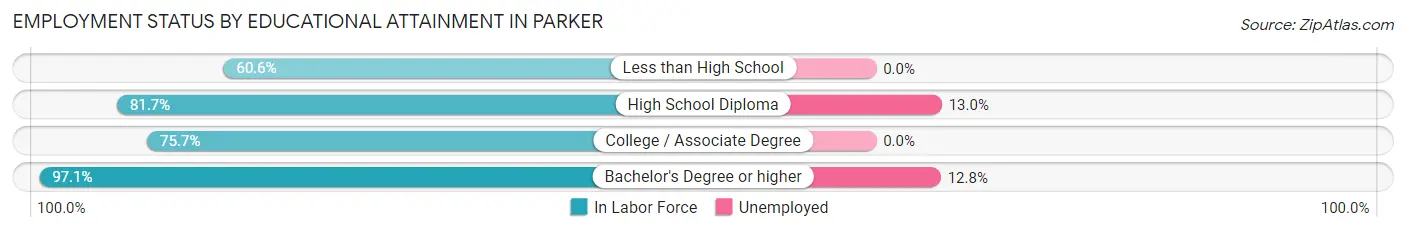
| Educational Attainment | In Labor Force | Unemployed |
| Less than High School | 258 (60.6%) | 0 (0.0%) |
| High School Diploma | 669 (81.7%) | 106 (13.0%) |
| College / Associate Degree | 627 (75.7%) | 0 (0.0%) |
| Bachelor's Degree or higher | 336 (97.1%) | 44 (12.8%) |
| Total | 1,889 (78.1%) | 167 (6.9%) |
Employment Occupations by Sex in Parker
Management, Business, Science and Arts Occupations
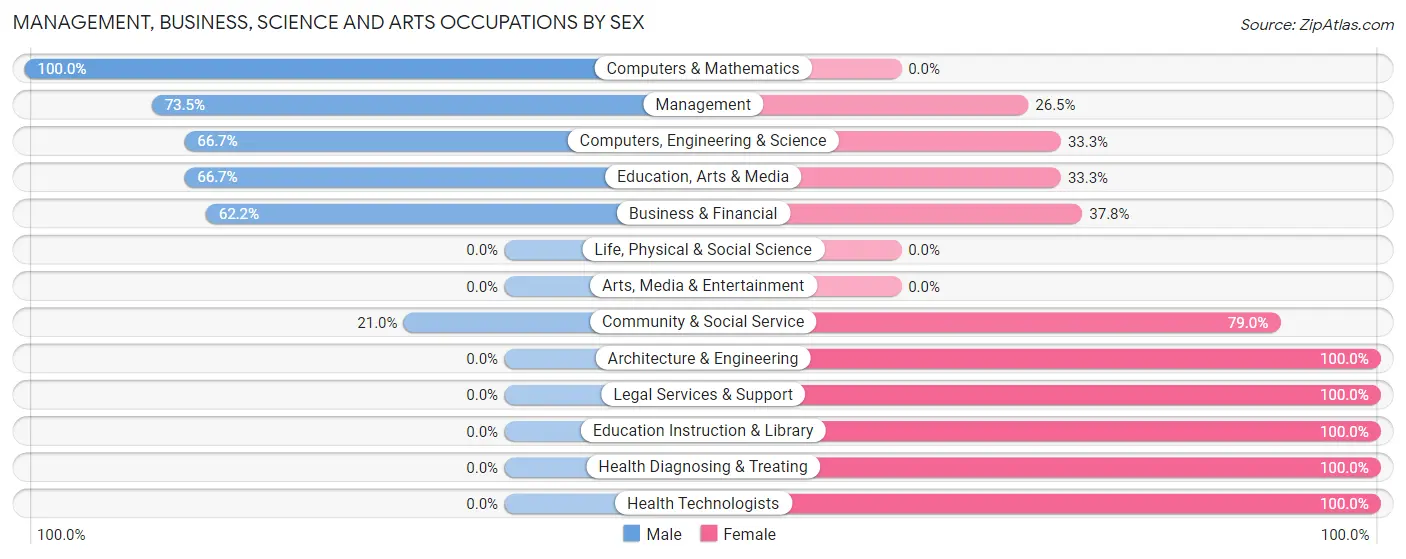
The most common Management, Business, Science and Arts occupations in Parker are Community & Social Service (162 | 7.8%), Management (147 | 7.1%), Education Instruction & Library (98 | 4.7%), Business & Financial (82 | 4.0%), and Computers, Engineering & Science (72 | 3.5%).
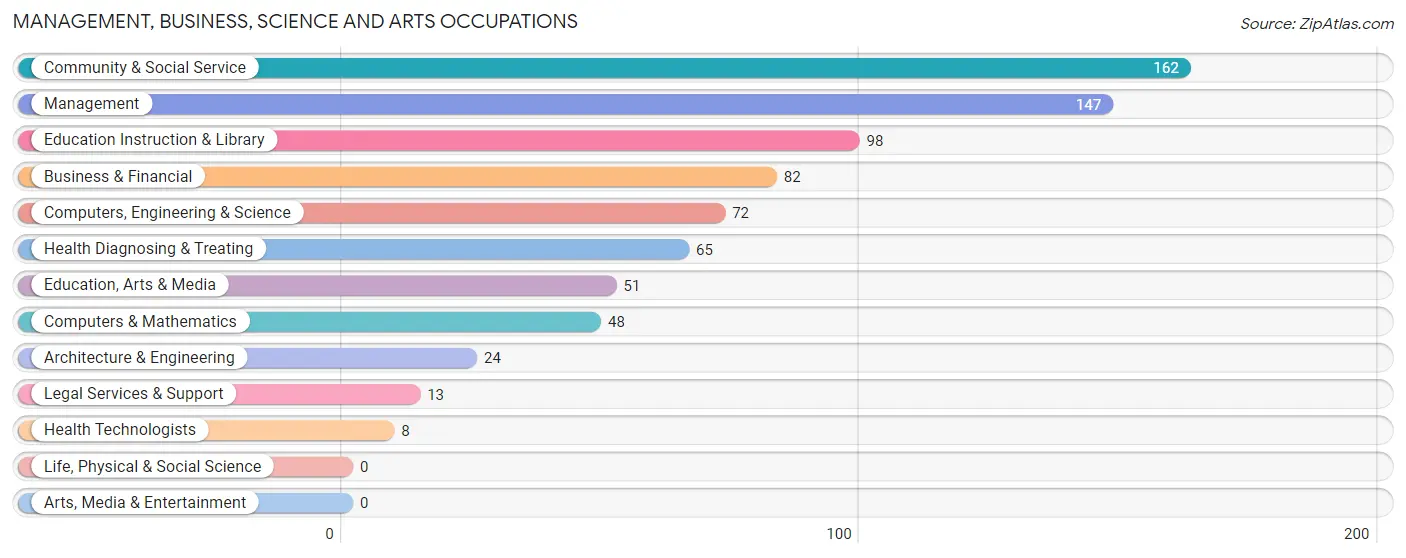
Management, Business, Science and Arts Occupations by Sex
Within the Management, Business, Science and Arts occupations in Parker, the most male-oriented occupations are Computers & Mathematics (100.0%), Management (73.5%), and Computers, Engineering & Science (66.7%), while the most female-oriented occupations are Architecture & Engineering (100.0%), Legal Services & Support (100.0%), and Education Instruction & Library (100.0%).
| Occupation | Male | Female |
| Management | 108 (73.5%) | 39 (26.5%) |
| Business & Financial | 51 (62.2%) | 31 (37.8%) |
| Computers, Engineering & Science | 48 (66.7%) | 24 (33.3%) |
| Computers & Mathematics | 48 (100.0%) | 0 (0.0%) |
| Architecture & Engineering | 0 (0.0%) | 24 (100.0%) |
| Life, Physical & Social Science | 0 (0.0%) | 0 (0.0%) |
| Community & Social Service | 34 (21.0%) | 128 (79.0%) |
| Education, Arts & Media | 34 (66.7%) | 17 (33.3%) |
| Legal Services & Support | 0 (0.0%) | 13 (100.0%) |
| Education Instruction & Library | 0 (0.0%) | 98 (100.0%) |
| Arts, Media & Entertainment | 0 (0.0%) | 0 (0.0%) |
| Health Diagnosing & Treating | 0 (0.0%) | 65 (100.0%) |
| Health Technologists | 0 (0.0%) | 8 (100.0%) |
| Total (Category) | 241 (45.6%) | 287 (54.4%) |
| Total (Overall) | 1,210 (58.6%) | 856 (41.4%) |
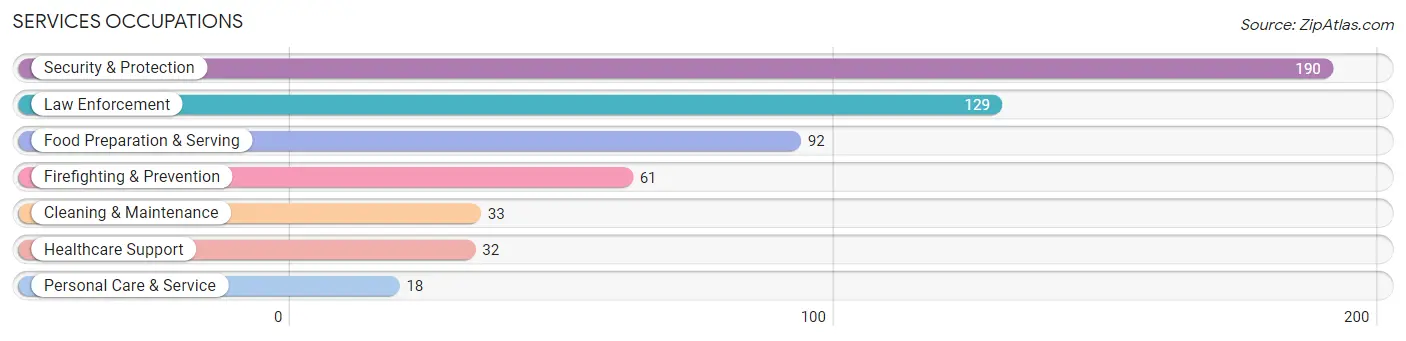
Services Occupations
The most common Services occupations in Parker are Security & Protection (190 | 9.2%), Law Enforcement (129 | 6.2%), Food Preparation & Serving (92 | 4.4%), Firefighting & Prevention (61 | 2.9%), and Cleaning & Maintenance (33 | 1.6%).
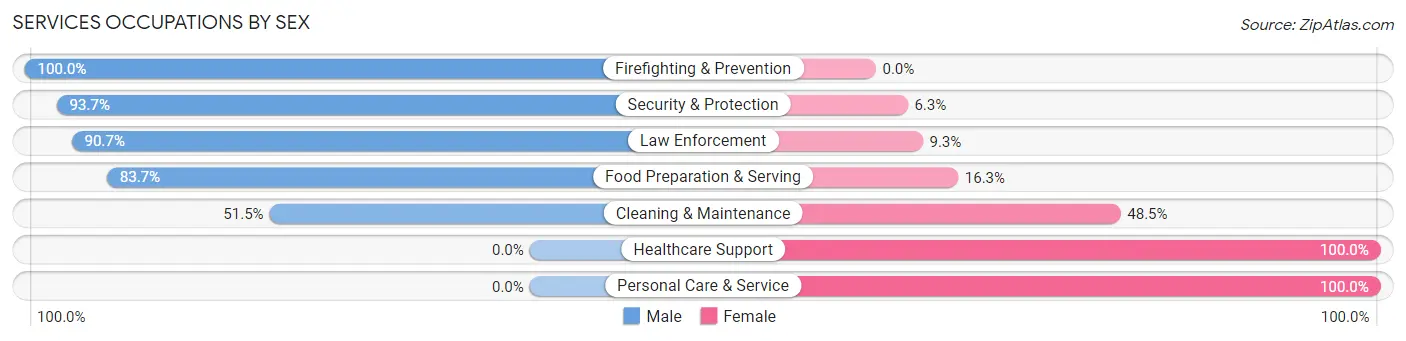
Services Occupations by Sex
Within the Services occupations in Parker, the most male-oriented occupations are Firefighting & Prevention (100.0%), Security & Protection (93.7%), and Law Enforcement (90.7%), while the most female-oriented occupations are Healthcare Support (100.0%), Personal Care & Service (100.0%), and Cleaning & Maintenance (48.5%).
| Occupation | Male | Female |
| Healthcare Support | 0 (0.0%) | 32 (100.0%) |
| Security & Protection | 178 (93.7%) | 12 (6.3%) |
| Firefighting & Prevention | 61 (100.0%) | 0 (0.0%) |
| Law Enforcement | 117 (90.7%) | 12 (9.3%) |
| Food Preparation & Serving | 77 (83.7%) | 15 (16.3%) |
| Cleaning & Maintenance | 17 (51.5%) | 16 (48.5%) |
| Personal Care & Service | 0 (0.0%) | 18 (100.0%) |
| Total (Category) | 272 (74.5%) | 93 (25.5%) |
| Total (Overall) | 1,210 (58.6%) | 856 (41.4%) |
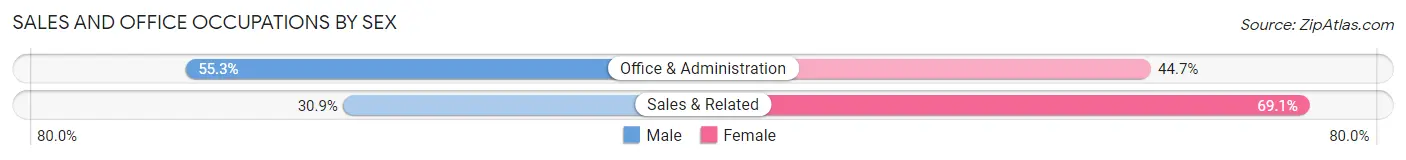
Sales and Office Occupations
The most common Sales and Office occupations in Parker are Sales & Related (440 | 21.3%), and Office & Administration (208 | 10.1%).

Sales and Office Occupations by Sex
| Occupation | Male | Female |
| Sales & Related | 136 (30.9%) | 304 (69.1%) |
| Office & Administration | 115 (55.3%) | 93 (44.7%) |
| Total (Category) | 251 (38.7%) | 397 (61.3%) |
| Total (Overall) | 1,210 (58.6%) | 856 (41.4%) |
Natural Resources, Construction and Maintenance Occupations
The most common Natural Resources, Construction and Maintenance occupations in Parker are Construction & Extraction (82 | 4.0%), and Installation, Maintenance & Repair (20 | 1.0%).

Natural Resources, Construction and Maintenance Occupations by Sex
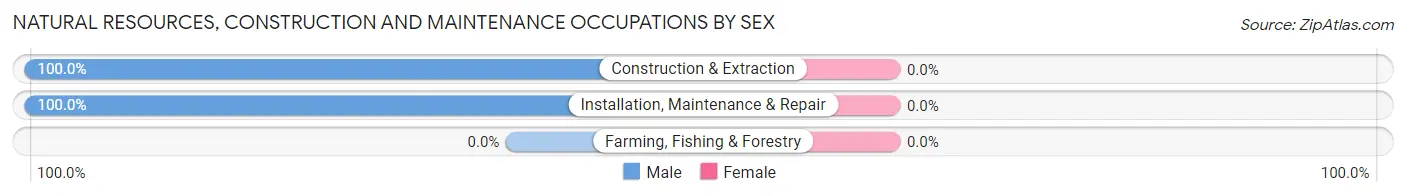
| Occupation | Male | Female |
| Farming, Fishing & Forestry | 0 (0.0%) | 0 (0.0%) |
| Construction & Extraction | 82 (100.0%) | 0 (0.0%) |
| Installation, Maintenance & Repair | 20 (100.0%) | 0 (0.0%) |
| Total (Category) | 102 (100.0%) | 0 (0.0%) |
| Total (Overall) | 1,210 (58.6%) | 856 (41.4%) |
Production, Transportation and Moving Occupations
The most common Production, Transportation and Moving occupations in Parker are Production (249 | 12.0%), Transportation (90 | 4.4%), and Material Moving (84 | 4.1%).
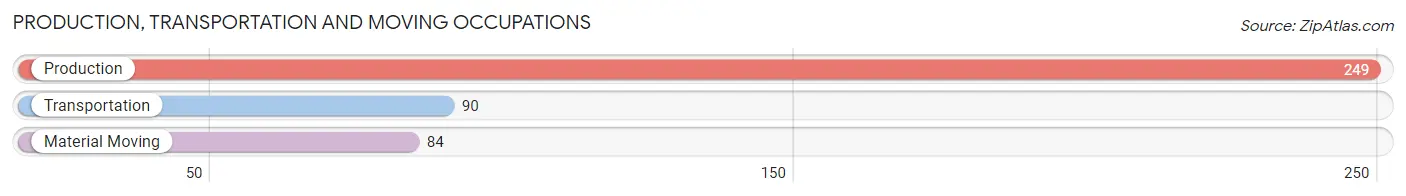
Production, Transportation and Moving Occupations by Sex
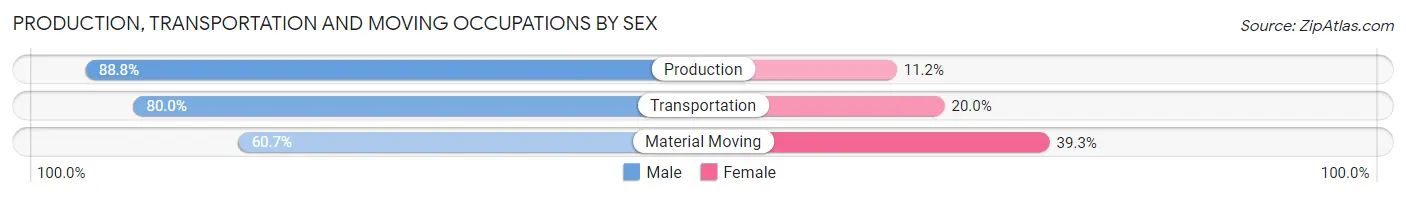
| Occupation | Male | Female |
| Production | 221 (88.8%) | 28 (11.2%) |
| Transportation | 72 (80.0%) | 18 (20.0%) |
| Material Moving | 51 (60.7%) | 33 (39.3%) |
| Total (Category) | 344 (81.3%) | 79 (18.7%) |
| Total (Overall) | 1,210 (58.6%) | 856 (41.4%) |
Employment Industries by Sex in Parker
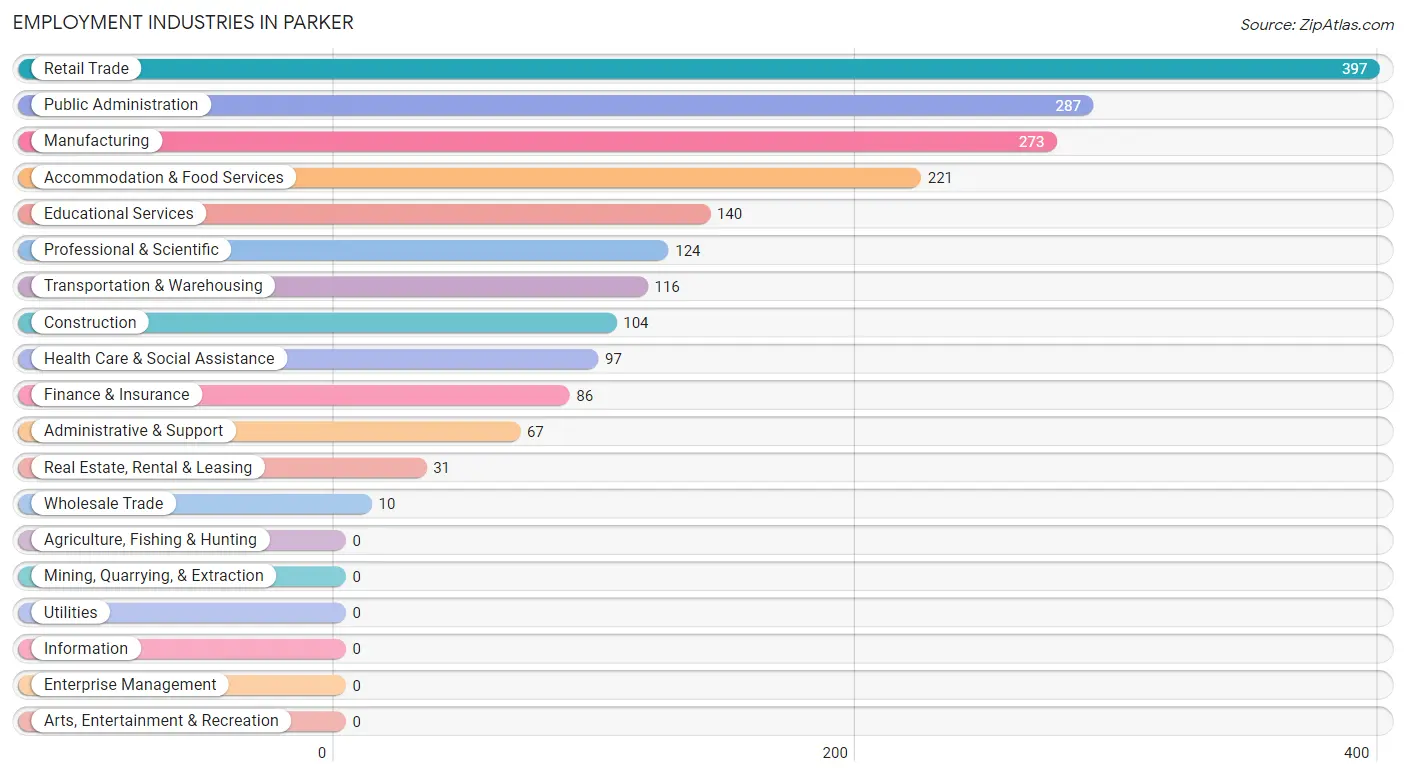
Employment Industries in Parker
The major employment industries in Parker include Retail Trade (397 | 19.2%), Public Administration (287 | 13.9%), Manufacturing (273 | 13.2%), Accommodation & Food Services (221 | 10.7%), and Educational Services (140 | 6.8%).
Employment Industries by Sex in Parker
The Parker industries that see more men than women are Wholesale Trade (100.0%), Transportation & Warehousing (100.0%), and Real Estate, Rental & Leasing (100.0%), whereas the industries that tend to have a higher number of women are Educational Services (100.0%), Health Care & Social Assistance (100.0%), and Retail Trade (55.7%).
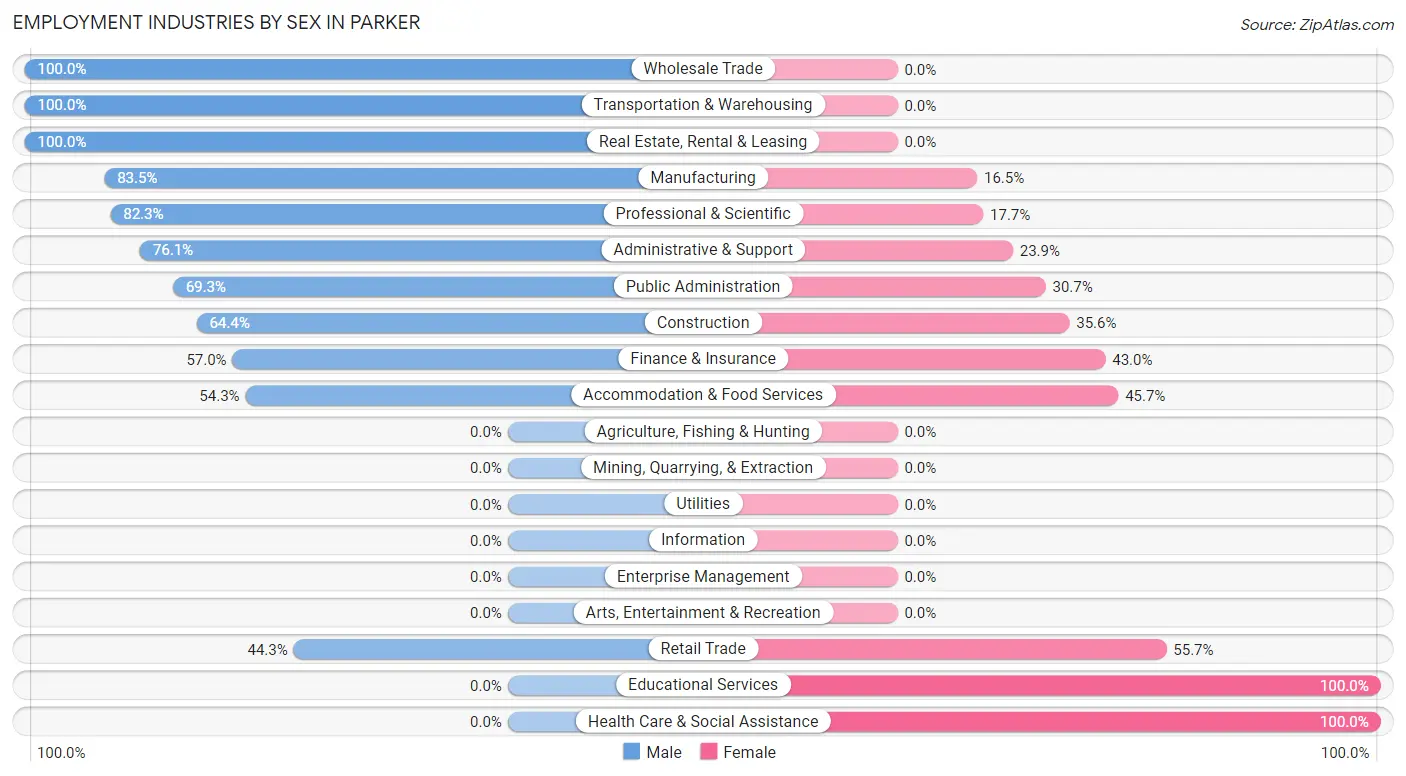
| Industry | Male | Female |
| Agriculture, Fishing & Hunting | 0 (0.0%) | 0 (0.0%) |
| Mining, Quarrying, & Extraction | 0 (0.0%) | 0 (0.0%) |
| Construction | 67 (64.4%) | 37 (35.6%) |
| Manufacturing | 228 (83.5%) | 45 (16.5%) |
| Wholesale Trade | 10 (100.0%) | 0 (0.0%) |
| Retail Trade | 176 (44.3%) | 221 (55.7%) |
| Transportation & Warehousing | 116 (100.0%) | 0 (0.0%) |
| Utilities | 0 (0.0%) | 0 (0.0%) |
| Information | 0 (0.0%) | 0 (0.0%) |
| Finance & Insurance | 49 (57.0%) | 37 (43.0%) |
| Real Estate, Rental & Leasing | 31 (100.0%) | 0 (0.0%) |
| Professional & Scientific | 102 (82.3%) | 22 (17.7%) |
| Enterprise Management | 0 (0.0%) | 0 (0.0%) |
| Administrative & Support | 51 (76.1%) | 16 (23.9%) |
| Educational Services | 0 (0.0%) | 140 (100.0%) |
| Health Care & Social Assistance | 0 (0.0%) | 97 (100.0%) |
| Arts, Entertainment & Recreation | 0 (0.0%) | 0 (0.0%) |
| Accommodation & Food Services | 120 (54.3%) | 101 (45.7%) |
| Public Administration | 199 (69.3%) | 88 (30.7%) |
| Total | 1,210 (58.6%) | 856 (41.4%) |
Education in Parker
School Enrollment in Parker
The most common levels of schooling among the 890 students in Parker are high school (299 | 33.6%), middle school (255 | 28.6%), and college / undergraduate (121 | 13.6%).
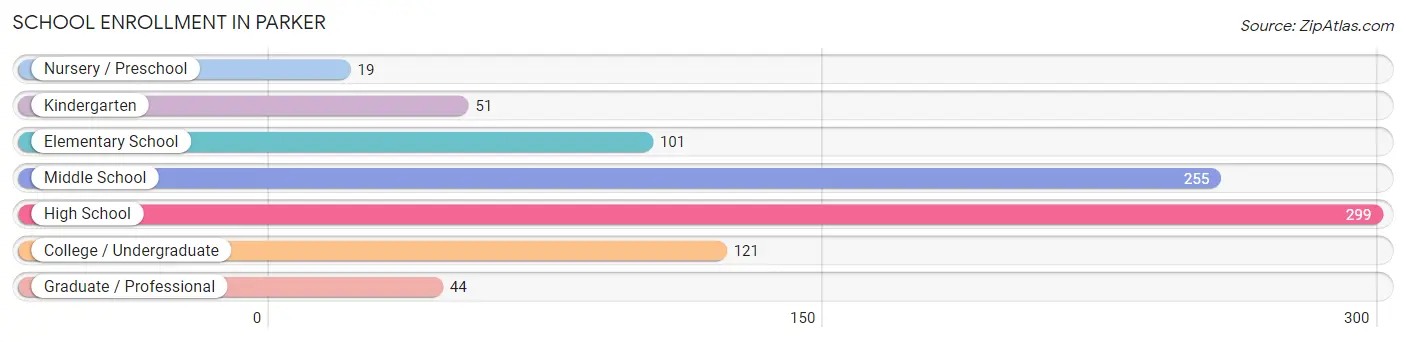
| School Level | # Students | % Students |
| Nursery / Preschool | 19 | 2.1% |
| Kindergarten | 51 | 5.7% |
| Elementary School | 101 | 11.4% |
| Middle School | 255 | 28.6% |
| High School | 299 | 33.6% |
| College / Undergraduate | 121 | 13.6% |
| Graduate / Professional | 44 | 4.9% |
| Total | 890 | 100.0% |
School Enrollment by Age by Funding Source in Parker
Out of a total of 890 students who are enrolled in schools in Parker, 138 (15.5%) attend a private institution, while the remaining 752 (84.5%) are enrolled in public schools. The age group of 18 to 19 year olds has the highest likelihood of being enrolled in private schools, with 25 (100.0% in the age bracket) enrolled. Conversely, the age group of 5 to 9 year old has the lowest likelihood of being enrolled in a private school, with 152 (100.0% in the age bracket) attending a public institution.
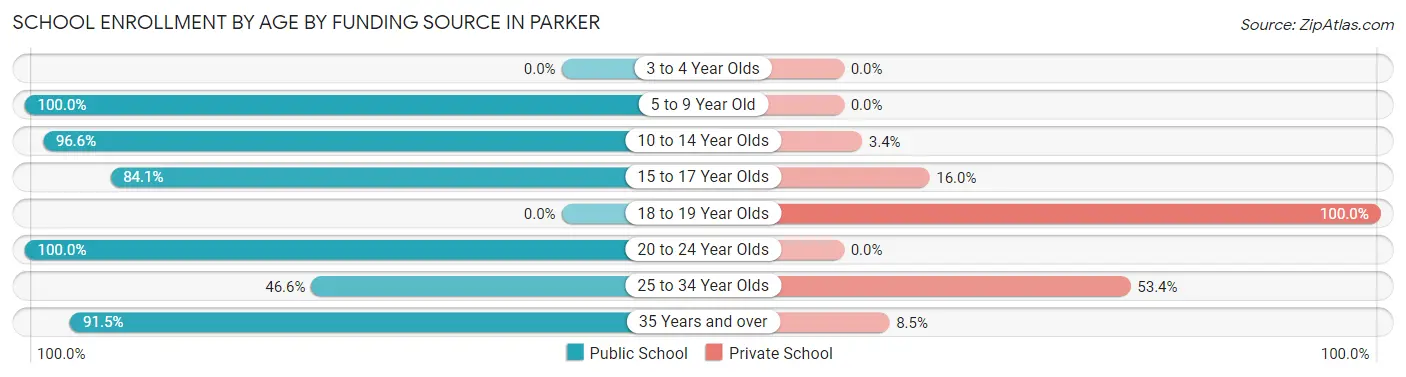
| Age Bracket | Public School | Private School |
| 3 to 4 Year Olds | 0 (0.0%) | 0 (0.0%) |
| 5 to 9 Year Old | 152 (100.0%) | 0 (0.0%) |
| 10 to 14 Year Olds | 228 (96.6%) | 8 (3.4%) |
| 15 to 17 Year Olds | 216 (84.1%) | 41 (16.0%) |
| 18 to 19 Year Olds | 0 (0.0%) | 25 (100.0%) |
| 20 to 24 Year Olds | 11 (100.0%) | 0 (0.0%) |
| 25 to 34 Year Olds | 48 (46.6%) | 55 (53.4%) |
| 35 Years and over | 97 (91.5%) | 9 (8.5%) |
| Total | 752 (84.5%) | 138 (15.5%) |
Educational Attainment by Field of Study in Parker
Arts & humanities (137 | 24.3%), computers & mathematics (108 | 19.2%), business (103 | 18.3%), education (70 | 12.4%), and multidisciplinary studies (25 | 4.4%) are the most common fields of study among 563 individuals in Parker who have obtained a bachelor's degree or higher.
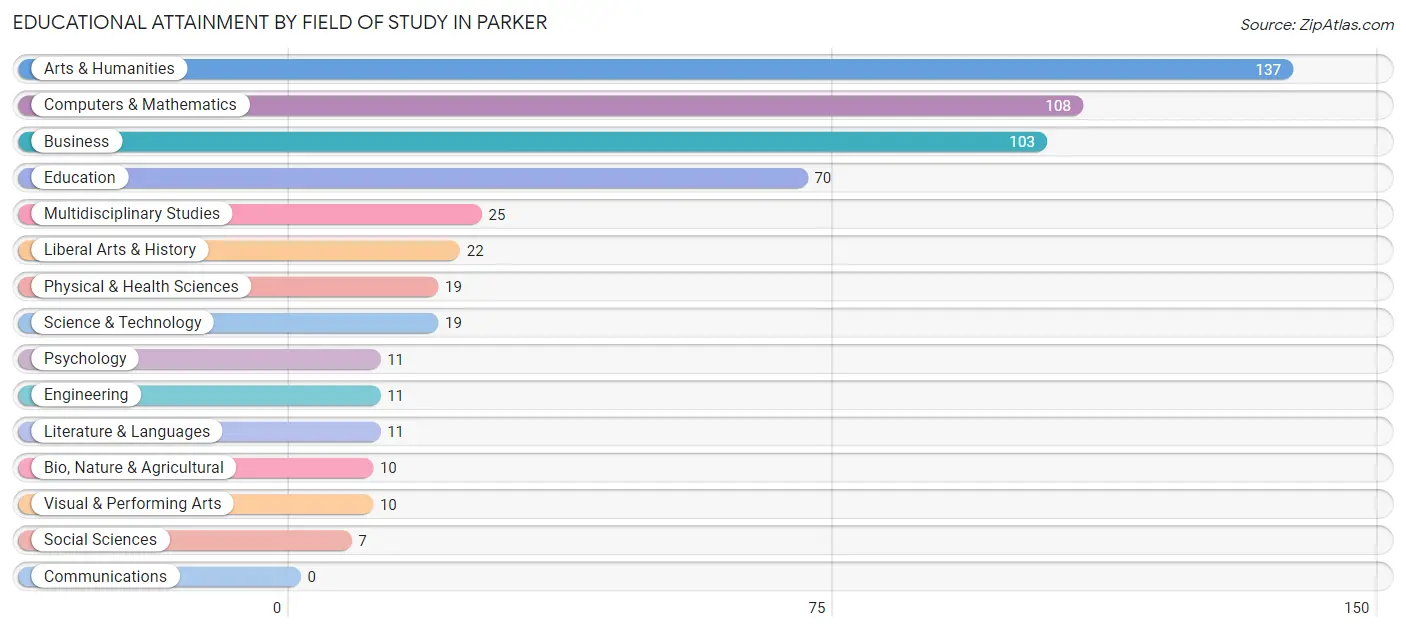
| Field of Study | # Graduates | % Graduates |
| Computers & Mathematics | 108 | 19.2% |
| Bio, Nature & Agricultural | 10 | 1.8% |
| Physical & Health Sciences | 19 | 3.4% |
| Psychology | 11 | 1.9% |
| Social Sciences | 7 | 1.2% |
| Engineering | 11 | 1.9% |
| Multidisciplinary Studies | 25 | 4.4% |
| Science & Technology | 19 | 3.4% |
| Business | 103 | 18.3% |
| Education | 70 | 12.4% |
| Literature & Languages | 11 | 1.9% |
| Liberal Arts & History | 22 | 3.9% |
| Visual & Performing Arts | 10 | 1.8% |
| Communications | 0 | 0.0% |
| Arts & Humanities | 137 | 24.3% |
| Total | 563 | 100.0% |
Transportation & Commute in Parker
Vehicle Availability by Sex in Parker
The most prevalent vehicle ownership categories in Parker are males with 2 vehicles (832, accounting for 67.3%) and females with 2 vehicles (424, making up 102.1%).
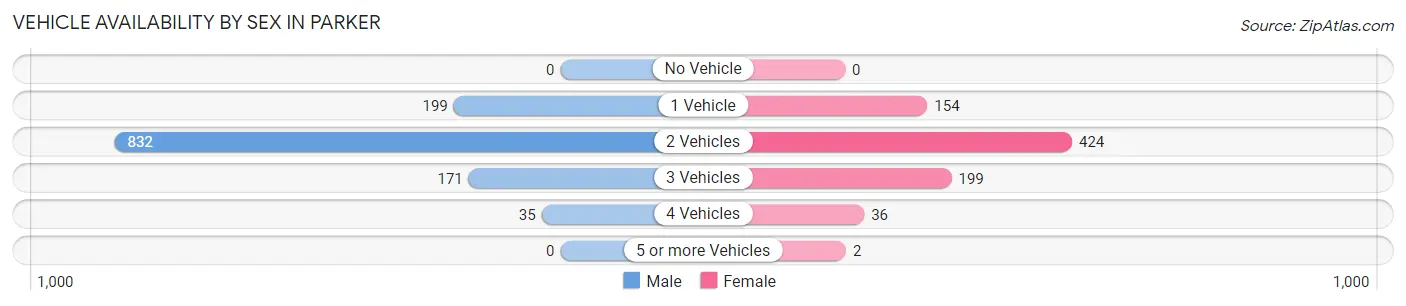
| Vehicles Available | Male | Female |
| No Vehicle | 0 (0.0%) | 0 (0.0%) |
| 1 Vehicle | 199 (16.1%) | 154 (18.9%) |
| 2 Vehicles | 832 (67.3%) | 424 (52.0%) |
| 3 Vehicles | 171 (13.8%) | 199 (24.4%) |
| 4 Vehicles | 35 (2.8%) | 36 (4.4%) |
| 5 or more Vehicles | 0 (0.0%) | 2 (0.3%) |
| Total | 1,237 (100.0%) | 815 (100.0%) |
Commute Time in Parker
The most frequently occuring commute durations in Parker are 20 to 24 minutes (425 commuters, 21.9%), 15 to 19 minutes (356 commuters, 18.4%), and 10 to 14 minutes (268 commuters, 13.8%).
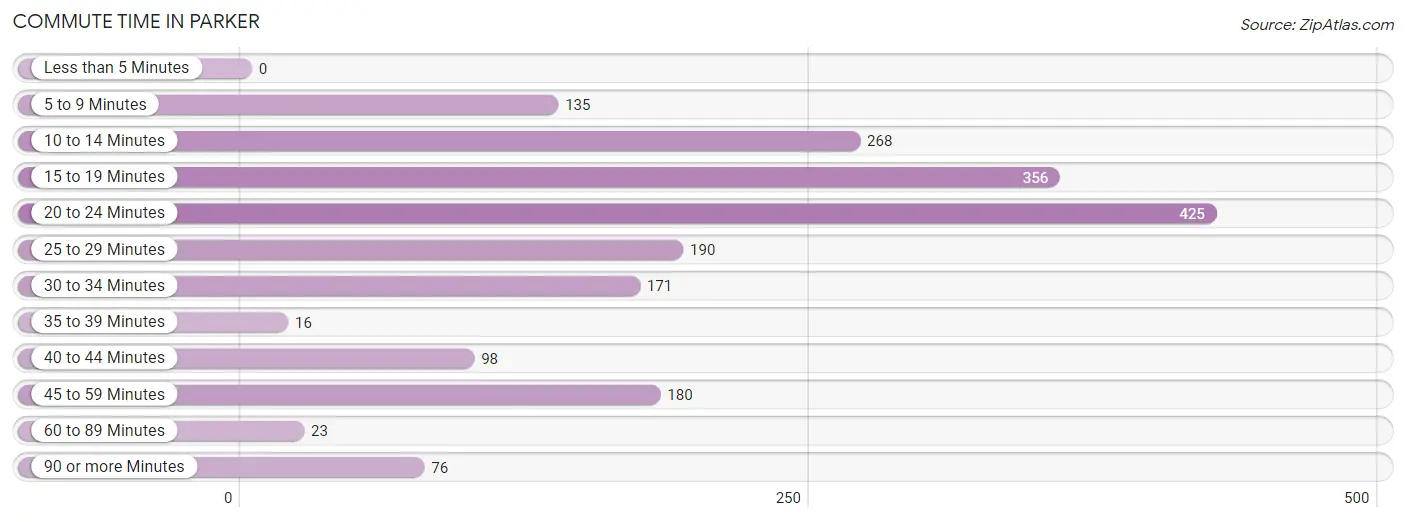
| Commute Time | # Commuters | % Commuters |
| Less than 5 Minutes | 0 | 0.0% |
| 5 to 9 Minutes | 135 | 7.0% |
| 10 to 14 Minutes | 268 | 13.8% |
| 15 to 19 Minutes | 356 | 18.4% |
| 20 to 24 Minutes | 425 | 21.9% |
| 25 to 29 Minutes | 190 | 9.8% |
| 30 to 34 Minutes | 171 | 8.8% |
| 35 to 39 Minutes | 16 | 0.8% |
| 40 to 44 Minutes | 98 | 5.1% |
| 45 to 59 Minutes | 180 | 9.3% |
| 60 to 89 Minutes | 23 | 1.2% |
| 90 or more Minutes | 76 | 3.9% |
Commute Time by Sex in Parker
The most common commute times in Parker are 20 to 24 minutes (265 commuters, 22.0%) for males and 20 to 24 minutes (160 commuters, 21.9%) for females.
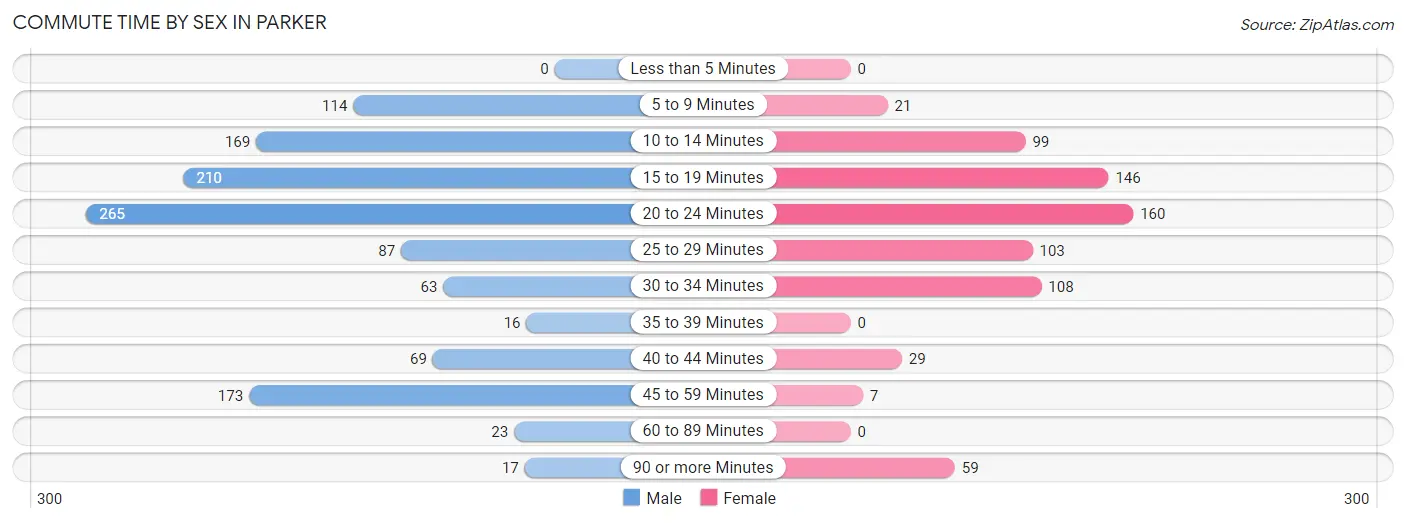
| Commute Time | Male | Female |
| Less than 5 Minutes | 0 (0.0%) | 0 (0.0%) |
| 5 to 9 Minutes | 114 (9.5%) | 21 (2.9%) |
| 10 to 14 Minutes | 169 (14.0%) | 99 (13.5%) |
| 15 to 19 Minutes | 210 (17.4%) | 146 (20.0%) |
| 20 to 24 Minutes | 265 (22.0%) | 160 (21.9%) |
| 25 to 29 Minutes | 87 (7.2%) | 103 (14.1%) |
| 30 to 34 Minutes | 63 (5.2%) | 108 (14.7%) |
| 35 to 39 Minutes | 16 (1.3%) | 0 (0.0%) |
| 40 to 44 Minutes | 69 (5.7%) | 29 (4.0%) |
| 45 to 59 Minutes | 173 (14.3%) | 7 (1.0%) |
| 60 to 89 Minutes | 23 (1.9%) | 0 (0.0%) |
| 90 or more Minutes | 17 (1.4%) | 59 (8.1%) |
Time of Departure to Work by Sex in Parker
The most frequent times of departure to work in Parker are 6:30 AM to 6:59 AM (184, 15.3%) for males and 4:00 PM to 11:59 PM (156, 21.3%) for females.
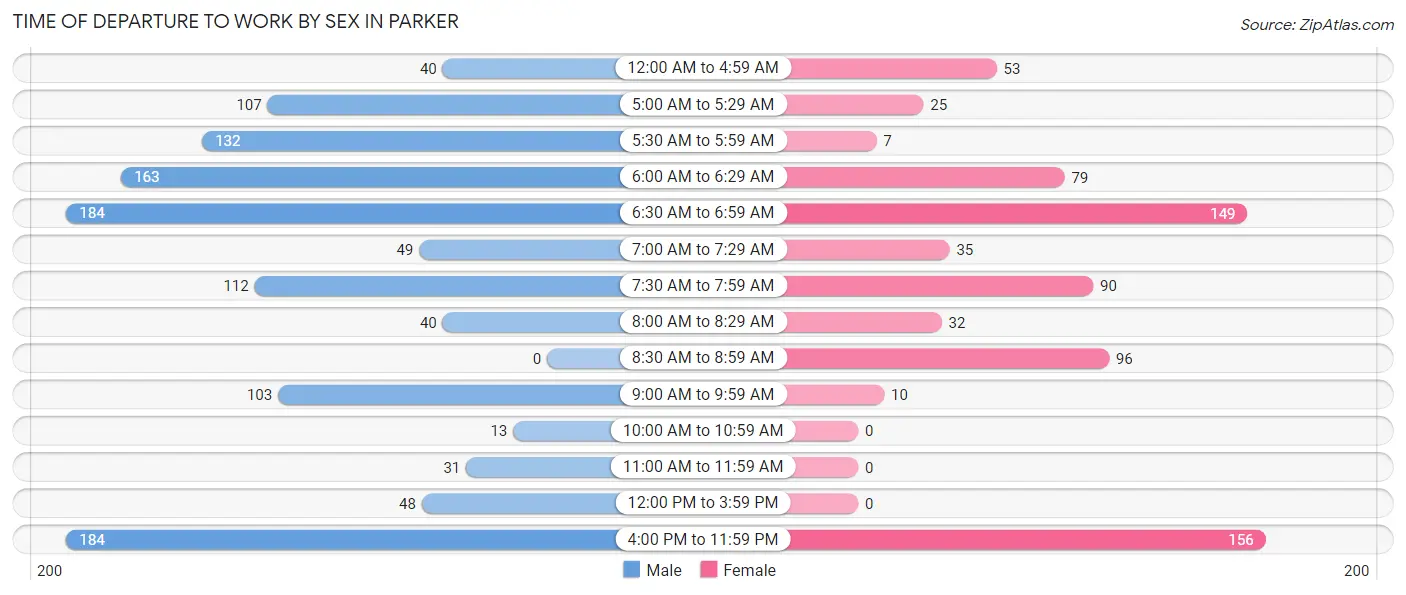
| Time of Departure | Male | Female |
| 12:00 AM to 4:59 AM | 40 (3.3%) | 53 (7.2%) |
| 5:00 AM to 5:29 AM | 107 (8.9%) | 25 (3.4%) |
| 5:30 AM to 5:59 AM | 132 (11.0%) | 7 (1.0%) |
| 6:00 AM to 6:29 AM | 163 (13.5%) | 79 (10.8%) |
| 6:30 AM to 6:59 AM | 184 (15.3%) | 149 (20.4%) |
| 7:00 AM to 7:29 AM | 49 (4.1%) | 35 (4.8%) |
| 7:30 AM to 7:59 AM | 112 (9.3%) | 90 (12.3%) |
| 8:00 AM to 8:29 AM | 40 (3.3%) | 32 (4.4%) |
| 8:30 AM to 8:59 AM | 0 (0.0%) | 96 (13.1%) |
| 9:00 AM to 9:59 AM | 103 (8.5%) | 10 (1.4%) |
| 10:00 AM to 10:59 AM | 13 (1.1%) | 0 (0.0%) |
| 11:00 AM to 11:59 AM | 31 (2.6%) | 0 (0.0%) |
| 12:00 PM to 3:59 PM | 48 (4.0%) | 0 (0.0%) |
| 4:00 PM to 11:59 PM | 184 (15.3%) | 156 (21.3%) |
| Total | 1,206 (100.0%) | 732 (100.0%) |
Housing Occupancy in Parker
Occupancy by Ownership in Parker
Of the total 1,693 dwellings in Parker, owner-occupied units account for 1,035 (61.1%), while renter-occupied units make up 658 (38.9%).
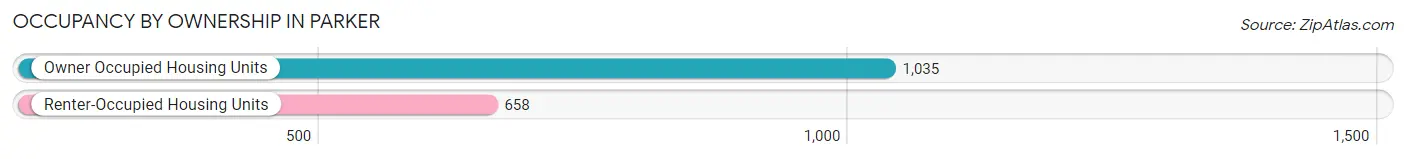
| Occupancy | # Housing Units | % Housing Units |
| Owner Occupied Housing Units | 1,035 | 61.1% |
| Renter-Occupied Housing Units | 658 | 38.9% |
| Total Occupied Housing Units | 1,693 | 100.0% |
Occupancy by Household Size in Parker
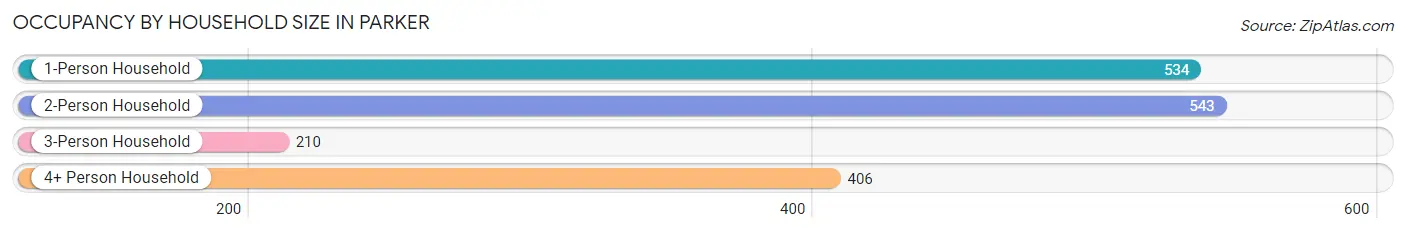
| Household Size | # Housing Units | % Housing Units |
| 1-Person Household | 534 | 31.5% |
| 2-Person Household | 543 | 32.1% |
| 3-Person Household | 210 | 12.4% |
| 4+ Person Household | 406 | 24.0% |
| Total Housing Units | 1,693 | 100.0% |
Occupancy by Ownership by Household Size in Parker
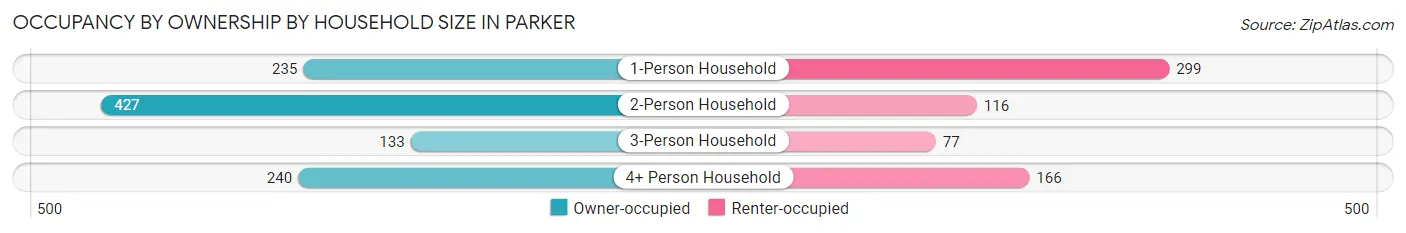
| Household Size | Owner-occupied | Renter-occupied |
| 1-Person Household | 235 (44.0%) | 299 (56.0%) |
| 2-Person Household | 427 (78.6%) | 116 (21.4%) |
| 3-Person Household | 133 (63.3%) | 77 (36.7%) |
| 4+ Person Household | 240 (59.1%) | 166 (40.9%) |
| Total Housing Units | 1,035 (61.1%) | 658 (38.9%) |
Occupancy by Educational Attainment in Parker
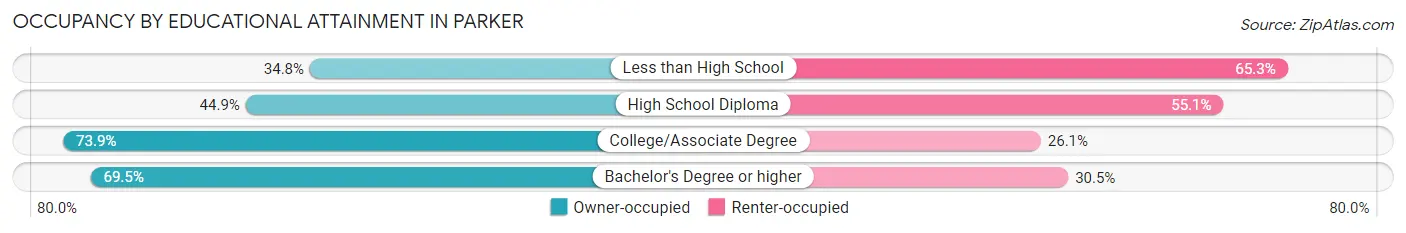
| Household Size | Owner-occupied | Renter-occupied |
| Less than High School | 41 (34.7%) | 77 (65.2%) |
| High School Diploma | 240 (44.9%) | 294 (55.1%) |
| College/Associate Degree | 512 (73.9%) | 181 (26.1%) |
| Bachelor's Degree or higher | 242 (69.5%) | 106 (30.5%) |
Occupancy by Age of Householder in Parker
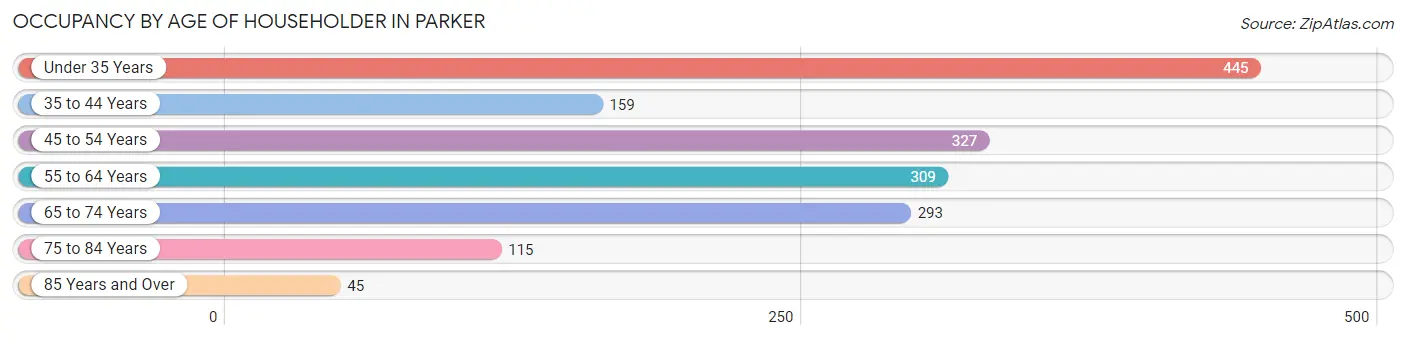
| Age Bracket | # Households | % Households |
| Under 35 Years | 445 | 26.3% |
| 35 to 44 Years | 159 | 9.4% |
| 45 to 54 Years | 327 | 19.3% |
| 55 to 64 Years | 309 | 18.2% |
| 65 to 74 Years | 293 | 17.3% |
| 75 to 84 Years | 115 | 6.8% |
| 85 Years and Over | 45 | 2.7% |
| Total | 1,693 | 100.0% |
Housing Finances in Parker
Median Income by Occupancy in Parker
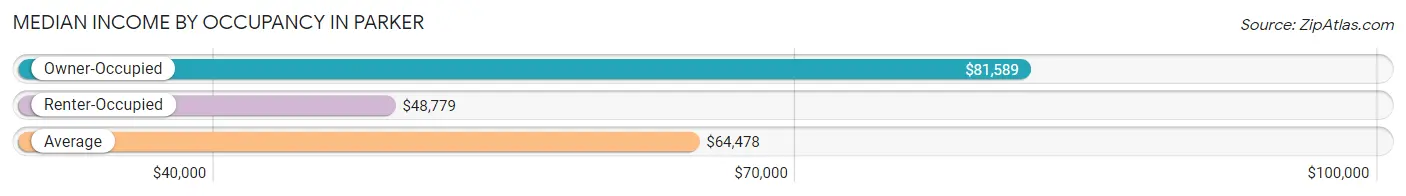
| Occupancy Type | # Households | Median Income |
| Owner-Occupied | 1,035 (61.1%) | $81,589 |
| Renter-Occupied | 658 (38.9%) | $48,779 |
| Average | 1,693 (100.0%) | $64,478 |
Occupancy by Householder Income Bracket in Parker
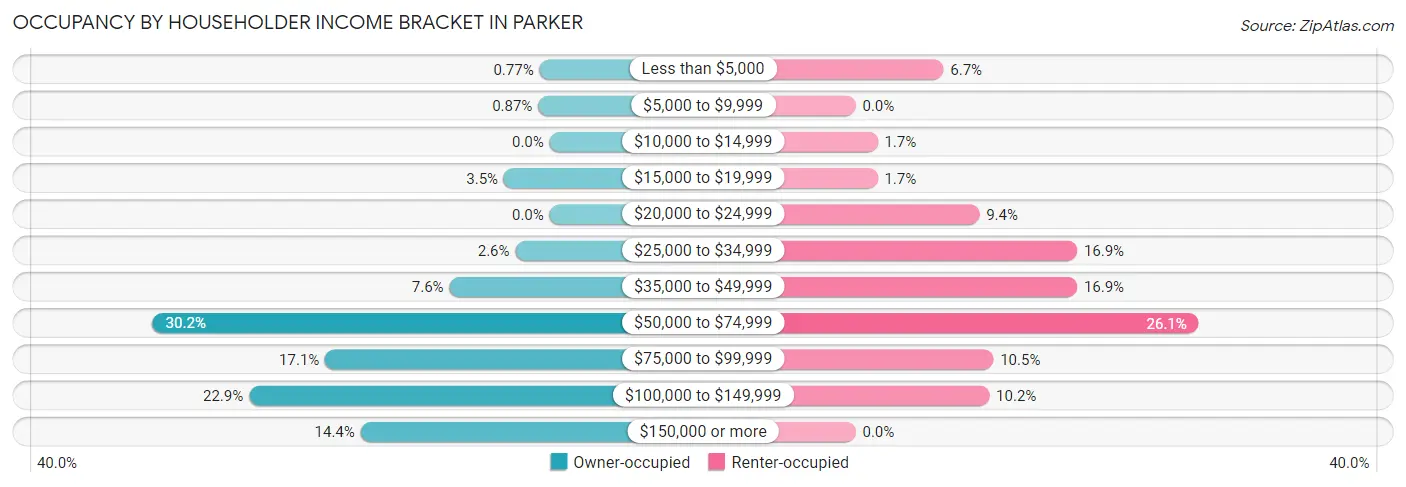
| Income Bracket | Owner-occupied | Renter-occupied |
| Less than $5,000 | 8 (0.8%) | 44 (6.7%) |
| $5,000 to $9,999 | 9 (0.9%) | 0 (0.0%) |
| $10,000 to $14,999 | 0 (0.0%) | 11 (1.7%) |
| $15,000 to $19,999 | 36 (3.5%) | 11 (1.7%) |
| $20,000 to $24,999 | 0 (0.0%) | 62 (9.4%) |
| $25,000 to $34,999 | 27 (2.6%) | 111 (16.9%) |
| $35,000 to $49,999 | 79 (7.6%) | 111 (16.9%) |
| $50,000 to $74,999 | 313 (30.2%) | 172 (26.1%) |
| $75,000 to $99,999 | 177 (17.1%) | 69 (10.5%) |
| $100,000 to $149,999 | 237 (22.9%) | 67 (10.2%) |
| $150,000 or more | 149 (14.4%) | 0 (0.0%) |
| Total | 1,035 (100.0%) | 658 (100.0%) |
Monthly Housing Cost Tiers in Parker
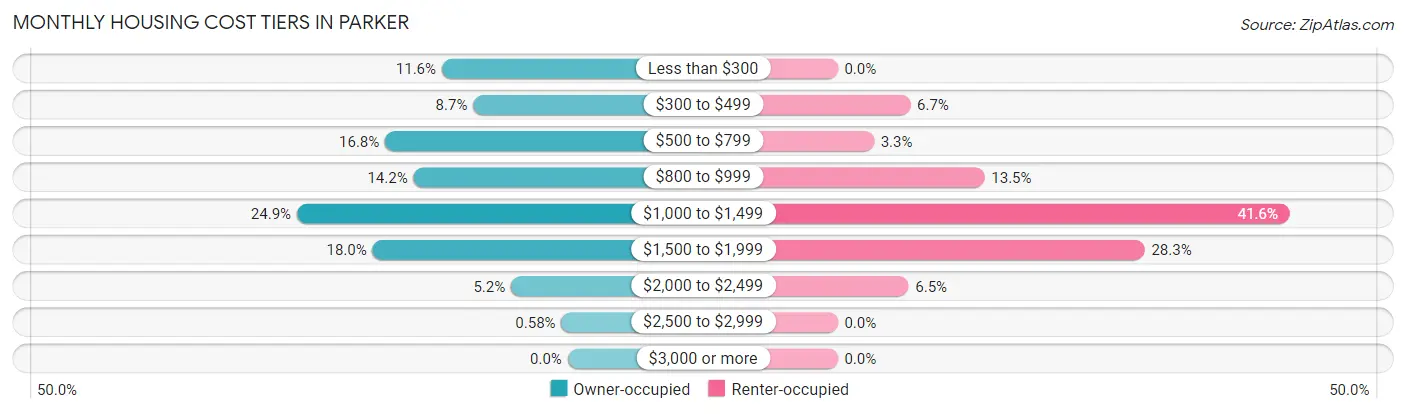
| Monthly Cost | Owner-occupied | Renter-occupied |
| Less than $300 | 120 (11.6%) | 0 (0.0%) |
| $300 to $499 | 90 (8.7%) | 44 (6.7%) |
| $500 to $799 | 174 (16.8%) | 22 (3.3%) |
| $800 to $999 | 147 (14.2%) | 89 (13.5%) |
| $1,000 to $1,499 | 258 (24.9%) | 274 (41.6%) |
| $1,500 to $1,999 | 186 (18.0%) | 186 (28.3%) |
| $2,000 to $2,499 | 54 (5.2%) | 43 (6.5%) |
| $2,500 to $2,999 | 6 (0.6%) | 0 (0.0%) |
| $3,000 or more | 0 (0.0%) | 0 (0.0%) |
| Total | 1,035 (100.0%) | 658 (100.0%) |
Physical Housing Characteristics in Parker
Housing Structures in Parker
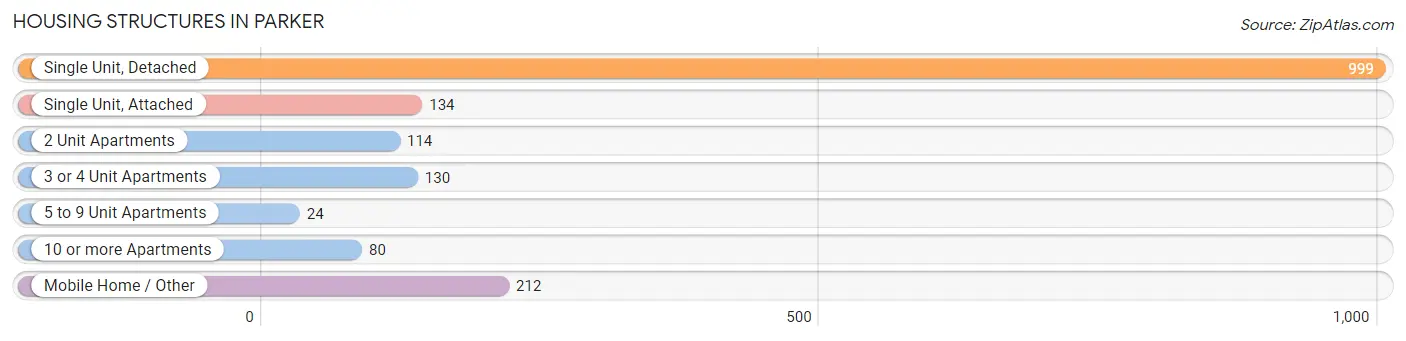
| Structure Type | # Housing Units | % Housing Units |
| Single Unit, Detached | 999 | 59.0% |
| Single Unit, Attached | 134 | 7.9% |
| 2 Unit Apartments | 114 | 6.7% |
| 3 or 4 Unit Apartments | 130 | 7.7% |
| 5 to 9 Unit Apartments | 24 | 1.4% |
| 10 or more Apartments | 80 | 4.7% |
| Mobile Home / Other | 212 | 12.5% |
| Total | 1,693 | 100.0% |
Housing Structures by Occupancy in Parker
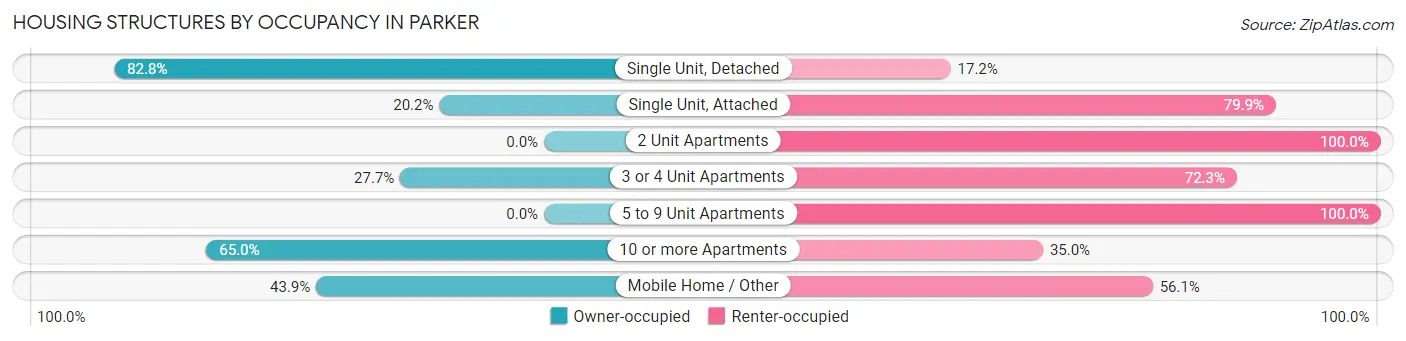
| Structure Type | Owner-occupied | Renter-occupied |
| Single Unit, Detached | 827 (82.8%) | 172 (17.2%) |
| Single Unit, Attached | 27 (20.2%) | 107 (79.8%) |
| 2 Unit Apartments | 0 (0.0%) | 114 (100.0%) |
| 3 or 4 Unit Apartments | 36 (27.7%) | 94 (72.3%) |
| 5 to 9 Unit Apartments | 0 (0.0%) | 24 (100.0%) |
| 10 or more Apartments | 52 (65.0%) | 28 (35.0%) |
| Mobile Home / Other | 93 (43.9%) | 119 (56.1%) |
| Total | 1,035 (61.1%) | 658 (38.9%) |
Housing Structures by Number of Rooms in Parker
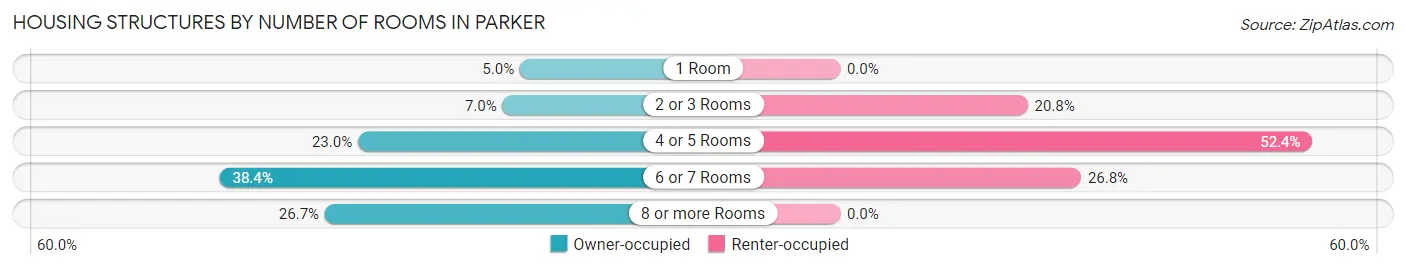
| Number of Rooms | Owner-occupied | Renter-occupied |
| 1 Room | 52 (5.0%) | 0 (0.0%) |
| 2 or 3 Rooms | 72 (7.0%) | 137 (20.8%) |
| 4 or 5 Rooms | 238 (23.0%) | 345 (52.4%) |
| 6 or 7 Rooms | 397 (38.4%) | 176 (26.8%) |
| 8 or more Rooms | 276 (26.7%) | 0 (0.0%) |
| Total | 1,035 (100.0%) | 658 (100.0%) |
Housing Structure by Heating Type in Parker
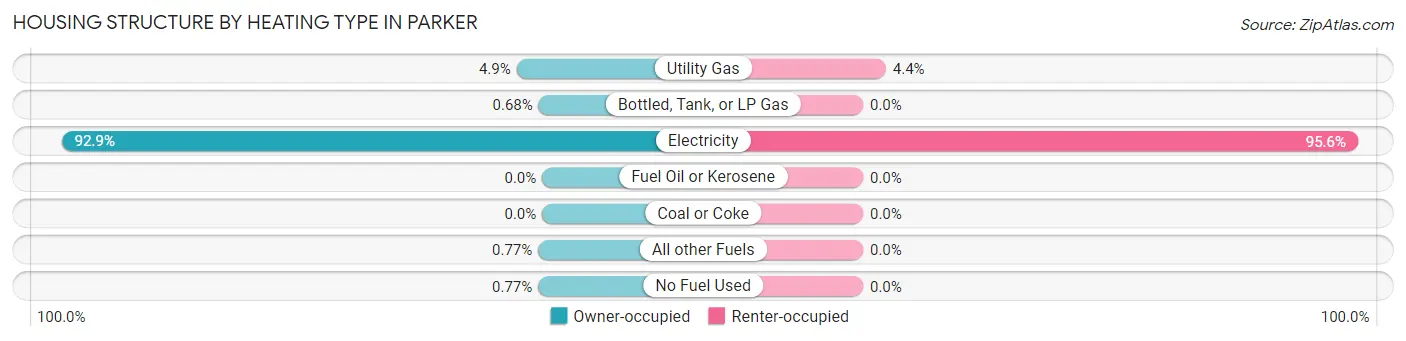
| Heating Type | Owner-occupied | Renter-occupied |
| Utility Gas | 51 (4.9%) | 29 (4.4%) |
| Bottled, Tank, or LP Gas | 7 (0.7%) | 0 (0.0%) |
| Electricity | 961 (92.8%) | 629 (95.6%) |
| Fuel Oil or Kerosene | 0 (0.0%) | 0 (0.0%) |
| Coal or Coke | 0 (0.0%) | 0 (0.0%) |
| All other Fuels | 8 (0.8%) | 0 (0.0%) |
| No Fuel Used | 8 (0.8%) | 0 (0.0%) |
| Total | 1,035 (100.0%) | 658 (100.0%) |
Household Vehicle Usage in Parker
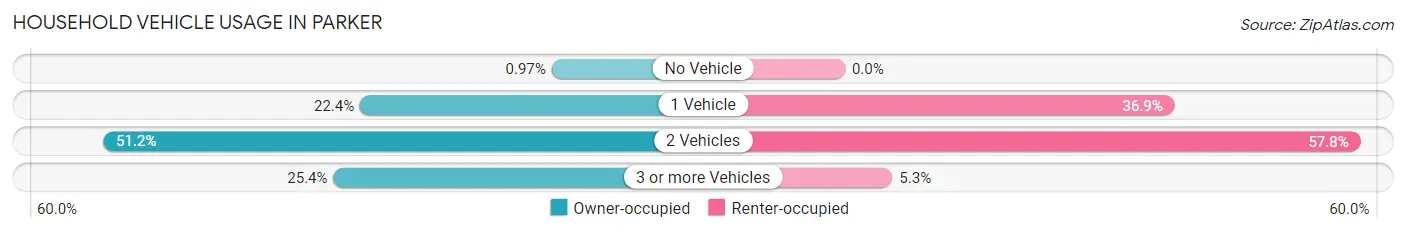
| Vehicles per Household | Owner-occupied | Renter-occupied |
| No Vehicle | 10 (1.0%) | 0 (0.0%) |
| 1 Vehicle | 232 (22.4%) | 243 (36.9%) |
| 2 Vehicles | 530 (51.2%) | 380 (57.8%) |
| 3 or more Vehicles | 263 (25.4%) | 35 (5.3%) |
| Total | 1,035 (100.0%) | 658 (100.0%) |
Real Estate & Mortgages in Parker
Real Estate and Mortgage Overview in Parker
| Characteristic | Without Mortgage | With Mortgage |
| Housing Units | 419 | 616 |
| Median Property Value | $157,900 | $193,000 |
| Median Household Income | $64,111 | $32 |
| Monthly Housing Costs | $499 | $0 |
| Real Estate Taxes | $660 | $130 |
Property Value by Mortgage Status in Parker
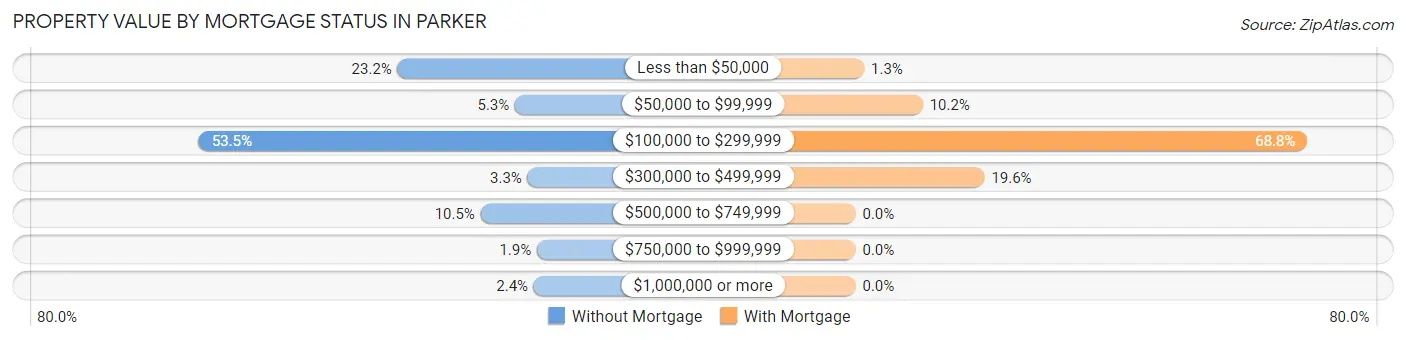
| Property Value | Without Mortgage | With Mortgage |
| Less than $50,000 | 97 (23.2%) | 8 (1.3%) |
| $50,000 to $99,999 | 22 (5.2%) | 63 (10.2%) |
| $100,000 to $299,999 | 224 (53.5%) | 424 (68.8%) |
| $300,000 to $499,999 | 14 (3.3%) | 121 (19.6%) |
| $500,000 to $749,999 | 44 (10.5%) | 0 (0.0%) |
| $750,000 to $999,999 | 8 (1.9%) | 0 (0.0%) |
| $1,000,000 or more | 10 (2.4%) | 0 (0.0%) |
| Total | 419 (100.0%) | 616 (100.0%) |
Household Income by Mortgage Status in Parker
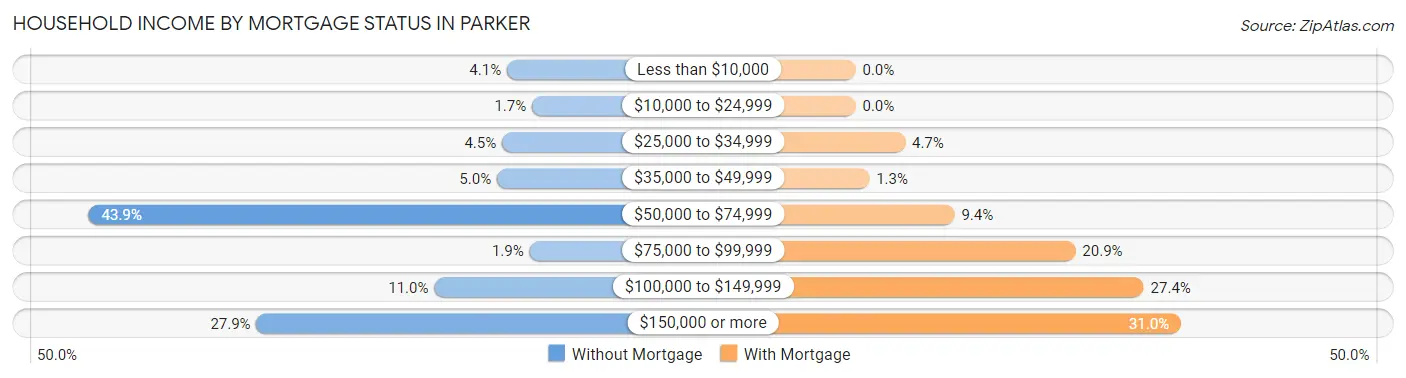
| Household Income | Without Mortgage | With Mortgage |
| Less than $10,000 | 17 (4.1%) | 0 (0.0%) |
| $10,000 to $24,999 | 7 (1.7%) | 0 (0.0%) |
| $25,000 to $34,999 | 19 (4.5%) | 29 (4.7%) |
| $35,000 to $49,999 | 21 (5.0%) | 8 (1.3%) |
| $50,000 to $74,999 | 184 (43.9%) | 58 (9.4%) |
| $75,000 to $99,999 | 8 (1.9%) | 129 (20.9%) |
| $100,000 to $149,999 | 46 (11.0%) | 169 (27.4%) |
| $150,000 or more | 117 (27.9%) | 191 (31.0%) |
| Total | 419 (100.0%) | 616 (100.0%) |
Property Value to Household Income Ratio in Parker
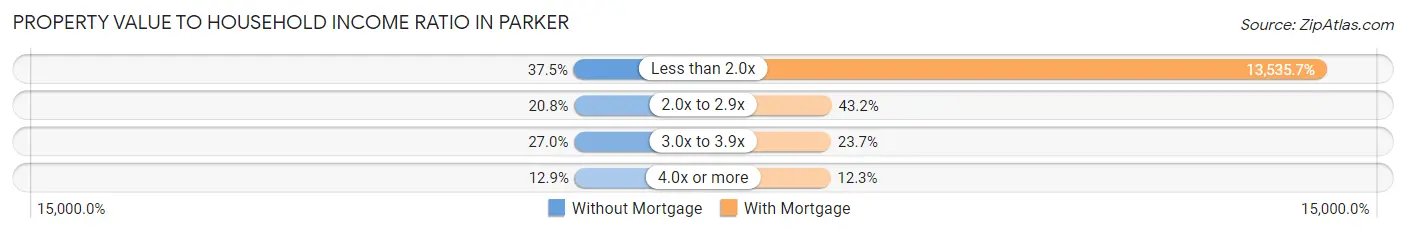
| Value-to-Income Ratio | Without Mortgage | With Mortgage |
| Less than 2.0x | 157 (37.5%) | 83,380 (13,535.7%) |
| 2.0x to 2.9x | 87 (20.8%) | 266 (43.2%) |
| 3.0x to 3.9x | 113 (27.0%) | 146 (23.7%) |
| 4.0x or more | 54 (12.9%) | 76 (12.3%) |
| Total | 419 (100.0%) | 616 (100.0%) |
Real Estate Taxes by Mortgage Status in Parker
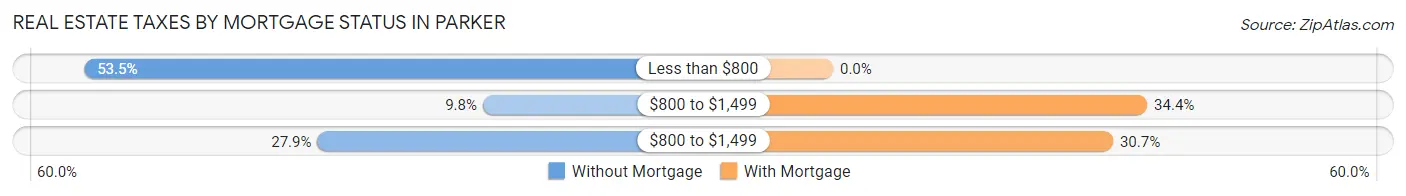
| Property Taxes | Without Mortgage | With Mortgage |
| Less than $800 | 224 (53.5%) | 0 (0.0%) |
| $800 to $1,499 | 41 (9.8%) | 212 (34.4%) |
| $800 to $1,499 | 117 (27.9%) | 189 (30.7%) |
| Total | 419 (100.0%) | 616 (100.0%) |
Health & Disability in Parker
Health Insurance Coverage by Age in Parker
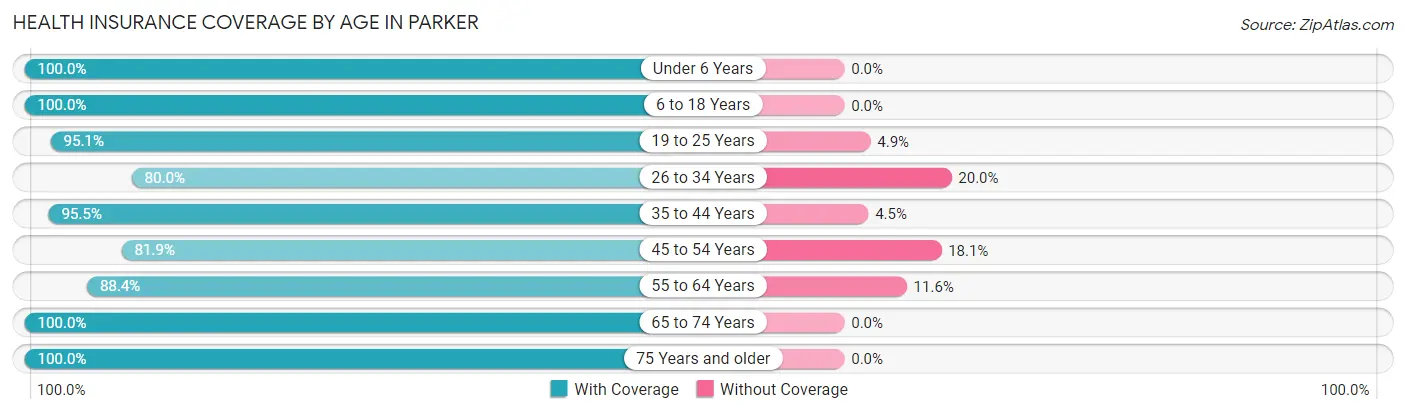
| Age Bracket | With Coverage | Without Coverage |
| Under 6 Years | 321 (100.0%) | 0 (0.0%) |
| 6 to 18 Years | 668 (100.0%) | 0 (0.0%) |
| 19 to 25 Years | 235 (95.1%) | 12 (4.9%) |
| 26 to 34 Years | 565 (80.0%) | 141 (20.0%) |
| 35 to 44 Years | 428 (95.5%) | 20 (4.5%) |
| 45 to 54 Years | 458 (81.9%) | 101 (18.1%) |
| 55 to 64 Years | 532 (88.4%) | 70 (11.6%) |
| 65 to 74 Years | 423 (100.0%) | 0 (0.0%) |
| 75 Years and older | 308 (100.0%) | 0 (0.0%) |
| Total | 3,938 (92.0%) | 344 (8.0%) |
Health Insurance Coverage by Citizenship Status in Parker
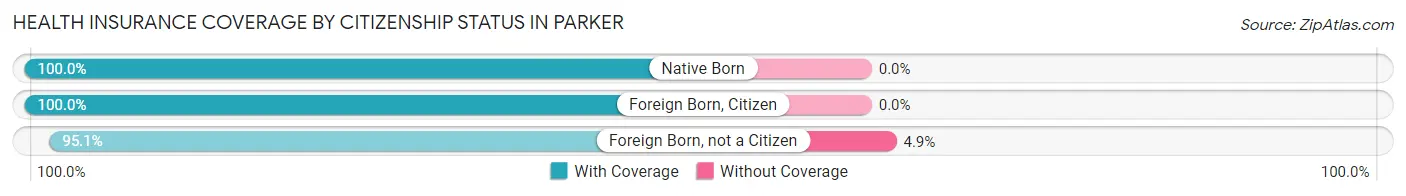
| Citizenship Status | With Coverage | Without Coverage |
| Native Born | 321 (100.0%) | 0 (0.0%) |
| Foreign Born, Citizen | 668 (100.0%) | 0 (0.0%) |
| Foreign Born, not a Citizen | 235 (95.1%) | 12 (4.9%) |
Health Insurance Coverage by Household Income in Parker
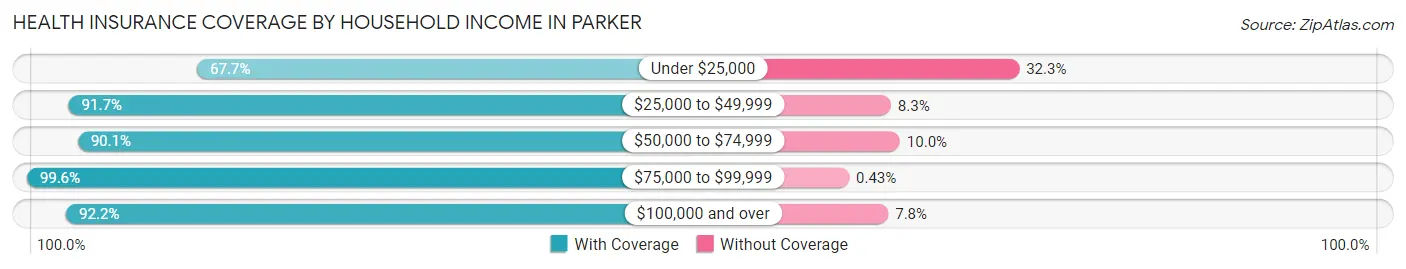
| Household Income | With Coverage | Without Coverage |
| Under $25,000 | 132 (67.7%) | 63 (32.3%) |
| $25,000 to $49,999 | 511 (91.7%) | 46 (8.3%) |
| $50,000 to $74,999 | 1,204 (90.0%) | 133 (10.0%) |
| $75,000 to $99,999 | 920 (99.6%) | 4 (0.4%) |
| $100,000 and over | 1,163 (92.2%) | 98 (7.8%) |
Public vs Private Health Insurance Coverage by Age in Parker
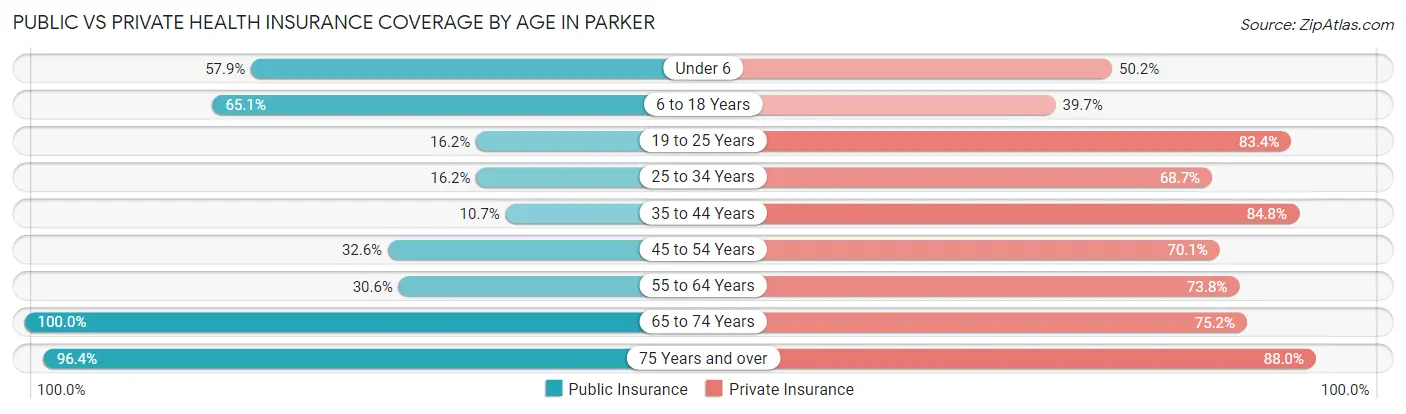
| Age Bracket | Public Insurance | Private Insurance |
| Under 6 | 186 (57.9%) | 161 (50.2%) |
| 6 to 18 Years | 435 (65.1%) | 265 (39.7%) |
| 19 to 25 Years | 40 (16.2%) | 206 (83.4%) |
| 25 to 34 Years | 114 (16.2%) | 485 (68.7%) |
| 35 to 44 Years | 48 (10.7%) | 380 (84.8%) |
| 45 to 54 Years | 182 (32.6%) | 392 (70.1%) |
| 55 to 64 Years | 184 (30.6%) | 444 (73.8%) |
| 65 to 74 Years | 423 (100.0%) | 318 (75.2%) |
| 75 Years and over | 297 (96.4%) | 271 (88.0%) |
| Total | 1,909 (44.6%) | 2,922 (68.2%) |
Disability Status by Sex by Age in Parker
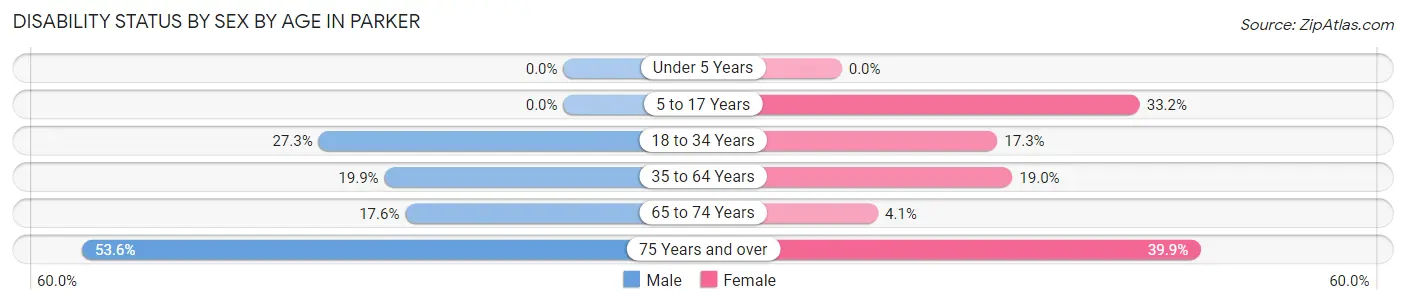
| Age Bracket | Male | Female |
| Under 5 Years | 0 (0.0%) | 0 (0.0%) |
| 5 to 17 Years | 0 (0.0%) | 152 (33.2%) |
| 18 to 34 Years | 144 (27.3%) | 78 (17.3%) |
| 35 to 64 Years | 177 (19.9%) | 137 (19.0%) |
| 65 to 74 Years | 31 (17.6%) | 10 (4.1%) |
| 75 Years and over | 67 (53.6%) | 73 (39.9%) |
Disability Class by Sex by Age in Parker
Disability Class: Hearing Difficulty
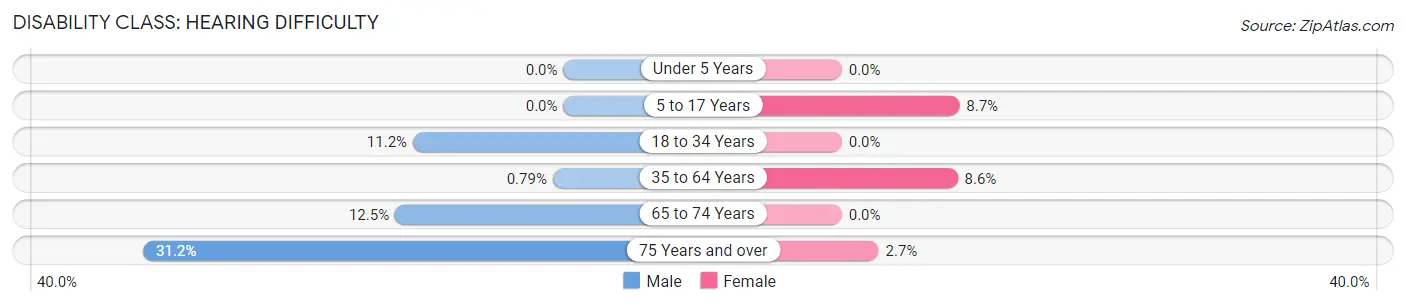
| Age Bracket | Male | Female |
| Under 5 Years | 0 (0.0%) | 0 (0.0%) |
| 5 to 17 Years | 0 (0.0%) | 40 (8.7%) |
| 18 to 34 Years | 59 (11.2%) | 0 (0.0%) |
| 35 to 64 Years | 7 (0.8%) | 62 (8.6%) |
| 65 to 74 Years | 22 (12.5%) | 0 (0.0%) |
| 75 Years and over | 39 (31.2%) | 5 (2.7%) |
Disability Class: Vision Difficulty
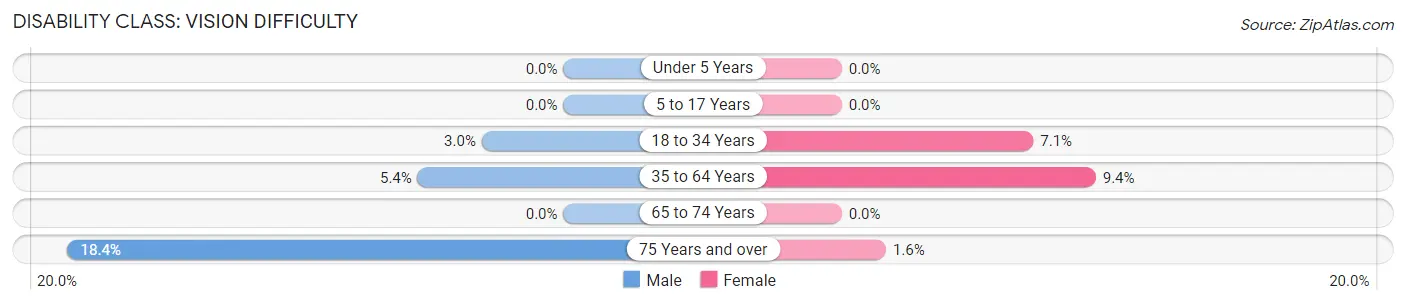
| Age Bracket | Male | Female |
| Under 5 Years | 0 (0.0%) | 0 (0.0%) |
| 5 to 17 Years | 0 (0.0%) | 0 (0.0%) |
| 18 to 34 Years | 16 (3.0%) | 32 (7.1%) |
| 35 to 64 Years | 48 (5.4%) | 68 (9.4%) |
| 65 to 74 Years | 0 (0.0%) | 0 (0.0%) |
| 75 Years and over | 23 (18.4%) | 3 (1.6%) |
Disability Class: Cognitive Difficulty
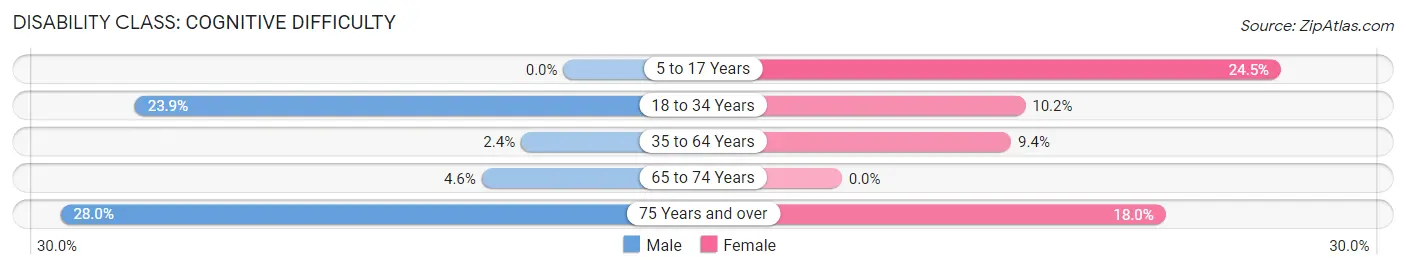
| Age Bracket | Male | Female |
| 5 to 17 Years | 0 (0.0%) | 112 (24.4%) |
| 18 to 34 Years | 126 (23.9%) | 46 (10.2%) |
| 35 to 64 Years | 21 (2.4%) | 68 (9.4%) |
| 65 to 74 Years | 8 (4.5%) | 0 (0.0%) |
| 75 Years and over | 35 (28.0%) | 33 (18.0%) |
Disability Class: Ambulatory Difficulty
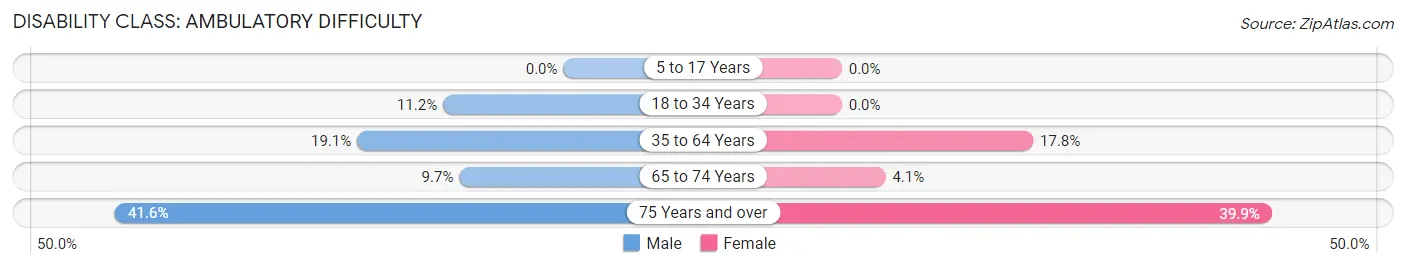
| Age Bracket | Male | Female |
| 5 to 17 Years | 0 (0.0%) | 0 (0.0%) |
| 18 to 34 Years | 59 (11.2%) | 0 (0.0%) |
| 35 to 64 Years | 170 (19.1%) | 128 (17.7%) |
| 65 to 74 Years | 17 (9.7%) | 10 (4.1%) |
| 75 Years and over | 52 (41.6%) | 73 (39.9%) |
Disability Class: Self-Care Difficulty
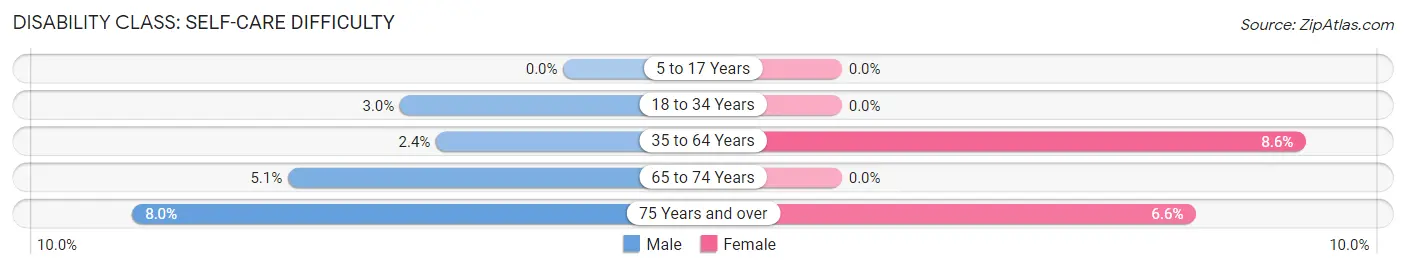
| Age Bracket | Male | Female |
| 5 to 17 Years | 0 (0.0%) | 0 (0.0%) |
| 18 to 34 Years | 16 (3.0%) | 0 (0.0%) |
| 35 to 64 Years | 21 (2.4%) | 62 (8.6%) |
| 65 to 74 Years | 9 (5.1%) | 0 (0.0%) |
| 75 Years and over | 10 (8.0%) | 12 (6.6%) |
Technology Access in Parker
Computing Device Access in Parker
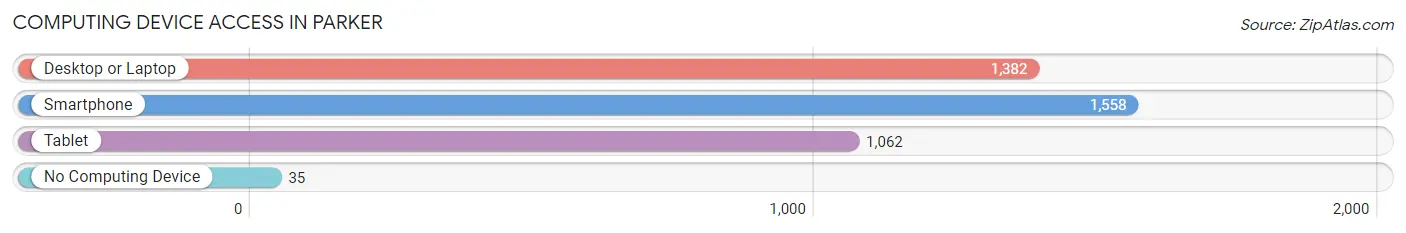
| Device Type | # Households | % Households |
| Desktop or Laptop | 1,382 | 81.6% |
| Smartphone | 1,558 | 92.0% |
| Tablet | 1,062 | 62.7% |
| No Computing Device | 35 | 2.1% |
| Total | 1,693 | 100.0% |
Internet Access in Parker
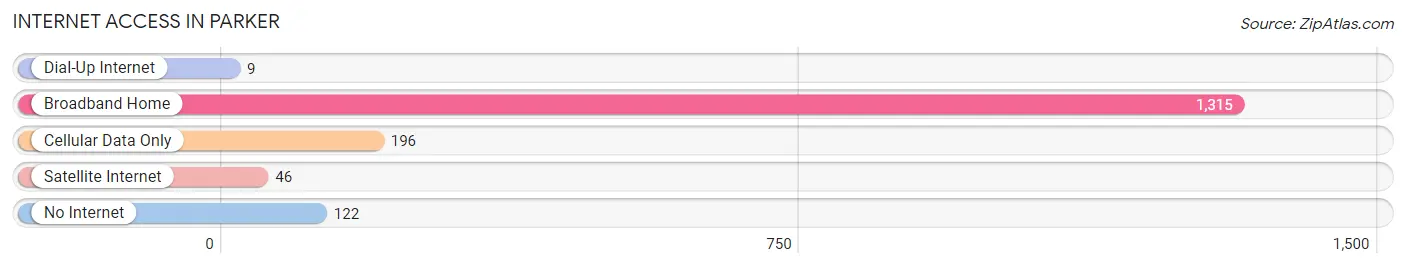
| Internet Type | # Households | % Households |
| Dial-Up Internet | 9 | 0.5% |
| Broadband Home | 1,315 | 77.7% |
| Cellular Data Only | 196 | 11.6% |
| Satellite Internet | 46 | 2.7% |
| No Internet | 122 | 7.2% |
| Total | 1,693 | 100.0% |
Parker Summary
Parker, Florida is a small town located in Bay County, Florida. It is situated on the western shore of the Gulf of Mexico, approximately 20 miles east of Panama City. The town was founded in 1887 and is named after the Parker family, who were among the first settlers in the area.
Geography
Parker is located in the Florida Panhandle, on the western shore of the Gulf of Mexico. It is bordered by the cities of Panama City Beach to the west, Lynn Haven to the north, and Callaway to the east. The town is situated on a peninsula, with the Gulf of Mexico to the south and St. Andrew Bay to the north. The town covers an area of approximately 4.5 square miles, with a population of approximately 4,000 people.
The terrain of Parker is mostly flat, with some rolling hills. The town is located in a humid subtropical climate zone, with hot, humid summers and mild winters. The average annual temperature is around 70 degrees Fahrenheit, with an average annual rainfall of around 60 inches.
Economy
The economy of Parker is largely based on tourism and fishing. The town is home to several marinas, which provide access to the Gulf of Mexico for recreational fishing and boating. The town also has several restaurants, bars, and shops, which cater to tourists and locals alike.
The town is also home to several manufacturing and industrial businesses, including a paper mill, a chemical plant, and a seafood processing plant. The town is also home to a number of small businesses, including retail stores, restaurants, and other services.
Demographics
As of the 2010 census, the population of Parker was 4,068. The racial makeup of the town was 79.3% White, 15.2% African American, 0.7% Native American, 0.7% Asian, 0.1% Pacific Islander, and 3.9% from other races. Hispanic or Latino of any race were 5.2% of the population.
The median household income in Parker was $37,917, and the median family income was $45,938. The per capita income for the town was $20,945. About 15.2% of families and 18.2% of the population were below the poverty line, including 25.2% of those under age 18 and 11.2% of those age 65 or over.
Conclusion
Parker, Florida is a small town located in Bay County, Florida. It is situated on the western shore of the Gulf of Mexico, approximately 20 miles east of Panama City. The town was founded in 1887 and is named after the Parker family, who were among the first settlers in the area. The economy of Parker is largely based on tourism and fishing, and the town is home to several manufacturing and industrial businesses. As of the 2010 census, the population of Parker was 4,068, with a median household income of $37,917 and a median family income of $45,938.
Common Questions
What is Per Capita Income in Parker?
Per Capita income in Parker is $32,192.
What is the Median Family Income in Parker?
Median Family Income in Parker is $71,979.
What is the Median Household income in Parker?
Median Household Income in Parker is $64,478.
What is Income or Wage Gap in Parker?
Income or Wage Gap in Parker is 21.7%.
Women in Parker earn 78.3 cents for every dollar earned by a man.
What is Inequality or Gini Index in Parker?
Inequality or Gini Index in Parker is 0.35.
What is the Total Population of Parker?
Total Population of Parker is 4,309.
What is the Total Male Population of Parker?
Total Male Population of Parker is 2,029.
What is the Total Female Population of Parker?
Total Female Population of Parker is 2,280.
What is the Ratio of Males per 100 Females in Parker?
There are 88.99 Males per 100 Females in Parker.
What is the Ratio of Females per 100 Males in Parker?
There are 112.37 Females per 100 Males in Parker.
What is the Median Population Age in Parker?
Median Population Age in Parker is 36.0 Years.
What is the Average Family Size in Parker
Average Family Size in Parker is 3.0 People.
What is the Average Household Size in Parker
Average Household Size in Parker is 2.5 People.
How Large is the Labor Force in Parker?
There are 2,222 People in the Labor Forcein in Parker.
What is the Percentage of People in the Labor Force in Parker?
62.6% of People are in the Labor Force in Parker.
What is the Unemployment Rate in Parker?
Unemployment Rate in Parker is 5.9%.