Palmetto, FL Map & Demographics
Palmetto Map
Palmetto Overview
$34,911
PER CAPITA INCOME
$70,814
AVG FAMILY INCOME
$55,584
AVG HOUSEHOLD INCOME
10.2%
WAGE / INCOME GAP [ % ]
89.8¢/ $1
WAGE / INCOME GAP [ $ ]
0.50
INEQUALITY / GINI INDEX
13,384
TOTAL POPULATION
6,468
MALE POPULATION
6,916
FEMALE POPULATION
93.52
MALES / 100 FEMALES
106.93
FEMALES / 100 MALES
50.0
MEDIAN AGE
3.2
AVG FAMILY SIZE
2.7
AVG HOUSEHOLD SIZE
5,859
LABOR FORCE [ PEOPLE ]
53.4%
PERCENT IN LABOR FORCE
6.7%
UNEMPLOYMENT RATE
Palmetto Zip Codes
Palmetto Area Codes
Income in Palmetto
Income Overview in Palmetto
Per Capita Income in Palmetto is $34,911, while median incomes of families and households are $70,814 and $55,584 respectively.
| Characteristic | Number | Measure |
| Per Capita Income | 13,384 | $34,911 |
| Median Family Income | 3,326 | $70,814 |
| Mean Family Income | 3,326 | $102,518 |
| Median Household Income | 4,957 | $55,584 |
| Mean Household Income | 4,957 | $87,136 |
| Income Deficit | 3,326 | $0 |
| Wage / Income Gap (%) | 13,384 | 10.15% |
| Wage / Income Gap ($) | 13,384 | 89.85¢ per $1 |
| Gini / Inequality Index | 13,384 | 0.50 |
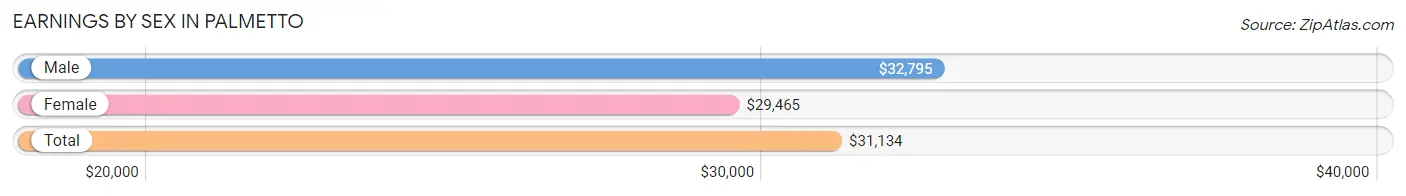
Earnings by Sex in Palmetto
Average Earnings in Palmetto are $31,134, $32,795 for men and $29,465 for women, a difference of 10.2%.
| Sex | Number | Average Earnings |
| Male | 3,341 (57.2%) | $32,795 |
| Female | 2,502 (42.8%) | $29,465 |
| Total | 5,843 (100.0%) | $31,134 |
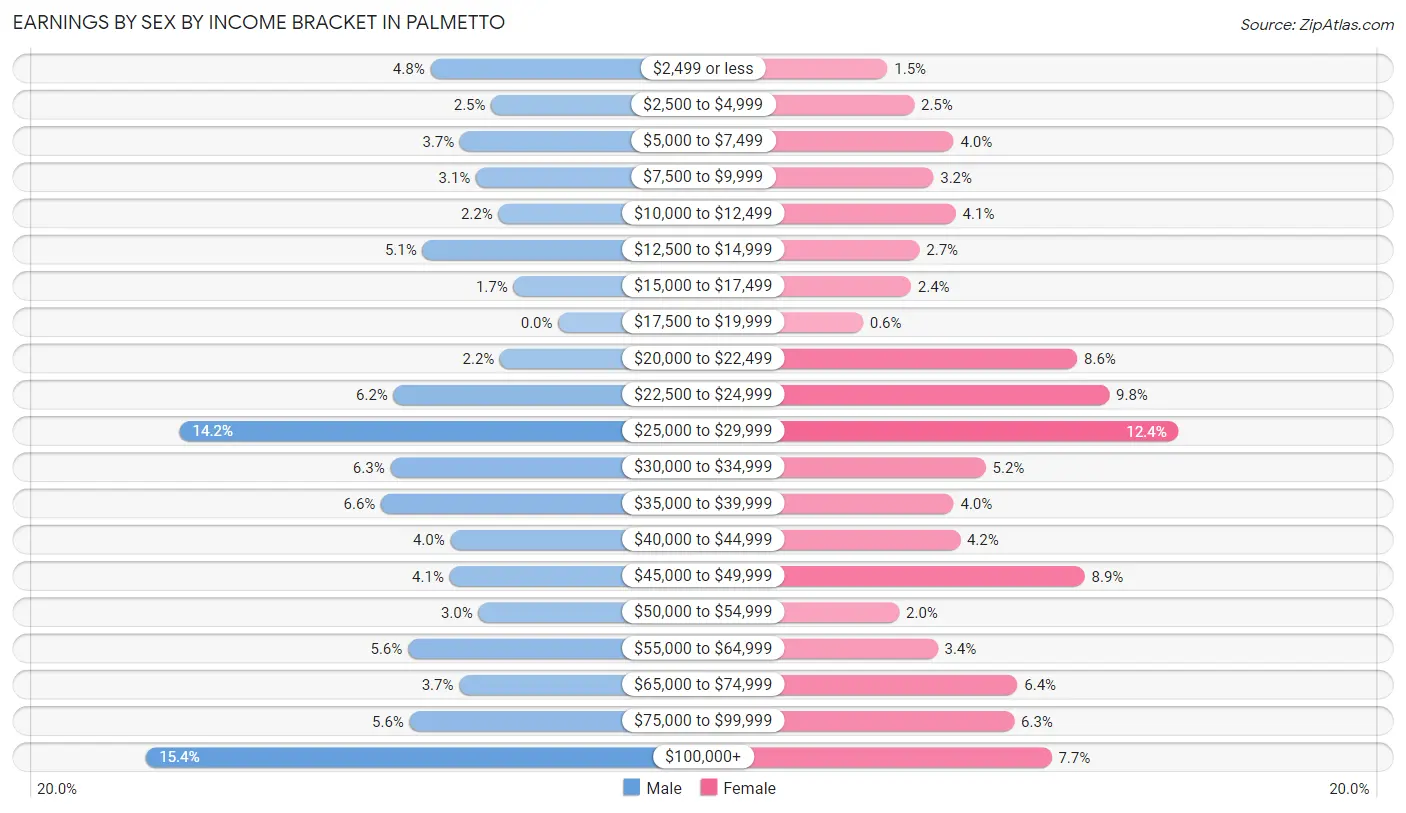
Earnings by Sex by Income Bracket in Palmetto
The most common earnings brackets in Palmetto are $100,000+ for men (516 | 15.4%) and $25,000 to $29,999 for women (311 | 12.4%).
| Income | Male | Female |
| $2,499 or less | 160 (4.8%) | 38 (1.5%) |
| $2,500 to $4,999 | 84 (2.5%) | 63 (2.5%) |
| $5,000 to $7,499 | 123 (3.7%) | 100 (4.0%) |
| $7,500 to $9,999 | 103 (3.1%) | 81 (3.2%) |
| $10,000 to $12,499 | 75 (2.2%) | 102 (4.1%) |
| $12,500 to $14,999 | 170 (5.1%) | 68 (2.7%) |
| $15,000 to $17,499 | 56 (1.7%) | 60 (2.4%) |
| $17,500 to $19,999 | 0 (0.0%) | 15 (0.6%) |
| $20,000 to $22,499 | 73 (2.2%) | 216 (8.6%) |
| $22,500 to $24,999 | 206 (6.2%) | 246 (9.8%) |
| $25,000 to $29,999 | 474 (14.2%) | 311 (12.4%) |
| $30,000 to $34,999 | 210 (6.3%) | 130 (5.2%) |
| $35,000 to $39,999 | 222 (6.6%) | 100 (4.0%) |
| $40,000 to $44,999 | 135 (4.0%) | 106 (4.2%) |
| $45,000 to $49,999 | 136 (4.1%) | 223 (8.9%) |
| $50,000 to $54,999 | 100 (3.0%) | 49 (2.0%) |
| $55,000 to $64,999 | 188 (5.6%) | 85 (3.4%) |
| $65,000 to $74,999 | 124 (3.7%) | 160 (6.4%) |
| $75,000 to $99,999 | 186 (5.6%) | 157 (6.3%) |
| $100,000+ | 516 (15.4%) | 192 (7.7%) |
| Total | 3,341 (100.0%) | 2,502 (100.0%) |
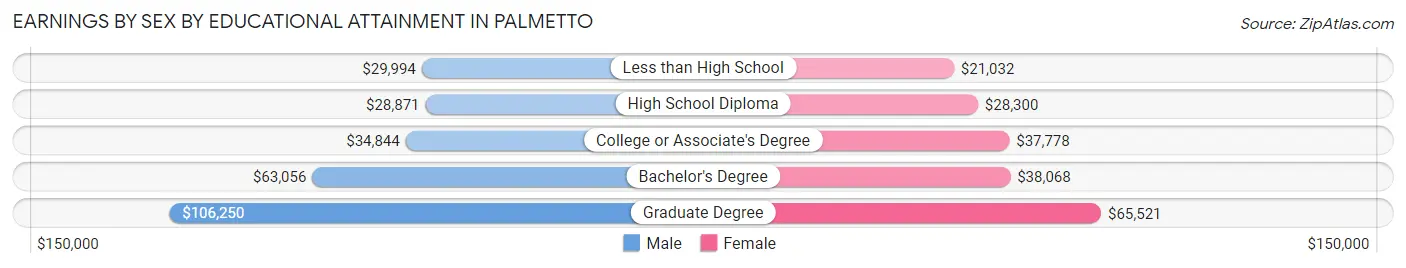
Earnings by Sex by Educational Attainment in Palmetto
Average earnings in Palmetto are $38,625 for men and $30,438 for women, a difference of 21.2%. Men with an educational attainment of graduate degree enjoy the highest average annual earnings of $106,250, while those with high school diploma education earn the least with $28,871. Women with an educational attainment of graduate degree earn the most with the average annual earnings of $65,521, while those with less than high school education have the smallest earnings of $21,032.
| Educational Attainment | Male Income | Female Income |
| Less than High School | $29,994 | $21,032 |
| High School Diploma | $28,871 | $28,300 |
| College or Associate's Degree | $34,844 | $37,778 |
| Bachelor's Degree | $63,056 | $38,068 |
| Graduate Degree | $106,250 | $65,521 |
| Total | $38,625 | $30,438 |
Family Income in Palmetto
Family Income Brackets in Palmetto
According to the Palmetto family income data, there are 582 families falling into the $50,000 to $74,999 income range, which is the most common income bracket and makes up 17.5% of all families. Conversely, the less than $10,000 income bracket is the least frequent group with only 43 families (1.3%) belonging to this category.
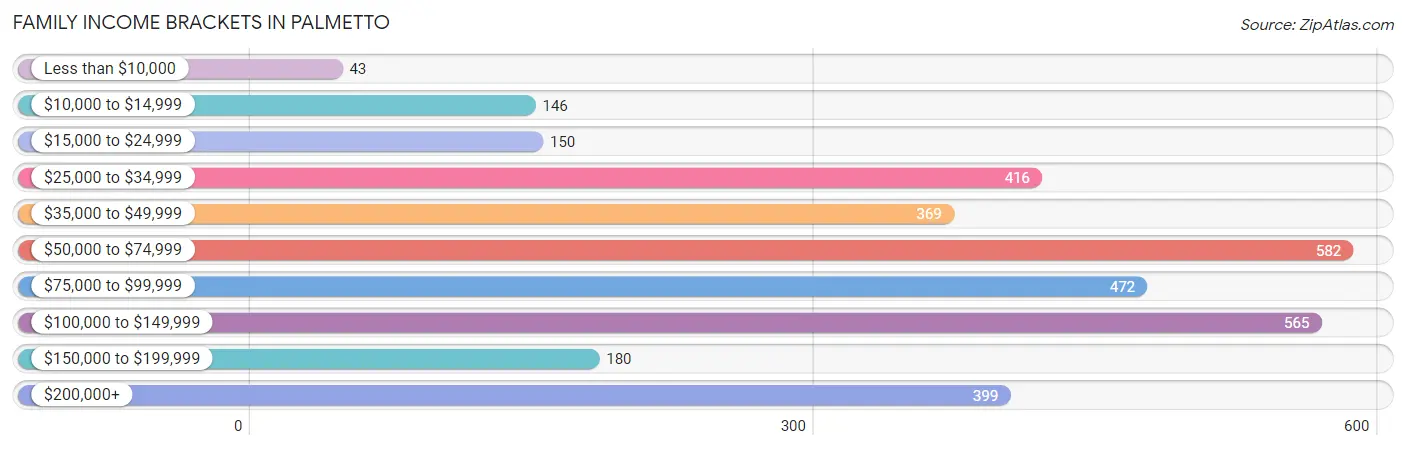
| Income Bracket | # Families | % Families |
| Less than $10,000 | 43 | 1.3% |
| $10,000 to $14,999 | 146 | 4.4% |
| $15,000 to $24,999 | 150 | 4.5% |
| $25,000 to $34,999 | 416 | 12.5% |
| $35,000 to $49,999 | 369 | 11.1% |
| $50,000 to $74,999 | 582 | 17.5% |
| $75,000 to $99,999 | 472 | 14.2% |
| $100,000 to $149,999 | 565 | 17.0% |
| $150,000 to $199,999 | 180 | 5.4% |
| $200,000+ | 399 | 12.0% |
Family Income by Famaliy Size in Palmetto
7+ person families (104 | 3.1%) account for the highest median family income in Palmetto with $141,744 per family, while 4-person families (340 | 10.2%) have the highest median income of $32,597 per family member.
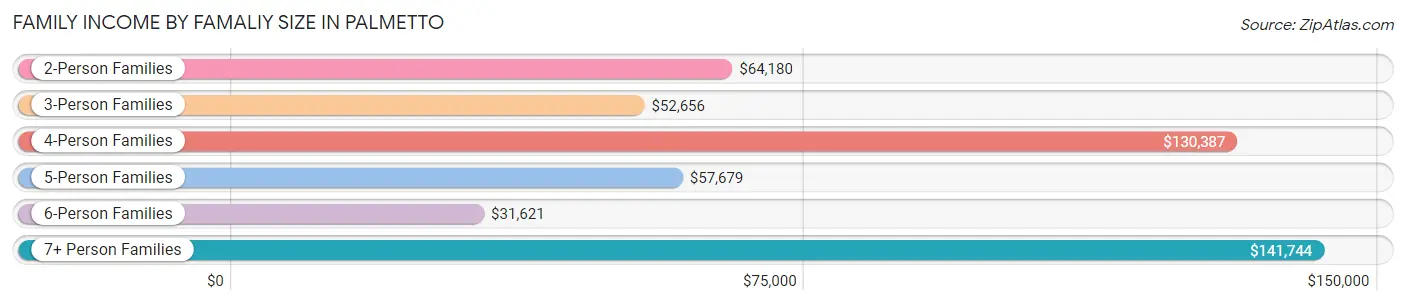
| Income Bracket | # Families | Median Income |
| 2-Person Families | 2,139 (64.3%) | $64,180 |
| 3-Person Families | 473 (14.2%) | $52,656 |
| 4-Person Families | 340 (10.2%) | $130,387 |
| 5-Person Families | 152 (4.6%) | $57,679 |
| 6-Person Families | 118 (3.5%) | $31,621 |
| 7+ Person Families | 104 (3.1%) | $141,744 |
| Total | 3,326 (100.0%) | $70,814 |
Family Income by Number of Earners in Palmetto
The median family income in Palmetto is $70,814, with families comprising 3+ earners (414) having the highest median family income of $131,964, while families with 1 earner (1,200) have the lowest median family income of $45,521, accounting for 12.4% and 36.1% of families, respectively.
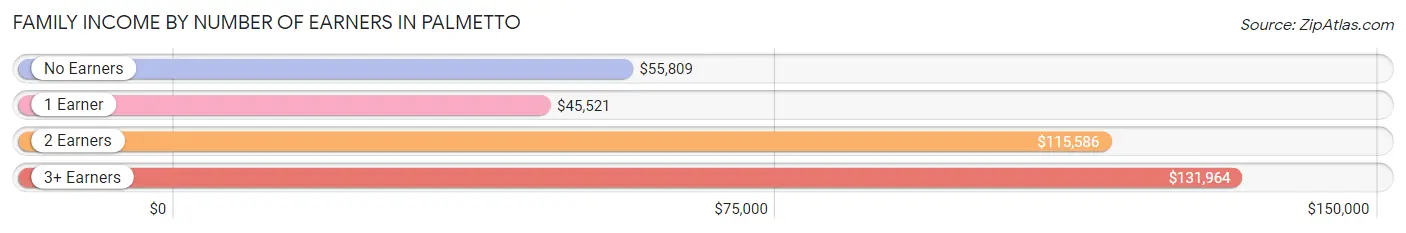
| Number of Earners | # Families | Median Income |
| No Earners | 969 (29.1%) | $55,809 |
| 1 Earner | 1,200 (36.1%) | $45,521 |
| 2 Earners | 743 (22.3%) | $115,586 |
| 3+ Earners | 414 (12.4%) | $131,964 |
| Total | 3,326 (100.0%) | $70,814 |
Household Income in Palmetto
Household Income Brackets in Palmetto
With 942 households falling in the category, the $50,000 to $74,999 income range is the most frequent in Palmetto, accounting for 19.0% of all households. In contrast, only 159 households (3.2%) fall into the less than $10,000 income bracket, making it the least populous group.
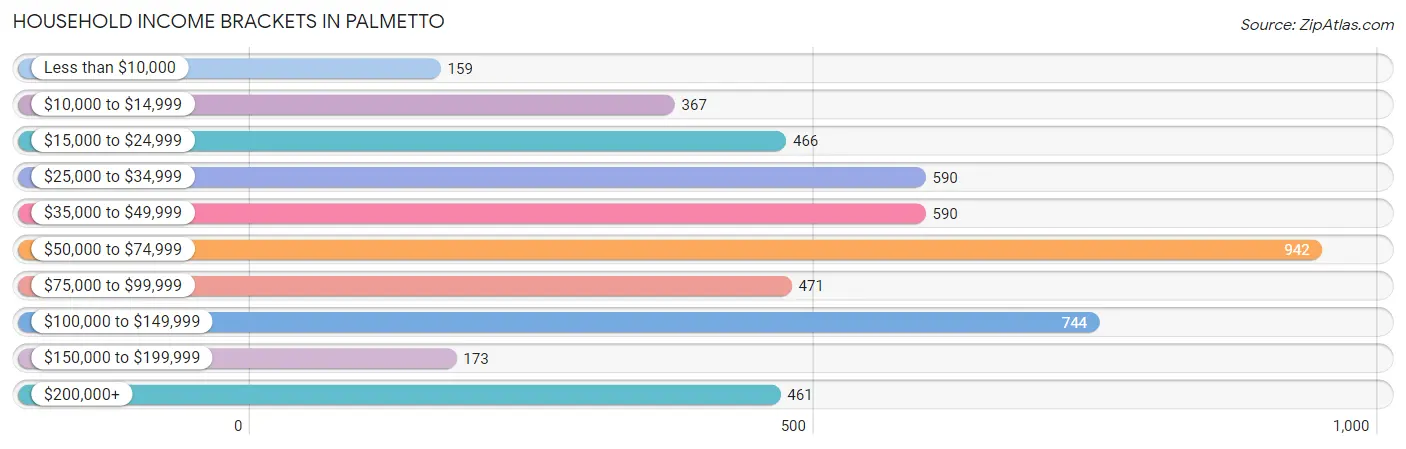
| Income Bracket | # Households | % Households |
| Less than $10,000 | 159 | 3.2% |
| $10,000 to $14,999 | 367 | 7.4% |
| $15,000 to $24,999 | 466 | 9.4% |
| $25,000 to $34,999 | 590 | 11.9% |
| $35,000 to $49,999 | 590 | 11.9% |
| $50,000 to $74,999 | 942 | 19.0% |
| $75,000 to $99,999 | 471 | 9.5% |
| $100,000 to $149,999 | 744 | 15.0% |
| $150,000 to $199,999 | 173 | 3.5% |
| $200,000+ | 461 | 9.3% |
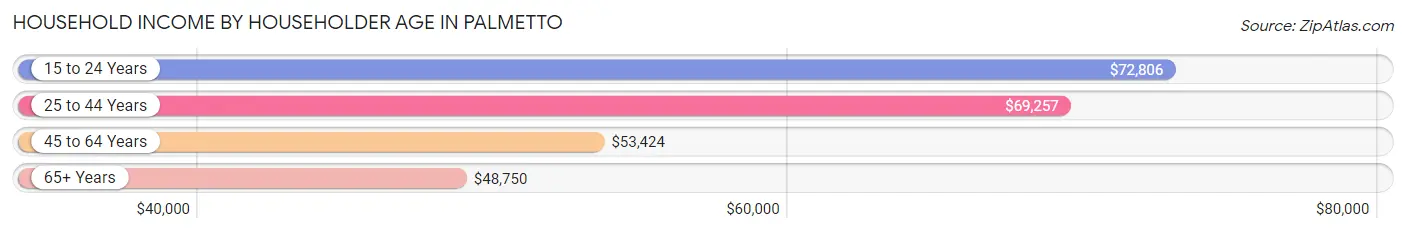
Household Income by Householder Age in Palmetto
The median household income in Palmetto is $55,584, with the highest median household income of $72,806 found in the 15 to 24 years age bracket for the primary householder. A total of 86 households (1.7%) fall into this category. Meanwhile, the 65+ years age bracket for the primary householder has the lowest median household income of $48,750, with 1,970 households (39.7%) in this group.
| Income Bracket | # Households | Median Income |
| 15 to 24 Years | 86 (1.7%) | $72,806 |
| 25 to 44 Years | 848 (17.1%) | $69,257 |
| 45 to 64 Years | 2,053 (41.4%) | $53,424 |
| 65+ Years | 1,970 (39.7%) | $48,750 |
| Total | 4,957 (100.0%) | $55,584 |
Poverty in Palmetto
Income Below Poverty by Sex and Age in Palmetto
With 15.2% poverty level for males and 19.1% for females among the residents of Palmetto, under 5 year old males and 16 and 17 year old females are the most vulnerable to poverty, with 161 males (54.0%) and 3 females (100.0%) in their respective age groups living below the poverty level.
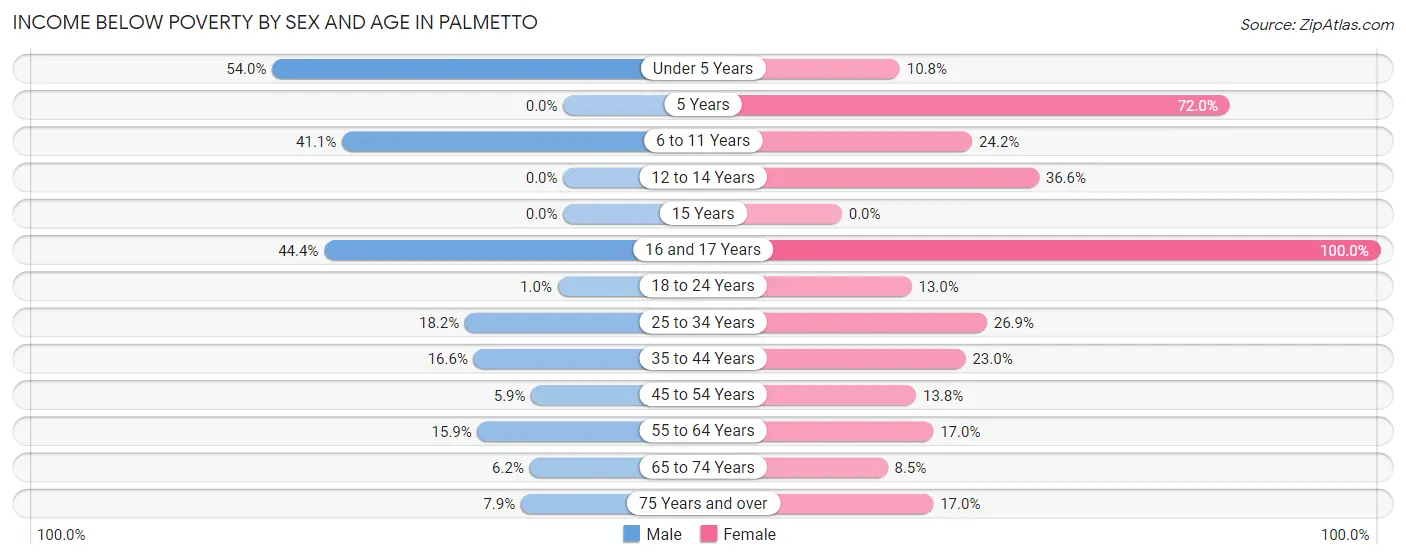
| Age Bracket | Male | Female |
| Under 5 Years | 161 (54.0%) | 44 (10.8%) |
| 5 Years | 0 (0.0%) | 144 (72.0%) |
| 6 to 11 Years | 184 (41.1%) | 98 (24.2%) |
| 12 to 14 Years | 0 (0.0%) | 98 (36.6%) |
| 15 Years | 0 (0.0%) | 0 (0.0%) |
| 16 and 17 Years | 83 (44.4%) | 3 (100.0%) |
| 18 to 24 Years | 6 (1.0%) | 36 (13.0%) |
| 25 to 34 Years | 160 (18.2%) | 168 (26.9%) |
| 35 to 44 Years | 78 (16.6%) | 149 (23.0%) |
| 45 to 54 Years | 47 (5.9%) | 85 (13.8%) |
| 55 to 64 Years | 156 (15.9%) | 198 (17.0%) |
| 65 to 74 Years | 39 (6.2%) | 91 (8.5%) |
| 75 Years and over | 66 (7.9%) | 185 (17.0%) |
| Total | 980 (15.2%) | 1,299 (19.1%) |
Income Above Poverty by Sex and Age in Palmetto
According to the poverty statistics in Palmetto, males aged 5 years and females aged 15 years are the age groups that are most secure financially, with 100.0% of males and 100.0% of females in these age groups living above the poverty line.
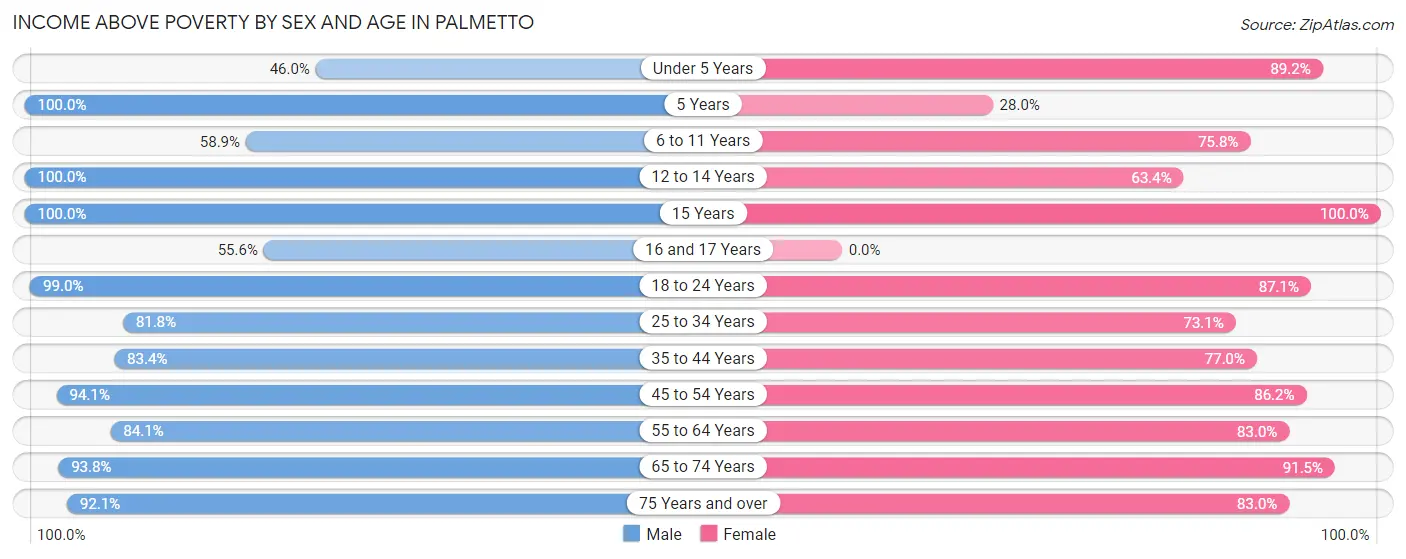
| Age Bracket | Male | Female |
| Under 5 Years | 137 (46.0%) | 364 (89.2%) |
| 5 Years | 64 (100.0%) | 56 (28.0%) |
| 6 to 11 Years | 264 (58.9%) | 307 (75.8%) |
| 12 to 14 Years | 178 (100.0%) | 170 (63.4%) |
| 15 Years | 105 (100.0%) | 19 (100.0%) |
| 16 and 17 Years | 104 (55.6%) | 0 (0.0%) |
| 18 to 24 Years | 572 (99.0%) | 242 (87.1%) |
| 25 to 34 Years | 717 (81.8%) | 456 (73.1%) |
| 35 to 44 Years | 391 (83.4%) | 500 (77.0%) |
| 45 to 54 Years | 744 (94.1%) | 532 (86.2%) |
| 55 to 64 Years | 823 (84.1%) | 969 (83.0%) |
| 65 to 74 Years | 586 (93.8%) | 981 (91.5%) |
| 75 Years and over | 774 (92.1%) | 905 (83.0%) |
| Total | 5,459 (84.8%) | 5,501 (80.9%) |
Income Below Poverty Among Married-Couple Families in Palmetto
The poverty statistics for married-couple families in Palmetto show that 9.3% or 224 of the total 2,420 families live below the poverty line. Families with 3 or 4 children have the highest poverty rate of 31.9%, comprising of 38 families. On the other hand, families with 1 or 2 children have the lowest poverty rate of 0.0%, which includes 0 families.
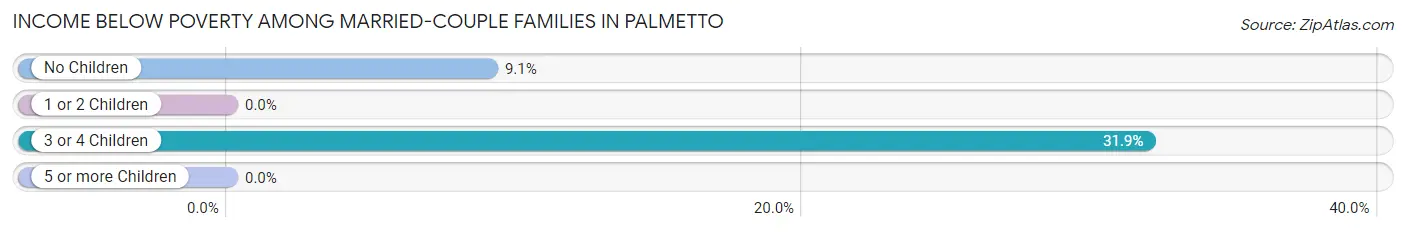
| Children | Above Poverty | Below Poverty |
| No Children | 1,869 (90.9%) | 186 (9.0%) |
| 1 or 2 Children | 181 (100.0%) | 0 (0.0%) |
| 3 or 4 Children | 81 (68.1%) | 38 (31.9%) |
| 5 or more Children | 65 (100.0%) | 0 (0.0%) |
| Total | 2,196 (90.7%) | 224 (9.3%) |
Income Below Poverty Among Single-Parent Households in Palmetto
According to the poverty data in Palmetto, 3.2% or 7 single-father households and 20.5% or 140 single-mother households are living below the poverty line. Among single-father households, those with no children have the highest poverty rate, with 7 households (7.8%) experiencing poverty. Likewise, among single-mother households, those with 5 or more children have the highest poverty rate, with 40 households (100.0%) falling below the poverty line.
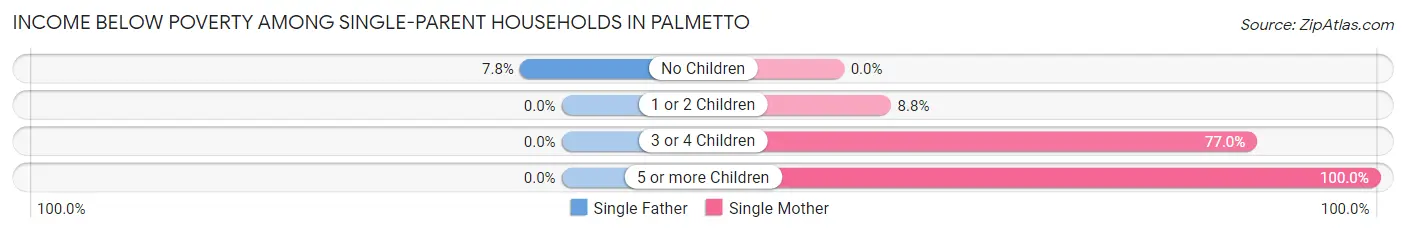
| Children | Single Father | Single Mother |
| No Children | 7 (7.8%) | 0 (0.0%) |
| 1 or 2 Children | 0 (0.0%) | 23 (8.7%) |
| 3 or 4 Children | 0 (0.0%) | 77 (77.0%) |
| 5 or more Children | 0 (0.0%) | 40 (100.0%) |
| Total | 7 (3.2%) | 140 (20.5%) |
Income Below Poverty Among Married-Couple vs Single-Parent Households in Palmetto
The poverty data for Palmetto shows that 224 of the married-couple family households (9.3%) and 147 of the single-parent households (16.2%) are living below the poverty level. Within the married-couple family households, those with 3 or 4 children have the highest poverty rate, with 38 households (31.9%) falling below the poverty line. Among the single-parent households, those with 5 or more children have the highest poverty rate, with 40 household (100.0%) living below poverty.
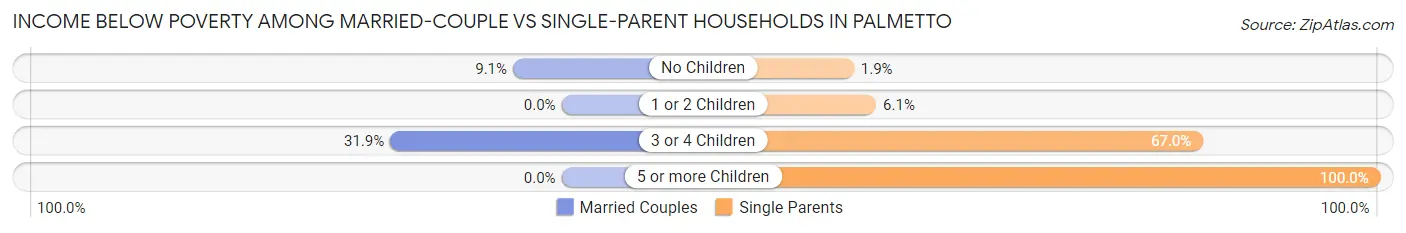
| Children | Married-Couple Families | Single-Parent Households |
| No Children | 186 (9.0%) | 7 (1.9%) |
| 1 or 2 Children | 0 (0.0%) | 23 (6.0%) |
| 3 or 4 Children | 38 (31.9%) | 77 (67.0%) |
| 5 or more Children | 0 (0.0%) | 40 (100.0%) |
| Total | 224 (9.3%) | 147 (16.2%) |
Race in Palmetto
The most populous races in Palmetto are White / Caucasian (9,878 | 73.8%), Hispanic or Latino (2,891 | 21.6%), and Black / African American (2,053 | 15.3%).
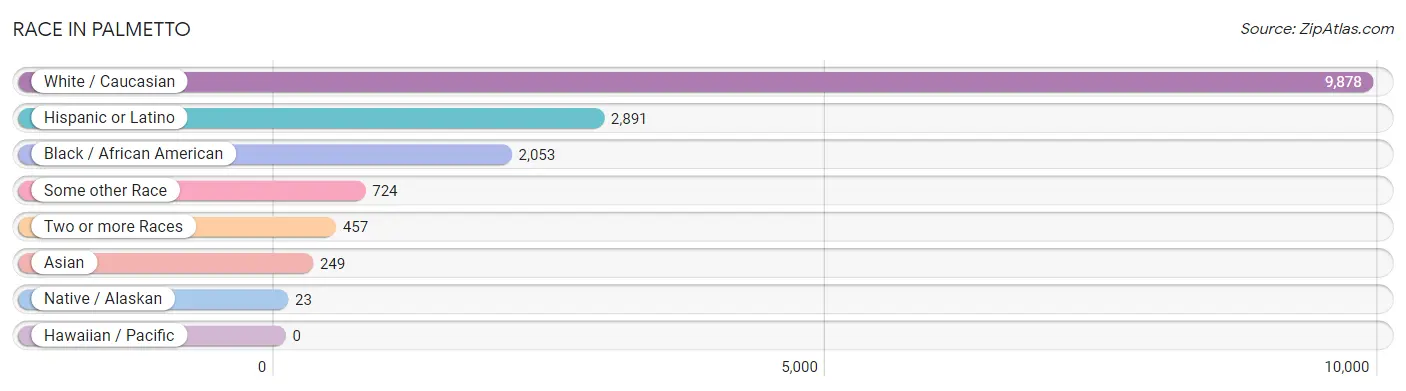
| Race | # Population | % Population |
| Asian | 249 | 1.9% |
| Black / African American | 2,053 | 15.3% |
| Hawaiian / Pacific | 0 | 0.0% |
| Hispanic or Latino | 2,891 | 21.6% |
| Native / Alaskan | 23 | 0.2% |
| White / Caucasian | 9,878 | 73.8% |
| Two or more Races | 457 | 3.4% |
| Some other Race | 724 | 5.4% |
| Total | 13,384 | 100.0% |
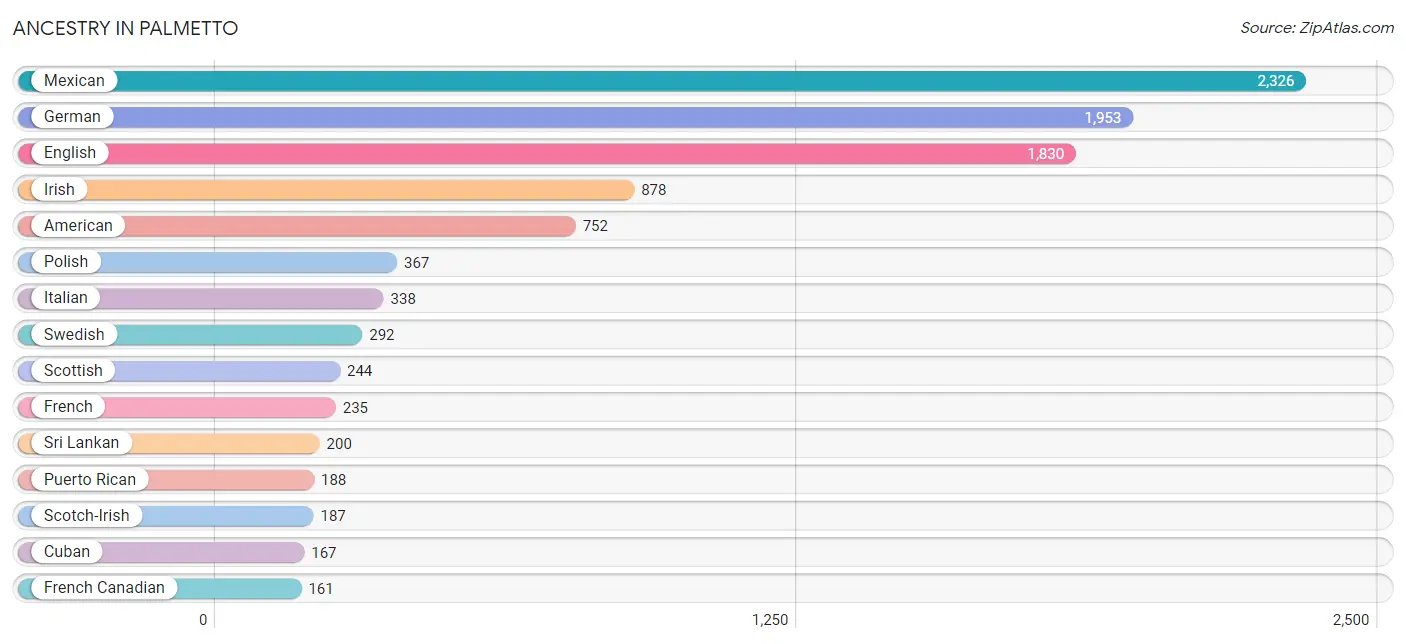
Ancestry in Palmetto
The most populous ancestries reported in Palmetto are Mexican (2,326 | 17.4%), German (1,953 | 14.6%), English (1,830 | 13.7%), Irish (878 | 6.6%), and American (752 | 5.6%), together accounting for 57.8% of all Palmetto residents.
| Ancestry | # Population | % Population |
| American | 752 | 5.6% |
| Arab | 25 | 0.2% |
| Austrian | 31 | 0.2% |
| Belgian | 37 | 0.3% |
| British | 108 | 0.8% |
| Burmese | 5 | 0.0% |
| Canadian | 17 | 0.1% |
| Central American | 3 | 0.0% |
| Colombian | 43 | 0.3% |
| Croatian | 21 | 0.2% |
| Cuban | 167 | 1.3% |
| Czech | 28 | 0.2% |
| Czechoslovakian | 11 | 0.1% |
| Danish | 16 | 0.1% |
| Dominican | 37 | 0.3% |
| Dutch | 137 | 1.0% |
| Ecuadorian | 23 | 0.2% |
| English | 1,830 | 13.7% |
| European | 110 | 0.8% |
| Finnish | 58 | 0.4% |
| French | 235 | 1.8% |
| French Canadian | 161 | 1.2% |
| German | 1,953 | 14.6% |
| Greek | 33 | 0.3% |
| Hungarian | 75 | 0.6% |
| Indian (Asian) | 14 | 0.1% |
| Irish | 878 | 6.6% |
| Israeli | 13 | 0.1% |
| Italian | 338 | 2.5% |
| Korean | 6 | 0.0% |
| Lebanese | 15 | 0.1% |
| Luxembourger | 9 | 0.1% |
| Mexican | 2,326 | 17.4% |
| Mexican American Indian | 15 | 0.1% |
| Nicaraguan | 3 | 0.0% |
| Norwegian | 85 | 0.6% |
| Palestinian | 10 | 0.1% |
| Polish | 367 | 2.7% |
| Puerto Rican | 188 | 1.4% |
| Russian | 7 | 0.1% |
| Scandinavian | 13 | 0.1% |
| Scotch-Irish | 187 | 1.4% |
| Scottish | 244 | 1.8% |
| Serbian | 18 | 0.1% |
| Slavic | 6 | 0.0% |
| Slovak | 51 | 0.4% |
| South American | 66 | 0.5% |
| Spaniard | 12 | 0.1% |
| Spanish | 44 | 0.3% |
| Sri Lankan | 200 | 1.5% |
| Swedish | 292 | 2.2% |
| Swiss | 9 | 0.1% |
| Thai | 151 | 1.1% |
| Turkish | 16 | 0.1% |
| Ukrainian | 56 | 0.4% |
| Welsh | 39 | 0.3% | View All 56 Rows |
Immigrants in Palmetto
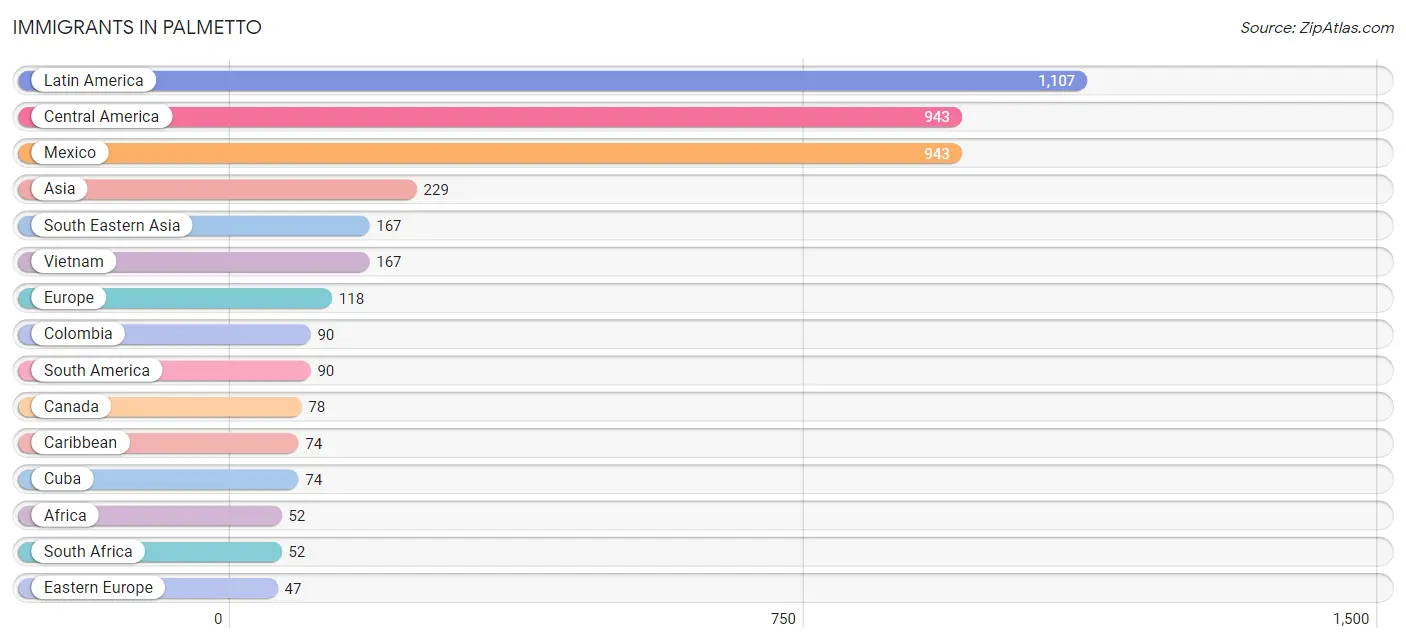
The most numerous immigrant groups reported in Palmetto came from Latin America (1,107 | 8.3%), Central America (943 | 7.0%), Mexico (943 | 7.0%), Asia (229 | 1.7%), and South Eastern Asia (167 | 1.3%), together accounting for 25.3% of all Palmetto residents.
| Immigration Origin | # Population | % Population |
| Africa | 52 | 0.4% |
| Asia | 229 | 1.7% |
| Canada | 78 | 0.6% |
| Caribbean | 74 | 0.5% |
| Central America | 943 | 7.0% |
| Colombia | 90 | 0.7% |
| Cuba | 74 | 0.5% |
| Eastern Asia | 5 | 0.0% |
| Eastern Europe | 47 | 0.4% |
| England | 25 | 0.2% |
| Europe | 118 | 0.9% |
| Germany | 37 | 0.3% |
| Israel | 13 | 0.1% |
| Kazakhstan | 18 | 0.1% |
| Korea | 5 | 0.0% |
| Latin America | 1,107 | 8.3% |
| Mexico | 943 | 7.0% |
| Netherlands | 9 | 0.1% |
| Northern Europe | 25 | 0.2% |
| Poland | 4 | 0.0% |
| Russia | 17 | 0.1% |
| South Africa | 52 | 0.4% |
| South America | 90 | 0.7% |
| South Central Asia | 18 | 0.1% |
| South Eastern Asia | 167 | 1.3% |
| Turkey | 16 | 0.1% |
| Ukraine | 26 | 0.2% |
| Vietnam | 167 | 1.3% |
| Western Asia | 29 | 0.2% |
| Western Europe | 46 | 0.3% | View All 30 Rows |
Sex and Age in Palmetto
Sex and Age in Palmetto
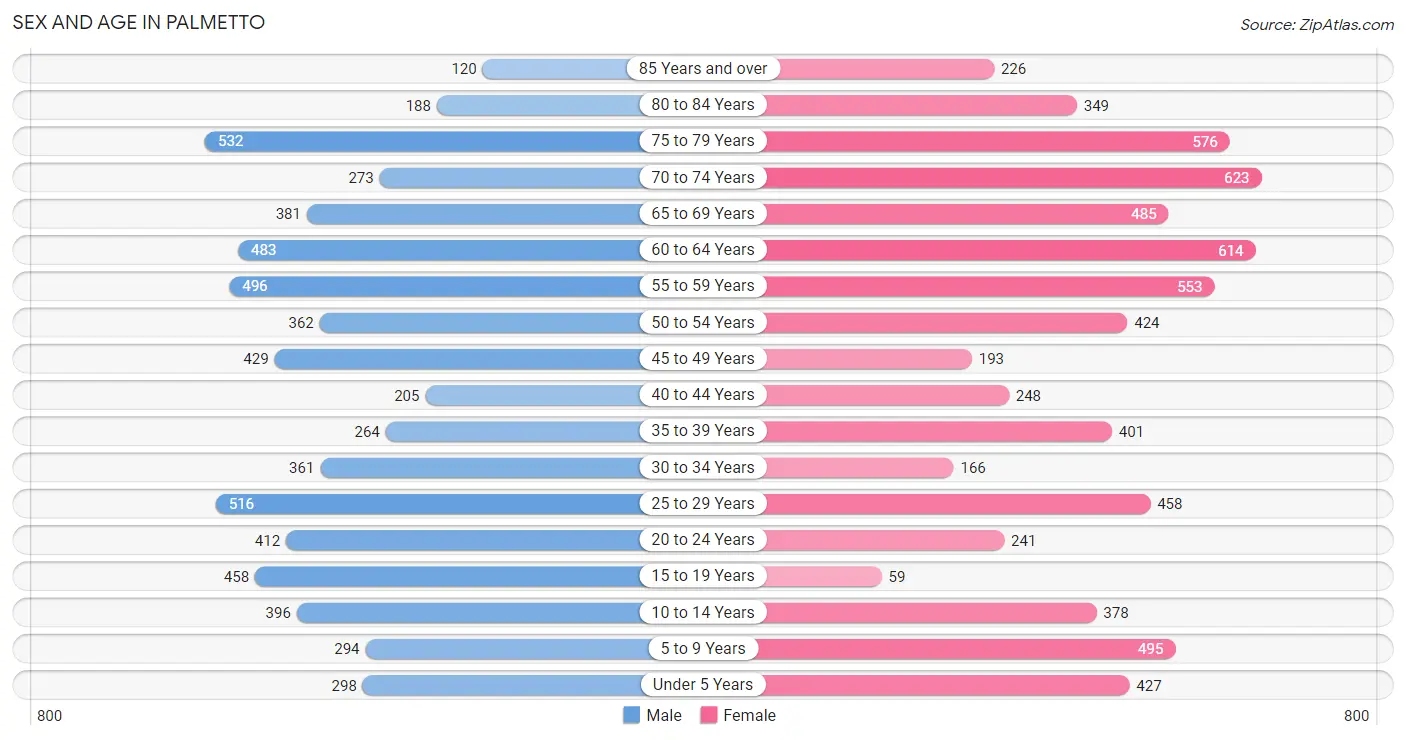
The most populous age groups in Palmetto are 75 to 79 Years (532 | 8.2%) for men and 70 to 74 Years (623 | 9.0%) for women.
| Age Bracket | Male | Female |
| Under 5 Years | 298 (4.6%) | 427 (6.2%) |
| 5 to 9 Years | 294 (4.5%) | 495 (7.2%) |
| 10 to 14 Years | 396 (6.1%) | 378 (5.5%) |
| 15 to 19 Years | 458 (7.1%) | 59 (0.9%) |
| 20 to 24 Years | 412 (6.4%) | 241 (3.5%) |
| 25 to 29 Years | 516 (8.0%) | 458 (6.6%) |
| 30 to 34 Years | 361 (5.6%) | 166 (2.4%) |
| 35 to 39 Years | 264 (4.1%) | 401 (5.8%) |
| 40 to 44 Years | 205 (3.2%) | 248 (3.6%) |
| 45 to 49 Years | 429 (6.6%) | 193 (2.8%) |
| 50 to 54 Years | 362 (5.6%) | 424 (6.1%) |
| 55 to 59 Years | 496 (7.7%) | 553 (8.0%) |
| 60 to 64 Years | 483 (7.5%) | 614 (8.9%) |
| 65 to 69 Years | 381 (5.9%) | 485 (7.0%) |
| 70 to 74 Years | 273 (4.2%) | 623 (9.0%) |
| 75 to 79 Years | 532 (8.2%) | 576 (8.3%) |
| 80 to 84 Years | 188 (2.9%) | 349 (5.1%) |
| 85 Years and over | 120 (1.9%) | 226 (3.3%) |
| Total | 6,468 (100.0%) | 6,916 (100.0%) |
Families and Households in Palmetto
Median Family Size in Palmetto
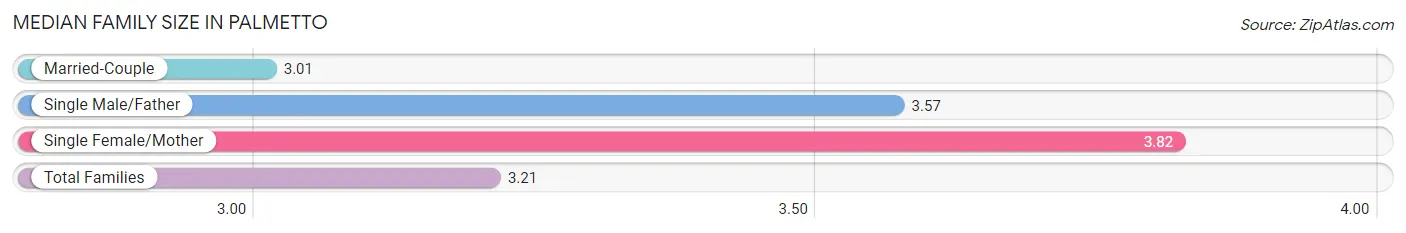
The median family size in Palmetto is 3.21 persons per family, with single female/mother families (684 | 20.6%) accounting for the largest median family size of 3.82 persons per family. On the other hand, married-couple families (2,420 | 72.8%) represent the smallest median family size with 3.01 persons per family.
| Family Type | # Families | Family Size |
| Married-Couple | 2,420 (72.8%) | 3.01 |
| Single Male/Father | 222 (6.7%) | 3.57 |
| Single Female/Mother | 684 (20.6%) | 3.82 |
| Total Families | 3,326 (100.0%) | 3.21 |
Median Household Size in Palmetto
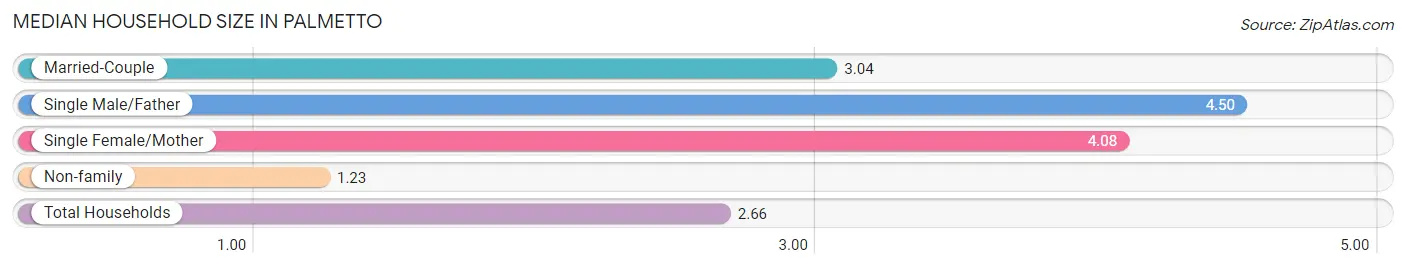
The median household size in Palmetto is 2.66 persons per household, with single male/father households (222 | 4.5%) accounting for the largest median household size of 4.5 persons per household. non-family households (1,631 | 32.9%) represent the smallest median household size with 1.23 persons per household.
| Household Type | # Households | Household Size |
| Married-Couple | 2,420 (48.8%) | 3.04 |
| Single Male/Father | 222 (4.5%) | 4.50 |
| Single Female/Mother | 684 (13.8%) | 4.08 |
| Non-family | 1,631 (32.9%) | 1.23 |
| Total Households | 4,957 (100.0%) | 2.66 |
Household Size by Marriage Status in Palmetto
Out of a total of 4,957 households in Palmetto, 3,326 (67.1%) are family households, while 1,631 (32.9%) are nonfamily households. The most numerous type of family households are 2-person households, comprising 1,980, and the most common type of nonfamily households are 1-person households, comprising 1,308.
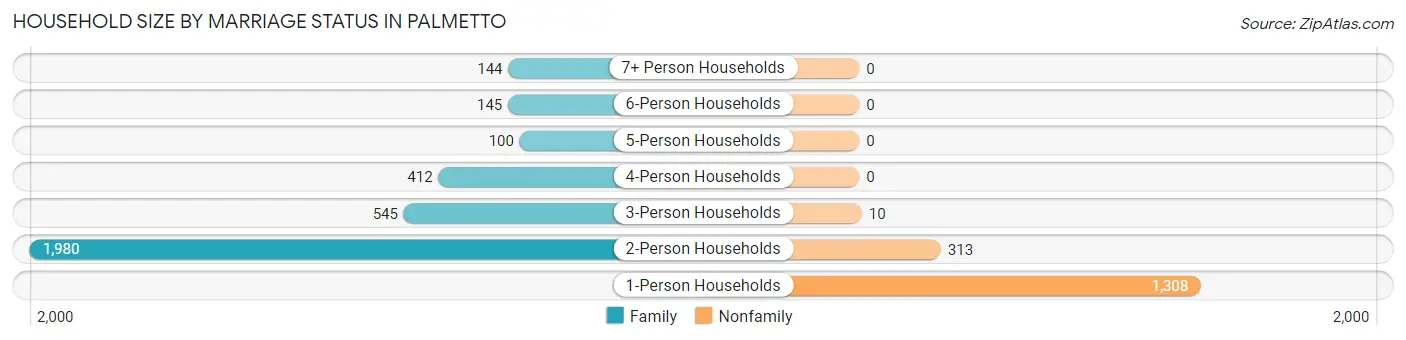
| Household Size | Family Households | Nonfamily Households |
| 1-Person Households | - | 1,308 (26.4%) |
| 2-Person Households | 1,980 (39.9%) | 313 (6.3%) |
| 3-Person Households | 545 (11.0%) | 10 (0.2%) |
| 4-Person Households | 412 (8.3%) | 0 (0.0%) |
| 5-Person Households | 100 (2.0%) | 0 (0.0%) |
| 6-Person Households | 145 (2.9%) | 0 (0.0%) |
| 7+ Person Households | 144 (2.9%) | 0 (0.0%) |
| Total | 3,326 (67.1%) | 1,631 (32.9%) |
Female Fertility in Palmetto
Fertility by Age in Palmetto
Average fertility rate in Palmetto is 107.0 births per 1,000 women. Women in the age bracket of 35 to 50 years have the highest fertility rate with 114.0 births per 1,000 women. Women in the age bracket of 35 to 50 years acount for 51.8% of all women with births.
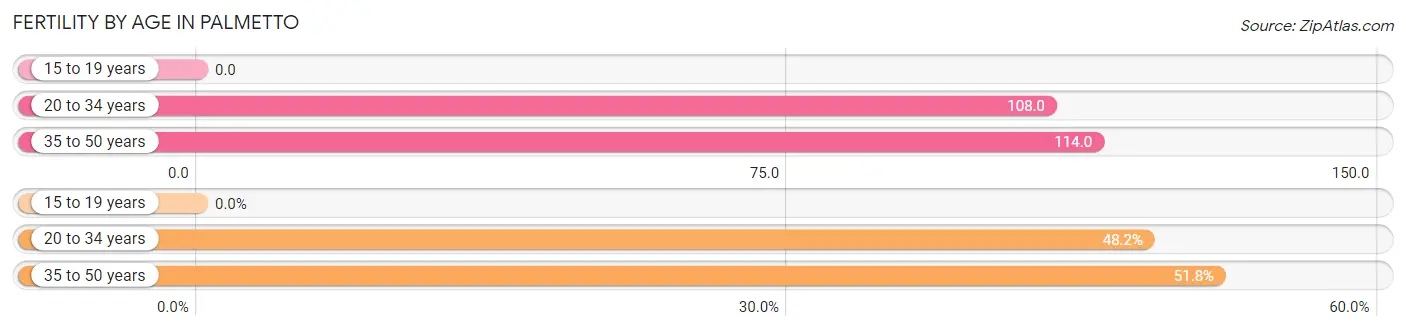
| Age Bracket | Women with Births | Births / 1,000 Women |
| 15 to 19 years | 0 (0.0%) | 0.0 |
| 20 to 34 years | 93 (48.2%) | 108.0 |
| 35 to 50 years | 100 (51.8%) | 114.0 |
| Total | 193 (100.0%) | 107.0 |
Fertility by Age by Marriage Status in Palmetto
33.2% of women with births (193) in Palmetto are married. The highest percentage of unmarried women with births falls into 20 to 34 years age bracket with 86.0% of them unmarried at the time of birth, while the lowest percentage of unmarried women with births belong to 35 to 50 years age bracket with 49.0% of them unmarried.
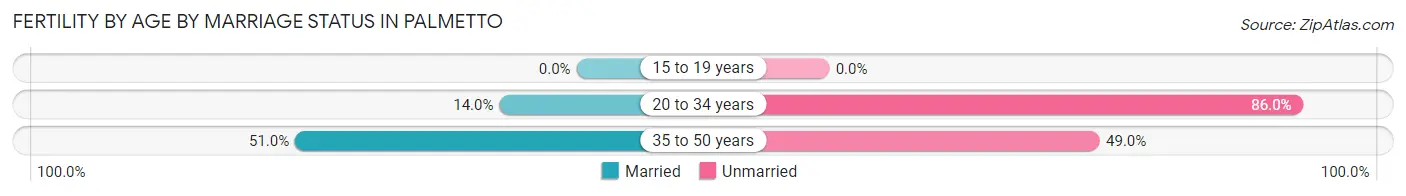
| Age Bracket | Married | Unmarried |
| 15 to 19 years | 0 (0.0%) | 0 (0.0%) |
| 20 to 34 years | 13 (14.0%) | 80 (86.0%) |
| 35 to 50 years | 51 (51.0%) | 49 (49.0%) |
| Total | 64 (33.2%) | 129 (66.8%) |
Fertility by Education in Palmetto
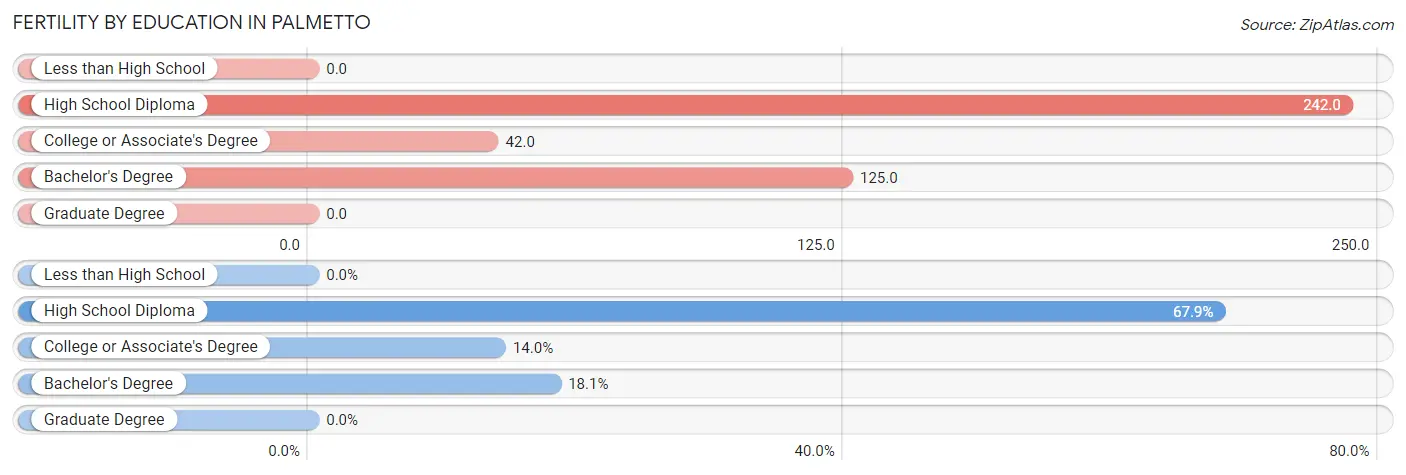
| Educational Attainment | Women with Births | Births / 1,000 Women |
| Less than High School | 0 (0.0%) | 0.0 |
| High School Diploma | 131 (67.9%) | 242.0 |
| College or Associate's Degree | 27 (14.0%) | 42.0 |
| Bachelor's Degree | 35 (18.1%) | 125.0 |
| Graduate Degree | 0 (0.0%) | 0.0 |
| Total | 193 (100.0%) | 107.0 |
Fertility by Education by Marriage Status in Palmetto
66.8% of women with births in Palmetto are unmarried. Women with the educational attainment of high school diploma are most likely to be married with 38.9% of them married at childbirth, while women with the educational attainment of college or associate's degree are least likely to be married with 100.0% of them unmarried at childbirth.
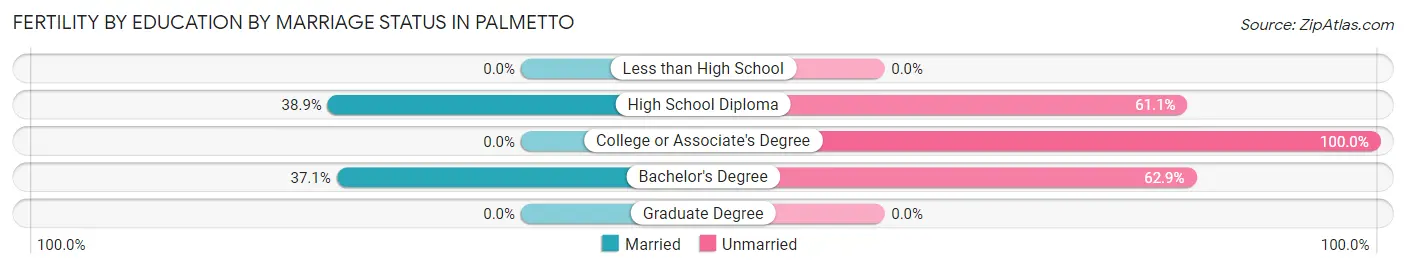
| Educational Attainment | Married | Unmarried |
| Less than High School | 0 (0.0%) | 0 (0.0%) |
| High School Diploma | 51 (38.9%) | 80 (61.1%) |
| College or Associate's Degree | 0 (0.0%) | 27 (100.0%) |
| Bachelor's Degree | 13 (37.1%) | 22 (62.9%) |
| Graduate Degree | 0 (0.0%) | 0 (0.0%) |
| Total | 64 (33.2%) | 129 (66.8%) |
Employment Characteristics in Palmetto
Employment by Class of Employer in Palmetto
Among the 5,462 employed individuals in Palmetto, private company employees (3,462 | 63.4%), not-for-profit organizations (596 | 10.9%), and self-employed (incorporated) (401 | 7.3%) make up the most common classes of employment.
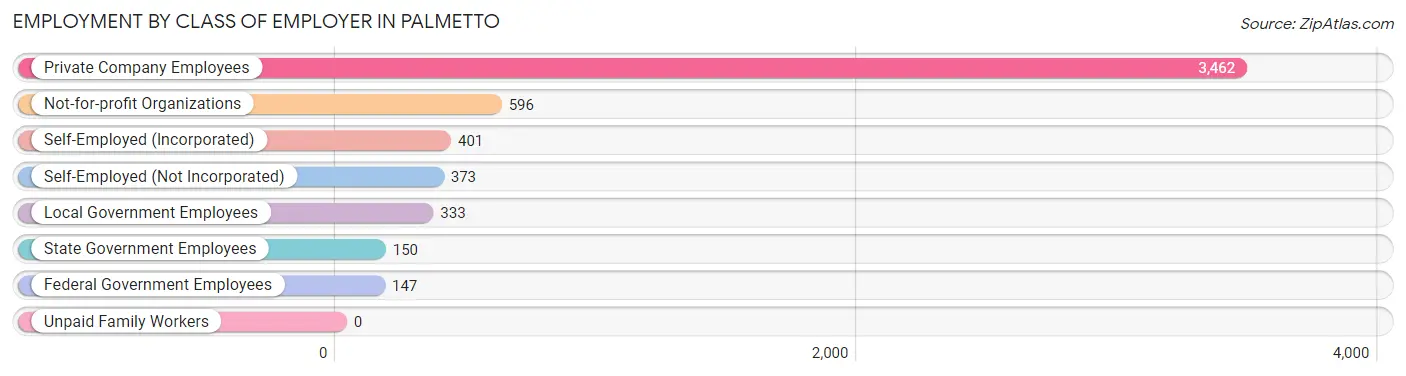
| Employer Class | # Employees | % Employees |
| Private Company Employees | 3,462 | 63.4% |
| Self-Employed (Incorporated) | 401 | 7.3% |
| Self-Employed (Not Incorporated) | 373 | 6.8% |
| Not-for-profit Organizations | 596 | 10.9% |
| Local Government Employees | 333 | 6.1% |
| State Government Employees | 150 | 2.8% |
| Federal Government Employees | 147 | 2.7% |
| Unpaid Family Workers | 0 | 0.0% |
| Total | 5,462 | 100.0% |
Employment Status by Age in Palmetto
According to the labor force statistics for Palmetto, out of the total population over 16 years of age (10,972), 53.4% or 5,859 individuals are in the labor force, with 6.7% or 393 of them unemployed. The age group with the highest labor force participation rate is 30 to 34 years, with 100.0% or 527 individuals in the labor force. Within the labor force, the 16 to 19 years age range has the highest percentage of unemployed individuals, with 19.2% or 49 of them being unemployed.
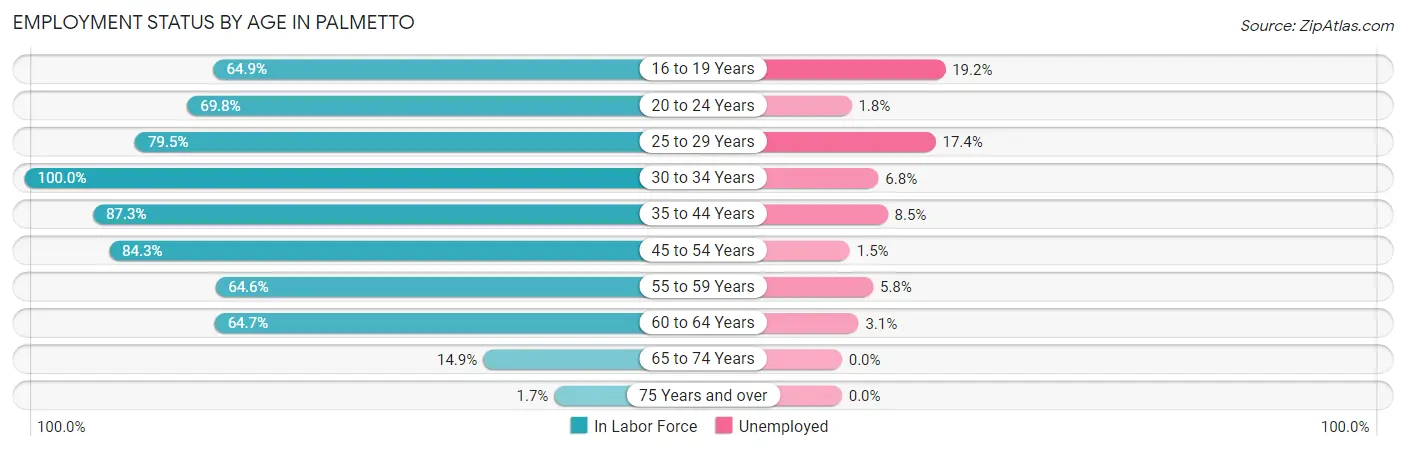
| Age Bracket | In Labor Force | Unemployed |
| 16 to 19 Years | 255 (64.9%) | 49 (19.2%) |
| 20 to 24 Years | 456 (69.8%) | 8 (1.8%) |
| 25 to 29 Years | 774 (79.5%) | 135 (17.4%) |
| 30 to 34 Years | 527 (100.0%) | 36 (6.8%) |
| 35 to 44 Years | 976 (87.3%) | 83 (8.5%) |
| 45 to 54 Years | 1,187 (84.3%) | 18 (1.5%) |
| 55 to 59 Years | 678 (64.6%) | 39 (5.8%) |
| 60 to 64 Years | 710 (64.7%) | 22 (3.1%) |
| 65 to 74 Years | 263 (14.9%) | 0 (0.0%) |
| 75 Years and over | 34 (1.7%) | 0 (0.0%) |
| Total | 5,859 (53.4%) | 393 (6.7%) |
Employment Status by Educational Attainment in Palmetto
According to labor force statistics for Palmetto, 78.6% of individuals (4,852) out of the total population between 25 and 64 years of age (6,173) are in the labor force, with 6.9% or 335 of them being unemployed. The group with the highest labor force participation rate are those with the educational attainment of bachelor's degree or higher, with 90.8% or 1,605 individuals in the labor force. Within the labor force, individuals with high school diploma education have the highest percentage of unemployment, with 16.1% or 214 of them being unemployed.
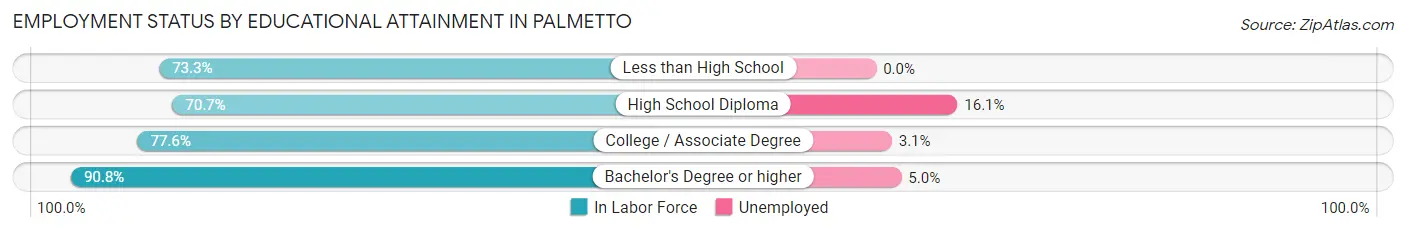
| Educational Attainment | In Labor Force | Unemployed |
| Less than High School | 698 (73.3%) | 0 (0.0%) |
| High School Diploma | 1,332 (70.7%) | 303 (16.1%) |
| College / Associate Degree | 1,218 (77.6%) | 49 (3.1%) |
| Bachelor's Degree or higher | 1,605 (90.8%) | 88 (5.0%) |
| Total | 4,852 (78.6%) | 426 (6.9%) |
Employment Occupations by Sex in Palmetto
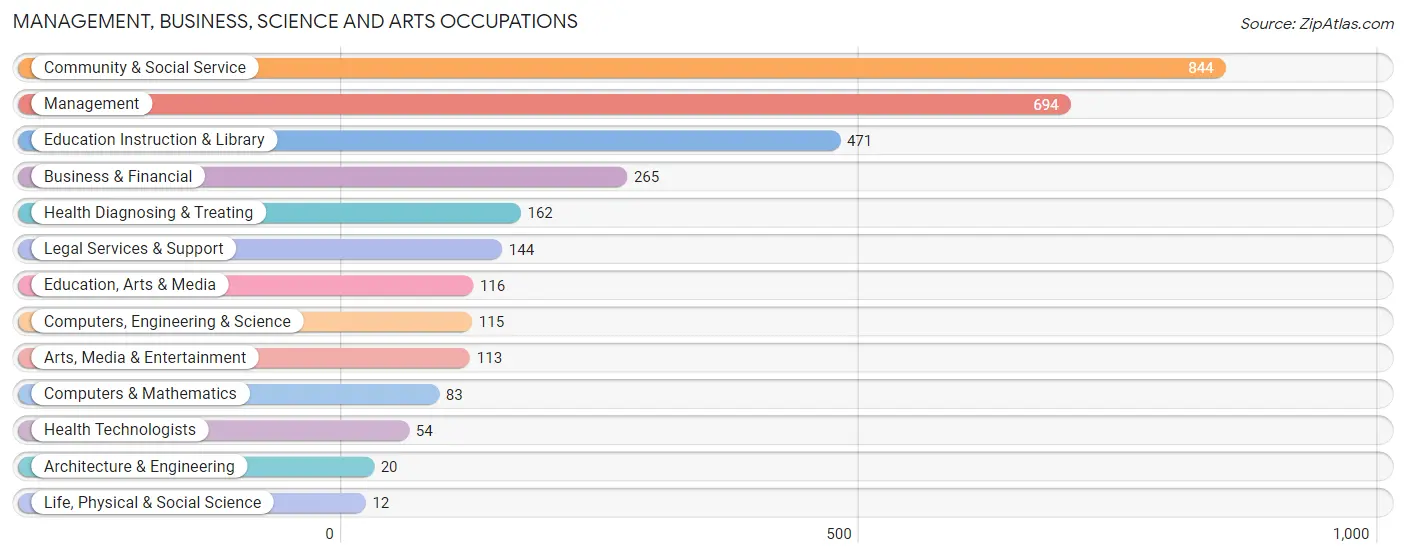
Management, Business, Science and Arts Occupations
The most common Management, Business, Science and Arts occupations in Palmetto are Community & Social Service (844 | 15.4%), Management (694 | 12.7%), Education Instruction & Library (471 | 8.6%), Business & Financial (265 | 4.9%), and Health Diagnosing & Treating (162 | 3.0%).
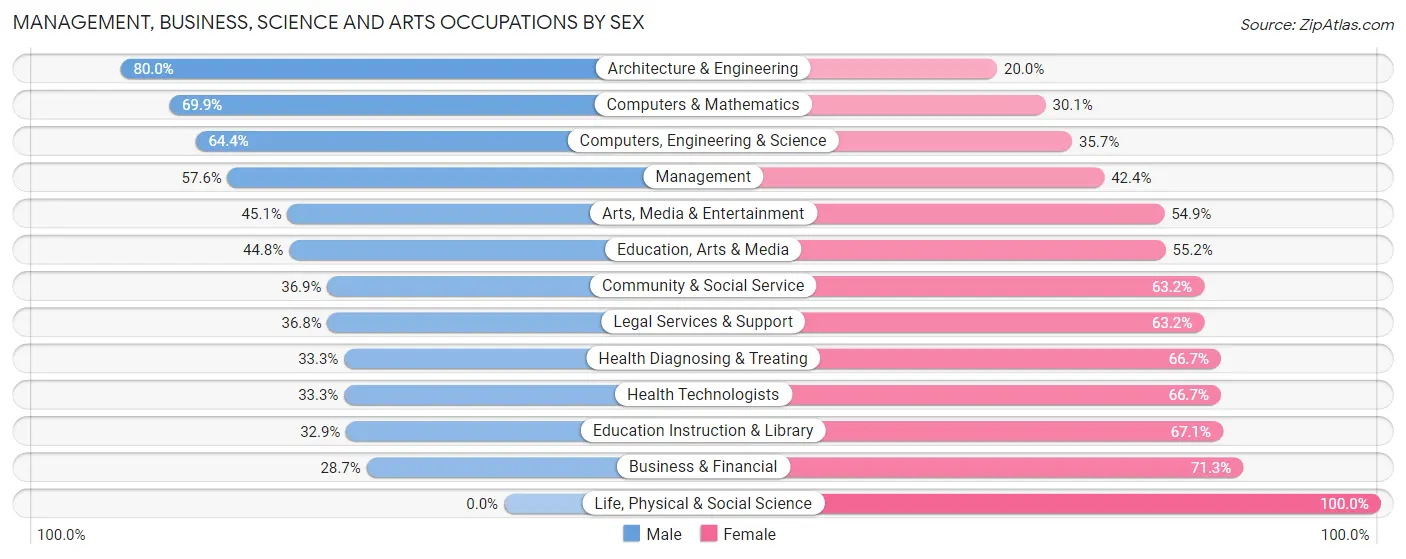
Management, Business, Science and Arts Occupations by Sex
Within the Management, Business, Science and Arts occupations in Palmetto, the most male-oriented occupations are Architecture & Engineering (80.0%), Computers & Mathematics (69.9%), and Computers, Engineering & Science (64.3%), while the most female-oriented occupations are Life, Physical & Social Science (100.0%), Business & Financial (71.3%), and Education Instruction & Library (67.1%).
| Occupation | Male | Female |
| Management | 400 (57.6%) | 294 (42.4%) |
| Business & Financial | 76 (28.7%) | 189 (71.3%) |
| Computers, Engineering & Science | 74 (64.3%) | 41 (35.6%) |
| Computers & Mathematics | 58 (69.9%) | 25 (30.1%) |
| Architecture & Engineering | 16 (80.0%) | 4 (20.0%) |
| Life, Physical & Social Science | 0 (0.0%) | 12 (100.0%) |
| Community & Social Service | 311 (36.8%) | 533 (63.1%) |
| Education, Arts & Media | 52 (44.8%) | 64 (55.2%) |
| Legal Services & Support | 53 (36.8%) | 91 (63.2%) |
| Education Instruction & Library | 155 (32.9%) | 316 (67.1%) |
| Arts, Media & Entertainment | 51 (45.1%) | 62 (54.9%) |
| Health Diagnosing & Treating | 54 (33.3%) | 108 (66.7%) |
| Health Technologists | 18 (33.3%) | 36 (66.7%) |
| Total (Category) | 915 (44.0%) | 1,165 (56.0%) |
| Total (Overall) | 3,151 (57.6%) | 2,318 (42.4%) |
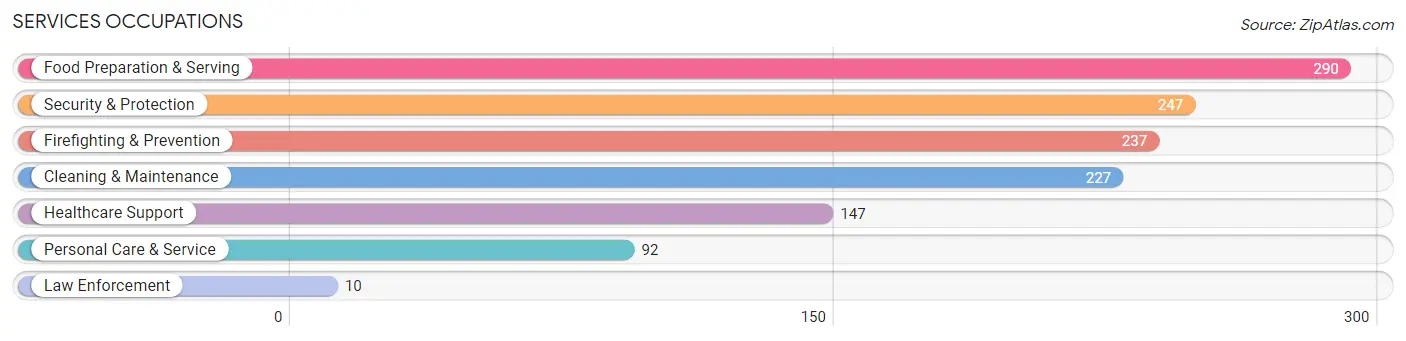
Services Occupations
The most common Services occupations in Palmetto are Food Preparation & Serving (290 | 5.3%), Security & Protection (247 | 4.5%), Firefighting & Prevention (237 | 4.3%), Cleaning & Maintenance (227 | 4.2%), and Healthcare Support (147 | 2.7%).
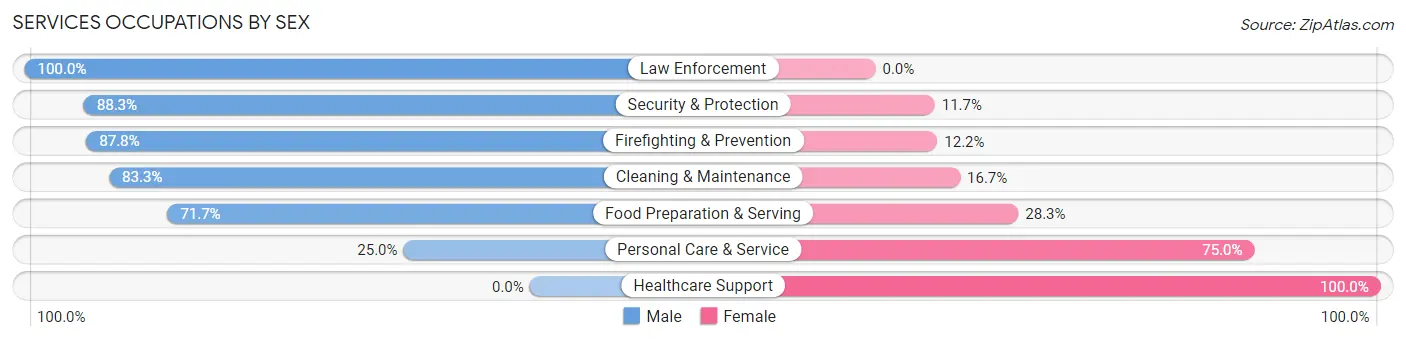
Services Occupations by Sex
Within the Services occupations in Palmetto, the most male-oriented occupations are Law Enforcement (100.0%), Security & Protection (88.3%), and Firefighting & Prevention (87.8%), while the most female-oriented occupations are Healthcare Support (100.0%), Personal Care & Service (75.0%), and Food Preparation & Serving (28.3%).
| Occupation | Male | Female |
| Healthcare Support | 0 (0.0%) | 147 (100.0%) |
| Security & Protection | 218 (88.3%) | 29 (11.7%) |
| Firefighting & Prevention | 208 (87.8%) | 29 (12.2%) |
| Law Enforcement | 10 (100.0%) | 0 (0.0%) |
| Food Preparation & Serving | 208 (71.7%) | 82 (28.3%) |
| Cleaning & Maintenance | 189 (83.3%) | 38 (16.7%) |
| Personal Care & Service | 23 (25.0%) | 69 (75.0%) |
| Total (Category) | 638 (63.6%) | 365 (36.4%) |
| Total (Overall) | 3,151 (57.6%) | 2,318 (42.4%) |
Sales and Office Occupations
The most common Sales and Office occupations in Palmetto are Sales & Related (630 | 11.5%), and Office & Administration (506 | 9.2%).
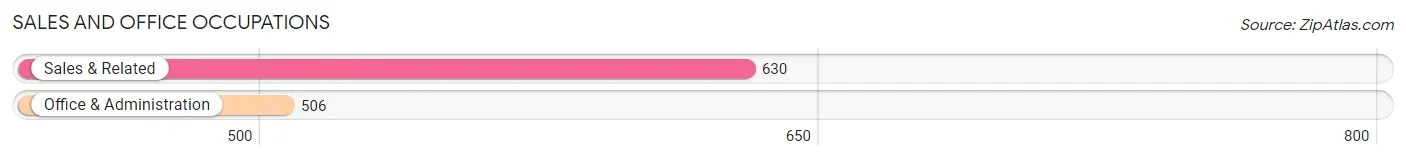
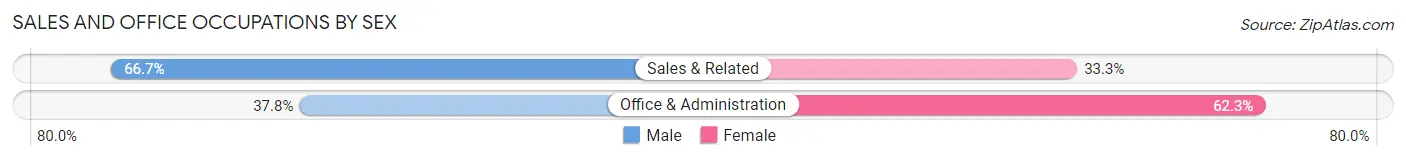
Sales and Office Occupations by Sex
| Occupation | Male | Female |
| Sales & Related | 420 (66.7%) | 210 (33.3%) |
| Office & Administration | 191 (37.8%) | 315 (62.3%) |
| Total (Category) | 611 (53.8%) | 525 (46.2%) |
| Total (Overall) | 3,151 (57.6%) | 2,318 (42.4%) |
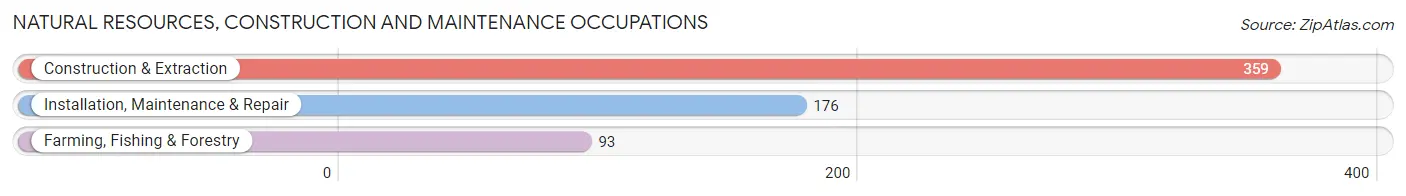
Natural Resources, Construction and Maintenance Occupations
The most common Natural Resources, Construction and Maintenance occupations in Palmetto are Construction & Extraction (359 | 6.6%), Installation, Maintenance & Repair (176 | 3.2%), and Farming, Fishing & Forestry (93 | 1.7%).
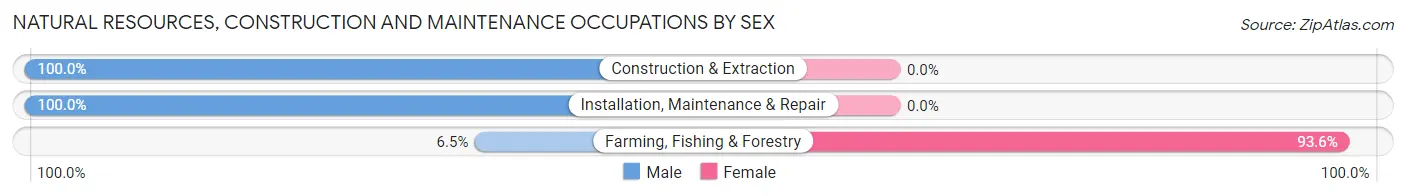
Natural Resources, Construction and Maintenance Occupations by Sex
| Occupation | Male | Female |
| Farming, Fishing & Forestry | 6 (6.5%) | 87 (93.5%) |
| Construction & Extraction | 359 (100.0%) | 0 (0.0%) |
| Installation, Maintenance & Repair | 176 (100.0%) | 0 (0.0%) |
| Total (Category) | 541 (86.2%) | 87 (13.9%) |
| Total (Overall) | 3,151 (57.6%) | 2,318 (42.4%) |
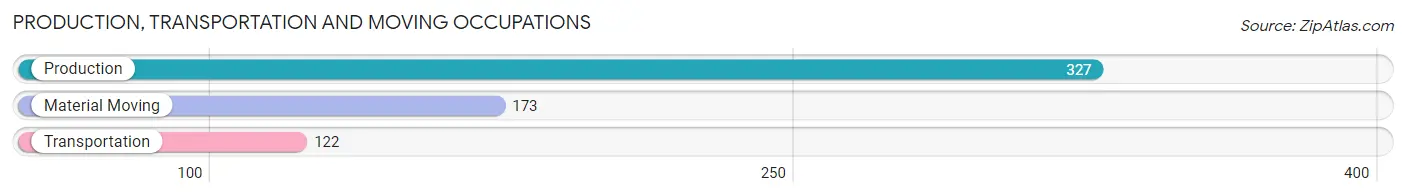
Production, Transportation and Moving Occupations
The most common Production, Transportation and Moving occupations in Palmetto are Production (327 | 6.0%), Material Moving (173 | 3.2%), and Transportation (122 | 2.2%).
Production, Transportation and Moving Occupations by Sex
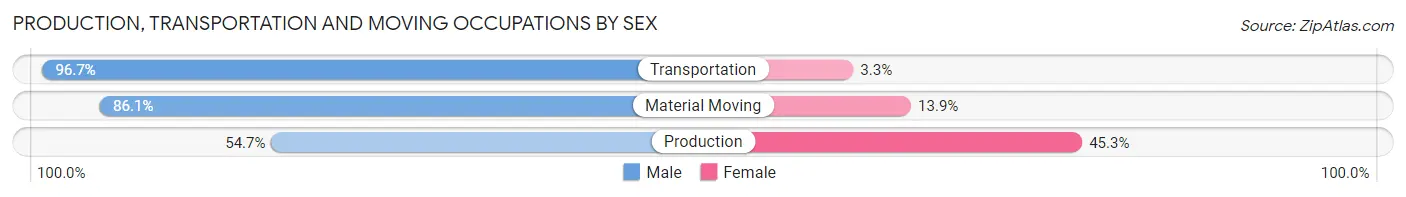
| Occupation | Male | Female |
| Production | 179 (54.7%) | 148 (45.3%) |
| Transportation | 118 (96.7%) | 4 (3.3%) |
| Material Moving | 149 (86.1%) | 24 (13.9%) |
| Total (Category) | 446 (71.7%) | 176 (28.3%) |
| Total (Overall) | 3,151 (57.6%) | 2,318 (42.4%) |
Employment Industries by Sex in Palmetto
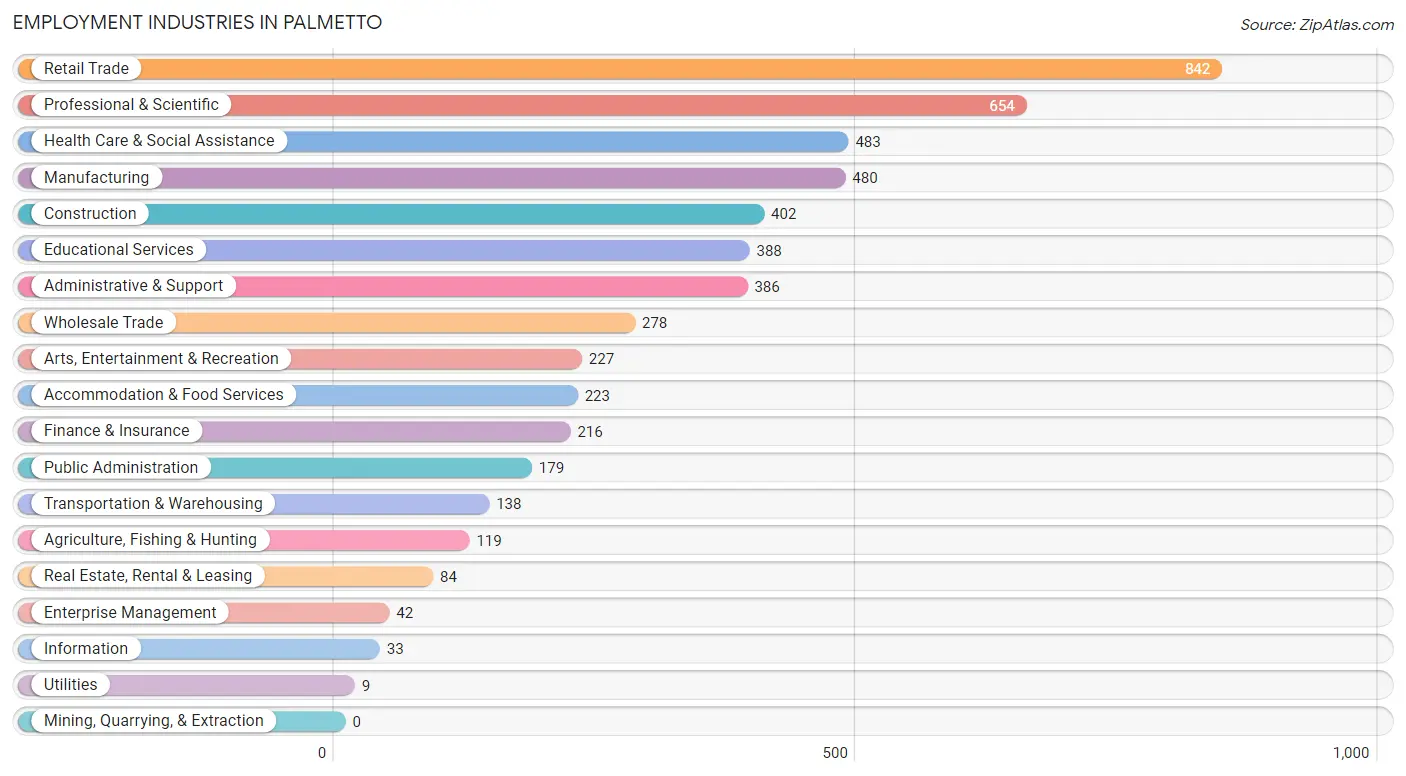
Employment Industries in Palmetto
The major employment industries in Palmetto include Retail Trade (842 | 15.4%), Professional & Scientific (654 | 12.0%), Health Care & Social Assistance (483 | 8.8%), Manufacturing (480 | 8.8%), and Construction (402 | 7.3%).
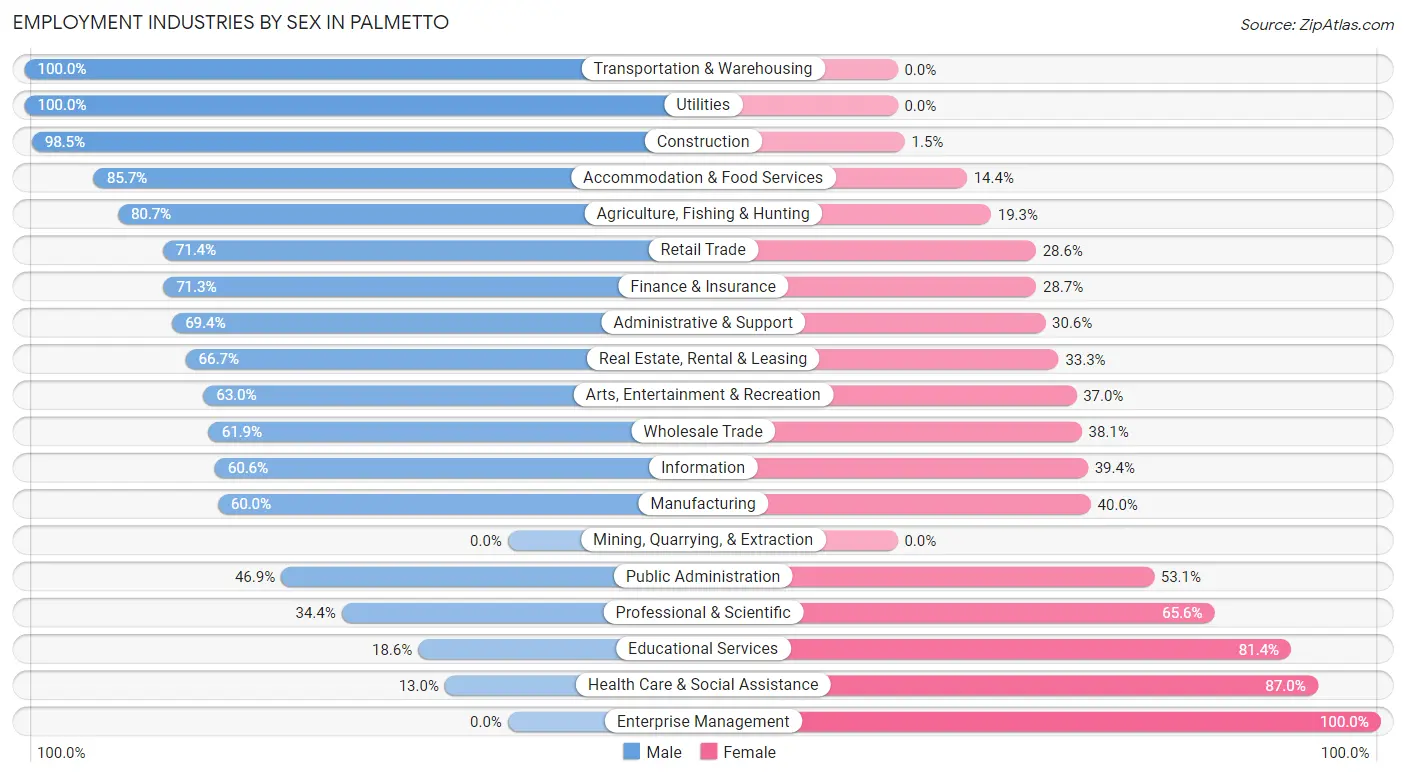
Employment Industries by Sex in Palmetto
The Palmetto industries that see more men than women are Transportation & Warehousing (100.0%), Utilities (100.0%), and Construction (98.5%), whereas the industries that tend to have a higher number of women are Enterprise Management (100.0%), Health Care & Social Assistance (87.0%), and Educational Services (81.4%).
| Industry | Male | Female |
| Agriculture, Fishing & Hunting | 96 (80.7%) | 23 (19.3%) |
| Mining, Quarrying, & Extraction | 0 (0.0%) | 0 (0.0%) |
| Construction | 396 (98.5%) | 6 (1.5%) |
| Manufacturing | 288 (60.0%) | 192 (40.0%) |
| Wholesale Trade | 172 (61.9%) | 106 (38.1%) |
| Retail Trade | 601 (71.4%) | 241 (28.6%) |
| Transportation & Warehousing | 138 (100.0%) | 0 (0.0%) |
| Utilities | 9 (100.0%) | 0 (0.0%) |
| Information | 20 (60.6%) | 13 (39.4%) |
| Finance & Insurance | 154 (71.3%) | 62 (28.7%) |
| Real Estate, Rental & Leasing | 56 (66.7%) | 28 (33.3%) |
| Professional & Scientific | 225 (34.4%) | 429 (65.6%) |
| Enterprise Management | 0 (0.0%) | 42 (100.0%) |
| Administrative & Support | 268 (69.4%) | 118 (30.6%) |
| Educational Services | 72 (18.6%) | 316 (81.4%) |
| Health Care & Social Assistance | 63 (13.0%) | 420 (87.0%) |
| Arts, Entertainment & Recreation | 143 (63.0%) | 84 (37.0%) |
| Accommodation & Food Services | 191 (85.7%) | 32 (14.3%) |
| Public Administration | 84 (46.9%) | 95 (53.1%) |
| Total | 3,151 (57.6%) | 2,318 (42.4%) |
Education in Palmetto
School Enrollment in Palmetto
The most common levels of schooling among the 2,492 students in Palmetto are elementary school (690 | 27.7%), middle school (508 | 20.4%), and high school (414 | 16.6%).
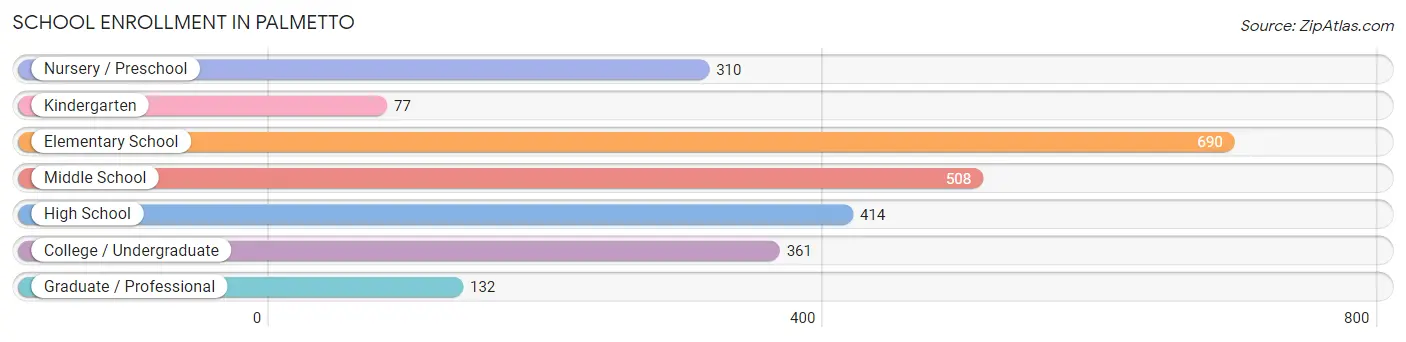
| School Level | # Students | % Students |
| Nursery / Preschool | 310 | 12.4% |
| Kindergarten | 77 | 3.1% |
| Elementary School | 690 | 27.7% |
| Middle School | 508 | 20.4% |
| High School | 414 | 16.6% |
| College / Undergraduate | 361 | 14.5% |
| Graduate / Professional | 132 | 5.3% |
| Total | 2,492 | 100.0% |
School Enrollment by Age by Funding Source in Palmetto
Out of a total of 2,492 students who are enrolled in schools in Palmetto, 299 (12.0%) attend a private institution, while the remaining 2,193 (88.0%) are enrolled in public schools. The age group of 25 to 34 year olds has the highest likelihood of being enrolled in private schools, with 64 (59.8% in the age bracket) enrolled. Conversely, the age group of 18 to 19 year olds has the lowest likelihood of being enrolled in a private school, with 85 (100.0% in the age bracket) attending a public institution.
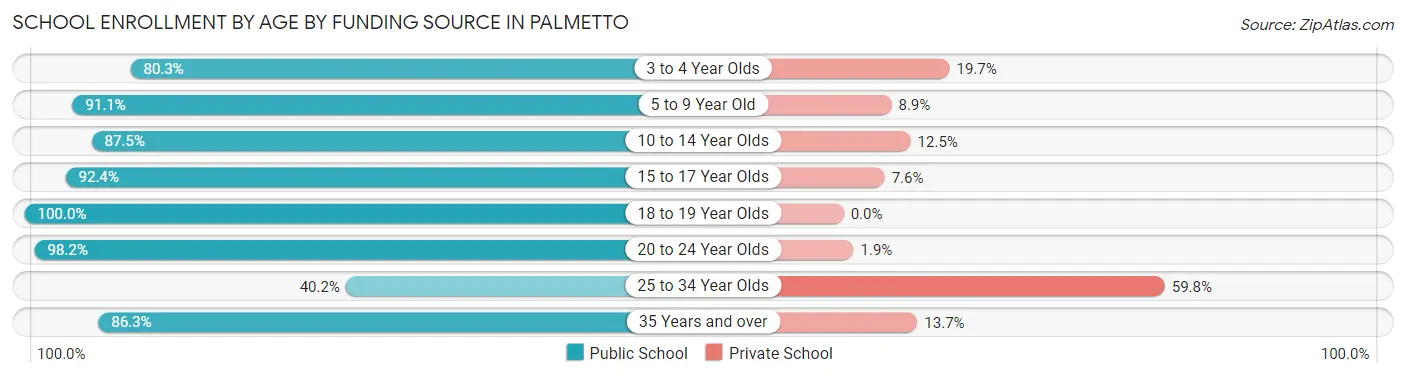
| Age Bracket | Public School | Private School |
| 3 to 4 Year Olds | 175 (80.3%) | 43 (19.7%) |
| 5 to 9 Year Old | 644 (91.1%) | 63 (8.9%) |
| 10 to 14 Year Olds | 603 (87.5%) | 86 (12.5%) |
| 15 to 17 Year Olds | 290 (92.4%) | 24 (7.6%) |
| 18 to 19 Year Olds | 85 (100.0%) | 0 (0.0%) |
| 20 to 24 Year Olds | 265 (98.2%) | 5 (1.8%) |
| 25 to 34 Year Olds | 43 (40.2%) | 64 (59.8%) |
| 35 Years and over | 88 (86.3%) | 14 (13.7%) |
| Total | 2,193 (88.0%) | 299 (12.0%) |
Educational Attainment by Field of Study in Palmetto
Business (630 | 22.1%), education (434 | 15.2%), science & technology (401 | 14.1%), social sciences (228 | 8.0%), and bio, nature & agricultural (181 | 6.4%) are the most common fields of study among 2,849 individuals in Palmetto who have obtained a bachelor's degree or higher.
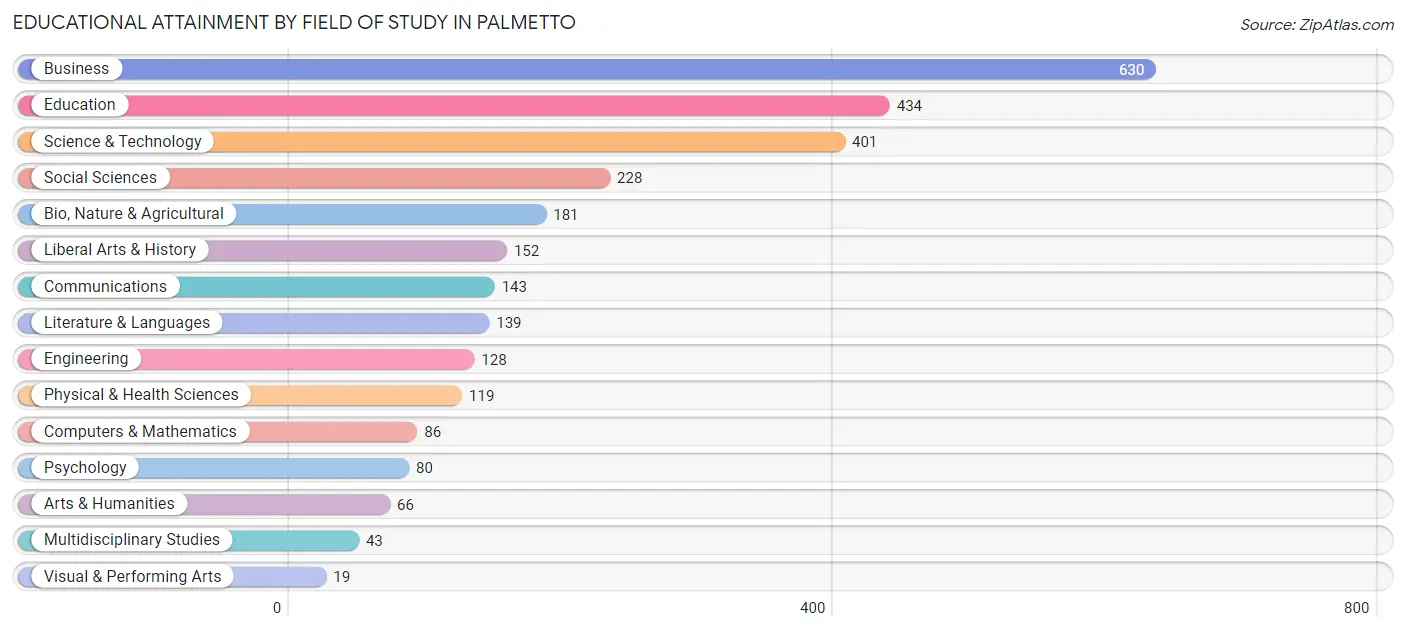
| Field of Study | # Graduates | % Graduates |
| Computers & Mathematics | 86 | 3.0% |
| Bio, Nature & Agricultural | 181 | 6.4% |
| Physical & Health Sciences | 119 | 4.2% |
| Psychology | 80 | 2.8% |
| Social Sciences | 228 | 8.0% |
| Engineering | 128 | 4.5% |
| Multidisciplinary Studies | 43 | 1.5% |
| Science & Technology | 401 | 14.1% |
| Business | 630 | 22.1% |
| Education | 434 | 15.2% |
| Literature & Languages | 139 | 4.9% |
| Liberal Arts & History | 152 | 5.3% |
| Visual & Performing Arts | 19 | 0.7% |
| Communications | 143 | 5.0% |
| Arts & Humanities | 66 | 2.3% |
| Total | 2,849 | 100.0% |
Transportation & Commute in Palmetto
Vehicle Availability by Sex in Palmetto
The most prevalent vehicle ownership categories in Palmetto are males with 2 vehicles (1,370, accounting for 44.0%) and females with 2 vehicles (958, making up 59.7%).
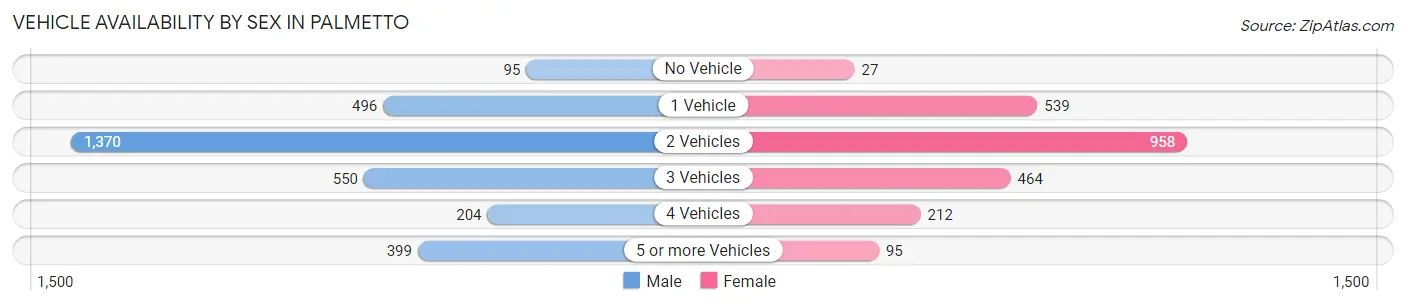
| Vehicles Available | Male | Female |
| No Vehicle | 95 (3.0%) | 27 (1.2%) |
| 1 Vehicle | 496 (15.9%) | 539 (23.5%) |
| 2 Vehicles | 1,370 (44.0%) | 958 (41.7%) |
| 3 Vehicles | 550 (17.7%) | 464 (20.2%) |
| 4 Vehicles | 204 (6.6%) | 212 (9.2%) |
| 5 or more Vehicles | 399 (12.8%) | 95 (4.1%) |
| Total | 3,114 (100.0%) | 2,295 (100.0%) |
Commute Time in Palmetto
The most frequently occuring commute durations in Palmetto are 20 to 24 minutes (880 commuters, 18.4%), 10 to 14 minutes (696 commuters, 14.6%), and 15 to 19 minutes (635 commuters, 13.3%).
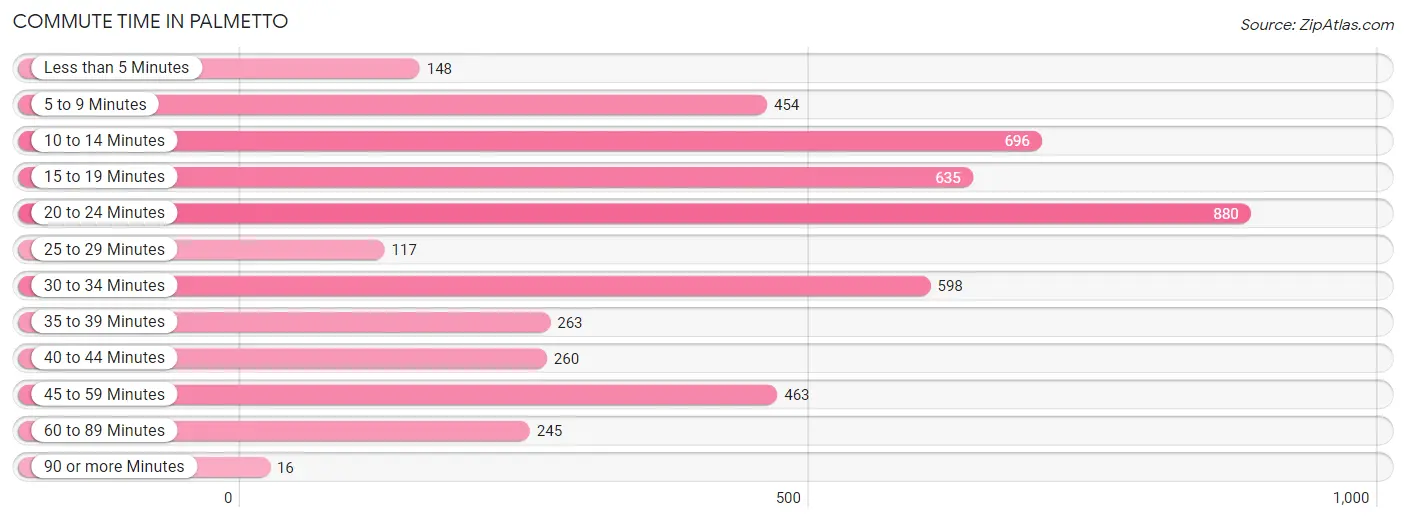
| Commute Time | # Commuters | % Commuters |
| Less than 5 Minutes | 148 | 3.1% |
| 5 to 9 Minutes | 454 | 9.5% |
| 10 to 14 Minutes | 696 | 14.6% |
| 15 to 19 Minutes | 635 | 13.3% |
| 20 to 24 Minutes | 880 | 18.4% |
| 25 to 29 Minutes | 117 | 2.5% |
| 30 to 34 Minutes | 598 | 12.5% |
| 35 to 39 Minutes | 263 | 5.5% |
| 40 to 44 Minutes | 260 | 5.4% |
| 45 to 59 Minutes | 463 | 9.7% |
| 60 to 89 Minutes | 245 | 5.1% |
| 90 or more Minutes | 16 | 0.3% |
Commute Time by Sex in Palmetto
The most common commute times in Palmetto are 20 to 24 minutes (520 commuters, 19.1%) for males and 30 to 34 minutes (406 commuters, 19.8%) for females.
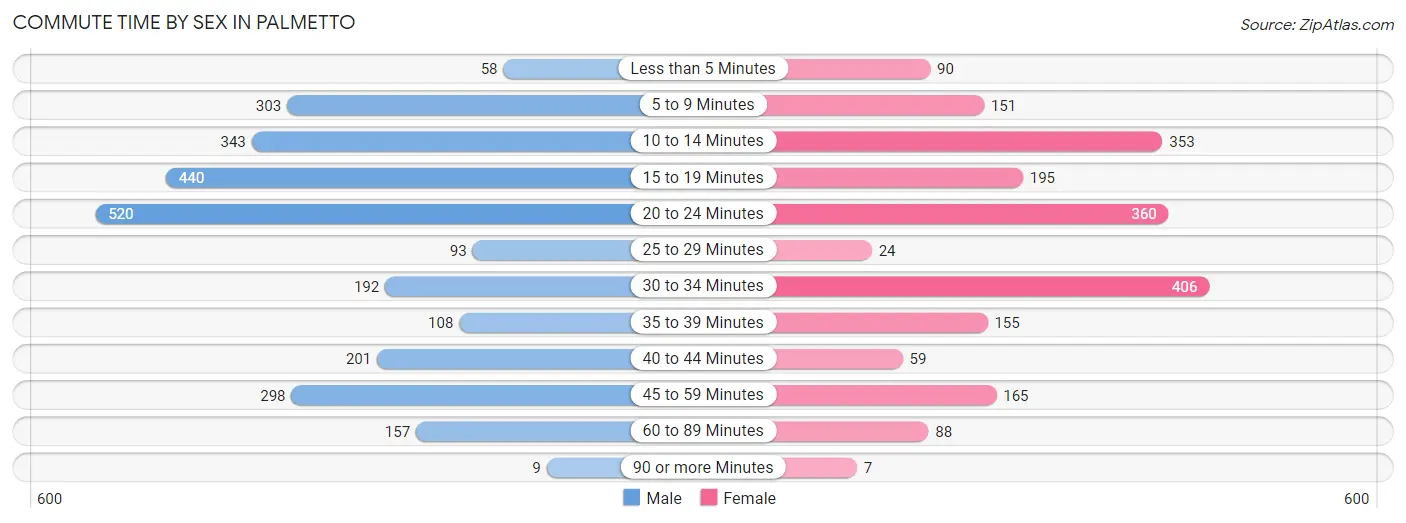
| Commute Time | Male | Female |
| Less than 5 Minutes | 58 (2.1%) | 90 (4.4%) |
| 5 to 9 Minutes | 303 (11.1%) | 151 (7.4%) |
| 10 to 14 Minutes | 343 (12.6%) | 353 (17.2%) |
| 15 to 19 Minutes | 440 (16.2%) | 195 (9.5%) |
| 20 to 24 Minutes | 520 (19.1%) | 360 (17.5%) |
| 25 to 29 Minutes | 93 (3.4%) | 24 (1.2%) |
| 30 to 34 Minutes | 192 (7.0%) | 406 (19.8%) |
| 35 to 39 Minutes | 108 (4.0%) | 155 (7.5%) |
| 40 to 44 Minutes | 201 (7.4%) | 59 (2.9%) |
| 45 to 59 Minutes | 298 (11.0%) | 165 (8.0%) |
| 60 to 89 Minutes | 157 (5.8%) | 88 (4.3%) |
| 90 or more Minutes | 9 (0.3%) | 7 (0.3%) |
Time of Departure to Work by Sex in Palmetto
The most frequent times of departure to work in Palmetto are 6:00 AM to 6:29 AM (412, 15.1%) for males and 7:00 AM to 7:29 AM (577, 28.1%) for females.
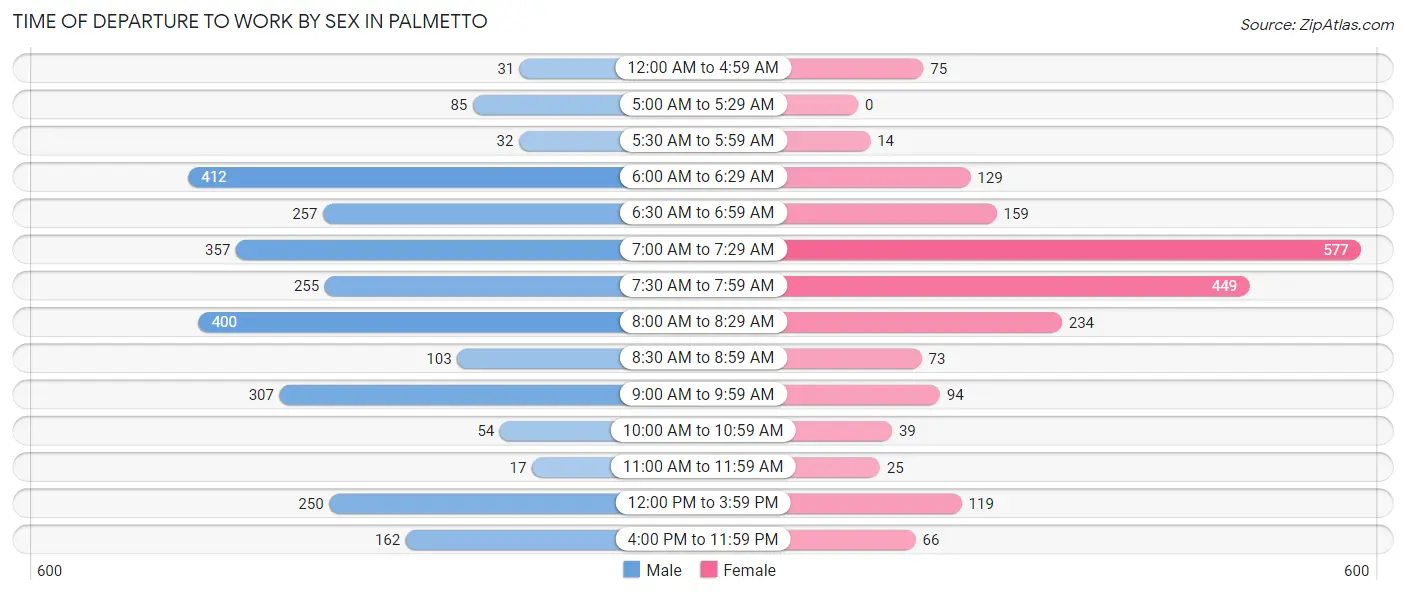
| Time of Departure | Male | Female |
| 12:00 AM to 4:59 AM | 31 (1.1%) | 75 (3.6%) |
| 5:00 AM to 5:29 AM | 85 (3.1%) | 0 (0.0%) |
| 5:30 AM to 5:59 AM | 32 (1.2%) | 14 (0.7%) |
| 6:00 AM to 6:29 AM | 412 (15.1%) | 129 (6.3%) |
| 6:30 AM to 6:59 AM | 257 (9.4%) | 159 (7.7%) |
| 7:00 AM to 7:29 AM | 357 (13.1%) | 577 (28.1%) |
| 7:30 AM to 7:59 AM | 255 (9.4%) | 449 (21.9%) |
| 8:00 AM to 8:29 AM | 400 (14.7%) | 234 (11.4%) |
| 8:30 AM to 8:59 AM | 103 (3.8%) | 73 (3.6%) |
| 9:00 AM to 9:59 AM | 307 (11.3%) | 94 (4.6%) |
| 10:00 AM to 10:59 AM | 54 (2.0%) | 39 (1.9%) |
| 11:00 AM to 11:59 AM | 17 (0.6%) | 25 (1.2%) |
| 12:00 PM to 3:59 PM | 250 (9.2%) | 119 (5.8%) |
| 4:00 PM to 11:59 PM | 162 (5.9%) | 66 (3.2%) |
| Total | 2,722 (100.0%) | 2,053 (100.0%) |
Housing Occupancy in Palmetto
Occupancy by Ownership in Palmetto
Of the total 4,957 dwellings in Palmetto, owner-occupied units account for 3,203 (64.6%), while renter-occupied units make up 1,754 (35.4%).
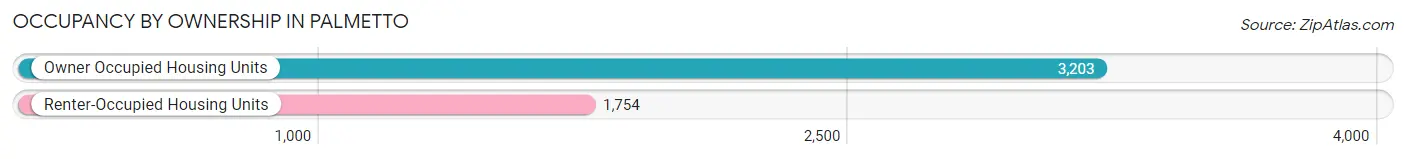
| Occupancy | # Housing Units | % Housing Units |
| Owner Occupied Housing Units | 3,203 | 64.6% |
| Renter-Occupied Housing Units | 1,754 | 35.4% |
| Total Occupied Housing Units | 4,957 | 100.0% |
Occupancy by Household Size in Palmetto
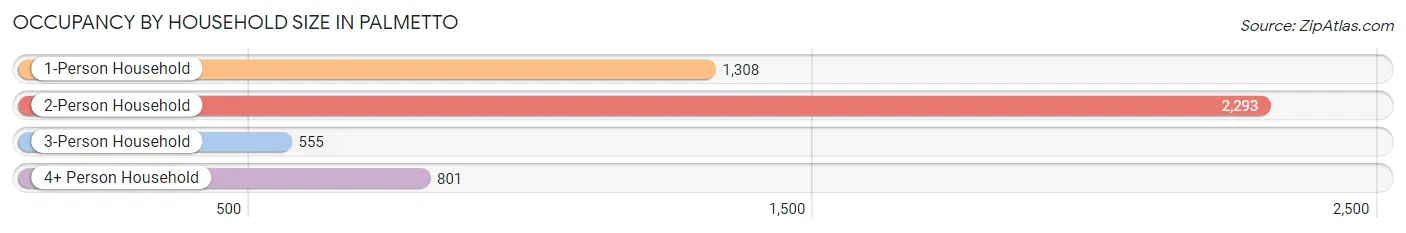
| Household Size | # Housing Units | % Housing Units |
| 1-Person Household | 1,308 | 26.4% |
| 2-Person Household | 2,293 | 46.3% |
| 3-Person Household | 555 | 11.2% |
| 4+ Person Household | 801 | 16.2% |
| Total Housing Units | 4,957 | 100.0% |
Occupancy by Ownership by Household Size in Palmetto
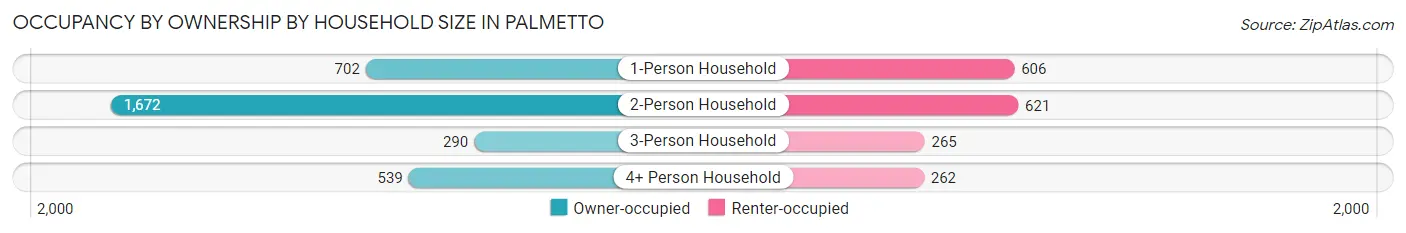
| Household Size | Owner-occupied | Renter-occupied |
| 1-Person Household | 702 (53.7%) | 606 (46.3%) |
| 2-Person Household | 1,672 (72.9%) | 621 (27.1%) |
| 3-Person Household | 290 (52.2%) | 265 (47.7%) |
| 4+ Person Household | 539 (67.3%) | 262 (32.7%) |
| Total Housing Units | 3,203 (64.6%) | 1,754 (35.4%) |
Occupancy by Educational Attainment in Palmetto
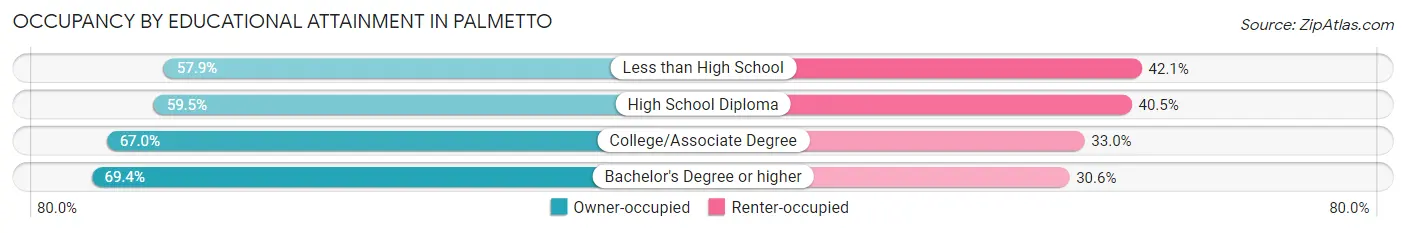
| Household Size | Owner-occupied | Renter-occupied |
| Less than High School | 304 (57.9%) | 221 (42.1%) |
| High School Diploma | 849 (59.5%) | 578 (40.5%) |
| College/Associate Degree | 967 (67.0%) | 477 (33.0%) |
| Bachelor's Degree or higher | 1,083 (69.4%) | 478 (30.6%) |
Occupancy by Age of Householder in Palmetto
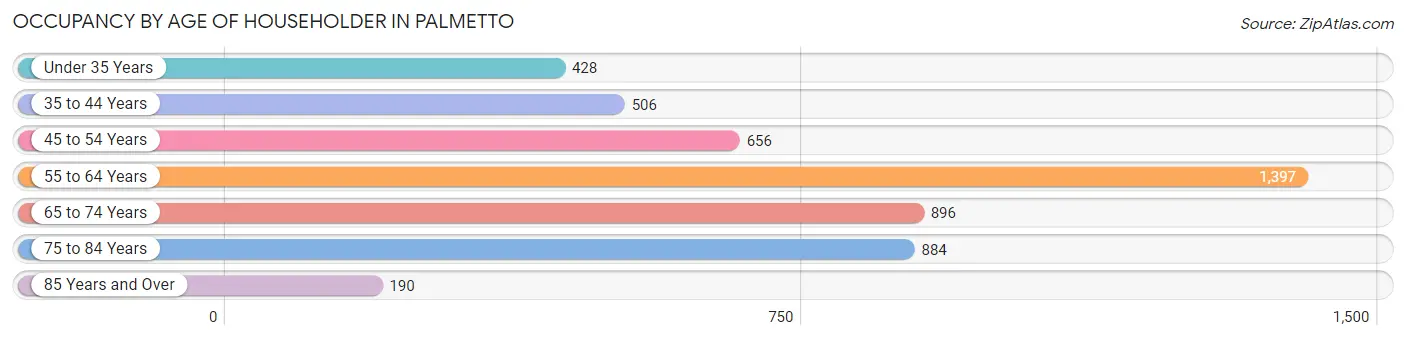
| Age Bracket | # Households | % Households |
| Under 35 Years | 428 | 8.6% |
| 35 to 44 Years | 506 | 10.2% |
| 45 to 54 Years | 656 | 13.2% |
| 55 to 64 Years | 1,397 | 28.2% |
| 65 to 74 Years | 896 | 18.1% |
| 75 to 84 Years | 884 | 17.8% |
| 85 Years and Over | 190 | 3.8% |
| Total | 4,957 | 100.0% |
Housing Finances in Palmetto
Median Income by Occupancy in Palmetto
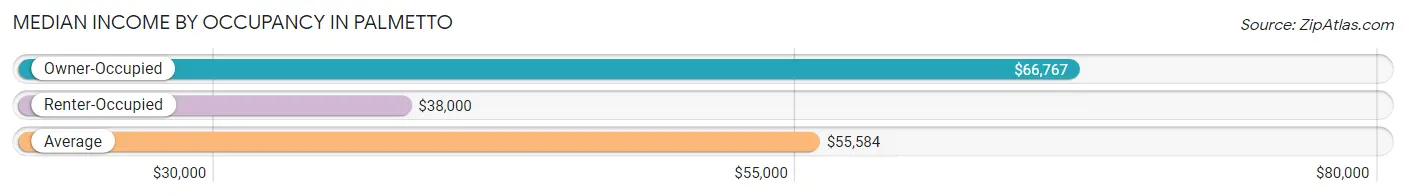
| Occupancy Type | # Households | Median Income |
| Owner-Occupied | 3,203 (64.6%) | $66,767 |
| Renter-Occupied | 1,754 (35.4%) | $38,000 |
| Average | 4,957 (100.0%) | $55,584 |
Occupancy by Householder Income Bracket in Palmetto
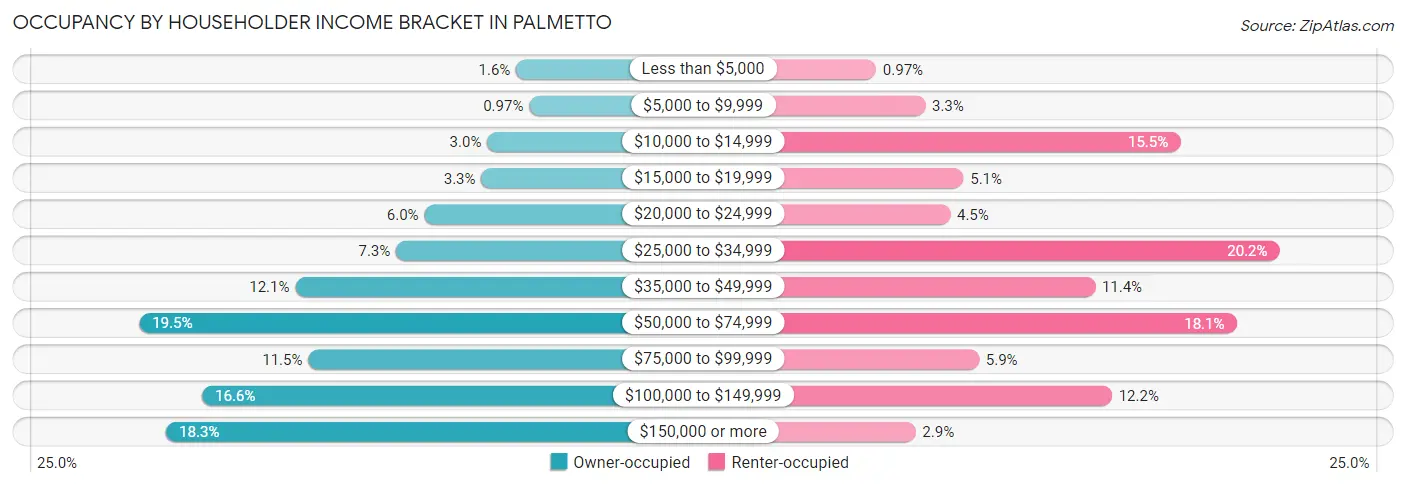
| Income Bracket | Owner-occupied | Renter-occupied |
| Less than $5,000 | 51 (1.6%) | 17 (1.0%) |
| $5,000 to $9,999 | 31 (1.0%) | 58 (3.3%) |
| $10,000 to $14,999 | 95 (3.0%) | 271 (15.4%) |
| $15,000 to $19,999 | 104 (3.3%) | 90 (5.1%) |
| $20,000 to $24,999 | 191 (6.0%) | 79 (4.5%) |
| $25,000 to $34,999 | 234 (7.3%) | 354 (20.2%) |
| $35,000 to $49,999 | 388 (12.1%) | 200 (11.4%) |
| $50,000 to $74,999 | 626 (19.5%) | 318 (18.1%) |
| $75,000 to $99,999 | 368 (11.5%) | 103 (5.9%) |
| $100,000 to $149,999 | 530 (16.6%) | 214 (12.2%) |
| $150,000 or more | 585 (18.3%) | 50 (2.9%) |
| Total | 3,203 (100.0%) | 1,754 (100.0%) |
Monthly Housing Cost Tiers in Palmetto
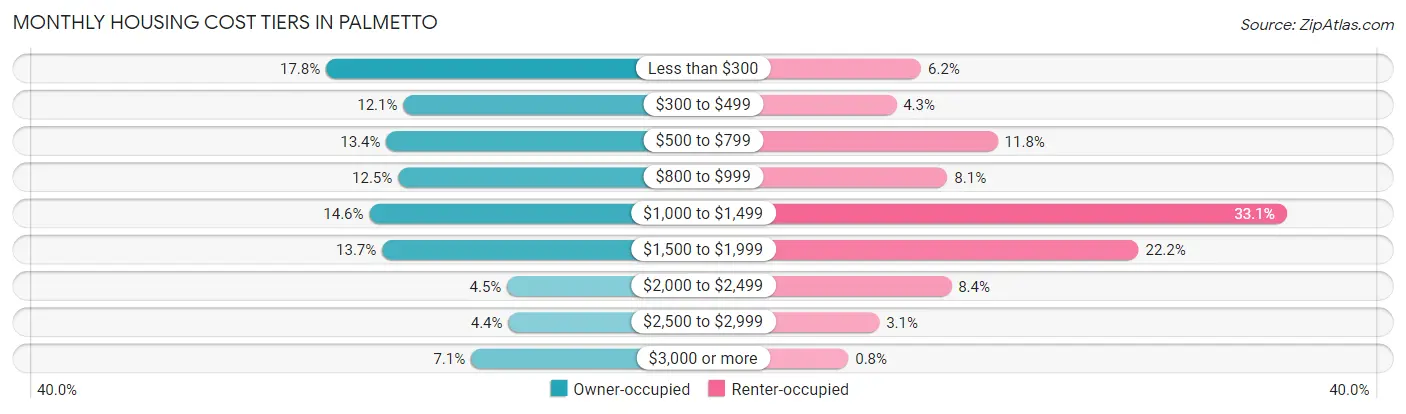
| Monthly Cost | Owner-occupied | Renter-occupied |
| Less than $300 | 570 (17.8%) | 108 (6.2%) |
| $300 to $499 | 388 (12.1%) | 76 (4.3%) |
| $500 to $799 | 428 (13.4%) | 207 (11.8%) |
| $800 to $999 | 400 (12.5%) | 142 (8.1%) |
| $1,000 to $1,499 | 468 (14.6%) | 580 (33.1%) |
| $1,500 to $1,999 | 438 (13.7%) | 389 (22.2%) |
| $2,000 to $2,499 | 143 (4.5%) | 147 (8.4%) |
| $2,500 to $2,999 | 140 (4.4%) | 54 (3.1%) |
| $3,000 or more | 228 (7.1%) | 14 (0.8%) |
| Total | 3,203 (100.0%) | 1,754 (100.0%) |
Physical Housing Characteristics in Palmetto
Housing Structures in Palmetto
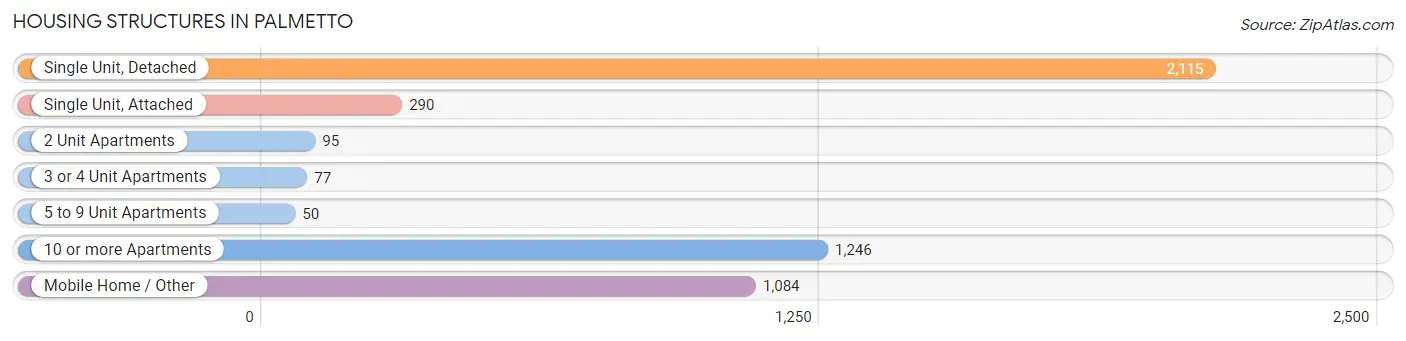
| Structure Type | # Housing Units | % Housing Units |
| Single Unit, Detached | 2,115 | 42.7% |
| Single Unit, Attached | 290 | 5.9% |
| 2 Unit Apartments | 95 | 1.9% |
| 3 or 4 Unit Apartments | 77 | 1.5% |
| 5 to 9 Unit Apartments | 50 | 1.0% |
| 10 or more Apartments | 1,246 | 25.1% |
| Mobile Home / Other | 1,084 | 21.9% |
| Total | 4,957 | 100.0% |
Housing Structures by Occupancy in Palmetto
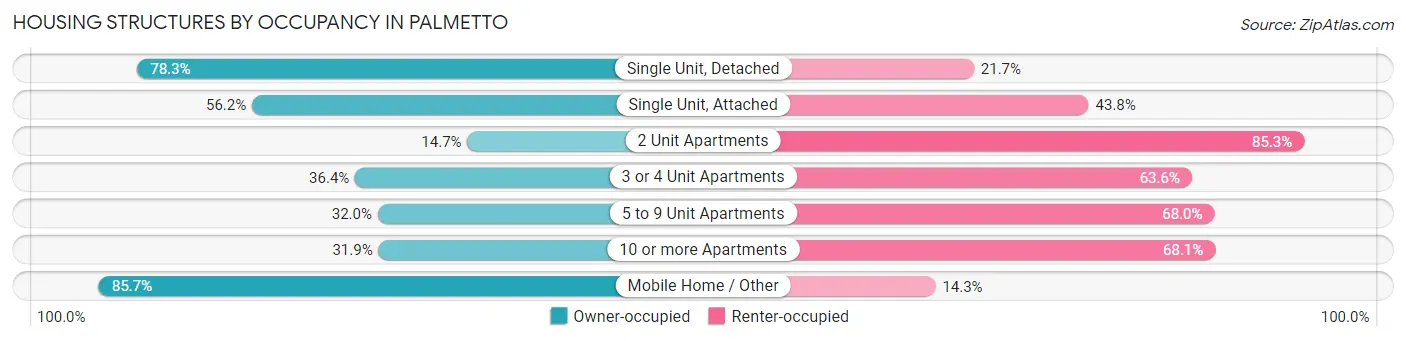
| Structure Type | Owner-occupied | Renter-occupied |
| Single Unit, Detached | 1,656 (78.3%) | 459 (21.7%) |
| Single Unit, Attached | 163 (56.2%) | 127 (43.8%) |
| 2 Unit Apartments | 14 (14.7%) | 81 (85.3%) |
| 3 or 4 Unit Apartments | 28 (36.4%) | 49 (63.6%) |
| 5 to 9 Unit Apartments | 16 (32.0%) | 34 (68.0%) |
| 10 or more Apartments | 397 (31.9%) | 849 (68.1%) |
| Mobile Home / Other | 929 (85.7%) | 155 (14.3%) |
| Total | 3,203 (64.6%) | 1,754 (35.4%) |
Housing Structures by Number of Rooms in Palmetto
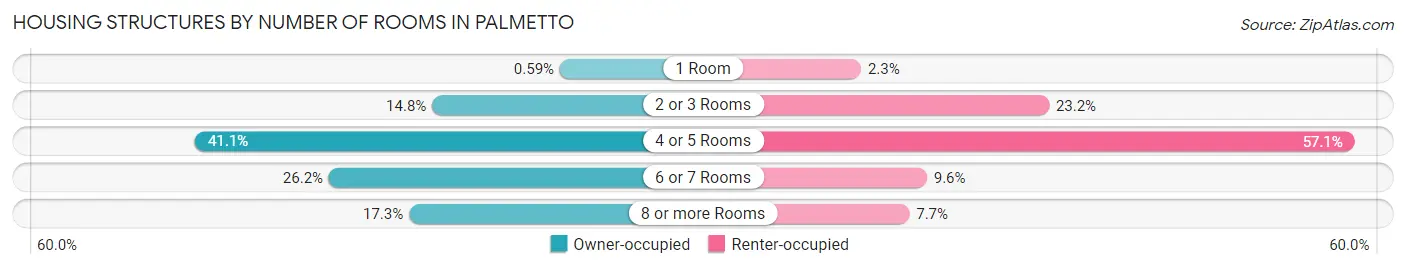
| Number of Rooms | Owner-occupied | Renter-occupied |
| 1 Room | 19 (0.6%) | 41 (2.3%) |
| 2 or 3 Rooms | 473 (14.8%) | 407 (23.2%) |
| 4 or 5 Rooms | 1,316 (41.1%) | 1,002 (57.1%) |
| 6 or 7 Rooms | 840 (26.2%) | 169 (9.6%) |
| 8 or more Rooms | 555 (17.3%) | 135 (7.7%) |
| Total | 3,203 (100.0%) | 1,754 (100.0%) |
Housing Structure by Heating Type in Palmetto
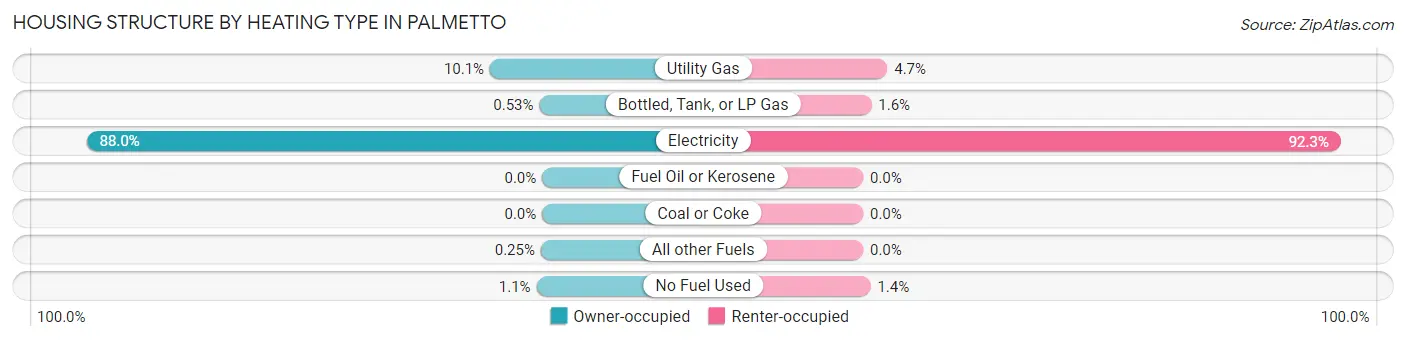
| Heating Type | Owner-occupied | Renter-occupied |
| Utility Gas | 323 (10.1%) | 82 (4.7%) |
| Bottled, Tank, or LP Gas | 17 (0.5%) | 28 (1.6%) |
| Electricity | 2,820 (88.0%) | 1,619 (92.3%) |
| Fuel Oil or Kerosene | 0 (0.0%) | 0 (0.0%) |
| Coal or Coke | 0 (0.0%) | 0 (0.0%) |
| All other Fuels | 8 (0.3%) | 0 (0.0%) |
| No Fuel Used | 35 (1.1%) | 25 (1.4%) |
| Total | 3,203 (100.0%) | 1,754 (100.0%) |
Household Vehicle Usage in Palmetto
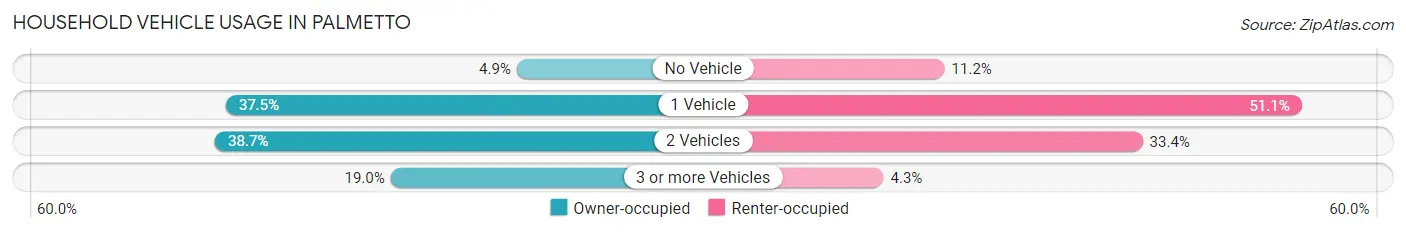
| Vehicles per Household | Owner-occupied | Renter-occupied |
| No Vehicle | 156 (4.9%) | 196 (11.2%) |
| 1 Vehicle | 1,200 (37.5%) | 897 (51.1%) |
| 2 Vehicles | 1,238 (38.7%) | 585 (33.4%) |
| 3 or more Vehicles | 609 (19.0%) | 76 (4.3%) |
| Total | 3,203 (100.0%) | 1,754 (100.0%) |
Real Estate & Mortgages in Palmetto
Real Estate and Mortgage Overview in Palmetto
| Characteristic | Without Mortgage | With Mortgage |
| Housing Units | 2,003 | 1,200 |
| Median Property Value | $129,800 | $337,100 |
| Median Household Income | $57,791 | $306 |
| Monthly Housing Costs | $532 | $228 |
| Real Estate Taxes | $1,237 | $71 |
Property Value by Mortgage Status in Palmetto
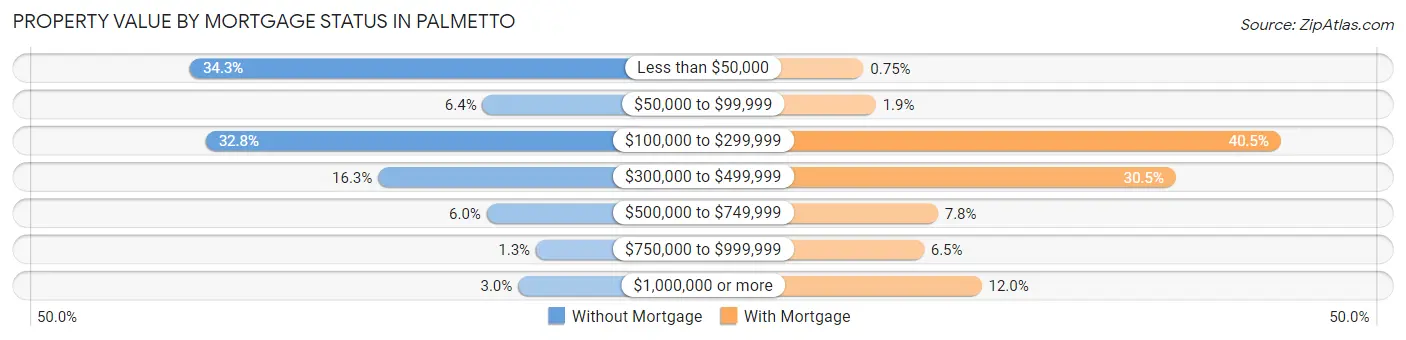
| Property Value | Without Mortgage | With Mortgage |
| Less than $50,000 | 686 (34.3%) | 9 (0.7%) |
| $50,000 to $99,999 | 128 (6.4%) | 23 (1.9%) |
| $100,000 to $299,999 | 656 (32.8%) | 486 (40.5%) |
| $300,000 to $499,999 | 327 (16.3%) | 366 (30.5%) |
| $500,000 to $749,999 | 120 (6.0%) | 94 (7.8%) |
| $750,000 to $999,999 | 26 (1.3%) | 78 (6.5%) |
| $1,000,000 or more | 60 (3.0%) | 144 (12.0%) |
| Total | 2,003 (100.0%) | 1,200 (100.0%) |
Household Income by Mortgage Status in Palmetto
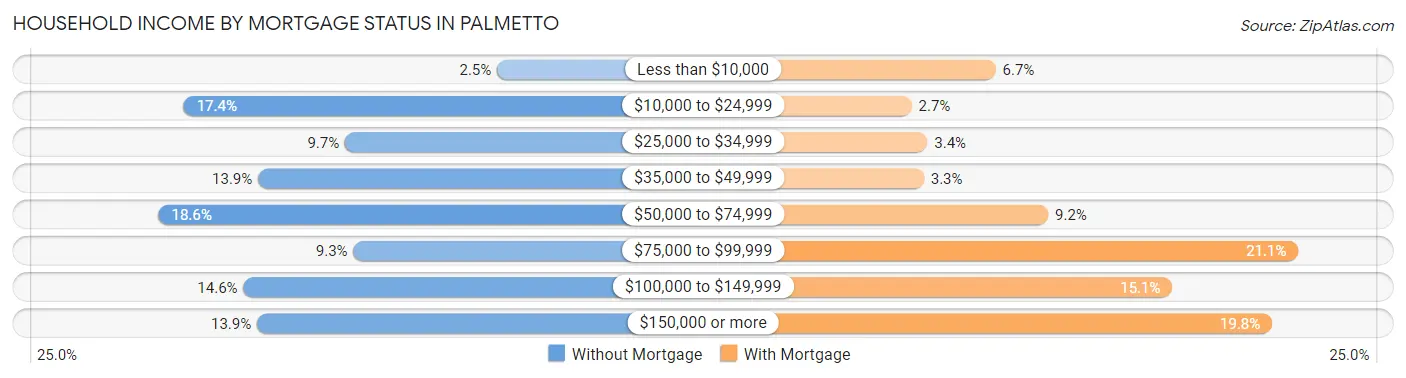
| Household Income | Without Mortgage | With Mortgage |
| Less than $10,000 | 50 (2.5%) | 80 (6.7%) |
| $10,000 to $24,999 | 349 (17.4%) | 32 (2.7%) |
| $25,000 to $34,999 | 195 (9.7%) | 41 (3.4%) |
| $35,000 to $49,999 | 278 (13.9%) | 39 (3.3%) |
| $50,000 to $74,999 | 373 (18.6%) | 110 (9.2%) |
| $75,000 to $99,999 | 187 (9.3%) | 253 (21.1%) |
| $100,000 to $149,999 | 292 (14.6%) | 181 (15.1%) |
| $150,000 or more | 279 (13.9%) | 238 (19.8%) |
| Total | 2,003 (100.0%) | 1,200 (100.0%) |
Property Value to Household Income Ratio in Palmetto
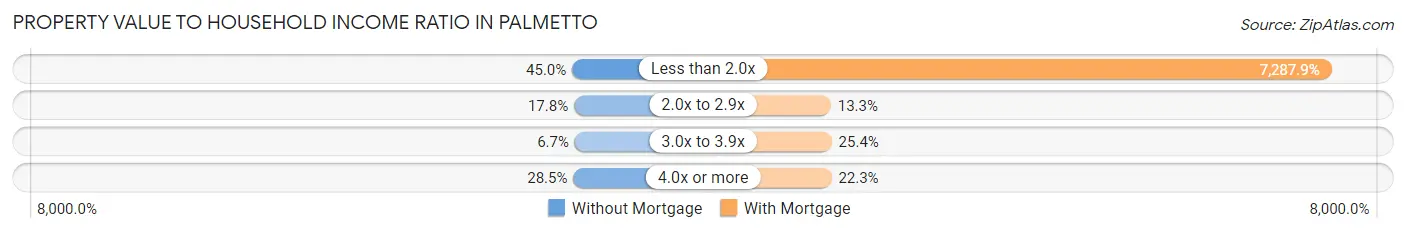
| Value-to-Income Ratio | Without Mortgage | With Mortgage |
| Less than 2.0x | 901 (45.0%) | 87,455 (7,287.9%) |
| 2.0x to 2.9x | 356 (17.8%) | 160 (13.3%) |
| 3.0x to 3.9x | 134 (6.7%) | 305 (25.4%) |
| 4.0x or more | 571 (28.5%) | 268 (22.3%) |
| Total | 2,003 (100.0%) | 1,200 (100.0%) |
Real Estate Taxes by Mortgage Status in Palmetto
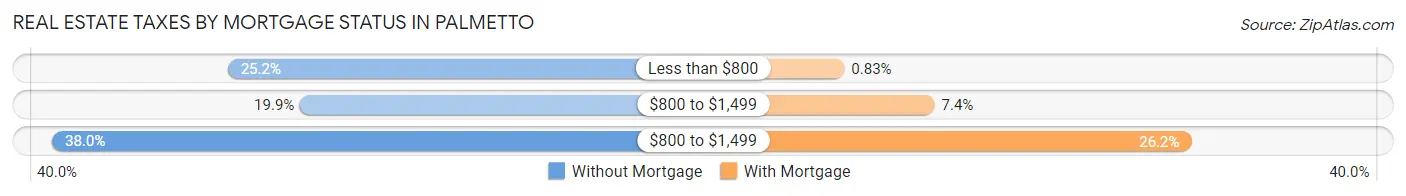
| Property Taxes | Without Mortgage | With Mortgage |
| Less than $800 | 504 (25.2%) | 10 (0.8%) |
| $800 to $1,499 | 398 (19.9%) | 89 (7.4%) |
| $800 to $1,499 | 761 (38.0%) | 314 (26.2%) |
| Total | 2,003 (100.0%) | 1,200 (100.0%) |
Health & Disability in Palmetto
Health Insurance Coverage by Age in Palmetto
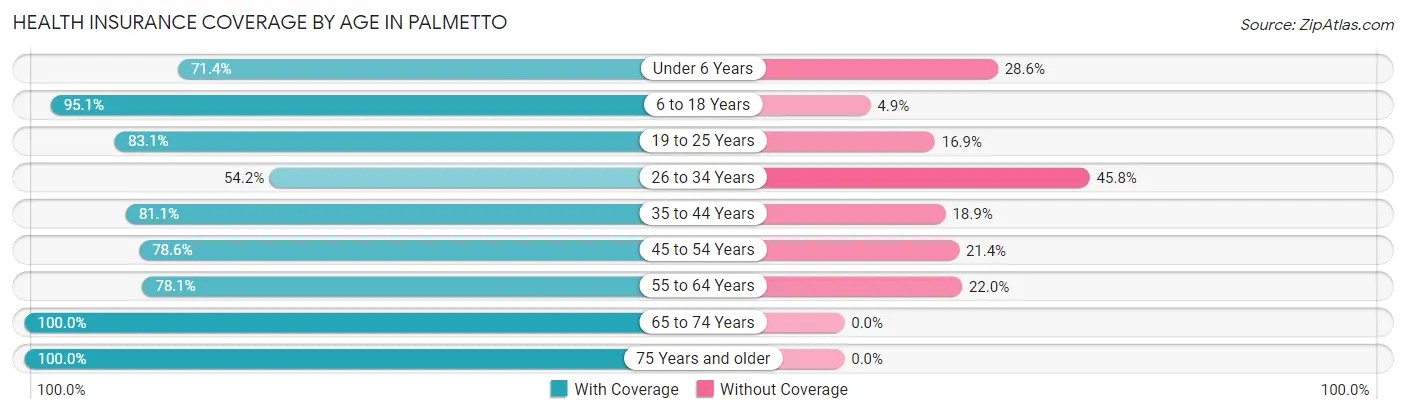
| Age Bracket | With Coverage | Without Coverage |
| Under 6 Years | 706 (71.4%) | 283 (28.6%) |
| 6 to 18 Years | 1,601 (95.1%) | 82 (4.9%) |
| 19 to 25 Years | 960 (83.1%) | 195 (16.9%) |
| 26 to 34 Years | 614 (54.2%) | 518 (45.8%) |
| 35 to 44 Years | 907 (81.1%) | 211 (18.9%) |
| 45 to 54 Years | 1,107 (78.6%) | 301 (21.4%) |
| 55 to 64 Years | 1,675 (78.0%) | 471 (22.0%) |
| 65 to 74 Years | 1,697 (100.0%) | 0 (0.0%) |
| 75 Years and older | 1,930 (100.0%) | 0 (0.0%) |
| Total | 11,197 (84.5%) | 2,061 (15.5%) |
Health Insurance Coverage by Citizenship Status in Palmetto
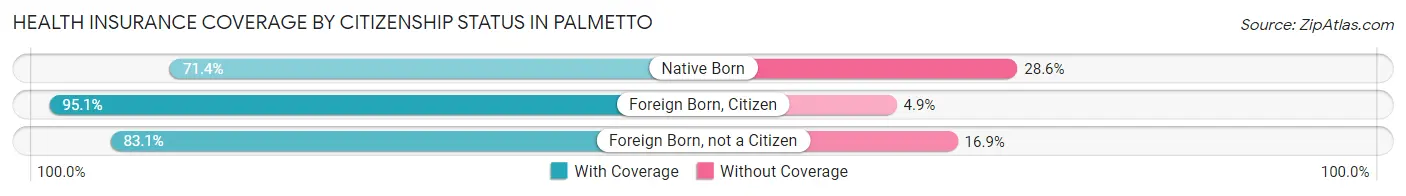
| Citizenship Status | With Coverage | Without Coverage |
| Native Born | 706 (71.4%) | 283 (28.6%) |
| Foreign Born, Citizen | 1,601 (95.1%) | 82 (4.9%) |
| Foreign Born, not a Citizen | 960 (83.1%) | 195 (16.9%) |
Health Insurance Coverage by Household Income in Palmetto
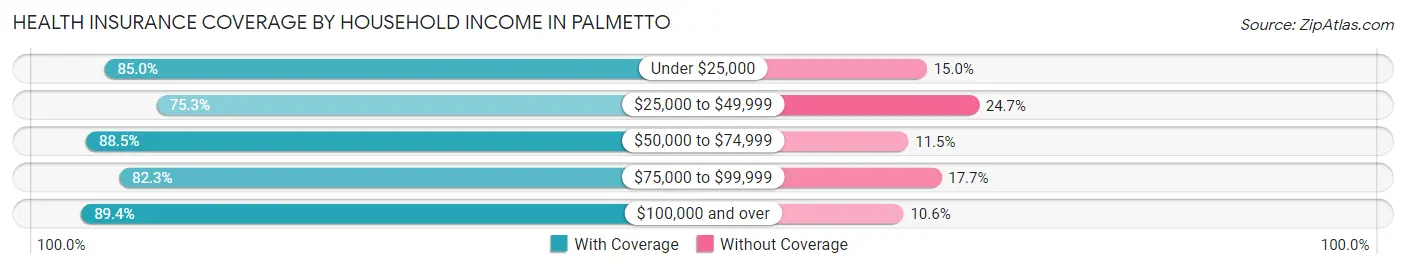
| Household Income | With Coverage | Without Coverage |
| Under $25,000 | 1,437 (85.0%) | 253 (15.0%) |
| $25,000 to $49,999 | 2,122 (75.3%) | 697 (24.7%) |
| $50,000 to $74,999 | 2,212 (88.5%) | 288 (11.5%) |
| $75,000 to $99,999 | 1,307 (82.3%) | 281 (17.7%) |
| $100,000 and over | 4,082 (89.4%) | 485 (10.6%) |
Public vs Private Health Insurance Coverage by Age in Palmetto
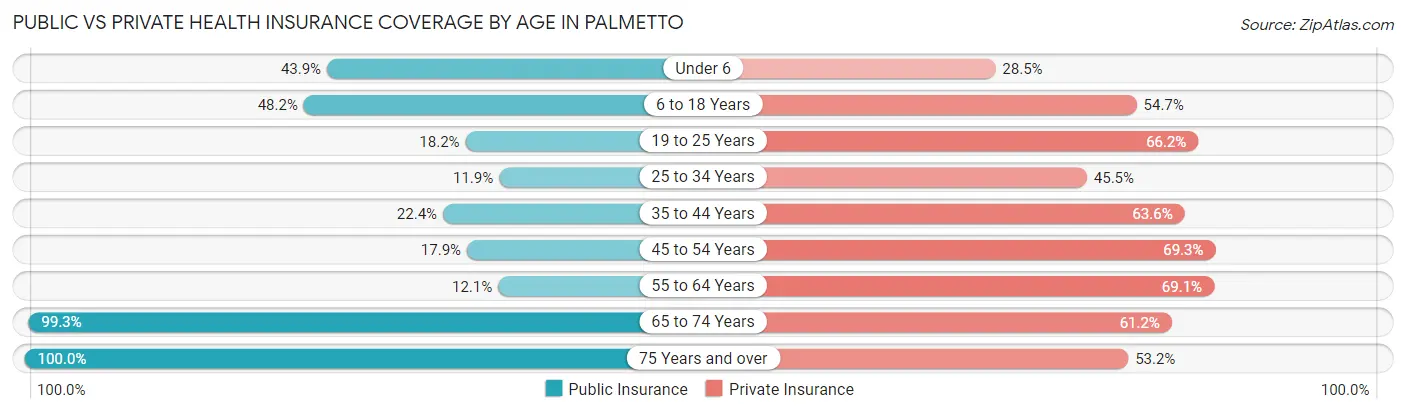
| Age Bracket | Public Insurance | Private Insurance |
| Under 6 | 434 (43.9%) | 282 (28.5%) |
| 6 to 18 Years | 811 (48.2%) | 921 (54.7%) |
| 19 to 25 Years | 210 (18.2%) | 764 (66.1%) |
| 25 to 34 Years | 135 (11.9%) | 515 (45.5%) |
| 35 to 44 Years | 250 (22.4%) | 711 (63.6%) |
| 45 to 54 Years | 252 (17.9%) | 976 (69.3%) |
| 55 to 64 Years | 260 (12.1%) | 1,482 (69.1%) |
| 65 to 74 Years | 1,685 (99.3%) | 1,039 (61.2%) |
| 75 Years and over | 1,930 (100.0%) | 1,026 (53.2%) |
| Total | 5,967 (45.0%) | 7,716 (58.2%) |
Disability Status by Sex by Age in Palmetto
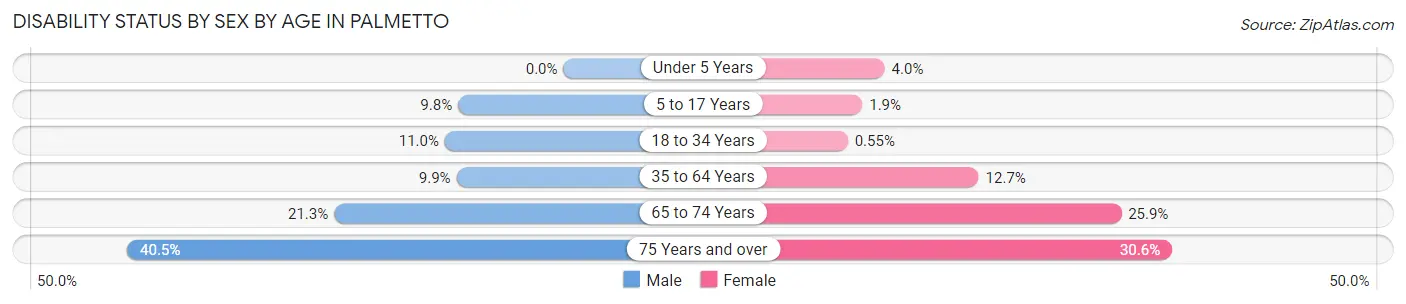
| Age Bracket | Male | Female |
| Under 5 Years | 0 (0.0%) | 17 (4.0%) |
| 5 to 17 Years | 96 (9.8%) | 17 (1.9%) |
| 18 to 34 Years | 160 (11.0%) | 5 (0.5%) |
| 35 to 64 Years | 222 (9.9%) | 309 (12.7%) |
| 65 to 74 Years | 133 (21.3%) | 278 (25.9%) |
| 75 Years and over | 340 (40.5%) | 334 (30.6%) |
Disability Class by Sex by Age in Palmetto
Disability Class: Hearing Difficulty
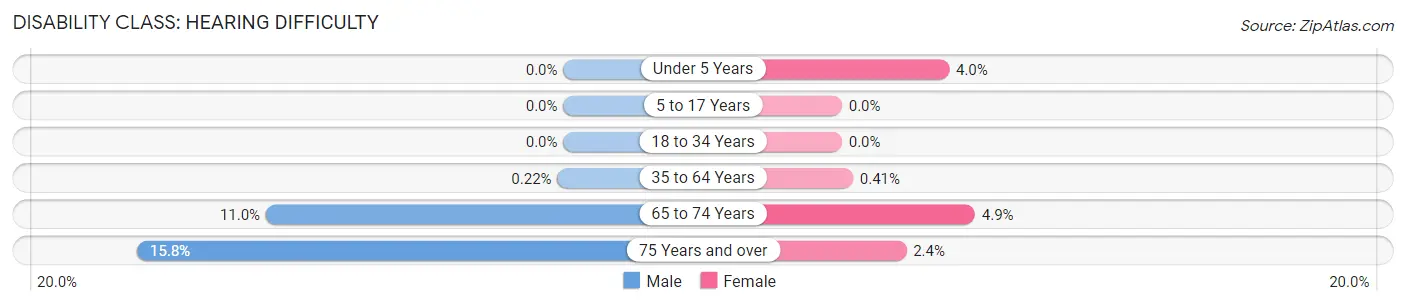
| Age Bracket | Male | Female |
| Under 5 Years | 0 (0.0%) | 17 (4.0%) |
| 5 to 17 Years | 0 (0.0%) | 0 (0.0%) |
| 18 to 34 Years | 0 (0.0%) | 0 (0.0%) |
| 35 to 64 Years | 5 (0.2%) | 10 (0.4%) |
| 65 to 74 Years | 69 (11.0%) | 53 (4.9%) |
| 75 Years and over | 133 (15.8%) | 26 (2.4%) |
Disability Class: Vision Difficulty
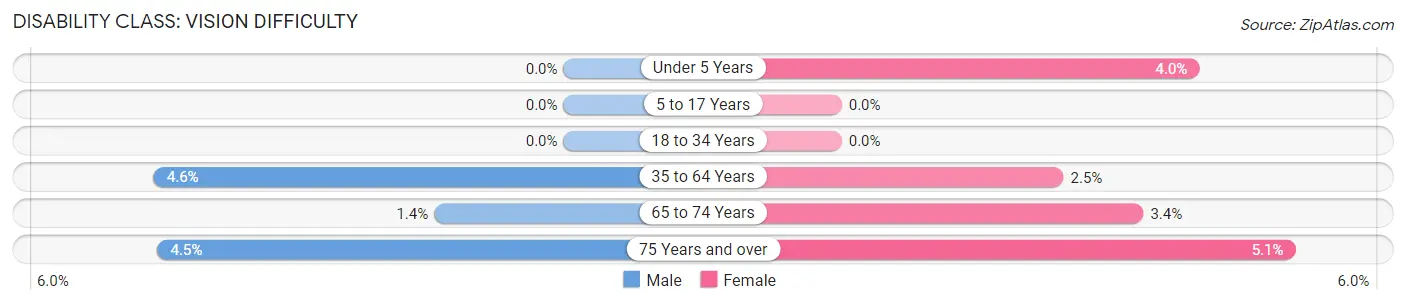
| Age Bracket | Male | Female |
| Under 5 Years | 0 (0.0%) | 17 (4.0%) |
| 5 to 17 Years | 0 (0.0%) | 0 (0.0%) |
| 18 to 34 Years | 0 (0.0%) | 0 (0.0%) |
| 35 to 64 Years | 102 (4.6%) | 60 (2.5%) |
| 65 to 74 Years | 9 (1.4%) | 36 (3.4%) |
| 75 Years and over | 38 (4.5%) | 55 (5.1%) |
Disability Class: Cognitive Difficulty
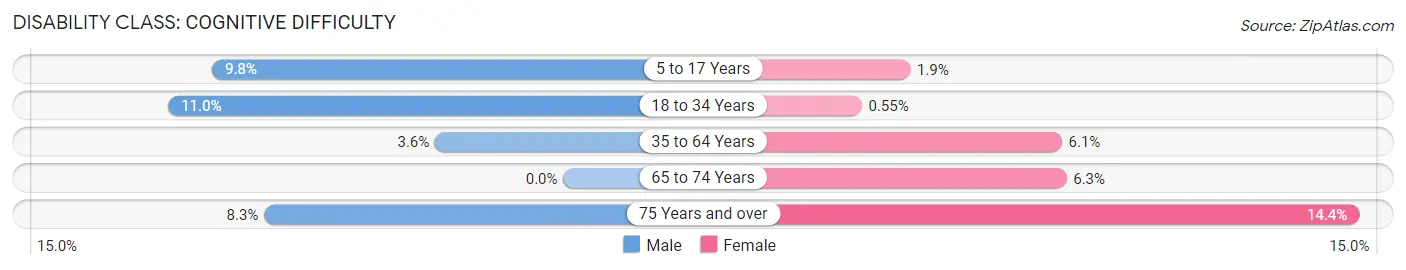
| Age Bracket | Male | Female |
| 5 to 17 Years | 96 (9.8%) | 17 (1.9%) |
| 18 to 34 Years | 160 (11.0%) | 5 (0.5%) |
| 35 to 64 Years | 80 (3.6%) | 149 (6.1%) |
| 65 to 74 Years | 0 (0.0%) | 67 (6.2%) |
| 75 Years and over | 70 (8.3%) | 157 (14.4%) |
Disability Class: Ambulatory Difficulty
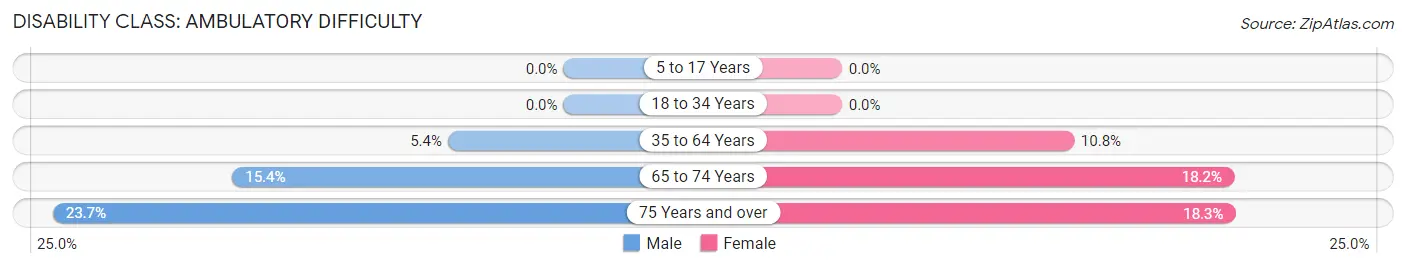
| Age Bracket | Male | Female |
| 5 to 17 Years | 0 (0.0%) | 0 (0.0%) |
| 18 to 34 Years | 0 (0.0%) | 0 (0.0%) |
| 35 to 64 Years | 120 (5.4%) | 262 (10.8%) |
| 65 to 74 Years | 96 (15.4%) | 195 (18.2%) |
| 75 Years and over | 199 (23.7%) | 199 (18.3%) |
Disability Class: Self-Care Difficulty
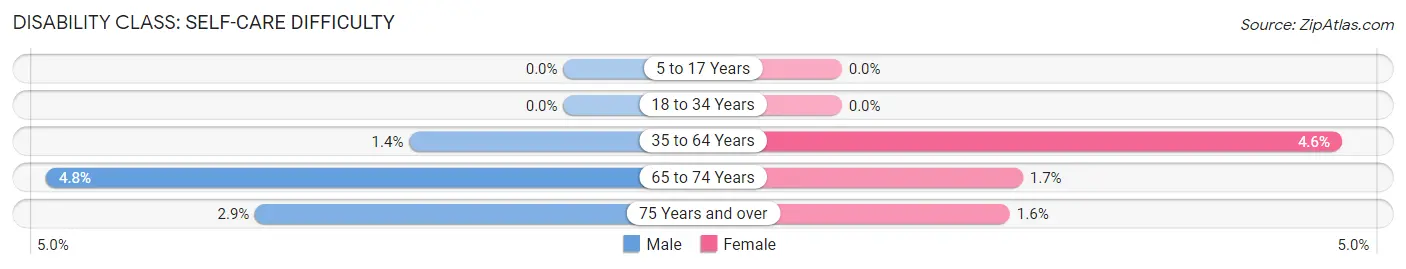
| Age Bracket | Male | Female |
| 5 to 17 Years | 0 (0.0%) | 0 (0.0%) |
| 18 to 34 Years | 0 (0.0%) | 0 (0.0%) |
| 35 to 64 Years | 32 (1.4%) | 113 (4.6%) |
| 65 to 74 Years | 30 (4.8%) | 18 (1.7%) |
| 75 Years and over | 24 (2.9%) | 17 (1.6%) |
Technology Access in Palmetto
Computing Device Access in Palmetto
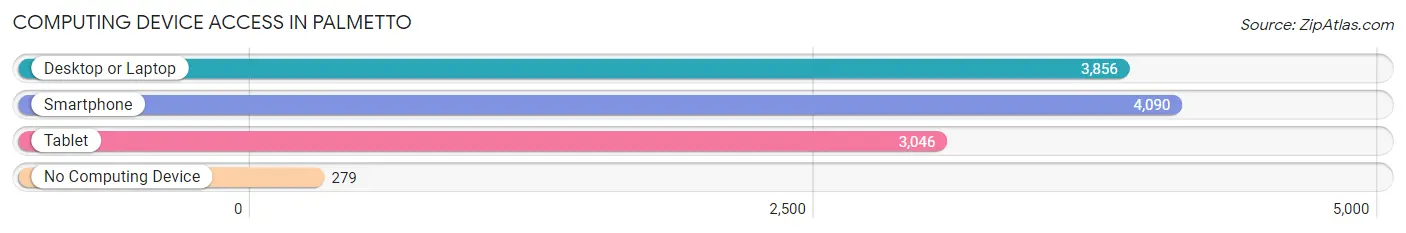
| Device Type | # Households | % Households |
| Desktop or Laptop | 3,856 | 77.8% |
| Smartphone | 4,090 | 82.5% |
| Tablet | 3,046 | 61.5% |
| No Computing Device | 279 | 5.6% |
| Total | 4,957 | 100.0% |
Internet Access in Palmetto
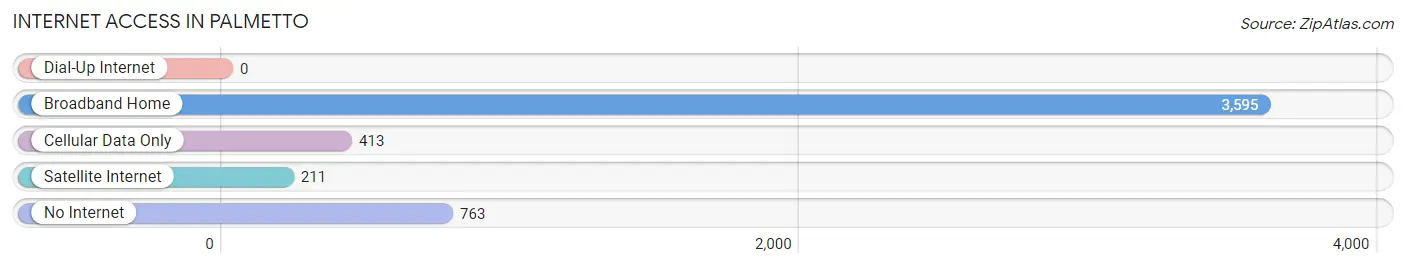
| Internet Type | # Households | % Households |
| Dial-Up Internet | 0 | 0.0% |
| Broadband Home | 3,595 | 72.5% |
| Cellular Data Only | 413 | 8.3% |
| Satellite Internet | 211 | 4.3% |
| No Internet | 763 | 15.4% |
| Total | 4,957 | 100.0% |
Palmetto Summary
Palmetto, Florida is a city located in Manatee County, Florida, United States. The population was 12,606 at the 2010 census. It is part of the Bradenton–Sarasota–Venice Metropolitan Statistical Area.
History
Palmetto was founded in 1868 by William and Mary Starling, who moved to the area from South Carolina. The city was named after the palmetto trees that grew in the area. The Starlings built a hotel and a general store, and the city quickly grew. In 1887, the Florida Central and Peninsular Railroad arrived in Palmetto, connecting the city to the rest of the state. This helped to further spur the city's growth.
In the early 1900s, Palmetto became a popular tourist destination, with many people coming to the city to enjoy the beaches and the warm climate. The city also became a center for the fishing industry, with many people coming to the area to fish for mullet, snapper, and other types of fish.
In the 1950s, Palmetto began to experience a population boom, as many people moved to the city from other parts of the state. This growth continued into the 1960s and 1970s, and the city's population reached 12,606 by the 2010 census.
Geography
Palmetto is located at 27°30'N 82°34'W (27.50, -82.57). According to the United States Census Bureau, the city has a total area of 8.2 square miles (21.2 km2), of which 8.1 square miles (21.0 km2) is land and 0.1 square miles (0.2 km2) (1.25%) is water.
Economy
Palmetto's economy is largely based on tourism and the fishing industry. The city is home to several marinas, which attract many visitors to the area. The city is also home to several restaurants, hotels, and other businesses that cater to tourists.
The city is also home to several manufacturing companies, including a paper mill and a plastics factory. The city is also home to several retail stores, including a Walmart Supercenter.
Demographics
As of the 2010 census, there were 12,606 people, 5,093 households, and 3,092 families residing in the city. The population density was 1,547.2 people per square mile (597.2/km2). There were 5,817 housing units at an average density of 719.2 per square mile (277.7/km2). The racial makeup of the city was 79.2% White, 11.3% African American, 0.4% Native American, 0.9% Asian, 0.1% Pacific Islander, 5.7% from other races, and 2.4% from two or more races. Hispanic or Latino of any race were 17.2% of the population.
There were 5,093 households, out of which 24.2% had children under the age of 18 living with them, 41.2% were married couples living together, 14.2% had a female householder with no husband present, and 39.2% were non-families. 32.2% of all households were made up of individuals, and 14.2% had someone living alone who was 65 years of age or older. The average household size was 2.44 and the average family size was 3.06.
In the city, the population was spread out, with 22.7% under the age of 18, 8.3% from 18 to 24, 25.2% from 25 to 44, 24.2% from 45 to 64, and 19.6% who were 65 years of age or older. The median age was 40 years. For every 100 females, there were 93.2 males. For every 100 females age 18 and over, there were 89.7 males.
The median income for a household in the city was $30,945, and the median income for a family was $37,813. Males had a median income of $30,945 versus $22,917 for females. The per capita income for the city was $17,890. About 13.2% of families and 16.3% of the population were below the poverty line, including 22.2% of those under age 18 and 10.2% of those age 65 or over.
Common Questions
What is Per Capita Income in Palmetto?
Per Capita income in Palmetto is $34,911.
What is the Median Family Income in Palmetto?
Median Family Income in Palmetto is $70,814.
What is the Median Household income in Palmetto?
Median Household Income in Palmetto is $55,584.
What is Income or Wage Gap in Palmetto?
Income or Wage Gap in Palmetto is 10.2%.
Women in Palmetto earn 89.8 cents for every dollar earned by a man.
What is Inequality or Gini Index in Palmetto?
Inequality or Gini Index in Palmetto is 0.50.
What is the Total Population of Palmetto?
Total Population of Palmetto is 13,384.
What is the Total Male Population of Palmetto?
Total Male Population of Palmetto is 6,468.
What is the Total Female Population of Palmetto?
Total Female Population of Palmetto is 6,916.
What is the Ratio of Males per 100 Females in Palmetto?
There are 93.52 Males per 100 Females in Palmetto.
What is the Ratio of Females per 100 Males in Palmetto?
There are 106.93 Females per 100 Males in Palmetto.
What is the Median Population Age in Palmetto?
Median Population Age in Palmetto is 50.0 Years.
What is the Average Family Size in Palmetto
Average Family Size in Palmetto is 3.2 People.
What is the Average Household Size in Palmetto
Average Household Size in Palmetto is 2.7 People.
How Large is the Labor Force in Palmetto?
There are 5,859 People in the Labor Forcein in Palmetto.
What is the Percentage of People in the Labor Force in Palmetto?
53.4% of People are in the Labor Force in Palmetto.
What is the Unemployment Rate in Palmetto?
Unemployment Rate in Palmetto is 6.7%.