Palm Shores, FL Map & Demographics
Palm Shores Map
Palm Shores Overview
$51,619
PER CAPITA INCOME
$118,182
AVG FAMILY INCOME
$98,125
AVG HOUSEHOLD INCOME
56.2%
WAGE / INCOME GAP [ % ]
43.8¢/ $1
WAGE / INCOME GAP [ $ ]
0.51
INEQUALITY / GINI INDEX
1,577
TOTAL POPULATION
720
MALE POPULATION
857
FEMALE POPULATION
84.01
MALES / 100 FEMALES
119.03
FEMALES / 100 MALES
43.3
MEDIAN AGE
3.2
AVG FAMILY SIZE
2.8
AVG HOUSEHOLD SIZE
962
LABOR FORCE [ PEOPLE ]
73.3%
PERCENT IN LABOR FORCE
1.6%
UNEMPLOYMENT RATE
Palm Shores Area Codes
Income in Palm Shores
Income Overview in Palm Shores
Per Capita Income in Palm Shores is $51,619, while median incomes of families and households are $118,182 and $98,125 respectively.
| Characteristic | Number | Measure |
| Per Capita Income | 1,577 | $51,619 |
| Median Family Income | 436 | $118,182 |
| Mean Family Income | 436 | $160,457 |
| Median Household Income | 569 | $98,125 |
| Mean Household Income | 569 | $136,321 |
| Income Deficit | 436 | $0 |
| Wage / Income Gap (%) | 1,577 | 56.16% |
| Wage / Income Gap ($) | 1,577 | 43.84¢ per $1 |
| Gini / Inequality Index | 1,577 | 0.51 |
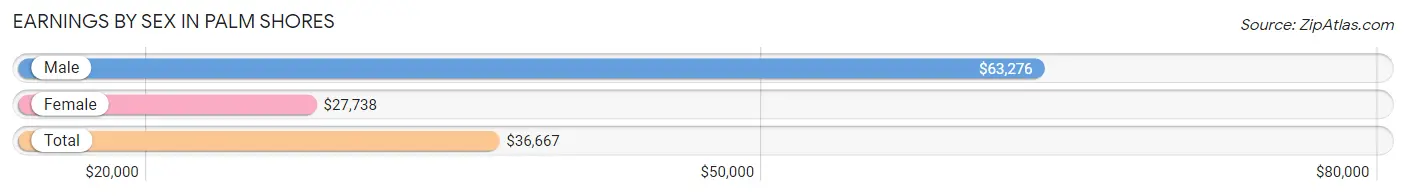
Earnings by Sex in Palm Shores
Average Earnings in Palm Shores are $36,667, $63,276 for men and $27,738 for women, a difference of 56.2%.
| Sex | Number | Average Earnings |
| Male | 476 (48.0%) | $63,276 |
| Female | 516 (52.0%) | $27,738 |
| Total | 992 (100.0%) | $36,667 |
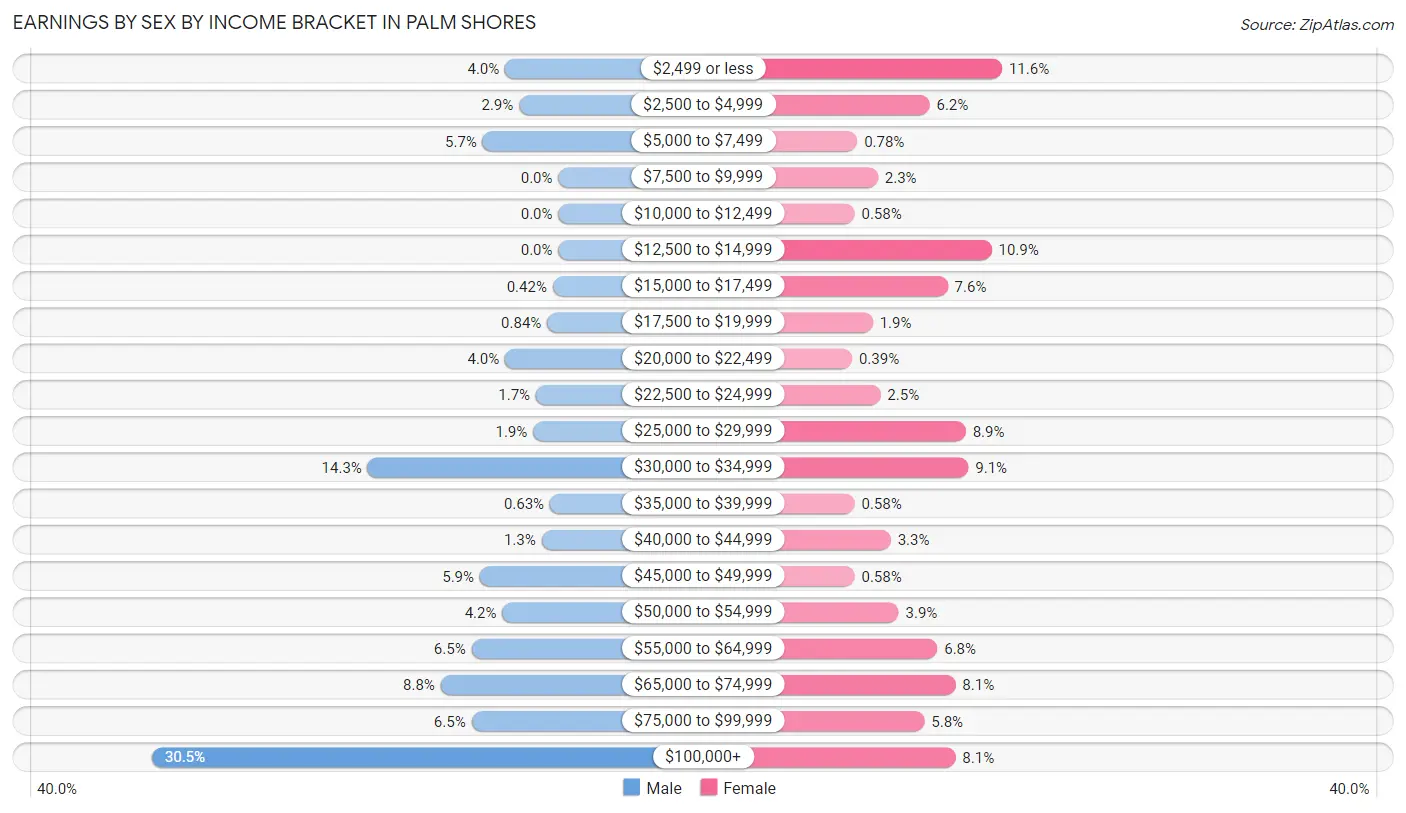
Earnings by Sex by Income Bracket in Palm Shores
The most common earnings brackets in Palm Shores are $100,000+ for men (145 | 30.5%) and $2,499 or less for women (60 | 11.6%).
| Income | Male | Female |
| $2,499 or less | 19 (4.0%) | 60 (11.6%) |
| $2,500 to $4,999 | 14 (2.9%) | 32 (6.2%) |
| $5,000 to $7,499 | 27 (5.7%) | 4 (0.8%) |
| $7,500 to $9,999 | 0 (0.0%) | 12 (2.3%) |
| $10,000 to $12,499 | 0 (0.0%) | 3 (0.6%) |
| $12,500 to $14,999 | 0 (0.0%) | 56 (10.8%) |
| $15,000 to $17,499 | 2 (0.4%) | 39 (7.6%) |
| $17,500 to $19,999 | 4 (0.8%) | 10 (1.9%) |
| $20,000 to $22,499 | 19 (4.0%) | 2 (0.4%) |
| $22,500 to $24,999 | 8 (1.7%) | 13 (2.5%) |
| $25,000 to $29,999 | 9 (1.9%) | 46 (8.9%) |
| $30,000 to $34,999 | 68 (14.3%) | 47 (9.1%) |
| $35,000 to $39,999 | 3 (0.6%) | 3 (0.6%) |
| $40,000 to $44,999 | 6 (1.3%) | 17 (3.3%) |
| $45,000 to $49,999 | 28 (5.9%) | 3 (0.6%) |
| $50,000 to $54,999 | 20 (4.2%) | 20 (3.9%) |
| $55,000 to $64,999 | 31 (6.5%) | 35 (6.8%) |
| $65,000 to $74,999 | 42 (8.8%) | 42 (8.1%) |
| $75,000 to $99,999 | 31 (6.5%) | 30 (5.8%) |
| $100,000+ | 145 (30.5%) | 42 (8.1%) |
| Total | 476 (100.0%) | 516 (100.0%) |
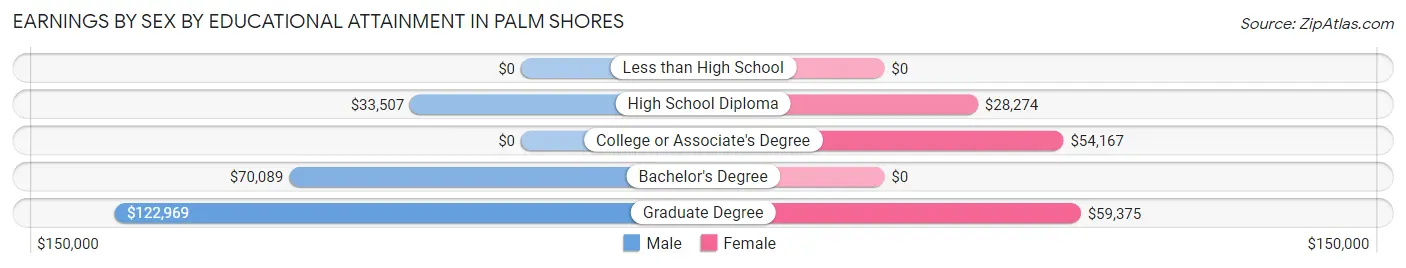
Earnings by Sex by Educational Attainment in Palm Shores
Average earnings in Palm Shores are $63,707 for men and $34,224 for women, a difference of 46.3%. Men with an educational attainment of graduate degree enjoy the highest average annual earnings of $122,969, while those with high school diploma education earn the least with $33,507. Women with an educational attainment of graduate degree earn the most with the average annual earnings of $59,375, while those with high school diploma education have the smallest earnings of $28,274.
| Educational Attainment | Male Income | Female Income |
| Less than High School | - | - |
| High School Diploma | $33,507 | $28,274 |
| College or Associate's Degree | - | - |
| Bachelor's Degree | $70,089 | $0 |
| Graduate Degree | $122,969 | $59,375 |
| Total | $63,707 | $34,224 |
Family Income in Palm Shores
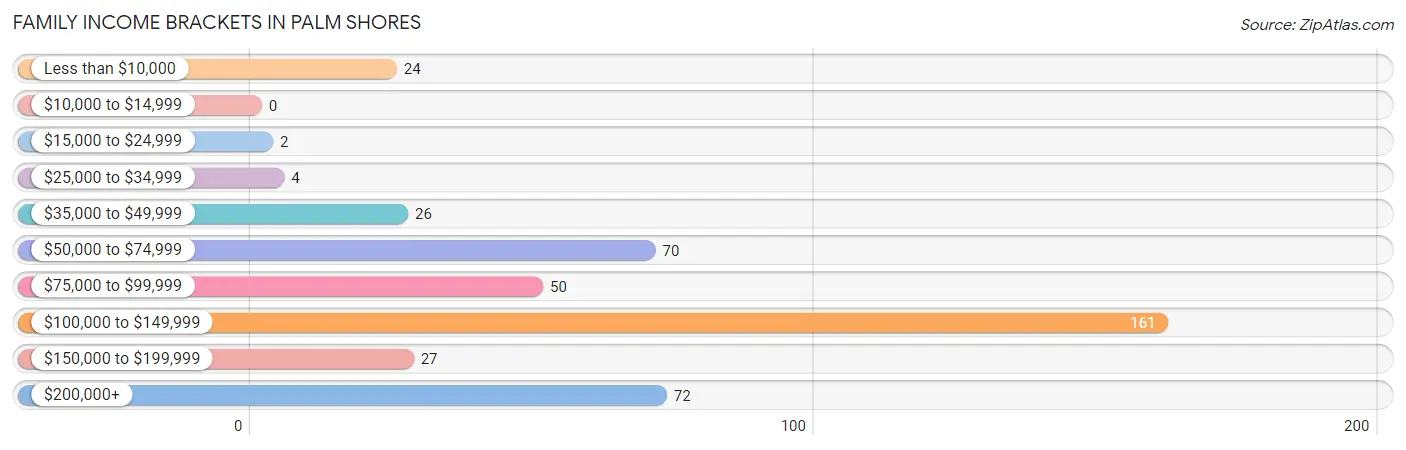
Family Income Brackets in Palm Shores
According to the Palm Shores family income data, there are 161 families falling into the $100,000 to $149,999 income range, which is the most common income bracket and makes up 36.9% of all families.
| Income Bracket | # Families | % Families |
| Less than $10,000 | 24 | 5.5% |
| $10,000 to $14,999 | 0 | 0.0% |
| $15,000 to $24,999 | 2 | 0.5% |
| $25,000 to $34,999 | 4 | 0.9% |
| $35,000 to $49,999 | 26 | 6.0% |
| $50,000 to $74,999 | 70 | 16.1% |
| $75,000 to $99,999 | 50 | 11.5% |
| $100,000 to $149,999 | 161 | 36.9% |
| $150,000 to $199,999 | 27 | 6.2% |
| $200,000+ | 72 | 16.5% |
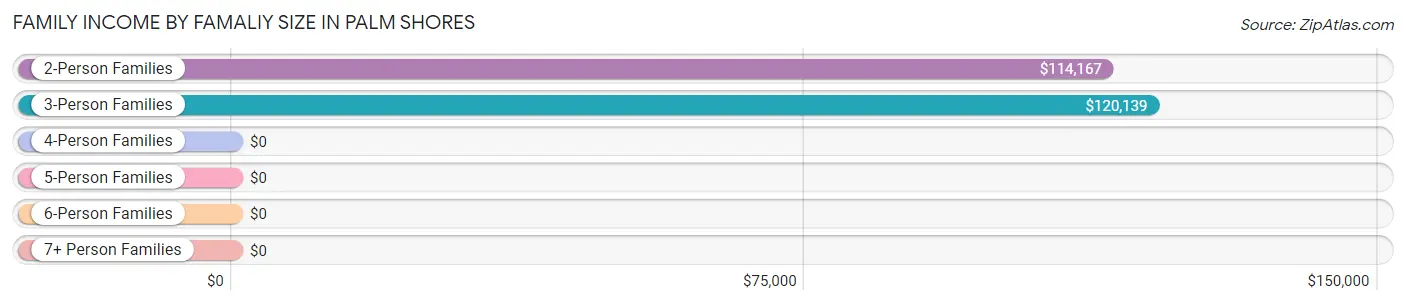
Family Income by Famaliy Size in Palm Shores
3-person families (125 | 28.7%) account for the highest median family income in Palm Shores with $120,139 per family, while 2-person families (188 | 43.1%) have the highest median income of $57,084 per family member.
| Income Bracket | # Families | Median Income |
| 2-Person Families | 188 (43.1%) | $114,167 |
| 3-Person Families | 125 (28.7%) | $120,139 |
| 4-Person Families | 109 (25.0%) | $0 |
| 5-Person Families | 6 (1.4%) | $0 |
| 6-Person Families | 3 (0.7%) | $0 |
| 7+ Person Families | 5 (1.1%) | $0 |
| Total | 436 (100.0%) | $118,182 |
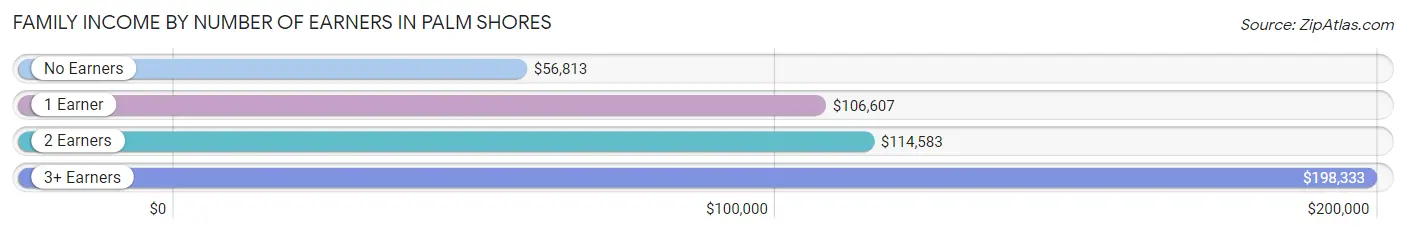
Family Income by Number of Earners in Palm Shores
The median family income in Palm Shores is $118,182, with families comprising 3+ earners (102) having the highest median family income of $198,333, while families with no earners (65) have the lowest median family income of $56,813, accounting for 23.4% and 14.9% of families, respectively.
| Number of Earners | # Families | Median Income |
| No Earners | 65 (14.9%) | $56,813 |
| 1 Earner | 89 (20.4%) | $106,607 |
| 2 Earners | 180 (41.3%) | $114,583 |
| 3+ Earners | 102 (23.4%) | $198,333 |
| Total | 436 (100.0%) | $118,182 |
Household Income in Palm Shores
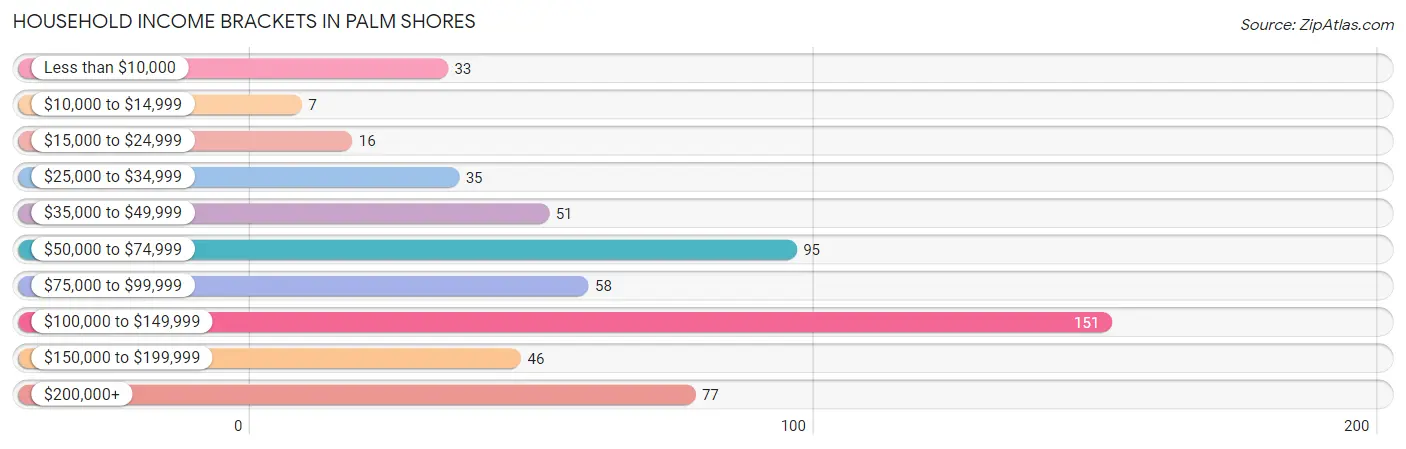
Household Income Brackets in Palm Shores
With 151 households falling in the category, the $100,000 to $149,999 income range is the most frequent in Palm Shores, accounting for 26.5% of all households. In contrast, only 7 households (1.2%) fall into the $10,000 to $14,999 income bracket, making it the least populous group.
| Income Bracket | # Households | % Households |
| Less than $10,000 | 33 | 5.8% |
| $10,000 to $14,999 | 7 | 1.2% |
| $15,000 to $24,999 | 16 | 2.8% |
| $25,000 to $34,999 | 35 | 6.2% |
| $35,000 to $49,999 | 51 | 9.0% |
| $50,000 to $74,999 | 95 | 16.7% |
| $75,000 to $99,999 | 58 | 10.2% |
| $100,000 to $149,999 | 151 | 26.5% |
| $150,000 to $199,999 | 46 | 8.1% |
| $200,000+ | 77 | 13.5% |
Household Income by Householder Age in Palm Shores
The median household income in Palm Shores is $98,125, with the highest median household income of $120,556 found in the 45 to 64 years age bracket for the primary householder. A total of 284 households (49.9%) fall into this category.
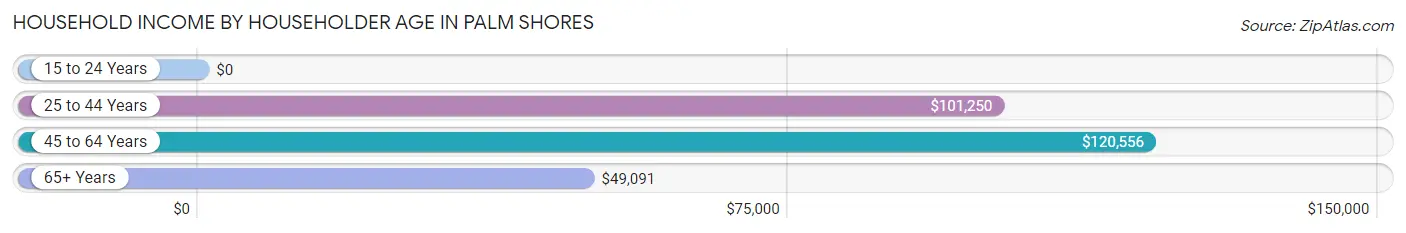
| Income Bracket | # Households | Median Income |
| 15 to 24 Years | 0 (0.0%) | $0 |
| 25 to 44 Years | 157 (27.6%) | $101,250 |
| 45 to 64 Years | 284 (49.9%) | $120,556 |
| 65+ Years | 128 (22.5%) | $49,091 |
| Total | 569 (100.0%) | $98,125 |
Poverty in Palm Shores
Income Below Poverty by Sex and Age in Palm Shores
With 6.6% poverty level for males and 7.5% for females among the residents of Palm Shores, 18 to 24 year old males and 75 year old and over females are the most vulnerable to poverty, with 24 males (44.4%) and 11 females (39.3%) in their respective age groups living below the poverty level.
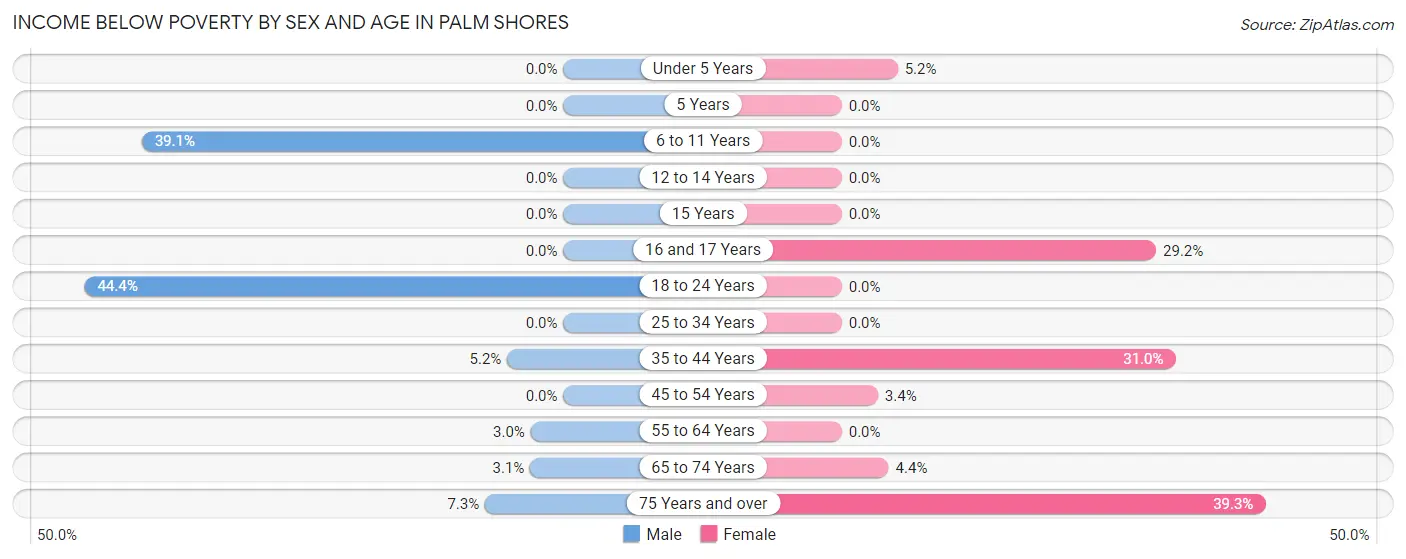
| Age Bracket | Male | Female |
| Under 5 Years | 0 (0.0%) | 4 (5.2%) |
| 5 Years | 0 (0.0%) | 0 (0.0%) |
| 6 to 11 Years | 9 (39.1%) | 0 (0.0%) |
| 12 to 14 Years | 0 (0.0%) | 0 (0.0%) |
| 15 Years | 0 (0.0%) | 0 (0.0%) |
| 16 and 17 Years | 0 (0.0%) | 14 (29.2%) |
| 18 to 24 Years | 24 (44.4%) | 0 (0.0%) |
| 25 to 34 Years | 0 (0.0%) | 0 (0.0%) |
| 35 to 44 Years | 5 (5.2%) | 26 (30.9%) |
| 45 to 54 Years | 0 (0.0%) | 6 (3.4%) |
| 55 to 64 Years | 3 (3.0%) | 0 (0.0%) |
| 65 to 74 Years | 2 (3.1%) | 3 (4.3%) |
| 75 Years and over | 4 (7.3%) | 11 (39.3%) |
| Total | 47 (6.6%) | 64 (7.5%) |
Income Above Poverty by Sex and Age in Palm Shores
According to the poverty statistics in Palm Shores, males aged under 5 years and females aged 5 years are the age groups that are most secure financially, with 100.0% of males and 100.0% of females in these age groups living above the poverty line.
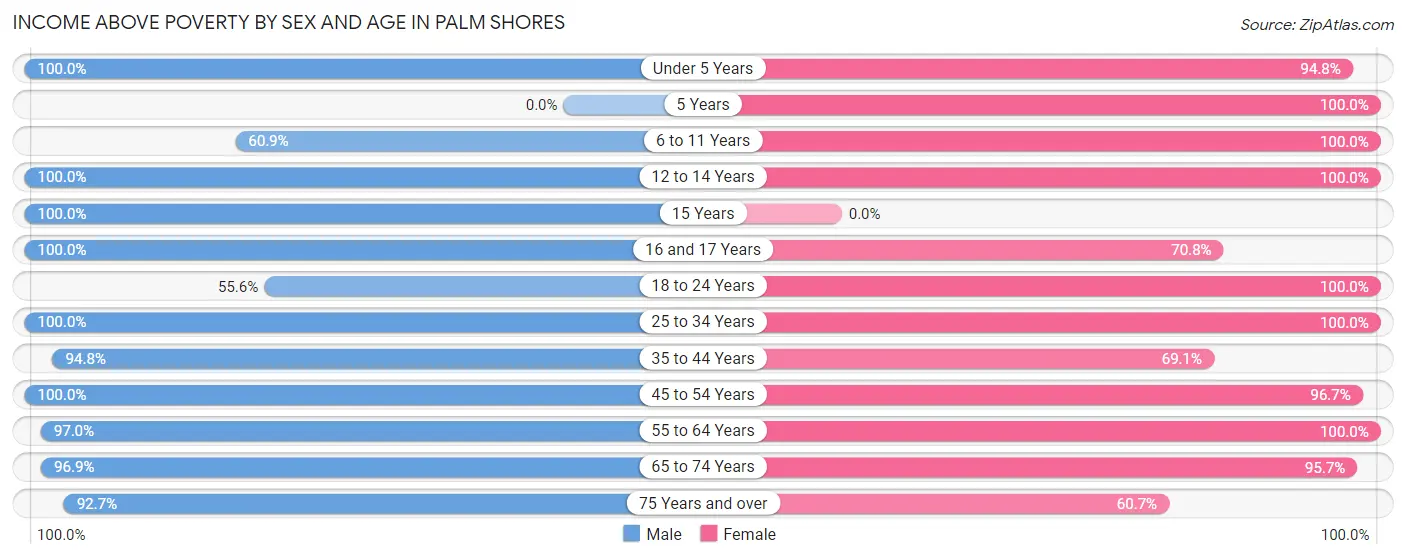
| Age Bracket | Male | Female |
| Under 5 Years | 33 (100.0%) | 73 (94.8%) |
| 5 Years | 0 (0.0%) | 27 (100.0%) |
| 6 to 11 Years | 14 (60.9%) | 21 (100.0%) |
| 12 to 14 Years | 29 (100.0%) | 37 (100.0%) |
| 15 Years | 5 (100.0%) | 0 (0.0%) |
| 16 and 17 Years | 14 (100.0%) | 34 (70.8%) |
| 18 to 24 Years | 30 (55.6%) | 87 (100.0%) |
| 25 to 34 Years | 108 (100.0%) | 101 (100.0%) |
| 35 to 44 Years | 91 (94.8%) | 58 (69.1%) |
| 45 to 54 Years | 127 (100.0%) | 173 (96.7%) |
| 55 to 64 Years | 96 (97.0%) | 99 (100.0%) |
| 65 to 74 Years | 63 (96.9%) | 66 (95.7%) |
| 75 Years and over | 51 (92.7%) | 17 (60.7%) |
| Total | 661 (93.4%) | 793 (92.5%) |
Income Below Poverty Among Married-Couple Families in Palm Shores
The poverty statistics for married-couple families in Palm Shores show that 1.6% or 6 of the total 374 families live below the poverty line. Families with 1 or 2 children have the highest poverty rate of 4.3%, comprising of 6 families. On the other hand, families with no children have the lowest poverty rate of 0.0%, which includes 0 families.
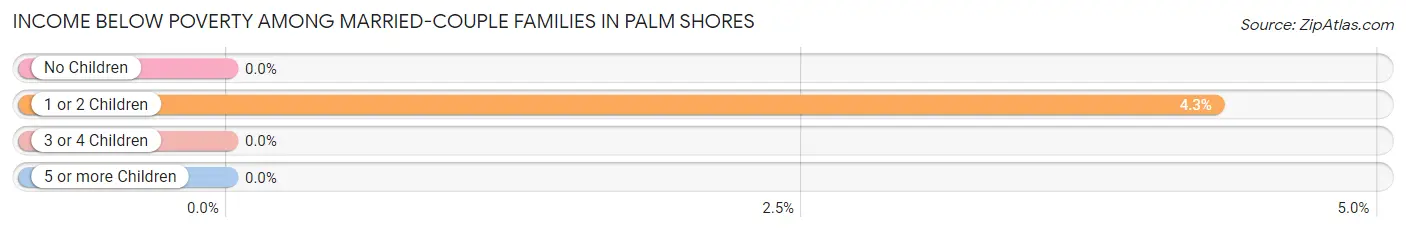
| Children | Above Poverty | Below Poverty |
| No Children | 226 (100.0%) | 0 (0.0%) |
| 1 or 2 Children | 134 (95.7%) | 6 (4.3%) |
| 3 or 4 Children | 8 (100.0%) | 0 (0.0%) |
| 5 or more Children | 0 (0.0%) | 0 (0.0%) |
| Total | 368 (98.4%) | 6 (1.6%) |
Income Below Poverty Among Single-Parent Households in Palm Shores
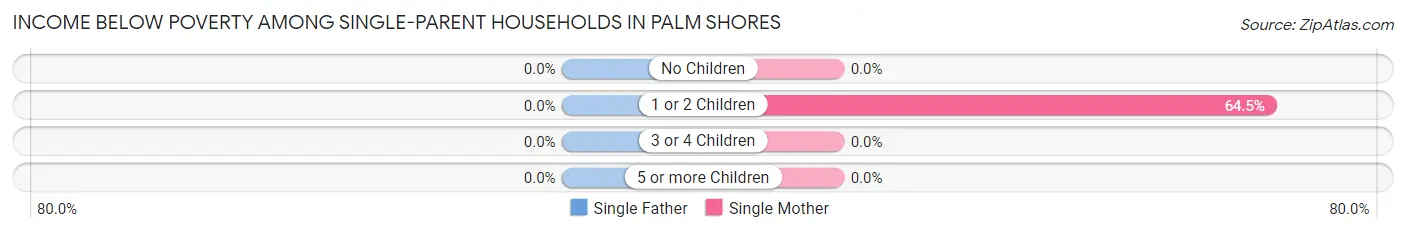
| Children | Single Father | Single Mother |
| No Children | 0 (0.0%) | 0 (0.0%) |
| 1 or 2 Children | 0 (0.0%) | 20 (64.5%) |
| 3 or 4 Children | 0 (0.0%) | 0 (0.0%) |
| 5 or more Children | 0 (0.0%) | 0 (0.0%) |
| Total | 0 (0.0%) | 20 (51.3%) |
Income Below Poverty Among Married-Couple vs Single-Parent Households in Palm Shores
The poverty data for Palm Shores shows that 6 of the married-couple family households (1.6%) and 20 of the single-parent households (32.3%) are living below the poverty level. Within the married-couple family households, those with 1 or 2 children have the highest poverty rate, with 6 households (4.3%) falling below the poverty line. Among the single-parent households, those with 1 or 2 children have the highest poverty rate, with 20 household (38.5%) living below poverty.
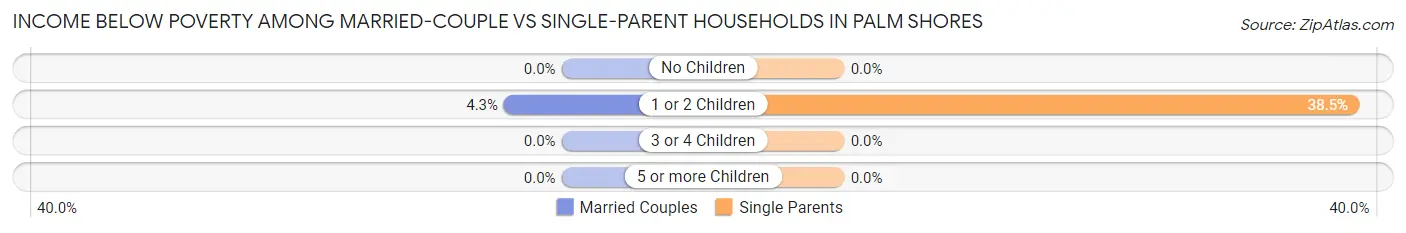
| Children | Married-Couple Families | Single-Parent Households |
| No Children | 0 (0.0%) | 0 (0.0%) |
| 1 or 2 Children | 6 (4.3%) | 20 (38.5%) |
| 3 or 4 Children | 0 (0.0%) | 0 (0.0%) |
| 5 or more Children | 0 (0.0%) | 0 (0.0%) |
| Total | 6 (1.6%) | 20 (32.3%) |
Race in Palm Shores
The most populous races in Palm Shores are White / Caucasian (1,214 | 77.0%), Hispanic or Latino (404 | 25.6%), and Two or more Races (197 | 12.5%).
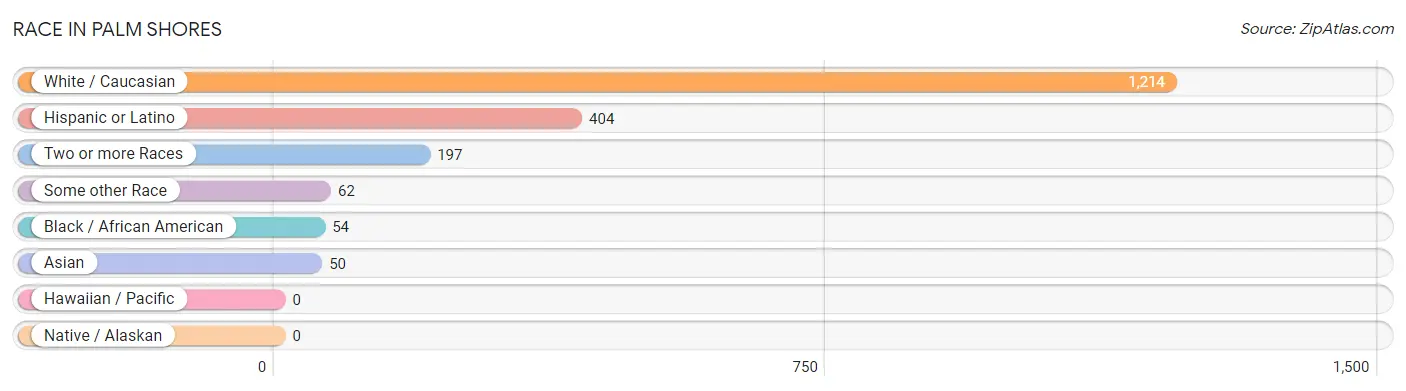
| Race | # Population | % Population |
| Asian | 50 | 3.2% |
| Black / African American | 54 | 3.4% |
| Hawaiian / Pacific | 0 | 0.0% |
| Hispanic or Latino | 404 | 25.6% |
| Native / Alaskan | 0 | 0.0% |
| White / Caucasian | 1,214 | 77.0% |
| Two or more Races | 197 | 12.5% |
| Some other Race | 62 | 3.9% |
| Total | 1,577 | 100.0% |
Ancestry in Palm Shores
The most populous ancestries reported in Palm Shores are English (224 | 14.2%), South American (176 | 11.2%), Irish (163 | 10.3%), German (156 | 9.9%), and European (139 | 8.8%), together accounting for 54.4% of all Palm Shores residents.
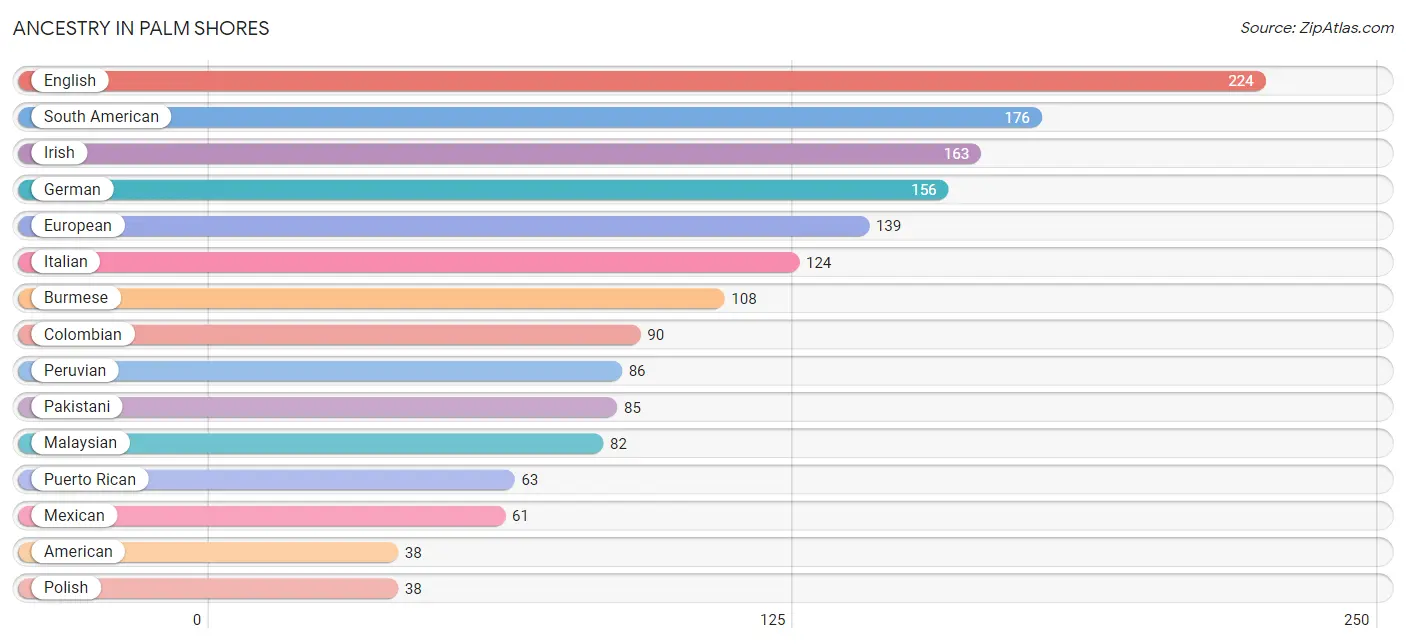
| Ancestry | # Population | % Population |
| American | 38 | 2.4% |
| Apache | 5 | 0.3% |
| Armenian | 3 | 0.2% |
| Belgian | 11 | 0.7% |
| Bhutanese | 18 | 1.1% |
| British | 27 | 1.7% |
| Burmese | 108 | 6.9% |
| Central American | 9 | 0.6% |
| Cherokee | 3 | 0.2% |
| Colombian | 90 | 5.7% |
| Cuban | 22 | 1.4% |
| Czech | 31 | 2.0% |
| Eastern European | 12 | 0.8% |
| English | 224 | 14.2% |
| European | 139 | 8.8% |
| French | 21 | 1.3% |
| French Canadian | 17 | 1.1% |
| German | 156 | 9.9% |
| Irish | 163 | 10.3% |
| Italian | 124 | 7.9% |
| Korean | 24 | 1.5% |
| Malaysian | 82 | 5.2% |
| Mexican | 61 | 3.9% |
| Norwegian | 3 | 0.2% |
| Pakistani | 85 | 5.4% |
| Panamanian | 9 | 0.6% |
| Peruvian | 86 | 5.4% |
| Polish | 38 | 2.4% |
| Puerto Rican | 63 | 4.0% |
| Russian | 5 | 0.3% |
| Scotch-Irish | 3 | 0.2% |
| Scottish | 14 | 0.9% |
| South American | 176 | 11.2% |
| Spaniard | 6 | 0.4% |
| Spanish | 14 | 0.9% |
| Sri Lankan | 1 | 0.1% |
| Swedish | 4 | 0.3% |
| Welsh | 13 | 0.8% | View All 38 Rows |
Immigrants in Palm Shores
The most numerous immigrant groups reported in Palm Shores came from Latin America (112 | 7.1%), Colombia (60 | 3.8%), South America (60 | 3.8%), Central America (52 | 3.3%), and Asia (50 | 3.2%), together accounting for 21.2% of all Palm Shores residents.
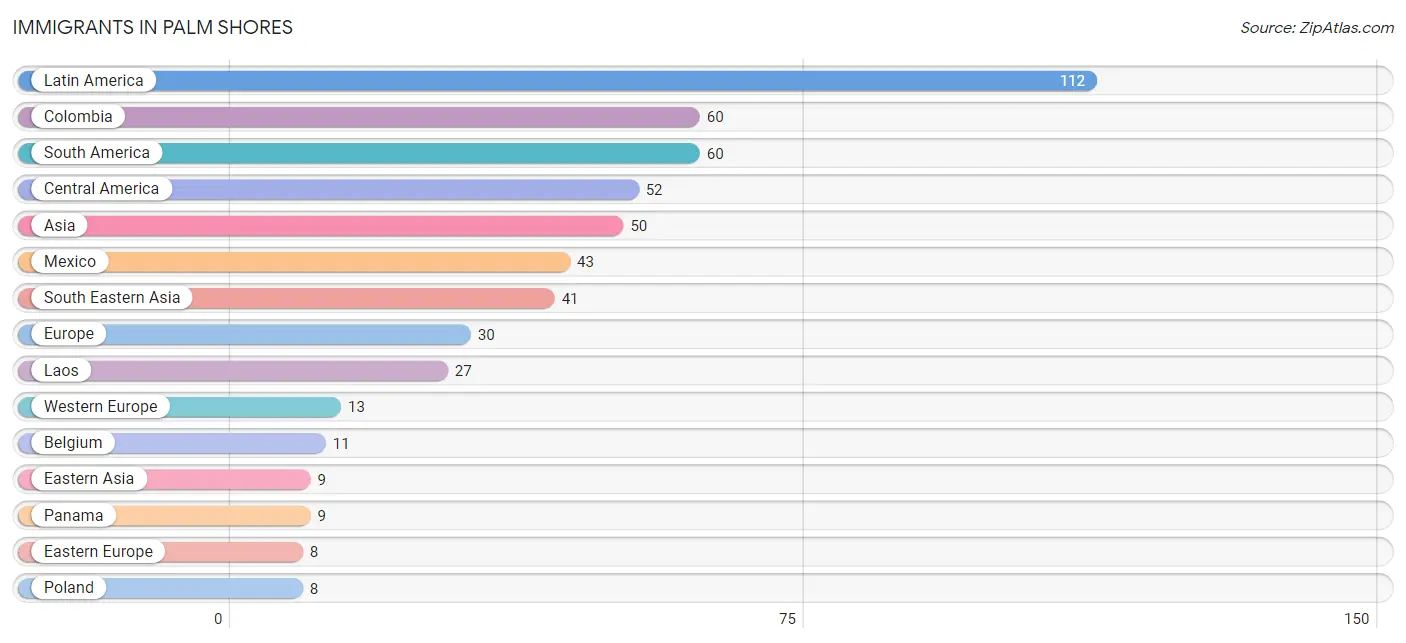
| Immigration Origin | # Population | % Population |
| Asia | 50 | 3.2% |
| Belgium | 11 | 0.7% |
| Central America | 52 | 3.3% |
| Colombia | 60 | 3.8% |
| Eastern Asia | 9 | 0.6% |
| Eastern Europe | 8 | 0.5% |
| England | 7 | 0.4% |
| Europe | 30 | 1.9% |
| Germany | 2 | 0.1% |
| Italy | 2 | 0.1% |
| Japan | 7 | 0.4% |
| Korea | 2 | 0.1% |
| Laos | 27 | 1.7% |
| Latin America | 112 | 7.1% |
| Mexico | 43 | 2.7% |
| Northern Europe | 7 | 0.4% |
| Panama | 9 | 0.6% |
| Philippines | 7 | 0.4% |
| Poland | 8 | 0.5% |
| South America | 60 | 3.8% |
| South Eastern Asia | 41 | 2.6% |
| Southern Europe | 2 | 0.1% |
| Thailand | 3 | 0.2% |
| Vietnam | 4 | 0.3% |
| Western Europe | 13 | 0.8% | View All 25 Rows |
Sex and Age in Palm Shores
Sex and Age in Palm Shores
The most populous age groups in Palm Shores are 40 to 44 Years (79 | 11.0%) for men and 45 to 49 Years (105 | 12.2%) for women.
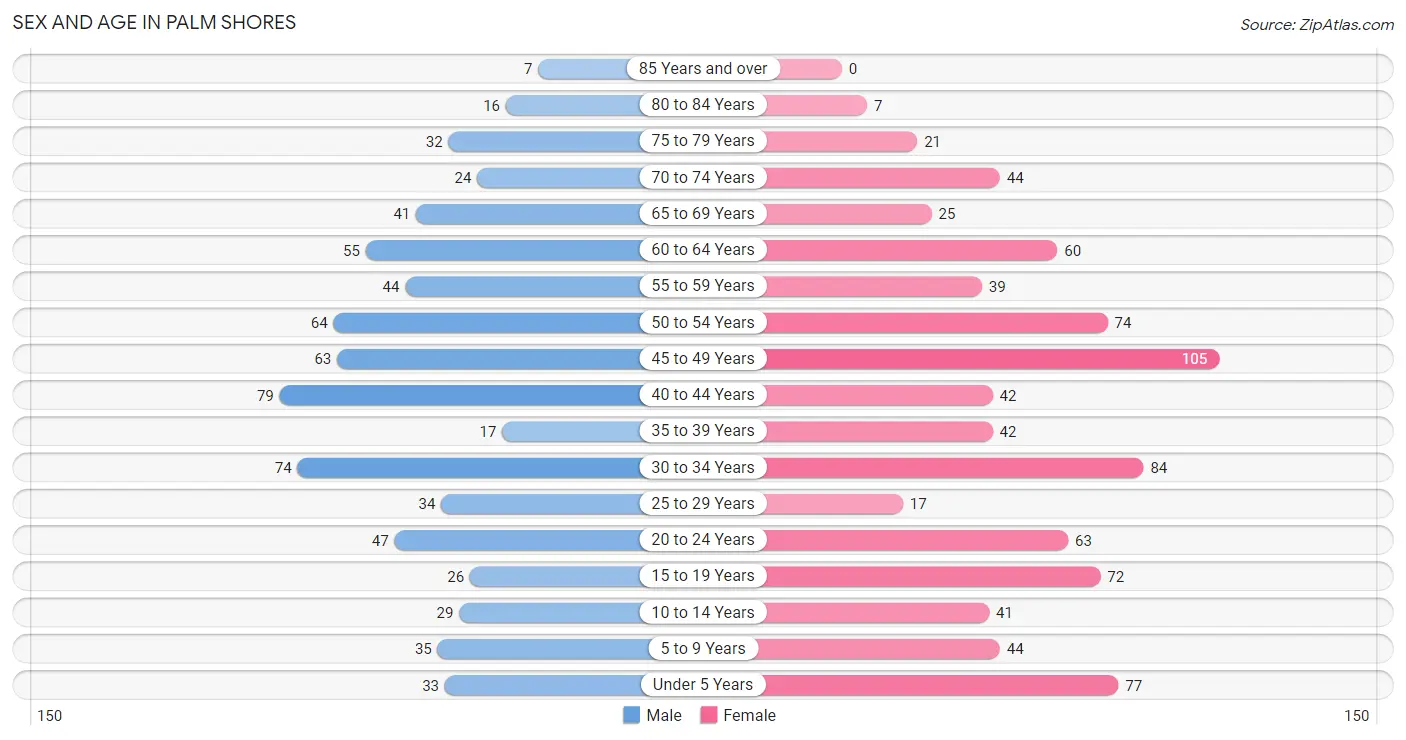
| Age Bracket | Male | Female |
| Under 5 Years | 33 (4.6%) | 77 (9.0%) |
| 5 to 9 Years | 35 (4.9%) | 44 (5.1%) |
| 10 to 14 Years | 29 (4.0%) | 41 (4.8%) |
| 15 to 19 Years | 26 (3.6%) | 72 (8.4%) |
| 20 to 24 Years | 47 (6.5%) | 63 (7.3%) |
| 25 to 29 Years | 34 (4.7%) | 17 (2.0%) |
| 30 to 34 Years | 74 (10.3%) | 84 (9.8%) |
| 35 to 39 Years | 17 (2.4%) | 42 (4.9%) |
| 40 to 44 Years | 79 (11.0%) | 42 (4.9%) |
| 45 to 49 Years | 63 (8.7%) | 105 (12.2%) |
| 50 to 54 Years | 64 (8.9%) | 74 (8.6%) |
| 55 to 59 Years | 44 (6.1%) | 39 (4.5%) |
| 60 to 64 Years | 55 (7.6%) | 60 (7.0%) |
| 65 to 69 Years | 41 (5.7%) | 25 (2.9%) |
| 70 to 74 Years | 24 (3.3%) | 44 (5.1%) |
| 75 to 79 Years | 32 (4.4%) | 21 (2.5%) |
| 80 to 84 Years | 16 (2.2%) | 7 (0.8%) |
| 85 Years and over | 7 (1.0%) | 0 (0.0%) |
| Total | 720 (100.0%) | 857 (100.0%) |
Families and Households in Palm Shores
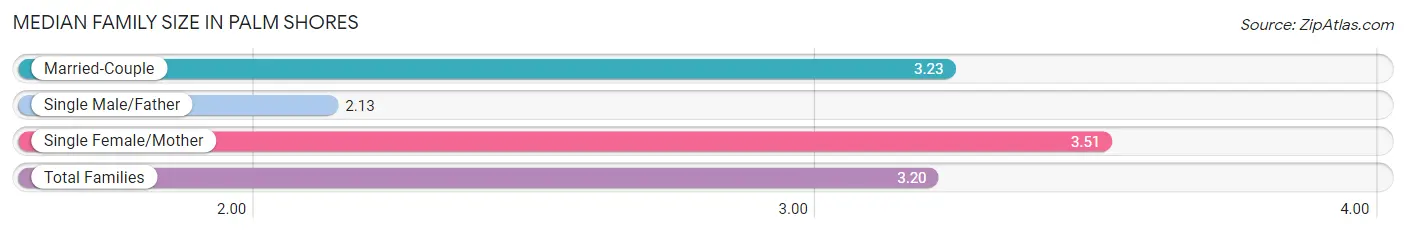
Median Family Size in Palm Shores
The median family size in Palm Shores is 3.20 persons per family, with single female/mother families (39 | 8.9%) accounting for the largest median family size of 3.51 persons per family. On the other hand, single male/father families (23 | 5.3%) represent the smallest median family size with 2.13 persons per family.
| Family Type | # Families | Family Size |
| Married-Couple | 374 (85.8%) | 3.23 |
| Single Male/Father | 23 (5.3%) | 2.13 |
| Single Female/Mother | 39 (8.9%) | 3.51 |
| Total Families | 436 (100.0%) | 3.20 |
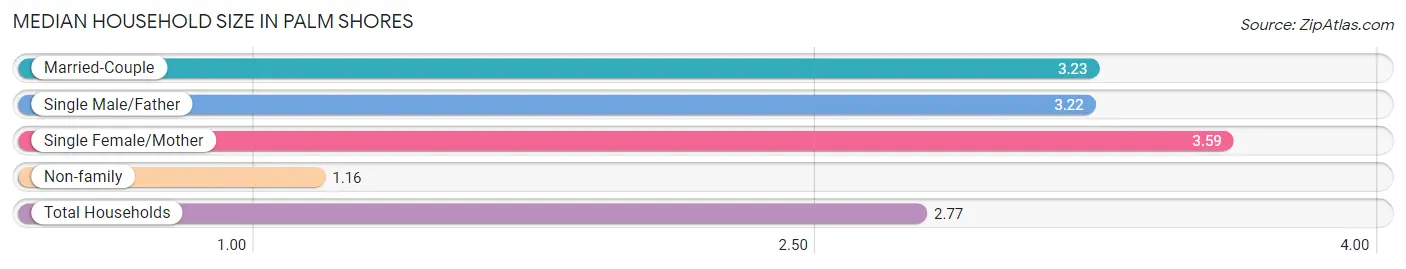
Median Household Size in Palm Shores
The median household size in Palm Shores is 2.77 persons per household, with single female/mother households (39 | 6.9%) accounting for the largest median household size of 3.59 persons per household. non-family households (133 | 23.4%) represent the smallest median household size with 1.16 persons per household.
| Household Type | # Households | Household Size |
| Married-Couple | 374 (65.7%) | 3.23 |
| Single Male/Father | 23 (4.0%) | 3.22 |
| Single Female/Mother | 39 (6.9%) | 3.59 |
| Non-family | 133 (23.4%) | 1.16 |
| Total Households | 569 (100.0%) | 2.77 |
Household Size by Marriage Status in Palm Shores
Out of a total of 569 households in Palm Shores, 436 (76.6%) are family households, while 133 (23.4%) are nonfamily households. The most numerous type of family households are 2-person households, comprising 166, and the most common type of nonfamily households are 1-person households, comprising 116.
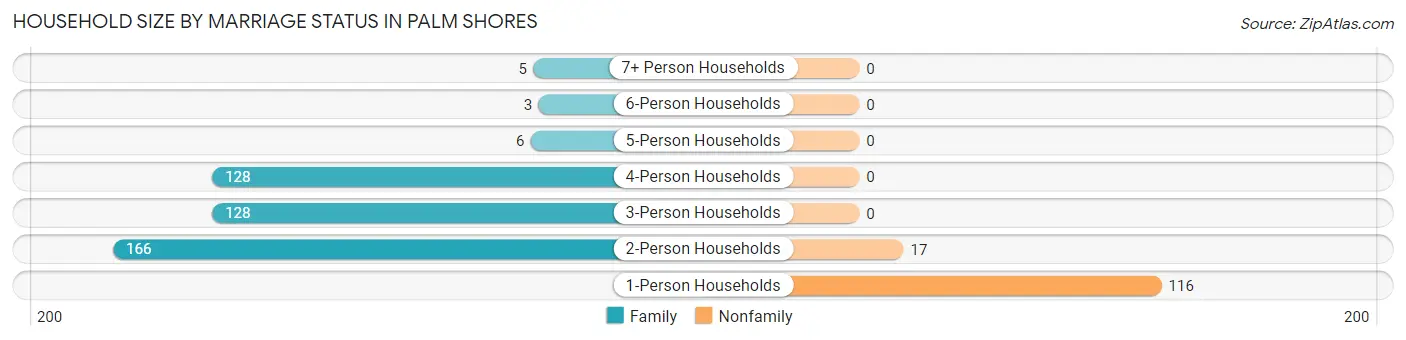
| Household Size | Family Households | Nonfamily Households |
| 1-Person Households | - | 116 (20.4%) |
| 2-Person Households | 166 (29.2%) | 17 (3.0%) |
| 3-Person Households | 128 (22.5%) | 0 (0.0%) |
| 4-Person Households | 128 (22.5%) | 0 (0.0%) |
| 5-Person Households | 6 (1.1%) | 0 (0.0%) |
| 6-Person Households | 3 (0.5%) | 0 (0.0%) |
| 7+ Person Households | 5 (0.9%) | 0 (0.0%) |
| Total | 436 (76.6%) | 133 (23.4%) |
Female Fertility in Palm Shores
Fertility by Age in Palm Shores
Average fertility rate in Palm Shores is 96.0 births per 1,000 women. Women in the age bracket of 20 to 34 years have the highest fertility rate with 232.0 births per 1,000 women. Women in the age bracket of 20 to 34 years acount for 90.5% of all women with births.
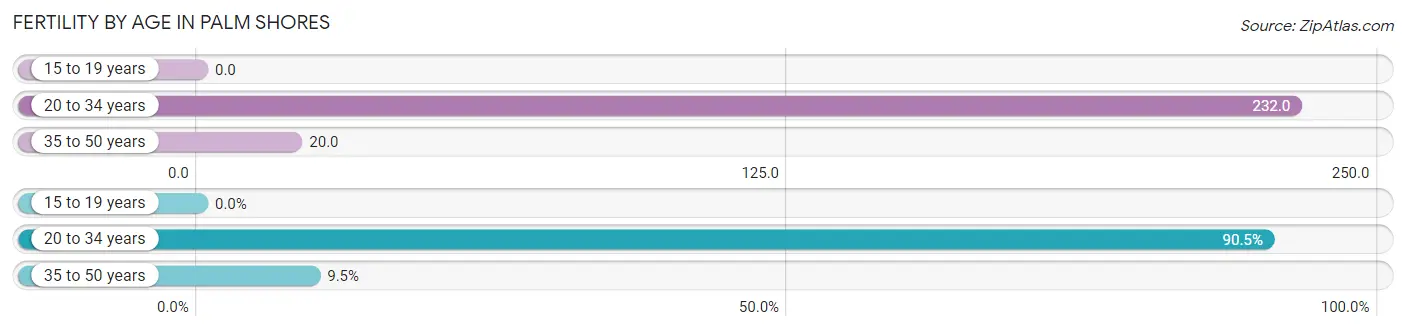
| Age Bracket | Women with Births | Births / 1,000 Women |
| 15 to 19 years | 0 (0.0%) | 0.0 |
| 20 to 34 years | 38 (90.5%) | 232.0 |
| 35 to 50 years | 4 (9.5%) | 20.0 |
| Total | 42 (100.0%) | 96.0 |
Fertility by Age by Marriage Status in Palm Shores
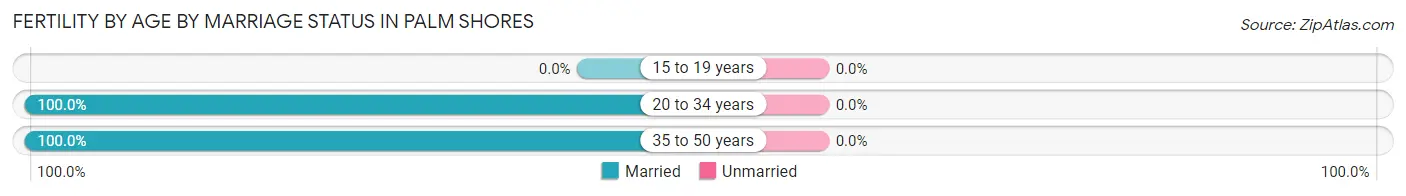
| Age Bracket | Married | Unmarried |
| 15 to 19 years | 0 (0.0%) | 0 (0.0%) |
| 20 to 34 years | 38 (100.0%) | 0 (0.0%) |
| 35 to 50 years | 4 (100.0%) | 0 (0.0%) |
| Total | 42 (100.0%) | 0 (0.0%) |
Fertility by Education in Palm Shores
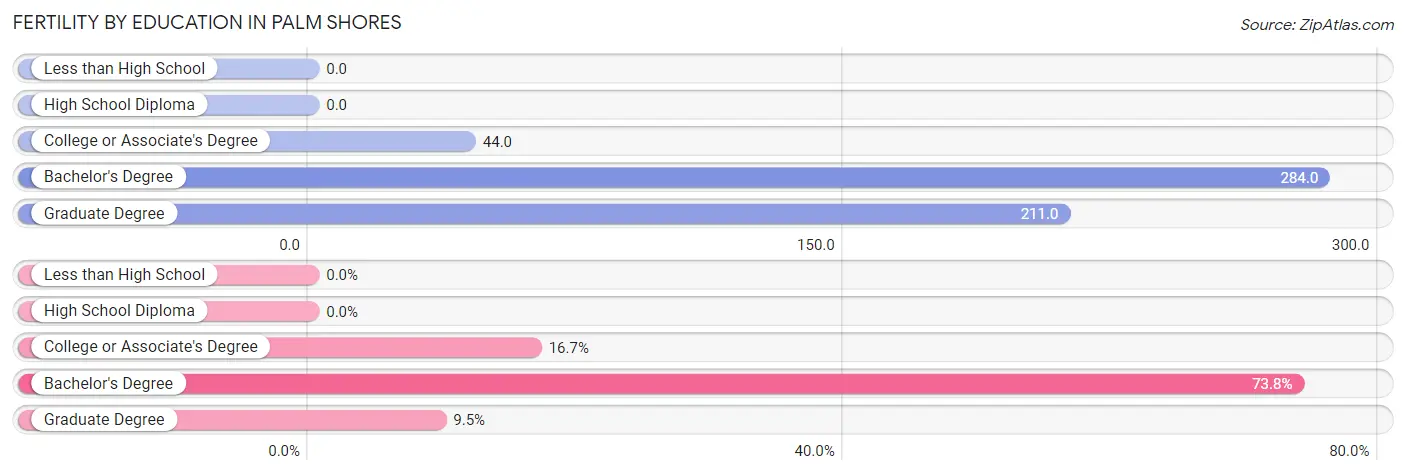
| Educational Attainment | Women with Births | Births / 1,000 Women |
| Less than High School | 0 (0.0%) | 0.0 |
| High School Diploma | 0 (0.0%) | 0.0 |
| College or Associate's Degree | 7 (16.7%) | 44.0 |
| Bachelor's Degree | 31 (73.8%) | 284.0 |
| Graduate Degree | 4 (9.5%) | 211.0 |
| Total | 42 (100.0%) | 96.0 |
Fertility by Education by Marriage Status in Palm Shores
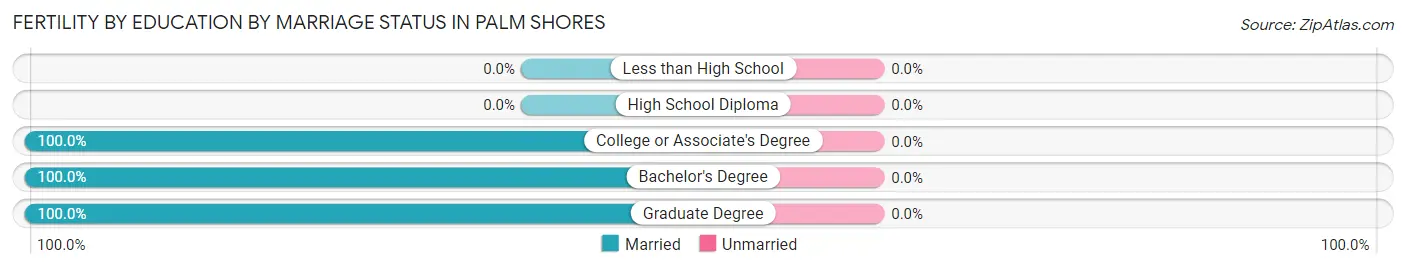
| Educational Attainment | Married | Unmarried |
| Less than High School | 0 (0.0%) | 0 (0.0%) |
| High School Diploma | 0 (0.0%) | 0 (0.0%) |
| College or Associate's Degree | 7 (100.0%) | 0 (0.0%) |
| Bachelor's Degree | 31 (100.0%) | 0 (0.0%) |
| Graduate Degree | 4 (100.0%) | 0 (0.0%) |
| Total | 42 (100.0%) | 0 (0.0%) |
Employment Characteristics in Palm Shores
Employment by Class of Employer in Palm Shores
Among the 944 employed individuals in Palm Shores, private company employees (671 | 71.1%), self-employed (not incorporated) (91 | 9.6%), and federal government employees (63 | 6.7%) make up the most common classes of employment.
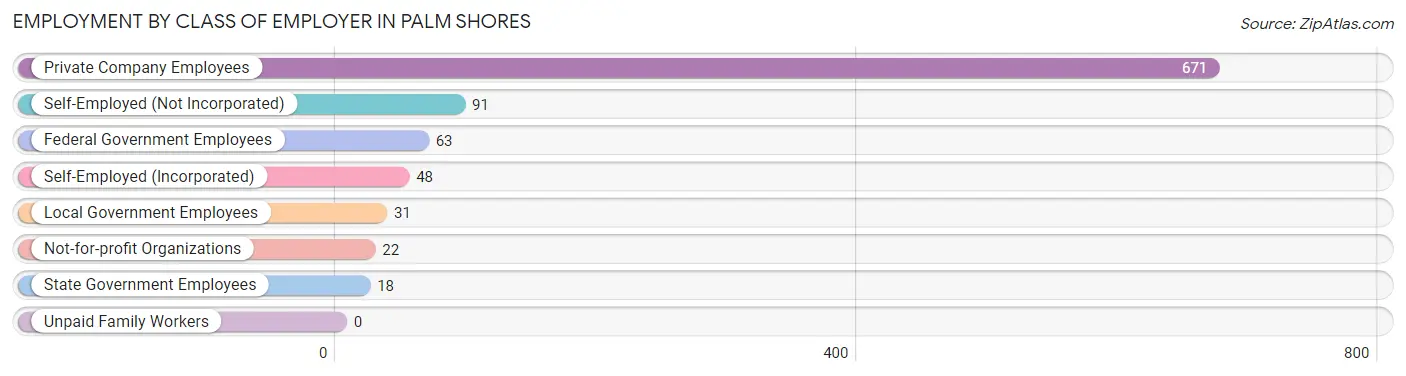
| Employer Class | # Employees | % Employees |
| Private Company Employees | 671 | 71.1% |
| Self-Employed (Incorporated) | 48 | 5.1% |
| Self-Employed (Not Incorporated) | 91 | 9.6% |
| Not-for-profit Organizations | 22 | 2.3% |
| Local Government Employees | 31 | 3.3% |
| State Government Employees | 18 | 1.9% |
| Federal Government Employees | 63 | 6.7% |
| Unpaid Family Workers | 0 | 0.0% |
| Total | 944 | 100.0% |
Employment Status by Age in Palm Shores
According to the labor force statistics for Palm Shores, out of the total population over 16 years of age (1,313), 73.3% or 962 individuals are in the labor force, with 1.6% or 15 of them unemployed. The age group with the highest labor force participation rate is 30 to 34 years, with 100.0% or 158 individuals in the labor force. Within the labor force, the 30 to 34 years age range has the highest percentage of unemployed individuals, with 7.7% or 12 of them being unemployed.
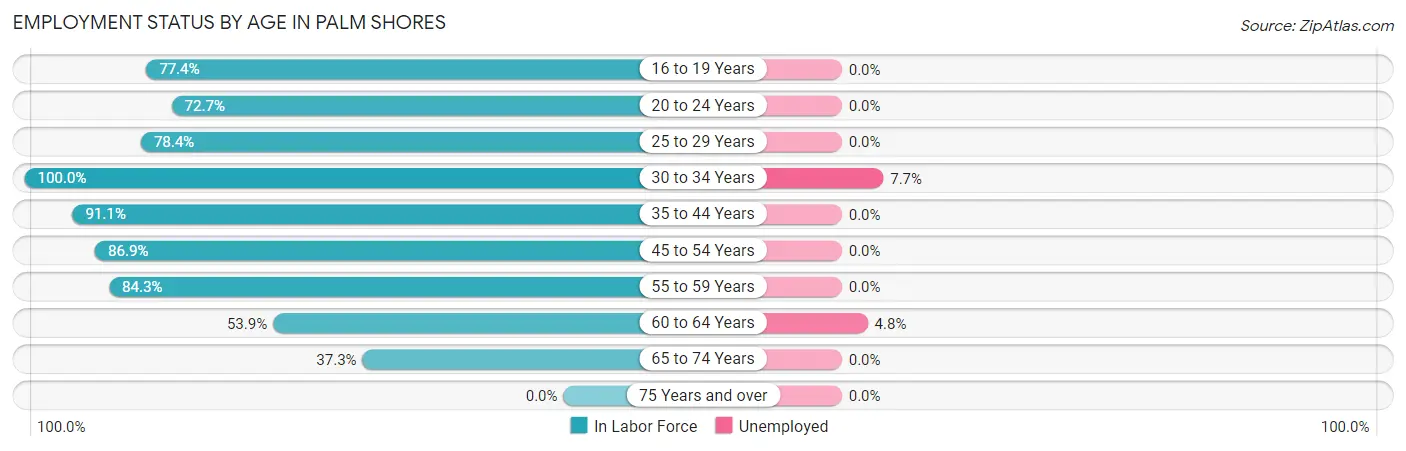
| Age Bracket | In Labor Force | Unemployed |
| 16 to 19 Years | 72 (77.4%) | 0 (0.0%) |
| 20 to 24 Years | 80 (72.7%) | 0 (0.0%) |
| 25 to 29 Years | 40 (78.4%) | 0 (0.0%) |
| 30 to 34 Years | 158 (100.0%) | 12 (7.7%) |
| 35 to 44 Years | 164 (91.1%) | 0 (0.0%) |
| 45 to 54 Years | 266 (86.9%) | 0 (0.0%) |
| 55 to 59 Years | 70 (84.3%) | 0 (0.0%) |
| 60 to 64 Years | 62 (53.9%) | 3 (4.8%) |
| 65 to 74 Years | 50 (37.3%) | 0 (0.0%) |
| 75 Years and over | 0 (0.0%) | 0 (0.0%) |
| Total | 962 (73.3%) | 15 (1.6%) |
Employment Status by Educational Attainment in Palm Shores
According to labor force statistics for Palm Shores, 85.1% of individuals (760) out of the total population between 25 and 64 years of age (893) are in the labor force, with 2.0% or 15 of them being unemployed. The group with the highest labor force participation rate are those with the educational attainment of college / associate degree, with 86.4% or 318 individuals in the labor force. Within the labor force, individuals with less than high school education have the highest percentage of unemployment, with 36.4% or 8 of them being unemployed.
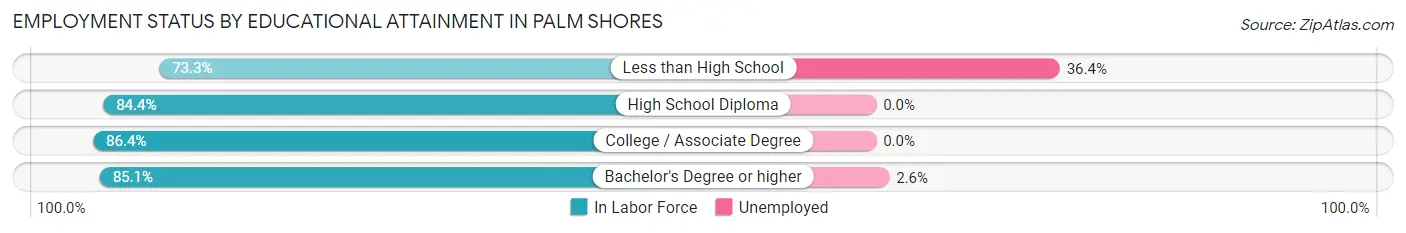
| Educational Attainment | In Labor Force | Unemployed |
| Less than High School | 22 (73.3%) | 11 (36.4%) |
| High School Diploma | 152 (84.4%) | 0 (0.0%) |
| College / Associate Degree | 318 (86.4%) | 0 (0.0%) |
| Bachelor's Degree or higher | 268 (85.1%) | 8 (2.6%) |
| Total | 760 (85.1%) | 18 (2.0%) |
Employment Occupations by Sex in Palm Shores
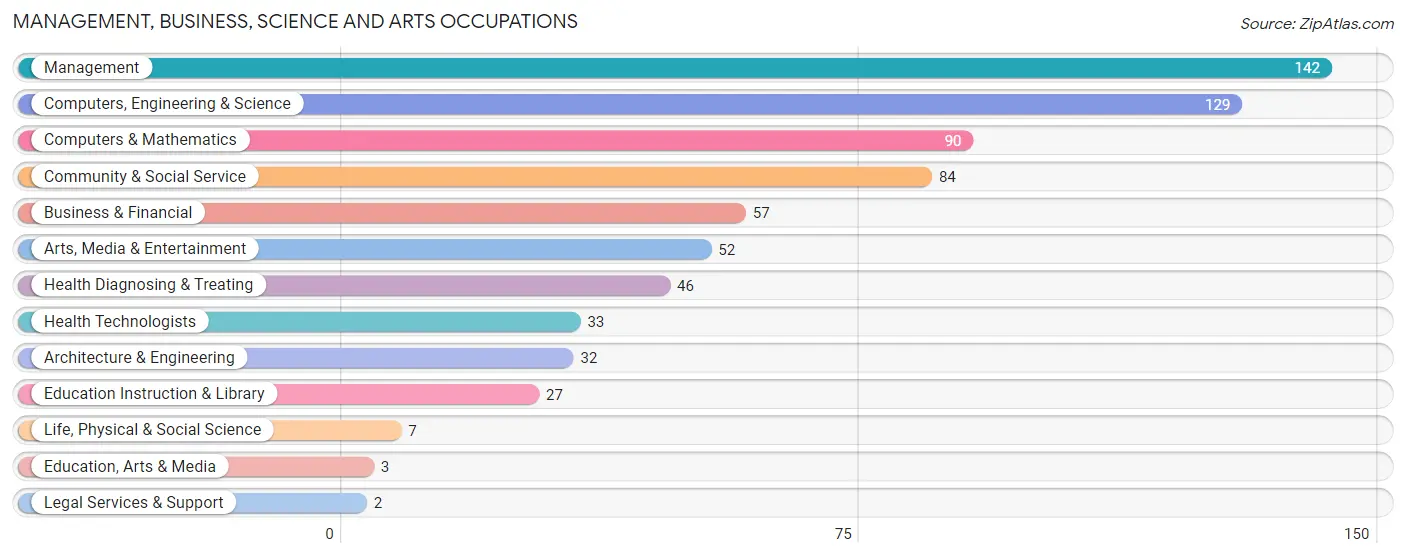
Management, Business, Science and Arts Occupations
The most common Management, Business, Science and Arts occupations in Palm Shores are Management (142 | 15.0%), Computers, Engineering & Science (129 | 13.7%), Computers & Mathematics (90 | 9.5%), Community & Social Service (84 | 8.9%), and Business & Financial (57 | 6.0%).
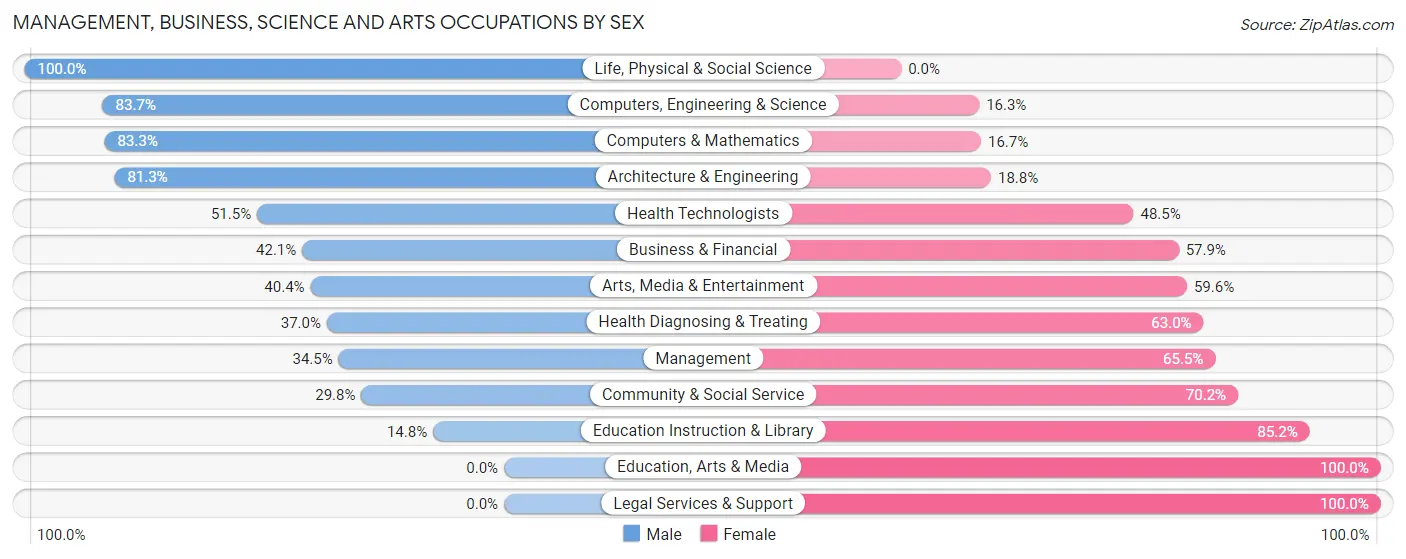
Management, Business, Science and Arts Occupations by Sex
Within the Management, Business, Science and Arts occupations in Palm Shores, the most male-oriented occupations are Life, Physical & Social Science (100.0%), Computers, Engineering & Science (83.7%), and Computers & Mathematics (83.3%), while the most female-oriented occupations are Education, Arts & Media (100.0%), Legal Services & Support (100.0%), and Education Instruction & Library (85.2%).
| Occupation | Male | Female |
| Management | 49 (34.5%) | 93 (65.5%) |
| Business & Financial | 24 (42.1%) | 33 (57.9%) |
| Computers, Engineering & Science | 108 (83.7%) | 21 (16.3%) |
| Computers & Mathematics | 75 (83.3%) | 15 (16.7%) |
| Architecture & Engineering | 26 (81.2%) | 6 (18.8%) |
| Life, Physical & Social Science | 7 (100.0%) | 0 (0.0%) |
| Community & Social Service | 25 (29.8%) | 59 (70.2%) |
| Education, Arts & Media | 0 (0.0%) | 3 (100.0%) |
| Legal Services & Support | 0 (0.0%) | 2 (100.0%) |
| Education Instruction & Library | 4 (14.8%) | 23 (85.2%) |
| Arts, Media & Entertainment | 21 (40.4%) | 31 (59.6%) |
| Health Diagnosing & Treating | 17 (37.0%) | 29 (63.0%) |
| Health Technologists | 17 (51.5%) | 16 (48.5%) |
| Total (Category) | 223 (48.7%) | 235 (51.3%) |
| Total (Overall) | 457 (48.4%) | 487 (51.6%) |
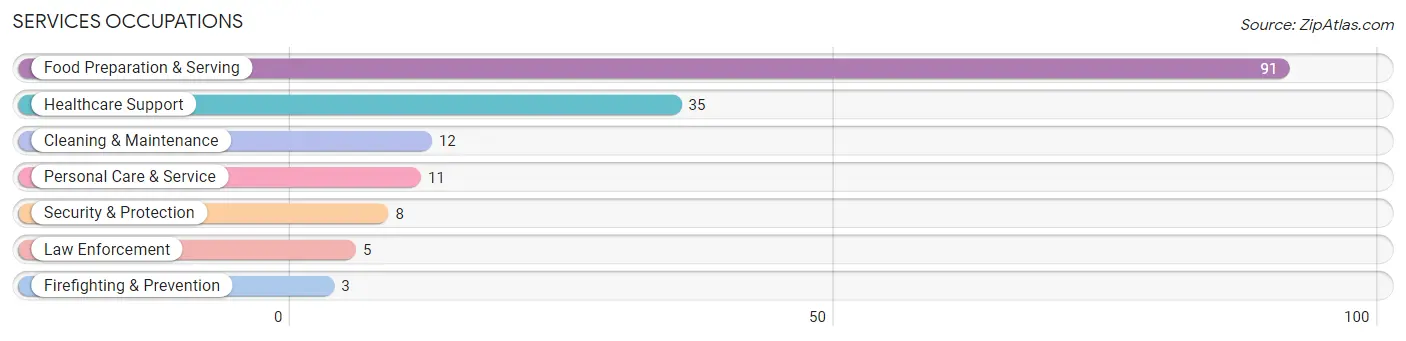
Services Occupations
The most common Services occupations in Palm Shores are Food Preparation & Serving (91 | 9.6%), Healthcare Support (35 | 3.7%), Cleaning & Maintenance (12 | 1.3%), Personal Care & Service (11 | 1.2%), and Security & Protection (8 | 0.9%).
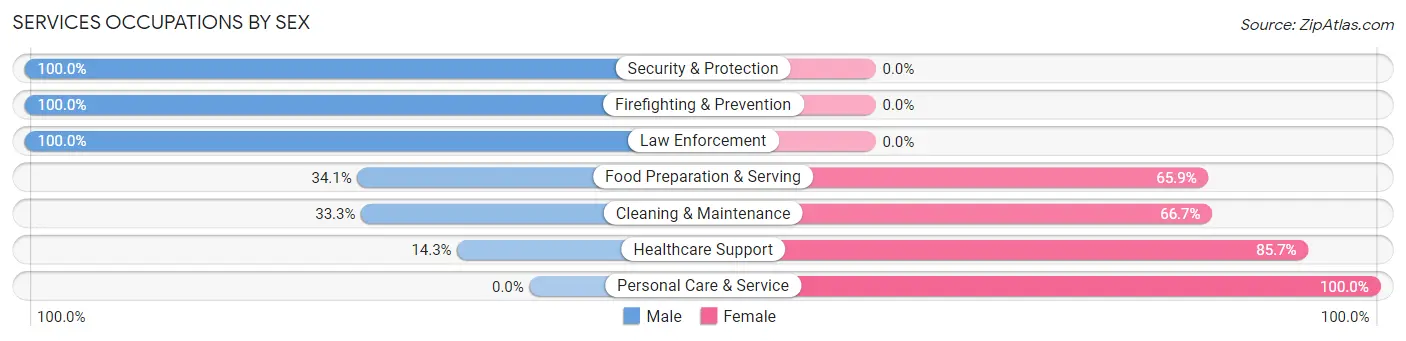
Services Occupations by Sex
Within the Services occupations in Palm Shores, the most male-oriented occupations are Security & Protection (100.0%), Firefighting & Prevention (100.0%), and Law Enforcement (100.0%), while the most female-oriented occupations are Personal Care & Service (100.0%), Healthcare Support (85.7%), and Cleaning & Maintenance (66.7%).
| Occupation | Male | Female |
| Healthcare Support | 5 (14.3%) | 30 (85.7%) |
| Security & Protection | 8 (100.0%) | 0 (0.0%) |
| Firefighting & Prevention | 3 (100.0%) | 0 (0.0%) |
| Law Enforcement | 5 (100.0%) | 0 (0.0%) |
| Food Preparation & Serving | 31 (34.1%) | 60 (65.9%) |
| Cleaning & Maintenance | 4 (33.3%) | 8 (66.7%) |
| Personal Care & Service | 0 (0.0%) | 11 (100.0%) |
| Total (Category) | 48 (30.6%) | 109 (69.4%) |
| Total (Overall) | 457 (48.4%) | 487 (51.6%) |
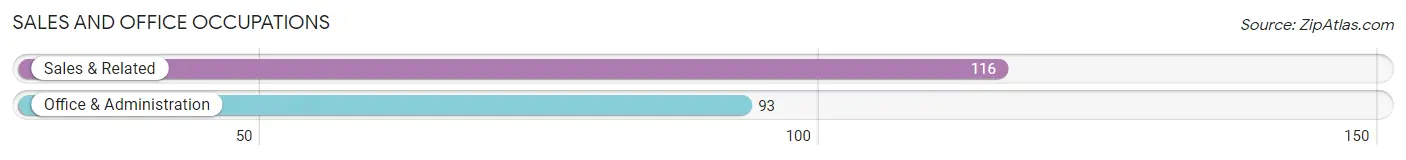
Sales and Office Occupations
The most common Sales and Office occupations in Palm Shores are Sales & Related (116 | 12.3%), and Office & Administration (93 | 9.9%).
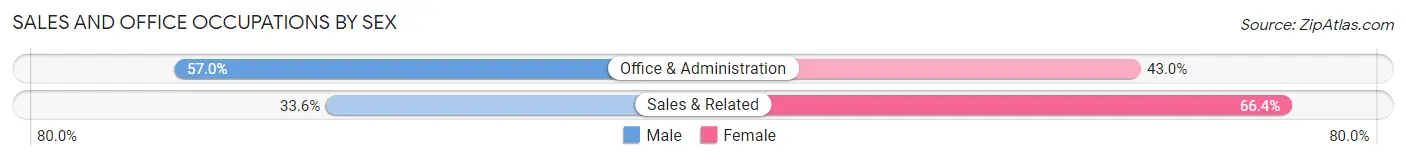
Sales and Office Occupations by Sex
| Occupation | Male | Female |
| Sales & Related | 39 (33.6%) | 77 (66.4%) |
| Office & Administration | 53 (57.0%) | 40 (43.0%) |
| Total (Category) | 92 (44.0%) | 117 (56.0%) |
| Total (Overall) | 457 (48.4%) | 487 (51.6%) |
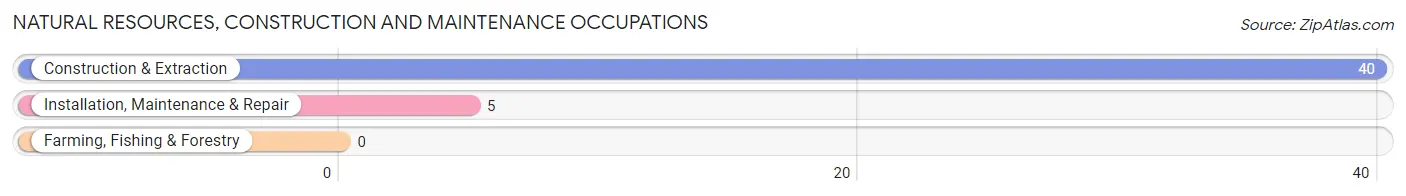
Natural Resources, Construction and Maintenance Occupations
The most common Natural Resources, Construction and Maintenance occupations in Palm Shores are Construction & Extraction (40 | 4.2%), and Installation, Maintenance & Repair (5 | 0.5%).
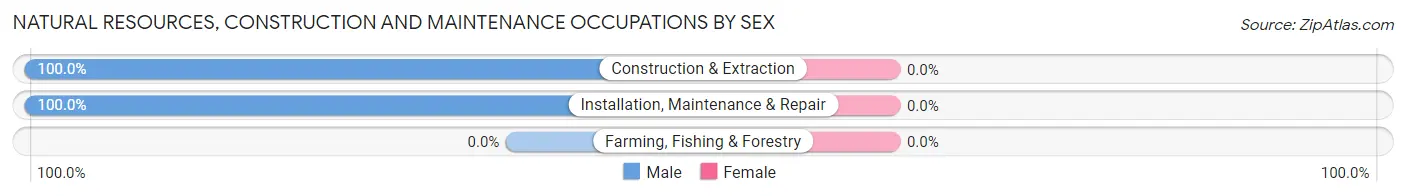
Natural Resources, Construction and Maintenance Occupations by Sex
| Occupation | Male | Female |
| Farming, Fishing & Forestry | 0 (0.0%) | 0 (0.0%) |
| Construction & Extraction | 40 (100.0%) | 0 (0.0%) |
| Installation, Maintenance & Repair | 5 (100.0%) | 0 (0.0%) |
| Total (Category) | 45 (100.0%) | 0 (0.0%) |
| Total (Overall) | 457 (48.4%) | 487 (51.6%) |
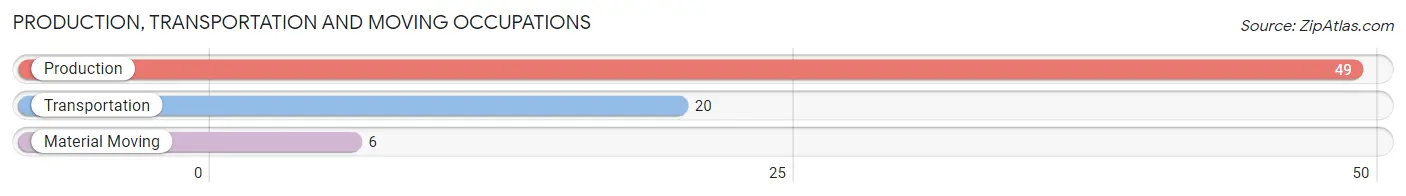
Production, Transportation and Moving Occupations
The most common Production, Transportation and Moving occupations in Palm Shores are Production (49 | 5.2%), Transportation (20 | 2.1%), and Material Moving (6 | 0.6%).
Production, Transportation and Moving Occupations by Sex
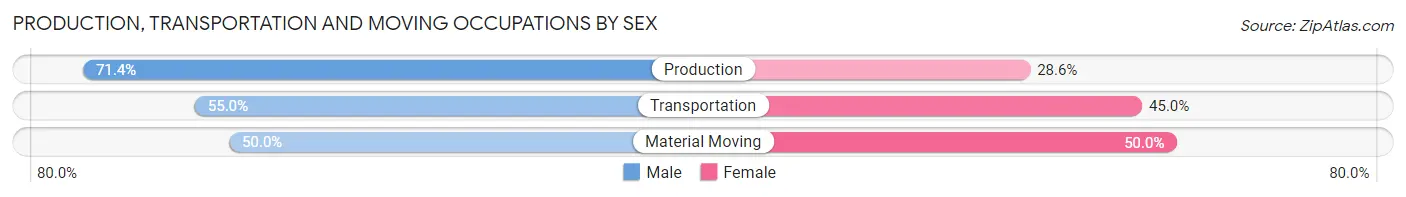
| Occupation | Male | Female |
| Production | 35 (71.4%) | 14 (28.6%) |
| Transportation | 11 (55.0%) | 9 (45.0%) |
| Material Moving | 3 (50.0%) | 3 (50.0%) |
| Total (Category) | 49 (65.3%) | 26 (34.7%) |
| Total (Overall) | 457 (48.4%) | 487 (51.6%) |
Employment Industries by Sex in Palm Shores
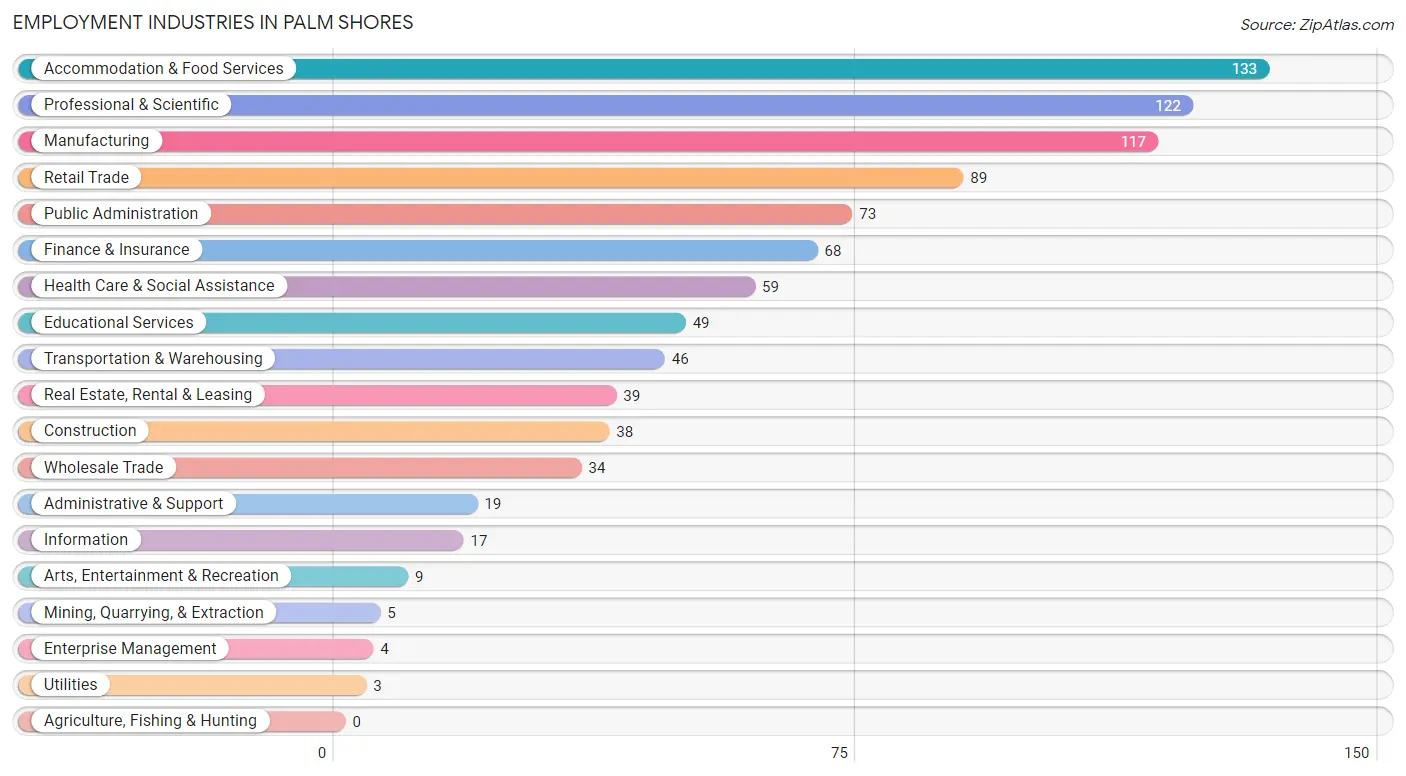
Employment Industries in Palm Shores
The major employment industries in Palm Shores include Accommodation & Food Services (133 | 14.1%), Professional & Scientific (122 | 12.9%), Manufacturing (117 | 12.4%), Retail Trade (89 | 9.4%), and Public Administration (73 | 7.7%).
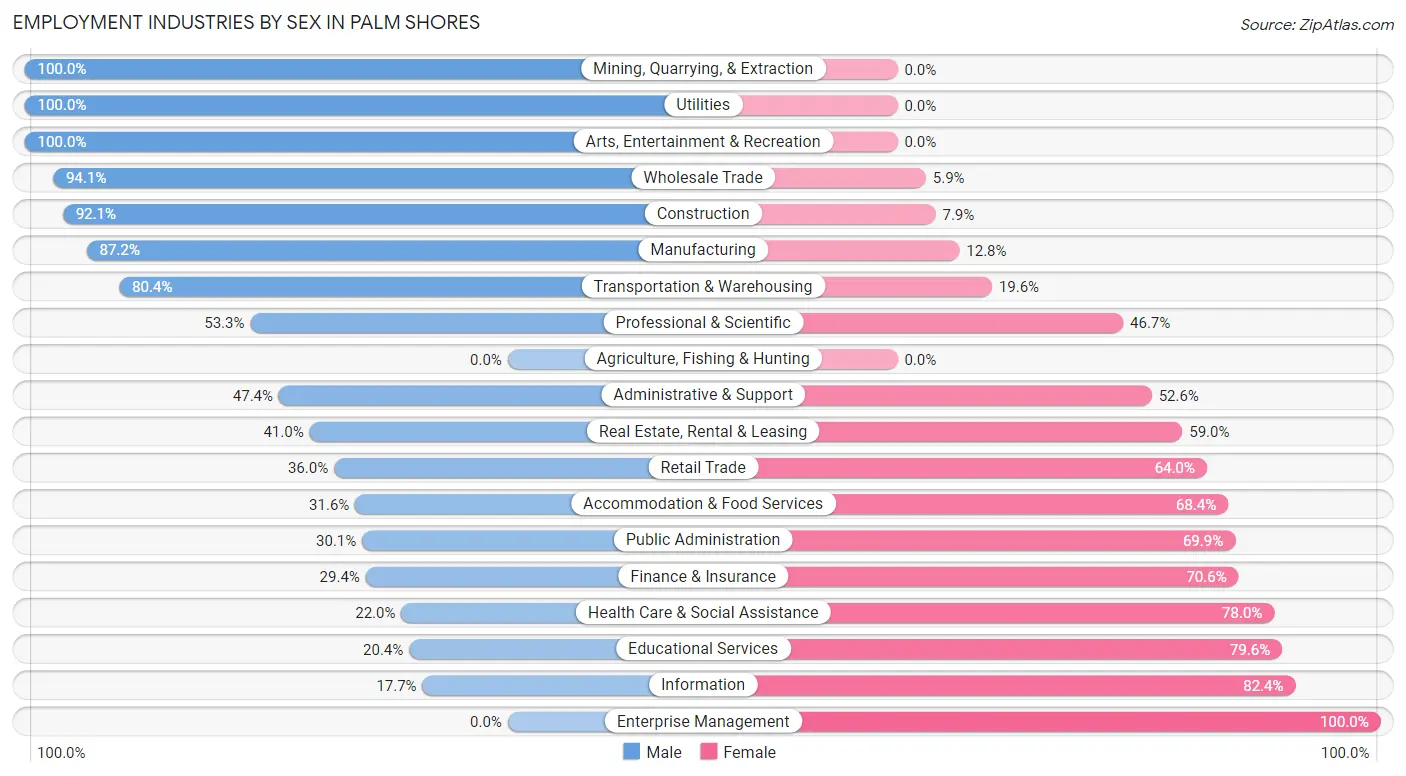
Employment Industries by Sex in Palm Shores
The Palm Shores industries that see more men than women are Mining, Quarrying, & Extraction (100.0%), Utilities (100.0%), and Arts, Entertainment & Recreation (100.0%), whereas the industries that tend to have a higher number of women are Enterprise Management (100.0%), Information (82.4%), and Educational Services (79.6%).
| Industry | Male | Female |
| Agriculture, Fishing & Hunting | 0 (0.0%) | 0 (0.0%) |
| Mining, Quarrying, & Extraction | 5 (100.0%) | 0 (0.0%) |
| Construction | 35 (92.1%) | 3 (7.9%) |
| Manufacturing | 102 (87.2%) | 15 (12.8%) |
| Wholesale Trade | 32 (94.1%) | 2 (5.9%) |
| Retail Trade | 32 (36.0%) | 57 (64.0%) |
| Transportation & Warehousing | 37 (80.4%) | 9 (19.6%) |
| Utilities | 3 (100.0%) | 0 (0.0%) |
| Information | 3 (17.6%) | 14 (82.4%) |
| Finance & Insurance | 20 (29.4%) | 48 (70.6%) |
| Real Estate, Rental & Leasing | 16 (41.0%) | 23 (59.0%) |
| Professional & Scientific | 65 (53.3%) | 57 (46.7%) |
| Enterprise Management | 0 (0.0%) | 4 (100.0%) |
| Administrative & Support | 9 (47.4%) | 10 (52.6%) |
| Educational Services | 10 (20.4%) | 39 (79.6%) |
| Health Care & Social Assistance | 13 (22.0%) | 46 (78.0%) |
| Arts, Entertainment & Recreation | 9 (100.0%) | 0 (0.0%) |
| Accommodation & Food Services | 42 (31.6%) | 91 (68.4%) |
| Public Administration | 22 (30.1%) | 51 (69.9%) |
| Total | 457 (48.4%) | 487 (51.6%) |
Education in Palm Shores
School Enrollment in Palm Shores
The most common levels of schooling among the 371 students in Palm Shores are college / undergraduate (93 | 25.1%), high school (69 | 18.6%), and graduate / professional (65 | 17.5%).
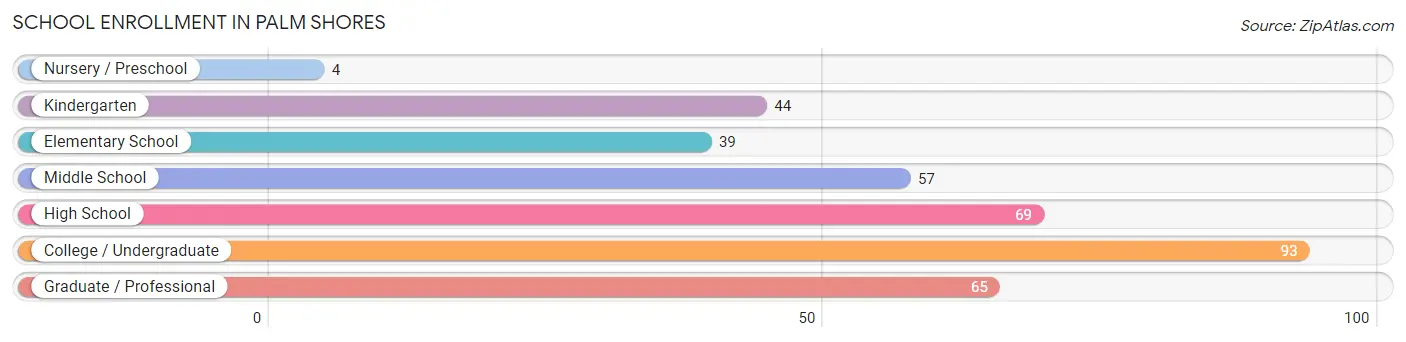
| School Level | # Students | % Students |
| Nursery / Preschool | 4 | 1.1% |
| Kindergarten | 44 | 11.9% |
| Elementary School | 39 | 10.5% |
| Middle School | 57 | 15.4% |
| High School | 69 | 18.6% |
| College / Undergraduate | 93 | 25.1% |
| Graduate / Professional | 65 | 17.5% |
| Total | 371 | 100.0% |
School Enrollment by Age by Funding Source in Palm Shores
Out of a total of 371 students who are enrolled in schools in Palm Shores, 32 (8.6%) attend a private institution, while the remaining 339 (91.4%) are enrolled in public schools. The age group of 3 to 4 year olds has the highest likelihood of being enrolled in private schools, with 4 (100.0% in the age bracket) enrolled. Conversely, the age group of 5 to 9 year old has the lowest likelihood of being enrolled in a private school, with 79 (100.0% in the age bracket) attending a public institution.
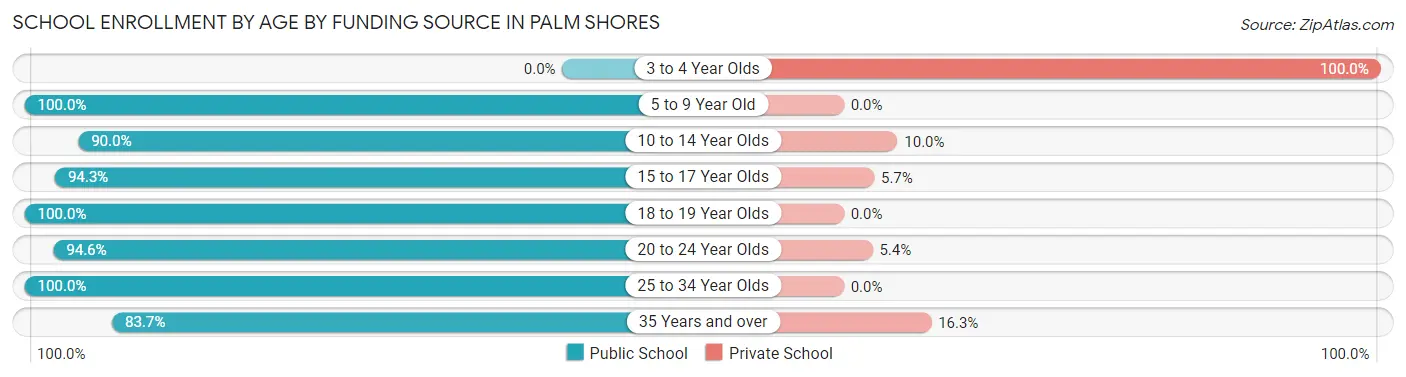
| Age Bracket | Public School | Private School |
| 3 to 4 Year Olds | 0 (0.0%) | 4 (100.0%) |
| 5 to 9 Year Old | 79 (100.0%) | 0 (0.0%) |
| 10 to 14 Year Olds | 63 (90.0%) | 7 (10.0%) |
| 15 to 17 Year Olds | 50 (94.3%) | 3 (5.7%) |
| 18 to 19 Year Olds | 14 (100.0%) | 0 (0.0%) |
| 20 to 24 Year Olds | 53 (94.6%) | 3 (5.4%) |
| 25 to 34 Year Olds | 3 (100.0%) | 0 (0.0%) |
| 35 Years and over | 77 (83.7%) | 15 (16.3%) |
| Total | 339 (91.4%) | 32 (8.6%) |
Educational Attainment by Field of Study in Palm Shores
Business (120 | 29.7%), education (52 | 12.9%), bio, nature & agricultural (50 | 12.4%), liberal arts & history (49 | 12.1%), and science & technology (31 | 7.7%) are the most common fields of study among 404 individuals in Palm Shores who have obtained a bachelor's degree or higher.
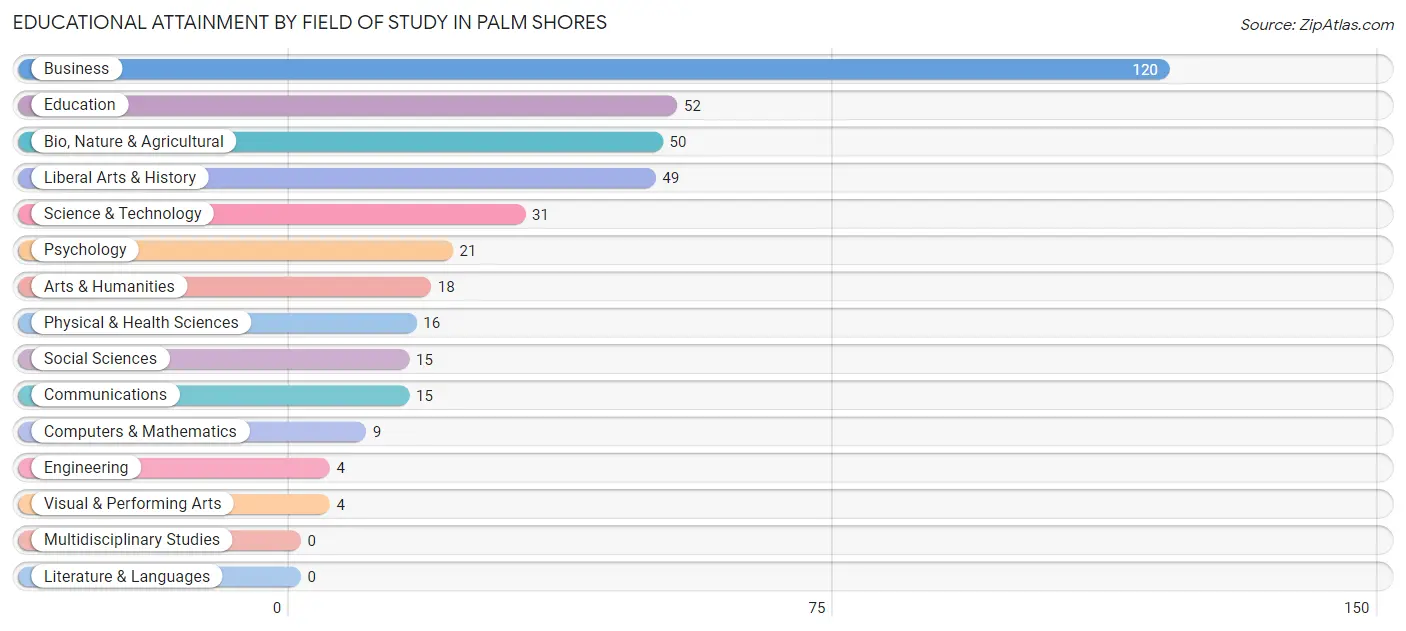
| Field of Study | # Graduates | % Graduates |
| Computers & Mathematics | 9 | 2.2% |
| Bio, Nature & Agricultural | 50 | 12.4% |
| Physical & Health Sciences | 16 | 4.0% |
| Psychology | 21 | 5.2% |
| Social Sciences | 15 | 3.7% |
| Engineering | 4 | 1.0% |
| Multidisciplinary Studies | 0 | 0.0% |
| Science & Technology | 31 | 7.7% |
| Business | 120 | 29.7% |
| Education | 52 | 12.9% |
| Literature & Languages | 0 | 0.0% |
| Liberal Arts & History | 49 | 12.1% |
| Visual & Performing Arts | 4 | 1.0% |
| Communications | 15 | 3.7% |
| Arts & Humanities | 18 | 4.5% |
| Total | 404 | 100.0% |
Transportation & Commute in Palm Shores
Vehicle Availability by Sex in Palm Shores
The most prevalent vehicle ownership categories in Palm Shores are males with 2 vehicles (282, accounting for 61.7%) and females with 2 vehicles (224, making up 57.9%).
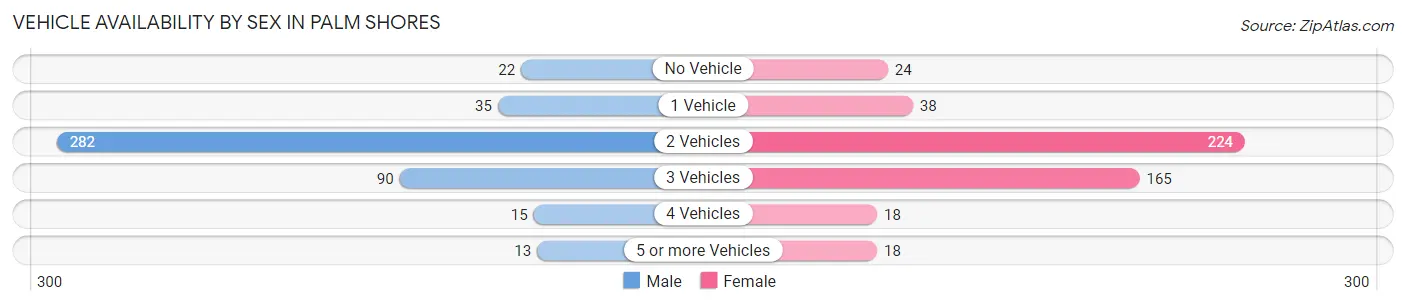
| Vehicles Available | Male | Female |
| No Vehicle | 22 (4.8%) | 24 (4.9%) |
| 1 Vehicle | 35 (7.7%) | 38 (7.8%) |
| 2 Vehicles | 282 (61.7%) | 224 (46.0%) |
| 3 Vehicles | 90 (19.7%) | 165 (33.9%) |
| 4 Vehicles | 15 (3.3%) | 18 (3.7%) |
| 5 or more Vehicles | 13 (2.8%) | 18 (3.7%) |
| Total | 457 (100.0%) | 487 (100.0%) |
Commute Time in Palm Shores
The most frequently occuring commute durations in Palm Shores are 15 to 19 minutes (270 commuters, 33.5%), 30 to 34 minutes (121 commuters, 15.0%), and 20 to 24 minutes (118 commuters, 14.6%).
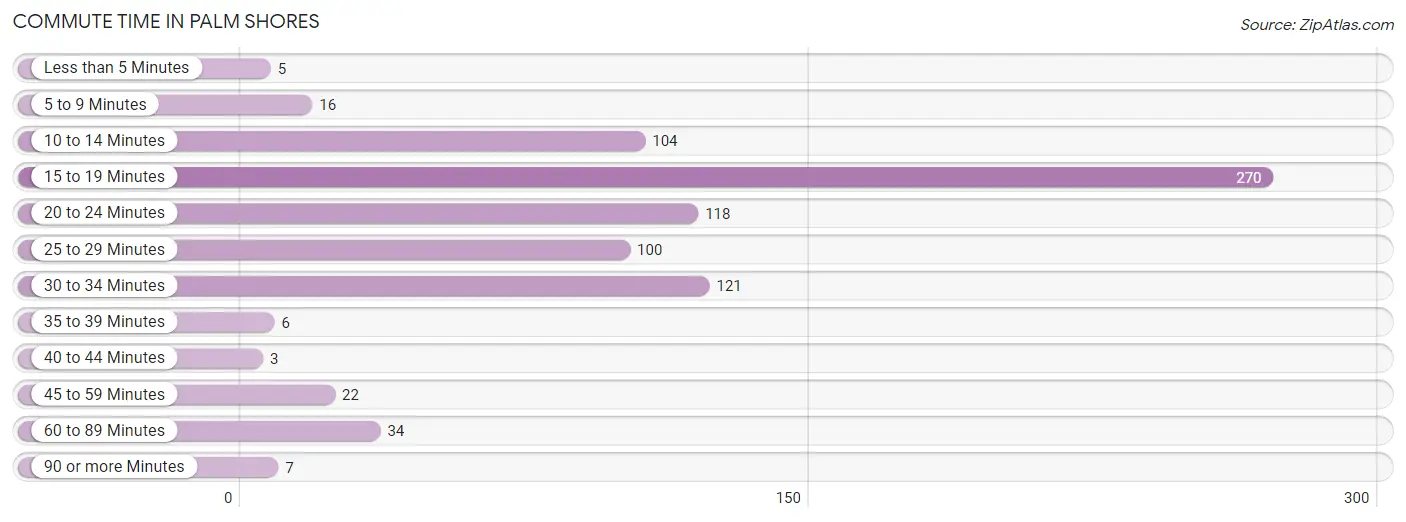
| Commute Time | # Commuters | % Commuters |
| Less than 5 Minutes | 5 | 0.6% |
| 5 to 9 Minutes | 16 | 2.0% |
| 10 to 14 Minutes | 104 | 12.9% |
| 15 to 19 Minutes | 270 | 33.5% |
| 20 to 24 Minutes | 118 | 14.6% |
| 25 to 29 Minutes | 100 | 12.4% |
| 30 to 34 Minutes | 121 | 15.0% |
| 35 to 39 Minutes | 6 | 0.7% |
| 40 to 44 Minutes | 3 | 0.4% |
| 45 to 59 Minutes | 22 | 2.7% |
| 60 to 89 Minutes | 34 | 4.2% |
| 90 or more Minutes | 7 | 0.9% |
Commute Time by Sex in Palm Shores
The most common commute times in Palm Shores are 15 to 19 minutes (112 commuters, 29.5%) for males and 15 to 19 minutes (158 commuters, 37.1%) for females.
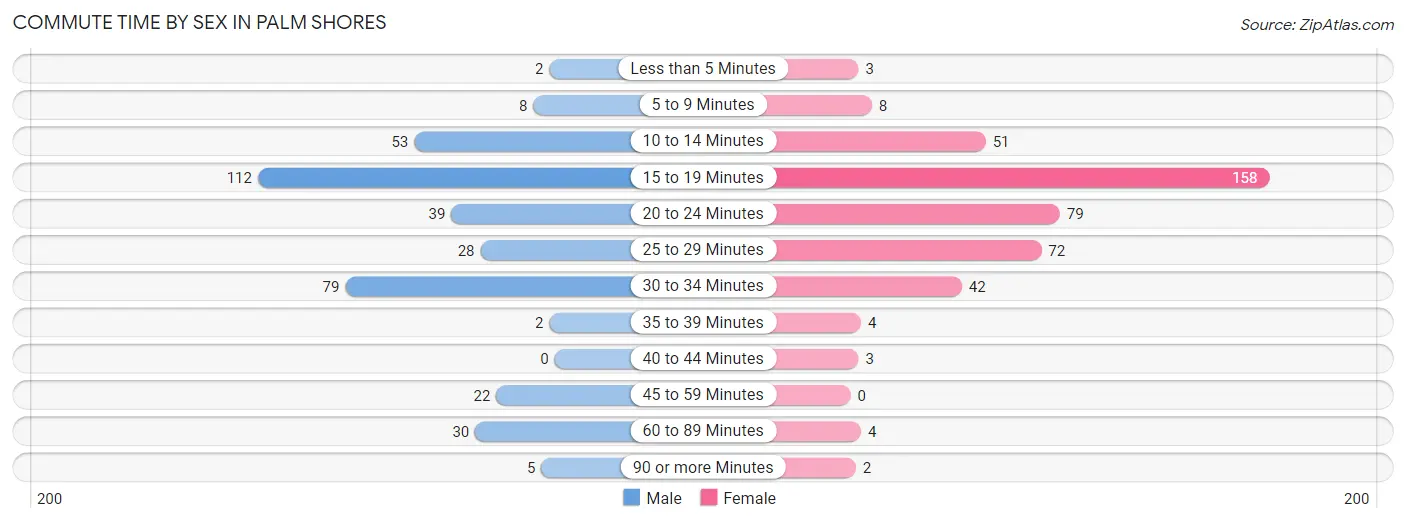
| Commute Time | Male | Female |
| Less than 5 Minutes | 2 (0.5%) | 3 (0.7%) |
| 5 to 9 Minutes | 8 (2.1%) | 8 (1.9%) |
| 10 to 14 Minutes | 53 (14.0%) | 51 (12.0%) |
| 15 to 19 Minutes | 112 (29.5%) | 158 (37.1%) |
| 20 to 24 Minutes | 39 (10.3%) | 79 (18.5%) |
| 25 to 29 Minutes | 28 (7.4%) | 72 (16.9%) |
| 30 to 34 Minutes | 79 (20.8%) | 42 (9.9%) |
| 35 to 39 Minutes | 2 (0.5%) | 4 (0.9%) |
| 40 to 44 Minutes | 0 (0.0%) | 3 (0.7%) |
| 45 to 59 Minutes | 22 (5.8%) | 0 (0.0%) |
| 60 to 89 Minutes | 30 (7.9%) | 4 (0.9%) |
| 90 or more Minutes | 5 (1.3%) | 2 (0.5%) |
Time of Departure to Work by Sex in Palm Shores
The most frequent times of departure to work in Palm Shores are 8:00 AM to 8:29 AM (64, 16.8%) for males and 10:00 AM to 10:59 AM (86, 20.2%) for females.
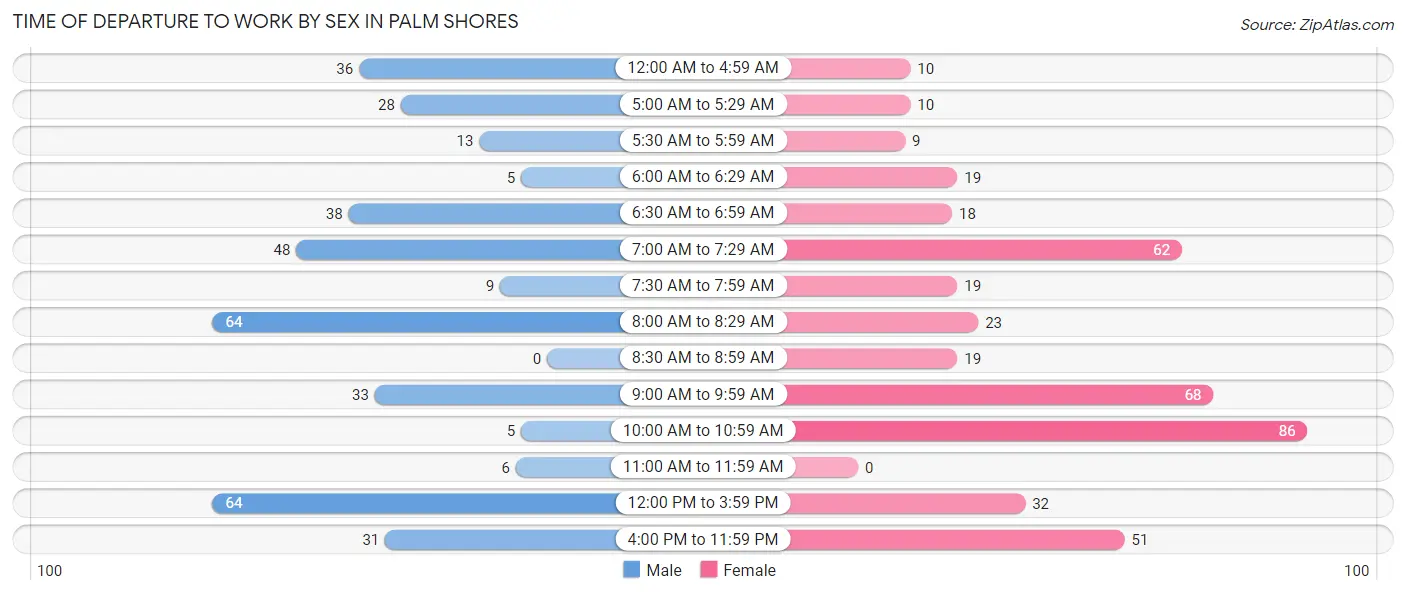
| Time of Departure | Male | Female |
| 12:00 AM to 4:59 AM | 36 (9.5%) | 10 (2.4%) |
| 5:00 AM to 5:29 AM | 28 (7.4%) | 10 (2.4%) |
| 5:30 AM to 5:59 AM | 13 (3.4%) | 9 (2.1%) |
| 6:00 AM to 6:29 AM | 5 (1.3%) | 19 (4.5%) |
| 6:30 AM to 6:59 AM | 38 (10.0%) | 18 (4.2%) |
| 7:00 AM to 7:29 AM | 48 (12.6%) | 62 (14.5%) |
| 7:30 AM to 7:59 AM | 9 (2.4%) | 19 (4.5%) |
| 8:00 AM to 8:29 AM | 64 (16.8%) | 23 (5.4%) |
| 8:30 AM to 8:59 AM | 0 (0.0%) | 19 (4.5%) |
| 9:00 AM to 9:59 AM | 33 (8.7%) | 68 (16.0%) |
| 10:00 AM to 10:59 AM | 5 (1.3%) | 86 (20.2%) |
| 11:00 AM to 11:59 AM | 6 (1.6%) | 0 (0.0%) |
| 12:00 PM to 3:59 PM | 64 (16.8%) | 32 (7.5%) |
| 4:00 PM to 11:59 PM | 31 (8.2%) | 51 (12.0%) |
| Total | 380 (100.0%) | 426 (100.0%) |
Housing Occupancy in Palm Shores
Occupancy by Ownership in Palm Shores
Of the total 569 dwellings in Palm Shores, owner-occupied units account for 524 (92.1%), while renter-occupied units make up 45 (7.9%).
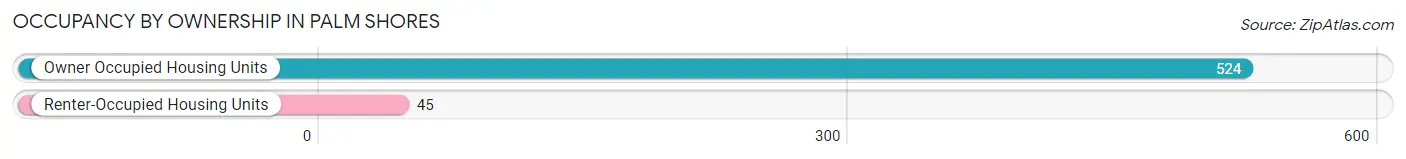
| Occupancy | # Housing Units | % Housing Units |
| Owner Occupied Housing Units | 524 | 92.1% |
| Renter-Occupied Housing Units | 45 | 7.9% |
| Total Occupied Housing Units | 569 | 100.0% |
Occupancy by Household Size in Palm Shores
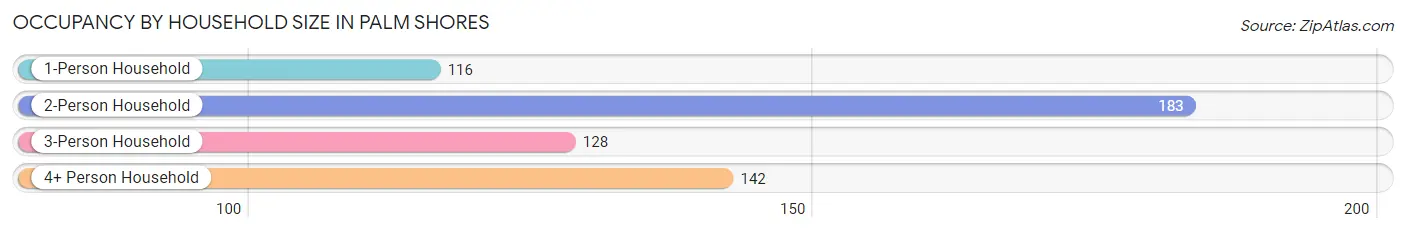
| Household Size | # Housing Units | % Housing Units |
| 1-Person Household | 116 | 20.4% |
| 2-Person Household | 183 | 32.2% |
| 3-Person Household | 128 | 22.5% |
| 4+ Person Household | 142 | 25.0% |
| Total Housing Units | 569 | 100.0% |
Occupancy by Ownership by Household Size in Palm Shores
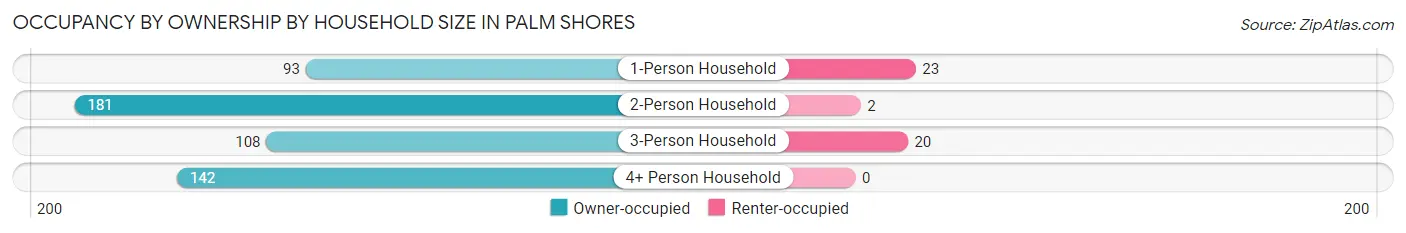
| Household Size | Owner-occupied | Renter-occupied |
| 1-Person Household | 93 (80.2%) | 23 (19.8%) |
| 2-Person Household | 181 (98.9%) | 2 (1.1%) |
| 3-Person Household | 108 (84.4%) | 20 (15.6%) |
| 4+ Person Household | 142 (100.0%) | 0 (0.0%) |
| Total Housing Units | 524 (92.1%) | 45 (7.9%) |
Occupancy by Educational Attainment in Palm Shores
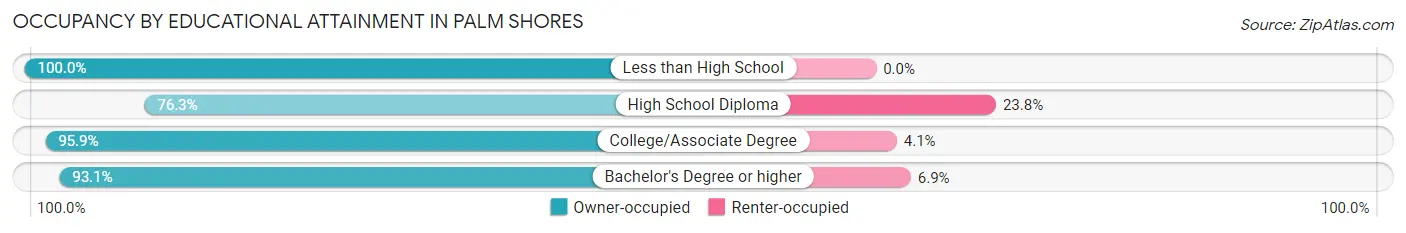
| Household Size | Owner-occupied | Renter-occupied |
| Less than High School | 3 (100.0%) | 0 (0.0%) |
| High School Diploma | 61 (76.2%) | 19 (23.7%) |
| College/Associate Degree | 257 (95.9%) | 11 (4.1%) |
| Bachelor's Degree or higher | 203 (93.1%) | 15 (6.9%) |
Occupancy by Age of Householder in Palm Shores
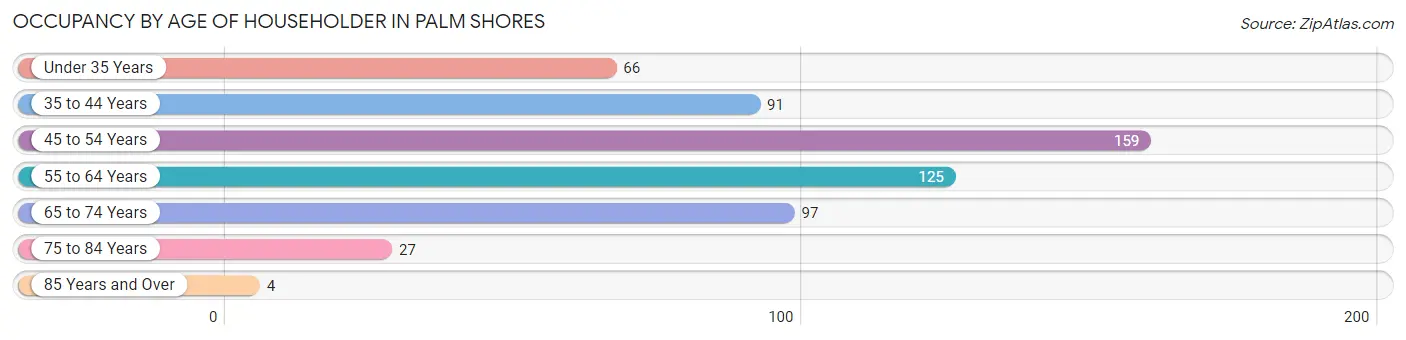
| Age Bracket | # Households | % Households |
| Under 35 Years | 66 | 11.6% |
| 35 to 44 Years | 91 | 16.0% |
| 45 to 54 Years | 159 | 27.9% |
| 55 to 64 Years | 125 | 22.0% |
| 65 to 74 Years | 97 | 17.1% |
| 75 to 84 Years | 27 | 4.8% |
| 85 Years and Over | 4 | 0.7% |
| Total | 569 | 100.0% |
Housing Finances in Palm Shores
Median Income by Occupancy in Palm Shores
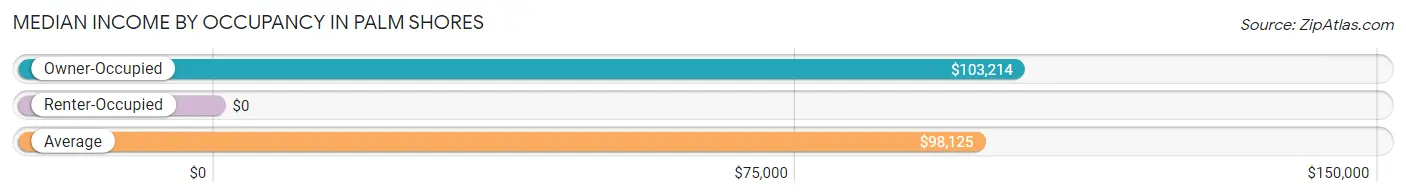
| Occupancy Type | # Households | Median Income |
| Owner-Occupied | 524 (92.1%) | $103,214 |
| Renter-Occupied | 45 (7.9%) | $0 |
| Average | 569 (100.0%) | $98,125 |
Occupancy by Householder Income Bracket in Palm Shores
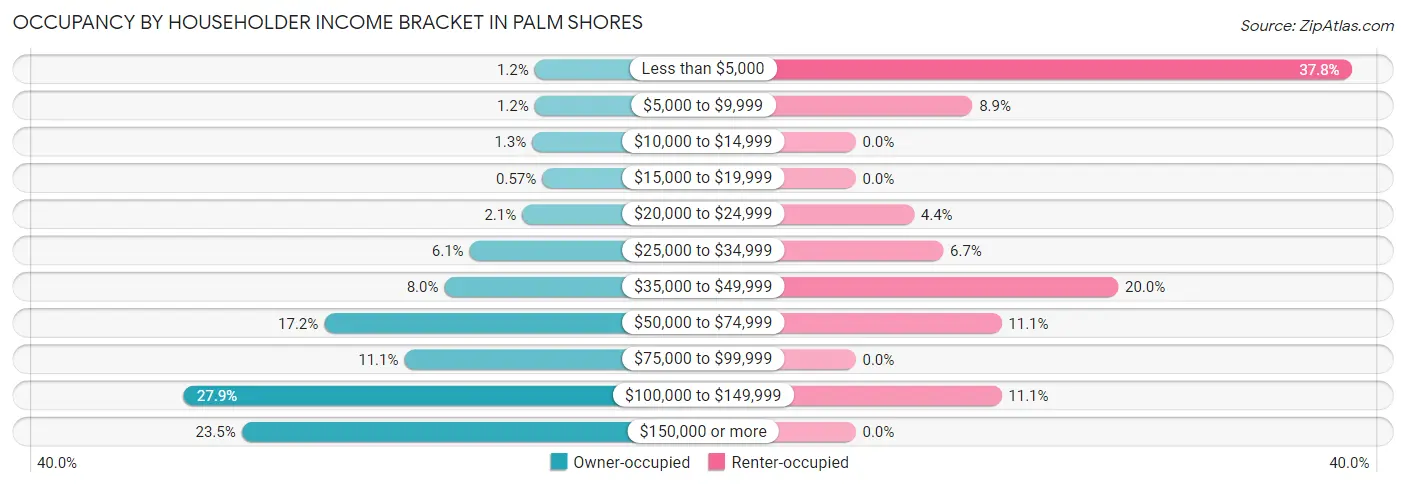
| Income Bracket | Owner-occupied | Renter-occupied |
| Less than $5,000 | 6 (1.1%) | 17 (37.8%) |
| $5,000 to $9,999 | 6 (1.1%) | 4 (8.9%) |
| $10,000 to $14,999 | 7 (1.3%) | 0 (0.0%) |
| $15,000 to $19,999 | 3 (0.6%) | 0 (0.0%) |
| $20,000 to $24,999 | 11 (2.1%) | 2 (4.4%) |
| $25,000 to $34,999 | 32 (6.1%) | 3 (6.7%) |
| $35,000 to $49,999 | 42 (8.0%) | 9 (20.0%) |
| $50,000 to $74,999 | 90 (17.2%) | 5 (11.1%) |
| $75,000 to $99,999 | 58 (11.1%) | 0 (0.0%) |
| $100,000 to $149,999 | 146 (27.9%) | 5 (11.1%) |
| $150,000 or more | 123 (23.5%) | 0 (0.0%) |
| Total | 524 (100.0%) | 45 (100.0%) |
Monthly Housing Cost Tiers in Palm Shores
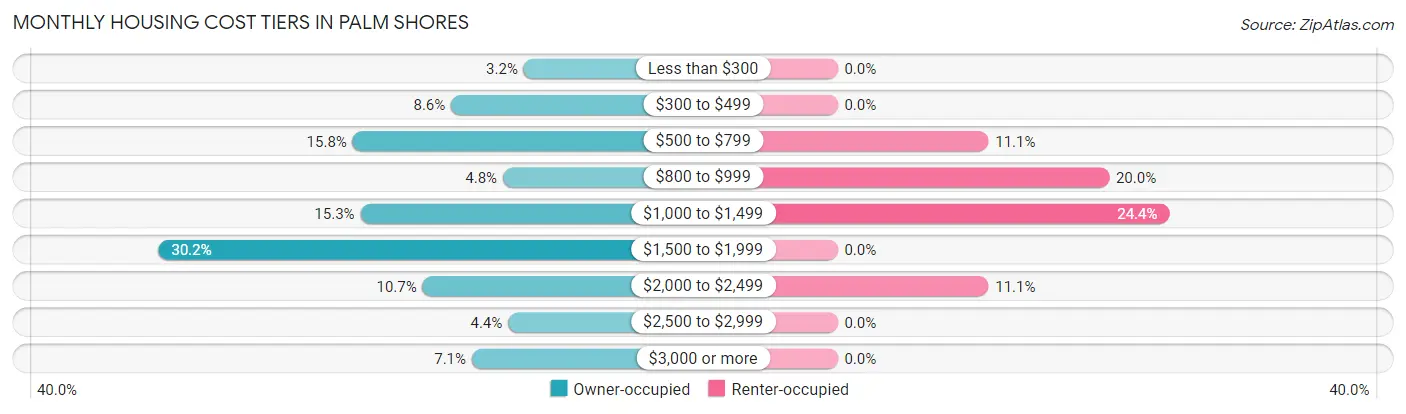
| Monthly Cost | Owner-occupied | Renter-occupied |
| Less than $300 | 17 (3.2%) | 0 (0.0%) |
| $300 to $499 | 45 (8.6%) | 0 (0.0%) |
| $500 to $799 | 83 (15.8%) | 5 (11.1%) |
| $800 to $999 | 25 (4.8%) | 9 (20.0%) |
| $1,000 to $1,499 | 80 (15.3%) | 11 (24.4%) |
| $1,500 to $1,999 | 158 (30.1%) | 0 (0.0%) |
| $2,000 to $2,499 | 56 (10.7%) | 5 (11.1%) |
| $2,500 to $2,999 | 23 (4.4%) | 0 (0.0%) |
| $3,000 or more | 37 (7.1%) | 0 (0.0%) |
| Total | 524 (100.0%) | 45 (100.0%) |
Physical Housing Characteristics in Palm Shores
Housing Structures in Palm Shores
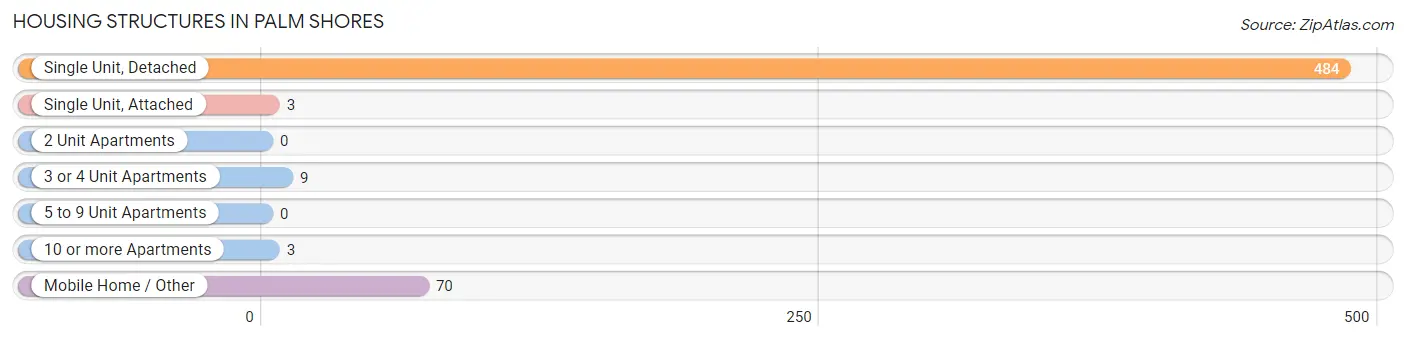
| Structure Type | # Housing Units | % Housing Units |
| Single Unit, Detached | 484 | 85.1% |
| Single Unit, Attached | 3 | 0.5% |
| 2 Unit Apartments | 0 | 0.0% |
| 3 or 4 Unit Apartments | 9 | 1.6% |
| 5 to 9 Unit Apartments | 0 | 0.0% |
| 10 or more Apartments | 3 | 0.5% |
| Mobile Home / Other | 70 | 12.3% |
| Total | 569 | 100.0% |
Housing Structures by Occupancy in Palm Shores
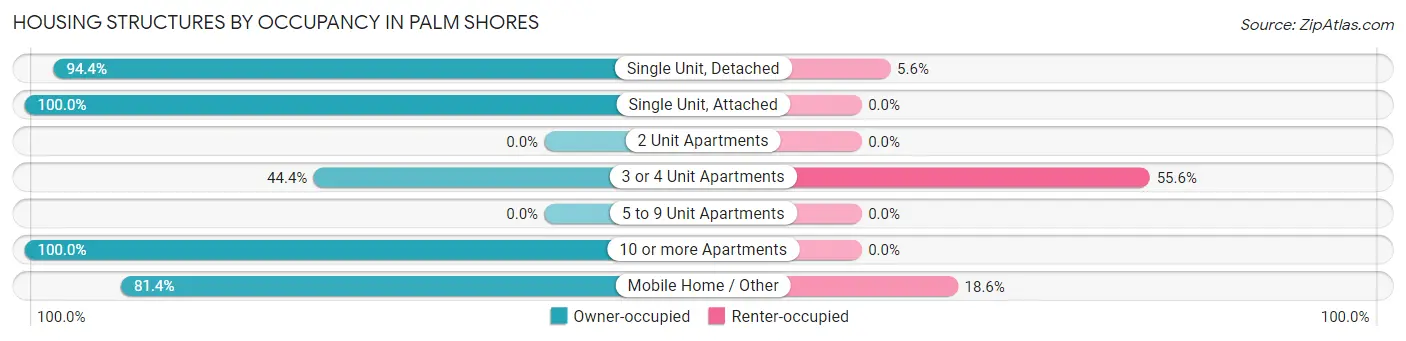
| Structure Type | Owner-occupied | Renter-occupied |
| Single Unit, Detached | 457 (94.4%) | 27 (5.6%) |
| Single Unit, Attached | 3 (100.0%) | 0 (0.0%) |
| 2 Unit Apartments | 0 (0.0%) | 0 (0.0%) |
| 3 or 4 Unit Apartments | 4 (44.4%) | 5 (55.6%) |
| 5 to 9 Unit Apartments | 0 (0.0%) | 0 (0.0%) |
| 10 or more Apartments | 3 (100.0%) | 0 (0.0%) |
| Mobile Home / Other | 57 (81.4%) | 13 (18.6%) |
| Total | 524 (92.1%) | 45 (7.9%) |
Housing Structures by Number of Rooms in Palm Shores
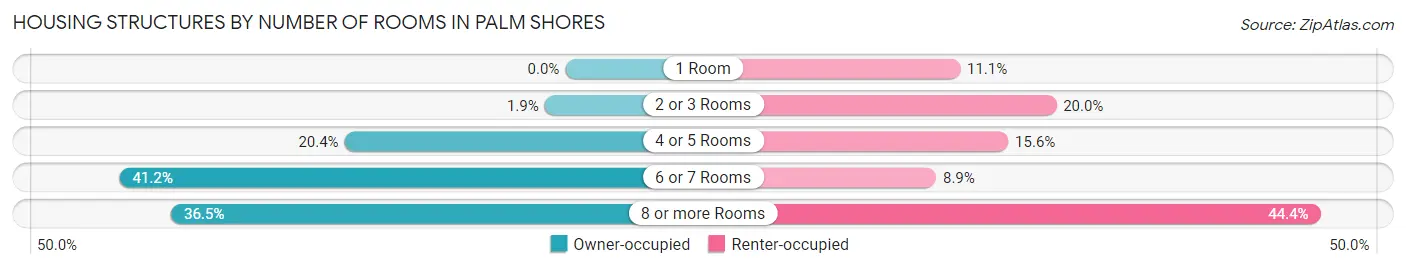
| Number of Rooms | Owner-occupied | Renter-occupied |
| 1 Room | 0 (0.0%) | 5 (11.1%) |
| 2 or 3 Rooms | 10 (1.9%) | 9 (20.0%) |
| 4 or 5 Rooms | 107 (20.4%) | 7 (15.6%) |
| 6 or 7 Rooms | 216 (41.2%) | 4 (8.9%) |
| 8 or more Rooms | 191 (36.4%) | 20 (44.4%) |
| Total | 524 (100.0%) | 45 (100.0%) |
Housing Structure by Heating Type in Palm Shores
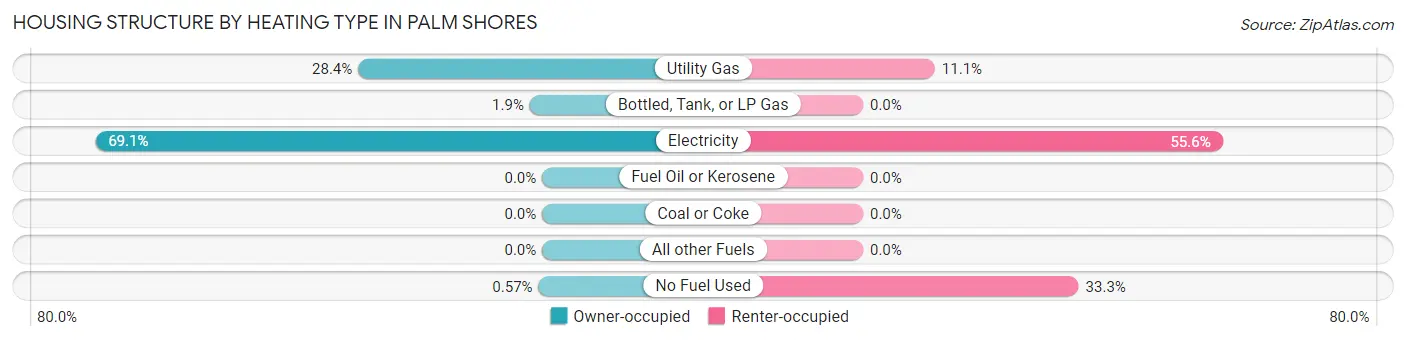
| Heating Type | Owner-occupied | Renter-occupied |
| Utility Gas | 149 (28.4%) | 5 (11.1%) |
| Bottled, Tank, or LP Gas | 10 (1.9%) | 0 (0.0%) |
| Electricity | 362 (69.1%) | 25 (55.6%) |
| Fuel Oil or Kerosene | 0 (0.0%) | 0 (0.0%) |
| Coal or Coke | 0 (0.0%) | 0 (0.0%) |
| All other Fuels | 0 (0.0%) | 0 (0.0%) |
| No Fuel Used | 3 (0.6%) | 15 (33.3%) |
| Total | 524 (100.0%) | 45 (100.0%) |
Household Vehicle Usage in Palm Shores
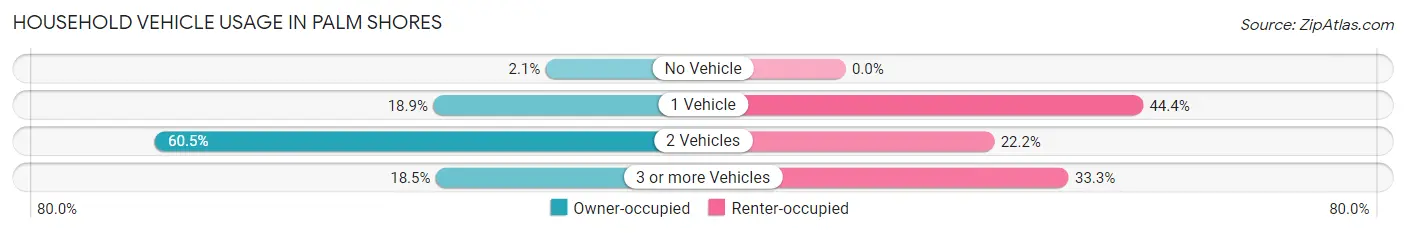
| Vehicles per Household | Owner-occupied | Renter-occupied |
| No Vehicle | 11 (2.1%) | 0 (0.0%) |
| 1 Vehicle | 99 (18.9%) | 20 (44.4%) |
| 2 Vehicles | 317 (60.5%) | 10 (22.2%) |
| 3 or more Vehicles | 97 (18.5%) | 15 (33.3%) |
| Total | 524 (100.0%) | 45 (100.0%) |
Real Estate & Mortgages in Palm Shores
Real Estate and Mortgage Overview in Palm Shores
| Characteristic | Without Mortgage | With Mortgage |
| Housing Units | 176 | 348 |
| Median Property Value | $252,500 | $354,700 |
| Median Household Income | $55,217 | $116 |
| Monthly Housing Costs | $590 | $37 |
| Real Estate Taxes | $1,697 | $10 |
Property Value by Mortgage Status in Palm Shores
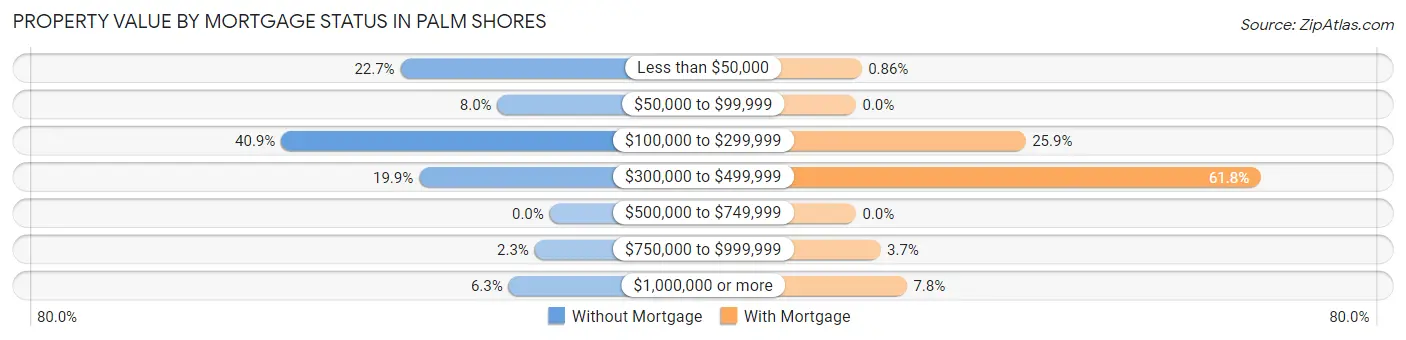
| Property Value | Without Mortgage | With Mortgage |
| Less than $50,000 | 40 (22.7%) | 3 (0.9%) |
| $50,000 to $99,999 | 14 (8.0%) | 0 (0.0%) |
| $100,000 to $299,999 | 72 (40.9%) | 90 (25.9%) |
| $300,000 to $499,999 | 35 (19.9%) | 215 (61.8%) |
| $500,000 to $749,999 | 0 (0.0%) | 0 (0.0%) |
| $750,000 to $999,999 | 4 (2.3%) | 13 (3.7%) |
| $1,000,000 or more | 11 (6.2%) | 27 (7.8%) |
| Total | 176 (100.0%) | 348 (100.0%) |
Household Income by Mortgage Status in Palm Shores
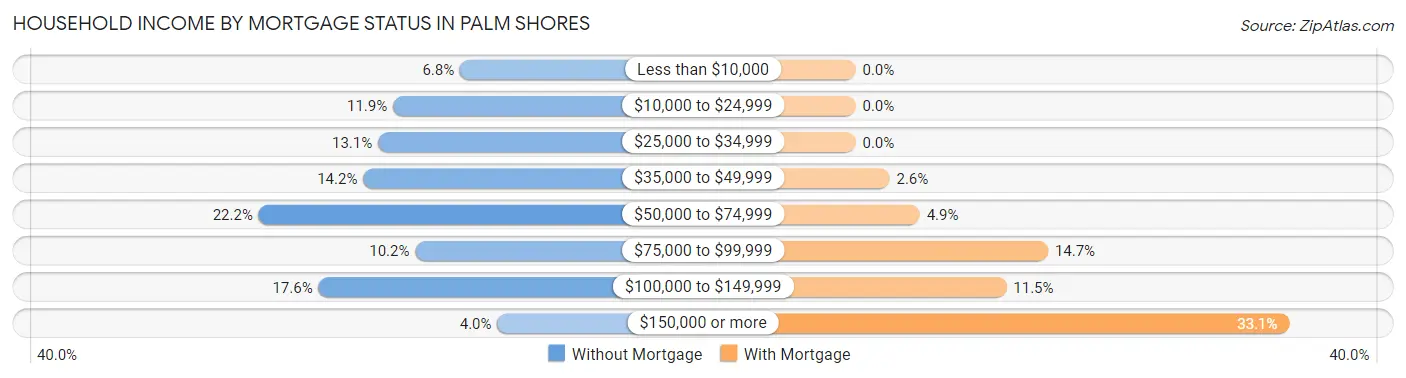
| Household Income | Without Mortgage | With Mortgage |
| Less than $10,000 | 12 (6.8%) | 0 (0.0%) |
| $10,000 to $24,999 | 21 (11.9%) | 0 (0.0%) |
| $25,000 to $34,999 | 23 (13.1%) | 0 (0.0%) |
| $35,000 to $49,999 | 25 (14.2%) | 9 (2.6%) |
| $50,000 to $74,999 | 39 (22.2%) | 17 (4.9%) |
| $75,000 to $99,999 | 18 (10.2%) | 51 (14.7%) |
| $100,000 to $149,999 | 31 (17.6%) | 40 (11.5%) |
| $150,000 or more | 7 (4.0%) | 115 (33.1%) |
| Total | 176 (100.0%) | 348 (100.0%) |
Property Value to Household Income Ratio in Palm Shores
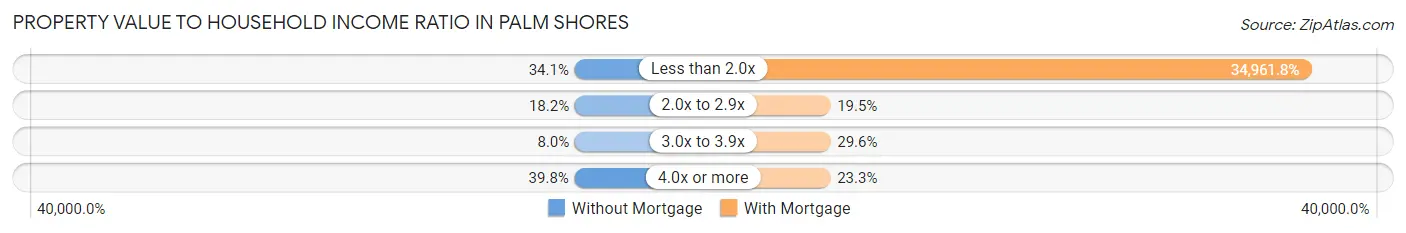
| Value-to-Income Ratio | Without Mortgage | With Mortgage |
| Less than 2.0x | 60 (34.1%) | 121,667 (34,961.8%) |
| 2.0x to 2.9x | 32 (18.2%) | 68 (19.5%) |
| 3.0x to 3.9x | 14 (8.0%) | 103 (29.6%) |
| 4.0x or more | 70 (39.8%) | 81 (23.3%) |
| Total | 176 (100.0%) | 348 (100.0%) |
Real Estate Taxes by Mortgage Status in Palm Shores
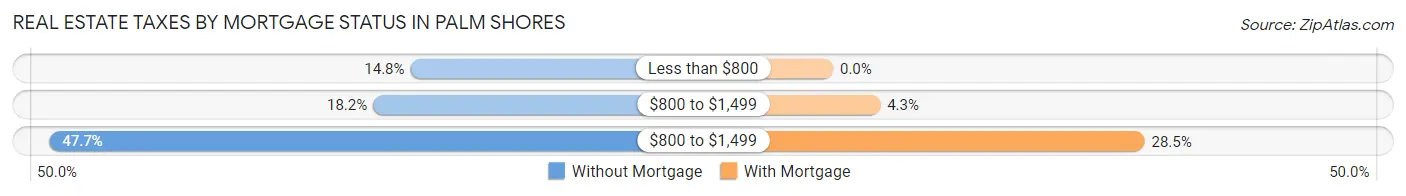
| Property Taxes | Without Mortgage | With Mortgage |
| Less than $800 | 26 (14.8%) | 0 (0.0%) |
| $800 to $1,499 | 32 (18.2%) | 15 (4.3%) |
| $800 to $1,499 | 84 (47.7%) | 99 (28.4%) |
| Total | 176 (100.0%) | 348 (100.0%) |
Health & Disability in Palm Shores
Health Insurance Coverage by Age in Palm Shores
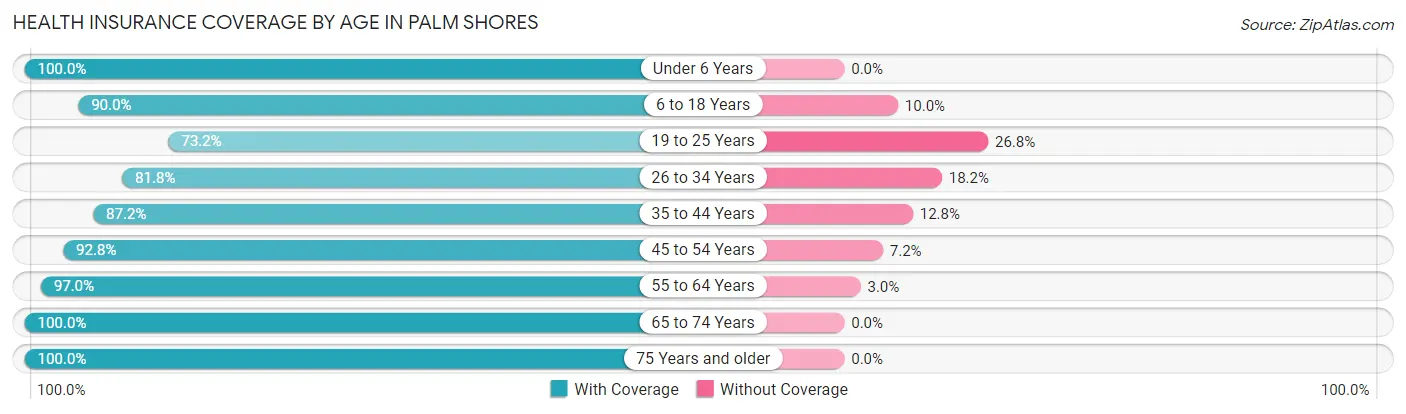
| Age Bracket | With Coverage | Without Coverage |
| Under 6 Years | 137 (100.0%) | 0 (0.0%) |
| 6 to 18 Years | 180 (90.0%) | 20 (10.0%) |
| 19 to 25 Years | 101 (73.2%) | 37 (26.8%) |
| 26 to 34 Years | 162 (81.8%) | 36 (18.2%) |
| 35 to 44 Years | 157 (87.2%) | 23 (12.8%) |
| 45 to 54 Years | 284 (92.8%) | 22 (7.2%) |
| 55 to 64 Years | 192 (97.0%) | 6 (3.0%) |
| 65 to 74 Years | 134 (100.0%) | 0 (0.0%) |
| 75 Years and older | 83 (100.0%) | 0 (0.0%) |
| Total | 1,430 (90.8%) | 144 (9.1%) |
Health Insurance Coverage by Citizenship Status in Palm Shores
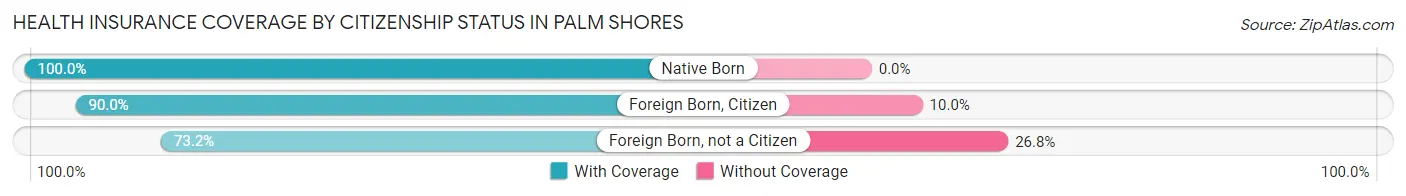
| Citizenship Status | With Coverage | Without Coverage |
| Native Born | 137 (100.0%) | 0 (0.0%) |
| Foreign Born, Citizen | 180 (90.0%) | 20 (10.0%) |
| Foreign Born, not a Citizen | 101 (73.2%) | 37 (26.8%) |
Health Insurance Coverage by Household Income in Palm Shores
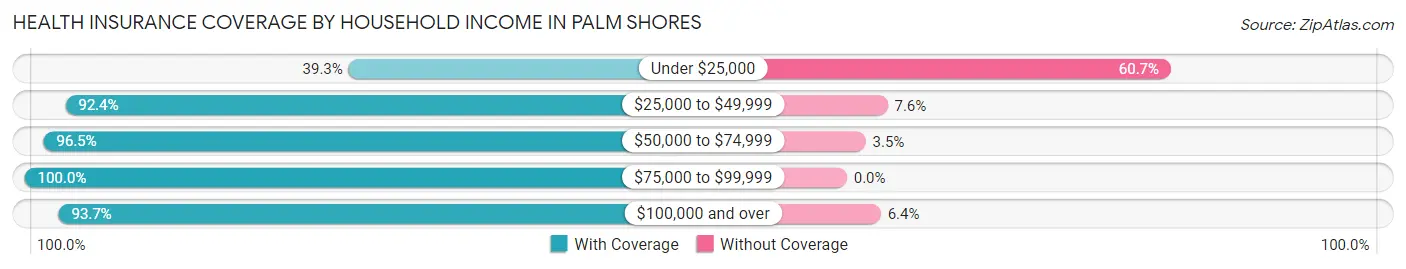
| Household Income | With Coverage | Without Coverage |
| Under $25,000 | 44 (39.3%) | 68 (60.7%) |
| $25,000 to $49,999 | 109 (92.4%) | 9 (7.6%) |
| $50,000 to $74,999 | 247 (96.5%) | 9 (3.5%) |
| $75,000 to $99,999 | 174 (100.0%) | 0 (0.0%) |
| $100,000 and over | 856 (93.6%) | 58 (6.4%) |
Public vs Private Health Insurance Coverage by Age in Palm Shores
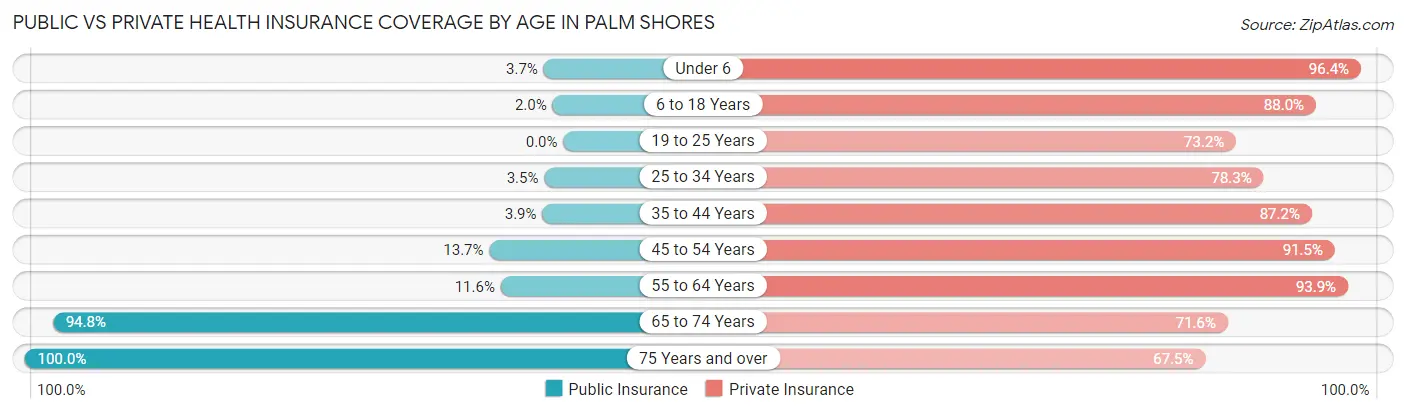
| Age Bracket | Public Insurance | Private Insurance |
| Under 6 | 5 (3.6%) | 132 (96.4%) |
| 6 to 18 Years | 4 (2.0%) | 176 (88.0%) |
| 19 to 25 Years | 0 (0.0%) | 101 (73.2%) |
| 25 to 34 Years | 7 (3.5%) | 155 (78.3%) |
| 35 to 44 Years | 7 (3.9%) | 157 (87.2%) |
| 45 to 54 Years | 42 (13.7%) | 280 (91.5%) |
| 55 to 64 Years | 23 (11.6%) | 186 (93.9%) |
| 65 to 74 Years | 127 (94.8%) | 96 (71.6%) |
| 75 Years and over | 83 (100.0%) | 56 (67.5%) |
| Total | 298 (18.9%) | 1,339 (85.1%) |
Disability Status by Sex by Age in Palm Shores
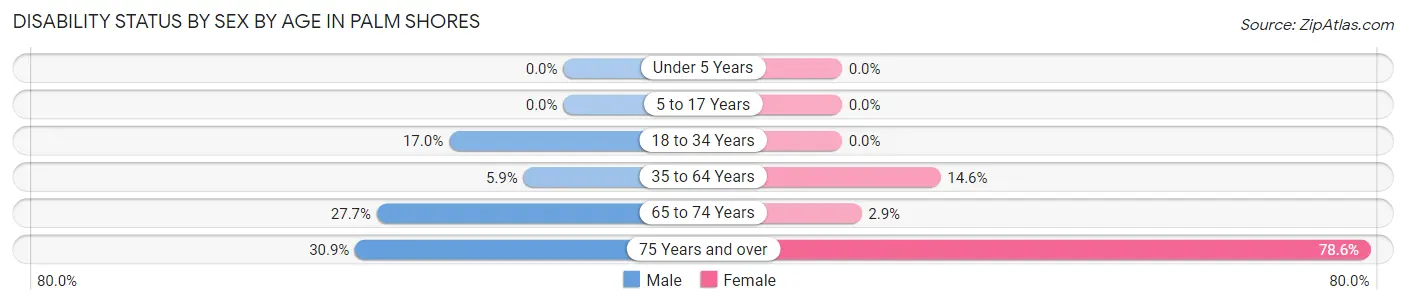
| Age Bracket | Male | Female |
| Under 5 Years | 0 (0.0%) | 0 (0.0%) |
| 5 to 17 Years | 0 (0.0%) | 0 (0.0%) |
| 18 to 34 Years | 27 (17.0%) | 0 (0.0%) |
| 35 to 64 Years | 19 (5.9%) | 53 (14.6%) |
| 65 to 74 Years | 18 (27.7%) | 2 (2.9%) |
| 75 Years and over | 17 (30.9%) | 22 (78.6%) |
Disability Class by Sex by Age in Palm Shores
Disability Class: Hearing Difficulty
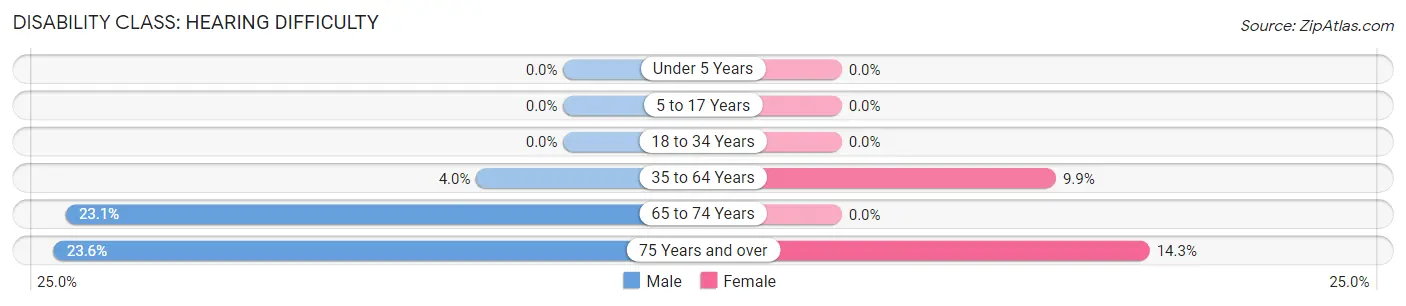
| Age Bracket | Male | Female |
| Under 5 Years | 0 (0.0%) | 0 (0.0%) |
| 5 to 17 Years | 0 (0.0%) | 0 (0.0%) |
| 18 to 34 Years | 0 (0.0%) | 0 (0.0%) |
| 35 to 64 Years | 13 (4.0%) | 36 (9.9%) |
| 65 to 74 Years | 15 (23.1%) | 0 (0.0%) |
| 75 Years and over | 13 (23.6%) | 4 (14.3%) |
Disability Class: Vision Difficulty
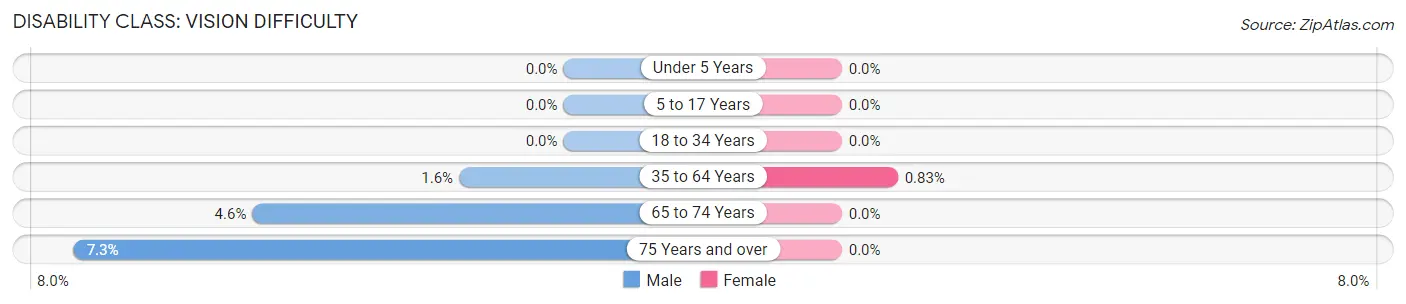
| Age Bracket | Male | Female |
| Under 5 Years | 0 (0.0%) | 0 (0.0%) |
| 5 to 17 Years | 0 (0.0%) | 0 (0.0%) |
| 18 to 34 Years | 0 (0.0%) | 0 (0.0%) |
| 35 to 64 Years | 5 (1.5%) | 3 (0.8%) |
| 65 to 74 Years | 3 (4.6%) | 0 (0.0%) |
| 75 Years and over | 4 (7.3%) | 0 (0.0%) |
Disability Class: Cognitive Difficulty
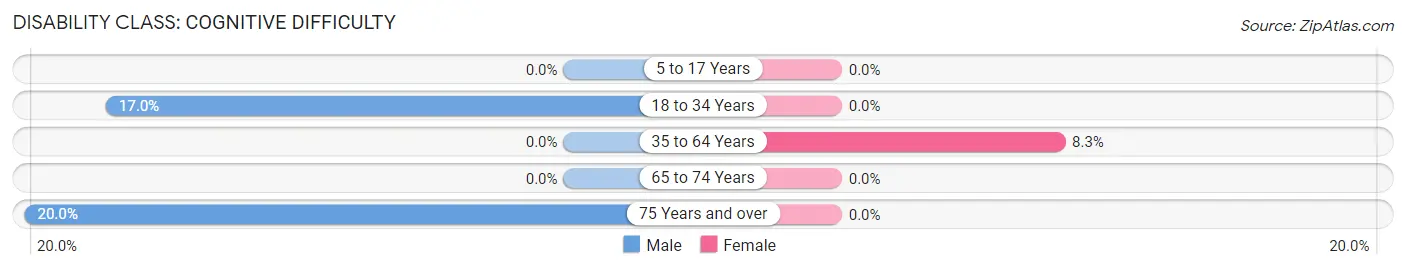
| Age Bracket | Male | Female |
| 5 to 17 Years | 0 (0.0%) | 0 (0.0%) |
| 18 to 34 Years | 27 (17.0%) | 0 (0.0%) |
| 35 to 64 Years | 0 (0.0%) | 30 (8.3%) |
| 65 to 74 Years | 0 (0.0%) | 0 (0.0%) |
| 75 Years and over | 11 (20.0%) | 0 (0.0%) |
Disability Class: Ambulatory Difficulty
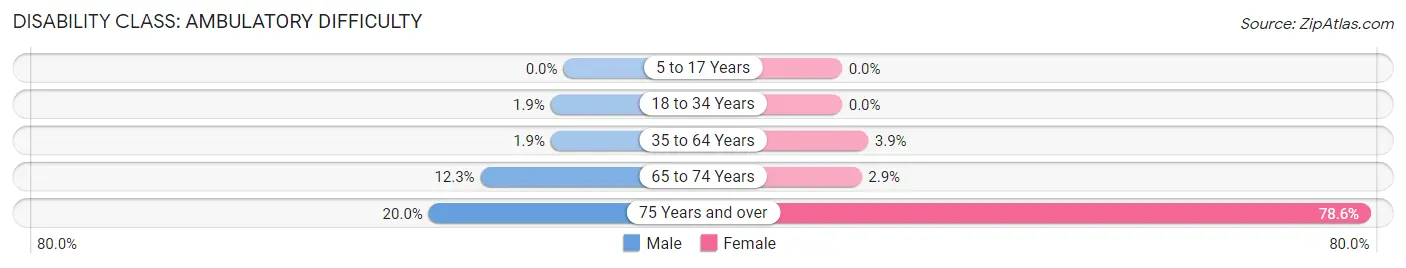
| Age Bracket | Male | Female |
| 5 to 17 Years | 0 (0.0%) | 0 (0.0%) |
| 18 to 34 Years | 3 (1.9%) | 0 (0.0%) |
| 35 to 64 Years | 6 (1.9%) | 14 (3.9%) |
| 65 to 74 Years | 8 (12.3%) | 2 (2.9%) |
| 75 Years and over | 11 (20.0%) | 22 (78.6%) |
Disability Class: Self-Care Difficulty
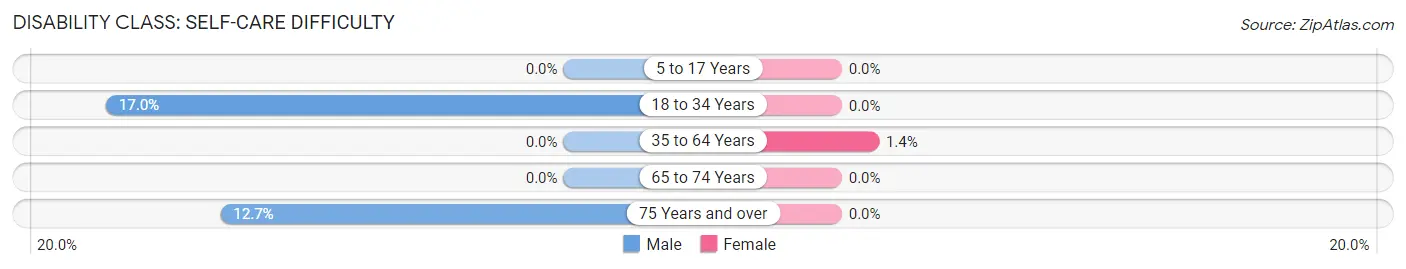
| Age Bracket | Male | Female |
| 5 to 17 Years | 0 (0.0%) | 0 (0.0%) |
| 18 to 34 Years | 27 (17.0%) | 0 (0.0%) |
| 35 to 64 Years | 0 (0.0%) | 5 (1.4%) |
| 65 to 74 Years | 0 (0.0%) | 0 (0.0%) |
| 75 Years and over | 7 (12.7%) | 0 (0.0%) |
Technology Access in Palm Shores
Computing Device Access in Palm Shores
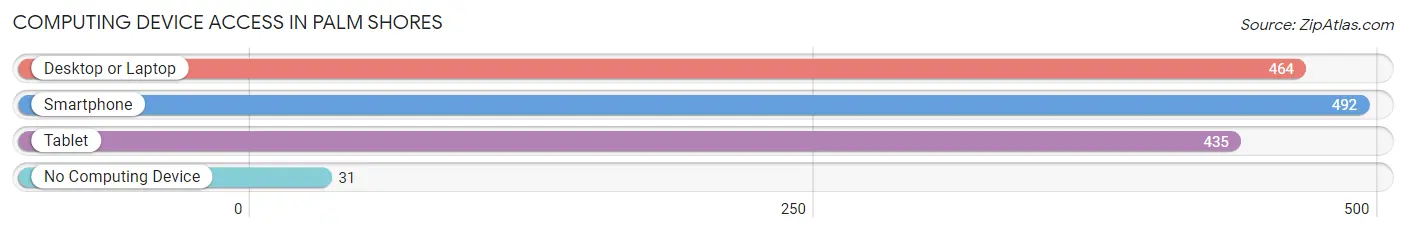
| Device Type | # Households | % Households |
| Desktop or Laptop | 464 | 81.6% |
| Smartphone | 492 | 86.5% |
| Tablet | 435 | 76.4% |
| No Computing Device | 31 | 5.4% |
| Total | 569 | 100.0% |
Internet Access in Palm Shores
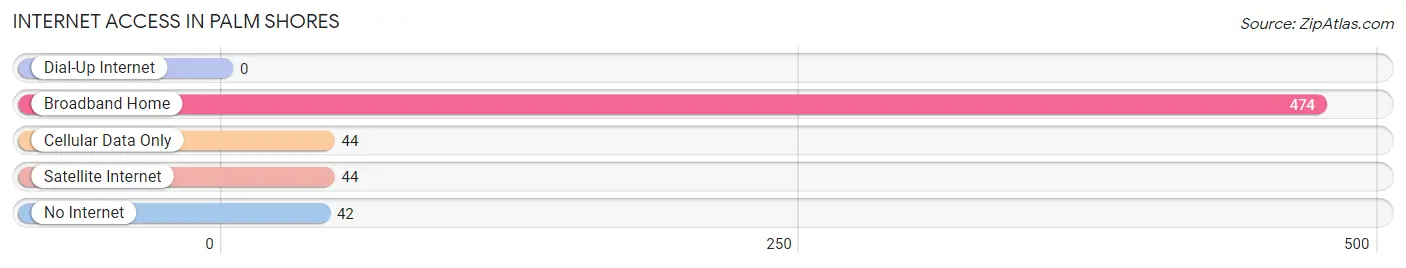
| Internet Type | # Households | % Households |
| Dial-Up Internet | 0 | 0.0% |
| Broadband Home | 474 | 83.3% |
| Cellular Data Only | 44 | 7.7% |
| Satellite Internet | 44 | 7.7% |
| No Internet | 42 | 7.4% |
| Total | 569 | 100.0% |
Palm Shores Summary
Palm Shores is a small town located in Brevard County, Florida, United States. It is situated on the Indian River Lagoon, just south of Melbourne. The town was incorporated in 1959 and has a population of approximately 4,000 people.
Geography
Palm Shores is located in Brevard County, Florida, United States. It is situated on the Indian River Lagoon, just south of Melbourne. The town is bordered by the cities of Melbourne, Indian Harbour Beach, and Satellite Beach. The town is located on the east coast of Florida, and is approximately 60 miles southeast of Orlando. The town is situated on a peninsula, with the Indian River Lagoon to the west and the Atlantic Ocean to the east.
The town has a total area of 1.3 square miles, all of which is land. The town is located at an elevation of 10 feet above sea level. The climate in Palm Shores is humid subtropical, with hot, humid summers and mild winters. The average temperature in the summer is around 90 degrees Fahrenheit, and the average temperature in the winter is around 70 degrees Fahrenheit.
History
Palm Shores was first settled in the late 1800s by a group of settlers from the Bahamas. The settlers were attracted to the area due to its abundance of fish and wildlife. The town was originally known as "Bahama Shores" and was later renamed "Palm Shores" in 1959.
The town was incorporated in 1959 and has since grown to a population of approximately 4,000 people. The town is known for its beautiful beaches, fishing, and boating.
Economy
The economy of Palm Shores is largely based on tourism and fishing. The town is home to several marinas, which attract tourists from all over the world. The town is also home to several restaurants, bars, and shops.
The town is also home to several technology companies, such as Harris Corporation, which is a major employer in the area. The town is also home to several aerospace companies, such as Northrop Grumman and Lockheed Martin.
Demographics
As of the 2010 census, the population of Palm Shores was 4,039. The racial makeup of the town was 94.3% White, 1.7% African American, 0.3% Native American, 1.2% Asian, 0.1% Pacific Islander, 1.2% from other races, and 1.4% from two or more races. Hispanic or Latino of any race were 4.2% of the population.
The median income for a household in the town was $45,938, and the median income for a family was $51,938. The per capita income for the town was $25,938. About 8.3% of families and 10.2% of the population were below the poverty line, including 14.2% of those under age 18 and 5.2% of those age 65 or over.
Palm Shores is a small town with a rich history and a vibrant economy. The town is known for its beautiful beaches, fishing, and boating. The town is also home to several technology and aerospace companies, which provide employment opportunities for the residents. The town has a diverse population, with a mix of different races and ethnicities. The town is a great place to live, work, and play.
Common Questions
What is Per Capita Income in Palm Shores?
Per Capita income in Palm Shores is $51,619.
What is the Median Family Income in Palm Shores?
Median Family Income in Palm Shores is $118,182.
What is the Median Household income in Palm Shores?
Median Household Income in Palm Shores is $98,125.
What is Income or Wage Gap in Palm Shores?
Income or Wage Gap in Palm Shores is 56.2%.
Women in Palm Shores earn 43.8 cents for every dollar earned by a man.
What is Inequality or Gini Index in Palm Shores?
Inequality or Gini Index in Palm Shores is 0.51.
What is the Total Population of Palm Shores?
Total Population of Palm Shores is 1,577.
What is the Total Male Population of Palm Shores?
Total Male Population of Palm Shores is 720.
What is the Total Female Population of Palm Shores?
Total Female Population of Palm Shores is 857.
What is the Ratio of Males per 100 Females in Palm Shores?
There are 84.01 Males per 100 Females in Palm Shores.
What is the Ratio of Females per 100 Males in Palm Shores?
There are 119.03 Females per 100 Males in Palm Shores.
What is the Median Population Age in Palm Shores?
Median Population Age in Palm Shores is 43.3 Years.
What is the Average Family Size in Palm Shores
Average Family Size in Palm Shores is 3.2 People.
What is the Average Household Size in Palm Shores
Average Household Size in Palm Shores is 2.8 People.
How Large is the Labor Force in Palm Shores?
There are 962 People in the Labor Forcein in Palm Shores.
What is the Percentage of People in the Labor Force in Palm Shores?
73.3% of People are in the Labor Force in Palm Shores.
What is the Unemployment Rate in Palm Shores?
Unemployment Rate in Palm Shores is 1.6%.