Ormond by the Sea, FL Map & Demographics
Ormond by the Sea Map
Ormond by the Sea Overview
$67,925
PER CAPITA INCOME
$77,230
AVG FAMILY INCOME
$59,598
AVG HOUSEHOLD INCOME
10.0%
WAGE / INCOME GAP [ % ]
90.0¢/ $1
WAGE / INCOME GAP [ $ ]
0.63
INEQUALITY / GINI INDEX
6,668
TOTAL POPULATION
3,377
MALE POPULATION
3,291
FEMALE POPULATION
102.61
MALES / 100 FEMALES
97.45
FEMALES / 100 MALES
61.8
MEDIAN AGE
2.5
AVG FAMILY SIZE
1.8
AVG HOUSEHOLD SIZE
2,870
LABOR FORCE [ PEOPLE ]
45.4%
PERCENT IN LABOR FORCE
9.3%
UNEMPLOYMENT RATE
Income in Ormond by the Sea
Income Overview in Ormond by the Sea
Per Capita Income in Ormond by the Sea is $67,925, while median incomes of families and households are $77,230 and $59,598 respectively.
| Characteristic | Number | Measure |
| Per Capita Income | 6,668 | $67,925 |
| Median Family Income | 1,766 | $77,230 |
| Mean Family Income | 1,766 | $177,557 |
| Median Household Income | 3,626 | $59,598 |
| Mean Household Income | 3,626 | $124,961 |
| Income Deficit | 1,766 | $0 |
| Wage / Income Gap (%) | 6,668 | 10.00% |
| Wage / Income Gap ($) | 6,668 | 90.00¢ per $1 |
| Gini / Inequality Index | 6,668 | 0.63 |
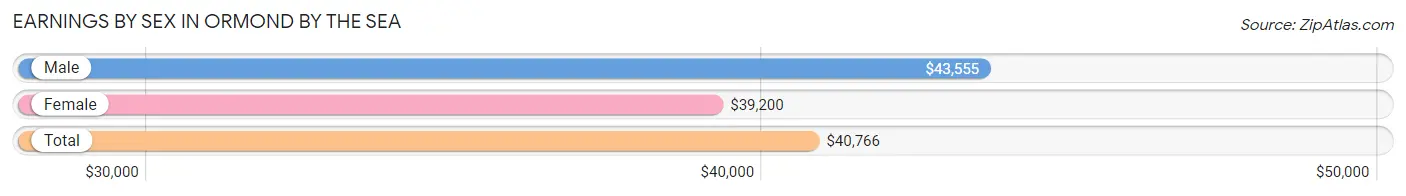
Earnings by Sex in Ormond by the Sea
Average Earnings in Ormond by the Sea are $40,766, $43,555 for men and $39,200 for women, a difference of 10.0%.
| Sex | Number | Average Earnings |
| Male | 1,701 (57.2%) | $43,555 |
| Female | 1,274 (42.8%) | $39,200 |
| Total | 2,975 (100.0%) | $40,766 |
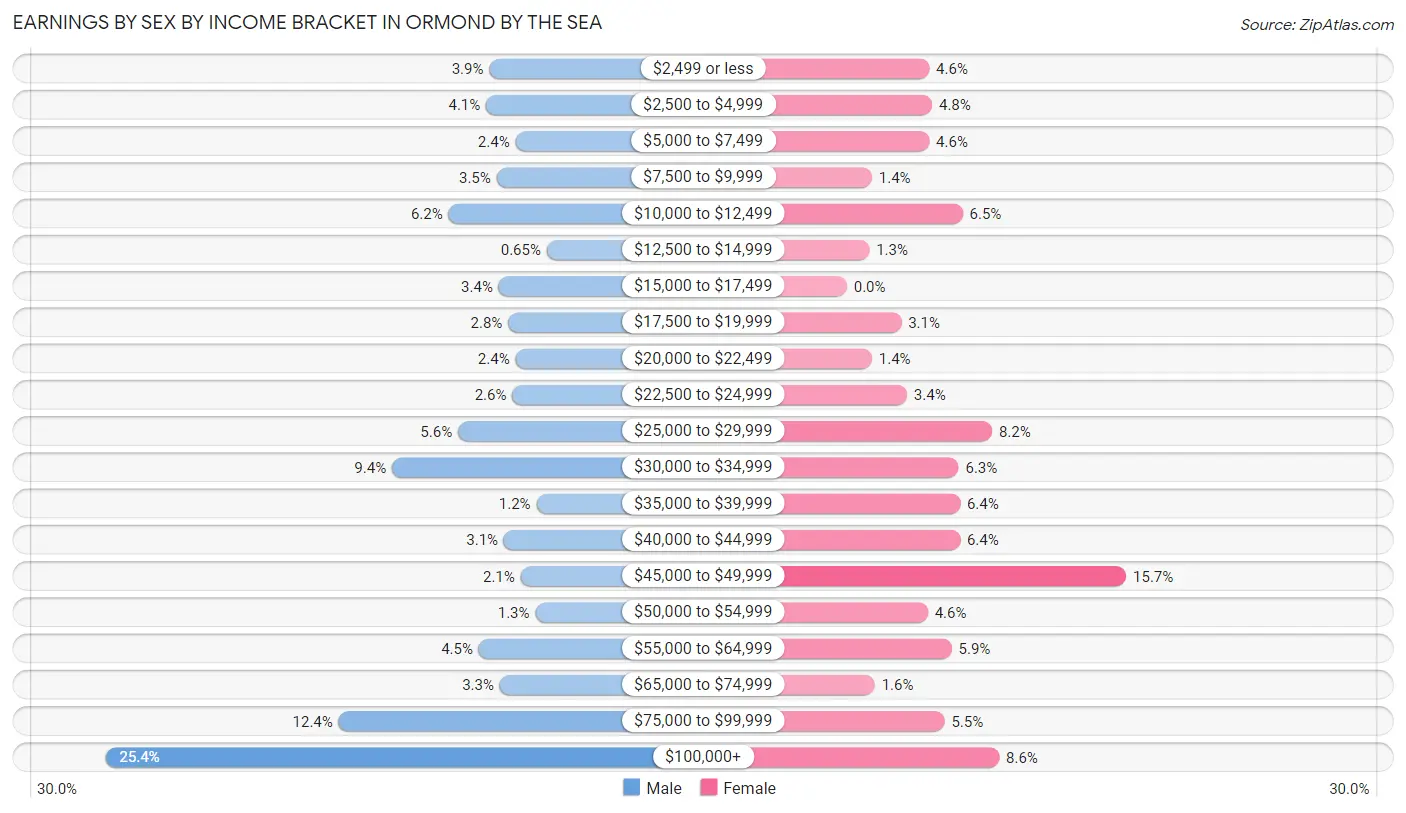
Earnings by Sex by Income Bracket in Ormond by the Sea
The most common earnings brackets in Ormond by the Sea are $100,000+ for men (432 | 25.4%) and $45,000 to $49,999 for women (200 | 15.7%).
| Income | Male | Female |
| $2,499 or less | 66 (3.9%) | 59 (4.6%) |
| $2,500 to $4,999 | 69 (4.1%) | 61 (4.8%) |
| $5,000 to $7,499 | 41 (2.4%) | 59 (4.6%) |
| $7,500 to $9,999 | 59 (3.5%) | 18 (1.4%) |
| $10,000 to $12,499 | 105 (6.2%) | 83 (6.5%) |
| $12,500 to $14,999 | 11 (0.6%) | 16 (1.3%) |
| $15,000 to $17,499 | 57 (3.4%) | 0 (0.0%) |
| $17,500 to $19,999 | 48 (2.8%) | 39 (3.1%) |
| $20,000 to $22,499 | 41 (2.4%) | 18 (1.4%) |
| $22,500 to $24,999 | 44 (2.6%) | 43 (3.4%) |
| $25,000 to $29,999 | 96 (5.6%) | 104 (8.2%) |
| $30,000 to $34,999 | 159 (9.3%) | 80 (6.3%) |
| $35,000 to $39,999 | 21 (1.2%) | 81 (6.4%) |
| $40,000 to $44,999 | 52 (3.1%) | 81 (6.4%) |
| $45,000 to $49,999 | 36 (2.1%) | 200 (15.7%) |
| $50,000 to $54,999 | 22 (1.3%) | 58 (4.5%) |
| $55,000 to $64,999 | 76 (4.5%) | 75 (5.9%) |
| $65,000 to $74,999 | 56 (3.3%) | 20 (1.6%) |
| $75,000 to $99,999 | 210 (12.3%) | 70 (5.5%) |
| $100,000+ | 432 (25.4%) | 109 (8.6%) |
| Total | 1,701 (100.0%) | 1,274 (100.0%) |
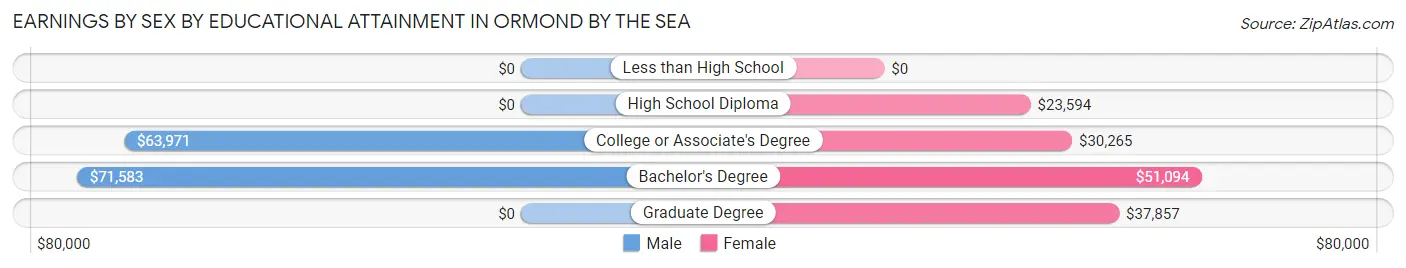
Earnings by Sex by Educational Attainment in Ormond by the Sea
Average earnings in Ormond by the Sea are $55,930 for men and $39,967 for women, a difference of 28.5%. Men with an educational attainment of bachelor's degree enjoy the highest average annual earnings of $71,583, while those with college or associate's degree education earn the least with $63,971. Women with an educational attainment of bachelor's degree earn the most with the average annual earnings of $51,094, while those with high school diploma education have the smallest earnings of $23,594.
| Educational Attainment | Male Income | Female Income |
| Less than High School | - | - |
| High School Diploma | - | - |
| College or Associate's Degree | $63,971 | $30,265 |
| Bachelor's Degree | $71,583 | $51,094 |
| Graduate Degree | - | - |
| Total | $55,930 | $39,967 |
Family Income in Ormond by the Sea
Family Income Brackets in Ormond by the Sea
According to the Ormond by the Sea family income data, there are 383 families falling into the $50,000 to $74,999 income range, which is the most common income bracket and makes up 21.7% of all families. Conversely, the less than $10,000 income bracket is the least frequent group with only 35 families (2.0%) belonging to this category.
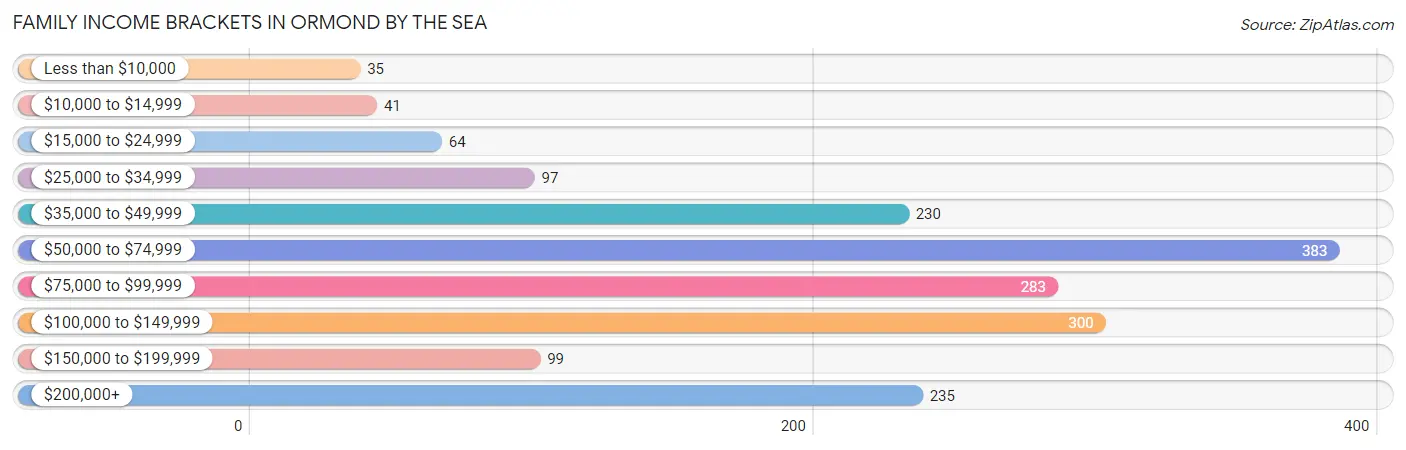
| Income Bracket | # Families | % Families |
| Less than $10,000 | 35 | 2.0% |
| $10,000 to $14,999 | 41 | 2.3% |
| $15,000 to $24,999 | 64 | 3.6% |
| $25,000 to $34,999 | 97 | 5.5% |
| $35,000 to $49,999 | 230 | 13.0% |
| $50,000 to $74,999 | 383 | 21.7% |
| $75,000 to $99,999 | 283 | 16.0% |
| $100,000 to $149,999 | 300 | 17.0% |
| $150,000 to $199,999 | 99 | 5.6% |
| $200,000+ | 235 | 13.3% |
Family Income by Famaliy Size in Ormond by the Sea
4-person families (121 | 6.9%) account for the highest median family income in Ormond by the Sea with $89,297 per family, while 2-person families (1,251 | 70.8%) have the highest median income of $37,517 per family member.
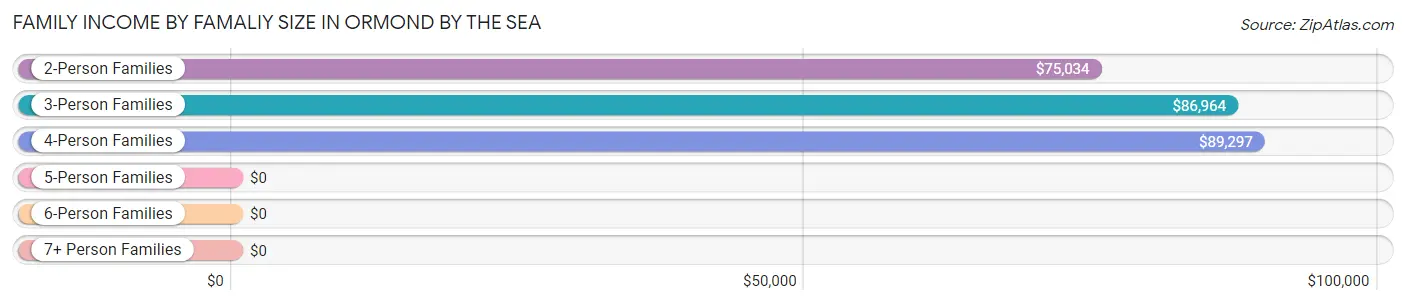
| Income Bracket | # Families | Median Income |
| 2-Person Families | 1,251 (70.8%) | $75,034 |
| 3-Person Families | 329 (18.6%) | $86,964 |
| 4-Person Families | 121 (6.9%) | $89,297 |
| 5-Person Families | 34 (1.9%) | $0 |
| 6-Person Families | 31 (1.8%) | $0 |
| 7+ Person Families | 0 (0.0%) | $0 |
| Total | 1,766 (100.0%) | $77,230 |
Family Income by Number of Earners in Ormond by the Sea
The median family income in Ormond by the Sea is $77,230, with families comprising 2 earners (638) having the highest median family income of $101,111, while families with no earners (599) have the lowest median family income of $54,954, accounting for 36.1% and 33.9% of families, respectively.
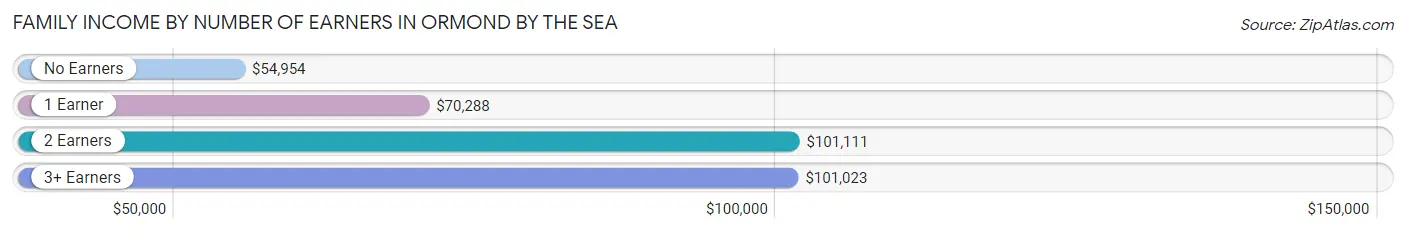
| Number of Earners | # Families | Median Income |
| No Earners | 599 (33.9%) | $54,954 |
| 1 Earner | 447 (25.3%) | $70,288 |
| 2 Earners | 638 (36.1%) | $101,111 |
| 3+ Earners | 82 (4.6%) | $101,023 |
| Total | 1,766 (100.0%) | $77,230 |
Household Income in Ormond by the Sea
Household Income Brackets in Ormond by the Sea
With 649 households falling in the category, the $50,000 to $74,999 income range is the most frequent in Ormond by the Sea, accounting for 17.9% of all households. In contrast, only 127 households (3.5%) fall into the $10,000 to $14,999 income bracket, making it the least populous group.
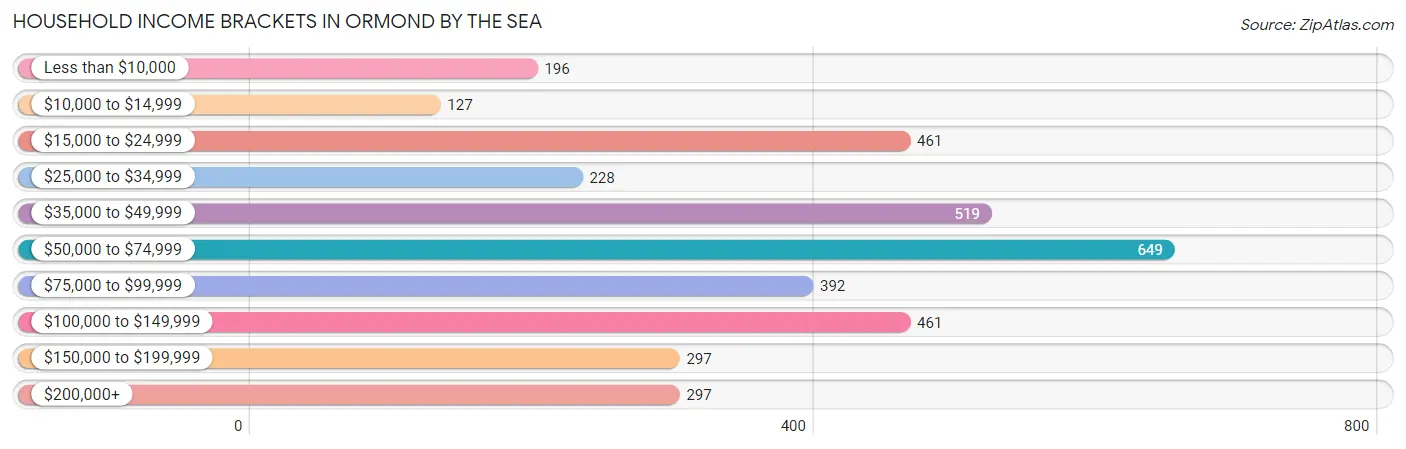
| Income Bracket | # Households | % Households |
| Less than $10,000 | 196 | 5.4% |
| $10,000 to $14,999 | 127 | 3.5% |
| $15,000 to $24,999 | 461 | 12.7% |
| $25,000 to $34,999 | 228 | 6.3% |
| $35,000 to $49,999 | 519 | 14.3% |
| $50,000 to $74,999 | 649 | 17.9% |
| $75,000 to $99,999 | 392 | 10.8% |
| $100,000 to $149,999 | 461 | 12.7% |
| $150,000 to $199,999 | 297 | 8.2% |
| $200,000+ | 297 | 8.2% |
Household Income by Householder Age in Ormond by the Sea
The median household income in Ormond by the Sea is $59,598, with the highest median household income of $76,715 found in the 45 to 64 years age bracket for the primary householder. A total of 1,359 households (37.5%) fall into this category. Meanwhile, the 15 to 24 years age bracket for the primary householder has the lowest median household income of $0, with 6 households (0.2%) in this group.
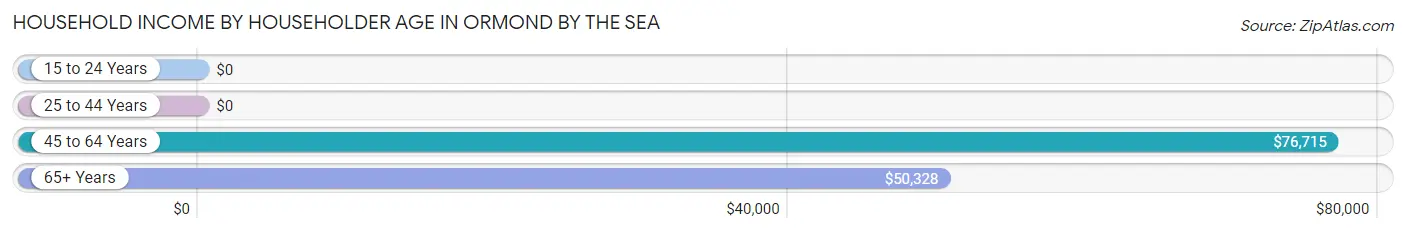
| Income Bracket | # Households | Median Income |
| 15 to 24 Years | 6 (0.2%) | $0 |
| 25 to 44 Years | 373 (10.3%) | $0 |
| 45 to 64 Years | 1,359 (37.5%) | $76,715 |
| 65+ Years | 1,888 (52.1%) | $50,328 |
| Total | 3,626 (100.0%) | $59,598 |
Poverty in Ormond by the Sea
Income Below Poverty by Sex and Age in Ormond by the Sea
With 8.5% poverty level for males and 10.7% for females among the residents of Ormond by the Sea, 6 to 11 year old males and 18 to 24 year old females are the most vulnerable to poverty, with 15 males (32.6%) and 28 females (31.1%) in their respective age groups living below the poverty level.
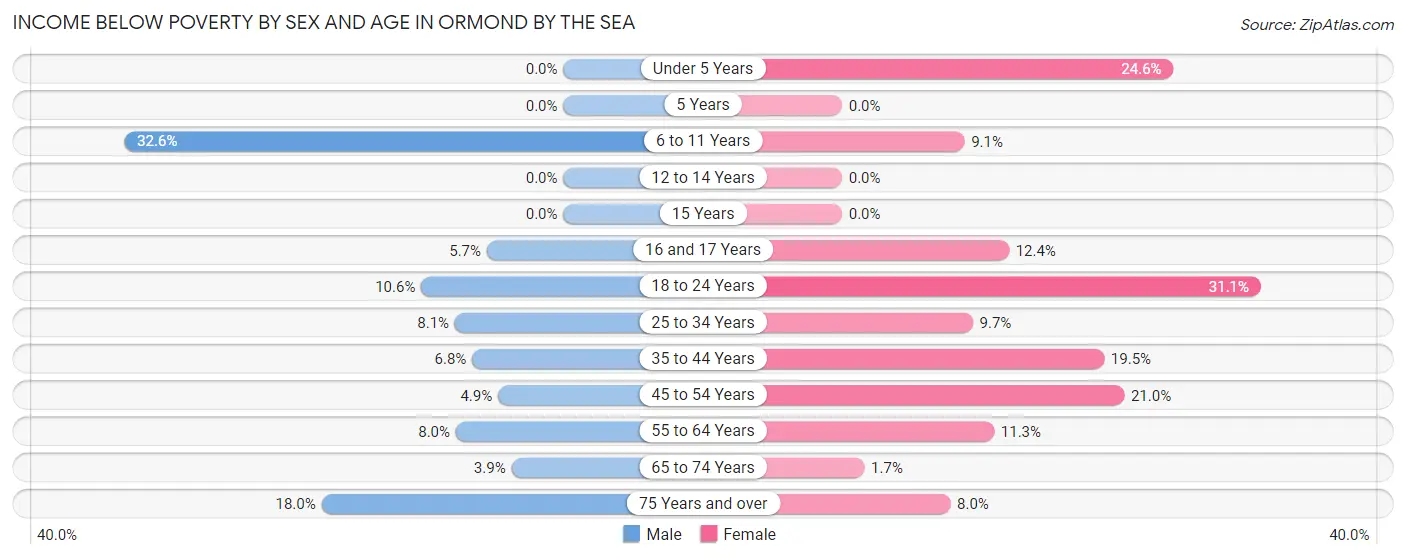
| Age Bracket | Male | Female |
| Under 5 Years | 0 (0.0%) | 16 (24.6%) |
| 5 Years | 0 (0.0%) | 0 (0.0%) |
| 6 to 11 Years | 15 (32.6%) | 13 (9.1%) |
| 12 to 14 Years | 0 (0.0%) | 0 (0.0%) |
| 15 Years | 0 (0.0%) | 0 (0.0%) |
| 16 and 17 Years | 5 (5.7%) | 14 (12.4%) |
| 18 to 24 Years | 25 (10.5%) | 28 (31.1%) |
| 25 to 34 Years | 19 (8.1%) | 17 (9.7%) |
| 35 to 44 Years | 13 (6.8%) | 29 (19.5%) |
| 45 to 54 Years | 20 (4.9%) | 79 (20.9%) |
| 55 to 64 Years | 60 (8.0%) | 92 (11.3%) |
| 65 to 74 Years | 31 (3.8%) | 11 (1.7%) |
| 75 Years and over | 98 (17.9%) | 54 (8.0%) |
| Total | 286 (8.5%) | 353 (10.7%) |
Income Above Poverty by Sex and Age in Ormond by the Sea
According to the poverty statistics in Ormond by the Sea, males aged under 5 years and females aged 12 to 14 years are the age groups that are most secure financially, with 100.0% of males and 100.0% of females in these age groups living above the poverty line.
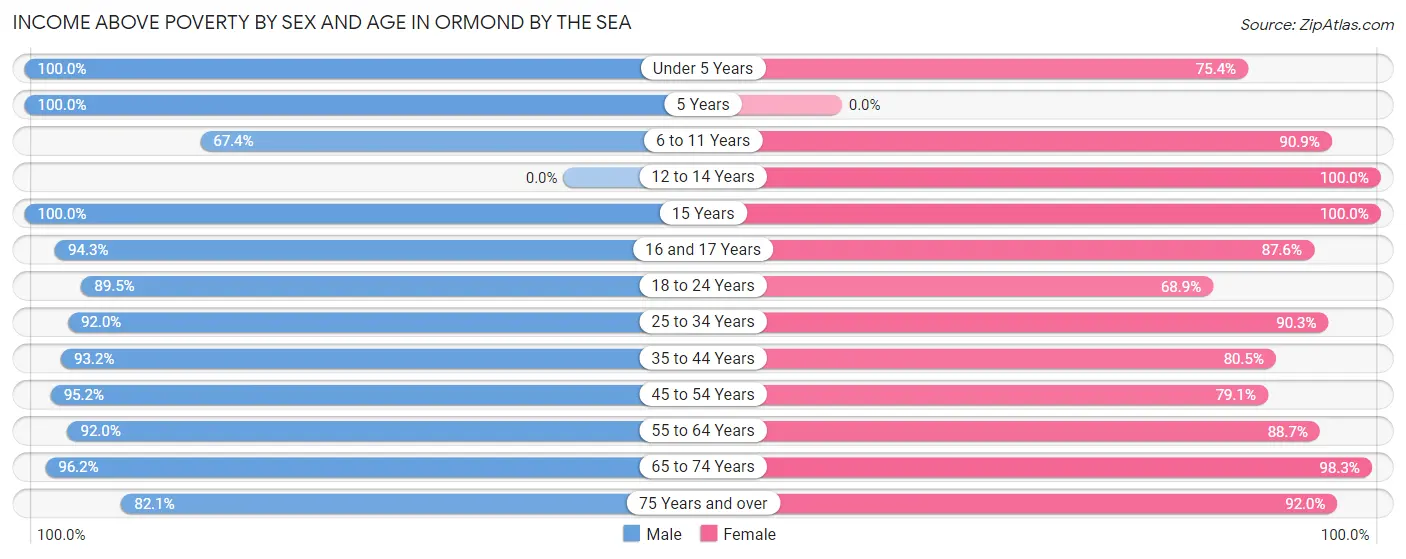
| Age Bracket | Male | Female |
| Under 5 Years | 19 (100.0%) | 49 (75.4%) |
| 5 Years | 21 (100.0%) | 0 (0.0%) |
| 6 to 11 Years | 31 (67.4%) | 130 (90.9%) |
| 12 to 14 Years | 0 (0.0%) | 12 (100.0%) |
| 15 Years | 22 (100.0%) | 18 (100.0%) |
| 16 and 17 Years | 83 (94.3%) | 99 (87.6%) |
| 18 to 24 Years | 212 (89.4%) | 62 (68.9%) |
| 25 to 34 Years | 217 (91.9%) | 158 (90.3%) |
| 35 to 44 Years | 179 (93.2%) | 120 (80.5%) |
| 45 to 54 Years | 392 (95.2%) | 298 (79.0%) |
| 55 to 64 Years | 692 (92.0%) | 723 (88.7%) |
| 65 to 74 Years | 775 (96.2%) | 651 (98.3%) |
| 75 Years and over | 448 (82.1%) | 618 (92.0%) |
| Total | 3,091 (91.5%) | 2,938 (89.3%) |
Income Below Poverty Among Married-Couple Families in Ormond by the Sea
The poverty statistics for married-couple families in Ormond by the Sea show that 2.7% or 42 of the total 1,543 families live below the poverty line. Families with no children have the highest poverty rate of 2.8%, comprising of 36 families. On the other hand, families with 3 or 4 children have the lowest poverty rate of 0.0%, which includes 0 families.
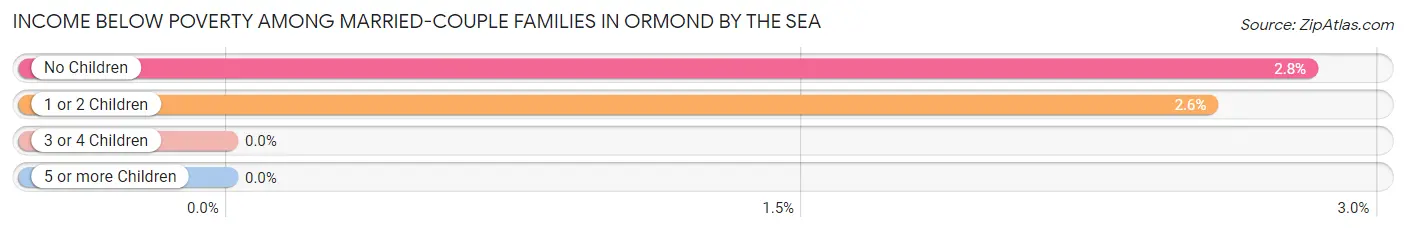
| Children | Above Poverty | Below Poverty |
| No Children | 1,242 (97.2%) | 36 (2.8%) |
| 1 or 2 Children | 228 (97.4%) | 6 (2.6%) |
| 3 or 4 Children | 31 (100.0%) | 0 (0.0%) |
| 5 or more Children | 0 (0.0%) | 0 (0.0%) |
| Total | 1,501 (97.3%) | 42 (2.7%) |
Income Below Poverty Among Single-Parent Households in Ormond by the Sea
According to the poverty data in Ormond by the Sea, 33.3% or 27 single-father households and 17.6% or 25 single-mother households are living below the poverty line. Among single-father households, those with no children have the highest poverty rate, with 27 households (33.3%) experiencing poverty. Likewise, among single-mother households, those with 3 or 4 children have the highest poverty rate, with 16 households (100.0%) falling below the poverty line.
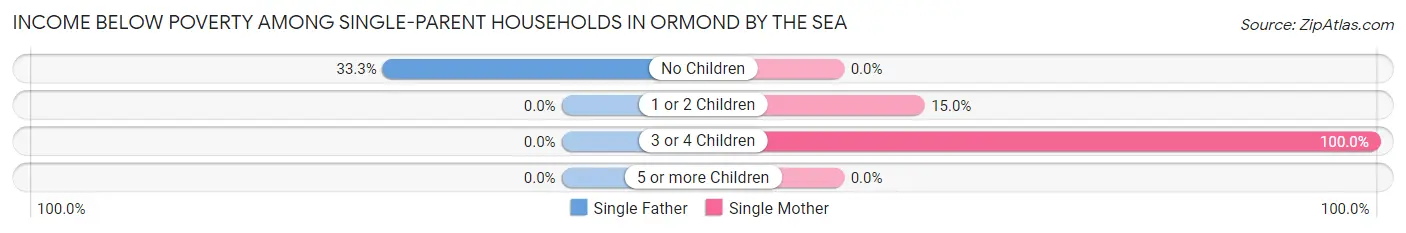
| Children | Single Father | Single Mother |
| No Children | 27 (33.3%) | 0 (0.0%) |
| 1 or 2 Children | 0 (0.0%) | 9 (15.0%) |
| 3 or 4 Children | 0 (0.0%) | 16 (100.0%) |
| 5 or more Children | 0 (0.0%) | 0 (0.0%) |
| Total | 27 (33.3%) | 25 (17.6%) |
Income Below Poverty Among Married-Couple vs Single-Parent Households in Ormond by the Sea
The poverty data for Ormond by the Sea shows that 42 of the married-couple family households (2.7%) and 52 of the single-parent households (23.3%) are living below the poverty level. Within the married-couple family households, those with no children have the highest poverty rate, with 36 households (2.8%) falling below the poverty line. Among the single-parent households, those with 3 or 4 children have the highest poverty rate, with 16 household (100.0%) living below poverty.
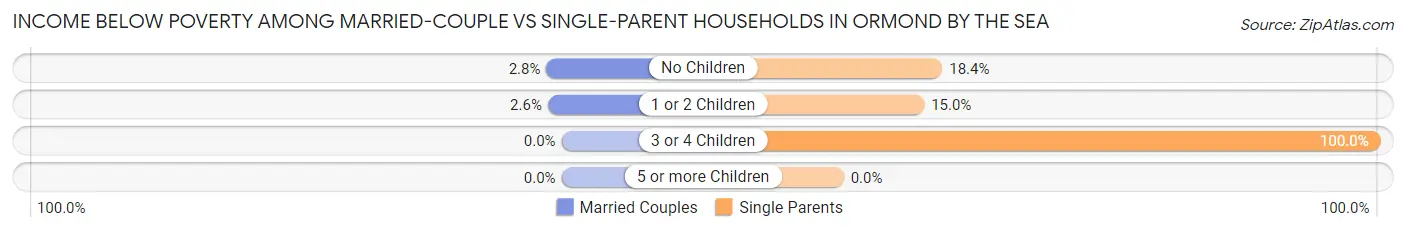
| Children | Married-Couple Families | Single-Parent Households |
| No Children | 36 (2.8%) | 27 (18.4%) |
| 1 or 2 Children | 6 (2.6%) | 9 (15.0%) |
| 3 or 4 Children | 0 (0.0%) | 16 (100.0%) |
| 5 or more Children | 0 (0.0%) | 0 (0.0%) |
| Total | 42 (2.7%) | 52 (23.3%) |
Race in Ormond by the Sea
The most populous races in Ormond by the Sea are White / Caucasian (6,163 | 92.4%), Two or more Races (309 | 4.6%), and Hispanic or Latino (216 | 3.2%).
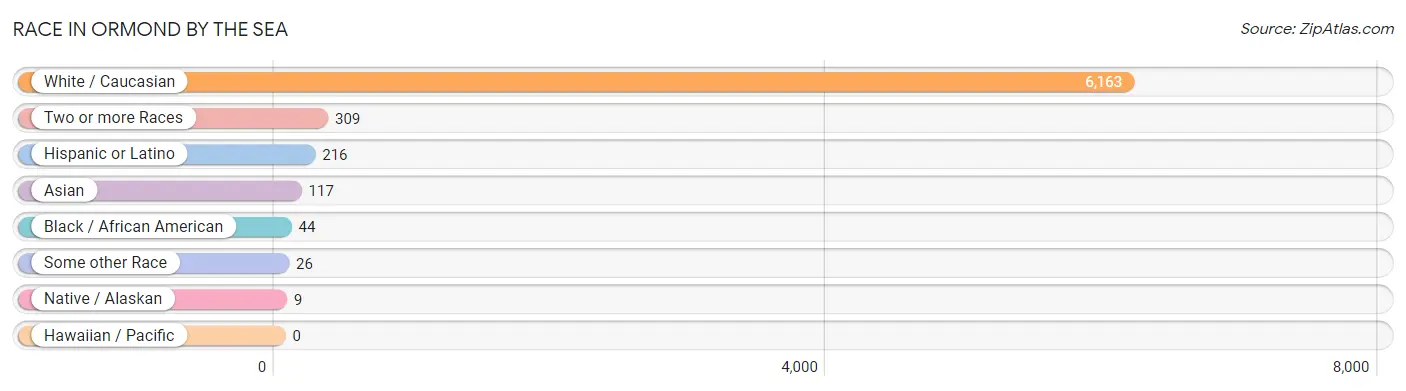
| Race | # Population | % Population |
| Asian | 117 | 1.8% |
| Black / African American | 44 | 0.7% |
| Hawaiian / Pacific | 0 | 0.0% |
| Hispanic or Latino | 216 | 3.2% |
| Native / Alaskan | 9 | 0.1% |
| White / Caucasian | 6,163 | 92.4% |
| Two or more Races | 309 | 4.6% |
| Some other Race | 26 | 0.4% |
| Total | 6,668 | 100.0% |
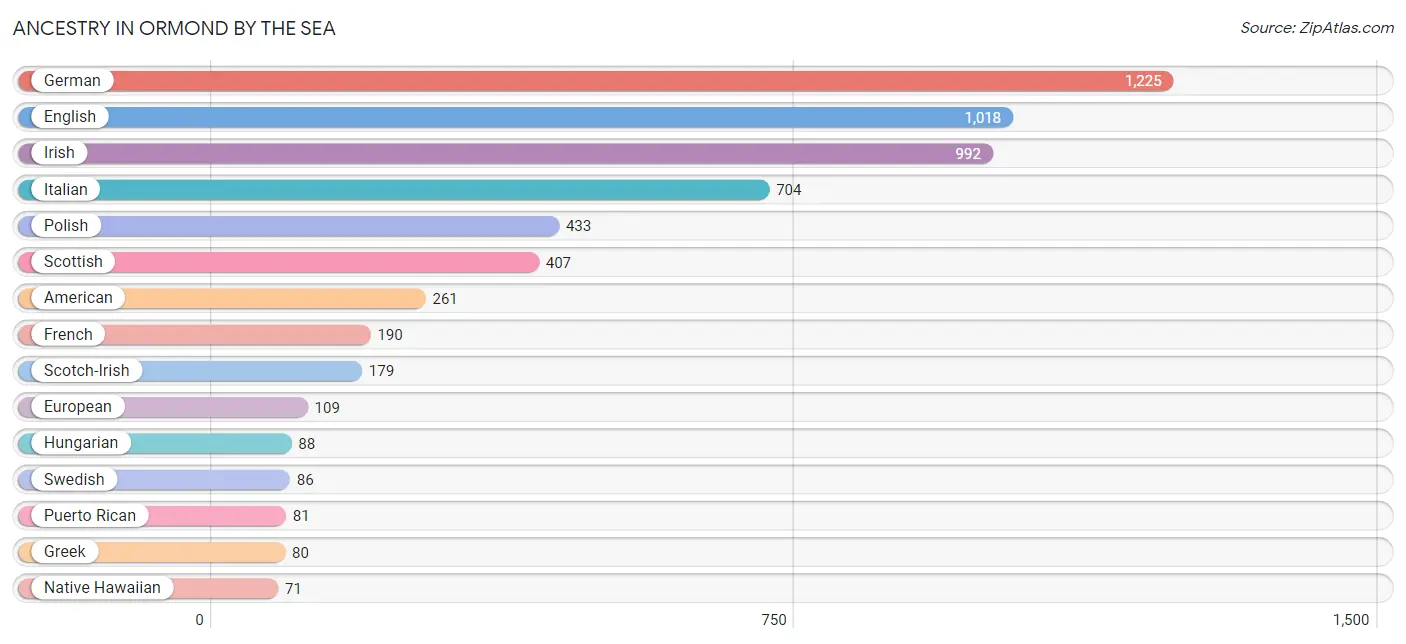
Ancestry in Ormond by the Sea
The most populous ancestries reported in Ormond by the Sea are German (1,225 | 18.4%), English (1,018 | 15.3%), Irish (992 | 14.9%), Italian (704 | 10.6%), and Polish (433 | 6.5%), together accounting for 65.6% of all Ormond by the Sea residents.
| Ancestry | # Population | % Population |
| Albanian | 14 | 0.2% |
| American | 261 | 3.9% |
| Arab | 17 | 0.3% |
| Australian | 11 | 0.2% |
| Austrian | 34 | 0.5% |
| Belgian | 23 | 0.3% |
| Bhutanese | 16 | 0.2% |
| Brazilian | 11 | 0.2% |
| British | 33 | 0.5% |
| Cherokee | 27 | 0.4% |
| Colombian | 11 | 0.2% |
| Croatian | 18 | 0.3% |
| Cuban | 35 | 0.5% |
| Czech | 45 | 0.7% |
| Czechoslovakian | 8 | 0.1% |
| Danish | 34 | 0.5% |
| Dutch | 55 | 0.8% |
| Eastern European | 28 | 0.4% |
| Egyptian | 9 | 0.1% |
| English | 1,018 | 15.3% |
| European | 109 | 1.6% |
| Finnish | 30 | 0.4% |
| French | 190 | 2.9% |
| French Canadian | 51 | 0.8% |
| German | 1,225 | 18.4% |
| Greek | 80 | 1.2% |
| Haitian | 12 | 0.2% |
| Hungarian | 88 | 1.3% |
| Indian (Asian) | 43 | 0.6% |
| Irish | 992 | 14.9% |
| Italian | 704 | 10.6% |
| Korean | 55 | 0.8% |
| Laotian | 10 | 0.2% |
| Latvian | 14 | 0.2% |
| Lebanese | 8 | 0.1% |
| Lithuanian | 23 | 0.3% |
| Maltese | 35 | 0.5% |
| Mexican | 47 | 0.7% |
| Native Hawaiian | 71 | 1.1% |
| Northern European | 8 | 0.1% |
| Norwegian | 24 | 0.4% |
| Pakistani | 7 | 0.1% |
| Polish | 433 | 6.5% |
| Portuguese | 9 | 0.1% |
| Puerto Rican | 81 | 1.2% |
| Russian | 21 | 0.3% |
| Scotch-Irish | 179 | 2.7% |
| Scottish | 407 | 6.1% |
| Serbian | 6 | 0.1% |
| Slavic | 10 | 0.2% |
| Slovak | 32 | 0.5% |
| Slovene | 10 | 0.2% |
| South American | 29 | 0.4% |
| Spaniard | 12 | 0.2% |
| Spanish | 12 | 0.2% |
| Subsaharan African | 16 | 0.2% |
| Swedish | 86 | 1.3% |
| Thai | 26 | 0.4% |
| Venezuelan | 18 | 0.3% |
| Welsh | 25 | 0.4% | View All 60 Rows |
Immigrants in Ormond by the Sea
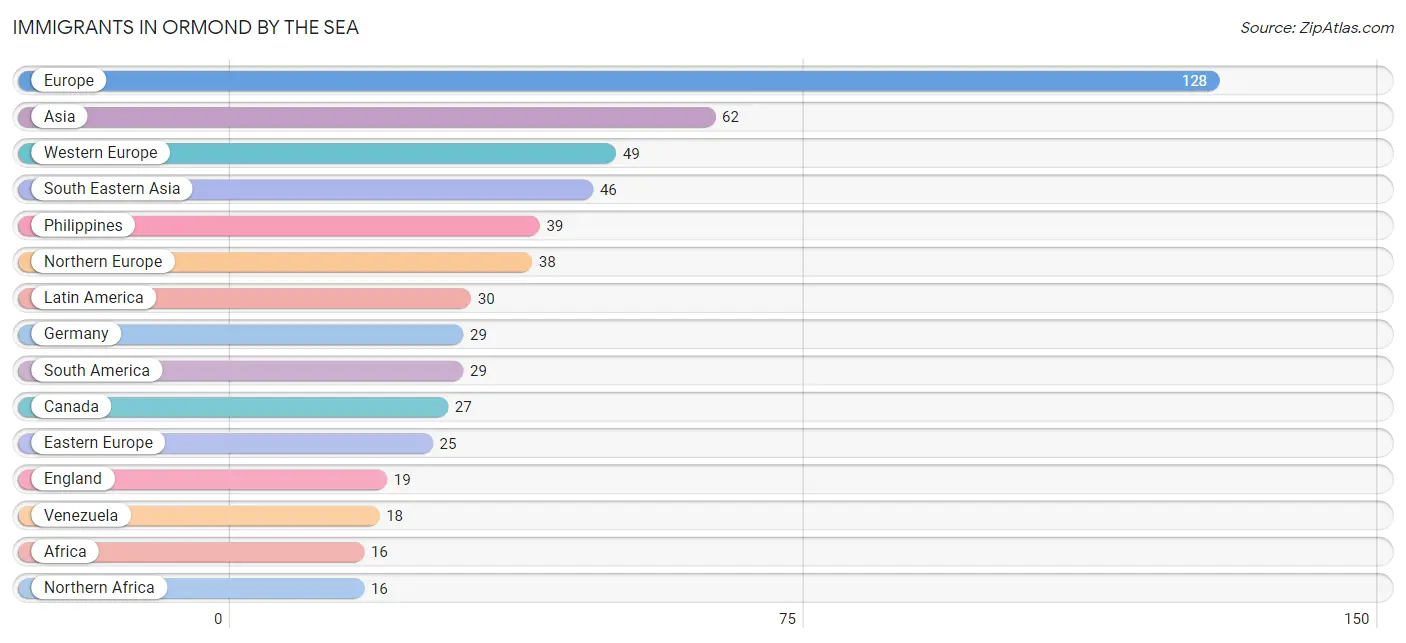
The most numerous immigrant groups reported in Ormond by the Sea came from Europe (128 | 1.9%), Asia (62 | 0.9%), Western Europe (49 | 0.7%), South Eastern Asia (46 | 0.7%), and Philippines (39 | 0.6%), together accounting for 4.9% of all Ormond by the Sea residents.
| Immigration Origin | # Population | % Population |
| Africa | 16 | 0.2% |
| Asia | 62 | 0.9% |
| Austria | 7 | 0.1% |
| Brazil | 11 | 0.2% |
| Canada | 27 | 0.4% |
| Caribbean | 1 | 0.0% |
| Cuba | 1 | 0.0% |
| Denmark | 9 | 0.1% |
| Eastern Asia | 8 | 0.1% |
| Eastern Europe | 25 | 0.4% |
| Egypt | 9 | 0.1% |
| England | 19 | 0.3% |
| Europe | 128 | 1.9% |
| France | 13 | 0.2% |
| Germany | 29 | 0.4% |
| Hungary | 5 | 0.1% |
| Japan | 8 | 0.1% |
| Latin America | 30 | 0.4% |
| Latvia | 6 | 0.1% |
| Lebanon | 8 | 0.1% |
| Northern Africa | 16 | 0.2% |
| Northern Europe | 38 | 0.6% |
| Philippines | 39 | 0.6% |
| Serbia | 6 | 0.1% |
| South America | 29 | 0.4% |
| South Eastern Asia | 46 | 0.7% |
| Southern Europe | 16 | 0.2% |
| Thailand | 7 | 0.1% |
| Venezuela | 18 | 0.3% |
| Western Asia | 8 | 0.1% |
| Western Europe | 49 | 0.7% | View All 31 Rows |
Sex and Age in Ormond by the Sea
Sex and Age in Ormond by the Sea
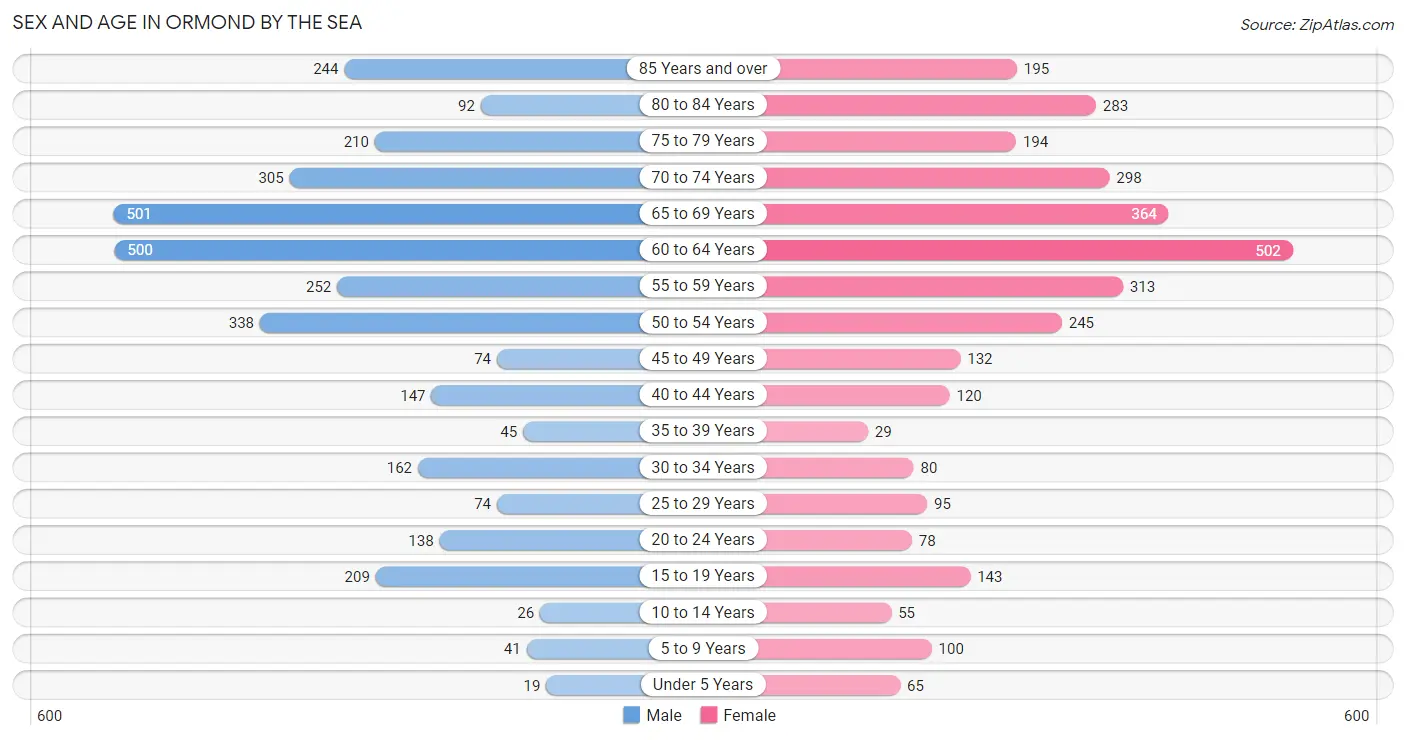
The most populous age groups in Ormond by the Sea are 65 to 69 Years (501 | 14.8%) for men and 60 to 64 Years (502 | 15.2%) for women.
| Age Bracket | Male | Female |
| Under 5 Years | 19 (0.6%) | 65 (2.0%) |
| 5 to 9 Years | 41 (1.2%) | 100 (3.0%) |
| 10 to 14 Years | 26 (0.8%) | 55 (1.7%) |
| 15 to 19 Years | 209 (6.2%) | 143 (4.3%) |
| 20 to 24 Years | 138 (4.1%) | 78 (2.4%) |
| 25 to 29 Years | 74 (2.2%) | 95 (2.9%) |
| 30 to 34 Years | 162 (4.8%) | 80 (2.4%) |
| 35 to 39 Years | 45 (1.3%) | 29 (0.9%) |
| 40 to 44 Years | 147 (4.3%) | 120 (3.6%) |
| 45 to 49 Years | 74 (2.2%) | 132 (4.0%) |
| 50 to 54 Years | 338 (10.0%) | 245 (7.4%) |
| 55 to 59 Years | 252 (7.5%) | 313 (9.5%) |
| 60 to 64 Years | 500 (14.8%) | 502 (15.2%) |
| 65 to 69 Years | 501 (14.8%) | 364 (11.1%) |
| 70 to 74 Years | 305 (9.0%) | 298 (9.0%) |
| 75 to 79 Years | 210 (6.2%) | 194 (5.9%) |
| 80 to 84 Years | 92 (2.7%) | 283 (8.6%) |
| 85 Years and over | 244 (7.2%) | 195 (5.9%) |
| Total | 3,377 (100.0%) | 3,291 (100.0%) |
Families and Households in Ormond by the Sea
Median Family Size in Ormond by the Sea
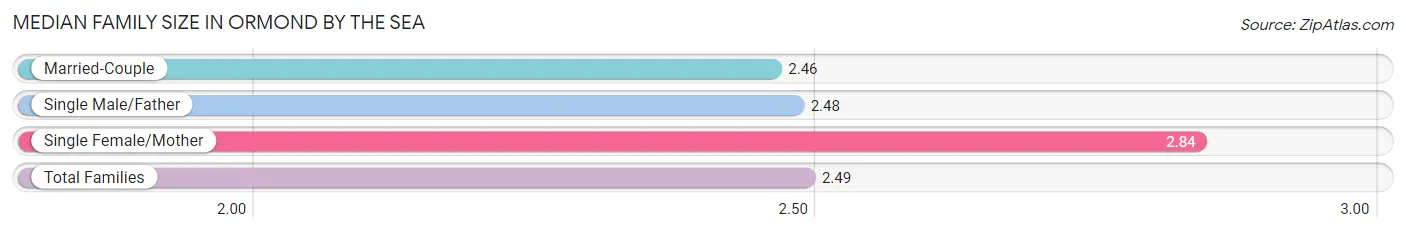
The median family size in Ormond by the Sea is 2.49 persons per family, with single female/mother families (142 | 8.0%) accounting for the largest median family size of 2.84 persons per family. On the other hand, married-couple families (1,543 | 87.4%) represent the smallest median family size with 2.46 persons per family.
| Family Type | # Families | Family Size |
| Married-Couple | 1,543 (87.4%) | 2.46 |
| Single Male/Father | 81 (4.6%) | 2.48 |
| Single Female/Mother | 142 (8.0%) | 2.84 |
| Total Families | 1,766 (100.0%) | 2.49 |
Median Household Size in Ormond by the Sea
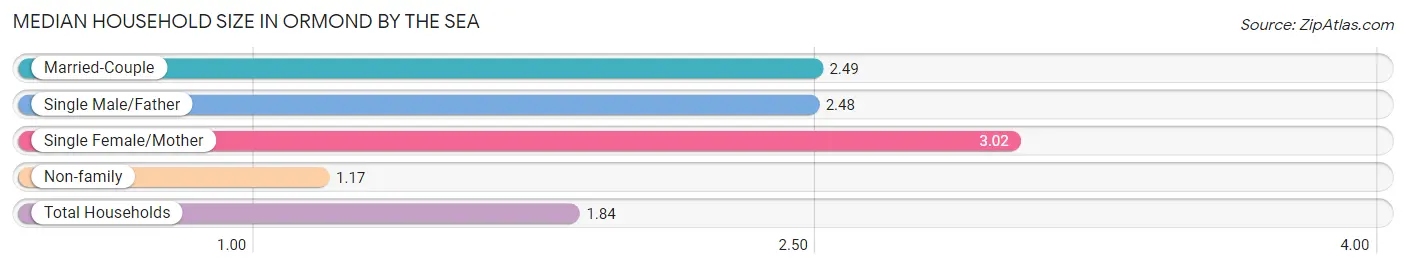
The median household size in Ormond by the Sea is 1.84 persons per household, with single female/mother households (142 | 3.9%) accounting for the largest median household size of 3.02 persons per household. non-family households (1,860 | 51.3%) represent the smallest median household size with 1.17 persons per household.
| Household Type | # Households | Household Size |
| Married-Couple | 1,543 (42.5%) | 2.49 |
| Single Male/Father | 81 (2.2%) | 2.48 |
| Single Female/Mother | 142 (3.9%) | 3.02 |
| Non-family | 1,860 (51.3%) | 1.17 |
| Total Households | 3,626 (100.0%) | 1.84 |
Household Size by Marriage Status in Ormond by the Sea
Out of a total of 3,626 households in Ormond by the Sea, 1,766 (48.7%) are family households, while 1,860 (51.3%) are nonfamily households. The most numerous type of family households are 2-person households, comprising 1,221, and the most common type of nonfamily households are 1-person households, comprising 1,542.
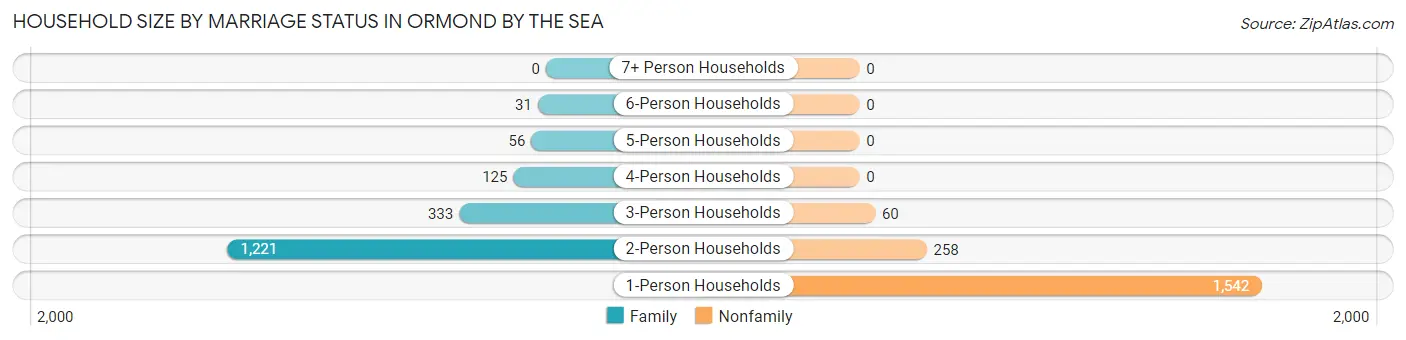
| Household Size | Family Households | Nonfamily Households |
| 1-Person Households | - | 1,542 (42.5%) |
| 2-Person Households | 1,221 (33.7%) | 258 (7.1%) |
| 3-Person Households | 333 (9.2%) | 60 (1.7%) |
| 4-Person Households | 125 (3.5%) | 0 (0.0%) |
| 5-Person Households | 56 (1.5%) | 0 (0.0%) |
| 6-Person Households | 31 (0.9%) | 0 (0.0%) |
| 7+ Person Households | 0 (0.0%) | 0 (0.0%) |
| Total | 1,766 (48.7%) | 1,860 (51.3%) |
Female Fertility in Ormond by the Sea
Fertility by Age in Ormond by the Sea
| Age Bracket | Women with Births | Births / 1,000 Women |
| 15 to 19 years | 0 (0.0%) | 0.0 |
| 20 to 34 years | 0 (0.0%) | 0.0 |
| 35 to 50 years | 0 (0.0%) | 0.0 |
| Total | 0 (0.0%) | 0.0 |
Fertility by Age by Marriage Status in Ormond by the Sea
| Age Bracket | Married | Unmarried |
| 15 to 19 years | 0 (0.0%) | 0 (0.0%) |
| 20 to 34 years | 0 (0.0%) | 0 (0.0%) |
| 35 to 50 years | 0 (0.0%) | 0 (0.0%) |
| Total | 0 (0.0%) | 0 (0.0%) |
Fertility by Education in Ormond by the Sea
| Educational Attainment | Women with Births | Births / 1,000 Women |
| Less than High School | 0 (0.0%) | 0.0 |
| High School Diploma | 0 (0.0%) | 0.0 |
| College or Associate's Degree | 0 (0.0%) | 0.0 |
| Bachelor's Degree | 0 (0.0%) | 0.0 |
| Graduate Degree | 0 (0.0%) | 0.0 |
| Total | 0 (0.0%) | 0.0 |
Fertility by Education by Marriage Status in Ormond by the Sea
| Educational Attainment | Married | Unmarried |
| Less than High School | 0 (0.0%) | 0 (0.0%) |
| High School Diploma | 0 (0.0%) | 0 (0.0%) |
| College or Associate's Degree | 0 (0.0%) | 0 (0.0%) |
| Bachelor's Degree | 0 (0.0%) | 0 (0.0%) |
| Graduate Degree | 0 (0.0%) | 0 (0.0%) |
| Total | 0 (0.0%) | 0 (0.0%) |
Employment Characteristics in Ormond by the Sea
Employment by Class of Employer in Ormond by the Sea
Among the 2,576 employed individuals in Ormond by the Sea, private company employees (1,711 | 66.4%), local government employees (257 | 10.0%), and self-employed (incorporated) (235 | 9.1%) make up the most common classes of employment.
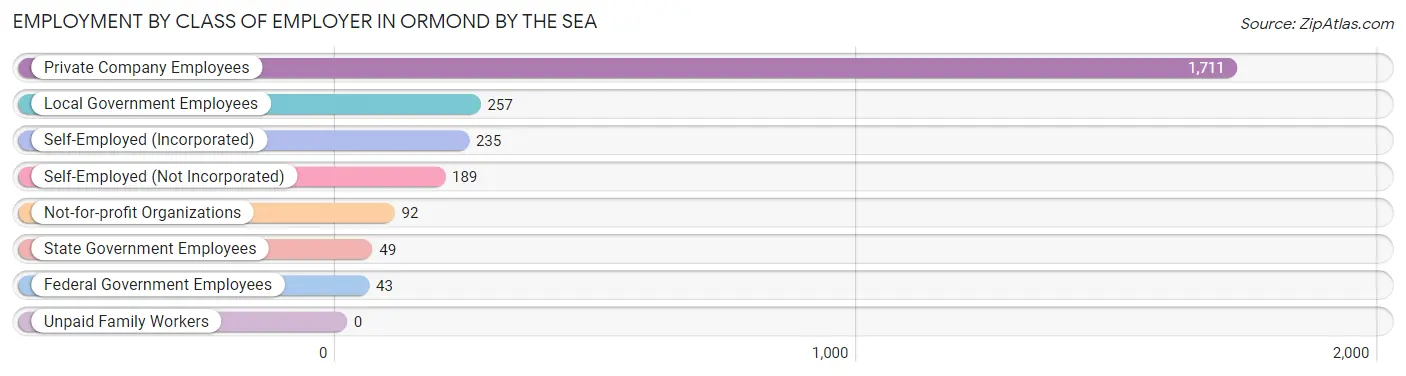
| Employer Class | # Employees | % Employees |
| Private Company Employees | 1,711 | 66.4% |
| Self-Employed (Incorporated) | 235 | 9.1% |
| Self-Employed (Not Incorporated) | 189 | 7.3% |
| Not-for-profit Organizations | 92 | 3.6% |
| Local Government Employees | 257 | 10.0% |
| State Government Employees | 49 | 1.9% |
| Federal Government Employees | 43 | 1.7% |
| Unpaid Family Workers | 0 | 0.0% |
| Total | 2,576 | 100.0% |
Employment Status by Age in Ormond by the Sea
According to the labor force statistics for Ormond by the Sea, out of the total population over 16 years of age (6,322), 45.4% or 2,870 individuals are in the labor force, with 9.3% or 267 of them unemployed. The age group with the highest labor force participation rate is 45 to 54 years, with 89.5% or 706 individuals in the labor force. Within the labor force, the 25 to 29 years age range has the highest percentage of unemployed individuals, with 36.8% or 35 of them being unemployed.
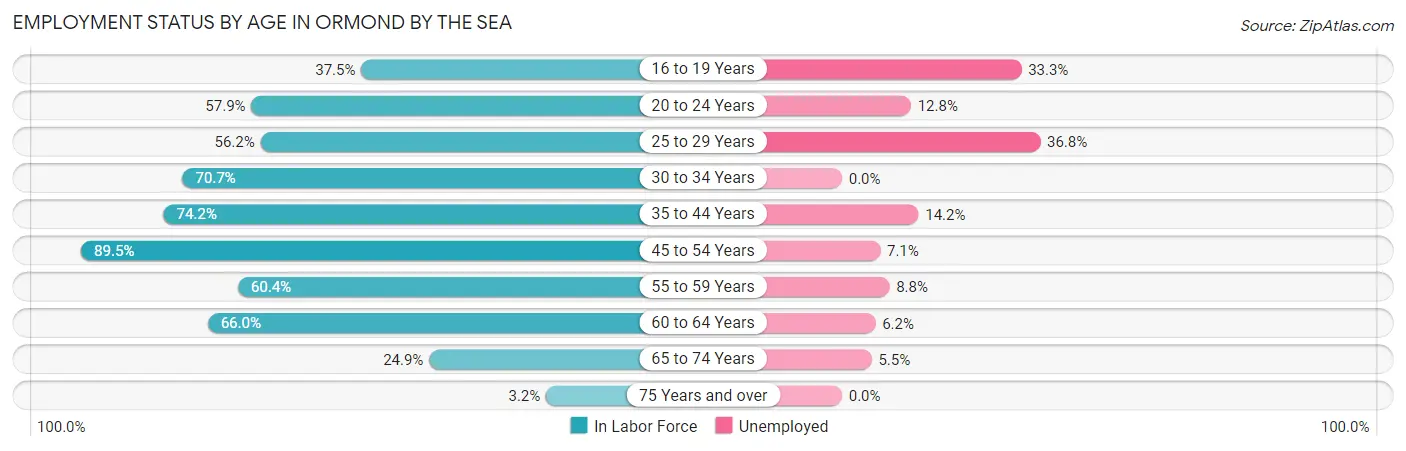
| Age Bracket | In Labor Force | Unemployed |
| 16 to 19 Years | 117 (37.5%) | 39 (33.3%) |
| 20 to 24 Years | 125 (57.9%) | 16 (12.8%) |
| 25 to 29 Years | 95 (56.2%) | 35 (36.8%) |
| 30 to 34 Years | 171 (70.7%) | 0 (0.0%) |
| 35 to 44 Years | 253 (74.2%) | 36 (14.2%) |
| 45 to 54 Years | 706 (89.5%) | 50 (7.1%) |
| 55 to 59 Years | 341 (60.4%) | 30 (8.8%) |
| 60 to 64 Years | 661 (66.0%) | 41 (6.2%) |
| 65 to 74 Years | 366 (24.9%) | 20 (5.5%) |
| 75 Years and over | 39 (3.2%) | 0 (0.0%) |
| Total | 2,870 (45.4%) | 267 (9.3%) |
Employment Status by Educational Attainment in Ormond by the Sea
According to labor force statistics for Ormond by the Sea, 71.7% of individuals (2,228) out of the total population between 25 and 64 years of age (3,108) are in the labor force, with 8.6% or 192 of them being unemployed. The group with the highest labor force participation rate are those with the educational attainment of less than high school, with 85.9% or 152 individuals in the labor force. Within the labor force, individuals with high school diploma education have the highest percentage of unemployment, with 13.1% or 66 of them being unemployed.
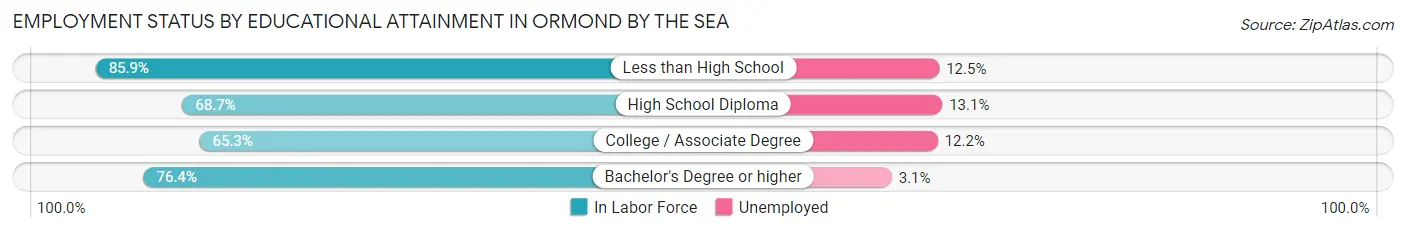
| Educational Attainment | In Labor Force | Unemployed |
| Less than High School | 152 (85.9%) | 22 (12.5%) |
| High School Diploma | 504 (68.7%) | 96 (13.1%) |
| College / Associate Degree | 637 (65.3%) | 119 (12.2%) |
| Bachelor's Degree or higher | 934 (76.4%) | 38 (3.1%) |
| Total | 2,228 (71.7%) | 267 (8.6%) |
Employment Occupations by Sex in Ormond by the Sea
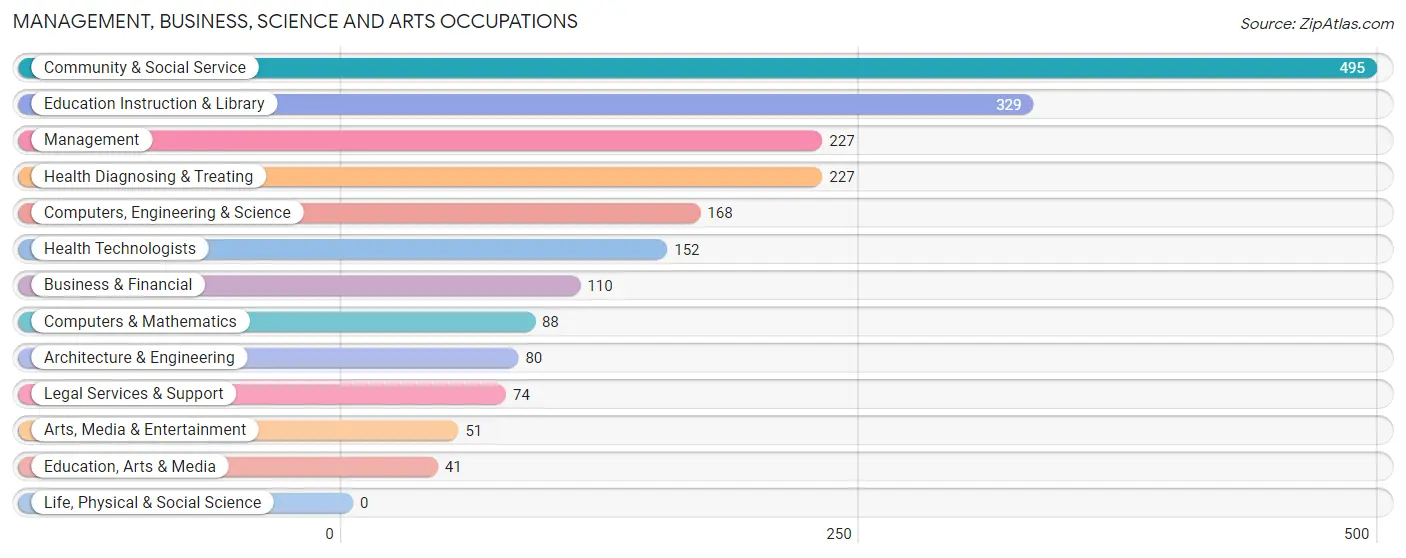
Management, Business, Science and Arts Occupations
The most common Management, Business, Science and Arts occupations in Ormond by the Sea are Community & Social Service (495 | 19.0%), Education Instruction & Library (329 | 12.6%), Management (227 | 8.7%), Health Diagnosing & Treating (227 | 8.7%), and Computers, Engineering & Science (168 | 6.5%).
Management, Business, Science and Arts Occupations by Sex
Within the Management, Business, Science and Arts occupations in Ormond by the Sea, the most male-oriented occupations are Arts, Media & Entertainment (84.3%), Computers & Mathematics (76.1%), and Health Technologists (63.8%), while the most female-oriented occupations are Education, Arts & Media (85.4%), Education Instruction & Library (62.6%), and Legal Services & Support (62.2%).
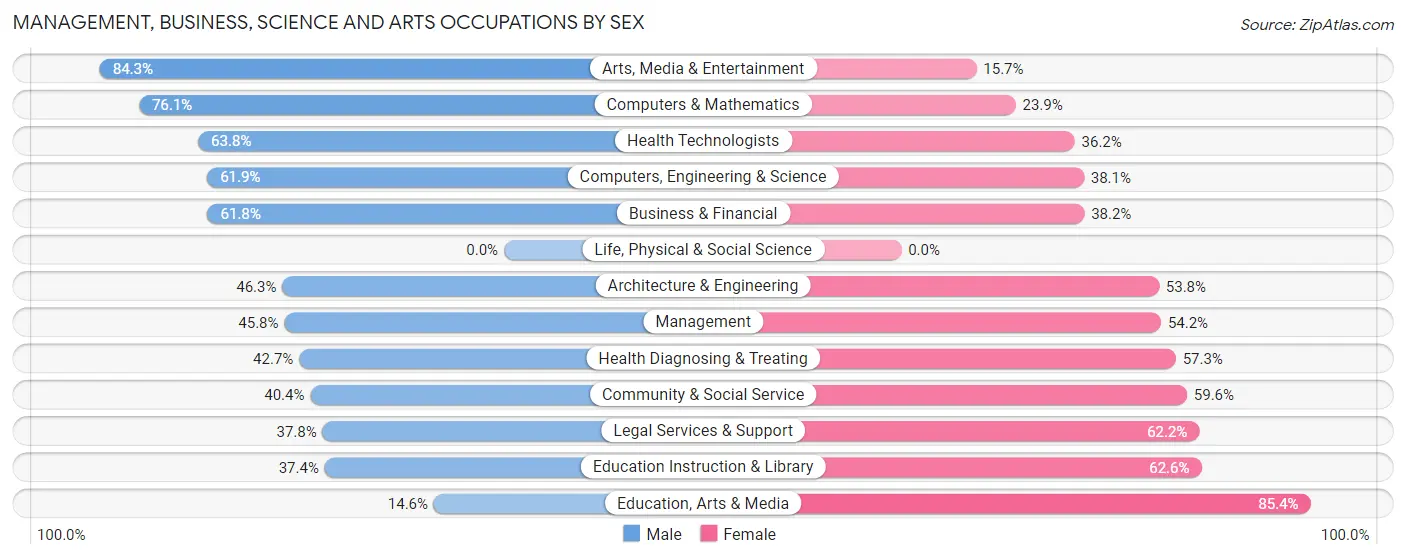
| Occupation | Male | Female |
| Management | 104 (45.8%) | 123 (54.2%) |
| Business & Financial | 68 (61.8%) | 42 (38.2%) |
| Computers, Engineering & Science | 104 (61.9%) | 64 (38.1%) |
| Computers & Mathematics | 67 (76.1%) | 21 (23.9%) |
| Architecture & Engineering | 37 (46.3%) | 43 (53.7%) |
| Life, Physical & Social Science | 0 (0.0%) | 0 (0.0%) |
| Community & Social Service | 200 (40.4%) | 295 (59.6%) |
| Education, Arts & Media | 6 (14.6%) | 35 (85.4%) |
| Legal Services & Support | 28 (37.8%) | 46 (62.2%) |
| Education Instruction & Library | 123 (37.4%) | 206 (62.6%) |
| Arts, Media & Entertainment | 43 (84.3%) | 8 (15.7%) |
| Health Diagnosing & Treating | 97 (42.7%) | 130 (57.3%) |
| Health Technologists | 97 (63.8%) | 55 (36.2%) |
| Total (Category) | 573 (46.7%) | 654 (53.3%) |
| Total (Overall) | 1,462 (56.1%) | 1,144 (43.9%) |
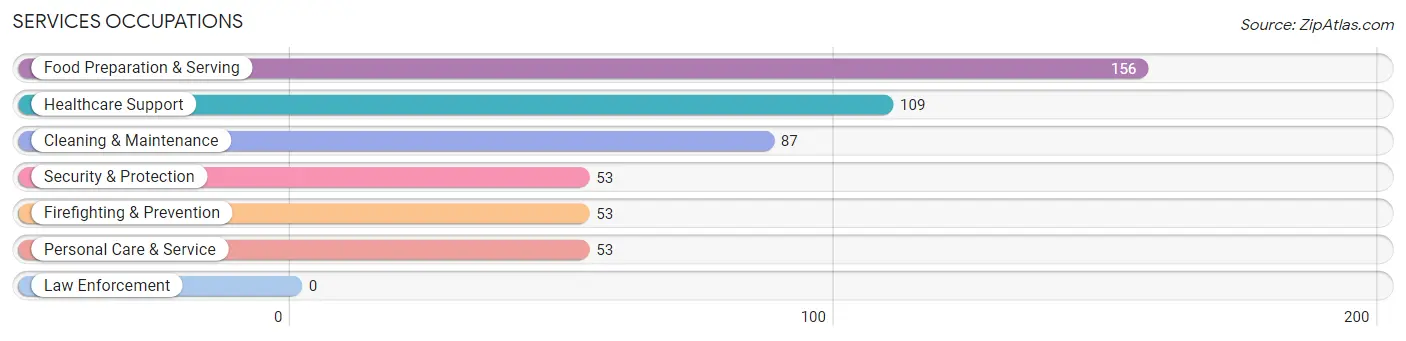
Services Occupations
The most common Services occupations in Ormond by the Sea are Food Preparation & Serving (156 | 6.0%), Healthcare Support (109 | 4.2%), Cleaning & Maintenance (87 | 3.3%), Security & Protection (53 | 2.0%), and Firefighting & Prevention (53 | 2.0%).
Services Occupations by Sex
Within the Services occupations in Ormond by the Sea, the most male-oriented occupations are Personal Care & Service (84.9%), Food Preparation & Serving (84.0%), and Security & Protection (73.6%), while the most female-oriented occupations are Healthcare Support (90.8%), Cleaning & Maintenance (40.2%), and Security & Protection (26.4%).
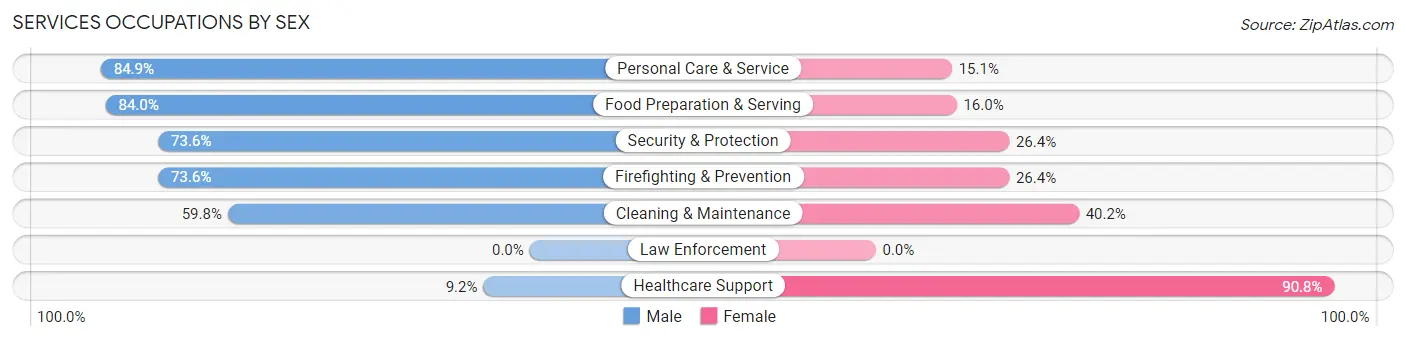
| Occupation | Male | Female |
| Healthcare Support | 10 (9.2%) | 99 (90.8%) |
| Security & Protection | 39 (73.6%) | 14 (26.4%) |
| Firefighting & Prevention | 39 (73.6%) | 14 (26.4%) |
| Law Enforcement | 0 (0.0%) | 0 (0.0%) |
| Food Preparation & Serving | 131 (84.0%) | 25 (16.0%) |
| Cleaning & Maintenance | 52 (59.8%) | 35 (40.2%) |
| Personal Care & Service | 45 (84.9%) | 8 (15.1%) |
| Total (Category) | 277 (60.5%) | 181 (39.5%) |
| Total (Overall) | 1,462 (56.1%) | 1,144 (43.9%) |
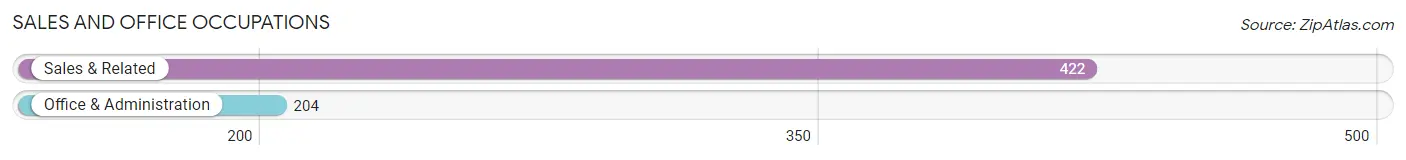
Sales and Office Occupations
The most common Sales and Office occupations in Ormond by the Sea are Sales & Related (422 | 16.2%), and Office & Administration (204 | 7.8%).
Sales and Office Occupations by Sex
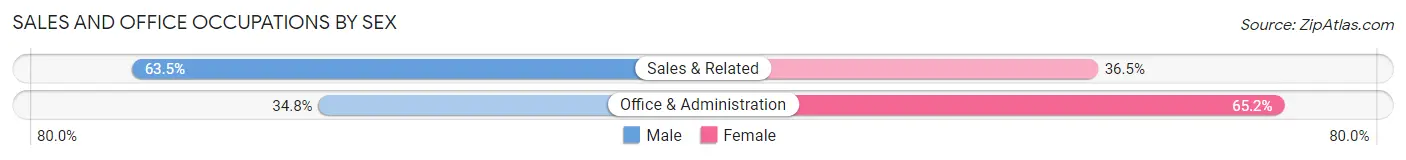
| Occupation | Male | Female |
| Sales & Related | 268 (63.5%) | 154 (36.5%) |
| Office & Administration | 71 (34.8%) | 133 (65.2%) |
| Total (Category) | 339 (54.1%) | 287 (45.9%) |
| Total (Overall) | 1,462 (56.1%) | 1,144 (43.9%) |
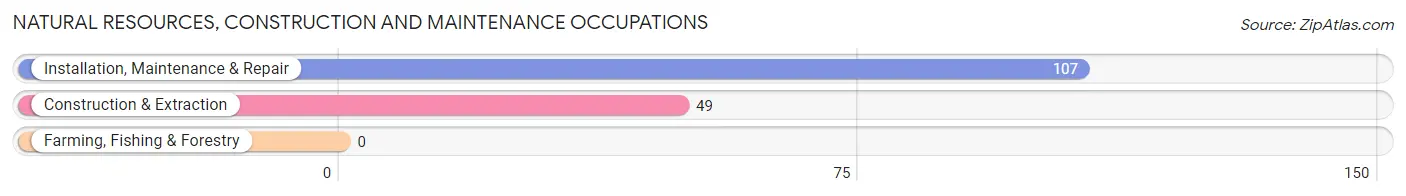
Natural Resources, Construction and Maintenance Occupations
The most common Natural Resources, Construction and Maintenance occupations in Ormond by the Sea are Installation, Maintenance & Repair (107 | 4.1%), and Construction & Extraction (49 | 1.9%).
Natural Resources, Construction and Maintenance Occupations by Sex
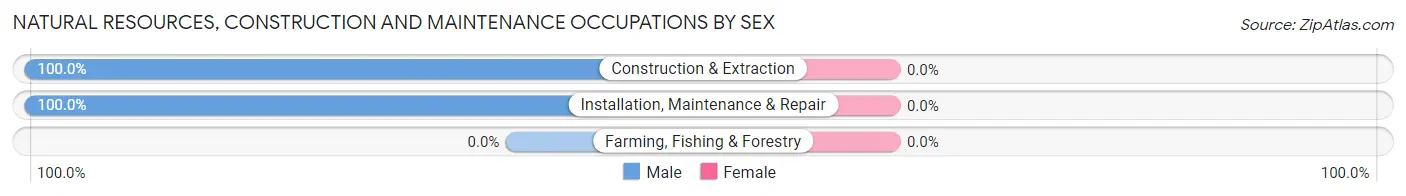
| Occupation | Male | Female |
| Farming, Fishing & Forestry | 0 (0.0%) | 0 (0.0%) |
| Construction & Extraction | 49 (100.0%) | 0 (0.0%) |
| Installation, Maintenance & Repair | 107 (100.0%) | 0 (0.0%) |
| Total (Category) | 156 (100.0%) | 0 (0.0%) |
| Total (Overall) | 1,462 (56.1%) | 1,144 (43.9%) |
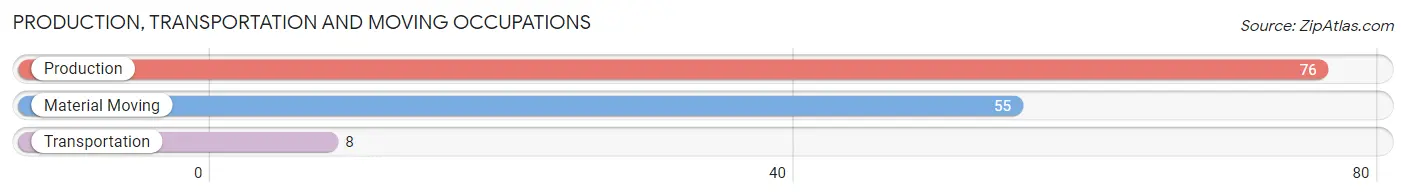
Production, Transportation and Moving Occupations
The most common Production, Transportation and Moving occupations in Ormond by the Sea are Production (76 | 2.9%), Material Moving (55 | 2.1%), and Transportation (8 | 0.3%).
Production, Transportation and Moving Occupations by Sex
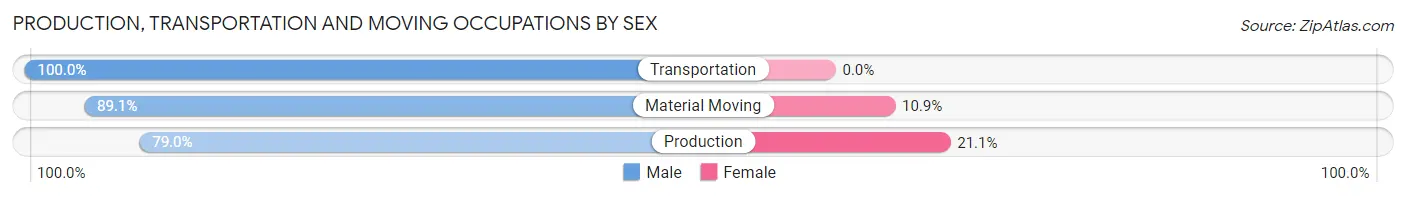
| Occupation | Male | Female |
| Production | 60 (78.9%) | 16 (21.0%) |
| Transportation | 8 (100.0%) | 0 (0.0%) |
| Material Moving | 49 (89.1%) | 6 (10.9%) |
| Total (Category) | 117 (84.2%) | 22 (15.8%) |
| Total (Overall) | 1,462 (56.1%) | 1,144 (43.9%) |
Employment Industries by Sex in Ormond by the Sea
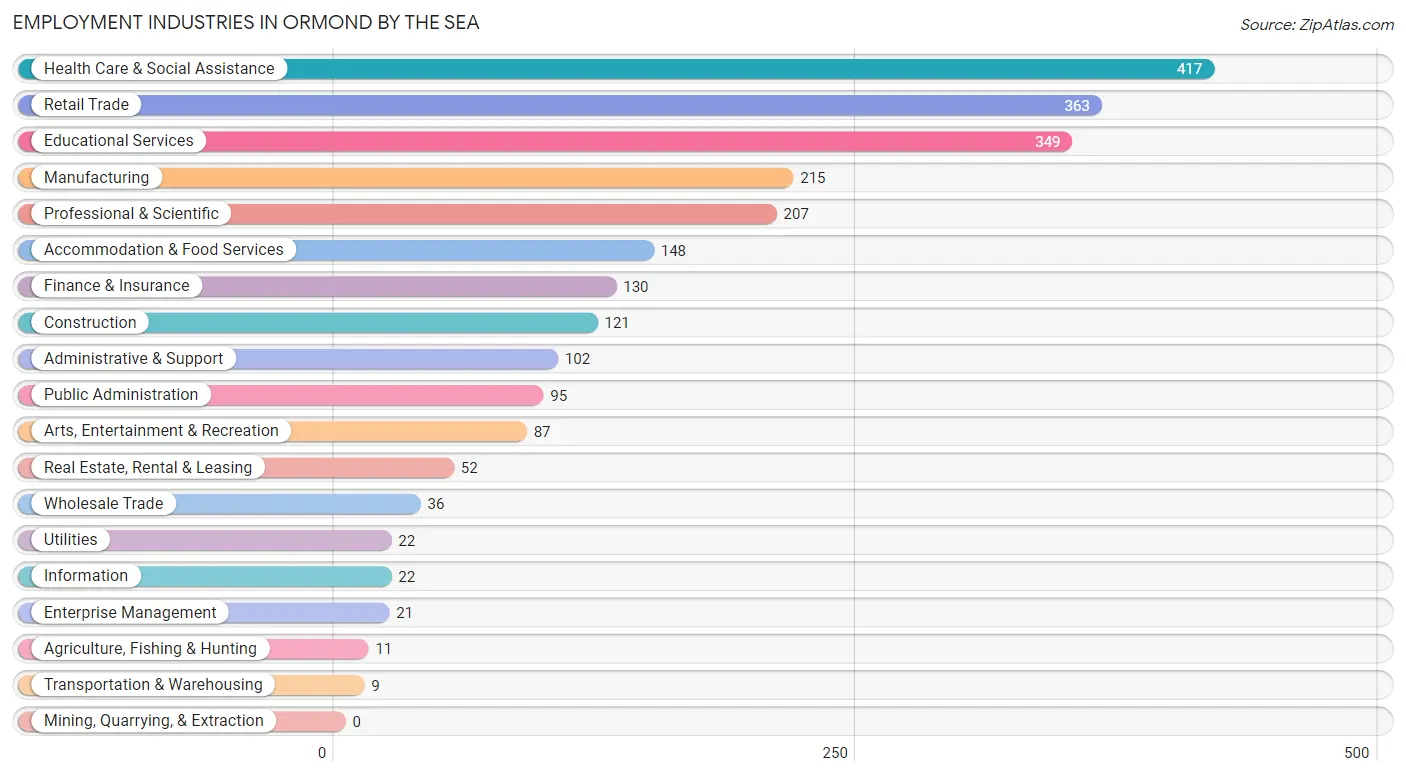
Employment Industries in Ormond by the Sea
The major employment industries in Ormond by the Sea include Health Care & Social Assistance (417 | 16.0%), Retail Trade (363 | 13.9%), Educational Services (349 | 13.4%), Manufacturing (215 | 8.3%), and Professional & Scientific (207 | 7.9%).
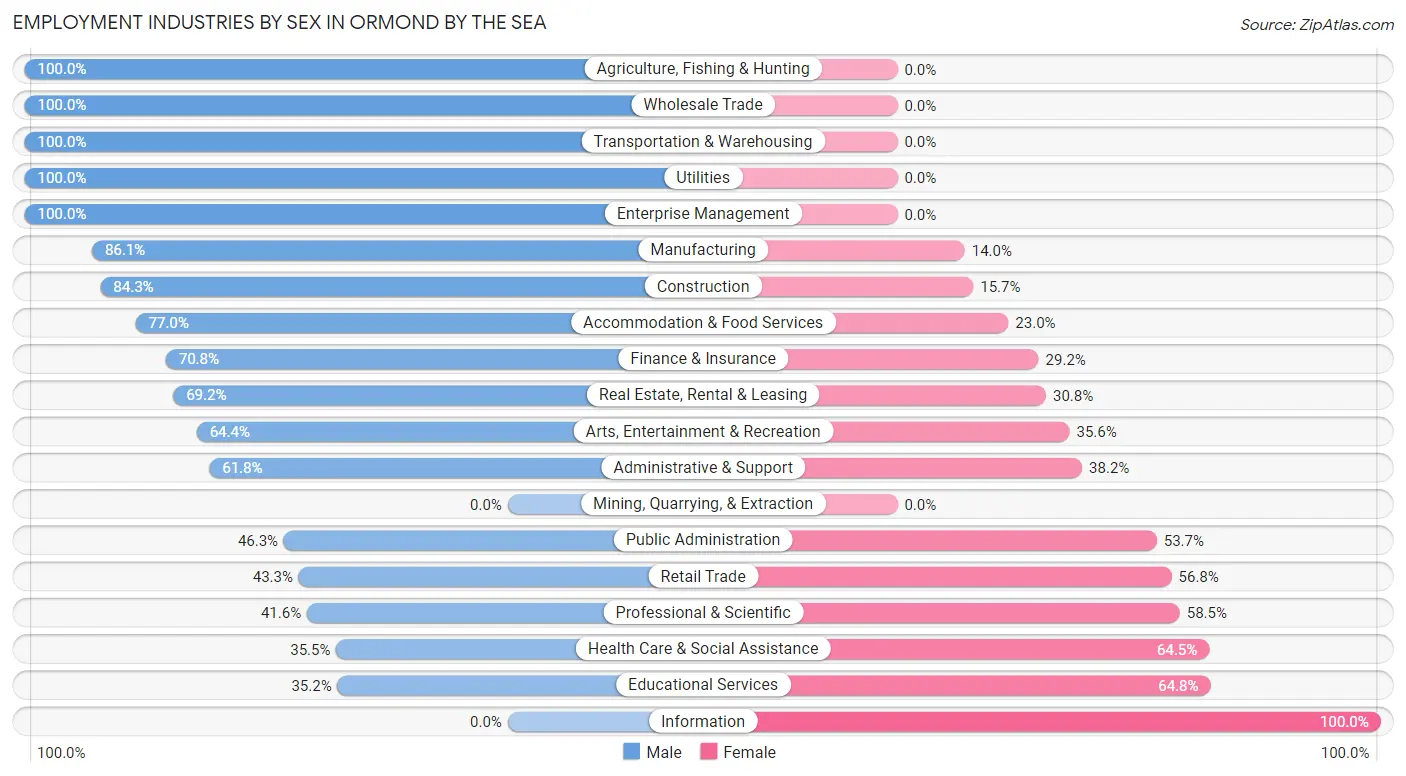
Employment Industries by Sex in Ormond by the Sea
The Ormond by the Sea industries that see more men than women are Agriculture, Fishing & Hunting (100.0%), Wholesale Trade (100.0%), and Transportation & Warehousing (100.0%), whereas the industries that tend to have a higher number of women are Information (100.0%), Educational Services (64.8%), and Health Care & Social Assistance (64.5%).
| Industry | Male | Female |
| Agriculture, Fishing & Hunting | 11 (100.0%) | 0 (0.0%) |
| Mining, Quarrying, & Extraction | 0 (0.0%) | 0 (0.0%) |
| Construction | 102 (84.3%) | 19 (15.7%) |
| Manufacturing | 185 (86.1%) | 30 (14.0%) |
| Wholesale Trade | 36 (100.0%) | 0 (0.0%) |
| Retail Trade | 157 (43.2%) | 206 (56.8%) |
| Transportation & Warehousing | 9 (100.0%) | 0 (0.0%) |
| Utilities | 22 (100.0%) | 0 (0.0%) |
| Information | 0 (0.0%) | 22 (100.0%) |
| Finance & Insurance | 92 (70.8%) | 38 (29.2%) |
| Real Estate, Rental & Leasing | 36 (69.2%) | 16 (30.8%) |
| Professional & Scientific | 86 (41.5%) | 121 (58.5%) |
| Enterprise Management | 21 (100.0%) | 0 (0.0%) |
| Administrative & Support | 63 (61.8%) | 39 (38.2%) |
| Educational Services | 123 (35.2%) | 226 (64.8%) |
| Health Care & Social Assistance | 148 (35.5%) | 269 (64.5%) |
| Arts, Entertainment & Recreation | 56 (64.4%) | 31 (35.6%) |
| Accommodation & Food Services | 114 (77.0%) | 34 (23.0%) |
| Public Administration | 44 (46.3%) | 51 (53.7%) |
| Total | 1,462 (56.1%) | 1,144 (43.9%) |
Education in Ormond by the Sea
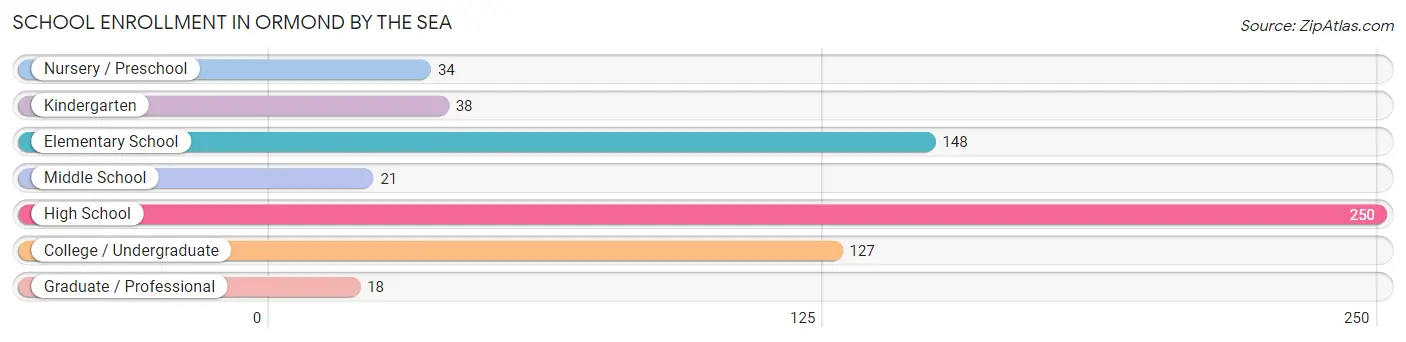
School Enrollment in Ormond by the Sea
The most common levels of schooling among the 636 students in Ormond by the Sea are high school (250 | 39.3%), elementary school (148 | 23.3%), and college / undergraduate (127 | 20.0%).
| School Level | # Students | % Students |
| Nursery / Preschool | 34 | 5.3% |
| Kindergarten | 38 | 6.0% |
| Elementary School | 148 | 23.3% |
| Middle School | 21 | 3.3% |
| High School | 250 | 39.3% |
| College / Undergraduate | 127 | 20.0% |
| Graduate / Professional | 18 | 2.8% |
| Total | 636 | 100.0% |
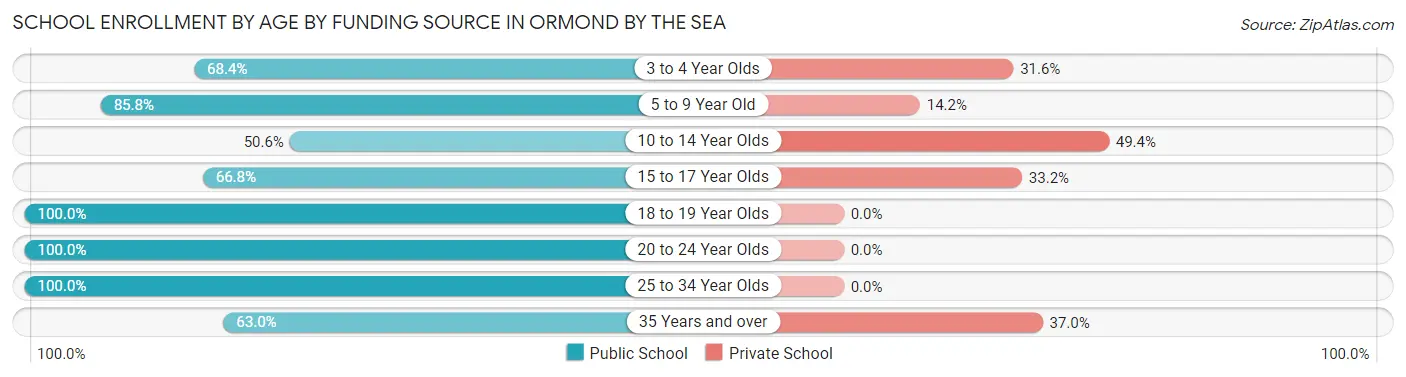
School Enrollment by Age by Funding Source in Ormond by the Sea
Out of a total of 636 students who are enrolled in schools in Ormond by the Sea, 156 (24.5%) attend a private institution, while the remaining 480 (75.5%) are enrolled in public schools. The age group of 10 to 14 year olds has the highest likelihood of being enrolled in private schools, with 40 (49.4% in the age bracket) enrolled. Conversely, the age group of 18 to 19 year olds has the lowest likelihood of being enrolled in a private school, with 47 (100.0% in the age bracket) attending a public institution.
| Age Bracket | Public School | Private School |
| 3 to 4 Year Olds | 13 (68.4%) | 6 (31.6%) |
| 5 to 9 Year Old | 121 (85.8%) | 20 (14.2%) |
| 10 to 14 Year Olds | 41 (50.6%) | 40 (49.4%) |
| 15 to 17 Year Olds | 161 (66.8%) | 80 (33.2%) |
| 18 to 19 Year Olds | 47 (100.0%) | 0 (0.0%) |
| 20 to 24 Year Olds | 74 (100.0%) | 0 (0.0%) |
| 25 to 34 Year Olds | 6 (100.0%) | 0 (0.0%) |
| 35 Years and over | 17 (63.0%) | 10 (37.0%) |
| Total | 480 (75.5%) | 156 (24.5%) |
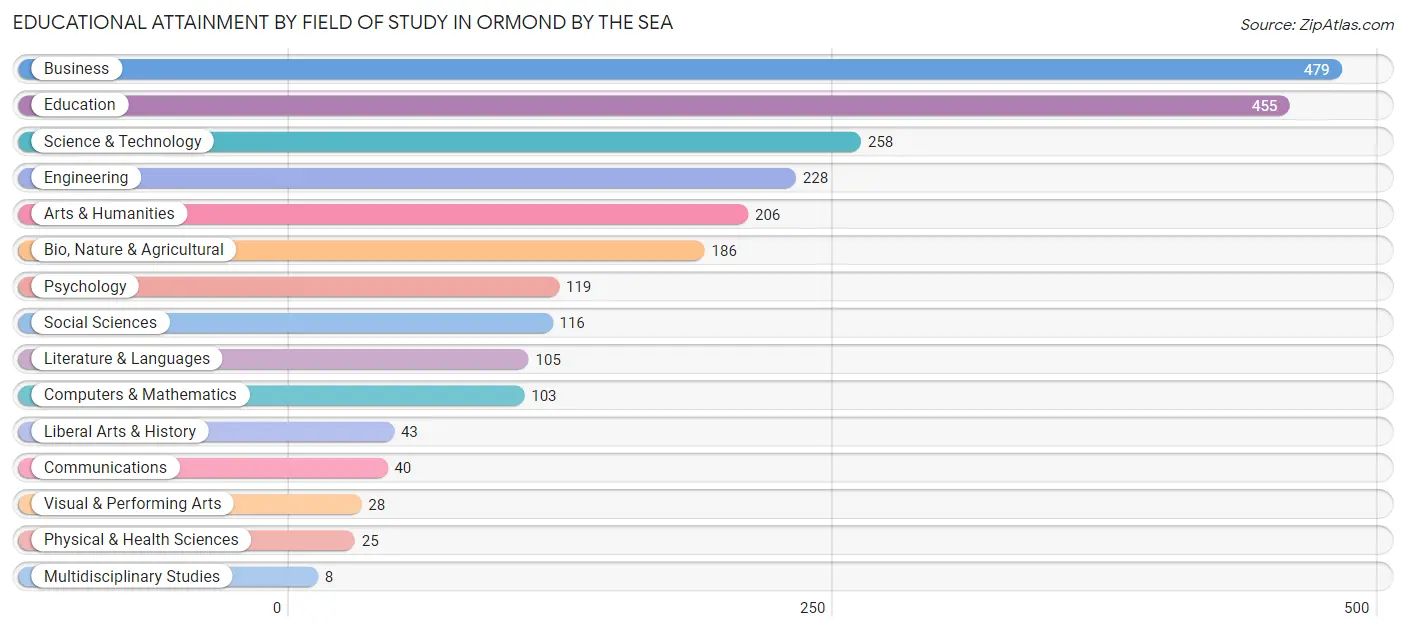
Educational Attainment by Field of Study in Ormond by the Sea
Business (479 | 20.0%), education (455 | 19.0%), science & technology (258 | 10.7%), engineering (228 | 9.5%), and arts & humanities (206 | 8.6%) are the most common fields of study among 2,399 individuals in Ormond by the Sea who have obtained a bachelor's degree or higher.
| Field of Study | # Graduates | % Graduates |
| Computers & Mathematics | 103 | 4.3% |
| Bio, Nature & Agricultural | 186 | 7.7% |
| Physical & Health Sciences | 25 | 1.0% |
| Psychology | 119 | 5.0% |
| Social Sciences | 116 | 4.8% |
| Engineering | 228 | 9.5% |
| Multidisciplinary Studies | 8 | 0.3% |
| Science & Technology | 258 | 10.7% |
| Business | 479 | 20.0% |
| Education | 455 | 19.0% |
| Literature & Languages | 105 | 4.4% |
| Liberal Arts & History | 43 | 1.8% |
| Visual & Performing Arts | 28 | 1.2% |
| Communications | 40 | 1.7% |
| Arts & Humanities | 206 | 8.6% |
| Total | 2,399 | 100.0% |
Transportation & Commute in Ormond by the Sea
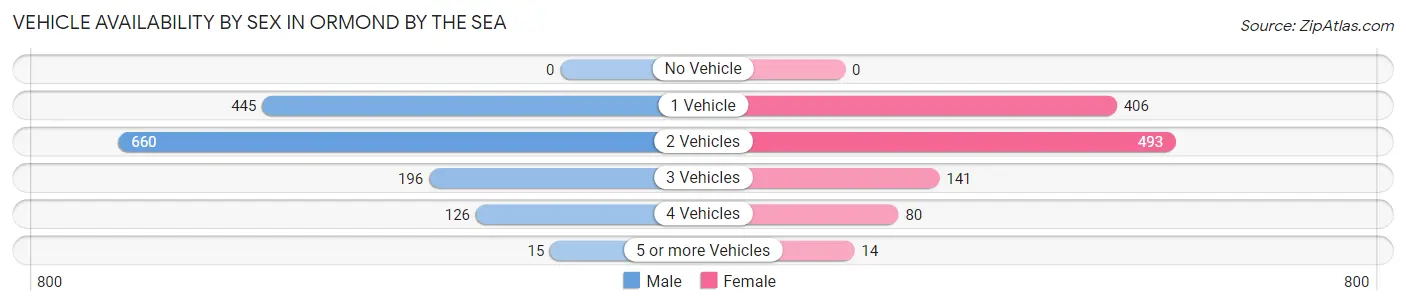
Vehicle Availability by Sex in Ormond by the Sea
The most prevalent vehicle ownership categories in Ormond by the Sea are males with 2 vehicles (660, accounting for 45.8%) and females with 2 vehicles (493, making up 58.2%).
| Vehicles Available | Male | Female |
| No Vehicle | 0 (0.0%) | 0 (0.0%) |
| 1 Vehicle | 445 (30.9%) | 406 (35.8%) |
| 2 Vehicles | 660 (45.8%) | 493 (43.5%) |
| 3 Vehicles | 196 (13.6%) | 141 (12.4%) |
| 4 Vehicles | 126 (8.7%) | 80 (7.0%) |
| 5 or more Vehicles | 15 (1.0%) | 14 (1.2%) |
| Total | 1,442 (100.0%) | 1,134 (100.0%) |
Commute Time in Ormond by the Sea
The most frequently occuring commute durations in Ormond by the Sea are 20 to 24 minutes (434 commuters, 22.3%), 30 to 34 minutes (362 commuters, 18.6%), and 15 to 19 minutes (264 commuters, 13.6%).
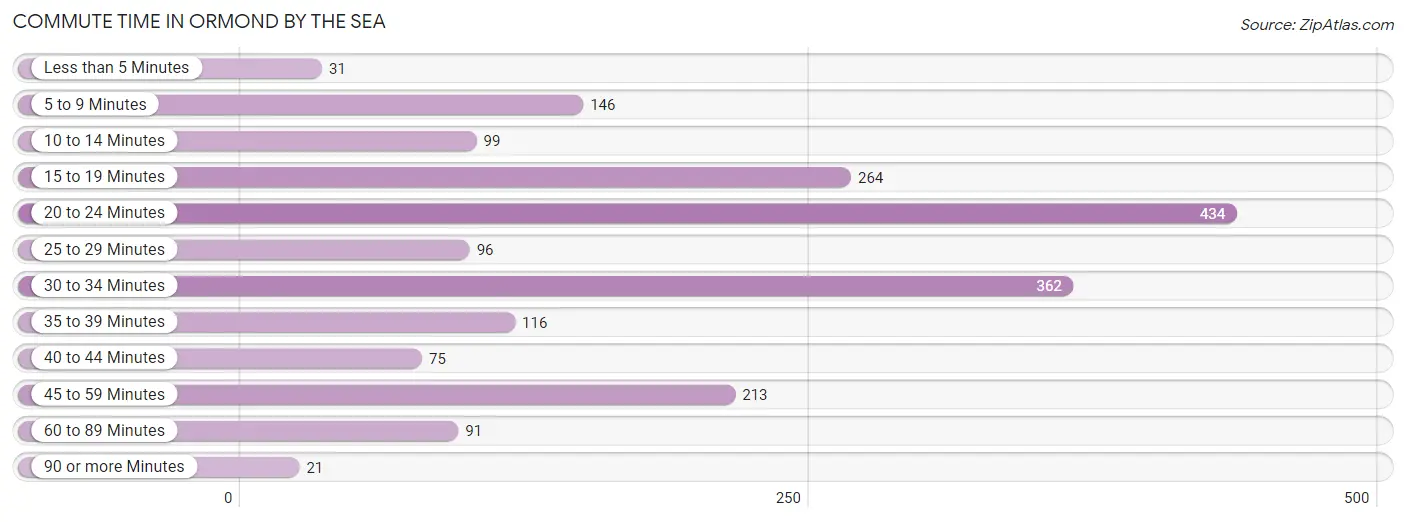
| Commute Time | # Commuters | % Commuters |
| Less than 5 Minutes | 31 | 1.6% |
| 5 to 9 Minutes | 146 | 7.5% |
| 10 to 14 Minutes | 99 | 5.1% |
| 15 to 19 Minutes | 264 | 13.6% |
| 20 to 24 Minutes | 434 | 22.3% |
| 25 to 29 Minutes | 96 | 4.9% |
| 30 to 34 Minutes | 362 | 18.6% |
| 35 to 39 Minutes | 116 | 5.9% |
| 40 to 44 Minutes | 75 | 3.8% |
| 45 to 59 Minutes | 213 | 10.9% |
| 60 to 89 Minutes | 91 | 4.7% |
| 90 or more Minutes | 21 | 1.1% |
Commute Time by Sex in Ormond by the Sea
The most common commute times in Ormond by the Sea are 20 to 24 minutes (259 commuters, 23.2%) for males and 30 to 34 minutes (214 commuters, 25.8%) for females.
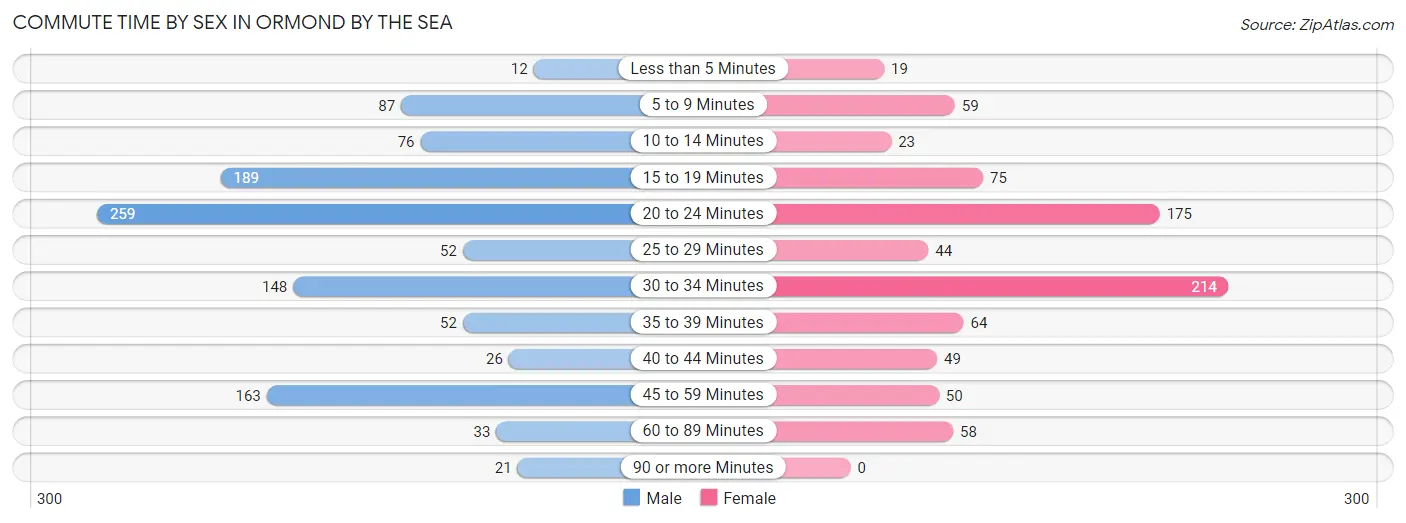
| Commute Time | Male | Female |
| Less than 5 Minutes | 12 (1.1%) | 19 (2.3%) |
| 5 to 9 Minutes | 87 (7.8%) | 59 (7.1%) |
| 10 to 14 Minutes | 76 (6.8%) | 23 (2.8%) |
| 15 to 19 Minutes | 189 (16.9%) | 75 (9.0%) |
| 20 to 24 Minutes | 259 (23.2%) | 175 (21.1%) |
| 25 to 29 Minutes | 52 (4.6%) | 44 (5.3%) |
| 30 to 34 Minutes | 148 (13.2%) | 214 (25.8%) |
| 35 to 39 Minutes | 52 (4.6%) | 64 (7.7%) |
| 40 to 44 Minutes | 26 (2.3%) | 49 (5.9%) |
| 45 to 59 Minutes | 163 (14.6%) | 50 (6.0%) |
| 60 to 89 Minutes | 33 (2.9%) | 58 (7.0%) |
| 90 or more Minutes | 21 (1.9%) | 0 (0.0%) |
Time of Departure to Work by Sex in Ormond by the Sea
The most frequent times of departure to work in Ormond by the Sea are 7:00 AM to 7:29 AM (208, 18.6%) for males and 9:00 AM to 9:59 AM (197, 23.7%) for females.
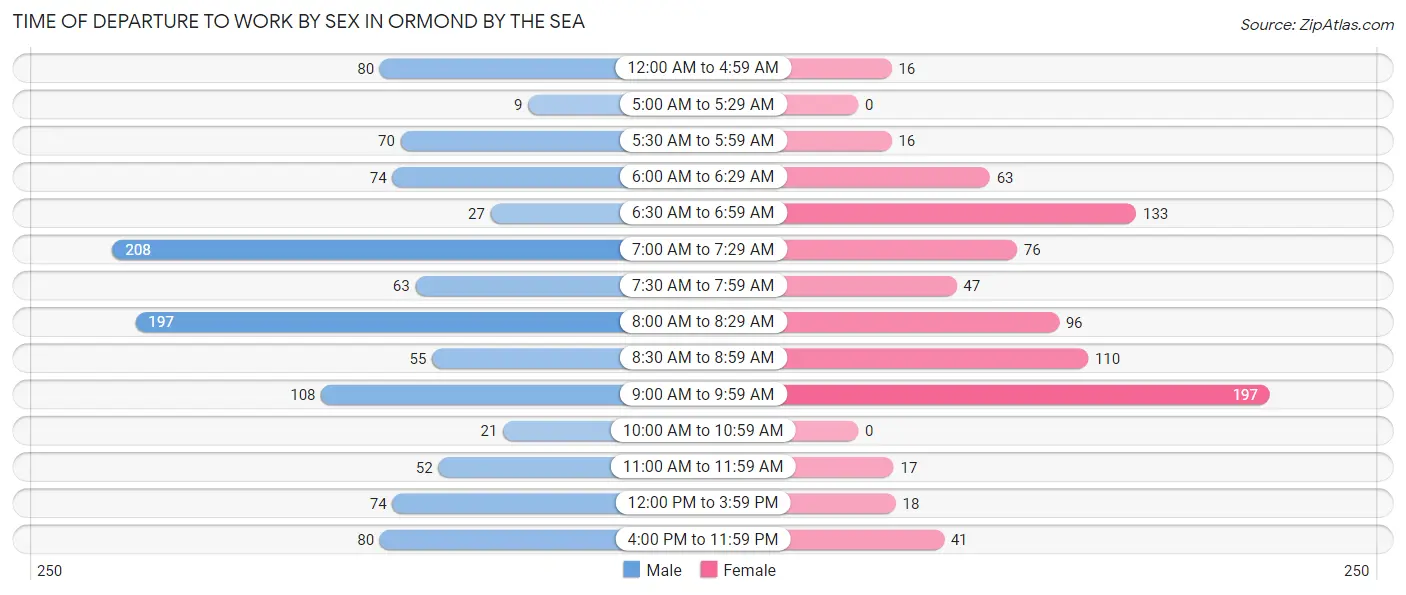
| Time of Departure | Male | Female |
| 12:00 AM to 4:59 AM | 80 (7.2%) | 16 (1.9%) |
| 5:00 AM to 5:29 AM | 9 (0.8%) | 0 (0.0%) |
| 5:30 AM to 5:59 AM | 70 (6.3%) | 16 (1.9%) |
| 6:00 AM to 6:29 AM | 74 (6.6%) | 63 (7.6%) |
| 6:30 AM to 6:59 AM | 27 (2.4%) | 133 (16.0%) |
| 7:00 AM to 7:29 AM | 208 (18.6%) | 76 (9.2%) |
| 7:30 AM to 7:59 AM | 63 (5.6%) | 47 (5.7%) |
| 8:00 AM to 8:29 AM | 197 (17.6%) | 96 (11.6%) |
| 8:30 AM to 8:59 AM | 55 (4.9%) | 110 (13.3%) |
| 9:00 AM to 9:59 AM | 108 (9.7%) | 197 (23.7%) |
| 10:00 AM to 10:59 AM | 21 (1.9%) | 0 (0.0%) |
| 11:00 AM to 11:59 AM | 52 (4.6%) | 17 (2.1%) |
| 12:00 PM to 3:59 PM | 74 (6.6%) | 18 (2.2%) |
| 4:00 PM to 11:59 PM | 80 (7.2%) | 41 (4.9%) |
| Total | 1,118 (100.0%) | 830 (100.0%) |
Housing Occupancy in Ormond by the Sea
Occupancy by Ownership in Ormond by the Sea
Of the total 3,626 dwellings in Ormond by the Sea, owner-occupied units account for 3,010 (83.0%), while renter-occupied units make up 616 (17.0%).
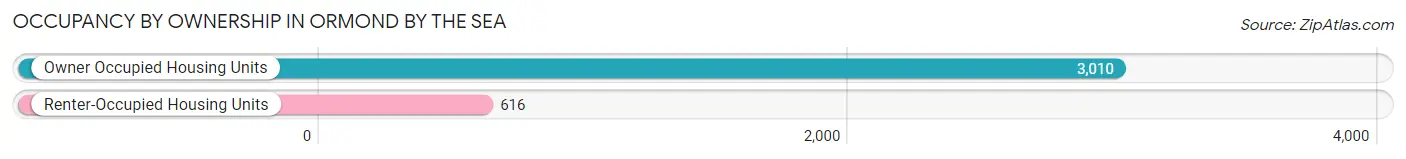
| Occupancy | # Housing Units | % Housing Units |
| Owner Occupied Housing Units | 3,010 | 83.0% |
| Renter-Occupied Housing Units | 616 | 17.0% |
| Total Occupied Housing Units | 3,626 | 100.0% |
Occupancy by Household Size in Ormond by the Sea
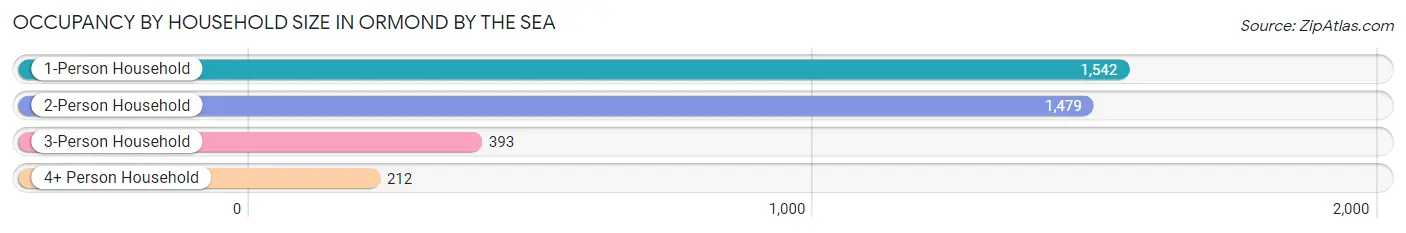
| Household Size | # Housing Units | % Housing Units |
| 1-Person Household | 1,542 | 42.5% |
| 2-Person Household | 1,479 | 40.8% |
| 3-Person Household | 393 | 10.8% |
| 4+ Person Household | 212 | 5.9% |
| Total Housing Units | 3,626 | 100.0% |
Occupancy by Ownership by Household Size in Ormond by the Sea
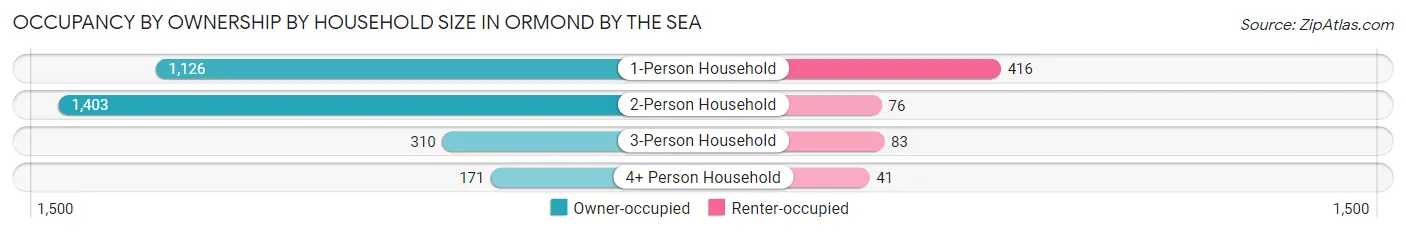
| Household Size | Owner-occupied | Renter-occupied |
| 1-Person Household | 1,126 (73.0%) | 416 (27.0%) |
| 2-Person Household | 1,403 (94.9%) | 76 (5.1%) |
| 3-Person Household | 310 (78.9%) | 83 (21.1%) |
| 4+ Person Household | 171 (80.7%) | 41 (19.3%) |
| Total Housing Units | 3,010 (83.0%) | 616 (17.0%) |
Occupancy by Educational Attainment in Ormond by the Sea
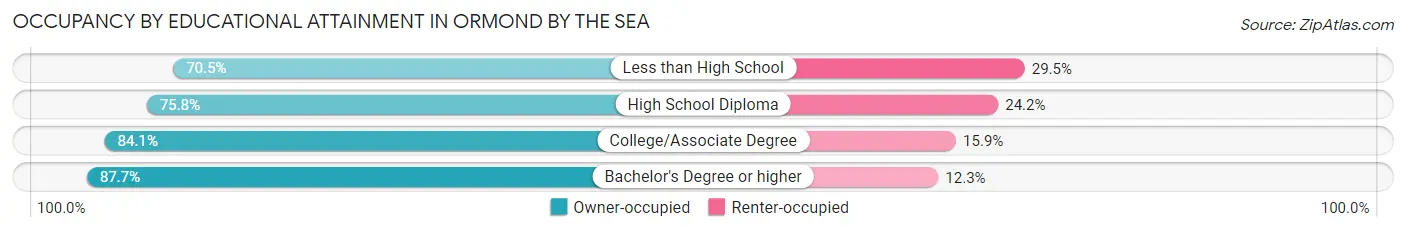
| Household Size | Owner-occupied | Renter-occupied |
| Less than High School | 67 (70.5%) | 28 (29.5%) |
| High School Diploma | 682 (75.8%) | 218 (24.2%) |
| College/Associate Degree | 1,082 (84.1%) | 204 (15.9%) |
| Bachelor's Degree or higher | 1,179 (87.7%) | 166 (12.3%) |
Occupancy by Age of Householder in Ormond by the Sea
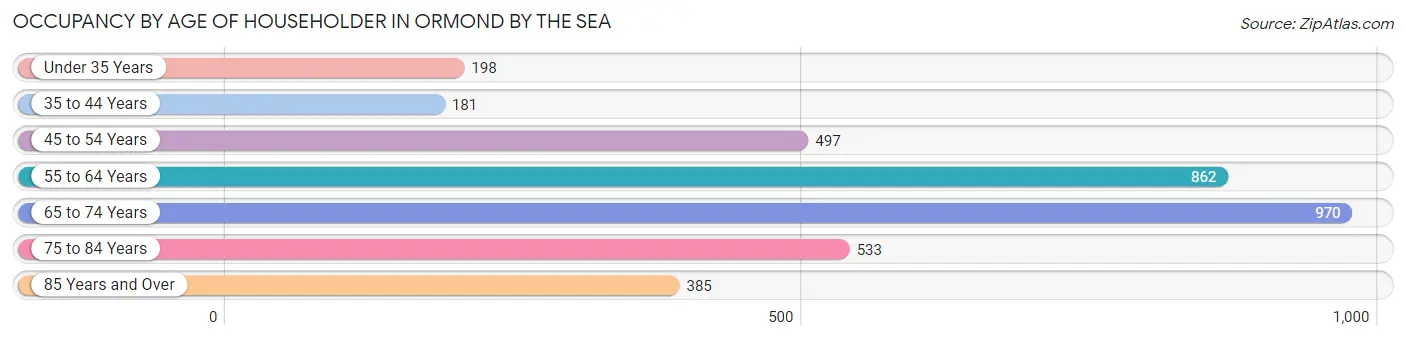
| Age Bracket | # Households | % Households |
| Under 35 Years | 198 | 5.5% |
| 35 to 44 Years | 181 | 5.0% |
| 45 to 54 Years | 497 | 13.7% |
| 55 to 64 Years | 862 | 23.8% |
| 65 to 74 Years | 970 | 26.8% |
| 75 to 84 Years | 533 | 14.7% |
| 85 Years and Over | 385 | 10.6% |
| Total | 3,626 | 100.0% |
Housing Finances in Ormond by the Sea
Median Income by Occupancy in Ormond by the Sea
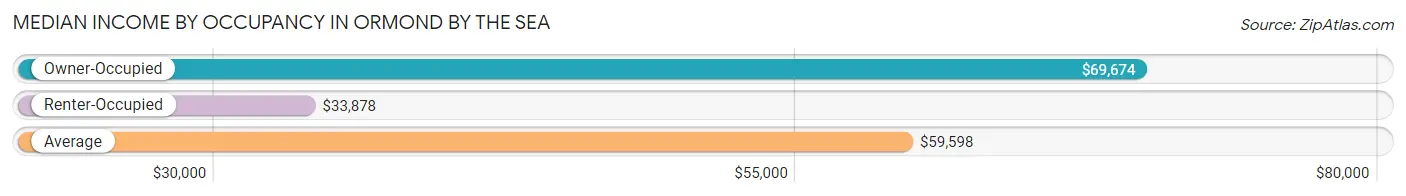
| Occupancy Type | # Households | Median Income |
| Owner-Occupied | 3,010 (83.0%) | $69,674 |
| Renter-Occupied | 616 (17.0%) | $33,878 |
| Average | 3,626 (100.0%) | $59,598 |
Occupancy by Householder Income Bracket in Ormond by the Sea
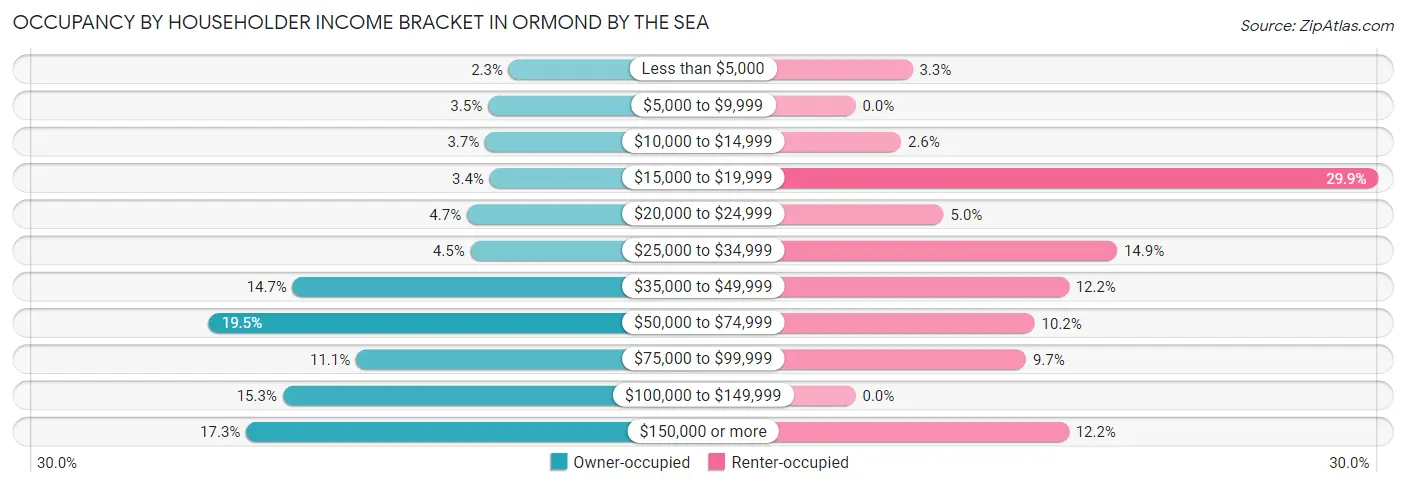
| Income Bracket | Owner-occupied | Renter-occupied |
| Less than $5,000 | 70 (2.3%) | 20 (3.3%) |
| $5,000 to $9,999 | 106 (3.5%) | 0 (0.0%) |
| $10,000 to $14,999 | 111 (3.7%) | 16 (2.6%) |
| $15,000 to $19,999 | 103 (3.4%) | 184 (29.9%) |
| $20,000 to $24,999 | 142 (4.7%) | 31 (5.0%) |
| $25,000 to $34,999 | 136 (4.5%) | 92 (14.9%) |
| $35,000 to $49,999 | 442 (14.7%) | 75 (12.2%) |
| $50,000 to $74,999 | 586 (19.5%) | 63 (10.2%) |
| $75,000 to $99,999 | 333 (11.1%) | 60 (9.7%) |
| $100,000 to $149,999 | 459 (15.2%) | 0 (0.0%) |
| $150,000 or more | 522 (17.3%) | 75 (12.2%) |
| Total | 3,010 (100.0%) | 616 (100.0%) |
Monthly Housing Cost Tiers in Ormond by the Sea
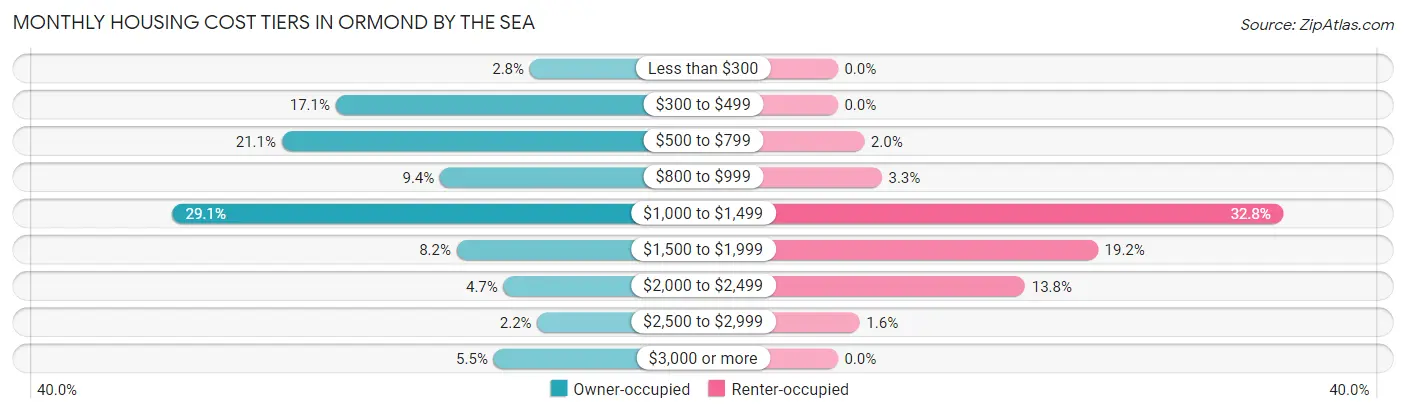
| Monthly Cost | Owner-occupied | Renter-occupied |
| Less than $300 | 84 (2.8%) | 0 (0.0%) |
| $300 to $499 | 514 (17.1%) | 0 (0.0%) |
| $500 to $799 | 634 (21.1%) | 12 (1.9%) |
| $800 to $999 | 283 (9.4%) | 20 (3.3%) |
| $1,000 to $1,499 | 876 (29.1%) | 202 (32.8%) |
| $1,500 to $1,999 | 246 (8.2%) | 118 (19.2%) |
| $2,000 to $2,499 | 142 (4.7%) | 85 (13.8%) |
| $2,500 to $2,999 | 67 (2.2%) | 10 (1.6%) |
| $3,000 or more | 164 (5.4%) | 0 (0.0%) |
| Total | 3,010 (100.0%) | 616 (100.0%) |
Physical Housing Characteristics in Ormond by the Sea
Housing Structures in Ormond by the Sea
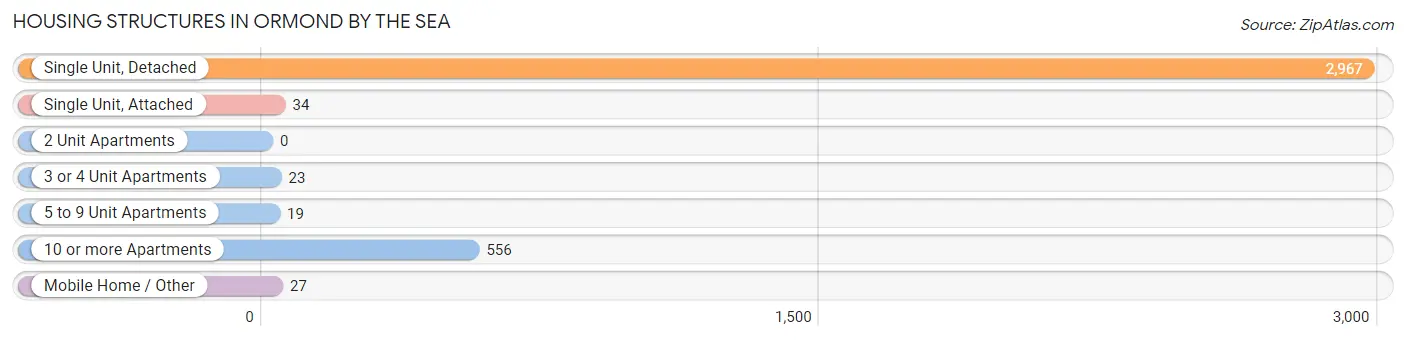
| Structure Type | # Housing Units | % Housing Units |
| Single Unit, Detached | 2,967 | 81.8% |
| Single Unit, Attached | 34 | 0.9% |
| 2 Unit Apartments | 0 | 0.0% |
| 3 or 4 Unit Apartments | 23 | 0.6% |
| 5 to 9 Unit Apartments | 19 | 0.5% |
| 10 or more Apartments | 556 | 15.3% |
| Mobile Home / Other | 27 | 0.7% |
| Total | 3,626 | 100.0% |
Housing Structures by Occupancy in Ormond by the Sea
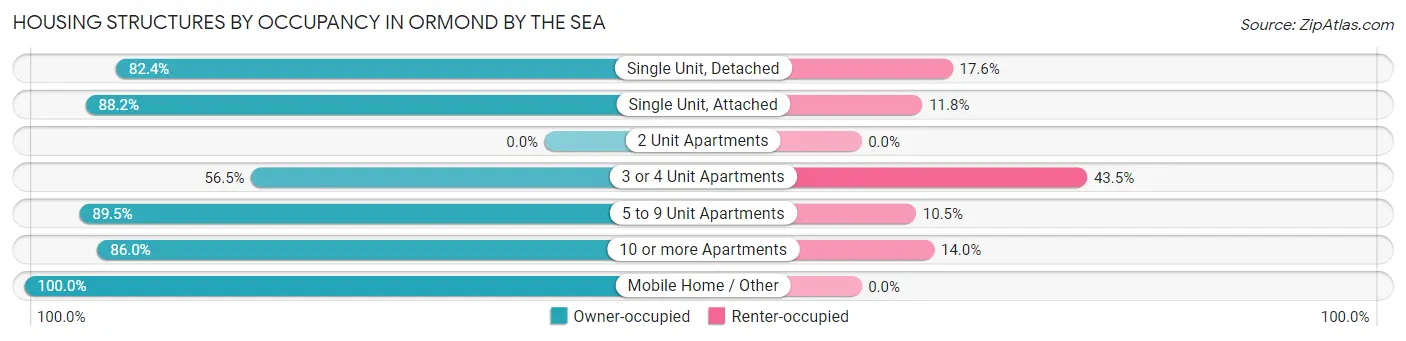
| Structure Type | Owner-occupied | Renter-occupied |
| Single Unit, Detached | 2,445 (82.4%) | 522 (17.6%) |
| Single Unit, Attached | 30 (88.2%) | 4 (11.8%) |
| 2 Unit Apartments | 0 (0.0%) | 0 (0.0%) |
| 3 or 4 Unit Apartments | 13 (56.5%) | 10 (43.5%) |
| 5 to 9 Unit Apartments | 17 (89.5%) | 2 (10.5%) |
| 10 or more Apartments | 478 (86.0%) | 78 (14.0%) |
| Mobile Home / Other | 27 (100.0%) | 0 (0.0%) |
| Total | 3,010 (83.0%) | 616 (17.0%) |
Housing Structures by Number of Rooms in Ormond by the Sea
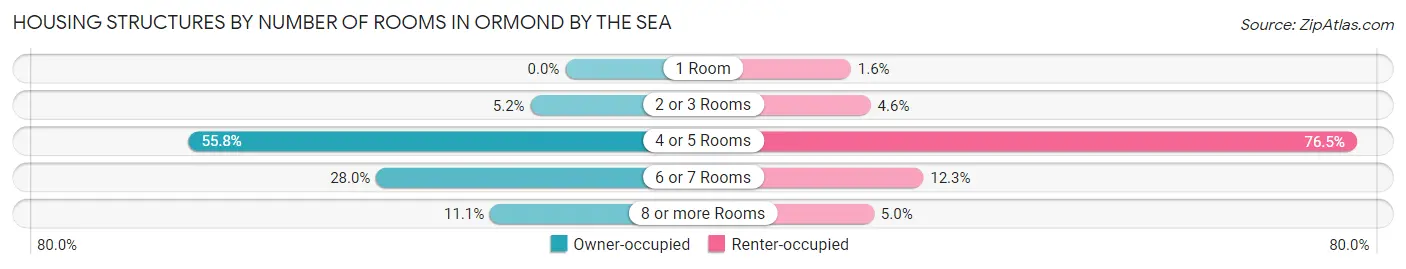
| Number of Rooms | Owner-occupied | Renter-occupied |
| 1 Room | 0 (0.0%) | 10 (1.6%) |
| 2 or 3 Rooms | 155 (5.1%) | 28 (4.5%) |
| 4 or 5 Rooms | 1,678 (55.7%) | 471 (76.5%) |
| 6 or 7 Rooms | 842 (28.0%) | 76 (12.3%) |
| 8 or more Rooms | 335 (11.1%) | 31 (5.0%) |
| Total | 3,010 (100.0%) | 616 (100.0%) |
Housing Structure by Heating Type in Ormond by the Sea
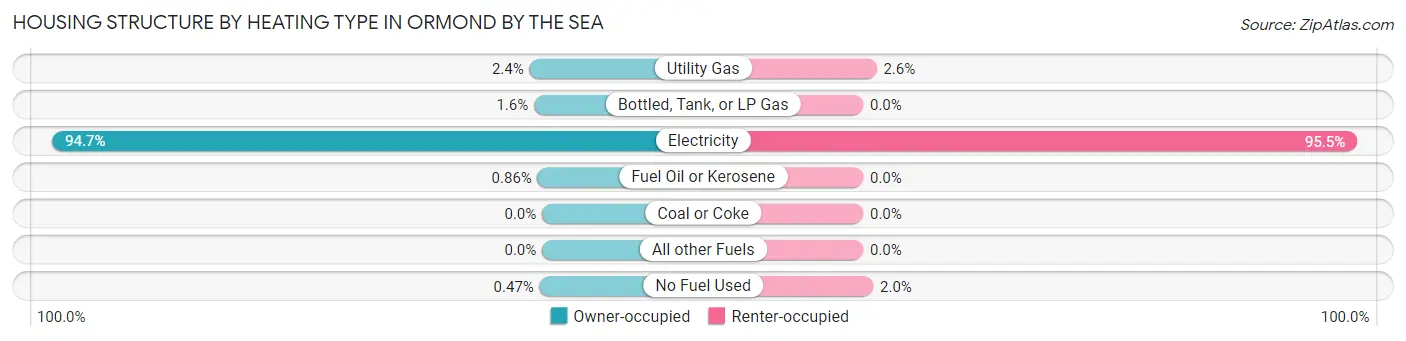
| Heating Type | Owner-occupied | Renter-occupied |
| Utility Gas | 73 (2.4%) | 16 (2.6%) |
| Bottled, Tank, or LP Gas | 47 (1.6%) | 0 (0.0%) |
| Electricity | 2,850 (94.7%) | 588 (95.5%) |
| Fuel Oil or Kerosene | 26 (0.9%) | 0 (0.0%) |
| Coal or Coke | 0 (0.0%) | 0 (0.0%) |
| All other Fuels | 0 (0.0%) | 0 (0.0%) |
| No Fuel Used | 14 (0.5%) | 12 (1.9%) |
| Total | 3,010 (100.0%) | 616 (100.0%) |
Household Vehicle Usage in Ormond by the Sea
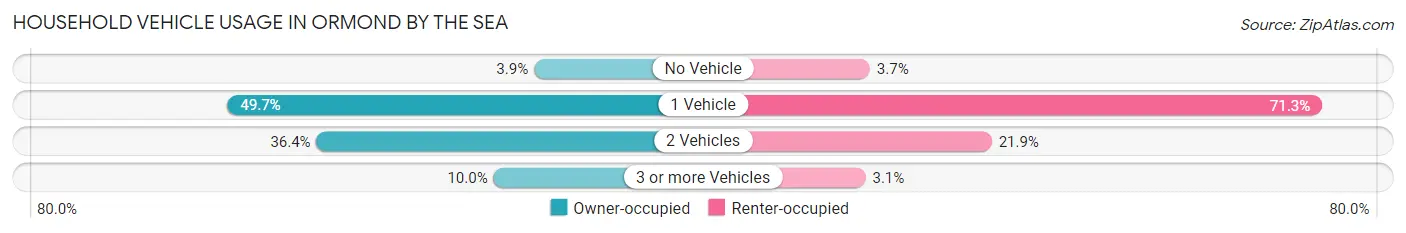
| Vehicles per Household | Owner-occupied | Renter-occupied |
| No Vehicle | 118 (3.9%) | 23 (3.7%) |
| 1 Vehicle | 1,496 (49.7%) | 439 (71.3%) |
| 2 Vehicles | 1,096 (36.4%) | 135 (21.9%) |
| 3 or more Vehicles | 300 (10.0%) | 19 (3.1%) |
| Total | 3,010 (100.0%) | 616 (100.0%) |
Real Estate & Mortgages in Ormond by the Sea
Real Estate and Mortgage Overview in Ormond by the Sea
| Characteristic | Without Mortgage | With Mortgage |
| Housing Units | 1,680 | 1,330 |
| Median Property Value | $325,100 | $295,200 |
| Median Household Income | $53,571 | $284 |
| Monthly Housing Costs | $611 | $142 |
| Real Estate Taxes | $2,843 | $30 |
Property Value by Mortgage Status in Ormond by the Sea
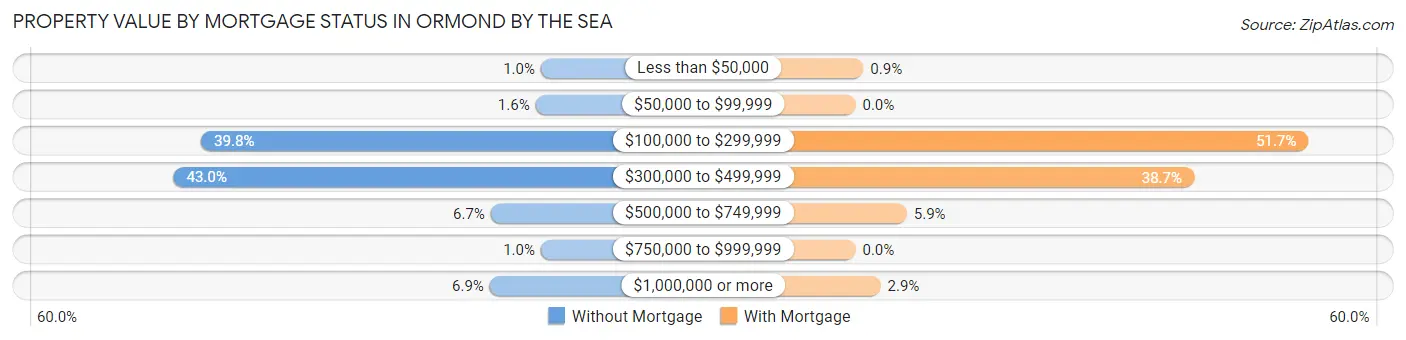
| Property Value | Without Mortgage | With Mortgage |
| Less than $50,000 | 17 (1.0%) | 12 (0.9%) |
| $50,000 to $99,999 | 27 (1.6%) | 0 (0.0%) |
| $100,000 to $299,999 | 669 (39.8%) | 688 (51.7%) |
| $300,000 to $499,999 | 722 (43.0%) | 514 (38.7%) |
| $500,000 to $749,999 | 113 (6.7%) | 78 (5.9%) |
| $750,000 to $999,999 | 17 (1.0%) | 0 (0.0%) |
| $1,000,000 or more | 115 (6.9%) | 38 (2.9%) |
| Total | 1,680 (100.0%) | 1,330 (100.0%) |
Household Income by Mortgage Status in Ormond by the Sea
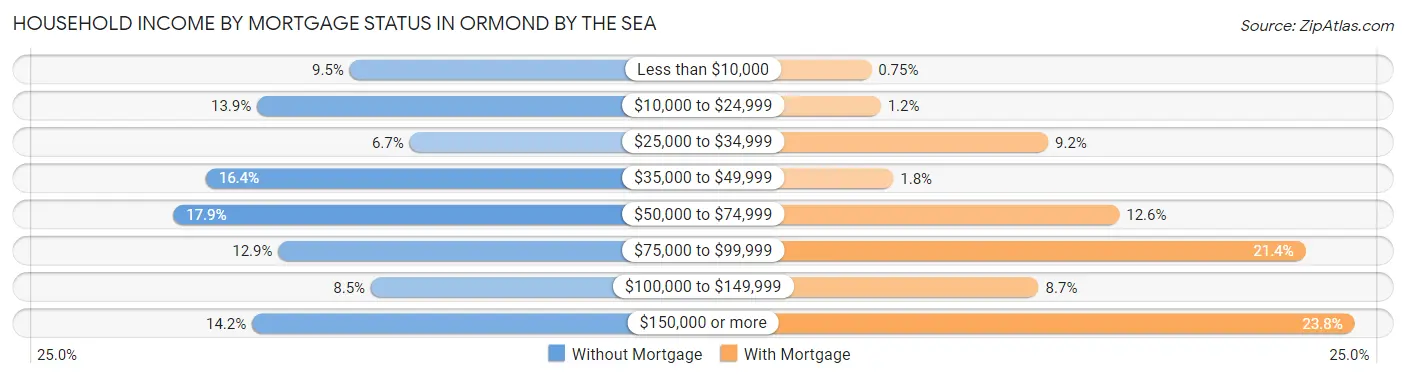
| Household Income | Without Mortgage | With Mortgage |
| Less than $10,000 | 160 (9.5%) | 10 (0.7%) |
| $10,000 to $24,999 | 234 (13.9%) | 16 (1.2%) |
| $25,000 to $34,999 | 112 (6.7%) | 122 (9.2%) |
| $35,000 to $49,999 | 275 (16.4%) | 24 (1.8%) |
| $50,000 to $74,999 | 301 (17.9%) | 167 (12.6%) |
| $75,000 to $99,999 | 217 (12.9%) | 285 (21.4%) |
| $100,000 to $149,999 | 143 (8.5%) | 116 (8.7%) |
| $150,000 or more | 238 (14.2%) | 316 (23.8%) |
| Total | 1,680 (100.0%) | 1,330 (100.0%) |
Property Value to Household Income Ratio in Ormond by the Sea
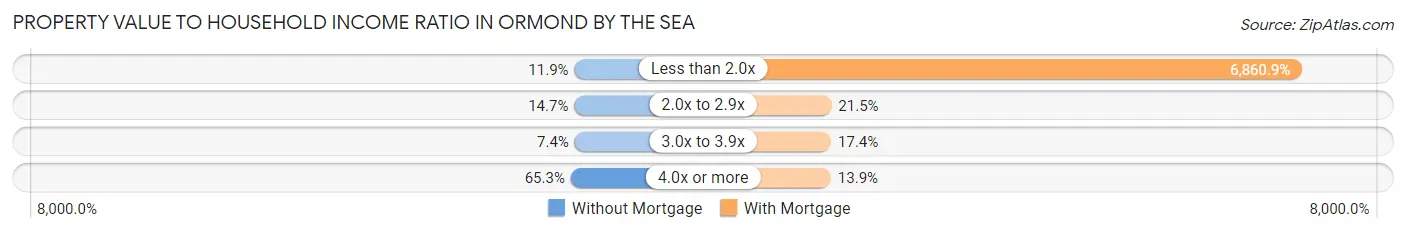
| Value-to-Income Ratio | Without Mortgage | With Mortgage |
| Less than 2.0x | 199 (11.8%) | 91,250 (6,860.9%) |
| 2.0x to 2.9x | 247 (14.7%) | 286 (21.5%) |
| 3.0x to 3.9x | 125 (7.4%) | 231 (17.4%) |
| 4.0x or more | 1,097 (65.3%) | 185 (13.9%) |
| Total | 1,680 (100.0%) | 1,330 (100.0%) |
Real Estate Taxes by Mortgage Status in Ormond by the Sea
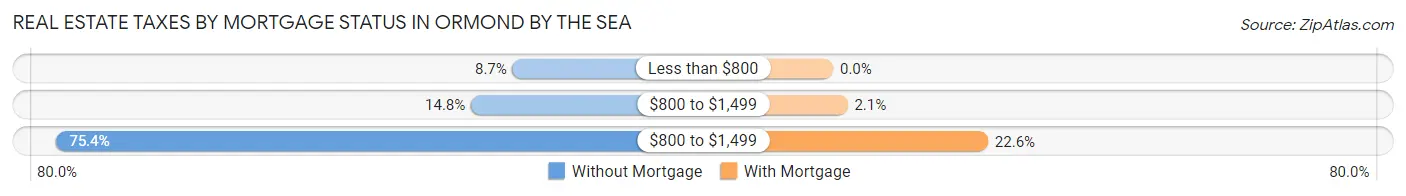
| Property Taxes | Without Mortgage | With Mortgage |
| Less than $800 | 146 (8.7%) | 0 (0.0%) |
| $800 to $1,499 | 248 (14.8%) | 28 (2.1%) |
| $800 to $1,499 | 1,266 (75.4%) | 301 (22.6%) |
| Total | 1,680 (100.0%) | 1,330 (100.0%) |
Health & Disability in Ormond by the Sea
Health Insurance Coverage by Age in Ormond by the Sea
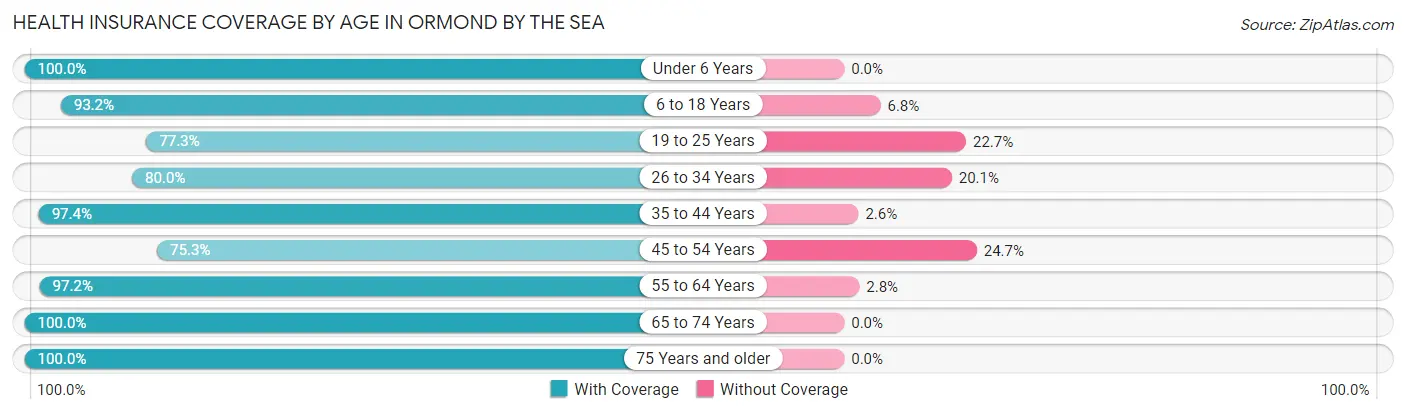
| Age Bracket | With Coverage | Without Coverage |
| Under 6 Years | 105 (100.0%) | 0 (0.0%) |
| 6 to 18 Years | 469 (93.2%) | 34 (6.8%) |
| 19 to 25 Years | 211 (77.3%) | 62 (22.7%) |
| 26 to 34 Years | 323 (79.9%) | 81 (20.1%) |
| 35 to 44 Years | 332 (97.4%) | 9 (2.6%) |
| 45 to 54 Years | 594 (75.3%) | 195 (24.7%) |
| 55 to 64 Years | 1,523 (97.2%) | 44 (2.8%) |
| 65 to 74 Years | 1,468 (100.0%) | 0 (0.0%) |
| 75 Years and older | 1,218 (100.0%) | 0 (0.0%) |
| Total | 6,243 (93.6%) | 425 (6.4%) |
Health Insurance Coverage by Citizenship Status in Ormond by the Sea
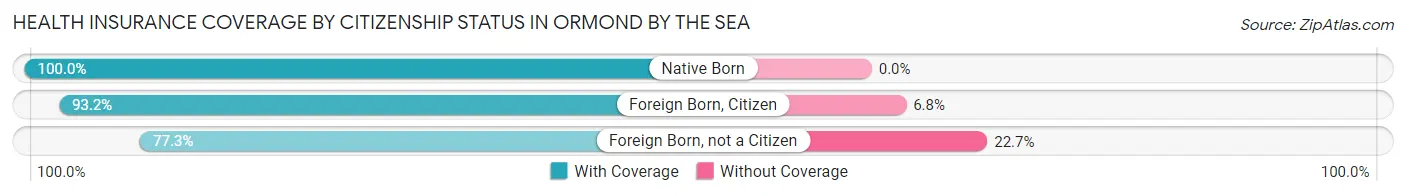
| Citizenship Status | With Coverage | Without Coverage |
| Native Born | 105 (100.0%) | 0 (0.0%) |
| Foreign Born, Citizen | 469 (93.2%) | 34 (6.8%) |
| Foreign Born, not a Citizen | 211 (77.3%) | 62 (22.7%) |
Health Insurance Coverage by Household Income in Ormond by the Sea
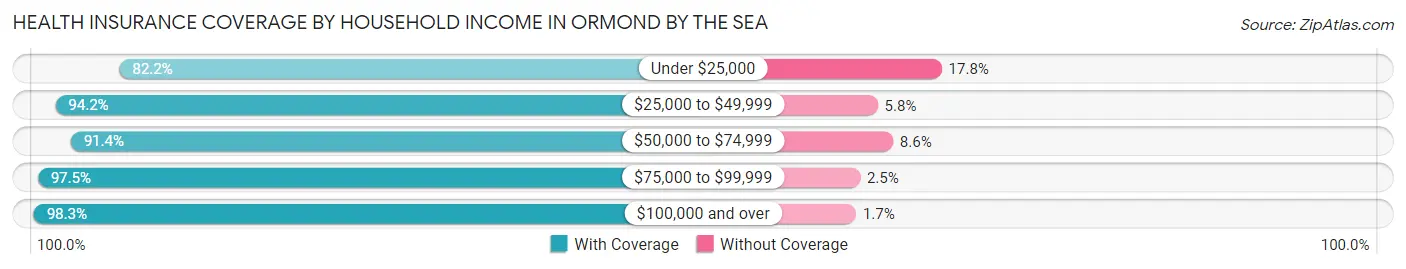
| Household Income | With Coverage | Without Coverage |
| Under $25,000 | 819 (82.2%) | 177 (17.8%) |
| $25,000 to $49,999 | 1,191 (94.2%) | 73 (5.8%) |
| $50,000 to $74,999 | 1,216 (91.4%) | 115 (8.6%) |
| $75,000 to $99,999 | 834 (97.5%) | 21 (2.5%) |
| $100,000 and over | 2,173 (98.3%) | 38 (1.7%) |
Public vs Private Health Insurance Coverage by Age in Ormond by the Sea
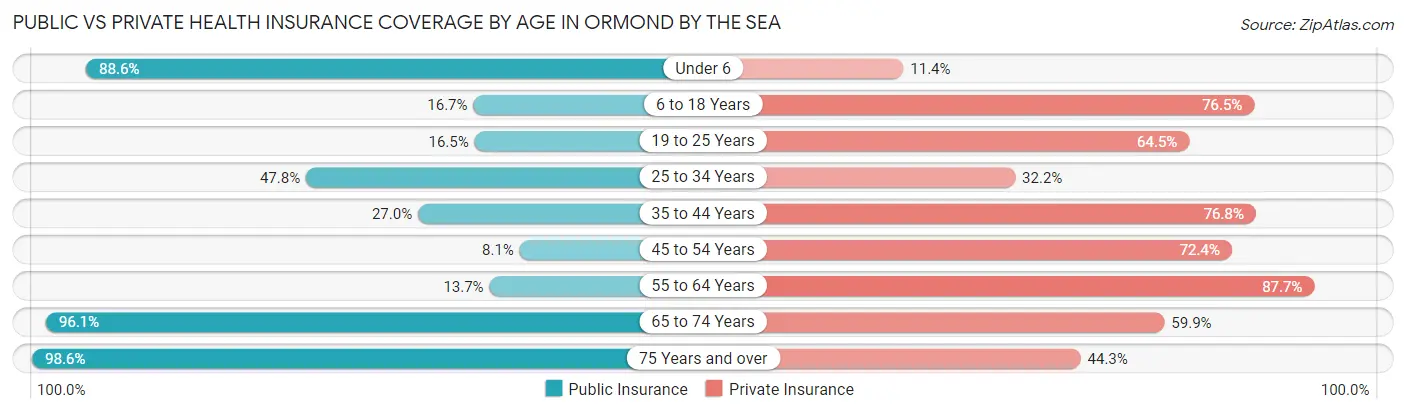
| Age Bracket | Public Insurance | Private Insurance |
| Under 6 | 93 (88.6%) | 12 (11.4%) |
| 6 to 18 Years | 84 (16.7%) | 385 (76.5%) |
| 19 to 25 Years | 45 (16.5%) | 176 (64.5%) |
| 25 to 34 Years | 193 (47.8%) | 130 (32.2%) |
| 35 to 44 Years | 92 (27.0%) | 262 (76.8%) |
| 45 to 54 Years | 64 (8.1%) | 571 (72.4%) |
| 55 to 64 Years | 215 (13.7%) | 1,374 (87.7%) |
| 65 to 74 Years | 1,410 (96.1%) | 879 (59.9%) |
| 75 Years and over | 1,201 (98.6%) | 540 (44.3%) |
| Total | 3,397 (50.9%) | 4,329 (64.9%) |
Disability Status by Sex by Age in Ormond by the Sea
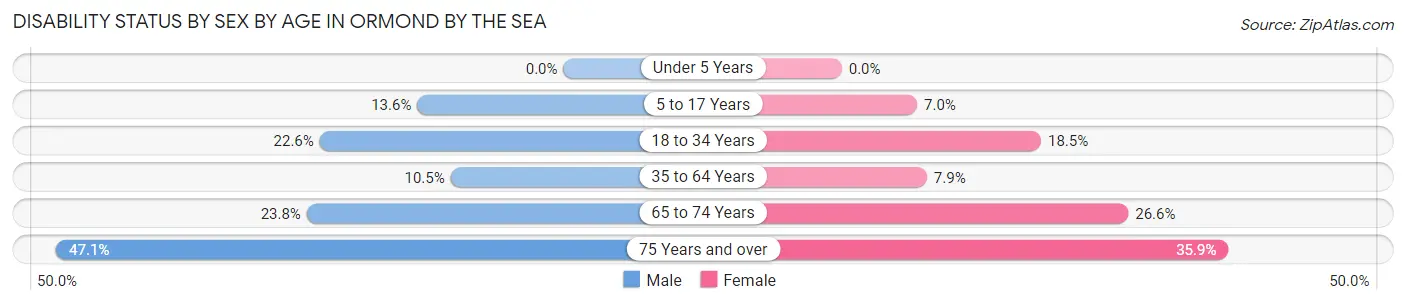
| Age Bracket | Male | Female |
| Under 5 Years | 0 (0.0%) | 0 (0.0%) |
| 5 to 17 Years | 24 (13.6%) | 20 (7.0%) |
| 18 to 34 Years | 107 (22.6%) | 49 (18.5%) |
| 35 to 64 Years | 142 (10.5%) | 106 (7.9%) |
| 65 to 74 Years | 192 (23.8%) | 176 (26.6%) |
| 75 Years and over | 257 (47.1%) | 241 (35.9%) |
Disability Class by Sex by Age in Ormond by the Sea
Disability Class: Hearing Difficulty
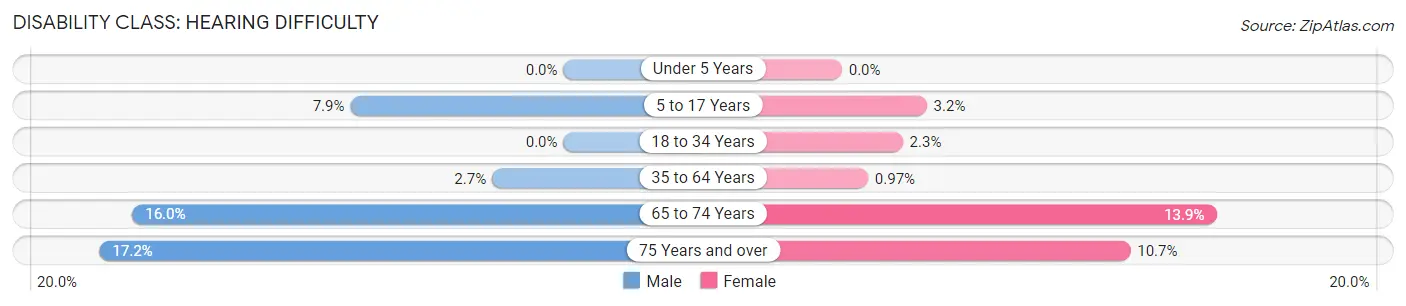
| Age Bracket | Male | Female |
| Under 5 Years | 0 (0.0%) | 0 (0.0%) |
| 5 to 17 Years | 14 (7.9%) | 9 (3.2%) |
| 18 to 34 Years | 0 (0.0%) | 6 (2.3%) |
| 35 to 64 Years | 36 (2.6%) | 13 (1.0%) |
| 65 to 74 Years | 129 (16.0%) | 92 (13.9%) |
| 75 Years and over | 94 (17.2%) | 72 (10.7%) |
Disability Class: Vision Difficulty
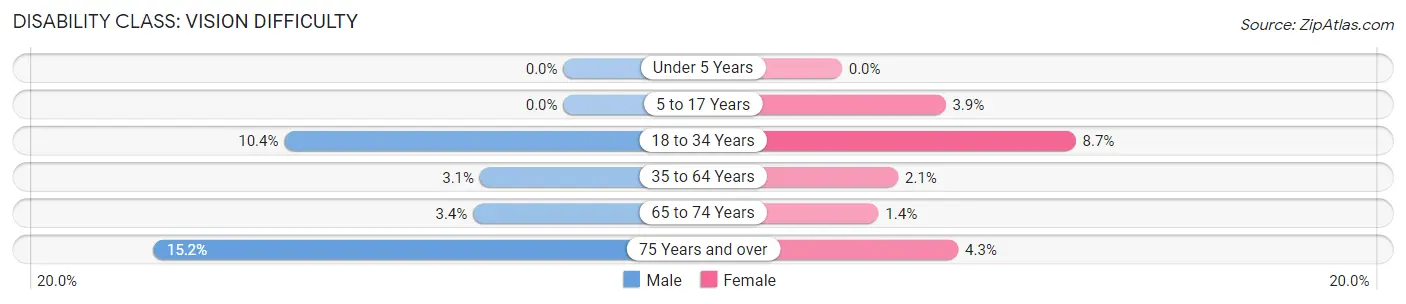
| Age Bracket | Male | Female |
| Under 5 Years | 0 (0.0%) | 0 (0.0%) |
| 5 to 17 Years | 0 (0.0%) | 11 (3.8%) |
| 18 to 34 Years | 49 (10.4%) | 23 (8.7%) |
| 35 to 64 Years | 42 (3.1%) | 28 (2.1%) |
| 65 to 74 Years | 27 (3.4%) | 9 (1.4%) |
| 75 Years and over | 83 (15.2%) | 29 (4.3%) |
Disability Class: Cognitive Difficulty
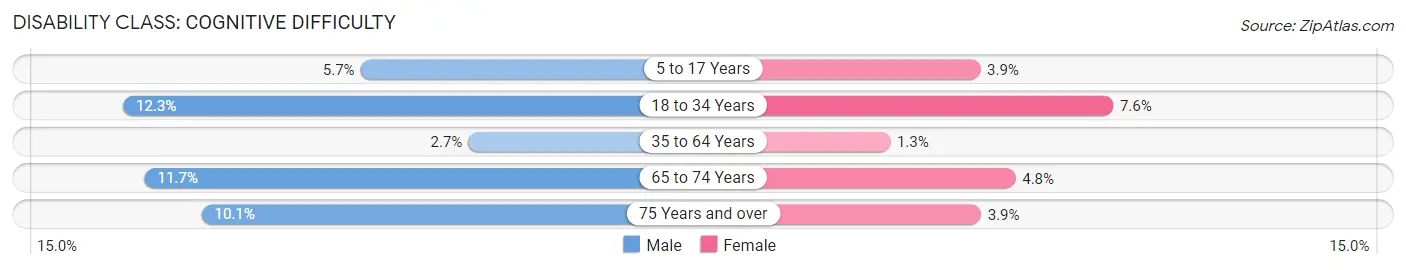
| Age Bracket | Male | Female |
| 5 to 17 Years | 10 (5.7%) | 11 (3.8%) |
| 18 to 34 Years | 58 (12.3%) | 20 (7.5%) |
| 35 to 64 Years | 36 (2.6%) | 18 (1.3%) |
| 65 to 74 Years | 94 (11.7%) | 32 (4.8%) |
| 75 Years and over | 55 (10.1%) | 26 (3.9%) |
Disability Class: Ambulatory Difficulty
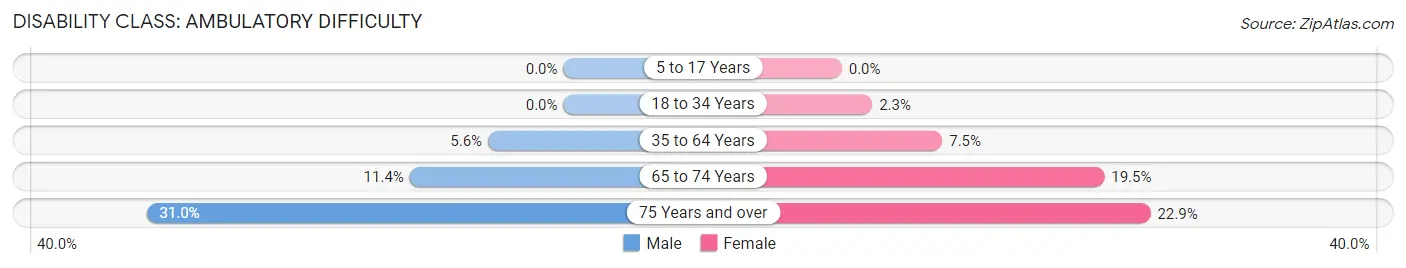
| Age Bracket | Male | Female |
| 5 to 17 Years | 0 (0.0%) | 0 (0.0%) |
| 18 to 34 Years | 0 (0.0%) | 6 (2.3%) |
| 35 to 64 Years | 76 (5.6%) | 100 (7.5%) |
| 65 to 74 Years | 92 (11.4%) | 129 (19.5%) |
| 75 Years and over | 169 (30.9%) | 154 (22.9%) |
Disability Class: Self-Care Difficulty
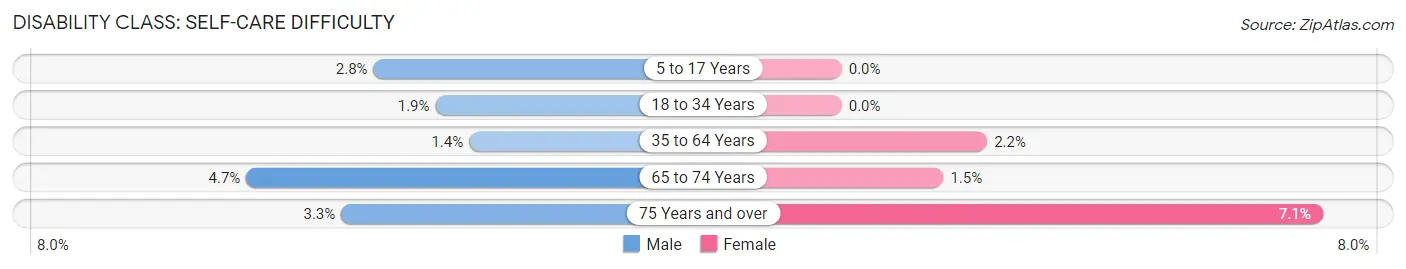
| Age Bracket | Male | Female |
| 5 to 17 Years | 5 (2.8%) | 0 (0.0%) |
| 18 to 34 Years | 9 (1.9%) | 0 (0.0%) |
| 35 to 64 Years | 19 (1.4%) | 29 (2.2%) |
| 65 to 74 Years | 38 (4.7%) | 10 (1.5%) |
| 75 Years and over | 18 (3.3%) | 48 (7.1%) |
Technology Access in Ormond by the Sea
Computing Device Access in Ormond by the Sea
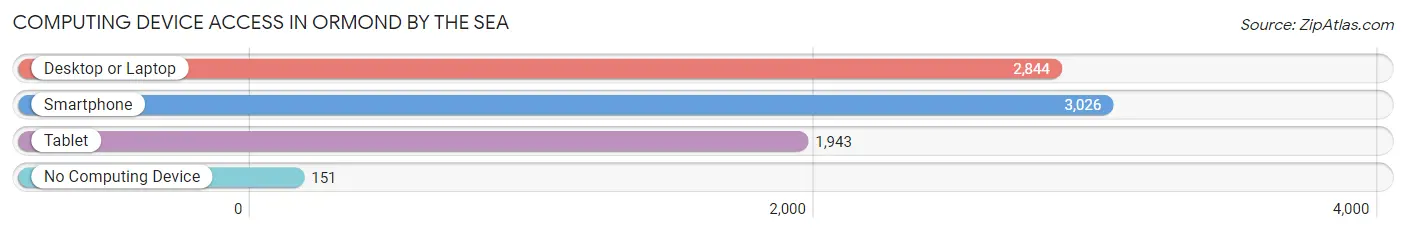
| Device Type | # Households | % Households |
| Desktop or Laptop | 2,844 | 78.4% |
| Smartphone | 3,026 | 83.5% |
| Tablet | 1,943 | 53.6% |
| No Computing Device | 151 | 4.2% |
| Total | 3,626 | 100.0% |
Internet Access in Ormond by the Sea
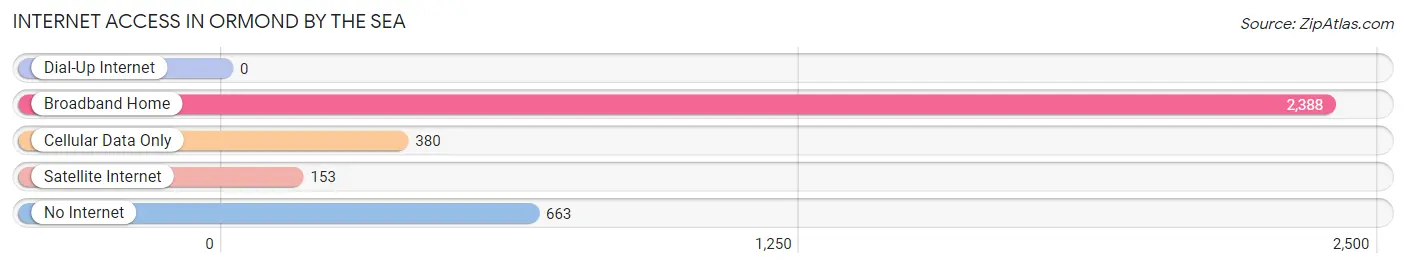
| Internet Type | # Households | % Households |
| Dial-Up Internet | 0 | 0.0% |
| Broadband Home | 2,388 | 65.9% |
| Cellular Data Only | 380 | 10.5% |
| Satellite Internet | 153 | 4.2% |
| No Internet | 663 | 18.3% |
| Total | 3,626 | 100.0% |
Ormond by the Sea Summary
Ormond By The Sea, FL is a small coastal town located in Volusia County, Florida. It is situated on the Atlantic Ocean, just north of Daytona Beach. The town is known for its beautiful beaches, fishing, and outdoor activities. The population of Ormond By The Sea, FL was estimated to be 5,845 in 2020.
History
The area that is now Ormond By The Sea, FL was first inhabited by the Timucua Indians. The Timucua were a Native American tribe that lived in the area for thousands of years before the arrival of Europeans. The first Europeans to settle in the area were the Spanish, who established a mission in the area in 1566. The mission was abandoned in 1572, but the Spanish continued to explore the area.
In the late 1700s, the area was settled by the British. The British established a trading post in the area, which was later abandoned. In the early 1800s, the area was settled by the French. The French established a trading post in the area, which was later abandoned.
In the late 1800s, the area was settled by the Americans. The Americans established a fishing village in the area, which was later abandoned. In the early 1900s, the area was settled by the Japanese. The Japanese established a fishing village in the area, which was later abandoned.
In the mid-1900s, the area was settled by the Americans again. The Americans established a resort town in the area, which was later abandoned. In the late 1900s, the area was settled by the Americans again. The Americans established a residential community in the area, which is now known as Ormond By The Sea, FL.
Geography
Ormond By The Sea, FL is located on the Atlantic Ocean, just north of Daytona Beach. The town is situated on a barrier island, which is separated from the mainland by the Halifax River. The town is bordered by the Atlantic Ocean to the east, the Halifax River to the west, and the Tomoka River to the south. The town is located approximately 25 miles north of Daytona Beach and approximately 60 miles south of Jacksonville.
The town has a total area of 2.2 square miles, all of which is land. The town has a humid subtropical climate, with hot, humid summers and mild winters. The average temperature in the summer is around 90 degrees Fahrenheit, and the average temperature in the winter is around 60 degrees Fahrenheit.
Economy
The economy of Ormond By The Sea, FL is largely based on tourism. The town is a popular destination for beachgoers, fishermen, and outdoor enthusiasts. The town is also home to several restaurants, bars, and shops. The town is also home to several hotels and resorts, which cater to tourists and visitors.
The town is also home to several manufacturing and industrial businesses. The town is home to several boat manufacturers, as well as a few aerospace companies. The town is also home to several technology companies, which specialize in software development and computer programming.
Demographics
As of 2020, the population of Ormond By The Sea, FL was estimated to be 5,845. The population is largely white (90.3%), with a small percentage of African Americans (3.2%), Hispanics (2.7%), and Asians (1.7%). The median household income in the town is $50,945, and the median home value is $220,000. The town has a high rate of homeownership (83.3%), and the unemployment rate is 4.2%.
Common Questions
What is Per Capita Income in Ormond by the Sea?
Per Capita income in Ormond by the Sea is $67,925.
What is the Median Family Income in Ormond by the Sea?
Median Family Income in Ormond by the Sea is $77,230.
What is the Median Household income in Ormond by the Sea?
Median Household Income in Ormond by the Sea is $59,598.
What is Income or Wage Gap in Ormond by the Sea?
Income or Wage Gap in Ormond by the Sea is 10.0%.
Women in Ormond by the Sea earn 90.0 cents for every dollar earned by a man.
What is Inequality or Gini Index in Ormond by the Sea?
Inequality or Gini Index in Ormond by the Sea is 0.63.
What is the Total Population of Ormond by the Sea?
Total Population of Ormond by the Sea is 6,668.
What is the Total Male Population of Ormond by the Sea?
Total Male Population of Ormond by the Sea is 3,377.
What is the Total Female Population of Ormond by the Sea?
Total Female Population of Ormond by the Sea is 3,291.
What is the Ratio of Males per 100 Females in Ormond by the Sea?
There are 102.61 Males per 100 Females in Ormond by the Sea.
What is the Ratio of Females per 100 Males in Ormond by the Sea?
There are 97.45 Females per 100 Males in Ormond by the Sea.
What is the Median Population Age in Ormond by the Sea?
Median Population Age in Ormond by the Sea is 61.8 Years.
What is the Average Family Size in Ormond by the Sea
Average Family Size in Ormond by the Sea is 2.5 People.
What is the Average Household Size in Ormond by the Sea
Average Household Size in Ormond by the Sea is 1.8 People.
How Large is the Labor Force in Ormond by the Sea?
There are 2,870 People in the Labor Forcein in Ormond by the Sea.
What is the Percentage of People in the Labor Force in Ormond by the Sea?
45.4% of People are in the Labor Force in Ormond by the Sea.
What is the Unemployment Rate in Ormond by the Sea?
Unemployment Rate in Ormond by the Sea is 9.3%.