Orange Park, FL Map & Demographics
Orange Park Map
Orange Park Overview
$37,854
PER CAPITA INCOME
$87,477
AVG FAMILY INCOME
$67,035
AVG HOUSEHOLD INCOME
35.1%
WAGE / INCOME GAP [ % ]
64.9¢/ $1
WAGE / INCOME GAP [ $ ]
$9,347
FAMILY INCOME DEFICIT
0.41
INEQUALITY / GINI INDEX
9,047
TOTAL POPULATION
4,930
MALE POPULATION
4,117
FEMALE POPULATION
119.75
MALES / 100 FEMALES
83.51
FEMALES / 100 MALES
45.3
MEDIAN AGE
2.9
AVG FAMILY SIZE
2.4
AVG HOUSEHOLD SIZE
4,678
LABOR FORCE [ PEOPLE ]
61.2%
PERCENT IN LABOR FORCE
5.6%
UNEMPLOYMENT RATE
Orange Park Area Codes
Income in Orange Park
Income Overview in Orange Park
Per Capita Income in Orange Park is $37,854, while median incomes of families and households are $87,477 and $67,035 respectively.
| Characteristic | Number | Measure |
| Per Capita Income | 9,047 | $37,854 |
| Median Family Income | 2,381 | $87,477 |
| Mean Family Income | 2,381 | $102,195 |
| Median Household Income | 3,521 | $67,035 |
| Mean Household Income | 3,521 | $89,248 |
| Income Deficit | 2,381 | $9,347 |
| Wage / Income Gap (%) | 9,047 | 35.06% |
| Wage / Income Gap ($) | 9,047 | 64.94¢ per $1 |
| Gini / Inequality Index | 9,047 | 0.41 |
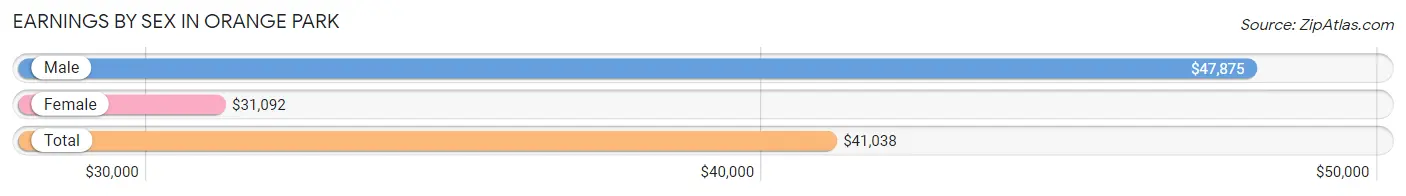
Earnings by Sex in Orange Park
Average Earnings in Orange Park are $41,038, $47,875 for men and $31,092 for women, a difference of 35.1%.
| Sex | Number | Average Earnings |
| Male | 2,676 (57.9%) | $47,875 |
| Female | 1,949 (42.1%) | $31,092 |
| Total | 4,625 (100.0%) | $41,038 |
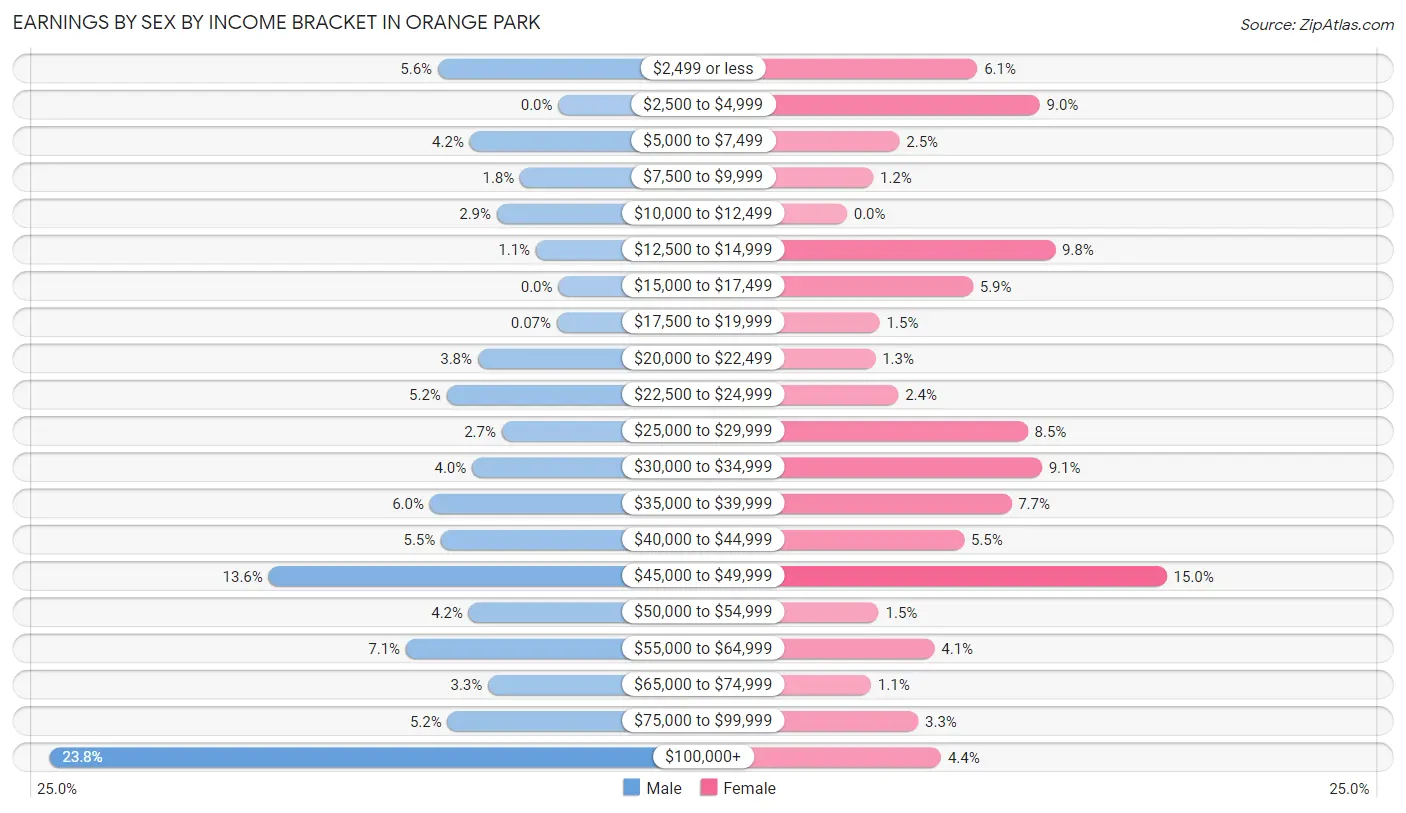
Earnings by Sex by Income Bracket in Orange Park
The most common earnings brackets in Orange Park are $100,000+ for men (638 | 23.8%) and $45,000 to $49,999 for women (292 | 15.0%).
| Income | Male | Female |
| $2,499 or less | 151 (5.6%) | 119 (6.1%) |
| $2,500 to $4,999 | 0 (0.0%) | 176 (9.0%) |
| $5,000 to $7,499 | 111 (4.2%) | 48 (2.5%) |
| $7,500 to $9,999 | 48 (1.8%) | 24 (1.2%) |
| $10,000 to $12,499 | 77 (2.9%) | 0 (0.0%) |
| $12,500 to $14,999 | 28 (1.1%) | 190 (9.8%) |
| $15,000 to $17,499 | 0 (0.0%) | 115 (5.9%) |
| $17,500 to $19,999 | 2 (0.1%) | 30 (1.5%) |
| $20,000 to $22,499 | 101 (3.8%) | 26 (1.3%) |
| $22,500 to $24,999 | 140 (5.2%) | 47 (2.4%) |
| $25,000 to $29,999 | 71 (2.6%) | 165 (8.5%) |
| $30,000 to $34,999 | 108 (4.0%) | 178 (9.1%) |
| $35,000 to $39,999 | 161 (6.0%) | 150 (7.7%) |
| $40,000 to $44,999 | 147 (5.5%) | 107 (5.5%) |
| $45,000 to $49,999 | 363 (13.6%) | 292 (15.0%) |
| $50,000 to $54,999 | 112 (4.2%) | 29 (1.5%) |
| $55,000 to $64,999 | 191 (7.1%) | 80 (4.1%) |
| $65,000 to $74,999 | 88 (3.3%) | 22 (1.1%) |
| $75,000 to $99,999 | 139 (5.2%) | 65 (3.3%) |
| $100,000+ | 638 (23.8%) | 86 (4.4%) |
| Total | 2,676 (100.0%) | 1,949 (100.0%) |
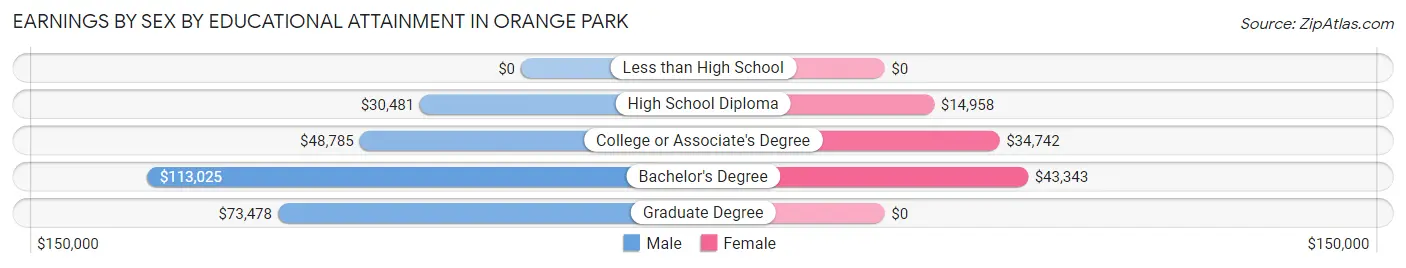
Earnings by Sex by Educational Attainment in Orange Park
Average earnings in Orange Park are $48,681 for men and $33,245 for women, a difference of 31.7%. Men with an educational attainment of bachelor's degree enjoy the highest average annual earnings of $113,025, while those with high school diploma education earn the least with $30,481. Women with an educational attainment of bachelor's degree earn the most with the average annual earnings of $43,343, while those with high school diploma education have the smallest earnings of $14,958.
| Educational Attainment | Male Income | Female Income |
| Less than High School | - | - |
| High School Diploma | $30,481 | $14,958 |
| College or Associate's Degree | $48,785 | $34,742 |
| Bachelor's Degree | $113,025 | $43,343 |
| Graduate Degree | $73,478 | $0 |
| Total | $48,681 | $33,245 |
Family Income in Orange Park
Family Income Brackets in Orange Park
According to the Orange Park family income data, there are 414 families falling into the $75,000 to $99,999 income range, which is the most common income bracket and makes up 17.4% of all families.
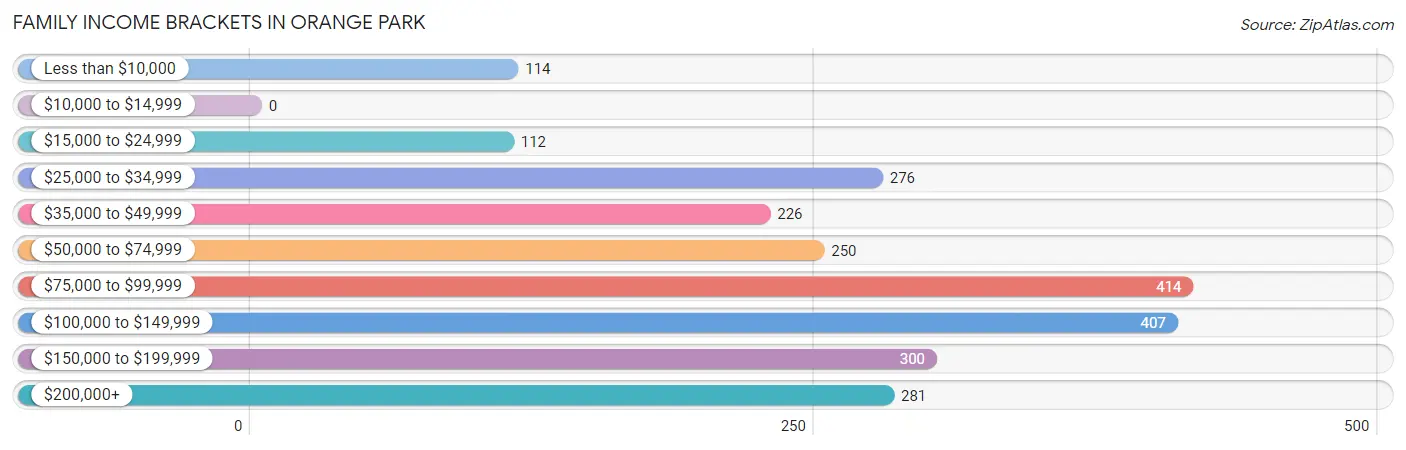
| Income Bracket | # Families | % Families |
| Less than $10,000 | 114 | 4.8% |
| $10,000 to $14,999 | 0 | 0.0% |
| $15,000 to $24,999 | 112 | 4.7% |
| $25,000 to $34,999 | 276 | 11.6% |
| $35,000 to $49,999 | 226 | 9.5% |
| $50,000 to $74,999 | 250 | 10.5% |
| $75,000 to $99,999 | 414 | 17.4% |
| $100,000 to $149,999 | 407 | 17.1% |
| $150,000 to $199,999 | 300 | 12.6% |
| $200,000+ | 281 | 11.8% |
Family Income by Famaliy Size in Orange Park
2-person families (1,328 | 55.8%) account for the highest median family income in Orange Park with $90,918 per family, while 2-person families (1,328 | 55.8%) have the highest median income of $45,459 per family member.
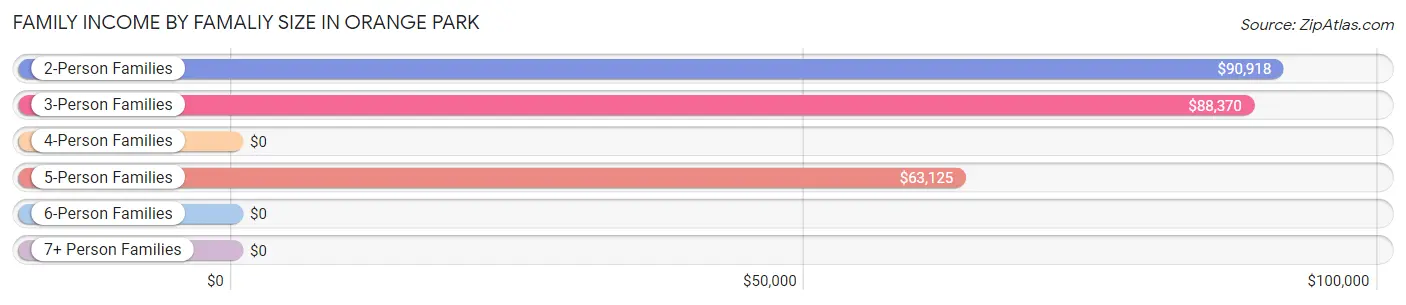
| Income Bracket | # Families | Median Income |
| 2-Person Families | 1,328 (55.8%) | $90,918 |
| 3-Person Families | 580 (24.4%) | $88,370 |
| 4-Person Families | 137 (5.8%) | $0 |
| 5-Person Families | 261 (11.0%) | $63,125 |
| 6-Person Families | 59 (2.5%) | $0 |
| 7+ Person Families | 16 (0.7%) | $0 |
| Total | 2,381 (100.0%) | $87,477 |
Family Income by Number of Earners in Orange Park
The median family income in Orange Park is $87,477, with families comprising 3+ earners (251) having the highest median family income of $116,615, while families with 1 earner (886) have the lowest median family income of $65,652, accounting for 10.5% and 37.2% of families, respectively.
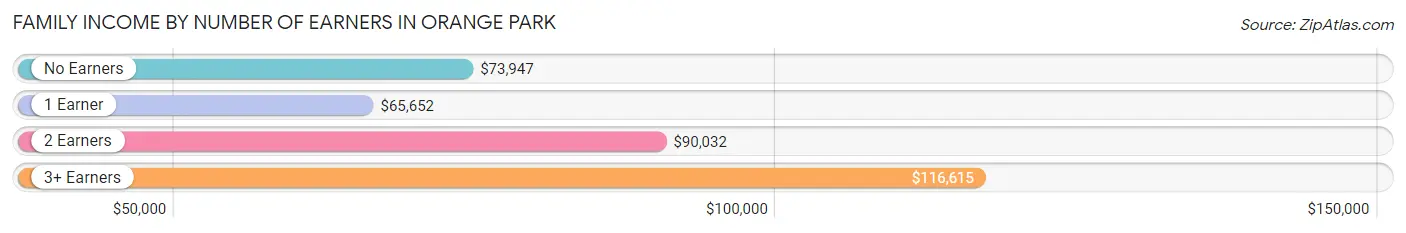
| Number of Earners | # Families | Median Income |
| No Earners | 440 (18.5%) | $73,947 |
| 1 Earner | 886 (37.2%) | $65,652 |
| 2 Earners | 804 (33.8%) | $90,032 |
| 3+ Earners | 251 (10.5%) | $116,615 |
| Total | 2,381 (100.0%) | $87,477 |
Household Income in Orange Park
Household Income Brackets in Orange Park
With 683 households falling in the category, the $35,000 to $49,999 income range is the most frequent in Orange Park, accounting for 19.4% of all households. In contrast, only 92 households (2.6%) fall into the $10,000 to $14,999 income bracket, making it the least populous group.
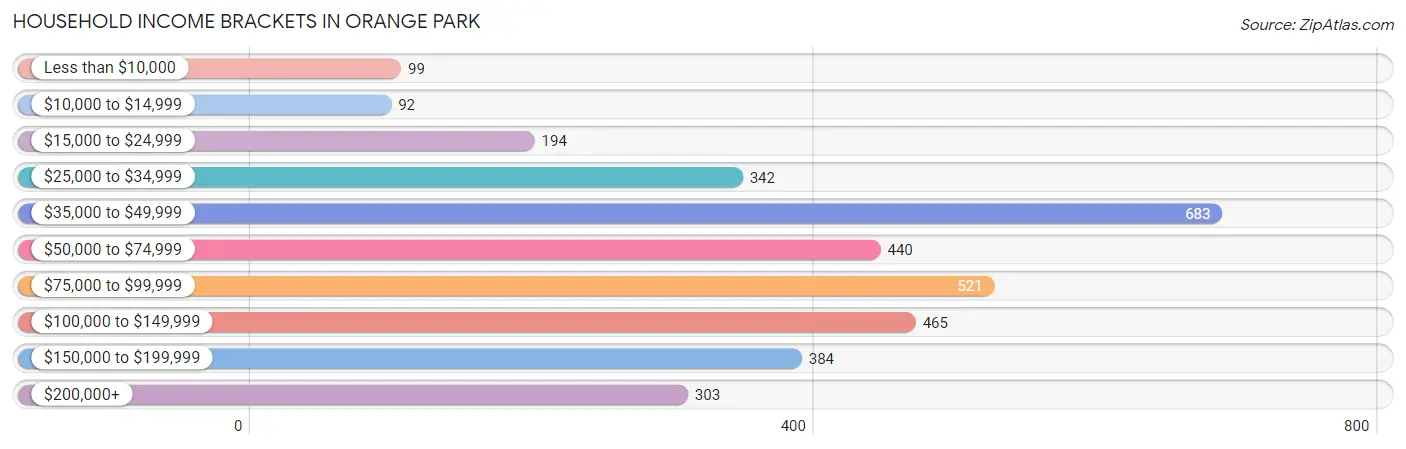
| Income Bracket | # Households | % Households |
| Less than $10,000 | 99 | 2.8% |
| $10,000 to $14,999 | 92 | 2.6% |
| $15,000 to $24,999 | 194 | 5.5% |
| $25,000 to $34,999 | 342 | 9.7% |
| $35,000 to $49,999 | 683 | 19.4% |
| $50,000 to $74,999 | 440 | 12.5% |
| $75,000 to $99,999 | 521 | 14.8% |
| $100,000 to $149,999 | 465 | 13.2% |
| $150,000 to $199,999 | 384 | 10.9% |
| $200,000+ | 303 | 8.6% |
Household Income by Householder Age in Orange Park
The median household income in Orange Park is $67,035, with the highest median household income of $77,025 found in the 65+ years age bracket for the primary householder. A total of 1,131 households (32.1%) fall into this category. Meanwhile, the 15 to 24 years age bracket for the primary householder has the lowest median household income of $0, with 33 households (0.9%) in this group.
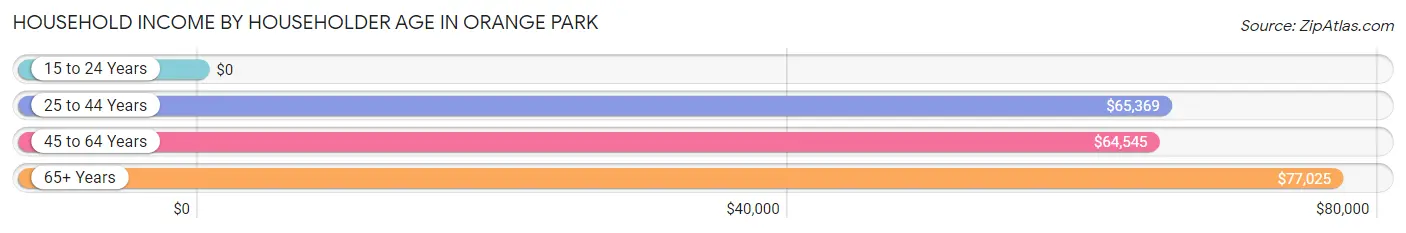
| Income Bracket | # Households | Median Income |
| 15 to 24 Years | 33 (0.9%) | $0 |
| 25 to 44 Years | 1,001 (28.4%) | $65,369 |
| 45 to 64 Years | 1,356 (38.5%) | $64,545 |
| 65+ Years | 1,131 (32.1%) | $77,025 |
| Total | 3,521 (100.0%) | $67,035 |
Poverty in Orange Park
Income Below Poverty by Sex and Age in Orange Park
With 10.4% poverty level for males and 16.8% for females among the residents of Orange Park, under 5 year old males and 18 to 24 year old females are the most vulnerable to poverty, with 135 males (60.0%) and 74 females (44.1%) in their respective age groups living below the poverty level.
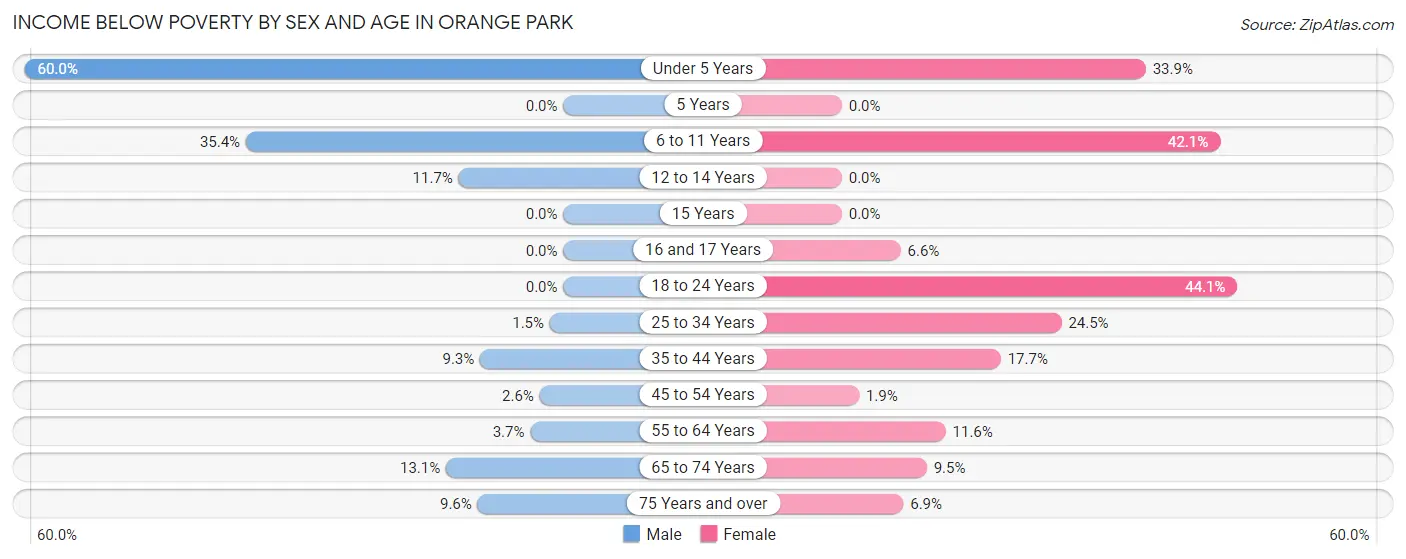
| Age Bracket | Male | Female |
| Under 5 Years | 135 (60.0%) | 65 (33.9%) |
| 5 Years | 0 (0.0%) | 0 (0.0%) |
| 6 to 11 Years | 140 (35.3%) | 115 (42.1%) |
| 12 to 14 Years | 19 (11.7%) | 0 (0.0%) |
| 15 Years | 0 (0.0%) | 0 (0.0%) |
| 16 and 17 Years | 0 (0.0%) | 11 (6.6%) |
| 18 to 24 Years | 0 (0.0%) | 74 (44.1%) |
| 25 to 34 Years | 12 (1.5%) | 147 (24.5%) |
| 35 to 44 Years | 46 (9.3%) | 91 (17.7%) |
| 45 to 54 Years | 22 (2.6%) | 7 (1.9%) |
| 55 to 64 Years | 19 (3.7%) | 66 (11.6%) |
| 65 to 74 Years | 61 (13.1%) | 37 (9.5%) |
| 75 Years and over | 38 (9.6%) | 39 (6.9%) |
| Total | 492 (10.4%) | 652 (16.8%) |
Income Above Poverty by Sex and Age in Orange Park
According to the poverty statistics in Orange Park, males aged 5 years and females aged 5 years are the age groups that are most secure financially, with 100.0% of males and 100.0% of females in these age groups living above the poverty line.
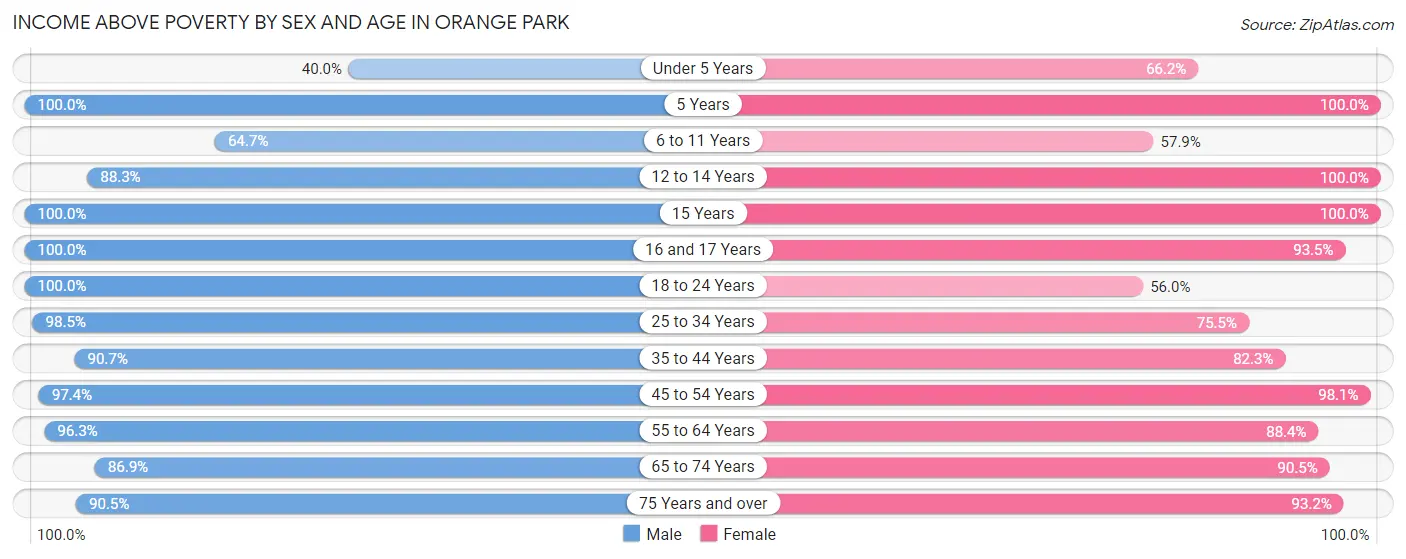
| Age Bracket | Male | Female |
| Under 5 Years | 90 (40.0%) | 127 (66.1%) |
| 5 Years | 33 (100.0%) | 19 (100.0%) |
| 6 to 11 Years | 256 (64.6%) | 158 (57.9%) |
| 12 to 14 Years | 144 (88.3%) | 52 (100.0%) |
| 15 Years | 43 (100.0%) | 8 (100.0%) |
| 16 and 17 Years | 104 (100.0%) | 157 (93.4%) |
| 18 to 24 Years | 234 (100.0%) | 94 (55.9%) |
| 25 to 34 Years | 789 (98.5%) | 454 (75.5%) |
| 35 to 44 Years | 450 (90.7%) | 423 (82.3%) |
| 45 to 54 Years | 812 (97.4%) | 359 (98.1%) |
| 55 to 64 Years | 497 (96.3%) | 505 (88.4%) |
| 65 to 74 Years | 406 (86.9%) | 354 (90.5%) |
| 75 Years and over | 360 (90.4%) | 530 (93.1%) |
| Total | 4,218 (89.5%) | 3,240 (83.3%) |
Income Below Poverty Among Married-Couple Families in Orange Park
The poverty statistics for married-couple families in Orange Park show that 4.8% or 74 of the total 1,534 families live below the poverty line. Families with no children have the highest poverty rate of 6.8%, comprising of 67 families. On the other hand, families with 3 or 4 children have the lowest poverty rate of 0.0%, which includes 0 families.
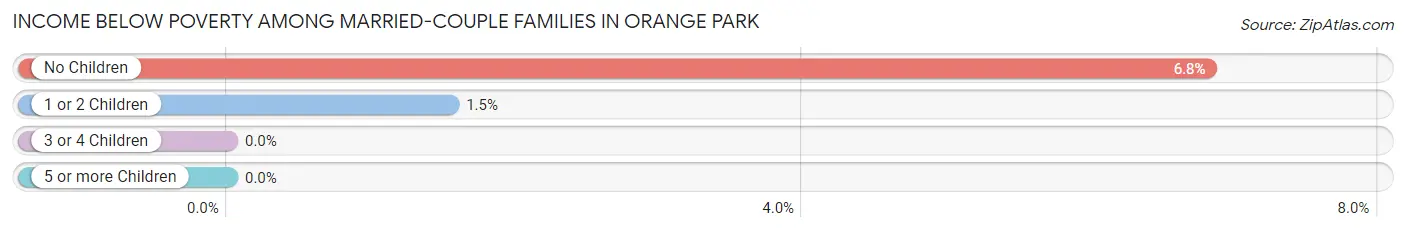
| Children | Above Poverty | Below Poverty |
| No Children | 916 (93.2%) | 67 (6.8%) |
| 1 or 2 Children | 448 (98.5%) | 7 (1.5%) |
| 3 or 4 Children | 96 (100.0%) | 0 (0.0%) |
| 5 or more Children | 0 (0.0%) | 0 (0.0%) |
| Total | 1,460 (95.2%) | 74 (4.8%) |
Income Below Poverty Among Single-Parent Households in Orange Park
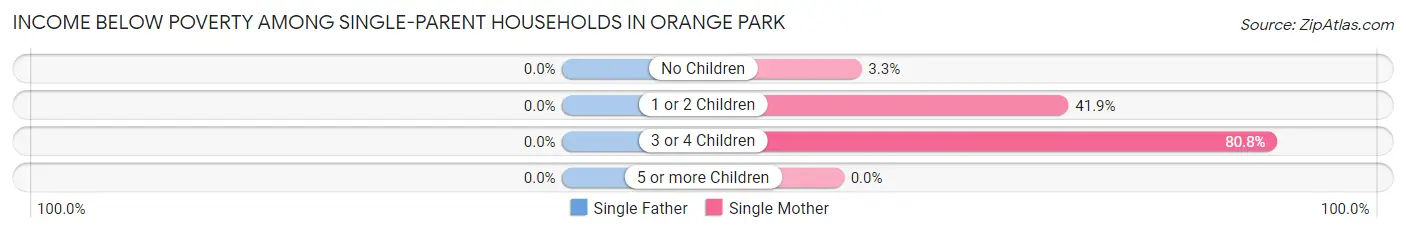
| Children | Single Father | Single Mother |
| No Children | 0 (0.0%) | 10 (3.3%) |
| 1 or 2 Children | 0 (0.0%) | 77 (41.8%) |
| 3 or 4 Children | 0 (0.0%) | 143 (80.8%) |
| 5 or more Children | 0 (0.0%) | 0 (0.0%) |
| Total | 0 (0.0%) | 230 (34.6%) |
Income Below Poverty Among Married-Couple vs Single-Parent Households in Orange Park
The poverty data for Orange Park shows that 74 of the married-couple family households (4.8%) and 230 of the single-parent households (27.2%) are living below the poverty level. Within the married-couple family households, those with no children have the highest poverty rate, with 67 households (6.8%) falling below the poverty line. Among the single-parent households, those with 3 or 4 children have the highest poverty rate, with 143 household (80.8%) living below poverty.
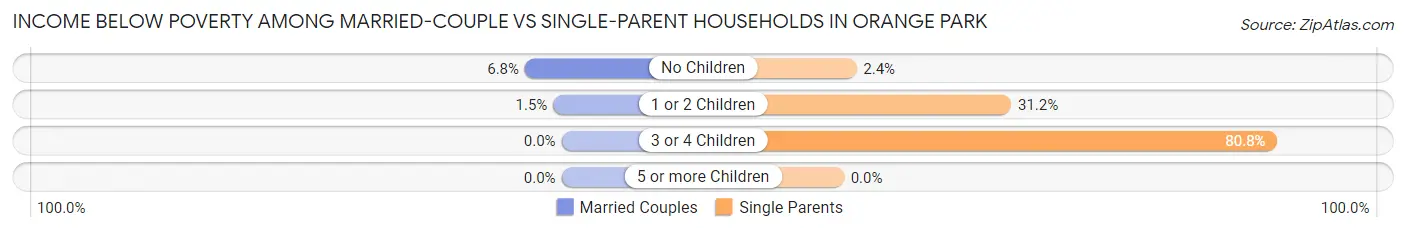
| Children | Married-Couple Families | Single-Parent Households |
| No Children | 67 (6.8%) | 10 (2.4%) |
| 1 or 2 Children | 7 (1.5%) | 77 (31.2%) |
| 3 or 4 Children | 0 (0.0%) | 143 (80.8%) |
| 5 or more Children | 0 (0.0%) | 0 (0.0%) |
| Total | 74 (4.8%) | 230 (27.2%) |
Race in Orange Park
The most populous races in Orange Park are White / Caucasian (5,364 | 59.3%), Black / African American (2,307 | 25.5%), and Hispanic or Latino (1,310 | 14.5%).
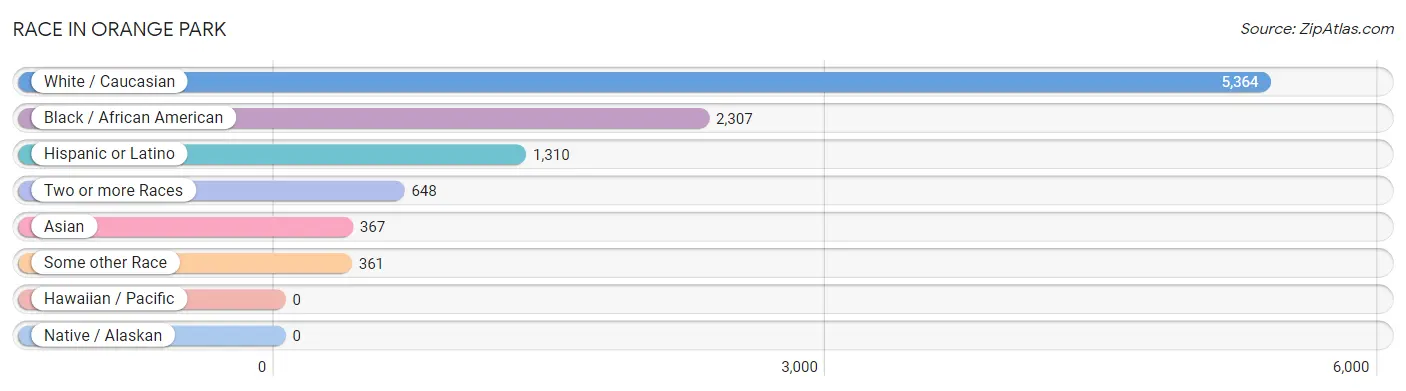
| Race | # Population | % Population |
| Asian | 367 | 4.1% |
| Black / African American | 2,307 | 25.5% |
| Hawaiian / Pacific | 0 | 0.0% |
| Hispanic or Latino | 1,310 | 14.5% |
| Native / Alaskan | 0 | 0.0% |
| White / Caucasian | 5,364 | 59.3% |
| Two or more Races | 648 | 7.2% |
| Some other Race | 361 | 4.0% |
| Total | 9,047 | 100.0% |
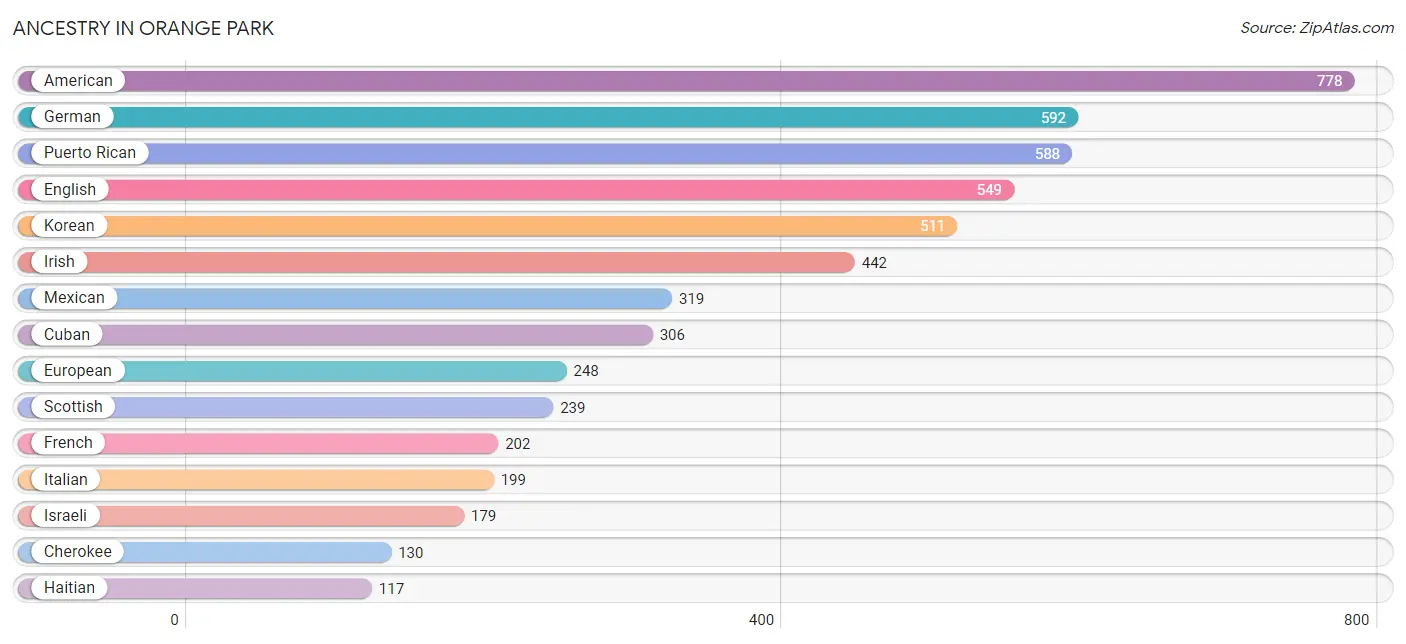
Ancestry in Orange Park
The most populous ancestries reported in Orange Park are American (778 | 8.6%), German (592 | 6.5%), Puerto Rican (588 | 6.5%), English (549 | 6.1%), and Korean (511 | 5.7%), together accounting for 33.4% of all Orange Park residents.
| Ancestry | # Population | % Population |
| African | 75 | 0.8% |
| American | 778 | 8.6% |
| Arab | 70 | 0.8% |
| Austrian | 37 | 0.4% |
| Bahamian | 4 | 0.0% |
| Bhutanese | 109 | 1.2% |
| British | 63 | 0.7% |
| Burmese | 44 | 0.5% |
| Canadian | 48 | 0.5% |
| Central American | 7 | 0.1% |
| Cherokee | 130 | 1.4% |
| Colombian | 11 | 0.1% |
| Costa Rican | 7 | 0.1% |
| Cuban | 306 | 3.4% |
| Czech | 30 | 0.3% |
| Dominican | 6 | 0.1% |
| Dutch | 103 | 1.1% |
| Eastern European | 24 | 0.3% |
| Egyptian | 48 | 0.5% |
| English | 549 | 6.1% |
| European | 248 | 2.7% |
| French | 202 | 2.2% |
| French Canadian | 40 | 0.4% |
| German | 592 | 6.5% |
| Greek | 11 | 0.1% |
| Haitian | 117 | 1.3% |
| Hungarian | 21 | 0.2% |
| Irish | 442 | 4.9% |
| Israeli | 179 | 2.0% |
| Italian | 199 | 2.2% |
| Jamaican | 2 | 0.0% |
| Korean | 511 | 5.7% |
| Mexican | 319 | 3.5% |
| Native Hawaiian | 100 | 1.1% |
| Northern European | 15 | 0.2% |
| Norwegian | 74 | 0.8% |
| Peruvian | 11 | 0.1% |
| Polish | 26 | 0.3% |
| Portuguese | 77 | 0.9% |
| Puerto Rican | 588 | 6.5% |
| Romanian | 8 | 0.1% |
| Russian | 97 | 1.1% |
| Scandinavian | 17 | 0.2% |
| Scotch-Irish | 79 | 0.9% |
| Scottish | 239 | 2.6% |
| Slavic | 6 | 0.1% |
| South American | 22 | 0.2% |
| Spaniard | 19 | 0.2% |
| Spanish | 15 | 0.2% |
| Subsaharan African | 75 | 0.8% |
| Swedish | 104 | 1.1% |
| Swiss | 12 | 0.1% |
| Syrian | 22 | 0.2% |
| Turkish | 29 | 0.3% |
| Ukrainian | 16 | 0.2% |
| Welsh | 60 | 0.7% | View All 56 Rows |
Immigrants in Orange Park
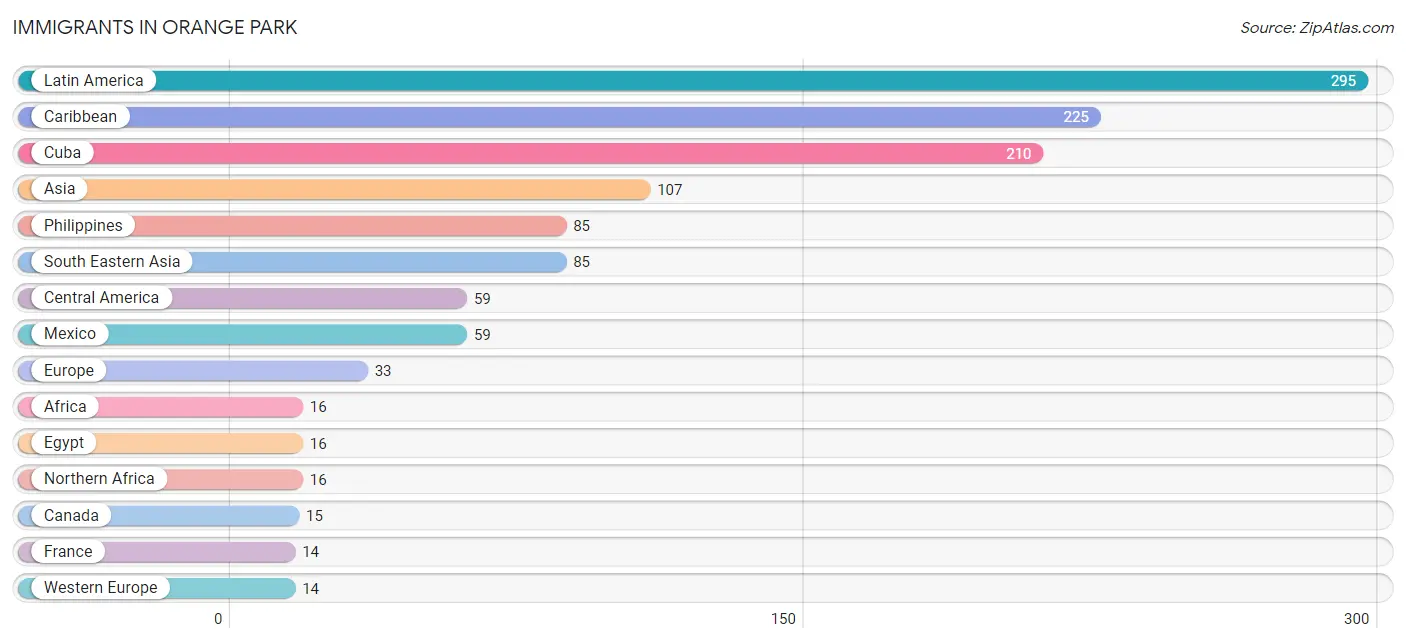
The most numerous immigrant groups reported in Orange Park came from Latin America (295 | 3.3%), Caribbean (225 | 2.5%), Cuba (210 | 2.3%), Asia (107 | 1.2%), and Philippines (85 | 0.9%), together accounting for 10.2% of all Orange Park residents.
| Immigration Origin | # Population | % Population |
| Africa | 16 | 0.2% |
| Asia | 107 | 1.2% |
| Canada | 15 | 0.2% |
| Caribbean | 225 | 2.5% |
| Central America | 59 | 0.6% |
| Colombia | 11 | 0.1% |
| Cuba | 210 | 2.3% |
| Eastern Asia | 8 | 0.1% |
| Eastern Europe | 8 | 0.1% |
| Egypt | 16 | 0.2% |
| Europe | 33 | 0.4% |
| France | 14 | 0.2% |
| Haiti | 6 | 0.1% |
| Korea | 8 | 0.1% |
| Latin America | 295 | 3.3% |
| Mexico | 59 | 0.6% |
| Northern Africa | 16 | 0.2% |
| Pakistan | 2 | 0.0% |
| Philippines | 85 | 0.9% |
| Romania | 8 | 0.1% |
| South America | 11 | 0.1% |
| South Central Asia | 2 | 0.0% |
| South Eastern Asia | 85 | 0.9% |
| Southern Europe | 11 | 0.1% |
| Spain | 11 | 0.1% |
| Trinidad and Tobago | 9 | 0.1% |
| Turkey | 12 | 0.1% |
| Western Asia | 12 | 0.1% |
| Western Europe | 14 | 0.2% | View All 29 Rows |
Sex and Age in Orange Park
Sex and Age in Orange Park
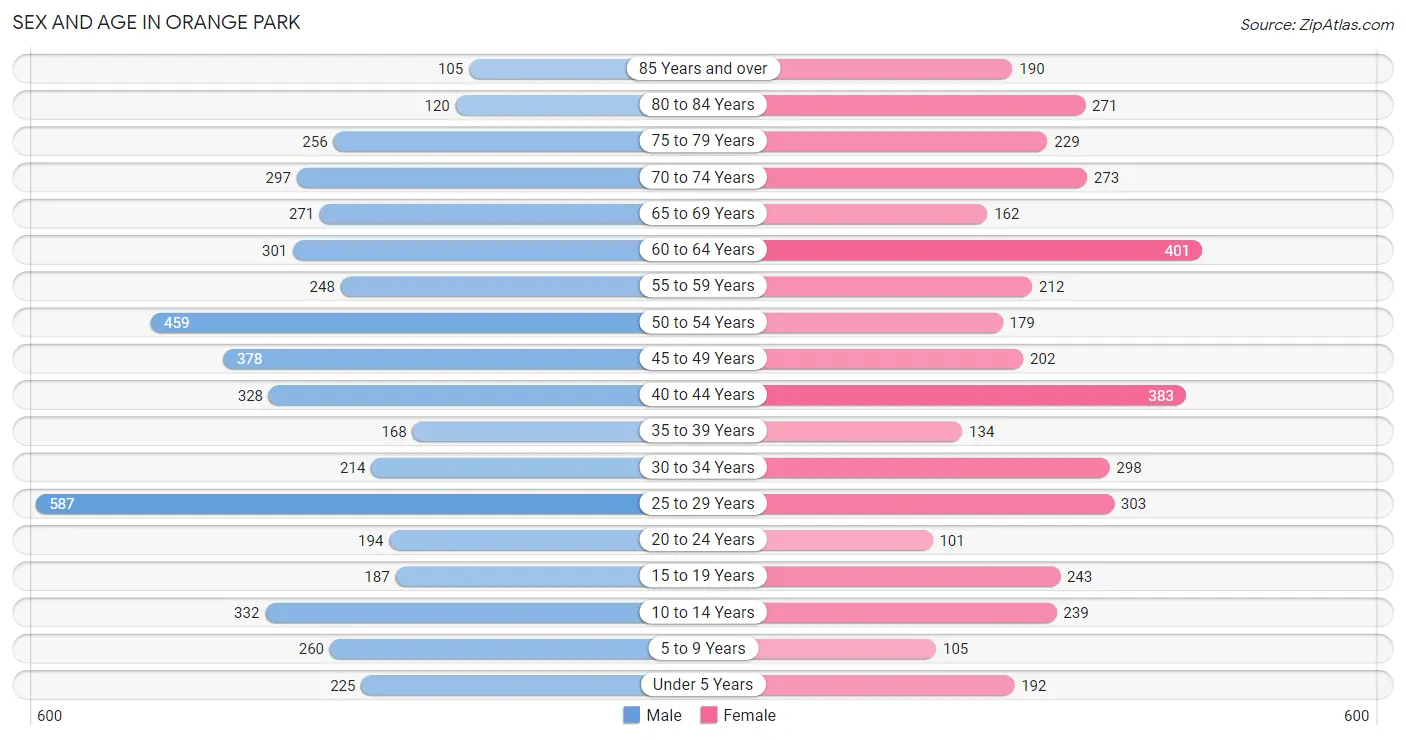
The most populous age groups in Orange Park are 25 to 29 Years (587 | 11.9%) for men and 60 to 64 Years (401 | 9.7%) for women.
| Age Bracket | Male | Female |
| Under 5 Years | 225 (4.6%) | 192 (4.7%) |
| 5 to 9 Years | 260 (5.3%) | 105 (2.5%) |
| 10 to 14 Years | 332 (6.7%) | 239 (5.8%) |
| 15 to 19 Years | 187 (3.8%) | 243 (5.9%) |
| 20 to 24 Years | 194 (3.9%) | 101 (2.5%) |
| 25 to 29 Years | 587 (11.9%) | 303 (7.4%) |
| 30 to 34 Years | 214 (4.3%) | 298 (7.2%) |
| 35 to 39 Years | 168 (3.4%) | 134 (3.3%) |
| 40 to 44 Years | 328 (6.7%) | 383 (9.3%) |
| 45 to 49 Years | 378 (7.7%) | 202 (4.9%) |
| 50 to 54 Years | 459 (9.3%) | 179 (4.3%) |
| 55 to 59 Years | 248 (5.0%) | 212 (5.1%) |
| 60 to 64 Years | 301 (6.1%) | 401 (9.7%) |
| 65 to 69 Years | 271 (5.5%) | 162 (3.9%) |
| 70 to 74 Years | 297 (6.0%) | 273 (6.6%) |
| 75 to 79 Years | 256 (5.2%) | 229 (5.6%) |
| 80 to 84 Years | 120 (2.4%) | 271 (6.6%) |
| 85 Years and over | 105 (2.1%) | 190 (4.6%) |
| Total | 4,930 (100.0%) | 4,117 (100.0%) |
Families and Households in Orange Park
Median Family Size in Orange Park
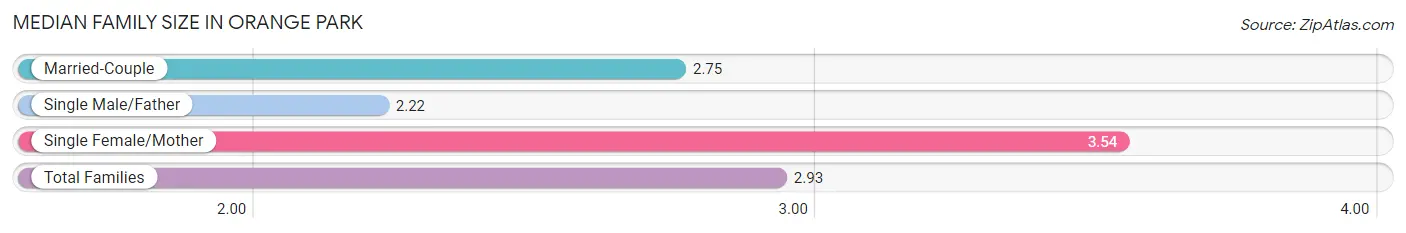
The median family size in Orange Park is 2.93 persons per family, with single female/mother families (664 | 27.9%) accounting for the largest median family size of 3.54 persons per family. On the other hand, single male/father families (183 | 7.7%) represent the smallest median family size with 2.22 persons per family.
| Family Type | # Families | Family Size |
| Married-Couple | 1,534 (64.4%) | 2.75 |
| Single Male/Father | 183 (7.7%) | 2.22 |
| Single Female/Mother | 664 (27.9%) | 3.54 |
| Total Families | 2,381 (100.0%) | 2.93 |
Median Household Size in Orange Park
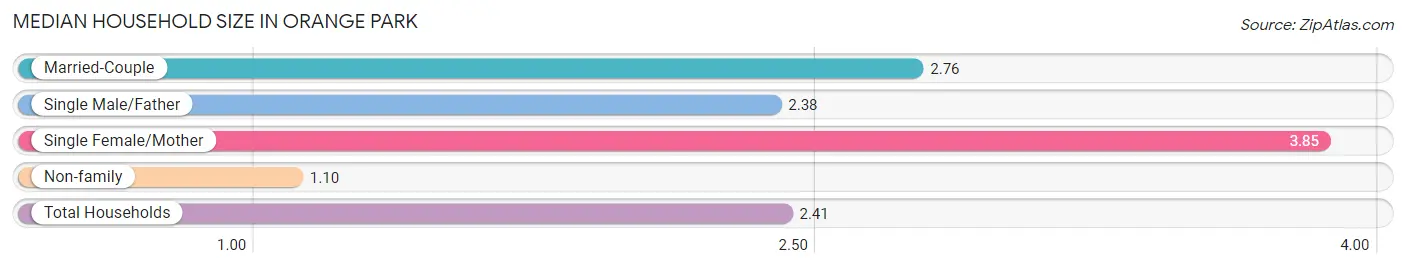
The median household size in Orange Park is 2.41 persons per household, with single female/mother households (664 | 18.9%) accounting for the largest median household size of 3.85 persons per household. non-family households (1,140 | 32.4%) represent the smallest median household size with 1.10 persons per household.
| Household Type | # Households | Household Size |
| Married-Couple | 1,534 (43.6%) | 2.76 |
| Single Male/Father | 183 (5.2%) | 2.38 |
| Single Female/Mother | 664 (18.9%) | 3.85 |
| Non-family | 1,140 (32.4%) | 1.10 |
| Total Households | 3,521 (100.0%) | 2.41 |
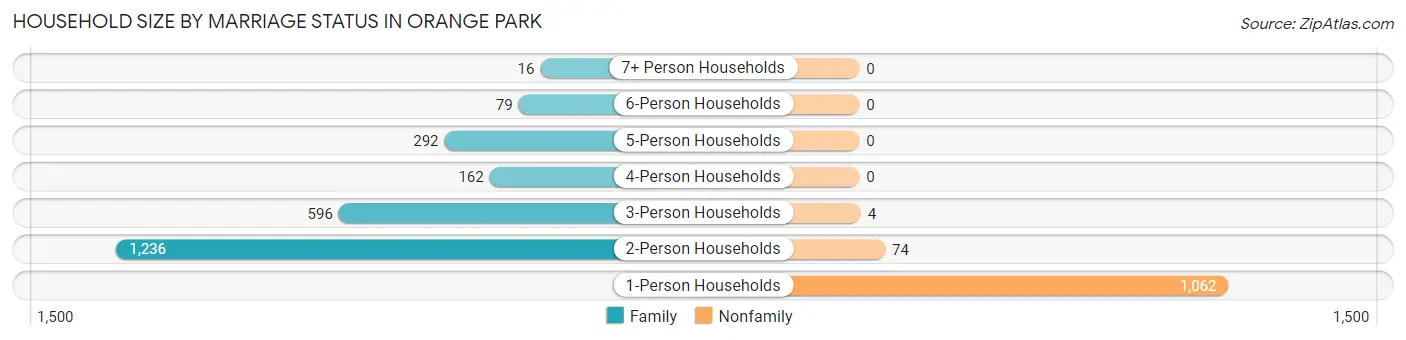
Household Size by Marriage Status in Orange Park
Out of a total of 3,521 households in Orange Park, 2,381 (67.6%) are family households, while 1,140 (32.4%) are nonfamily households. The most numerous type of family households are 2-person households, comprising 1,236, and the most common type of nonfamily households are 1-person households, comprising 1,062.
| Household Size | Family Households | Nonfamily Households |
| 1-Person Households | - | 1,062 (30.2%) |
| 2-Person Households | 1,236 (35.1%) | 74 (2.1%) |
| 3-Person Households | 596 (16.9%) | 4 (0.1%) |
| 4-Person Households | 162 (4.6%) | 0 (0.0%) |
| 5-Person Households | 292 (8.3%) | 0 (0.0%) |
| 6-Person Households | 79 (2.2%) | 0 (0.0%) |
| 7+ Person Households | 16 (0.4%) | 0 (0.0%) |
| Total | 2,381 (67.6%) | 1,140 (32.4%) |
Female Fertility in Orange Park
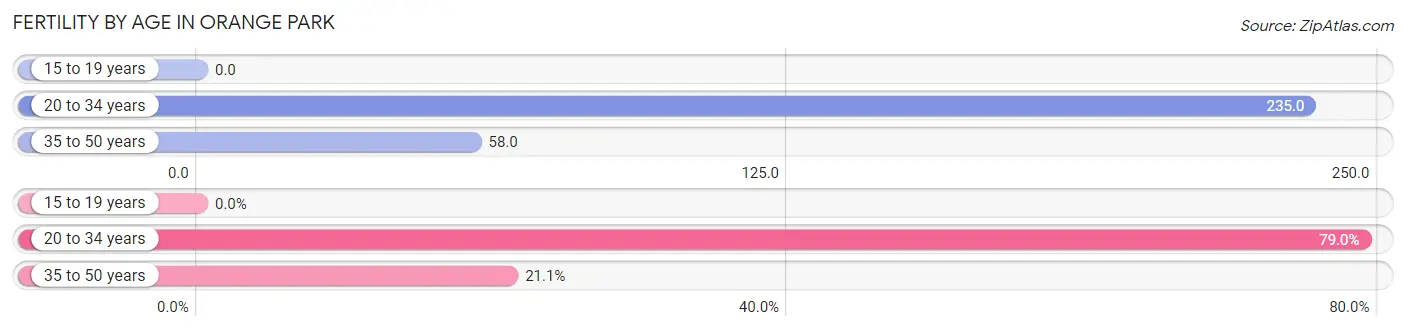
Fertility by Age in Orange Park
Average fertility rate in Orange Park is 123.0 births per 1,000 women. Women in the age bracket of 20 to 34 years have the highest fertility rate with 235.0 births per 1,000 women. Women in the age bracket of 20 to 34 years acount for 78.9% of all women with births.
| Age Bracket | Women with Births | Births / 1,000 Women |
| 15 to 19 years | 0 (0.0%) | 0.0 |
| 20 to 34 years | 165 (78.9%) | 235.0 |
| 35 to 50 years | 44 (21.0%) | 58.0 |
| Total | 209 (100.0%) | 123.0 |
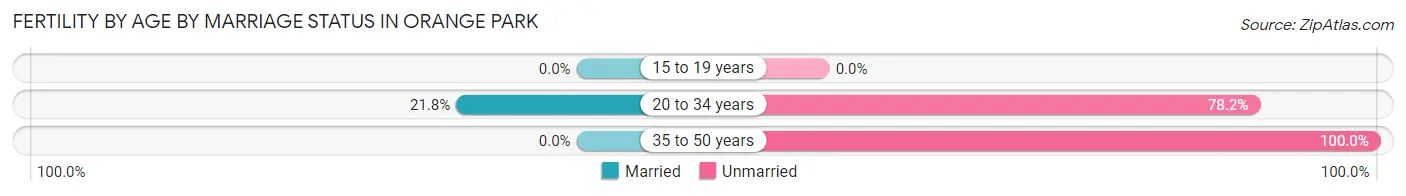
Fertility by Age by Marriage Status in Orange Park
17.2% of women with births (209) in Orange Park are married. The highest percentage of unmarried women with births falls into 35 to 50 years age bracket with 100.0% of them unmarried at the time of birth, while the lowest percentage of unmarried women with births belong to 20 to 34 years age bracket with 78.2% of them unmarried.
| Age Bracket | Married | Unmarried |
| 15 to 19 years | 0 (0.0%) | 0 (0.0%) |
| 20 to 34 years | 36 (21.8%) | 129 (78.2%) |
| 35 to 50 years | 0 (0.0%) | 44 (100.0%) |
| Total | 36 (17.2%) | 173 (82.8%) |
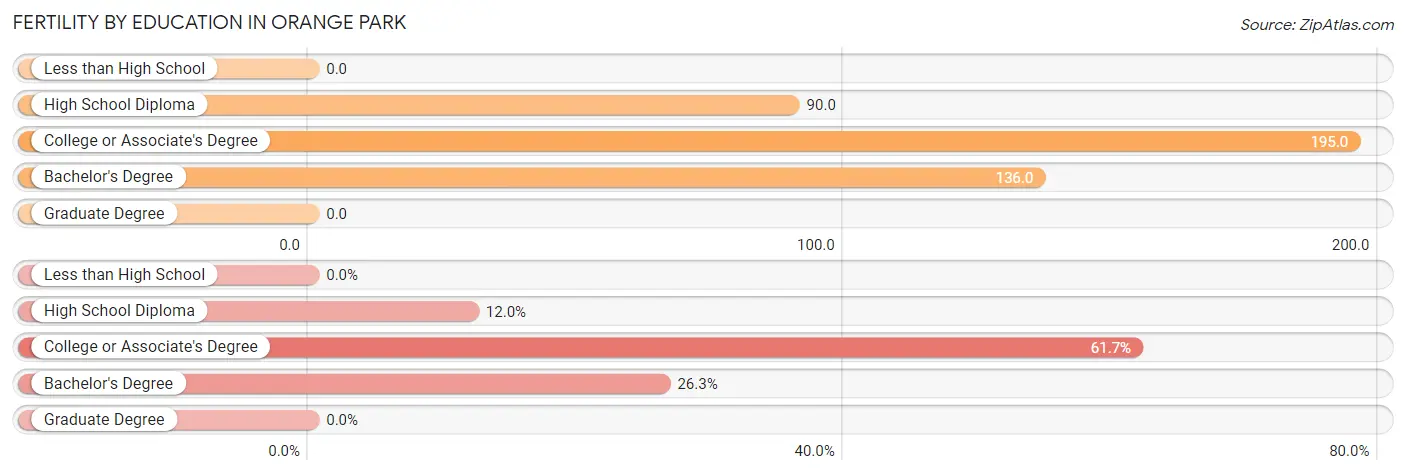
Fertility by Education in Orange Park
| Educational Attainment | Women with Births | Births / 1,000 Women |
| Less than High School | 0 (0.0%) | 0.0 |
| High School Diploma | 25 (12.0%) | 90.0 |
| College or Associate's Degree | 129 (61.7%) | 195.0 |
| Bachelor's Degree | 55 (26.3%) | 136.0 |
| Graduate Degree | 0 (0.0%) | 0.0 |
| Total | 209 (100.0%) | 123.0 |
Fertility by Education by Marriage Status in Orange Park
82.8% of women with births in Orange Park are unmarried. Women with the educational attainment of high school diploma are most likely to be married with 100.0% of them married at childbirth, while women with the educational attainment of college or associate's degree are least likely to be married with 100.0% of them unmarried at childbirth.
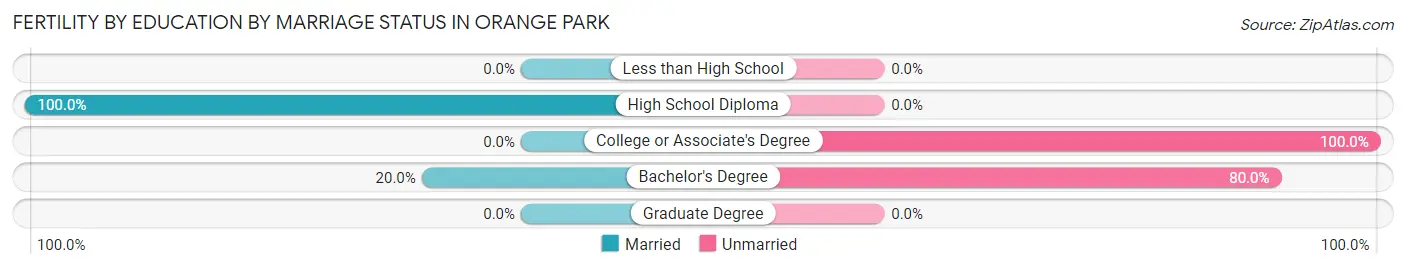
| Educational Attainment | Married | Unmarried |
| Less than High School | 0 (0.0%) | 0 (0.0%) |
| High School Diploma | 25 (100.0%) | 0 (0.0%) |
| College or Associate's Degree | 0 (0.0%) | 129 (100.0%) |
| Bachelor's Degree | 11 (20.0%) | 44 (80.0%) |
| Graduate Degree | 0 (0.0%) | 0 (0.0%) |
| Total | 36 (17.2%) | 173 (82.8%) |
Employment Characteristics in Orange Park
Employment by Class of Employer in Orange Park
Among the 4,354 employed individuals in Orange Park, private company employees (2,987 | 68.6%), not-for-profit organizations (464 | 10.7%), and self-employed (incorporated) (218 | 5.0%) make up the most common classes of employment.
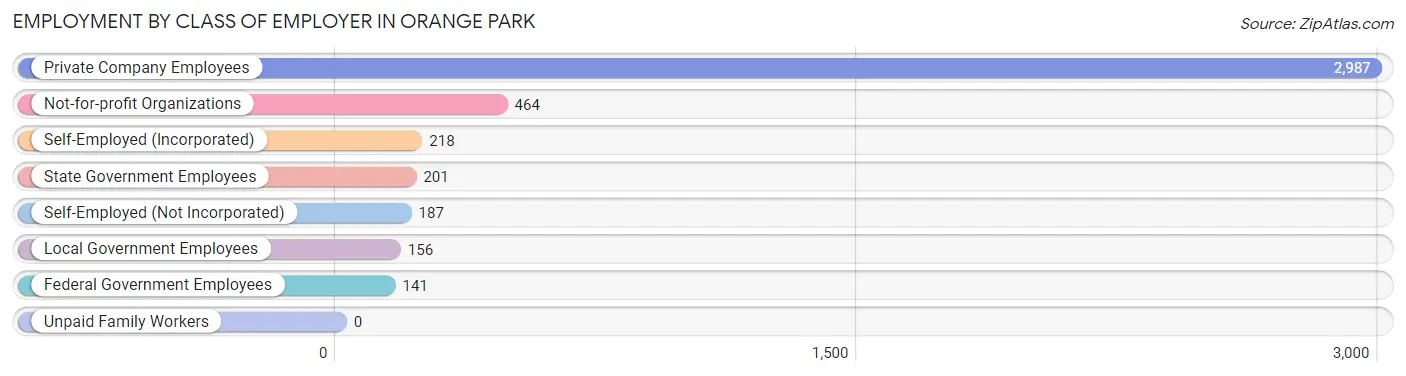
| Employer Class | # Employees | % Employees |
| Private Company Employees | 2,987 | 68.6% |
| Self-Employed (Incorporated) | 218 | 5.0% |
| Self-Employed (Not Incorporated) | 187 | 4.3% |
| Not-for-profit Organizations | 464 | 10.7% |
| Local Government Employees | 156 | 3.6% |
| State Government Employees | 201 | 4.6% |
| Federal Government Employees | 141 | 3.2% |
| Unpaid Family Workers | 0 | 0.0% |
| Total | 4,354 | 100.0% |
Employment Status by Age in Orange Park
According to the labor force statistics for Orange Park, out of the total population over 16 years of age (7,643), 61.2% or 4,678 individuals are in the labor force, with 5.6% or 262 of them unemployed. The age group with the highest labor force participation rate is 35 to 44 years, with 95.3% or 965 individuals in the labor force. Within the labor force, the 16 to 19 years age range has the highest percentage of unemployed individuals, with 50.3% or 91 of them being unemployed.
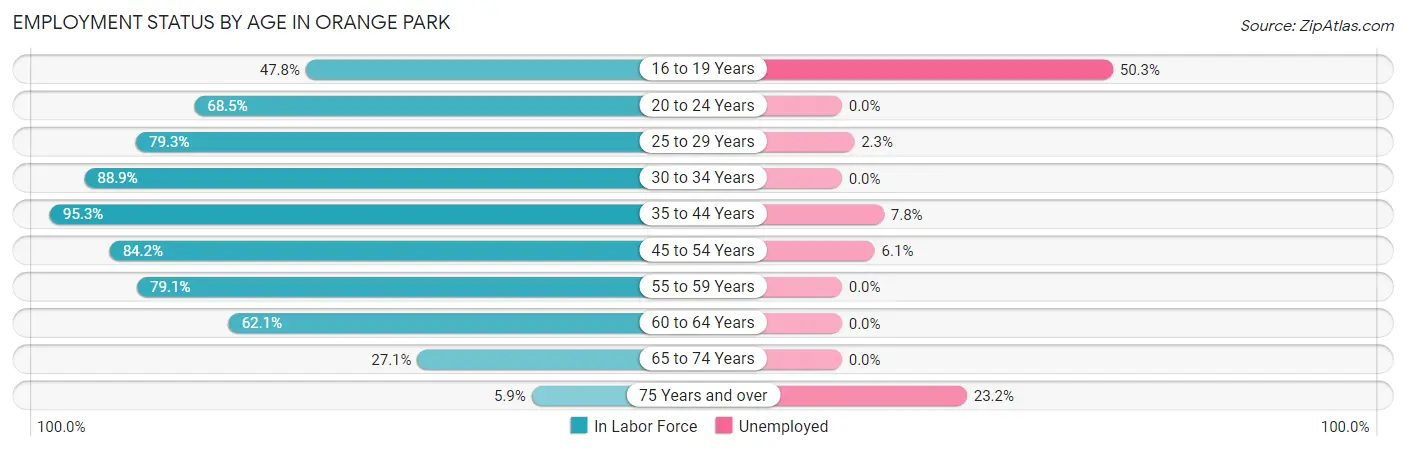
| Age Bracket | In Labor Force | Unemployed |
| 16 to 19 Years | 181 (47.8%) | 91 (50.3%) |
| 20 to 24 Years | 202 (68.5%) | 0 (0.0%) |
| 25 to 29 Years | 706 (79.3%) | 16 (2.3%) |
| 30 to 34 Years | 455 (88.9%) | 0 (0.0%) |
| 35 to 44 Years | 965 (95.3%) | 75 (7.8%) |
| 45 to 54 Years | 1,026 (84.2%) | 63 (6.1%) |
| 55 to 59 Years | 364 (79.1%) | 0 (0.0%) |
| 60 to 64 Years | 436 (62.1%) | 0 (0.0%) |
| 65 to 74 Years | 272 (27.1%) | 0 (0.0%) |
| 75 Years and over | 69 (5.9%) | 16 (23.2%) |
| Total | 4,678 (61.2%) | 262 (5.6%) |
Employment Status by Educational Attainment in Orange Park
According to labor force statistics for Orange Park, 82.4% of individuals (3,951) out of the total population between 25 and 64 years of age (4,795) are in the labor force, with 3.9% or 154 of them being unemployed. The group with the highest labor force participation rate are those with the educational attainment of bachelor's degree or higher, with 91.0% or 1,158 individuals in the labor force. Within the labor force, individuals with high school diploma education have the highest percentage of unemployment, with 13.5% or 118 of them being unemployed.
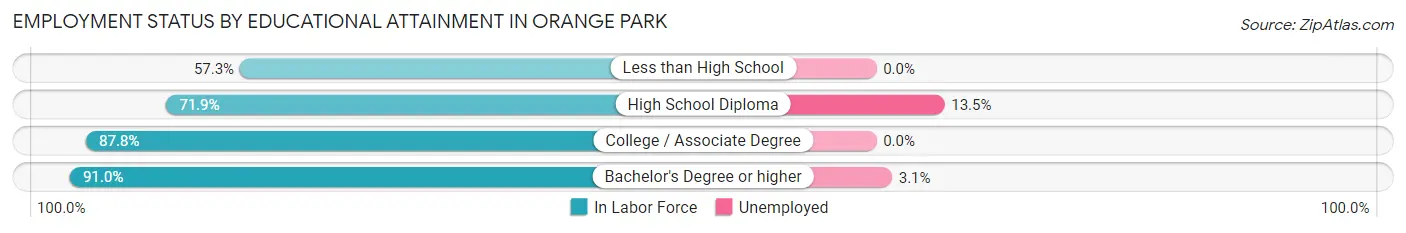
| Educational Attainment | In Labor Force | Unemployed |
| Less than High School | 196 (57.3%) | 0 (0.0%) |
| High School Diploma | 876 (71.9%) | 165 (13.5%) |
| College / Associate Degree | 1,722 (87.8%) | 0 (0.0%) |
| Bachelor's Degree or higher | 1,158 (91.0%) | 39 (3.1%) |
| Total | 3,951 (82.4%) | 187 (3.9%) |
Employment Occupations by Sex in Orange Park
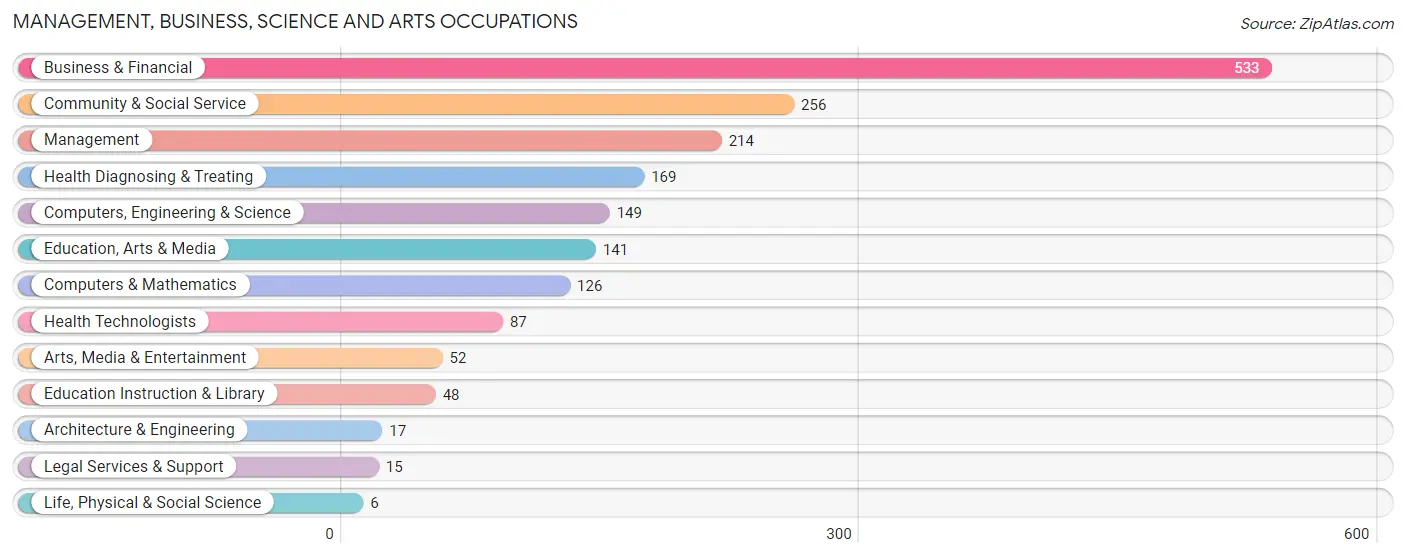
Management, Business, Science and Arts Occupations
The most common Management, Business, Science and Arts occupations in Orange Park are Business & Financial (533 | 12.1%), Community & Social Service (256 | 5.8%), Management (214 | 4.9%), Health Diagnosing & Treating (169 | 3.8%), and Computers, Engineering & Science (149 | 3.4%).
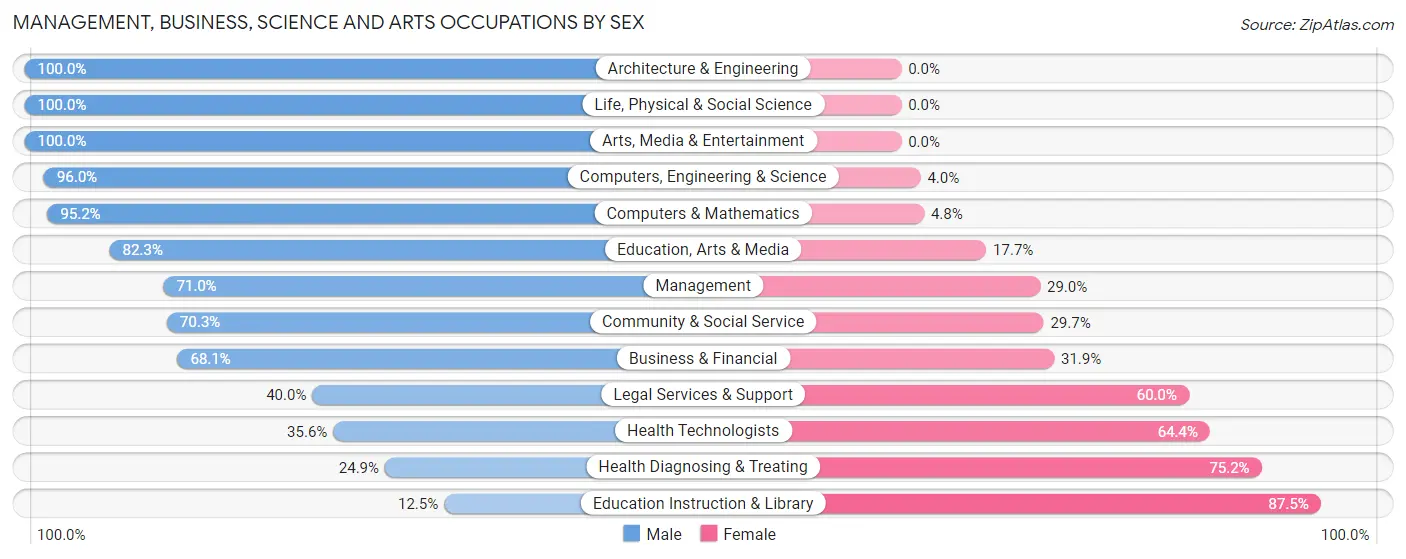
Management, Business, Science and Arts Occupations by Sex
Within the Management, Business, Science and Arts occupations in Orange Park, the most male-oriented occupations are Architecture & Engineering (100.0%), Life, Physical & Social Science (100.0%), and Arts, Media & Entertainment (100.0%), while the most female-oriented occupations are Education Instruction & Library (87.5%), Health Diagnosing & Treating (75.1%), and Health Technologists (64.4%).
| Occupation | Male | Female |
| Management | 152 (71.0%) | 62 (29.0%) |
| Business & Financial | 363 (68.1%) | 170 (31.9%) |
| Computers, Engineering & Science | 143 (96.0%) | 6 (4.0%) |
| Computers & Mathematics | 120 (95.2%) | 6 (4.8%) |
| Architecture & Engineering | 17 (100.0%) | 0 (0.0%) |
| Life, Physical & Social Science | 6 (100.0%) | 0 (0.0%) |
| Community & Social Service | 180 (70.3%) | 76 (29.7%) |
| Education, Arts & Media | 116 (82.3%) | 25 (17.7%) |
| Legal Services & Support | 6 (40.0%) | 9 (60.0%) |
| Education Instruction & Library | 6 (12.5%) | 42 (87.5%) |
| Arts, Media & Entertainment | 52 (100.0%) | 0 (0.0%) |
| Health Diagnosing & Treating | 42 (24.8%) | 127 (75.1%) |
| Health Technologists | 31 (35.6%) | 56 (64.4%) |
| Total (Category) | 880 (66.6%) | 441 (33.4%) |
| Total (Overall) | 2,536 (57.7%) | 1,860 (42.3%) |
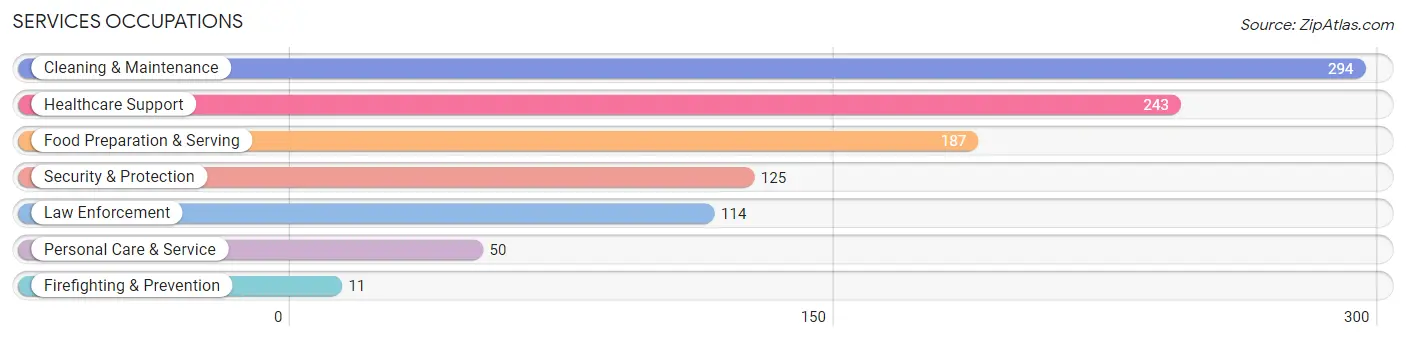
Services Occupations
The most common Services occupations in Orange Park are Cleaning & Maintenance (294 | 6.7%), Healthcare Support (243 | 5.5%), Food Preparation & Serving (187 | 4.3%), Security & Protection (125 | 2.8%), and Law Enforcement (114 | 2.6%).
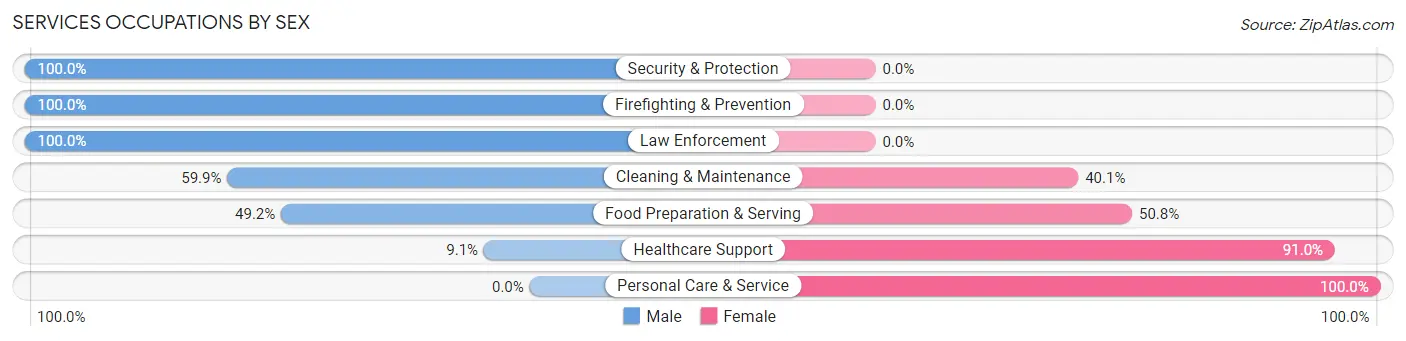
Services Occupations by Sex
Within the Services occupations in Orange Park, the most male-oriented occupations are Security & Protection (100.0%), Firefighting & Prevention (100.0%), and Law Enforcement (100.0%), while the most female-oriented occupations are Personal Care & Service (100.0%), Healthcare Support (90.9%), and Food Preparation & Serving (50.8%).
| Occupation | Male | Female |
| Healthcare Support | 22 (9.0%) | 221 (90.9%) |
| Security & Protection | 125 (100.0%) | 0 (0.0%) |
| Firefighting & Prevention | 11 (100.0%) | 0 (0.0%) |
| Law Enforcement | 114 (100.0%) | 0 (0.0%) |
| Food Preparation & Serving | 92 (49.2%) | 95 (50.8%) |
| Cleaning & Maintenance | 176 (59.9%) | 118 (40.1%) |
| Personal Care & Service | 0 (0.0%) | 50 (100.0%) |
| Total (Category) | 415 (46.2%) | 484 (53.8%) |
| Total (Overall) | 2,536 (57.7%) | 1,860 (42.3%) |
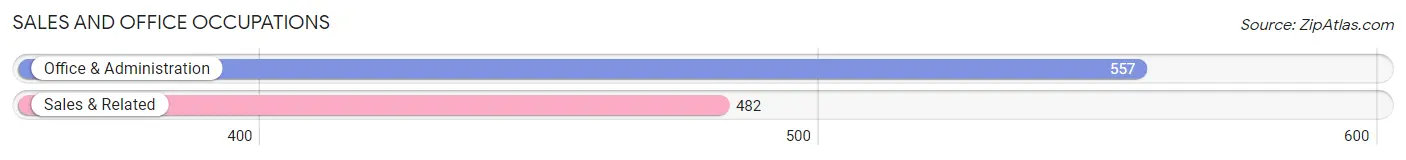
Sales and Office Occupations
The most common Sales and Office occupations in Orange Park are Office & Administration (557 | 12.7%), and Sales & Related (482 | 11.0%).
Sales and Office Occupations by Sex
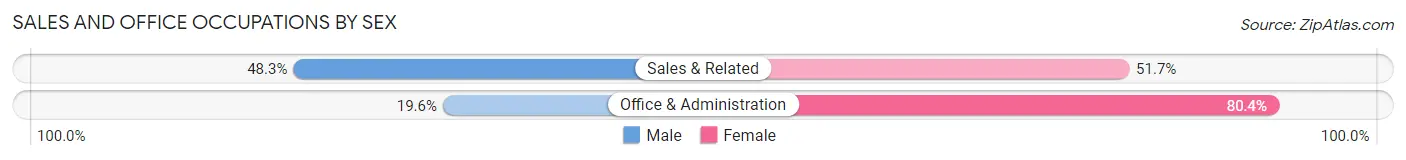
| Occupation | Male | Female |
| Sales & Related | 233 (48.3%) | 249 (51.7%) |
| Office & Administration | 109 (19.6%) | 448 (80.4%) |
| Total (Category) | 342 (32.9%) | 697 (67.1%) |
| Total (Overall) | 2,536 (57.7%) | 1,860 (42.3%) |
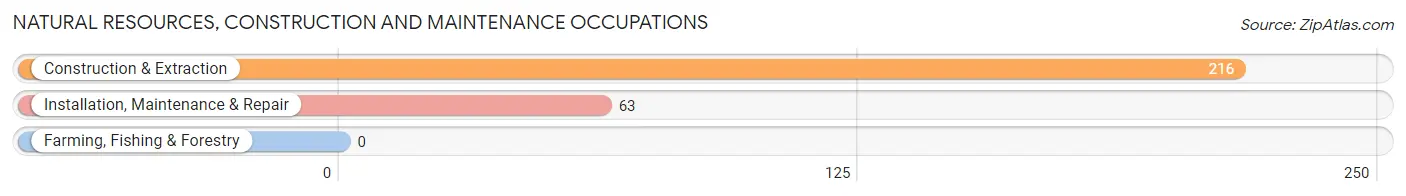
Natural Resources, Construction and Maintenance Occupations
The most common Natural Resources, Construction and Maintenance occupations in Orange Park are Construction & Extraction (216 | 4.9%), and Installation, Maintenance & Repair (63 | 1.4%).
Natural Resources, Construction and Maintenance Occupations by Sex
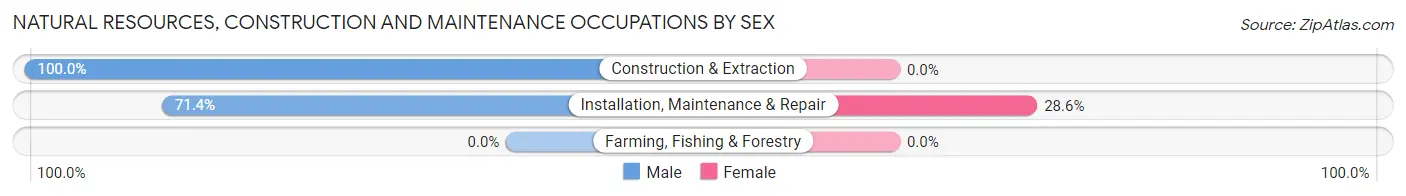
| Occupation | Male | Female |
| Farming, Fishing & Forestry | 0 (0.0%) | 0 (0.0%) |
| Construction & Extraction | 216 (100.0%) | 0 (0.0%) |
| Installation, Maintenance & Repair | 45 (71.4%) | 18 (28.6%) |
| Total (Category) | 261 (93.5%) | 18 (6.5%) |
| Total (Overall) | 2,536 (57.7%) | 1,860 (42.3%) |
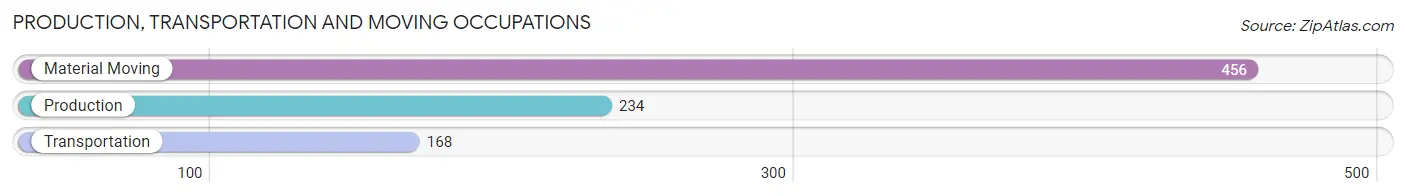
Production, Transportation and Moving Occupations
The most common Production, Transportation and Moving occupations in Orange Park are Material Moving (456 | 10.4%), Production (234 | 5.3%), and Transportation (168 | 3.8%).
Production, Transportation and Moving Occupations by Sex
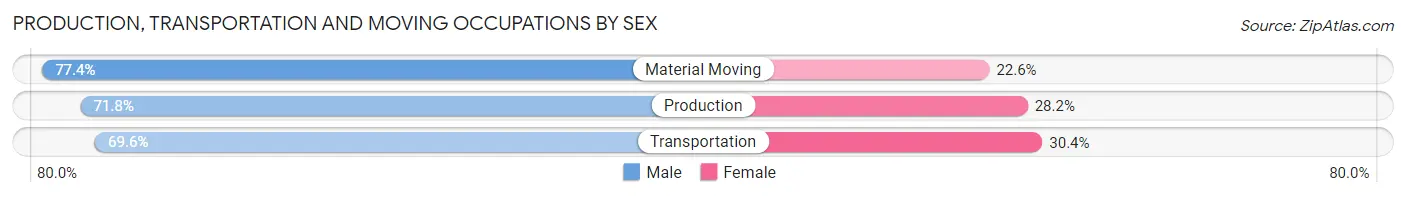
| Occupation | Male | Female |
| Production | 168 (71.8%) | 66 (28.2%) |
| Transportation | 117 (69.6%) | 51 (30.4%) |
| Material Moving | 353 (77.4%) | 103 (22.6%) |
| Total (Category) | 638 (74.4%) | 220 (25.6%) |
| Total (Overall) | 2,536 (57.7%) | 1,860 (42.3%) |
Employment Industries by Sex in Orange Park
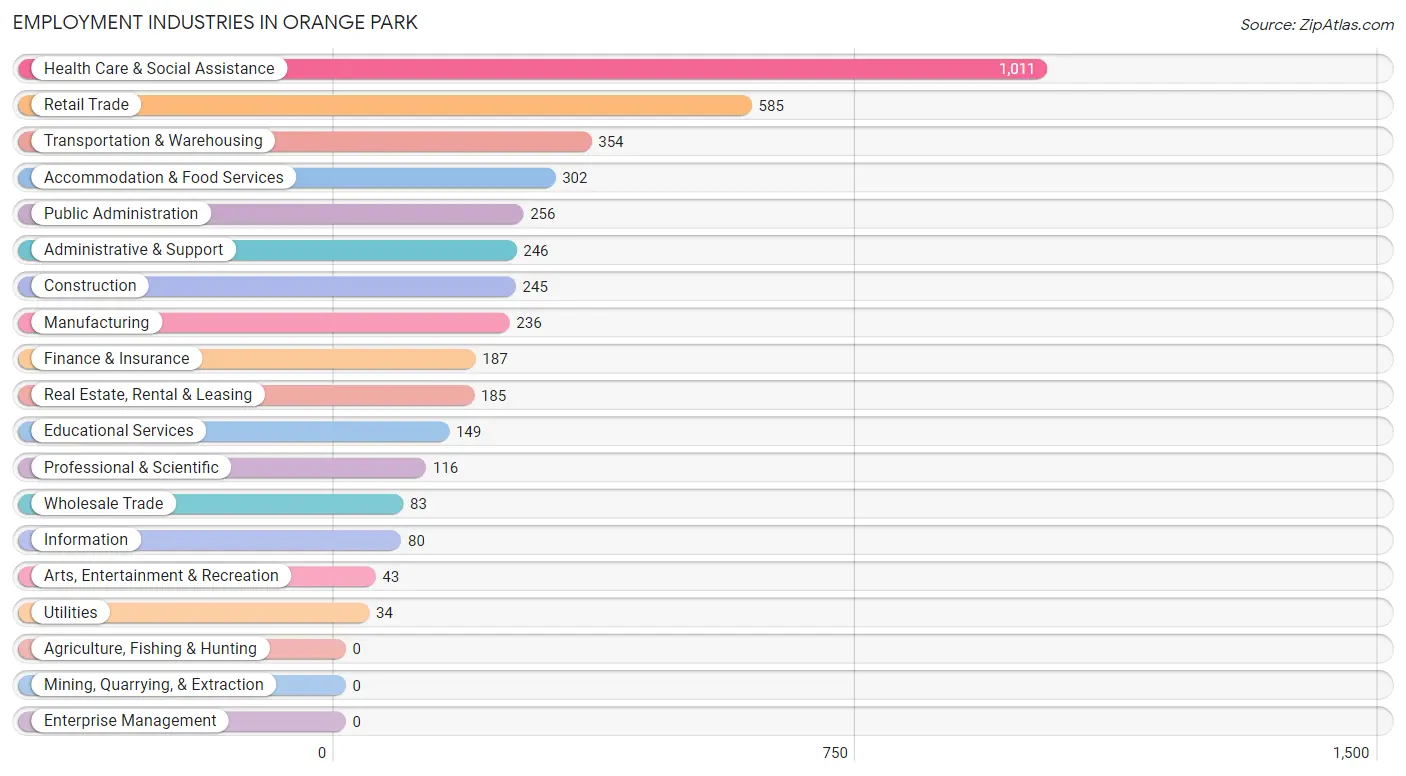
Employment Industries in Orange Park
The major employment industries in Orange Park include Health Care & Social Assistance (1,011 | 23.0%), Retail Trade (585 | 13.3%), Transportation & Warehousing (354 | 8.1%), Accommodation & Food Services (302 | 6.9%), and Public Administration (256 | 5.8%).
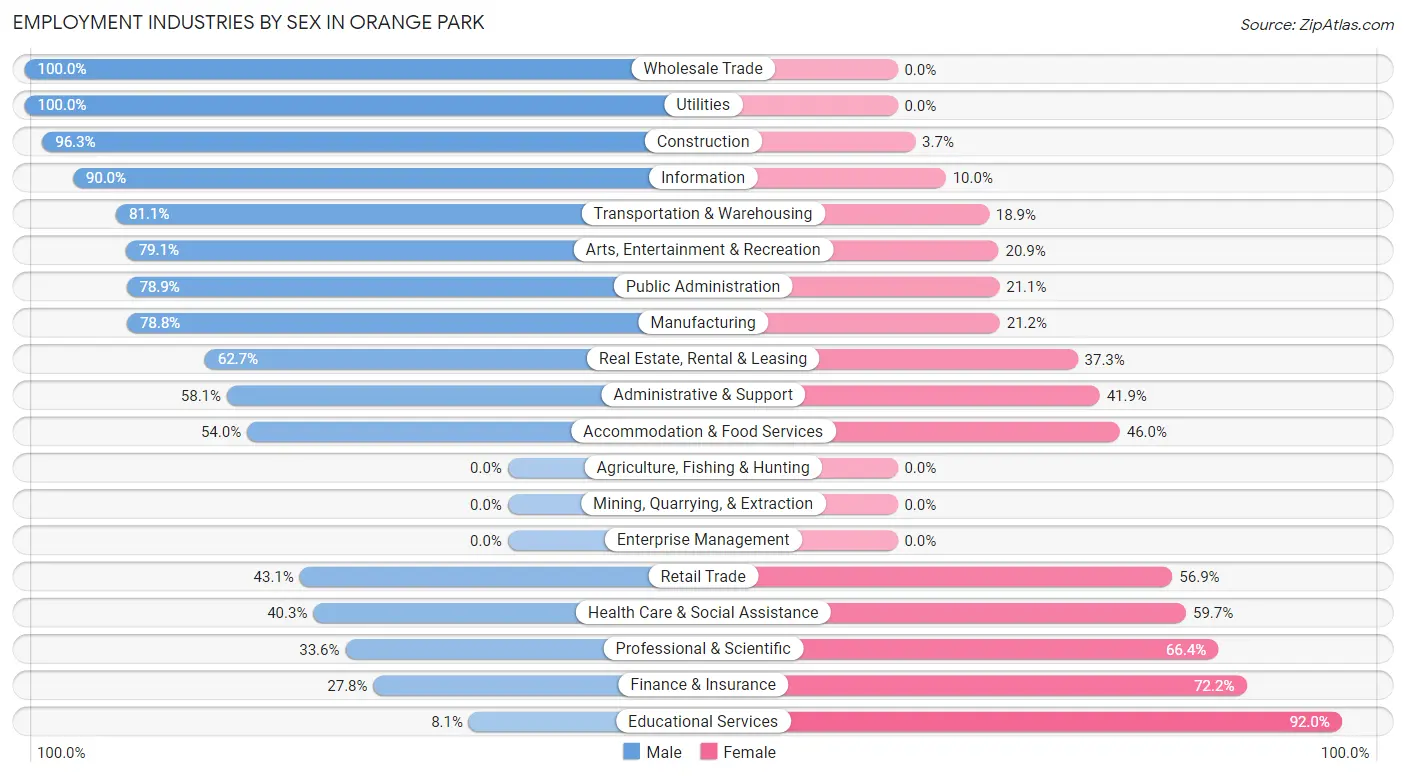
Employment Industries by Sex in Orange Park
The Orange Park industries that see more men than women are Wholesale Trade (100.0%), Utilities (100.0%), and Construction (96.3%), whereas the industries that tend to have a higher number of women are Educational Services (91.9%), Finance & Insurance (72.2%), and Professional & Scientific (66.4%).
| Industry | Male | Female |
| Agriculture, Fishing & Hunting | 0 (0.0%) | 0 (0.0%) |
| Mining, Quarrying, & Extraction | 0 (0.0%) | 0 (0.0%) |
| Construction | 236 (96.3%) | 9 (3.7%) |
| Manufacturing | 186 (78.8%) | 50 (21.2%) |
| Wholesale Trade | 83 (100.0%) | 0 (0.0%) |
| Retail Trade | 252 (43.1%) | 333 (56.9%) |
| Transportation & Warehousing | 287 (81.1%) | 67 (18.9%) |
| Utilities | 34 (100.0%) | 0 (0.0%) |
| Information | 72 (90.0%) | 8 (10.0%) |
| Finance & Insurance | 52 (27.8%) | 135 (72.2%) |
| Real Estate, Rental & Leasing | 116 (62.7%) | 69 (37.3%) |
| Professional & Scientific | 39 (33.6%) | 77 (66.4%) |
| Enterprise Management | 0 (0.0%) | 0 (0.0%) |
| Administrative & Support | 143 (58.1%) | 103 (41.9%) |
| Educational Services | 12 (8.1%) | 137 (91.9%) |
| Health Care & Social Assistance | 407 (40.3%) | 604 (59.7%) |
| Arts, Entertainment & Recreation | 34 (79.1%) | 9 (20.9%) |
| Accommodation & Food Services | 163 (54.0%) | 139 (46.0%) |
| Public Administration | 202 (78.9%) | 54 (21.1%) |
| Total | 2,536 (57.7%) | 1,860 (42.3%) |
Education in Orange Park
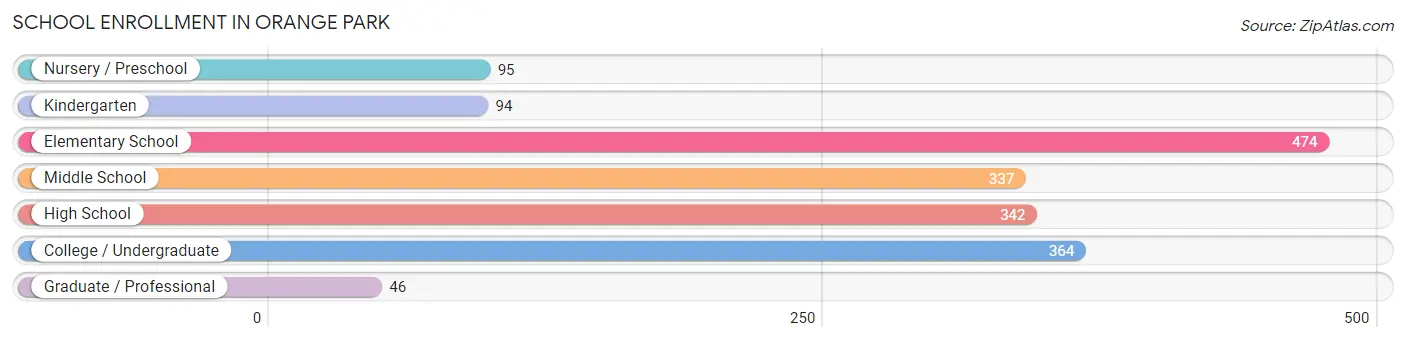
School Enrollment in Orange Park
The most common levels of schooling among the 1,752 students in Orange Park are elementary school (474 | 27.1%), college / undergraduate (364 | 20.8%), and high school (342 | 19.5%).
| School Level | # Students | % Students |
| Nursery / Preschool | 95 | 5.4% |
| Kindergarten | 94 | 5.4% |
| Elementary School | 474 | 27.1% |
| Middle School | 337 | 19.2% |
| High School | 342 | 19.5% |
| College / Undergraduate | 364 | 20.8% |
| Graduate / Professional | 46 | 2.6% |
| Total | 1,752 | 100.0% |
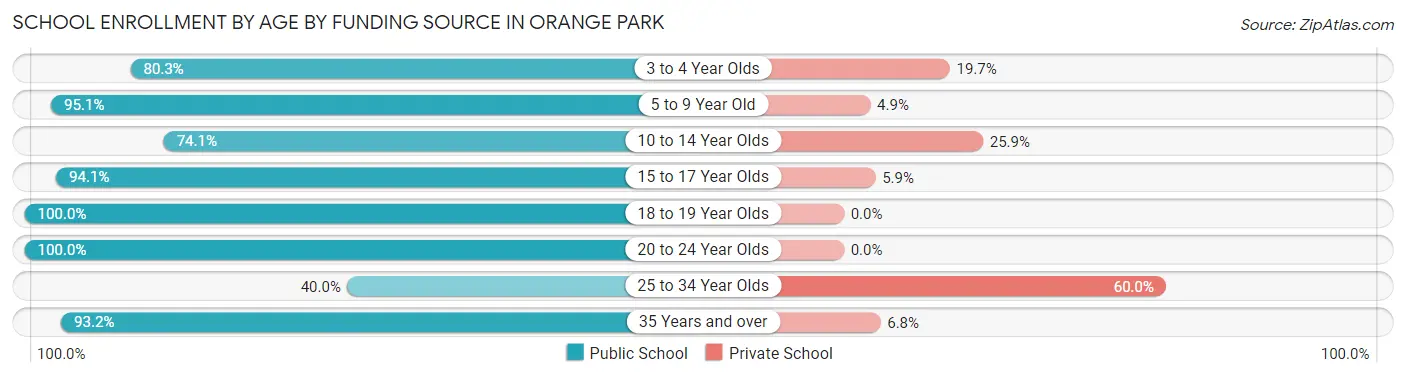
School Enrollment by Age by Funding Source in Orange Park
Out of a total of 1,752 students who are enrolled in schools in Orange Park, 315 (18.0%) attend a private institution, while the remaining 1,437 (82.0%) are enrolled in public schools. The age group of 25 to 34 year olds has the highest likelihood of being enrolled in private schools, with 108 (60.0% in the age bracket) enrolled. Conversely, the age group of 18 to 19 year olds has the lowest likelihood of being enrolled in a private school, with 30 (100.0% in the age bracket) attending a public institution.
| Age Bracket | Public School | Private School |
| 3 to 4 Year Olds | 57 (80.3%) | 14 (19.7%) |
| 5 to 9 Year Old | 347 (95.1%) | 18 (4.9%) |
| 10 to 14 Year Olds | 423 (74.1%) | 148 (25.9%) |
| 15 to 17 Year Olds | 304 (94.1%) | 19 (5.9%) |
| 18 to 19 Year Olds | 30 (100.0%) | 0 (0.0%) |
| 20 to 24 Year Olds | 80 (100.0%) | 0 (0.0%) |
| 25 to 34 Year Olds | 72 (40.0%) | 108 (60.0%) |
| 35 Years and over | 123 (93.2%) | 9 (6.8%) |
| Total | 1,437 (82.0%) | 315 (18.0%) |
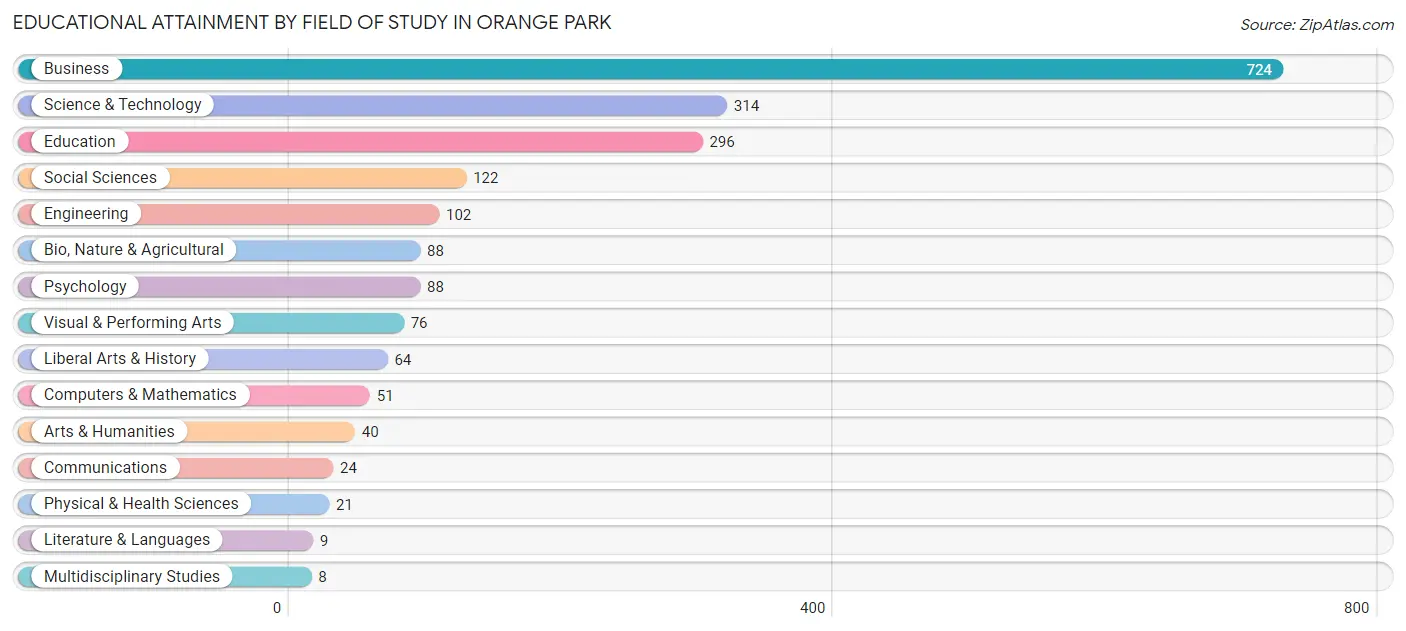
Educational Attainment by Field of Study in Orange Park
Business (724 | 35.7%), science & technology (314 | 15.5%), education (296 | 14.6%), social sciences (122 | 6.0%), and engineering (102 | 5.0%) are the most common fields of study among 2,027 individuals in Orange Park who have obtained a bachelor's degree or higher.
| Field of Study | # Graduates | % Graduates |
| Computers & Mathematics | 51 | 2.5% |
| Bio, Nature & Agricultural | 88 | 4.3% |
| Physical & Health Sciences | 21 | 1.0% |
| Psychology | 88 | 4.3% |
| Social Sciences | 122 | 6.0% |
| Engineering | 102 | 5.0% |
| Multidisciplinary Studies | 8 | 0.4% |
| Science & Technology | 314 | 15.5% |
| Business | 724 | 35.7% |
| Education | 296 | 14.6% |
| Literature & Languages | 9 | 0.4% |
| Liberal Arts & History | 64 | 3.2% |
| Visual & Performing Arts | 76 | 3.7% |
| Communications | 24 | 1.2% |
| Arts & Humanities | 40 | 2.0% |
| Total | 2,027 | 100.0% |
Transportation & Commute in Orange Park
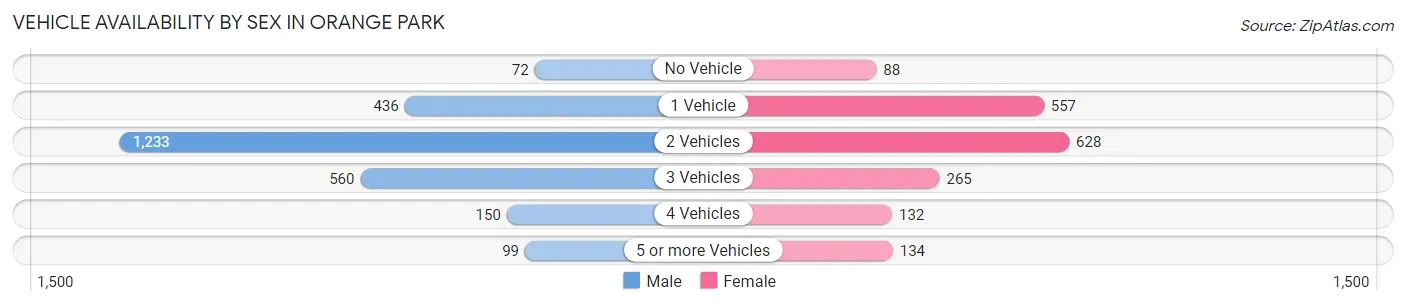
Vehicle Availability by Sex in Orange Park
The most prevalent vehicle ownership categories in Orange Park are males with 2 vehicles (1,233, accounting for 48.3%) and females with 2 vehicles (628, making up 68.3%).
| Vehicles Available | Male | Female |
| No Vehicle | 72 (2.8%) | 88 (4.9%) |
| 1 Vehicle | 436 (17.1%) | 557 (30.9%) |
| 2 Vehicles | 1,233 (48.3%) | 628 (34.8%) |
| 3 Vehicles | 560 (22.0%) | 265 (14.7%) |
| 4 Vehicles | 150 (5.9%) | 132 (7.3%) |
| 5 or more Vehicles | 99 (3.9%) | 134 (7.4%) |
| Total | 2,550 (100.0%) | 1,804 (100.0%) |
Commute Time in Orange Park
The most frequently occuring commute durations in Orange Park are 30 to 34 minutes (1,114 commuters, 27.4%), 20 to 24 minutes (625 commuters, 15.4%), and 10 to 14 minutes (512 commuters, 12.6%).
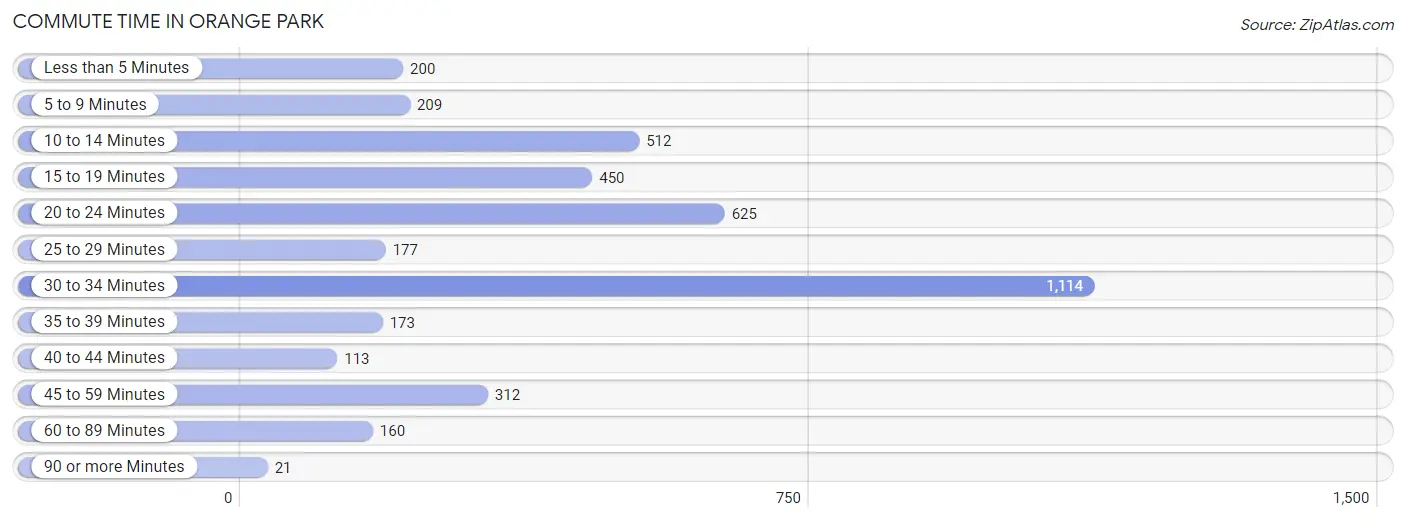
| Commute Time | # Commuters | % Commuters |
| Less than 5 Minutes | 200 | 4.9% |
| 5 to 9 Minutes | 209 | 5.1% |
| 10 to 14 Minutes | 512 | 12.6% |
| 15 to 19 Minutes | 450 | 11.1% |
| 20 to 24 Minutes | 625 | 15.4% |
| 25 to 29 Minutes | 177 | 4.3% |
| 30 to 34 Minutes | 1,114 | 27.4% |
| 35 to 39 Minutes | 173 | 4.3% |
| 40 to 44 Minutes | 113 | 2.8% |
| 45 to 59 Minutes | 312 | 7.7% |
| 60 to 89 Minutes | 160 | 3.9% |
| 90 or more Minutes | 21 | 0.5% |
Commute Time by Sex in Orange Park
The most common commute times in Orange Park are 30 to 34 minutes (651 commuters, 26.9%) for males and 30 to 34 minutes (463 commuters, 28.2%) for females.
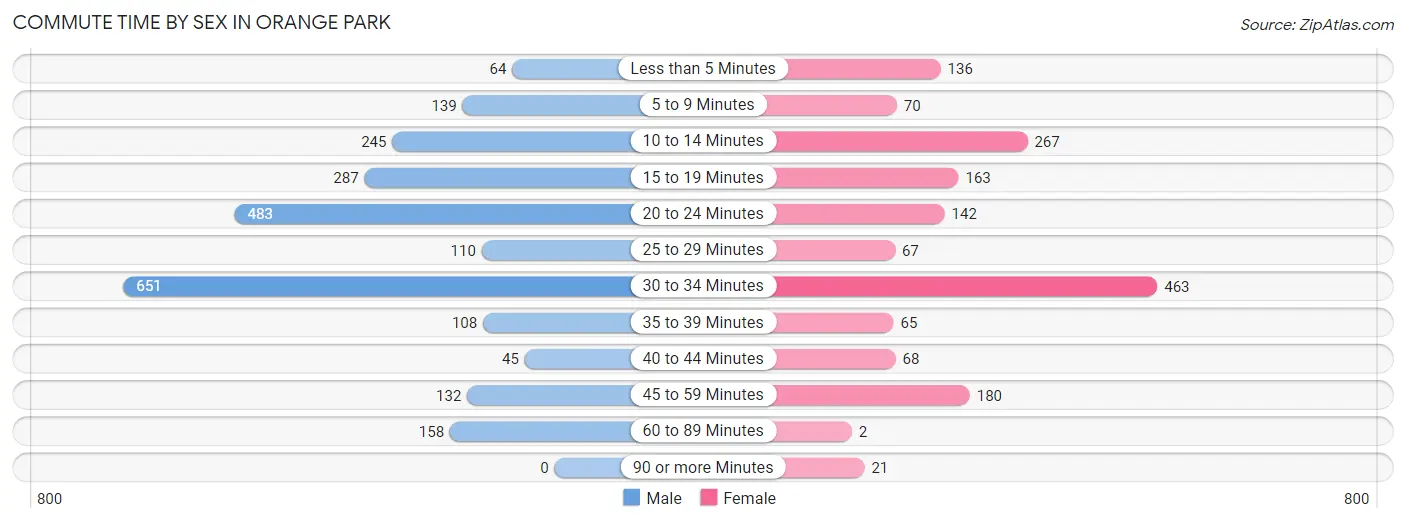
| Commute Time | Male | Female |
| Less than 5 Minutes | 64 (2.6%) | 136 (8.3%) |
| 5 to 9 Minutes | 139 (5.7%) | 70 (4.3%) |
| 10 to 14 Minutes | 245 (10.1%) | 267 (16.2%) |
| 15 to 19 Minutes | 287 (11.8%) | 163 (9.9%) |
| 20 to 24 Minutes | 483 (19.9%) | 142 (8.6%) |
| 25 to 29 Minutes | 110 (4.5%) | 67 (4.1%) |
| 30 to 34 Minutes | 651 (26.9%) | 463 (28.2%) |
| 35 to 39 Minutes | 108 (4.5%) | 65 (4.0%) |
| 40 to 44 Minutes | 45 (1.9%) | 68 (4.1%) |
| 45 to 59 Minutes | 132 (5.4%) | 180 (11.0%) |
| 60 to 89 Minutes | 158 (6.5%) | 2 (0.1%) |
| 90 or more Minutes | 0 (0.0%) | 21 (1.3%) |
Time of Departure to Work by Sex in Orange Park
The most frequent times of departure to work in Orange Park are 8:30 AM to 8:59 AM (599, 24.7%) for males and 6:00 AM to 6:29 AM (327, 19.9%) for females.
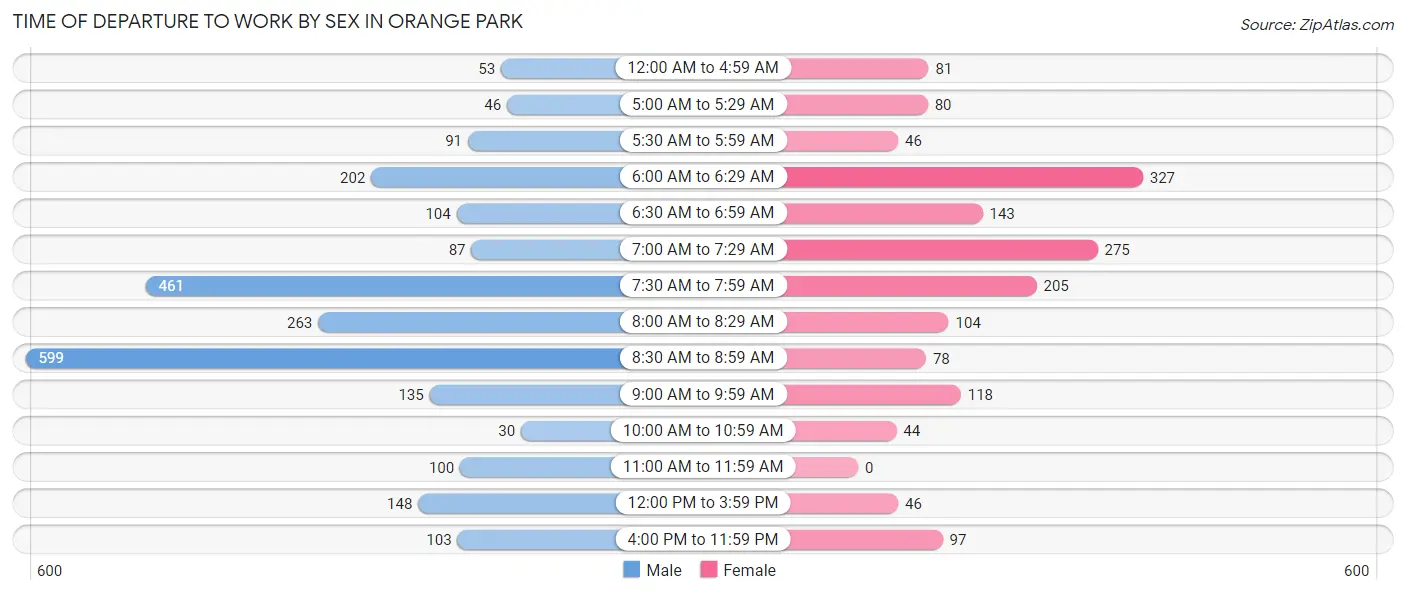
| Time of Departure | Male | Female |
| 12:00 AM to 4:59 AM | 53 (2.2%) | 81 (4.9%) |
| 5:00 AM to 5:29 AM | 46 (1.9%) | 80 (4.9%) |
| 5:30 AM to 5:59 AM | 91 (3.8%) | 46 (2.8%) |
| 6:00 AM to 6:29 AM | 202 (8.3%) | 327 (19.9%) |
| 6:30 AM to 6:59 AM | 104 (4.3%) | 143 (8.7%) |
| 7:00 AM to 7:29 AM | 87 (3.6%) | 275 (16.7%) |
| 7:30 AM to 7:59 AM | 461 (19.0%) | 205 (12.5%) |
| 8:00 AM to 8:29 AM | 263 (10.9%) | 104 (6.3%) |
| 8:30 AM to 8:59 AM | 599 (24.7%) | 78 (4.7%) |
| 9:00 AM to 9:59 AM | 135 (5.6%) | 118 (7.2%) |
| 10:00 AM to 10:59 AM | 30 (1.2%) | 44 (2.7%) |
| 11:00 AM to 11:59 AM | 100 (4.1%) | 0 (0.0%) |
| 12:00 PM to 3:59 PM | 148 (6.1%) | 46 (2.8%) |
| 4:00 PM to 11:59 PM | 103 (4.3%) | 97 (5.9%) |
| Total | 2,422 (100.0%) | 1,644 (100.0%) |
Housing Occupancy in Orange Park
Occupancy by Ownership in Orange Park
Of the total 3,521 dwellings in Orange Park, owner-occupied units account for 2,118 (60.2%), while renter-occupied units make up 1,403 (39.9%).
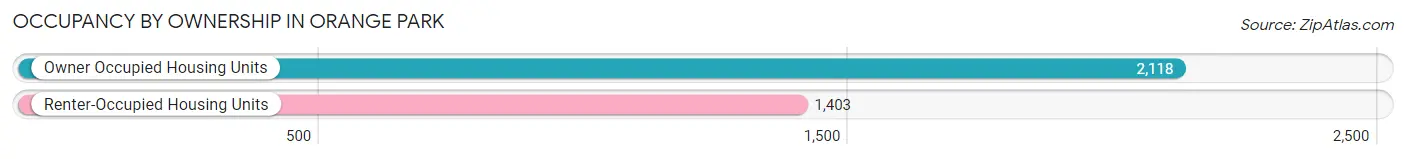
| Occupancy | # Housing Units | % Housing Units |
| Owner Occupied Housing Units | 2,118 | 60.2% |
| Renter-Occupied Housing Units | 1,403 | 39.9% |
| Total Occupied Housing Units | 3,521 | 100.0% |
Occupancy by Household Size in Orange Park
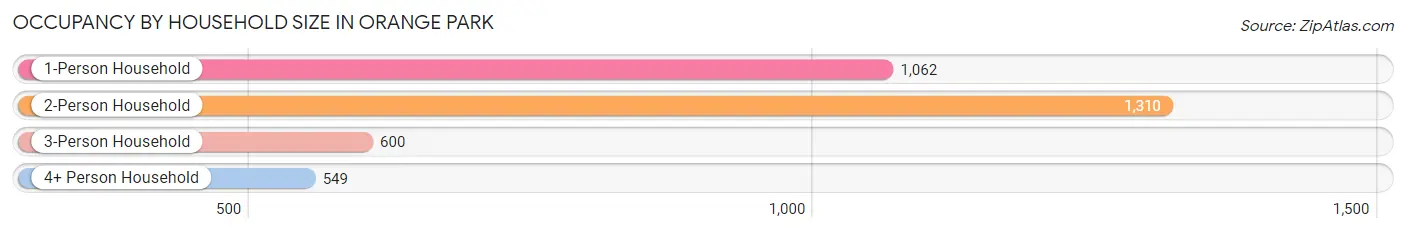
| Household Size | # Housing Units | % Housing Units |
| 1-Person Household | 1,062 | 30.2% |
| 2-Person Household | 1,310 | 37.2% |
| 3-Person Household | 600 | 17.0% |
| 4+ Person Household | 549 | 15.6% |
| Total Housing Units | 3,521 | 100.0% |
Occupancy by Ownership by Household Size in Orange Park
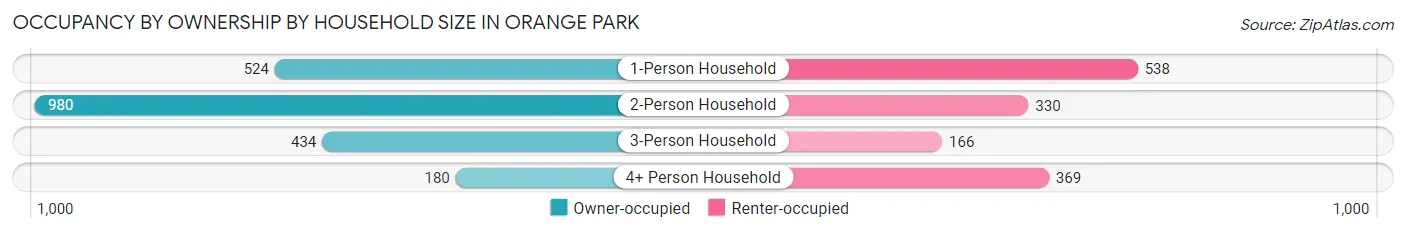
| Household Size | Owner-occupied | Renter-occupied |
| 1-Person Household | 524 (49.3%) | 538 (50.7%) |
| 2-Person Household | 980 (74.8%) | 330 (25.2%) |
| 3-Person Household | 434 (72.3%) | 166 (27.7%) |
| 4+ Person Household | 180 (32.8%) | 369 (67.2%) |
| Total Housing Units | 2,118 (60.2%) | 1,403 (39.9%) |
Occupancy by Educational Attainment in Orange Park
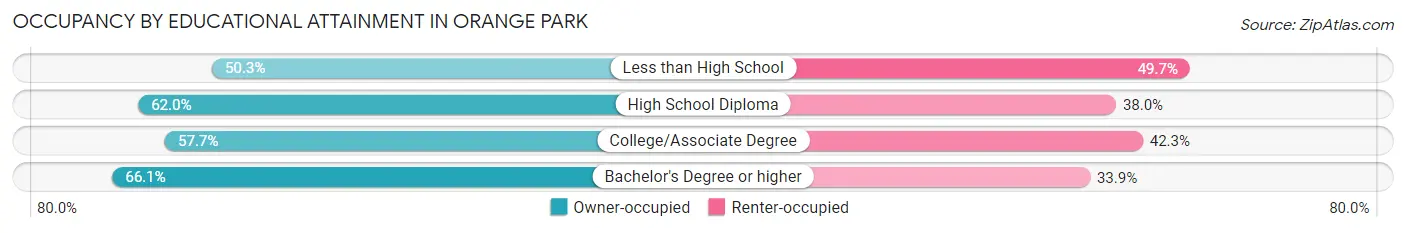
| Household Size | Owner-occupied | Renter-occupied |
| Less than High School | 92 (50.3%) | 91 (49.7%) |
| High School Diploma | 396 (62.0%) | 243 (38.0%) |
| College/Associate Degree | 1,059 (57.7%) | 776 (42.3%) |
| Bachelor's Degree or higher | 571 (66.1%) | 293 (33.9%) |
Occupancy by Age of Householder in Orange Park
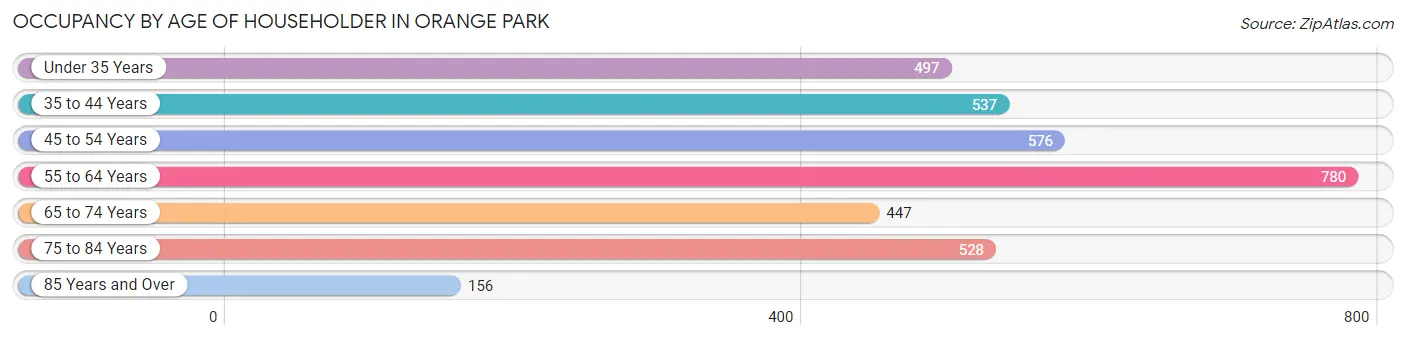
| Age Bracket | # Households | % Households |
| Under 35 Years | 497 | 14.1% |
| 35 to 44 Years | 537 | 15.2% |
| 45 to 54 Years | 576 | 16.4% |
| 55 to 64 Years | 780 | 22.2% |
| 65 to 74 Years | 447 | 12.7% |
| 75 to 84 Years | 528 | 15.0% |
| 85 Years and Over | 156 | 4.4% |
| Total | 3,521 | 100.0% |
Housing Finances in Orange Park
Median Income by Occupancy in Orange Park
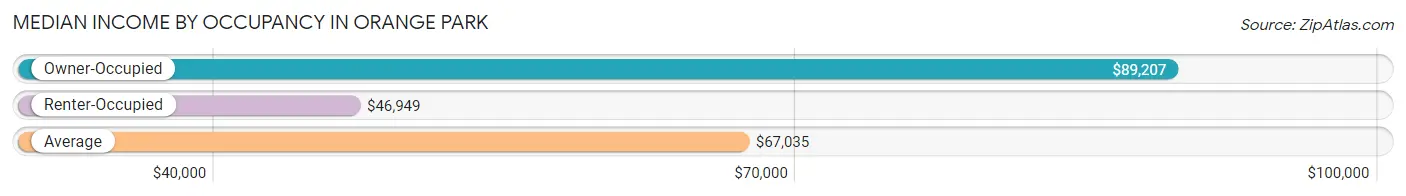
| Occupancy Type | # Households | Median Income |
| Owner-Occupied | 2,118 (60.2%) | $89,207 |
| Renter-Occupied | 1,403 (39.9%) | $46,949 |
| Average | 3,521 (100.0%) | $67,035 |
Occupancy by Householder Income Bracket in Orange Park
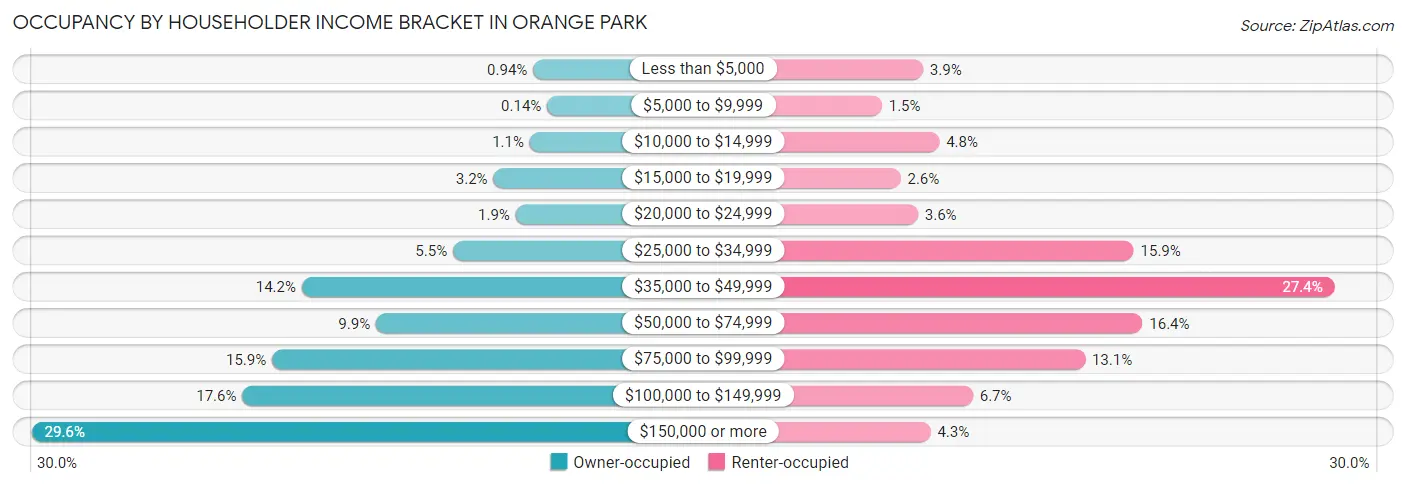
| Income Bracket | Owner-occupied | Renter-occupied |
| Less than $5,000 | 20 (0.9%) | 54 (3.8%) |
| $5,000 to $9,999 | 3 (0.1%) | 21 (1.5%) |
| $10,000 to $14,999 | 24 (1.1%) | 67 (4.8%) |
| $15,000 to $19,999 | 68 (3.2%) | 36 (2.6%) |
| $20,000 to $24,999 | 41 (1.9%) | 50 (3.6%) |
| $25,000 to $34,999 | 117 (5.5%) | 223 (15.9%) |
| $35,000 to $49,999 | 300 (14.2%) | 384 (27.4%) |
| $50,000 to $74,999 | 210 (9.9%) | 230 (16.4%) |
| $75,000 to $99,999 | 336 (15.9%) | 184 (13.1%) |
| $100,000 to $149,999 | 372 (17.6%) | 94 (6.7%) |
| $150,000 or more | 627 (29.6%) | 60 (4.3%) |
| Total | 2,118 (100.0%) | 1,403 (100.0%) |
Monthly Housing Cost Tiers in Orange Park
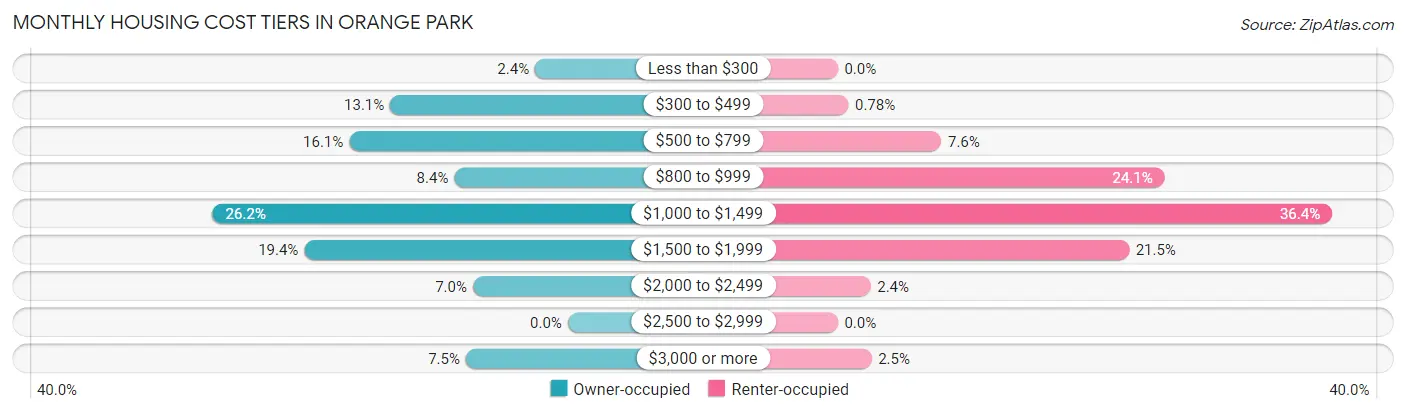
| Monthly Cost | Owner-occupied | Renter-occupied |
| Less than $300 | 51 (2.4%) | 0 (0.0%) |
| $300 to $499 | 277 (13.1%) | 11 (0.8%) |
| $500 to $799 | 341 (16.1%) | 107 (7.6%) |
| $800 to $999 | 177 (8.4%) | 338 (24.1%) |
| $1,000 to $1,499 | 554 (26.2%) | 511 (36.4%) |
| $1,500 to $1,999 | 411 (19.4%) | 301 (21.4%) |
| $2,000 to $2,499 | 148 (7.0%) | 34 (2.4%) |
| $2,500 to $2,999 | 0 (0.0%) | 0 (0.0%) |
| $3,000 or more | 159 (7.5%) | 35 (2.5%) |
| Total | 2,118 (100.0%) | 1,403 (100.0%) |
Physical Housing Characteristics in Orange Park
Housing Structures in Orange Park
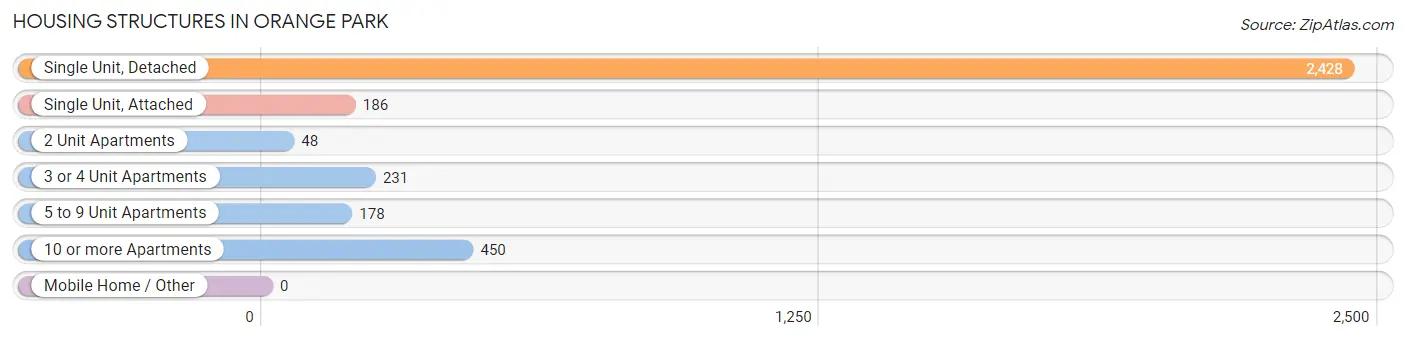
| Structure Type | # Housing Units | % Housing Units |
| Single Unit, Detached | 2,428 | 69.0% |
| Single Unit, Attached | 186 | 5.3% |
| 2 Unit Apartments | 48 | 1.4% |
| 3 or 4 Unit Apartments | 231 | 6.6% |
| 5 to 9 Unit Apartments | 178 | 5.1% |
| 10 or more Apartments | 450 | 12.8% |
| Mobile Home / Other | 0 | 0.0% |
| Total | 3,521 | 100.0% |
Housing Structures by Occupancy in Orange Park
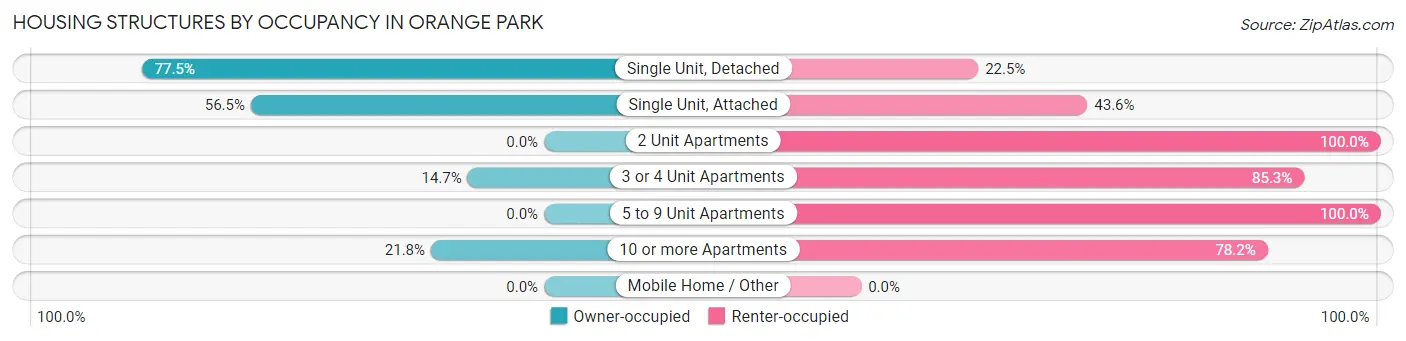
| Structure Type | Owner-occupied | Renter-occupied |
| Single Unit, Detached | 1,881 (77.5%) | 547 (22.5%) |
| Single Unit, Attached | 105 (56.5%) | 81 (43.5%) |
| 2 Unit Apartments | 0 (0.0%) | 48 (100.0%) |
| 3 or 4 Unit Apartments | 34 (14.7%) | 197 (85.3%) |
| 5 to 9 Unit Apartments | 0 (0.0%) | 178 (100.0%) |
| 10 or more Apartments | 98 (21.8%) | 352 (78.2%) |
| Mobile Home / Other | 0 (0.0%) | 0 (0.0%) |
| Total | 2,118 (60.2%) | 1,403 (39.9%) |
Housing Structures by Number of Rooms in Orange Park
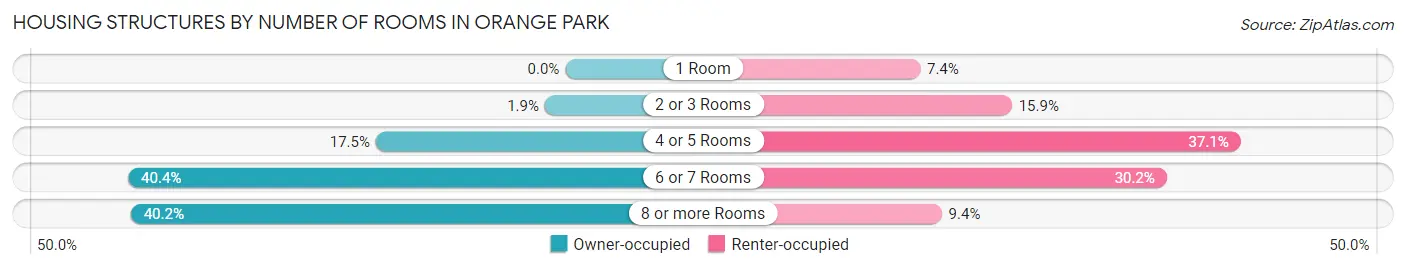
| Number of Rooms | Owner-occupied | Renter-occupied |
| 1 Room | 0 (0.0%) | 104 (7.4%) |
| 2 or 3 Rooms | 40 (1.9%) | 223 (15.9%) |
| 4 or 5 Rooms | 371 (17.5%) | 520 (37.1%) |
| 6 or 7 Rooms | 856 (40.4%) | 424 (30.2%) |
| 8 or more Rooms | 851 (40.2%) | 132 (9.4%) |
| Total | 2,118 (100.0%) | 1,403 (100.0%) |
Housing Structure by Heating Type in Orange Park
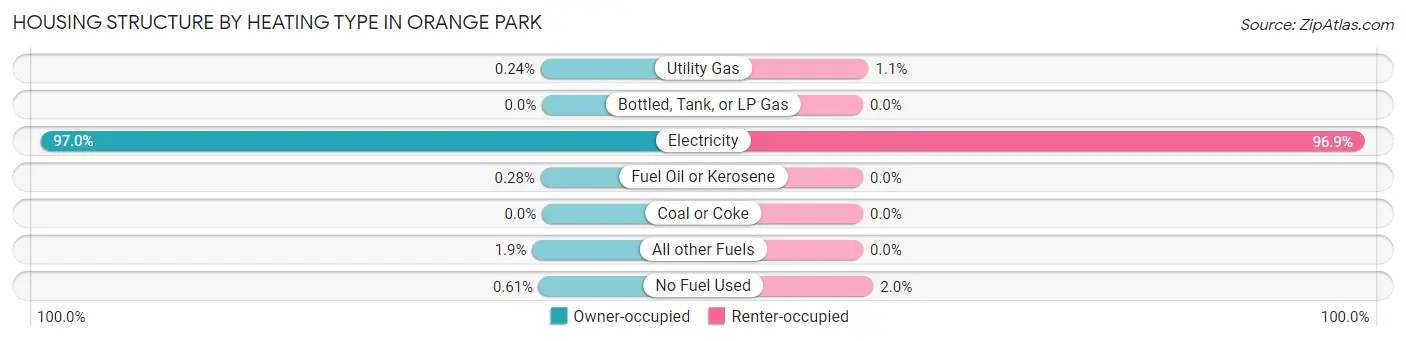
| Heating Type | Owner-occupied | Renter-occupied |
| Utility Gas | 5 (0.2%) | 15 (1.1%) |
| Bottled, Tank, or LP Gas | 0 (0.0%) | 0 (0.0%) |
| Electricity | 2,054 (97.0%) | 1,360 (96.9%) |
| Fuel Oil or Kerosene | 6 (0.3%) | 0 (0.0%) |
| Coal or Coke | 0 (0.0%) | 0 (0.0%) |
| All other Fuels | 40 (1.9%) | 0 (0.0%) |
| No Fuel Used | 13 (0.6%) | 28 (2.0%) |
| Total | 2,118 (100.0%) | 1,403 (100.0%) |
Household Vehicle Usage in Orange Park
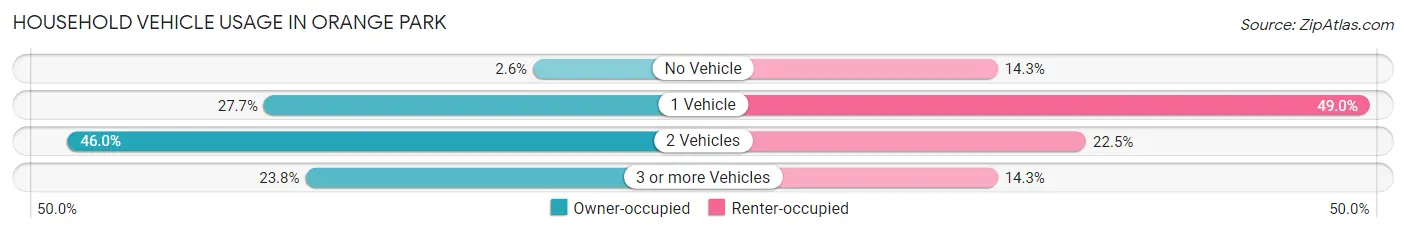
| Vehicles per Household | Owner-occupied | Renter-occupied |
| No Vehicle | 54 (2.5%) | 200 (14.3%) |
| 1 Vehicle | 586 (27.7%) | 687 (49.0%) |
| 2 Vehicles | 974 (46.0%) | 316 (22.5%) |
| 3 or more Vehicles | 504 (23.8%) | 200 (14.3%) |
| Total | 2,118 (100.0%) | 1,403 (100.0%) |
Real Estate & Mortgages in Orange Park
Real Estate and Mortgage Overview in Orange Park
| Characteristic | Without Mortgage | With Mortgage |
| Housing Units | 855 | 1,263 |
| Median Property Value | $218,000 | $261,600 |
| Median Household Income | $77,068 | $453 |
| Monthly Housing Costs | $561 | $145 |
| Real Estate Taxes | $1,701 | $33 |
Property Value by Mortgage Status in Orange Park
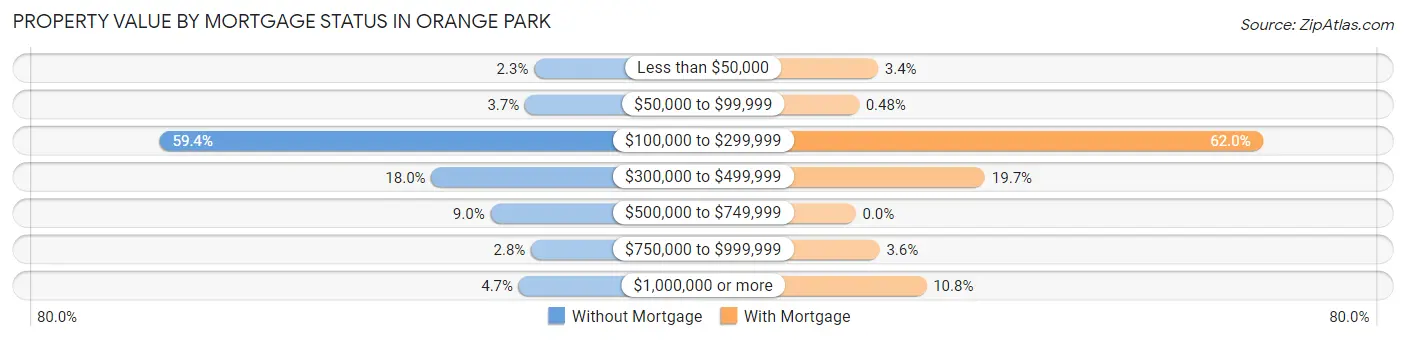
| Property Value | Without Mortgage | With Mortgage |
| Less than $50,000 | 20 (2.3%) | 43 (3.4%) |
| $50,000 to $99,999 | 32 (3.7%) | 6 (0.5%) |
| $100,000 to $299,999 | 508 (59.4%) | 783 (62.0%) |
| $300,000 to $499,999 | 154 (18.0%) | 249 (19.7%) |
| $500,000 to $749,999 | 77 (9.0%) | 0 (0.0%) |
| $750,000 to $999,999 | 24 (2.8%) | 46 (3.6%) |
| $1,000,000 or more | 40 (4.7%) | 136 (10.8%) |
| Total | 855 (100.0%) | 1,263 (100.0%) |
Household Income by Mortgage Status in Orange Park
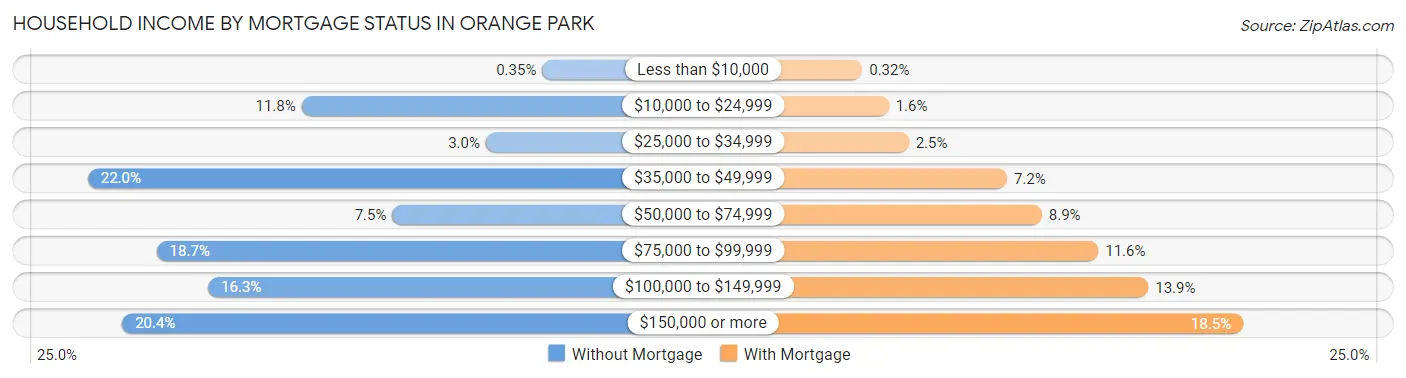
| Household Income | Without Mortgage | With Mortgage |
| Less than $10,000 | 3 (0.4%) | 4 (0.3%) |
| $10,000 to $24,999 | 101 (11.8%) | 20 (1.6%) |
| $25,000 to $34,999 | 26 (3.0%) | 32 (2.5%) |
| $35,000 to $49,999 | 188 (22.0%) | 91 (7.2%) |
| $50,000 to $74,999 | 64 (7.5%) | 112 (8.9%) |
| $75,000 to $99,999 | 160 (18.7%) | 146 (11.6%) |
| $100,000 to $149,999 | 139 (16.3%) | 176 (13.9%) |
| $150,000 or more | 174 (20.3%) | 233 (18.4%) |
| Total | 855 (100.0%) | 1,263 (100.0%) |
Property Value to Household Income Ratio in Orange Park
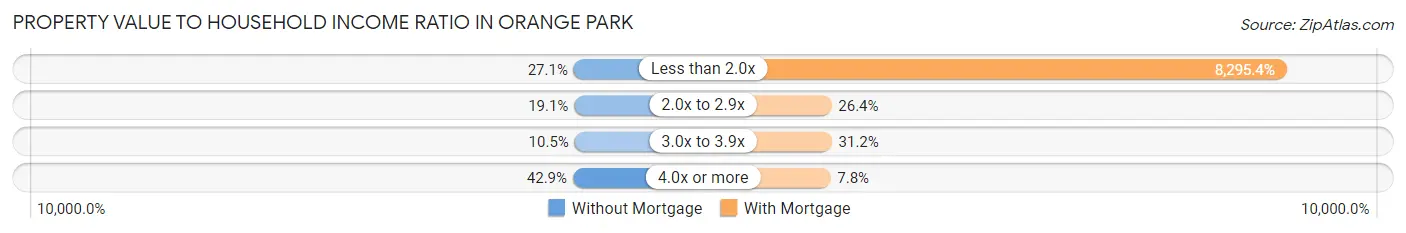
| Value-to-Income Ratio | Without Mortgage | With Mortgage |
| Less than 2.0x | 232 (27.1%) | 104,771 (8,295.4%) |
| 2.0x to 2.9x | 163 (19.1%) | 334 (26.4%) |
| 3.0x to 3.9x | 90 (10.5%) | 394 (31.2%) |
| 4.0x or more | 367 (42.9%) | 98 (7.8%) |
| Total | 855 (100.0%) | 1,263 (100.0%) |
Real Estate Taxes by Mortgage Status in Orange Park
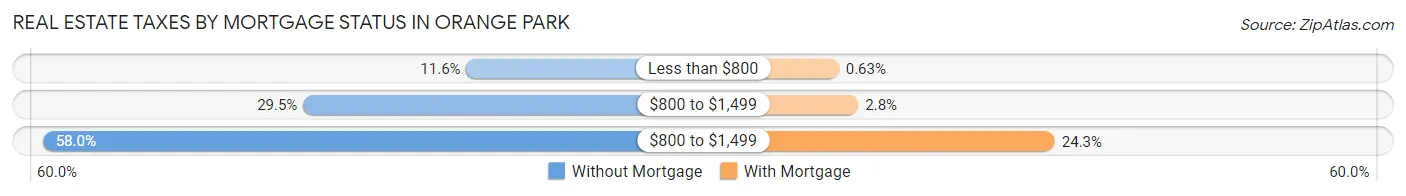
| Property Taxes | Without Mortgage | With Mortgage |
| Less than $800 | 99 (11.6%) | 8 (0.6%) |
| $800 to $1,499 | 252 (29.5%) | 35 (2.8%) |
| $800 to $1,499 | 496 (58.0%) | 307 (24.3%) |
| Total | 855 (100.0%) | 1,263 (100.0%) |
Health & Disability in Orange Park
Health Insurance Coverage by Age in Orange Park
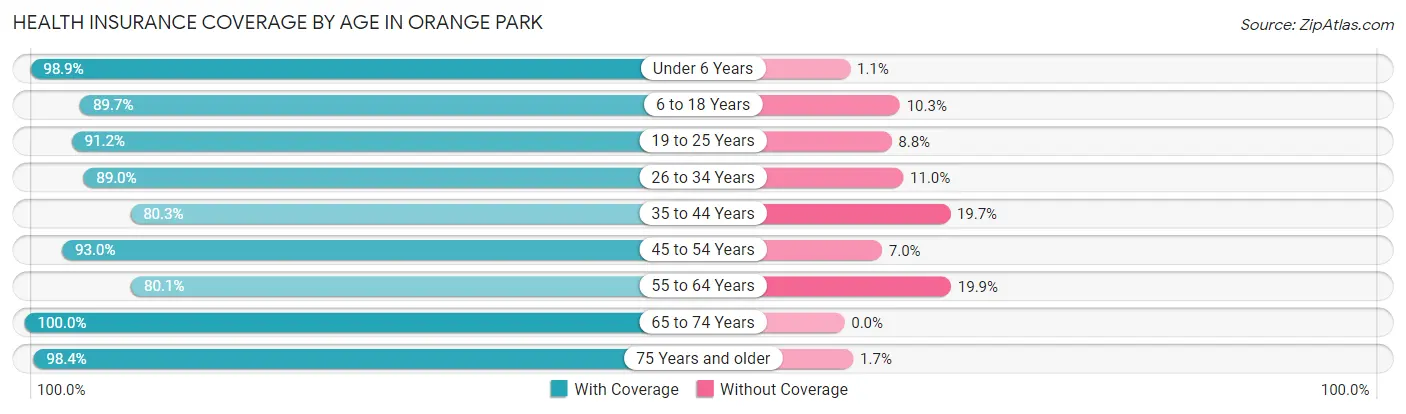
| Age Bracket | With Coverage | Without Coverage |
| Under 6 Years | 464 (98.9%) | 5 (1.1%) |
| 6 to 18 Years | 1,093 (89.7%) | 126 (10.3%) |
| 19 to 25 Years | 478 (91.2%) | 46 (8.8%) |
| 26 to 34 Years | 1,112 (89.0%) | 137 (11.0%) |
| 35 to 44 Years | 811 (80.3%) | 199 (19.7%) |
| 45 to 54 Years | 1,116 (93.0%) | 84 (7.0%) |
| 55 to 64 Years | 871 (80.1%) | 216 (19.9%) |
| 65 to 74 Years | 858 (100.0%) | 0 (0.0%) |
| 75 Years and older | 951 (98.4%) | 16 (1.7%) |
| Total | 7,754 (90.3%) | 829 (9.7%) |
Health Insurance Coverage by Citizenship Status in Orange Park
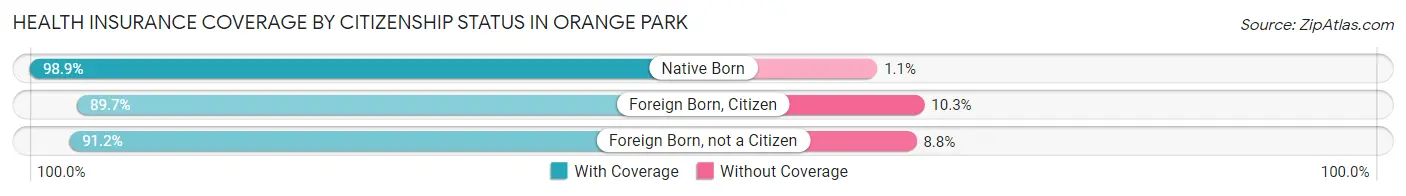
| Citizenship Status | With Coverage | Without Coverage |
| Native Born | 464 (98.9%) | 5 (1.1%) |
| Foreign Born, Citizen | 1,093 (89.7%) | 126 (10.3%) |
| Foreign Born, not a Citizen | 478 (91.2%) | 46 (8.8%) |
Health Insurance Coverage by Household Income in Orange Park
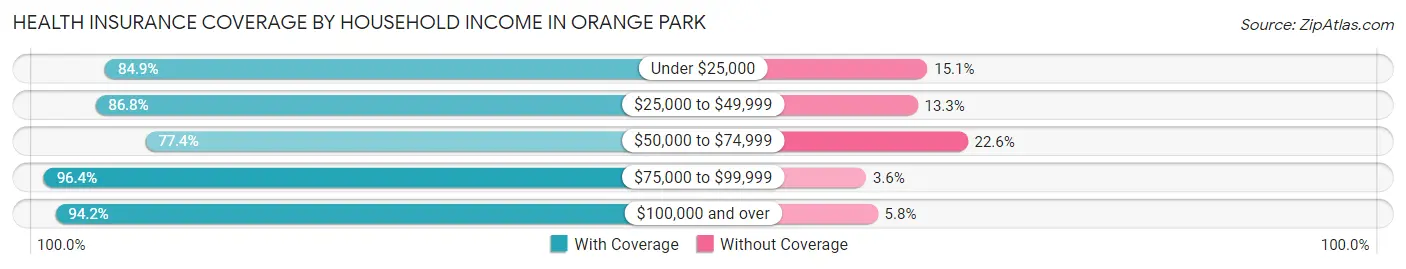
| Household Income | With Coverage | Without Coverage |
| Under $25,000 | 467 (84.9%) | 83 (15.1%) |
| $25,000 to $49,999 | 1,965 (86.8%) | 300 (13.3%) |
| $50,000 to $74,999 | 619 (77.4%) | 181 (22.6%) |
| $75,000 to $99,999 | 1,341 (96.4%) | 50 (3.6%) |
| $100,000 and over | 3,246 (94.2%) | 199 (5.8%) |
Public vs Private Health Insurance Coverage by Age in Orange Park
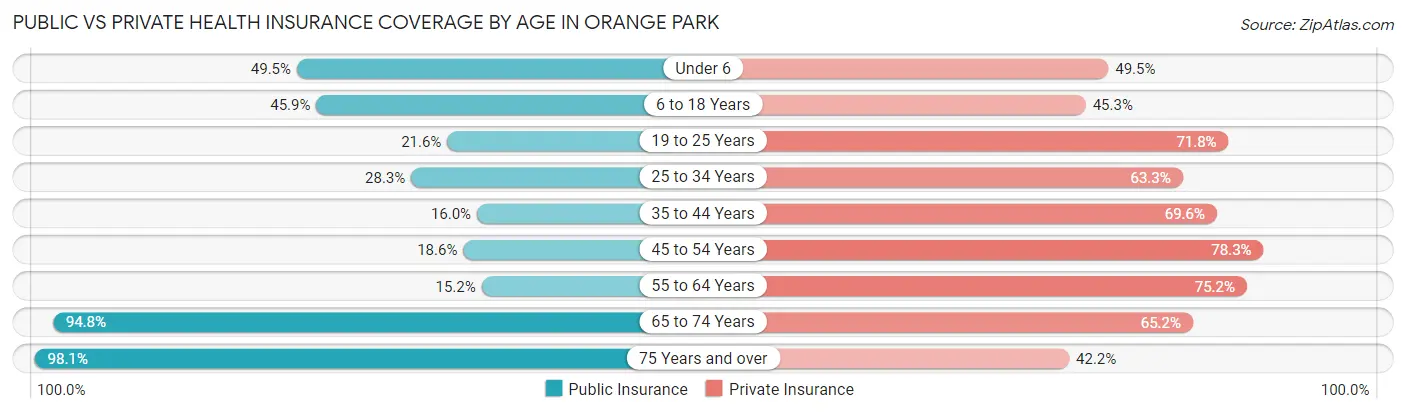
| Age Bracket | Public Insurance | Private Insurance |
| Under 6 | 232 (49.5%) | 232 (49.5%) |
| 6 to 18 Years | 559 (45.9%) | 552 (45.3%) |
| 19 to 25 Years | 113 (21.6%) | 376 (71.8%) |
| 25 to 34 Years | 353 (28.3%) | 790 (63.2%) |
| 35 to 44 Years | 162 (16.0%) | 703 (69.6%) |
| 45 to 54 Years | 223 (18.6%) | 939 (78.2%) |
| 55 to 64 Years | 165 (15.2%) | 817 (75.2%) |
| 65 to 74 Years | 813 (94.8%) | 559 (65.1%) |
| 75 Years and over | 949 (98.1%) | 408 (42.2%) |
| Total | 3,569 (41.6%) | 5,376 (62.6%) |
Disability Status by Sex by Age in Orange Park
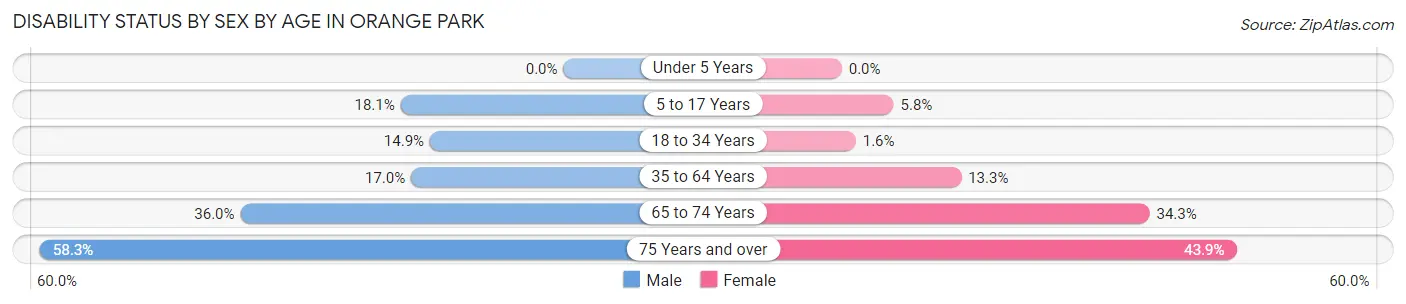
| Age Bracket | Male | Female |
| Under 5 Years | 0 (0.0%) | 0 (0.0%) |
| 5 to 17 Years | 134 (18.1%) | 30 (5.8%) |
| 18 to 34 Years | 151 (14.9%) | 12 (1.6%) |
| 35 to 64 Years | 313 (17.0%) | 193 (13.3%) |
| 65 to 74 Years | 168 (36.0%) | 134 (34.3%) |
| 75 Years and over | 232 (58.3%) | 250 (43.9%) |
Disability Class by Sex by Age in Orange Park
Disability Class: Hearing Difficulty
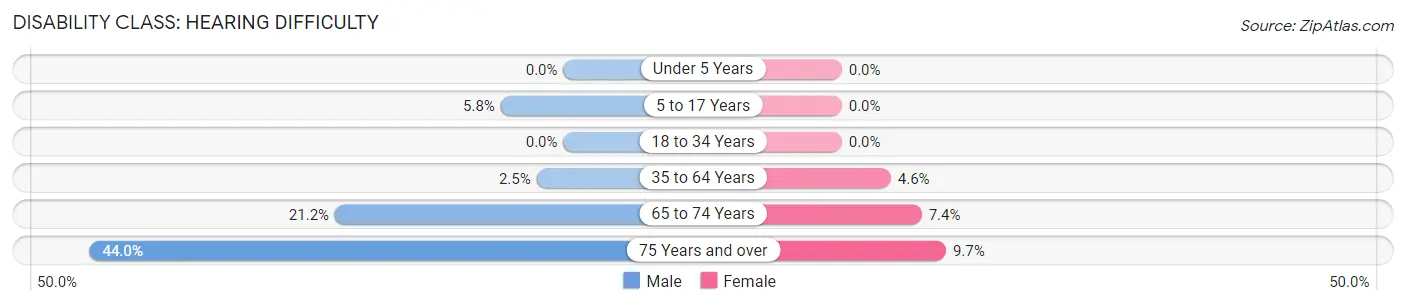
| Age Bracket | Male | Female |
| Under 5 Years | 0 (0.0%) | 0 (0.0%) |
| 5 to 17 Years | 43 (5.8%) | 0 (0.0%) |
| 18 to 34 Years | 0 (0.0%) | 0 (0.0%) |
| 35 to 64 Years | 46 (2.5%) | 66 (4.5%) |
| 65 to 74 Years | 99 (21.2%) | 29 (7.4%) |
| 75 Years and over | 175 (44.0%) | 55 (9.7%) |
Disability Class: Vision Difficulty
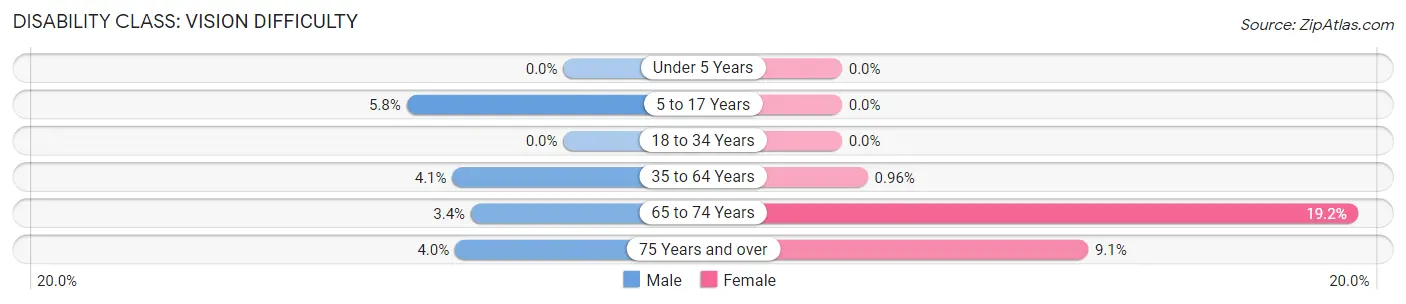
| Age Bracket | Male | Female |
| Under 5 Years | 0 (0.0%) | 0 (0.0%) |
| 5 to 17 Years | 43 (5.8%) | 0 (0.0%) |
| 18 to 34 Years | 0 (0.0%) | 0 (0.0%) |
| 35 to 64 Years | 76 (4.1%) | 14 (1.0%) |
| 65 to 74 Years | 16 (3.4%) | 75 (19.2%) |
| 75 Years and over | 16 (4.0%) | 52 (9.1%) |
Disability Class: Cognitive Difficulty
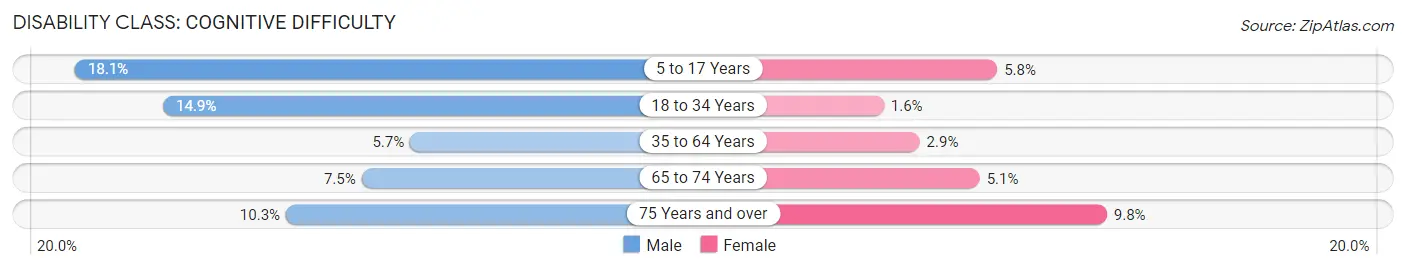
| Age Bracket | Male | Female |
| 5 to 17 Years | 134 (18.1%) | 30 (5.8%) |
| 18 to 34 Years | 151 (14.9%) | 12 (1.6%) |
| 35 to 64 Years | 105 (5.7%) | 42 (2.9%) |
| 65 to 74 Years | 35 (7.5%) | 20 (5.1%) |
| 75 Years and over | 41 (10.3%) | 56 (9.8%) |
Disability Class: Ambulatory Difficulty
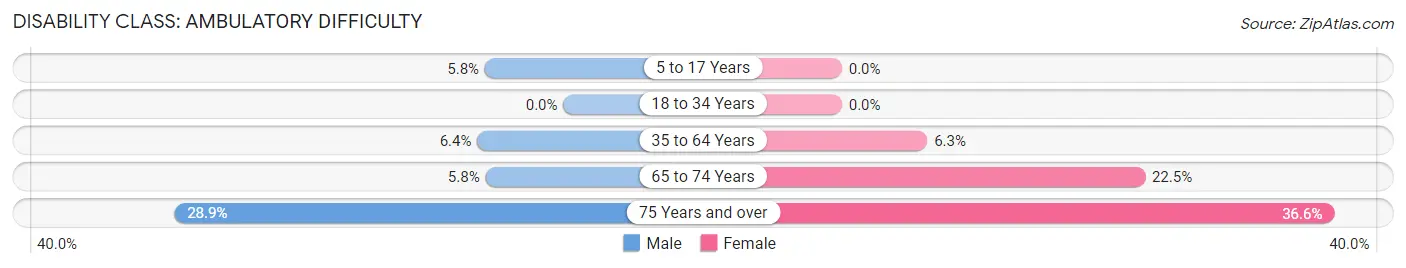
| Age Bracket | Male | Female |
| 5 to 17 Years | 43 (5.8%) | 0 (0.0%) |
| 18 to 34 Years | 0 (0.0%) | 0 (0.0%) |
| 35 to 64 Years | 118 (6.4%) | 92 (6.3%) |
| 65 to 74 Years | 27 (5.8%) | 88 (22.5%) |
| 75 Years and over | 115 (28.9%) | 208 (36.6%) |
Disability Class: Self-Care Difficulty
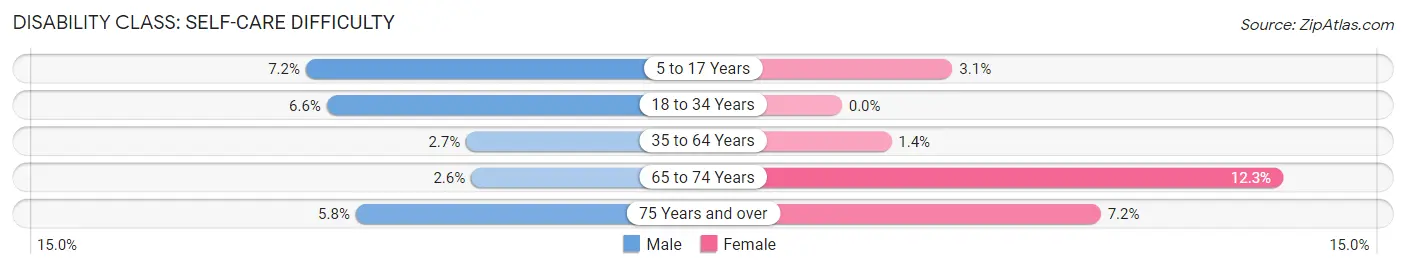
| Age Bracket | Male | Female |
| 5 to 17 Years | 53 (7.2%) | 16 (3.1%) |
| 18 to 34 Years | 67 (6.6%) | 0 (0.0%) |
| 35 to 64 Years | 50 (2.7%) | 20 (1.4%) |
| 65 to 74 Years | 12 (2.6%) | 48 (12.3%) |
| 75 Years and over | 23 (5.8%) | 41 (7.2%) |
Technology Access in Orange Park
Computing Device Access in Orange Park
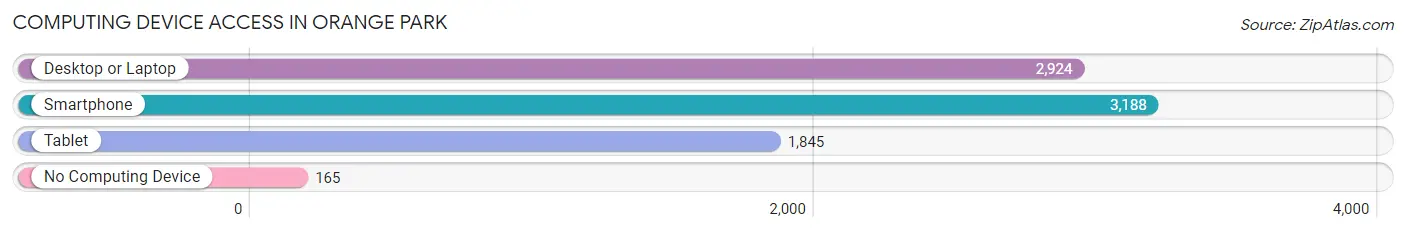
| Device Type | # Households | % Households |
| Desktop or Laptop | 2,924 | 83.0% |
| Smartphone | 3,188 | 90.5% |
| Tablet | 1,845 | 52.4% |
| No Computing Device | 165 | 4.7% |
| Total | 3,521 | 100.0% |
Internet Access in Orange Park
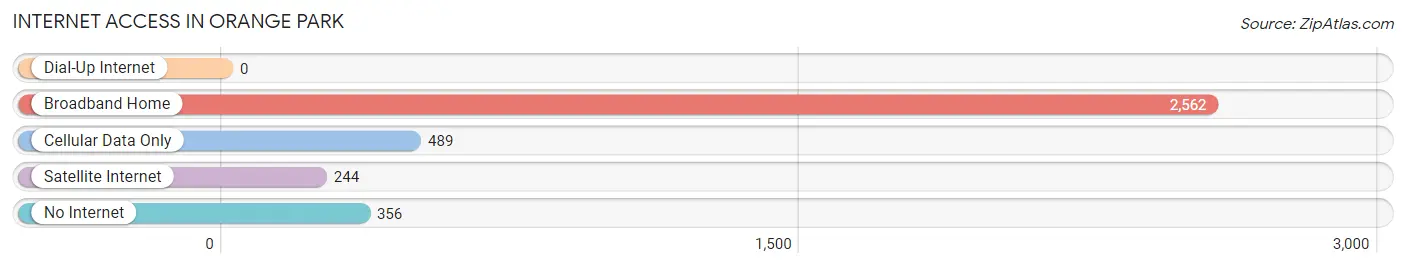
| Internet Type | # Households | % Households |
| Dial-Up Internet | 0 | 0.0% |
| Broadband Home | 2,562 | 72.8% |
| Cellular Data Only | 489 | 13.9% |
| Satellite Internet | 244 | 6.9% |
| No Internet | 356 | 10.1% |
| Total | 3,521 | 100.0% |
Orange Park Summary
Introduction
Orange Park is a town located in Clay County, Florida, United States. It is situated in the northeastern part of the state, approximately 20 miles south of Jacksonville and 40 miles north of St. Augustine. The town is part of the Jacksonville metropolitan area and is home to a population of 8,412 people as of the 2010 census. Orange Park is known for its historic downtown area, which is home to a variety of shops, restaurants, and other attractions.
History
Orange Park was first settled in 1877 by the Florida Land and Immigration Company. The town was named after the orange groves that were planted in the area. The town was incorporated in 1879 and was initially a small farming community. In the early 1900s, the town began to grow as the railroad was extended to the area. This allowed for the transportation of goods and people to and from the town.
In the 1950s, Orange Park began to experience a period of rapid growth. This was due to the construction of the Naval Air Station Jacksonville, which brought many new residents to the area. The town also experienced a population boom due to the development of the nearby suburbs of Jacksonville.
Geography
Orange Park is located in northeastern Florida, approximately 20 miles south of Jacksonville and 40 miles north of St. Augustine. The town is situated on the banks of the St. Johns River and is part of the Jacksonville metropolitan area. The town has a total area of 8.3 square miles, of which 8.2 square miles is land and 0.1 square miles is water.
The town is located in a humid subtropical climate zone and experiences hot, humid summers and mild winters. The average temperature in the summer is around 90 degrees Fahrenheit and the average temperature in the winter is around 60 degrees Fahrenheit.
Economy
Orange Park has a diverse economy that is driven by a variety of industries. The town is home to a number of businesses, including retail stores, restaurants, and professional services. The town is also home to a number of manufacturing companies, including a paper mill and a plastics factory.
The town is also home to a number of military installations, including the Naval Air Station Jacksonville and the Camp Blanding Joint Training Center. These installations provide a significant number of jobs to the local economy.
Demographics
As of the 2010 census, Orange Park had a population of 8,412 people. The racial makeup of the town was 79.3% White, 11.7% African American, 0.7% Native American, 2.2% Asian, 0.1% Pacific Islander, 3.3% from other races, and 3.1% from two or more races. Hispanic or Latino of any race were 8.3% of the population.
The median income for a household in the town was $45,945 and the median income for a family was $54,844. The per capita income for the town was $22,945. About 8.3% of families and 10.7% of the population were below the poverty line, including 14.2% of those under age 18 and 6.2% of those age 65 or over.
Conclusion
Orange Park is a town located in Clay County, Florida, United States. It is situated in the northeastern part of the state, approximately 20 miles south of Jacksonville and 40 miles north of St. Augustine. The town is part of the Jacksonville metropolitan area and is home to a population of 8,412 people as of the 2010 census. Orange Park is known for its historic downtown area, which is home to a variety of shops, restaurants, and other attractions. The town has a diverse economy that is driven by a variety of industries, including retail stores, restaurants, manufacturing companies, and military installations. The town has a population that is 79.3% White, 11.7% African American, 0.7% Native American, 2.2% Asian, 0.1% Pacific Islander, 3.3% from other races, and 3.1% from two or more races. The median income for a household in the town was $45,945 and the median income for a family was $54,844. Orange Park is a vibrant town with a rich history and a diverse population.
Common Questions
What is Per Capita Income in Orange Park?
Per Capita income in Orange Park is $37,854.
What is the Median Family Income in Orange Park?
Median Family Income in Orange Park is $87,477.
What is the Median Household income in Orange Park?
Median Household Income in Orange Park is $67,035.
What is Income or Wage Gap in Orange Park?
Income or Wage Gap in Orange Park is 35.1%.
Women in Orange Park earn 64.9 cents for every dollar earned by a man.
What is Family Income Deficit in Orange Park?
Family Income Deficit in Orange Park is $9,347.
Families that are below poverty line in Orange Park earn $9,347 less on average than the poverty threshold level.
What is Inequality or Gini Index in Orange Park?
Inequality or Gini Index in Orange Park is 0.41.
What is the Total Population of Orange Park?
Total Population of Orange Park is 9,047.
What is the Total Male Population of Orange Park?
Total Male Population of Orange Park is 4,930.
What is the Total Female Population of Orange Park?
Total Female Population of Orange Park is 4,117.
What is the Ratio of Males per 100 Females in Orange Park?
There are 119.75 Males per 100 Females in Orange Park.
What is the Ratio of Females per 100 Males in Orange Park?
There are 83.51 Females per 100 Males in Orange Park.
What is the Median Population Age in Orange Park?
Median Population Age in Orange Park is 45.3 Years.
What is the Average Family Size in Orange Park
Average Family Size in Orange Park is 2.9 People.
What is the Average Household Size in Orange Park
Average Household Size in Orange Park is 2.4 People.
How Large is the Labor Force in Orange Park?
There are 4,678 People in the Labor Forcein in Orange Park.
What is the Percentage of People in the Labor Force in Orange Park?
61.2% of People are in the Labor Force in Orange Park.
What is the Unemployment Rate in Orange Park?
Unemployment Rate in Orange Park is 5.6%.