Niceville, FL Map & Demographics
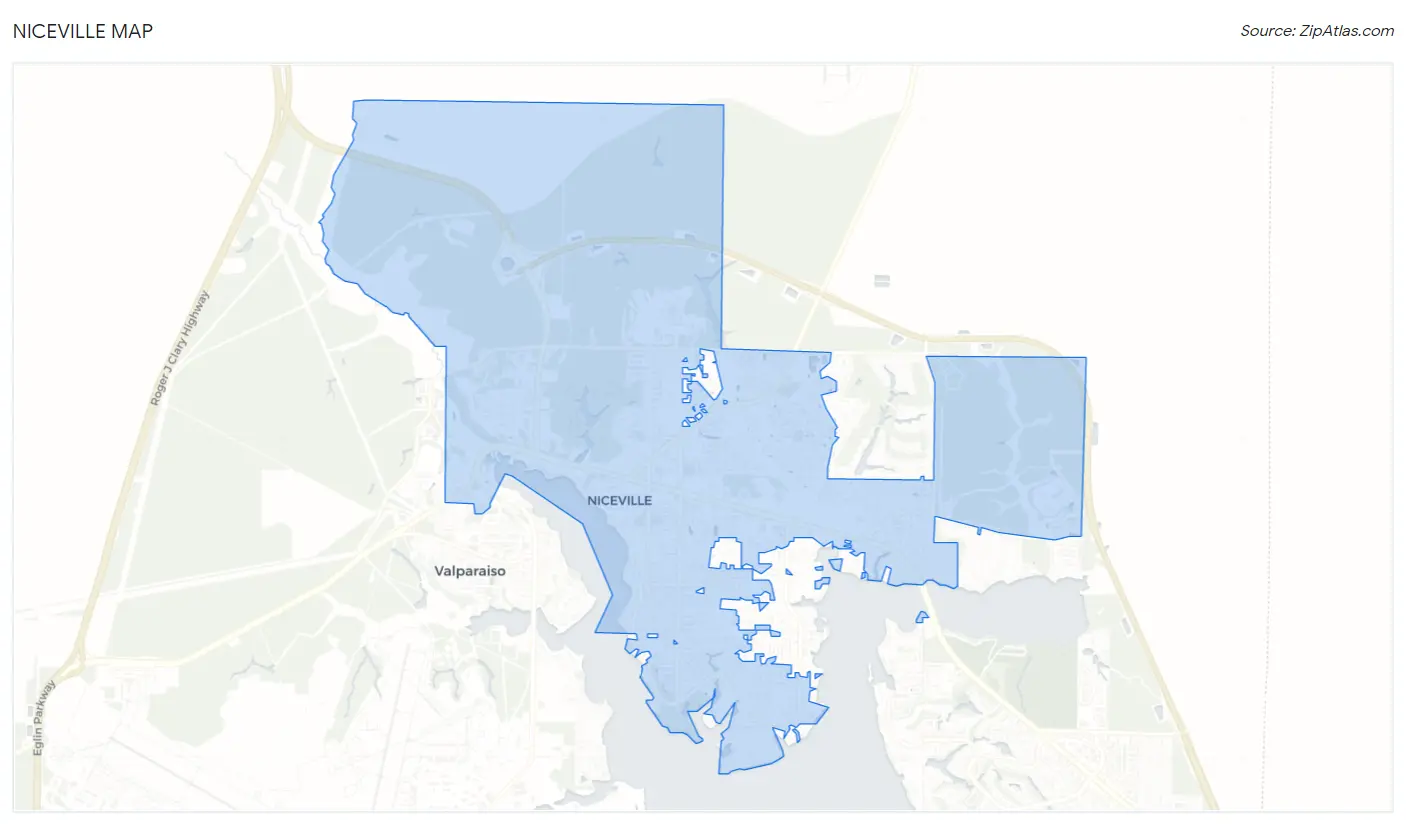
Niceville Map
Niceville Overview
$42,085
PER CAPITA INCOME
$102,262
AVG FAMILY INCOME
$92,345
AVG HOUSEHOLD INCOME
48.9%
WAGE / INCOME GAP [ % ]
51.1¢/ $1
WAGE / INCOME GAP [ $ ]
$11,873
FAMILY INCOME DEFICIT
0.41
INEQUALITY / GINI INDEX
15,804
TOTAL POPULATION
7,655
MALE POPULATION
8,149
FEMALE POPULATION
93.94
MALES / 100 FEMALES
106.45
FEMALES / 100 MALES
39.1
MEDIAN AGE
3.1
AVG FAMILY SIZE
2.8
AVG HOUSEHOLD SIZE
7,726
LABOR FORCE [ PEOPLE ]
62.4%
PERCENT IN LABOR FORCE
1.2%
UNEMPLOYMENT RATE
Niceville Zip Codes
Niceville Area Codes
Income in Niceville
Income Overview in Niceville
Per Capita Income in Niceville is $42,085, while median incomes of families and households are $102,262 and $92,345 respectively.
| Characteristic | Number | Measure |
| Per Capita Income | 15,804 | $42,085 |
| Median Family Income | 4,288 | $102,262 |
| Mean Family Income | 4,288 | $131,700 |
| Median Household Income | 5,710 | $92,345 |
| Mean Household Income | 5,710 | $117,026 |
| Income Deficit | 4,288 | $11,873 |
| Wage / Income Gap (%) | 15,804 | 48.86% |
| Wage / Income Gap ($) | 15,804 | 51.14¢ per $1 |
| Gini / Inequality Index | 15,804 | 0.41 |
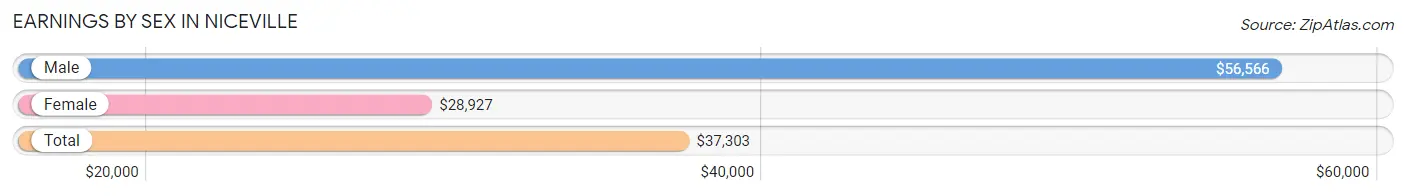
Earnings by Sex in Niceville
Average Earnings in Niceville are $37,303, $56,566 for men and $28,927 for women, a difference of 48.9%.
| Sex | Number | Average Earnings |
| Male | 4,505 (54.0%) | $56,566 |
| Female | 3,841 (46.0%) | $28,927 |
| Total | 8,346 (100.0%) | $37,303 |
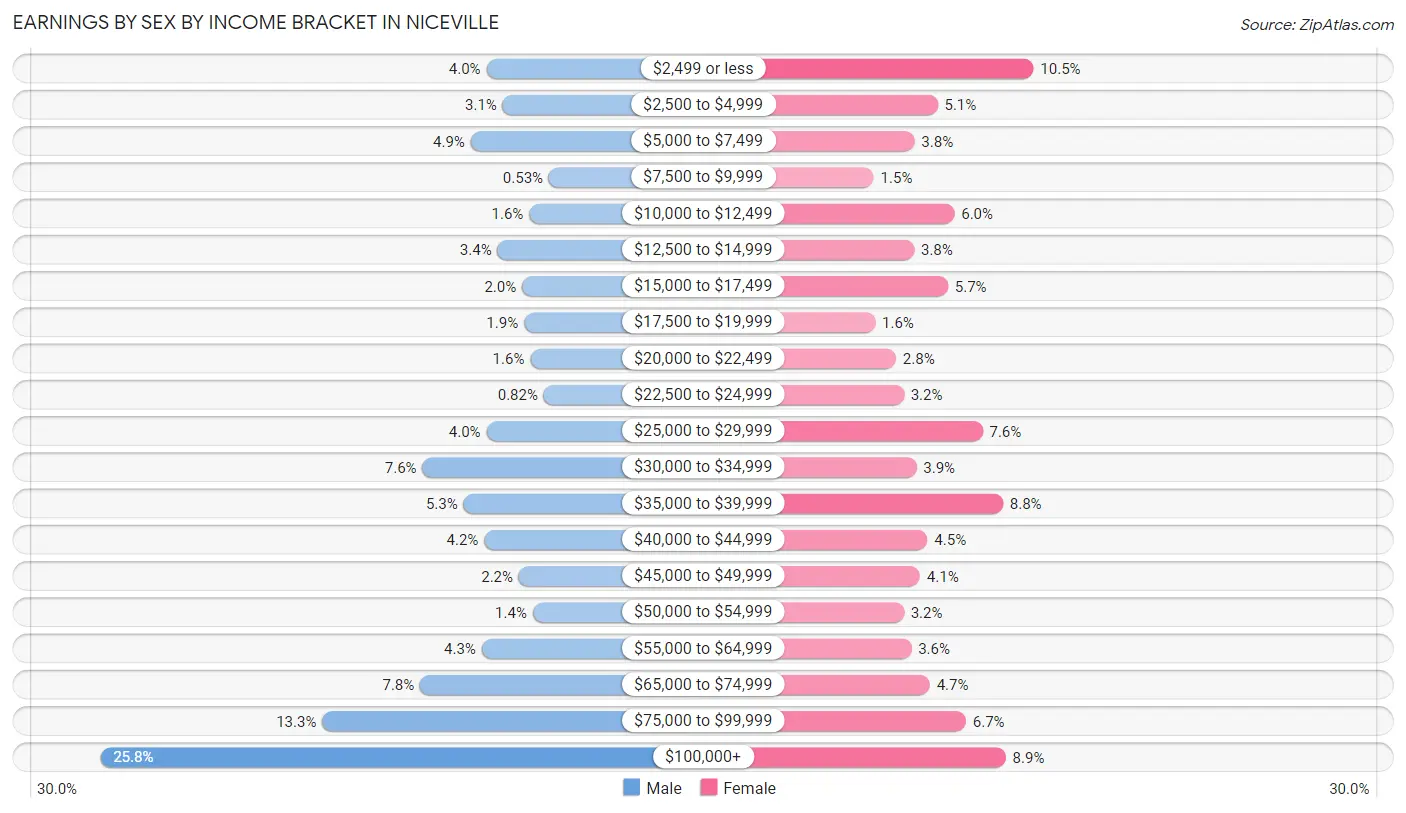
Earnings by Sex by Income Bracket in Niceville
The most common earnings brackets in Niceville are $100,000+ for men (1,160 | 25.8%) and $2,499 or less for women (403 | 10.5%).
| Income | Male | Female |
| $2,499 or less | 182 (4.0%) | 403 (10.5%) |
| $2,500 to $4,999 | 141 (3.1%) | 196 (5.1%) |
| $5,000 to $7,499 | 222 (4.9%) | 146 (3.8%) |
| $7,500 to $9,999 | 24 (0.5%) | 58 (1.5%) |
| $10,000 to $12,499 | 74 (1.6%) | 232 (6.0%) |
| $12,500 to $14,999 | 154 (3.4%) | 145 (3.8%) |
| $15,000 to $17,499 | 92 (2.0%) | 218 (5.7%) |
| $17,500 to $19,999 | 87 (1.9%) | 61 (1.6%) |
| $20,000 to $22,499 | 71 (1.6%) | 106 (2.8%) |
| $22,500 to $24,999 | 37 (0.8%) | 123 (3.2%) |
| $25,000 to $29,999 | 182 (4.0%) | 293 (7.6%) |
| $30,000 to $34,999 | 344 (7.6%) | 150 (3.9%) |
| $35,000 to $39,999 | 240 (5.3%) | 337 (8.8%) |
| $40,000 to $44,999 | 188 (4.2%) | 174 (4.5%) |
| $45,000 to $49,999 | 100 (2.2%) | 158 (4.1%) |
| $50,000 to $54,999 | 65 (1.4%) | 123 (3.2%) |
| $55,000 to $64,999 | 194 (4.3%) | 139 (3.6%) |
| $65,000 to $74,999 | 350 (7.8%) | 179 (4.7%) |
| $75,000 to $99,999 | 598 (13.3%) | 257 (6.7%) |
| $100,000+ | 1,160 (25.8%) | 343 (8.9%) |
| Total | 4,505 (100.0%) | 3,841 (100.0%) |
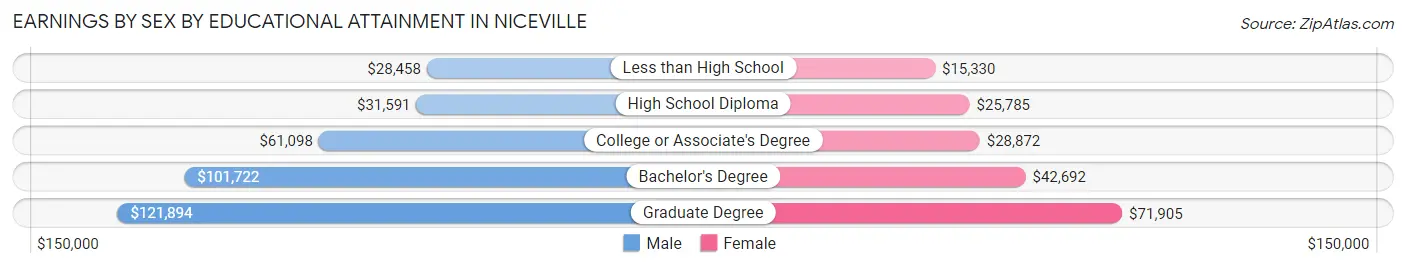
Earnings by Sex by Educational Attainment in Niceville
Average earnings in Niceville are $69,928 for men and $36,454 for women, a difference of 47.9%. Men with an educational attainment of graduate degree enjoy the highest average annual earnings of $121,894, while those with less than high school education earn the least with $28,458. Women with an educational attainment of graduate degree earn the most with the average annual earnings of $71,905, while those with less than high school education have the smallest earnings of $15,330.
| Educational Attainment | Male Income | Female Income |
| Less than High School | $28,458 | $15,330 |
| High School Diploma | $31,591 | $25,785 |
| College or Associate's Degree | $61,098 | $28,872 |
| Bachelor's Degree | $101,722 | $42,692 |
| Graduate Degree | $121,894 | $71,905 |
| Total | $69,928 | $36,454 |
Family Income in Niceville
Family Income Brackets in Niceville
According to the Niceville family income data, there are 870 families falling into the $200,000+ income range, which is the most common income bracket and makes up 20.3% of all families. Conversely, the $15,000 to $24,999 income bracket is the least frequent group with only 51 families (1.2%) belonging to this category.
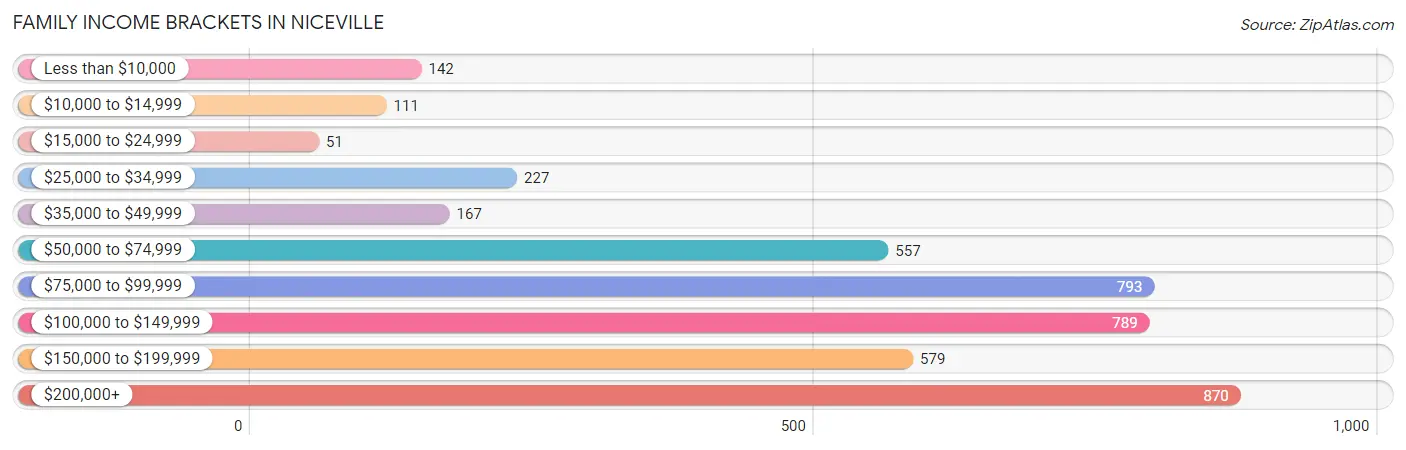
| Income Bracket | # Families | % Families |
| Less than $10,000 | 142 | 3.3% |
| $10,000 to $14,999 | 111 | 2.6% |
| $15,000 to $24,999 | 51 | 1.2% |
| $25,000 to $34,999 | 227 | 5.3% |
| $35,000 to $49,999 | 167 | 3.9% |
| $50,000 to $74,999 | 557 | 13.0% |
| $75,000 to $99,999 | 793 | 18.5% |
| $100,000 to $149,999 | 789 | 18.4% |
| $150,000 to $199,999 | 579 | 13.5% |
| $200,000+ | 870 | 20.3% |
Family Income by Famaliy Size in Niceville
7+ person families (31 | 0.7%) account for the highest median family income in Niceville with $148,482 per family, while 2-person families (2,045 | 47.7%) have the highest median income of $48,484 per family member.
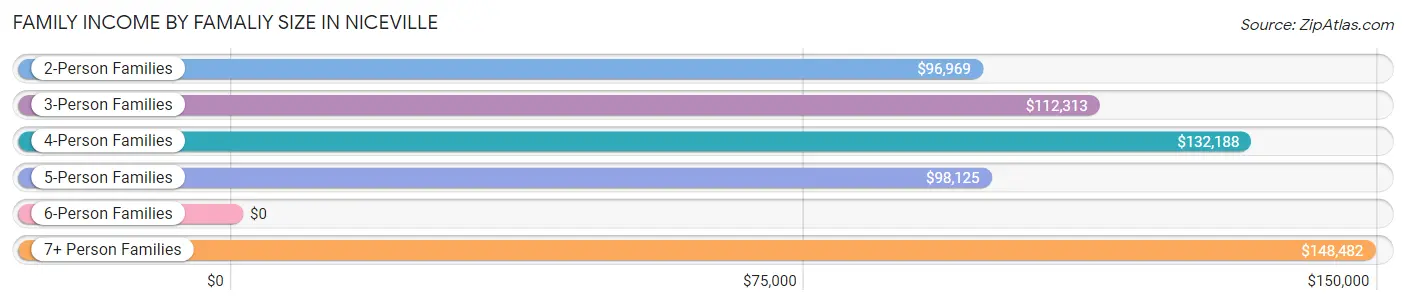
| Income Bracket | # Families | Median Income |
| 2-Person Families | 2,045 (47.7%) | $96,969 |
| 3-Person Families | 1,011 (23.6%) | $112,313 |
| 4-Person Families | 655 (15.3%) | $132,188 |
| 5-Person Families | 466 (10.9%) | $98,125 |
| 6-Person Families | 80 (1.9%) | $0 |
| 7+ Person Families | 31 (0.7%) | $148,482 |
| Total | 4,288 (100.0%) | $102,262 |
Family Income by Number of Earners in Niceville
The median family income in Niceville is $102,262, with families comprising 3+ earners (581) having the highest median family income of $145,341, while families with no earners (747) have the lowest median family income of $78,060, accounting for 13.6% and 17.4% of families, respectively.
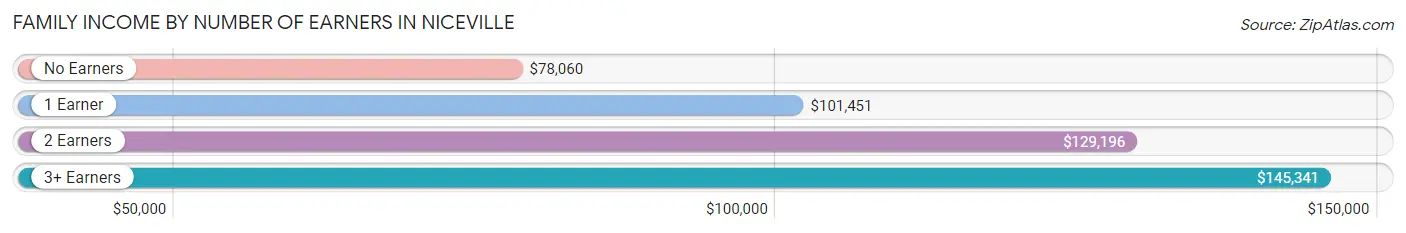
| Number of Earners | # Families | Median Income |
| No Earners | 747 (17.4%) | $78,060 |
| 1 Earner | 1,245 (29.0%) | $101,451 |
| 2 Earners | 1,715 (40.0%) | $129,196 |
| 3+ Earners | 581 (13.6%) | $145,341 |
| Total | 4,288 (100.0%) | $102,262 |
Household Income in Niceville
Household Income Brackets in Niceville
With 1,016 households falling in the category, the $75,000 to $99,999 income range is the most frequent in Niceville, accounting for 17.8% of all households. In contrast, only 80 households (1.4%) fall into the $10,000 to $14,999 income bracket, making it the least populous group.
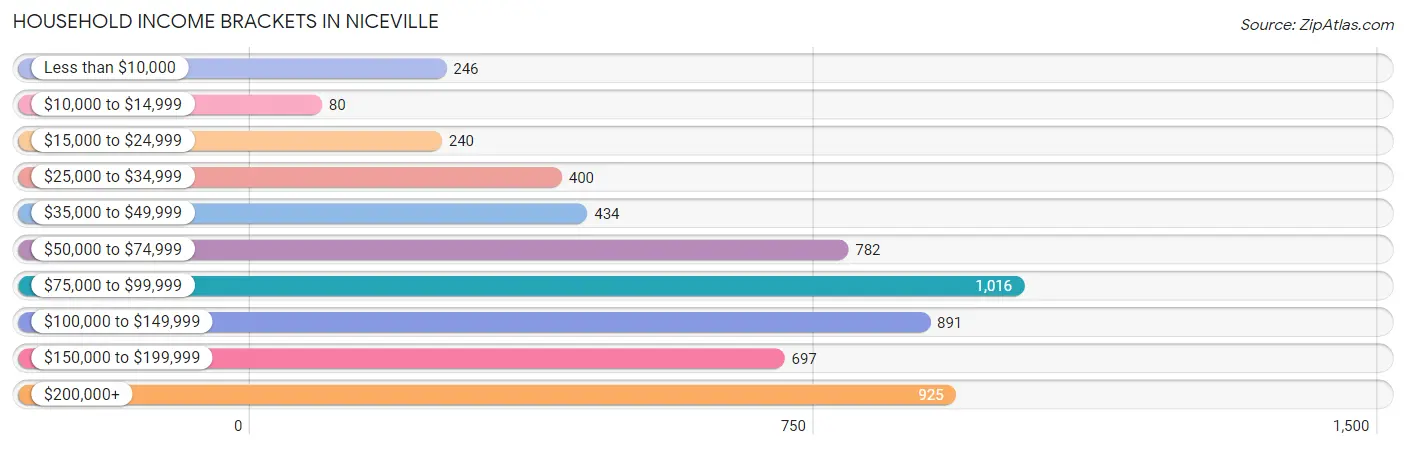
| Income Bracket | # Households | % Households |
| Less than $10,000 | 246 | 4.3% |
| $10,000 to $14,999 | 80 | 1.4% |
| $15,000 to $24,999 | 240 | 4.2% |
| $25,000 to $34,999 | 400 | 7.0% |
| $35,000 to $49,999 | 434 | 7.6% |
| $50,000 to $74,999 | 782 | 13.7% |
| $75,000 to $99,999 | 1,016 | 17.8% |
| $100,000 to $149,999 | 891 | 15.6% |
| $150,000 to $199,999 | 697 | 12.2% |
| $200,000+ | 925 | 16.2% |
Household Income by Householder Age in Niceville
The median household income in Niceville is $92,345, with the highest median household income of $131,417 found in the 45 to 64 years age bracket for the primary householder. A total of 2,135 households (37.4%) fall into this category. Meanwhile, the 15 to 24 years age bracket for the primary householder has the lowest median household income of $0, with 177 households (3.1%) in this group.
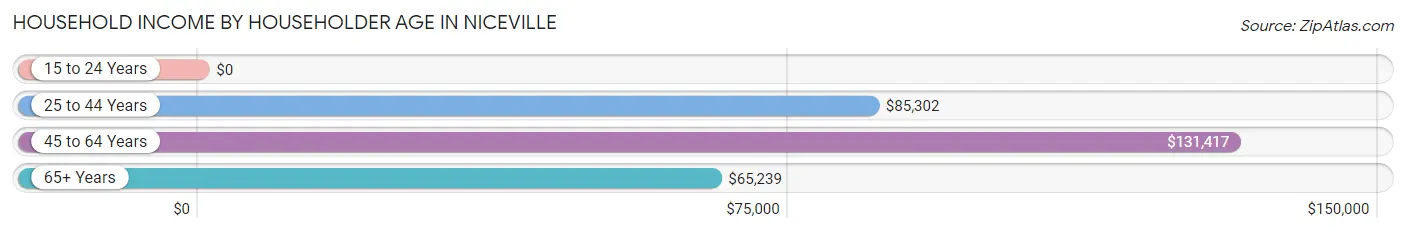
| Income Bracket | # Households | Median Income |
| 15 to 24 Years | 177 (3.1%) | $0 |
| 25 to 44 Years | 1,715 (30.0%) | $85,302 |
| 45 to 64 Years | 2,135 (37.4%) | $131,417 |
| 65+ Years | 1,683 (29.5%) | $65,239 |
| Total | 5,710 (100.0%) | $92,345 |
Poverty in Niceville
Income Below Poverty by Sex and Age in Niceville
With 7.4% poverty level for males and 10.1% for females among the residents of Niceville, 5 year old males and under 5 year old females are the most vulnerable to poverty, with 38 males (33.3%) and 95 females (16.9%) in their respective age groups living below the poverty level.
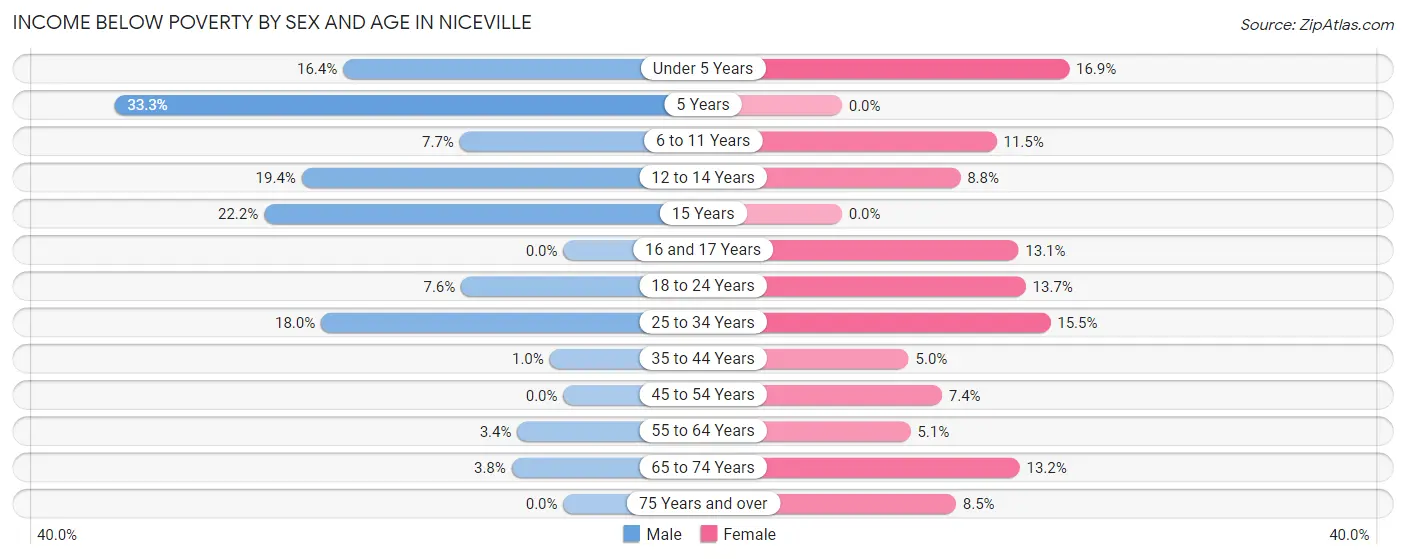
| Age Bracket | Male | Female |
| Under 5 Years | 54 (16.4%) | 95 (16.9%) |
| 5 Years | 38 (33.3%) | 0 (0.0%) |
| 6 to 11 Years | 52 (7.7%) | 74 (11.5%) |
| 12 to 14 Years | 96 (19.4%) | 34 (8.8%) |
| 15 Years | 18 (22.2%) | 0 (0.0%) |
| 16 and 17 Years | 0 (0.0%) | 16 (13.1%) |
| 18 to 24 Years | 44 (7.6%) | 123 (13.7%) |
| 25 to 34 Years | 188 (18.0%) | 109 (15.5%) |
| 35 to 44 Years | 10 (1.0%) | 59 (5.0%) |
| 45 to 54 Years | 0 (0.0%) | 75 (7.4%) |
| 55 to 64 Years | 32 (3.4%) | 45 (5.1%) |
| 65 to 74 Years | 29 (3.8%) | 136 (13.2%) |
| 75 Years and over | 0 (0.0%) | 46 (8.5%) |
| Total | 561 (7.4%) | 812 (10.1%) |
Income Above Poverty by Sex and Age in Niceville
According to the poverty statistics in Niceville, males aged 16 and 17 years and females aged 5 years are the age groups that are most secure financially, with 100.0% of males and 100.0% of females in these age groups living above the poverty line.
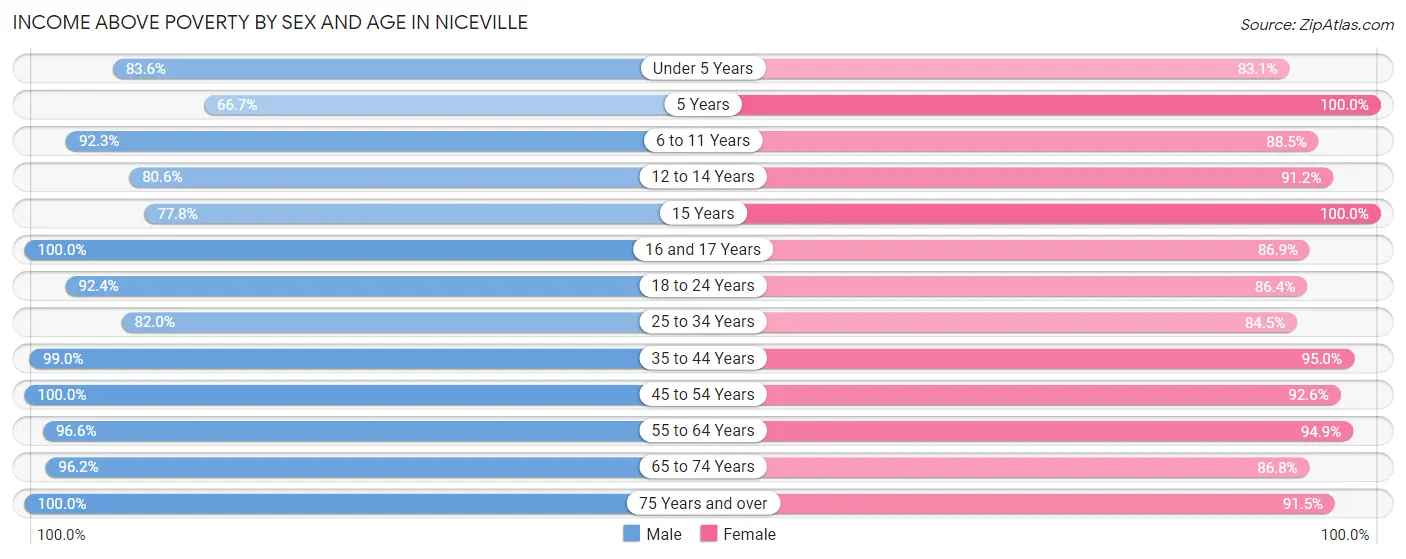
| Age Bracket | Male | Female |
| Under 5 Years | 276 (83.6%) | 468 (83.1%) |
| 5 Years | 76 (66.7%) | 28 (100.0%) |
| 6 to 11 Years | 623 (92.3%) | 570 (88.5%) |
| 12 to 14 Years | 398 (80.6%) | 353 (91.2%) |
| 15 Years | 63 (77.8%) | 32 (100.0%) |
| 16 and 17 Years | 205 (100.0%) | 106 (86.9%) |
| 18 to 24 Years | 536 (92.4%) | 778 (86.4%) |
| 25 to 34 Years | 857 (82.0%) | 595 (84.5%) |
| 35 to 44 Years | 972 (99.0%) | 1,131 (95.0%) |
| 45 to 54 Years | 940 (100.0%) | 935 (92.6%) |
| 55 to 64 Years | 904 (96.6%) | 837 (94.9%) |
| 65 to 74 Years | 727 (96.2%) | 894 (86.8%) |
| 75 Years and over | 477 (100.0%) | 497 (91.5%) |
| Total | 7,054 (92.6%) | 7,224 (89.9%) |
Income Below Poverty Among Married-Couple Families in Niceville
The poverty statistics for married-couple families in Niceville show that 1.8% or 65 of the total 3,544 families live below the poverty line. Families with 3 or 4 children have the highest poverty rate of 8.8%, comprising of 30 families. On the other hand, families with 1 or 2 children have the lowest poverty rate of 0.0%, which includes 0 families.
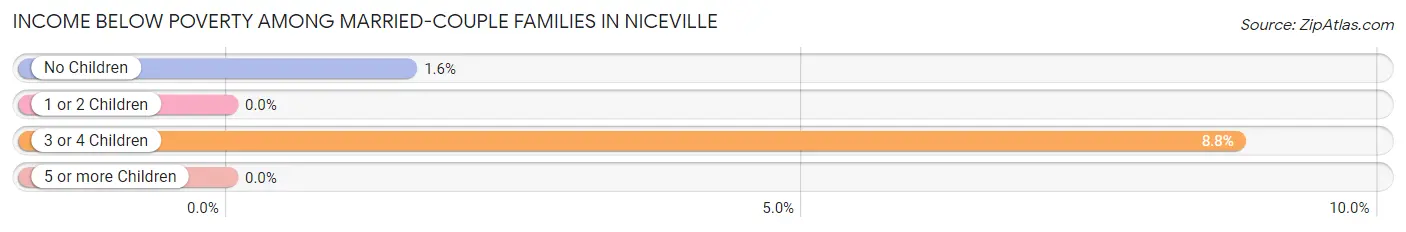
| Children | Above Poverty | Below Poverty |
| No Children | 2,206 (98.4%) | 35 (1.6%) |
| 1 or 2 Children | 940 (100.0%) | 0 (0.0%) |
| 3 or 4 Children | 312 (91.2%) | 30 (8.8%) |
| 5 or more Children | 21 (100.0%) | 0 (0.0%) |
| Total | 3,479 (98.2%) | 65 (1.8%) |
Income Below Poverty Among Single-Parent Households in Niceville
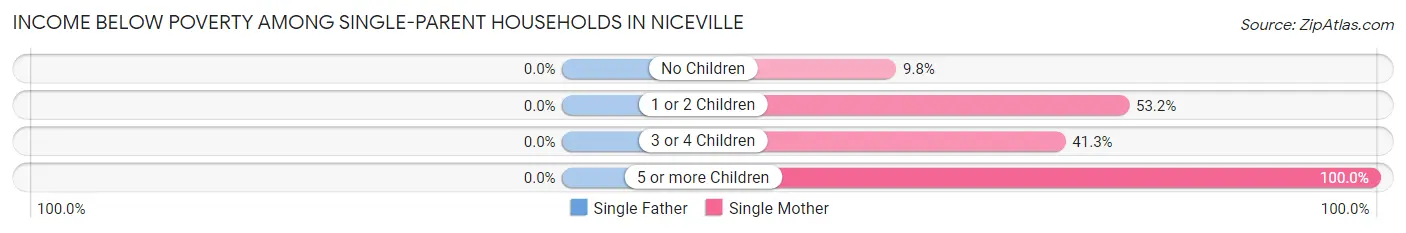
| Children | Single Father | Single Mother |
| No Children | 0 (0.0%) | 16 (9.8%) |
| 1 or 2 Children | 0 (0.0%) | 210 (53.2%) |
| 3 or 4 Children | 0 (0.0%) | 19 (41.3%) |
| 5 or more Children | 0 (0.0%) | 18 (100.0%) |
| Total | 0 (0.0%) | 263 (42.2%) |
Income Below Poverty Among Married-Couple vs Single-Parent Households in Niceville
The poverty data for Niceville shows that 65 of the married-couple family households (1.8%) and 263 of the single-parent households (35.3%) are living below the poverty level. Within the married-couple family households, those with 3 or 4 children have the highest poverty rate, with 30 households (8.8%) falling below the poverty line. Among the single-parent households, those with 5 or more children have the highest poverty rate, with 18 household (100.0%) living below poverty.
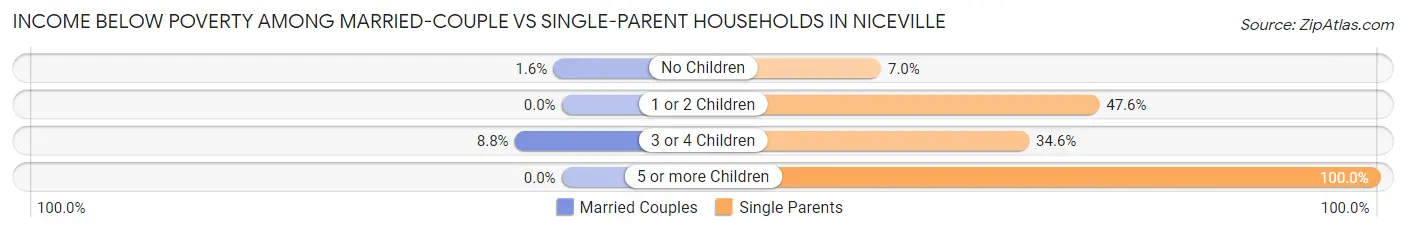
| Children | Married-Couple Families | Single-Parent Households |
| No Children | 35 (1.6%) | 16 (7.0%) |
| 1 or 2 Children | 0 (0.0%) | 210 (47.6%) |
| 3 or 4 Children | 30 (8.8%) | 19 (34.5%) |
| 5 or more Children | 0 (0.0%) | 18 (100.0%) |
| Total | 65 (1.8%) | 263 (35.3%) |
Race in Niceville
The most populous races in Niceville are White / Caucasian (13,068 | 82.7%), Black / African American (1,056 | 6.7%), and Hispanic or Latino (896 | 5.7%).
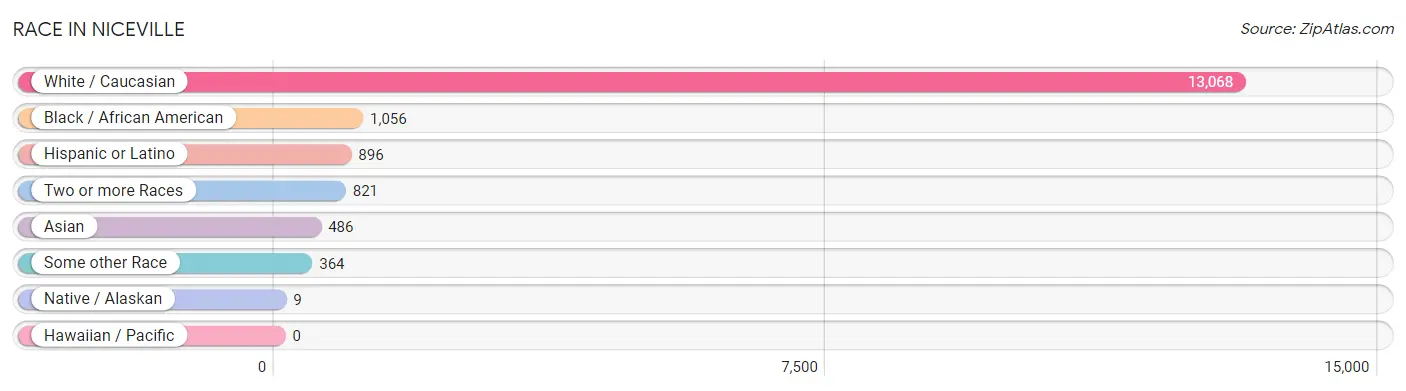
| Race | # Population | % Population |
| Asian | 486 | 3.1% |
| Black / African American | 1,056 | 6.7% |
| Hawaiian / Pacific | 0 | 0.0% |
| Hispanic or Latino | 896 | 5.7% |
| Native / Alaskan | 9 | 0.1% |
| White / Caucasian | 13,068 | 82.7% |
| Two or more Races | 821 | 5.2% |
| Some other Race | 364 | 2.3% |
| Total | 15,804 | 100.0% |
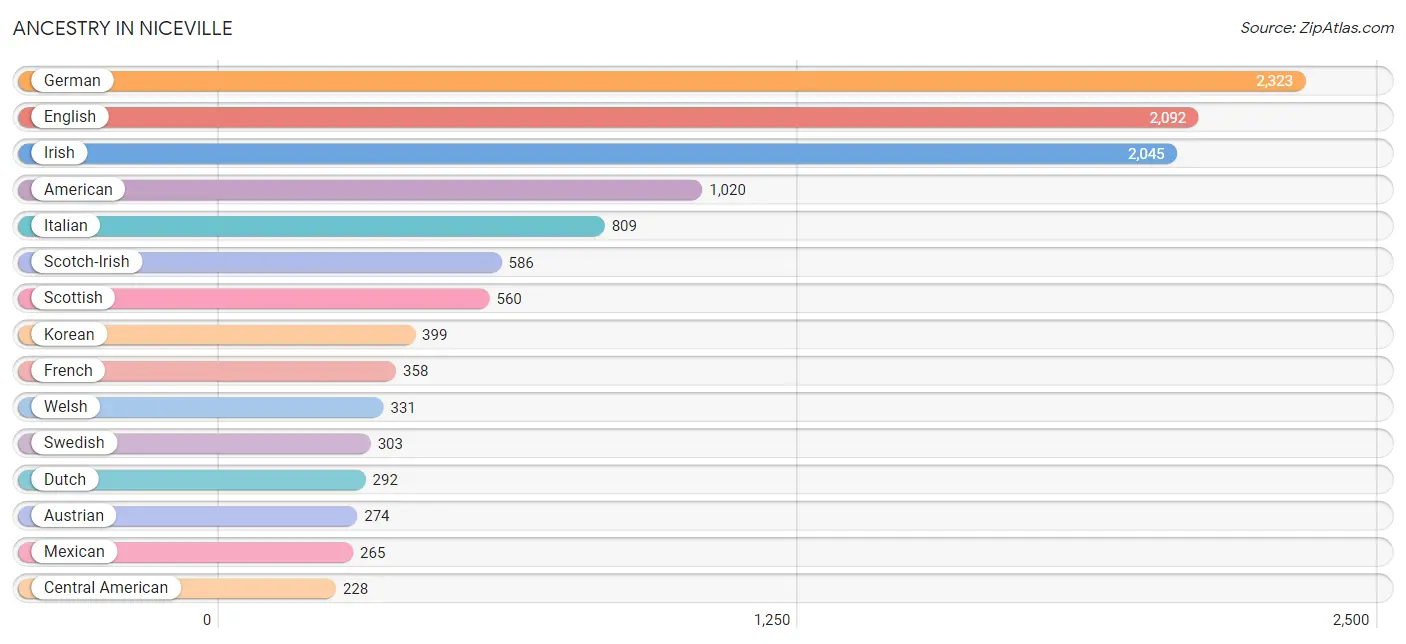
Ancestry in Niceville
The most populous ancestries reported in Niceville are German (2,323 | 14.7%), English (2,092 | 13.2%), Irish (2,045 | 12.9%), American (1,020 | 6.5%), and Italian (809 | 5.1%), together accounting for 52.4% of all Niceville residents.
| Ancestry | # Population | % Population |
| African | 19 | 0.1% |
| Albanian | 16 | 0.1% |
| American | 1,020 | 6.5% |
| Arab | 9 | 0.1% |
| Austrian | 274 | 1.7% |
| Belgian | 37 | 0.2% |
| Bhutanese | 58 | 0.4% |
| Bolivian | 4 | 0.0% |
| Brazilian | 24 | 0.2% |
| British | 202 | 1.3% |
| Burmese | 51 | 0.3% |
| Canadian | 17 | 0.1% |
| Central American | 228 | 1.4% |
| Cherokee | 57 | 0.4% |
| Colombian | 61 | 0.4% |
| Costa Rican | 33 | 0.2% |
| Creek | 11 | 0.1% |
| Croatian | 10 | 0.1% |
| Cuban | 8 | 0.1% |
| Czech | 13 | 0.1% |
| Danish | 96 | 0.6% |
| Dutch | 292 | 1.8% |
| Eastern European | 29 | 0.2% |
| English | 2,092 | 13.2% |
| European | 194 | 1.2% |
| Filipino | 38 | 0.2% |
| French | 358 | 2.3% |
| French American Indian | 7 | 0.0% |
| French Canadian | 47 | 0.3% |
| German | 2,323 | 14.7% |
| Greek | 98 | 0.6% |
| Hungarian | 199 | 1.3% |
| Indian (Asian) | 10 | 0.1% |
| Irish | 2,045 | 12.9% |
| Italian | 809 | 5.1% |
| Korean | 399 | 2.5% |
| Laotian | 20 | 0.1% |
| Lebanese | 9 | 0.1% |
| Lithuanian | 71 | 0.4% |
| Mexican | 265 | 1.7% |
| Native Hawaiian | 82 | 0.5% |
| Nicaraguan | 14 | 0.1% |
| Nigerian | 50 | 0.3% |
| Norwegian | 189 | 1.2% |
| Pakistani | 19 | 0.1% |
| Panamanian | 114 | 0.7% |
| Paraguayan | 20 | 0.1% |
| Pennsylvania German | 8 | 0.1% |
| Polish | 208 | 1.3% |
| Portuguese | 133 | 0.8% |
| Puerto Rican | 128 | 0.8% |
| Russian | 30 | 0.2% |
| Salvadoran | 67 | 0.4% |
| Scandinavian | 77 | 0.5% |
| Scotch-Irish | 586 | 3.7% |
| Scottish | 560 | 3.5% |
| Serbian | 21 | 0.1% |
| Slovak | 21 | 0.1% |
| South American | 85 | 0.5% |
| Spaniard | 36 | 0.2% |
| Spanish | 8 | 0.1% |
| Sri Lankan | 123 | 0.8% |
| Subsaharan African | 69 | 0.4% |
| Swedish | 303 | 1.9% |
| Swiss | 34 | 0.2% |
| Thai | 21 | 0.1% |
| Ukrainian | 71 | 0.4% |
| Welsh | 331 | 2.1% |
| West Indian | 12 | 0.1% | View All 69 Rows |
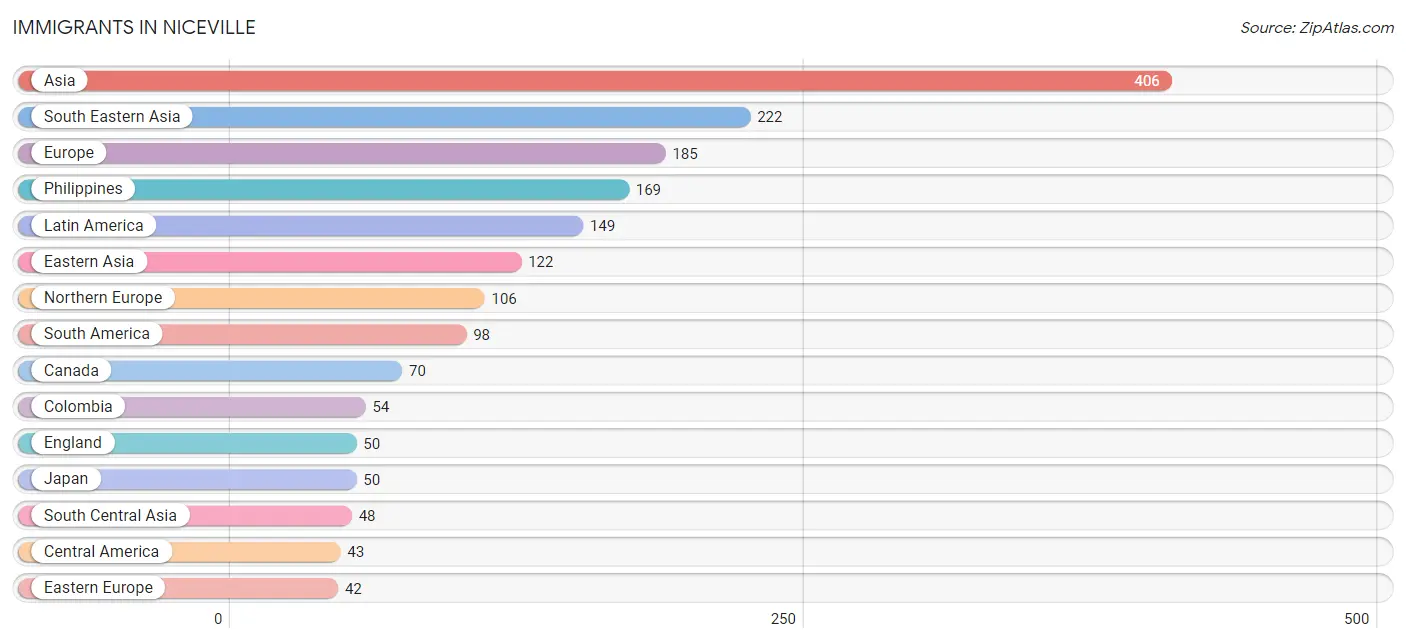
Immigrants in Niceville
The most numerous immigrant groups reported in Niceville came from Asia (406 | 2.6%), South Eastern Asia (222 | 1.4%), Europe (185 | 1.2%), Philippines (169 | 1.1%), and Latin America (149 | 0.9%), together accounting for 7.2% of all Niceville residents.
| Immigration Origin | # Population | % Population |
| Africa | 1 | 0.0% |
| Asia | 406 | 2.6% |
| Brazil | 24 | 0.2% |
| Canada | 70 | 0.4% |
| Caribbean | 8 | 0.1% |
| Central America | 43 | 0.3% |
| China | 34 | 0.2% |
| Colombia | 54 | 0.3% |
| Cuba | 8 | 0.1% |
| Eastern Asia | 122 | 0.8% |
| Eastern Europe | 42 | 0.3% |
| England | 50 | 0.3% |
| Europe | 185 | 1.2% |
| France | 14 | 0.1% |
| Germany | 16 | 0.1% |
| Guatemala | 16 | 0.1% |
| Hong Kong | 15 | 0.1% |
| India | 21 | 0.1% |
| Indonesia | 10 | 0.1% |
| Ireland | 16 | 0.1% |
| Italy | 7 | 0.0% |
| Japan | 50 | 0.3% |
| Korea | 38 | 0.2% |
| Latin America | 149 | 0.9% |
| Nepal | 18 | 0.1% |
| Nicaragua | 14 | 0.1% |
| Northern Europe | 106 | 0.7% |
| Oceania | 38 | 0.2% |
| Panama | 13 | 0.1% |
| Philippines | 169 | 1.1% |
| Russia | 25 | 0.2% |
| South Africa | 1 | 0.0% |
| South America | 98 | 0.6% |
| South Central Asia | 48 | 0.3% |
| South Eastern Asia | 222 | 1.4% |
| Southern Europe | 7 | 0.0% |
| Sri Lanka | 9 | 0.1% |
| Taiwan | 19 | 0.1% |
| Thailand | 9 | 0.1% |
| Turkey | 14 | 0.1% |
| Ukraine | 17 | 0.1% |
| Vietnam | 34 | 0.2% |
| Western Asia | 14 | 0.1% |
| Western Europe | 30 | 0.2% | View All 44 Rows |
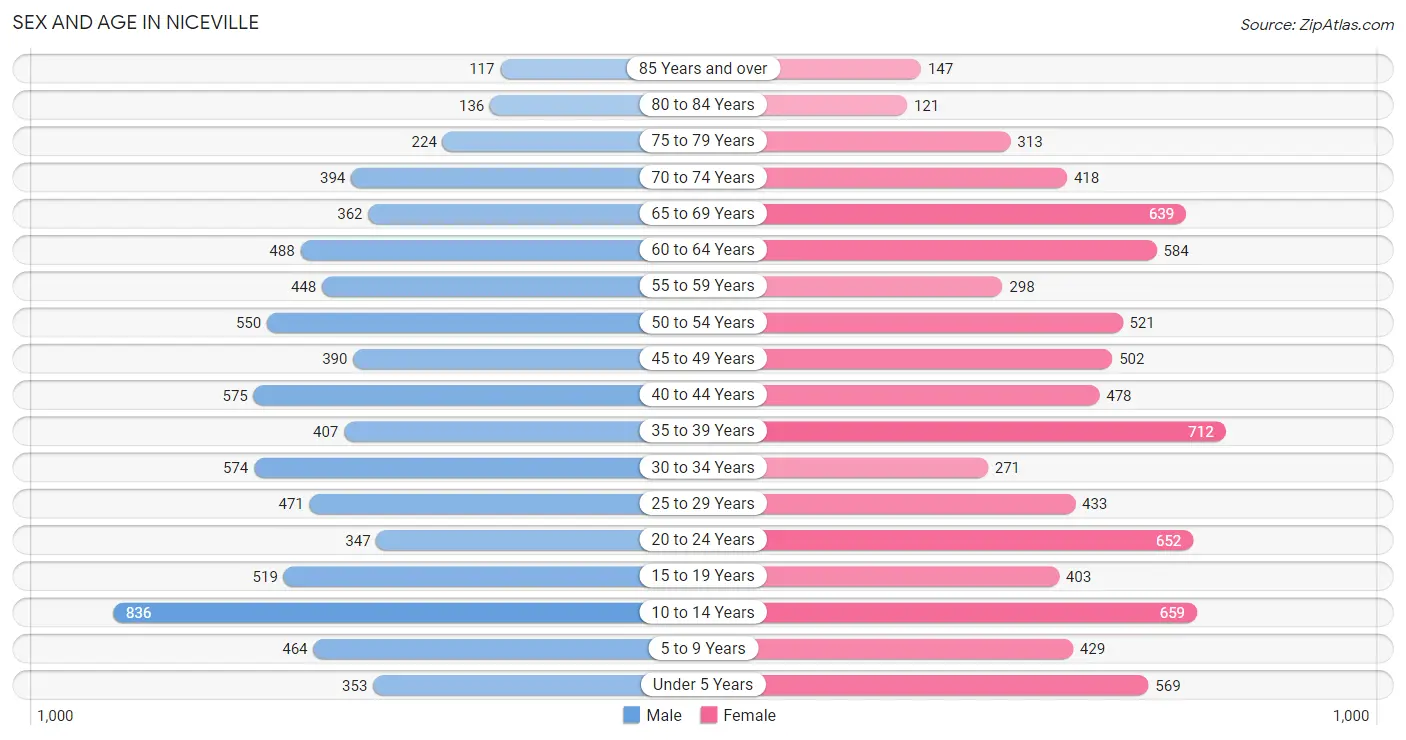
Sex and Age in Niceville
Sex and Age in Niceville
The most populous age groups in Niceville are 10 to 14 Years (836 | 10.9%) for men and 35 to 39 Years (712 | 8.7%) for women.
| Age Bracket | Male | Female |
| Under 5 Years | 353 (4.6%) | 569 (7.0%) |
| 5 to 9 Years | 464 (6.1%) | 429 (5.3%) |
| 10 to 14 Years | 836 (10.9%) | 659 (8.1%) |
| 15 to 19 Years | 519 (6.8%) | 403 (5.0%) |
| 20 to 24 Years | 347 (4.5%) | 652 (8.0%) |
| 25 to 29 Years | 471 (6.1%) | 433 (5.3%) |
| 30 to 34 Years | 574 (7.5%) | 271 (3.3%) |
| 35 to 39 Years | 407 (5.3%) | 712 (8.7%) |
| 40 to 44 Years | 575 (7.5%) | 478 (5.9%) |
| 45 to 49 Years | 390 (5.1%) | 502 (6.2%) |
| 50 to 54 Years | 550 (7.2%) | 521 (6.4%) |
| 55 to 59 Years | 448 (5.9%) | 298 (3.7%) |
| 60 to 64 Years | 488 (6.4%) | 584 (7.2%) |
| 65 to 69 Years | 362 (4.7%) | 639 (7.8%) |
| 70 to 74 Years | 394 (5.1%) | 418 (5.1%) |
| 75 to 79 Years | 224 (2.9%) | 313 (3.8%) |
| 80 to 84 Years | 136 (1.8%) | 121 (1.5%) |
| 85 Years and over | 117 (1.5%) | 147 (1.8%) |
| Total | 7,655 (100.0%) | 8,149 (100.0%) |
Families and Households in Niceville
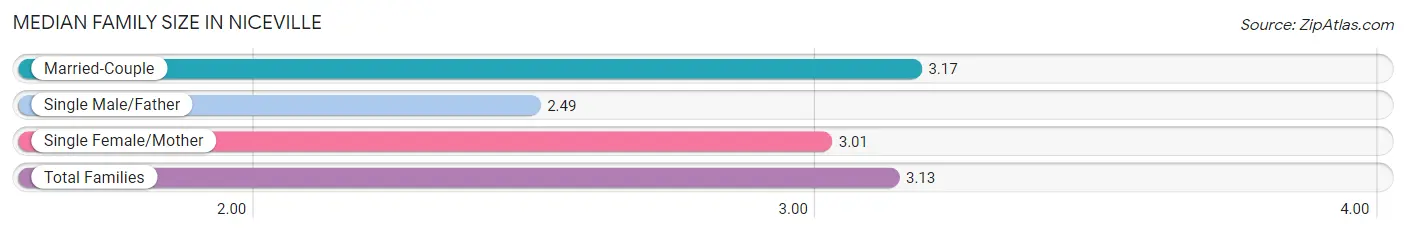
Median Family Size in Niceville
The median family size in Niceville is 3.13 persons per family, with married-couple families (3,544 | 82.7%) accounting for the largest median family size of 3.17 persons per family. On the other hand, single male/father families (121 | 2.8%) represent the smallest median family size with 2.49 persons per family.
| Family Type | # Families | Family Size |
| Married-Couple | 3,544 (82.7%) | 3.17 |
| Single Male/Father | 121 (2.8%) | 2.49 |
| Single Female/Mother | 623 (14.5%) | 3.01 |
| Total Families | 4,288 (100.0%) | 3.13 |
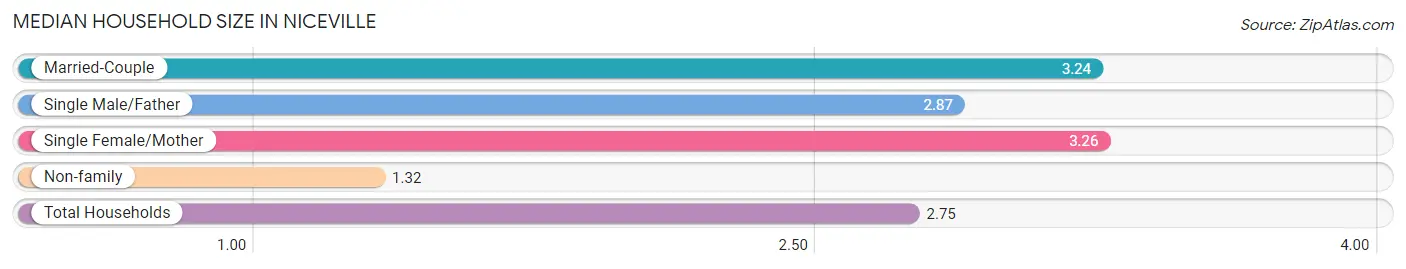
Median Household Size in Niceville
The median household size in Niceville is 2.75 persons per household, with single female/mother households (623 | 10.9%) accounting for the largest median household size of 3.26 persons per household. non-family households (1,422 | 24.9%) represent the smallest median household size with 1.32 persons per household.
| Household Type | # Households | Household Size |
| Married-Couple | 3,544 (62.1%) | 3.24 |
| Single Male/Father | 121 (2.1%) | 2.87 |
| Single Female/Mother | 623 (10.9%) | 3.26 |
| Non-family | 1,422 (24.9%) | 1.32 |
| Total Households | 5,710 (100.0%) | 2.75 |
Household Size by Marriage Status in Niceville
Out of a total of 5,710 households in Niceville, 4,288 (75.1%) are family households, while 1,422 (24.9%) are nonfamily households. The most numerous type of family households are 2-person households, comprising 1,948, and the most common type of nonfamily households are 1-person households, comprising 1,206.
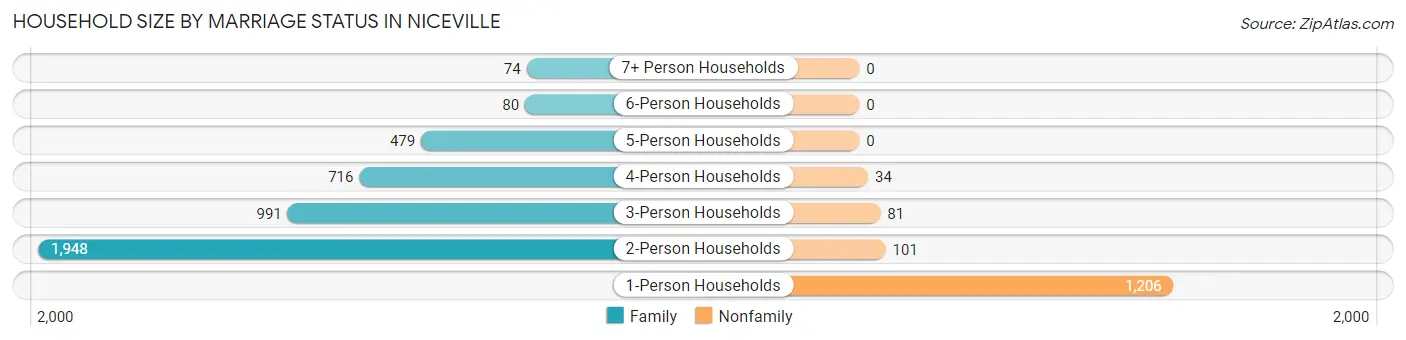
| Household Size | Family Households | Nonfamily Households |
| 1-Person Households | - | 1,206 (21.1%) |
| 2-Person Households | 1,948 (34.1%) | 101 (1.8%) |
| 3-Person Households | 991 (17.4%) | 81 (1.4%) |
| 4-Person Households | 716 (12.5%) | 34 (0.6%) |
| 5-Person Households | 479 (8.4%) | 0 (0.0%) |
| 6-Person Households | 80 (1.4%) | 0 (0.0%) |
| 7+ Person Households | 74 (1.3%) | 0 (0.0%) |
| Total | 4,288 (75.1%) | 1,422 (24.9%) |
Female Fertility in Niceville
Fertility by Age in Niceville
Average fertility rate in Niceville is 81.0 births per 1,000 women. Women in the age bracket of 20 to 34 years have the highest fertility rate with 128.0 births per 1,000 women. Women in the age bracket of 20 to 34 years acount for 59.9% of all women with births.
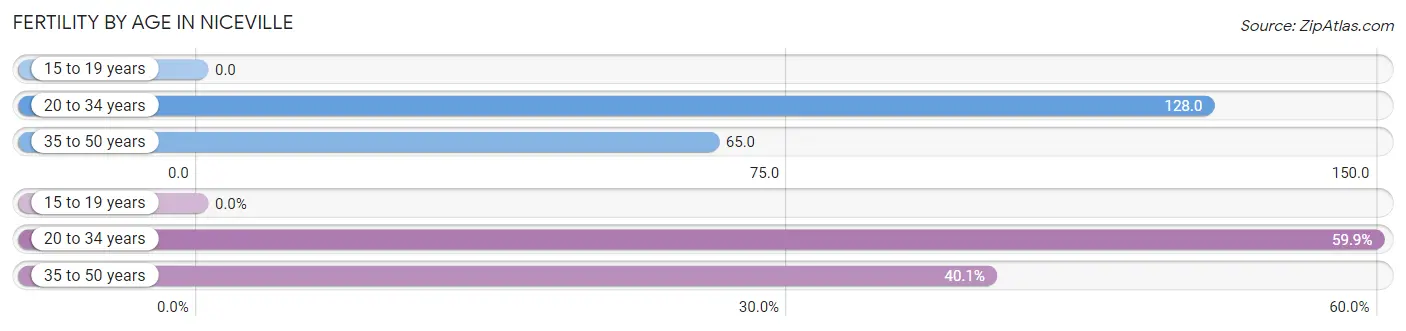
| Age Bracket | Women with Births | Births / 1,000 Women |
| 15 to 19 years | 0 (0.0%) | 0.0 |
| 20 to 34 years | 173 (59.9%) | 128.0 |
| 35 to 50 years | 116 (40.1%) | 65.0 |
| Total | 289 (100.0%) | 81.0 |
Fertility by Age by Marriage Status in Niceville
94.8% of women with births (289) in Niceville are married. The highest percentage of unmarried women with births falls into 20 to 34 years age bracket with 8.7% of them unmarried at the time of birth, while the lowest percentage of unmarried women with births belong to 35 to 50 years age bracket with 0.0% of them unmarried.
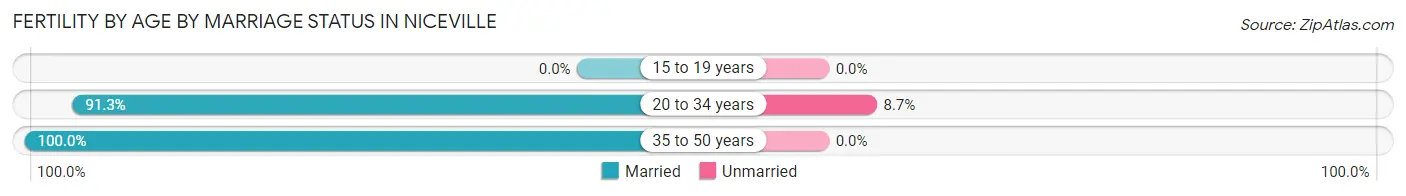
| Age Bracket | Married | Unmarried |
| 15 to 19 years | 0 (0.0%) | 0 (0.0%) |
| 20 to 34 years | 158 (91.3%) | 15 (8.7%) |
| 35 to 50 years | 116 (100.0%) | 0 (0.0%) |
| Total | 274 (94.8%) | 15 (5.2%) |
Fertility by Education in Niceville
Average fertility rate in Niceville is 81.0 births per 1,000 women. Women with the education attainment of bachelor's degree have the highest fertility rate of 126.0 births per 1,000 women, while women with the education attainment of graduate degree have the lowest fertility at 47.0 births per 1,000 women. Women with the education attainment of college or associate's degree represent 47.1% of all women with births.
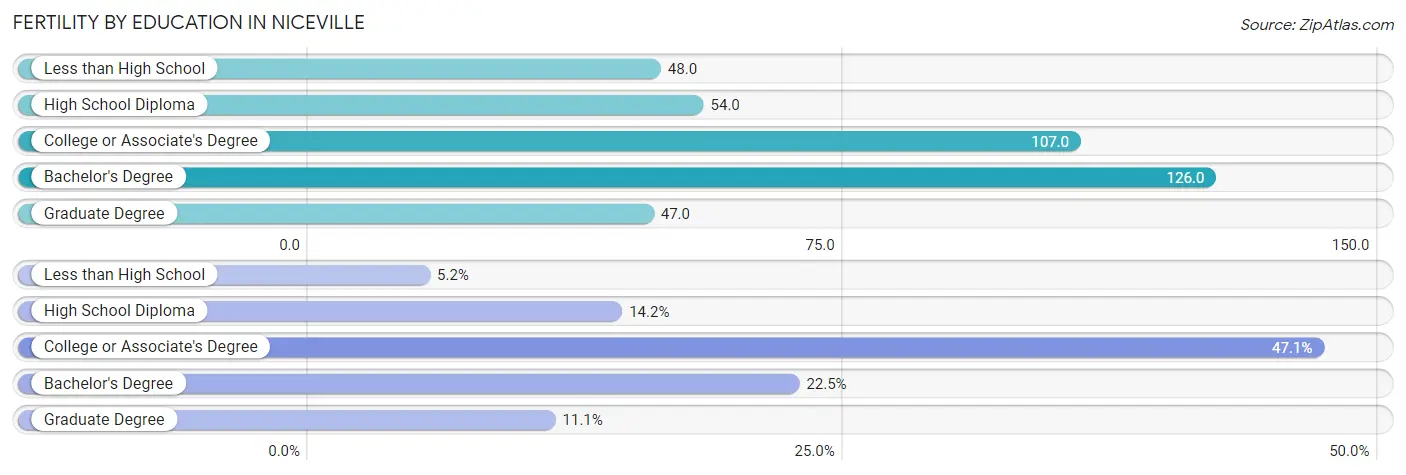
| Educational Attainment | Women with Births | Births / 1,000 Women |
| Less than High School | 15 (5.2%) | 48.0 |
| High School Diploma | 41 (14.2%) | 54.0 |
| College or Associate's Degree | 136 (47.1%) | 107.0 |
| Bachelor's Degree | 65 (22.5%) | 126.0 |
| Graduate Degree | 32 (11.1%) | 47.0 |
| Total | 289 (100.0%) | 81.0 |
Fertility by Education by Marriage Status in Niceville
5.2% of women with births in Niceville are unmarried. Women with the educational attainment of high school diploma are most likely to be married with 100.0% of them married at childbirth, while women with the educational attainment of less than high school are least likely to be married with 100.0% of them unmarried at childbirth.
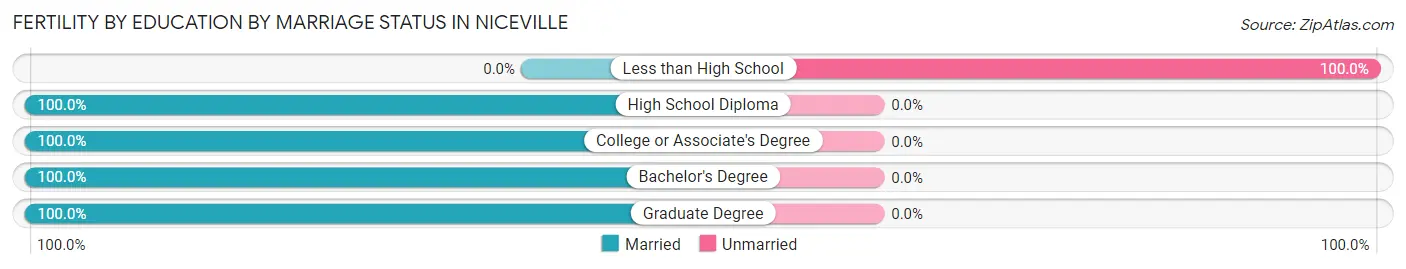
| Educational Attainment | Married | Unmarried |
| Less than High School | 0 (0.0%) | 15 (100.0%) |
| High School Diploma | 41 (100.0%) | 0 (0.0%) |
| College or Associate's Degree | 136 (100.0%) | 0 (0.0%) |
| Bachelor's Degree | 65 (100.0%) | 0 (0.0%) |
| Graduate Degree | 32 (100.0%) | 0 (0.0%) |
| Total | 274 (94.8%) | 15 (5.2%) |
Employment Characteristics in Niceville
Employment by Class of Employer in Niceville
Among the 7,475 employed individuals in Niceville, private company employees (4,224 | 56.5%), federal government employees (1,613 | 21.6%), and self-employed (incorporated) (511 | 6.8%) make up the most common classes of employment.
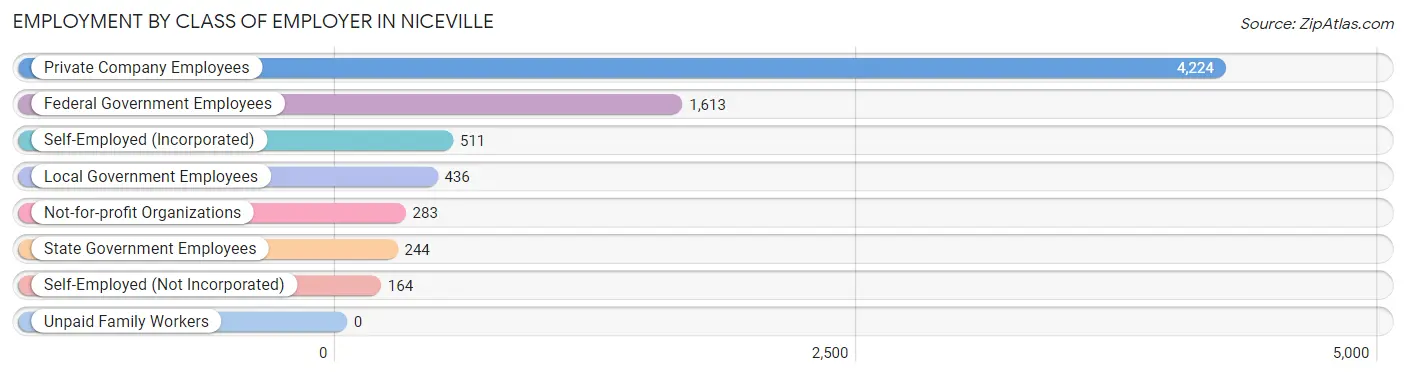
| Employer Class | # Employees | % Employees |
| Private Company Employees | 4,224 | 56.5% |
| Self-Employed (Incorporated) | 511 | 6.8% |
| Self-Employed (Not Incorporated) | 164 | 2.2% |
| Not-for-profit Organizations | 283 | 3.8% |
| Local Government Employees | 436 | 5.8% |
| State Government Employees | 244 | 3.3% |
| Federal Government Employees | 1,613 | 21.6% |
| Unpaid Family Workers | 0 | 0.0% |
| Total | 7,475 | 100.0% |
Employment Status by Age in Niceville
According to the labor force statistics for Niceville, out of the total population over 16 years of age (12,381), 62.4% or 7,726 individuals are in the labor force, with 1.2% or 93 of them unemployed. The age group with the highest labor force participation rate is 30 to 34 years, with 88.8% or 750 individuals in the labor force. Within the labor force, the 16 to 19 years age range has the highest percentage of unemployed individuals, with 7.1% or 36 of them being unemployed.
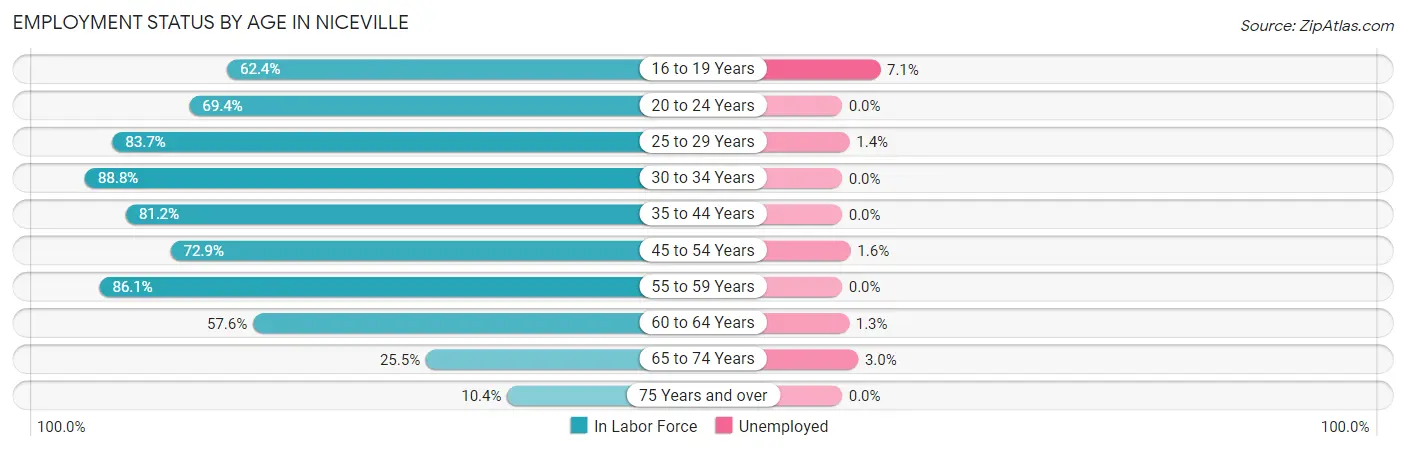
| Age Bracket | In Labor Force | Unemployed |
| 16 to 19 Years | 505 (62.4%) | 36 (7.1%) |
| 20 to 24 Years | 693 (69.4%) | 0 (0.0%) |
| 25 to 29 Years | 757 (83.7%) | 11 (1.4%) |
| 30 to 34 Years | 750 (88.8%) | 0 (0.0%) |
| 35 to 44 Years | 1,764 (81.2%) | 0 (0.0%) |
| 45 to 54 Years | 1,431 (72.9%) | 23 (1.6%) |
| 55 to 59 Years | 642 (86.1%) | 0 (0.0%) |
| 60 to 64 Years | 617 (57.6%) | 8 (1.3%) |
| 65 to 74 Years | 462 (25.5%) | 14 (3.0%) |
| 75 Years and over | 110 (10.4%) | 0 (0.0%) |
| Total | 7,726 (62.4%) | 93 (1.2%) |
Employment Status by Educational Attainment in Niceville
According to labor force statistics for Niceville, 77.4% of individuals (5,961) out of the total population between 25 and 64 years of age (7,702) are in the labor force, with 0.7% or 42 of them being unemployed. The group with the highest labor force participation rate are those with the educational attainment of bachelor's degree or higher, with 83.2% or 2,725 individuals in the labor force. Within the labor force, individuals with less than high school education have the highest percentage of unemployment, with 19.5% or 31 of them being unemployed.
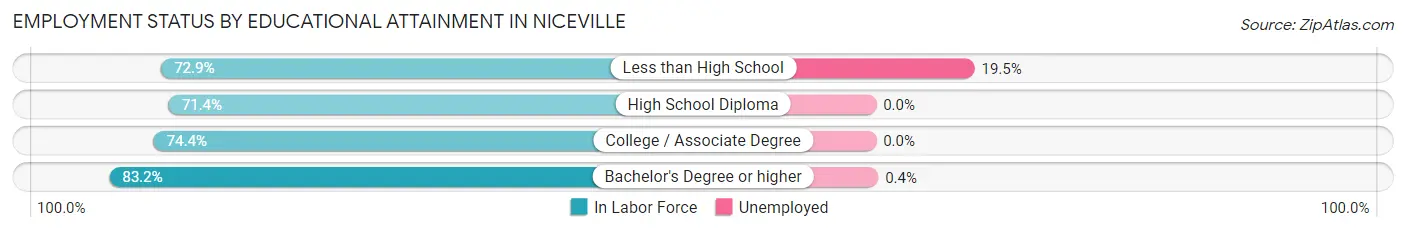
| Educational Attainment | In Labor Force | Unemployed |
| Less than High School | 159 (72.9%) | 43 (19.5%) |
| High School Diploma | 1,284 (71.4%) | 0 (0.0%) |
| College / Associate Degree | 1,794 (74.4%) | 0 (0.0%) |
| Bachelor's Degree or higher | 2,725 (83.2%) | 13 (0.4%) |
| Total | 5,961 (77.4%) | 54 (0.7%) |
Employment Occupations by Sex in Niceville
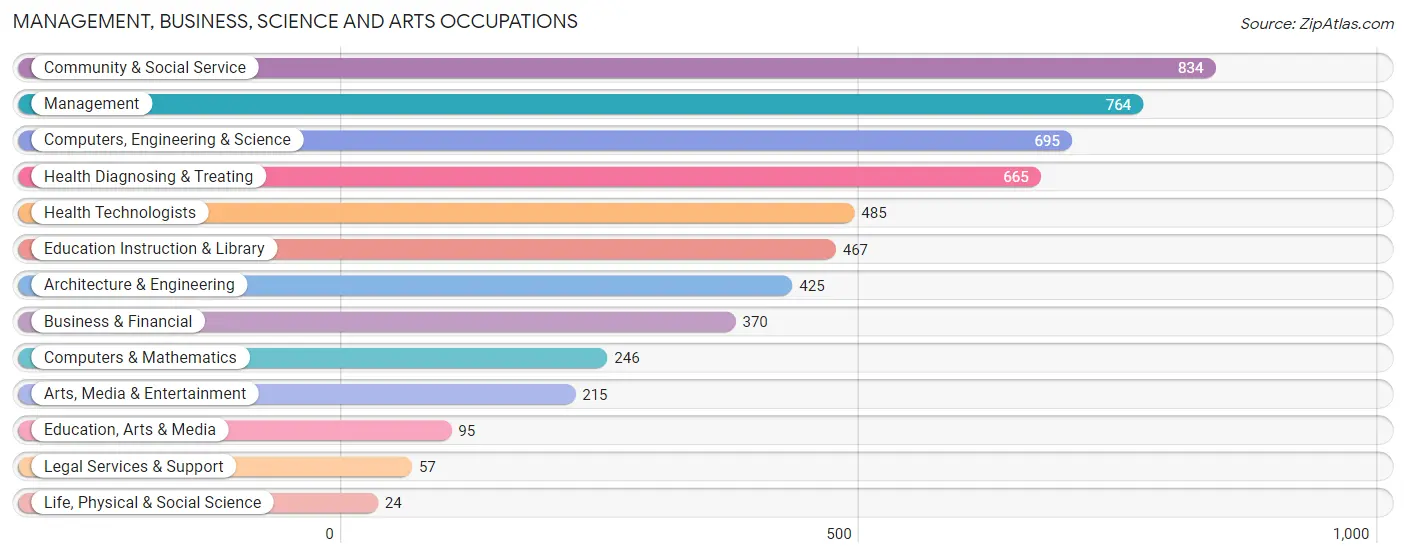
Management, Business, Science and Arts Occupations
The most common Management, Business, Science and Arts occupations in Niceville are Community & Social Service (834 | 11.5%), Management (764 | 10.5%), Computers, Engineering & Science (695 | 9.6%), Health Diagnosing & Treating (665 | 9.1%), and Health Technologists (485 | 6.7%).
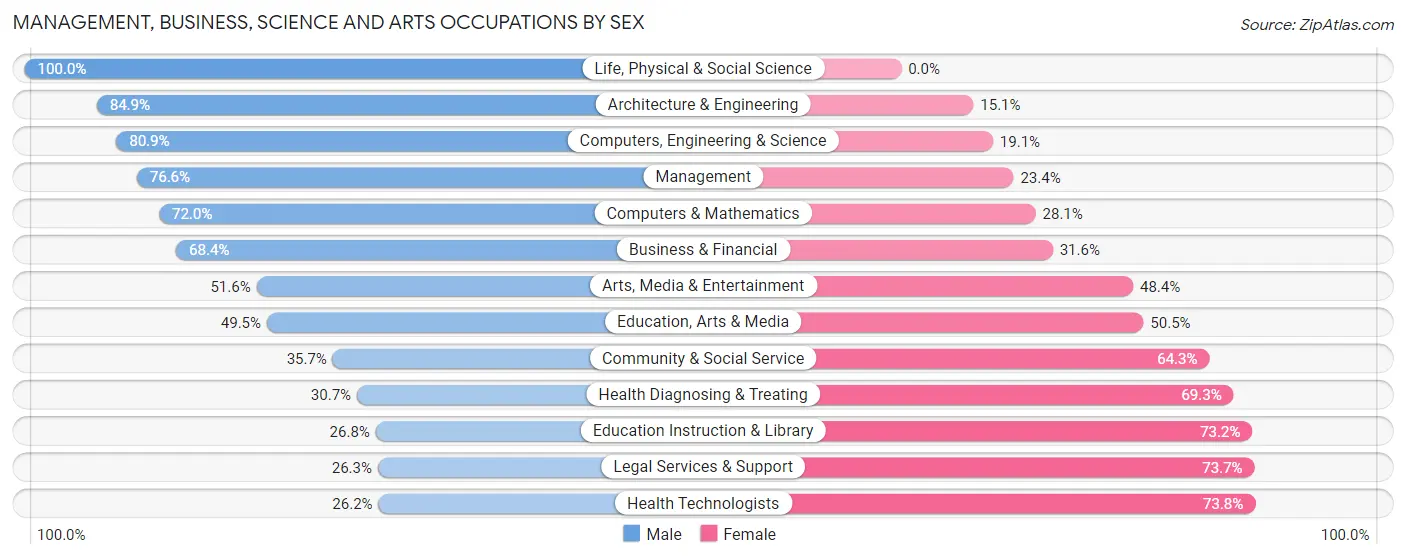
Management, Business, Science and Arts Occupations by Sex
Within the Management, Business, Science and Arts occupations in Niceville, the most male-oriented occupations are Life, Physical & Social Science (100.0%), Architecture & Engineering (84.9%), and Computers, Engineering & Science (80.9%), while the most female-oriented occupations are Health Technologists (73.8%), Legal Services & Support (73.7%), and Education Instruction & Library (73.2%).
| Occupation | Male | Female |
| Management | 585 (76.6%) | 179 (23.4%) |
| Business & Financial | 253 (68.4%) | 117 (31.6%) |
| Computers, Engineering & Science | 562 (80.9%) | 133 (19.1%) |
| Computers & Mathematics | 177 (72.0%) | 69 (28.1%) |
| Architecture & Engineering | 361 (84.9%) | 64 (15.1%) |
| Life, Physical & Social Science | 24 (100.0%) | 0 (0.0%) |
| Community & Social Service | 298 (35.7%) | 536 (64.3%) |
| Education, Arts & Media | 47 (49.5%) | 48 (50.5%) |
| Legal Services & Support | 15 (26.3%) | 42 (73.7%) |
| Education Instruction & Library | 125 (26.8%) | 342 (73.2%) |
| Arts, Media & Entertainment | 111 (51.6%) | 104 (48.4%) |
| Health Diagnosing & Treating | 204 (30.7%) | 461 (69.3%) |
| Health Technologists | 127 (26.2%) | 358 (73.8%) |
| Total (Category) | 1,902 (57.2%) | 1,426 (42.8%) |
| Total (Overall) | 4,062 (55.8%) | 3,215 (44.2%) |
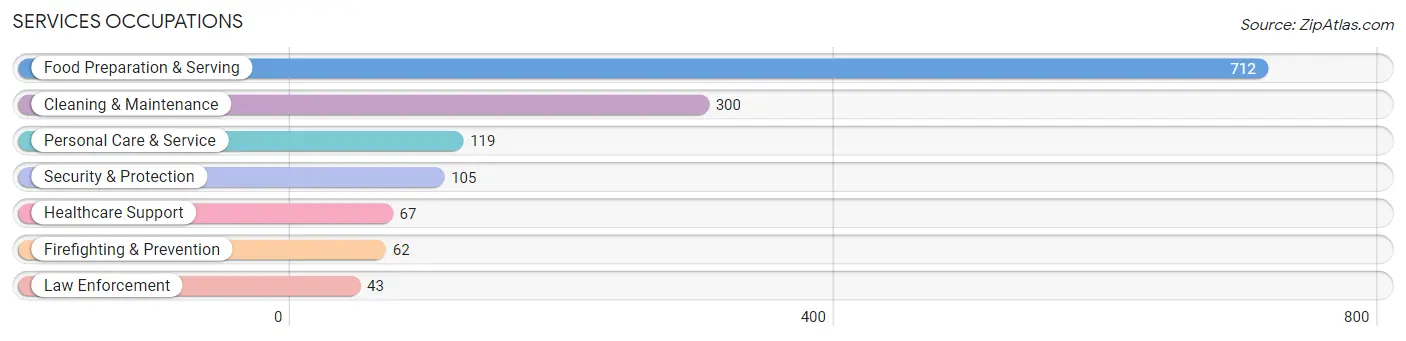
Services Occupations
The most common Services occupations in Niceville are Food Preparation & Serving (712 | 9.8%), Cleaning & Maintenance (300 | 4.1%), Personal Care & Service (119 | 1.6%), Security & Protection (105 | 1.4%), and Healthcare Support (67 | 0.9%).
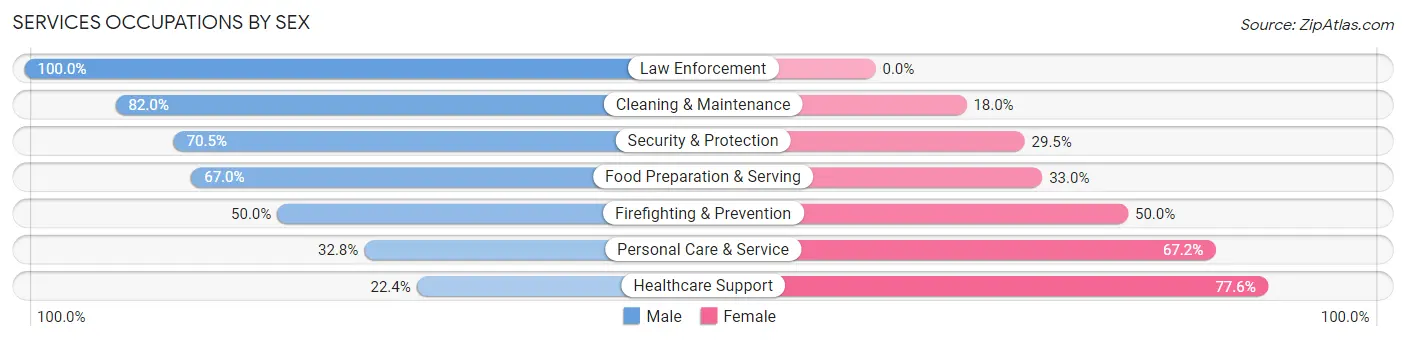
Services Occupations by Sex
Within the Services occupations in Niceville, the most male-oriented occupations are Law Enforcement (100.0%), Cleaning & Maintenance (82.0%), and Security & Protection (70.5%), while the most female-oriented occupations are Healthcare Support (77.6%), Personal Care & Service (67.2%), and Firefighting & Prevention (50.0%).
| Occupation | Male | Female |
| Healthcare Support | 15 (22.4%) | 52 (77.6%) |
| Security & Protection | 74 (70.5%) | 31 (29.5%) |
| Firefighting & Prevention | 31 (50.0%) | 31 (50.0%) |
| Law Enforcement | 43 (100.0%) | 0 (0.0%) |
| Food Preparation & Serving | 477 (67.0%) | 235 (33.0%) |
| Cleaning & Maintenance | 246 (82.0%) | 54 (18.0%) |
| Personal Care & Service | 39 (32.8%) | 80 (67.2%) |
| Total (Category) | 851 (65.3%) | 452 (34.7%) |
| Total (Overall) | 4,062 (55.8%) | 3,215 (44.2%) |
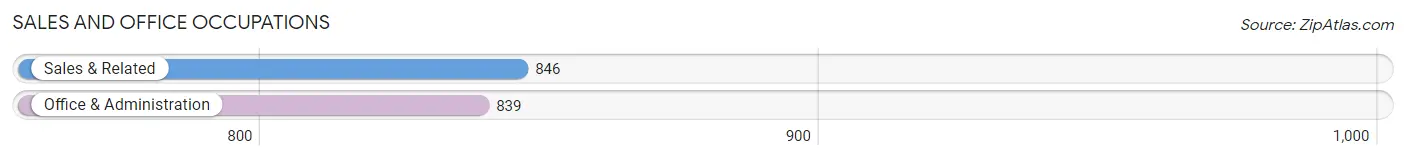
Sales and Office Occupations
The most common Sales and Office occupations in Niceville are Sales & Related (846 | 11.6%), and Office & Administration (839 | 11.5%).
Sales and Office Occupations by Sex
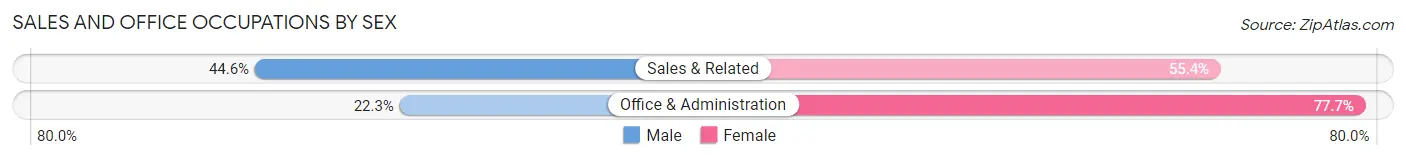
| Occupation | Male | Female |
| Sales & Related | 377 (44.6%) | 469 (55.4%) |
| Office & Administration | 187 (22.3%) | 652 (77.7%) |
| Total (Category) | 564 (33.5%) | 1,121 (66.5%) |
| Total (Overall) | 4,062 (55.8%) | 3,215 (44.2%) |
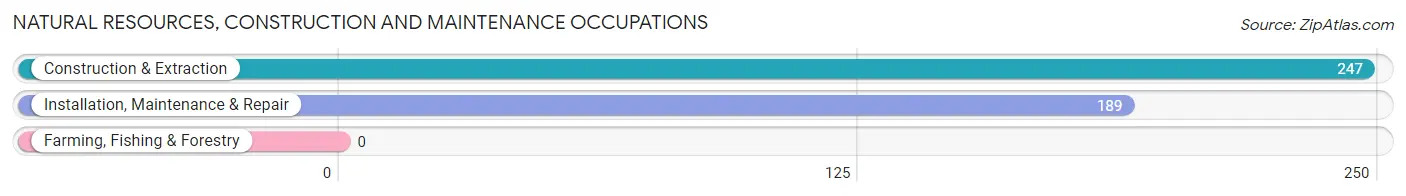
Natural Resources, Construction and Maintenance Occupations
The most common Natural Resources, Construction and Maintenance occupations in Niceville are Construction & Extraction (247 | 3.4%), and Installation, Maintenance & Repair (189 | 2.6%).
Natural Resources, Construction and Maintenance Occupations by Sex
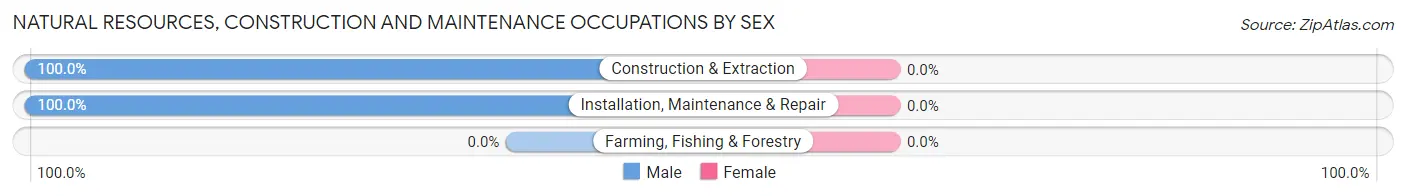
| Occupation | Male | Female |
| Farming, Fishing & Forestry | 0 (0.0%) | 0 (0.0%) |
| Construction & Extraction | 247 (100.0%) | 0 (0.0%) |
| Installation, Maintenance & Repair | 189 (100.0%) | 0 (0.0%) |
| Total (Category) | 436 (100.0%) | 0 (0.0%) |
| Total (Overall) | 4,062 (55.8%) | 3,215 (44.2%) |
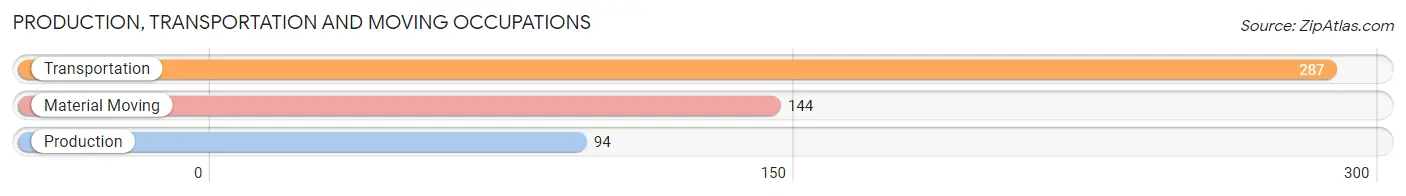
Production, Transportation and Moving Occupations
The most common Production, Transportation and Moving occupations in Niceville are Transportation (287 | 3.9%), Material Moving (144 | 2.0%), and Production (94 | 1.3%).
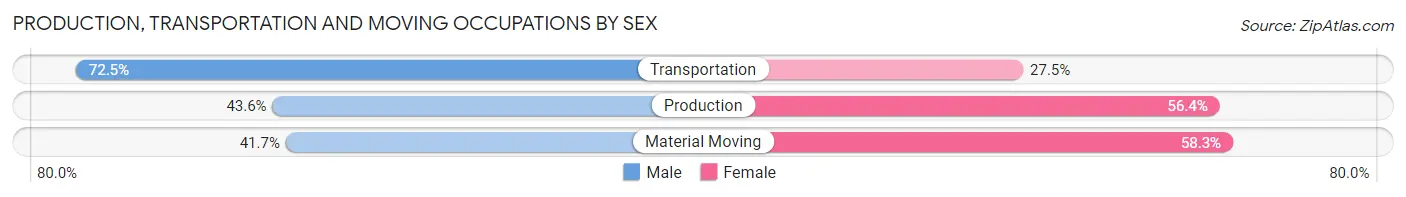
Production, Transportation and Moving Occupations by Sex
| Occupation | Male | Female |
| Production | 41 (43.6%) | 53 (56.4%) |
| Transportation | 208 (72.5%) | 79 (27.5%) |
| Material Moving | 60 (41.7%) | 84 (58.3%) |
| Total (Category) | 309 (58.9%) | 216 (41.1%) |
| Total (Overall) | 4,062 (55.8%) | 3,215 (44.2%) |
Employment Industries by Sex in Niceville
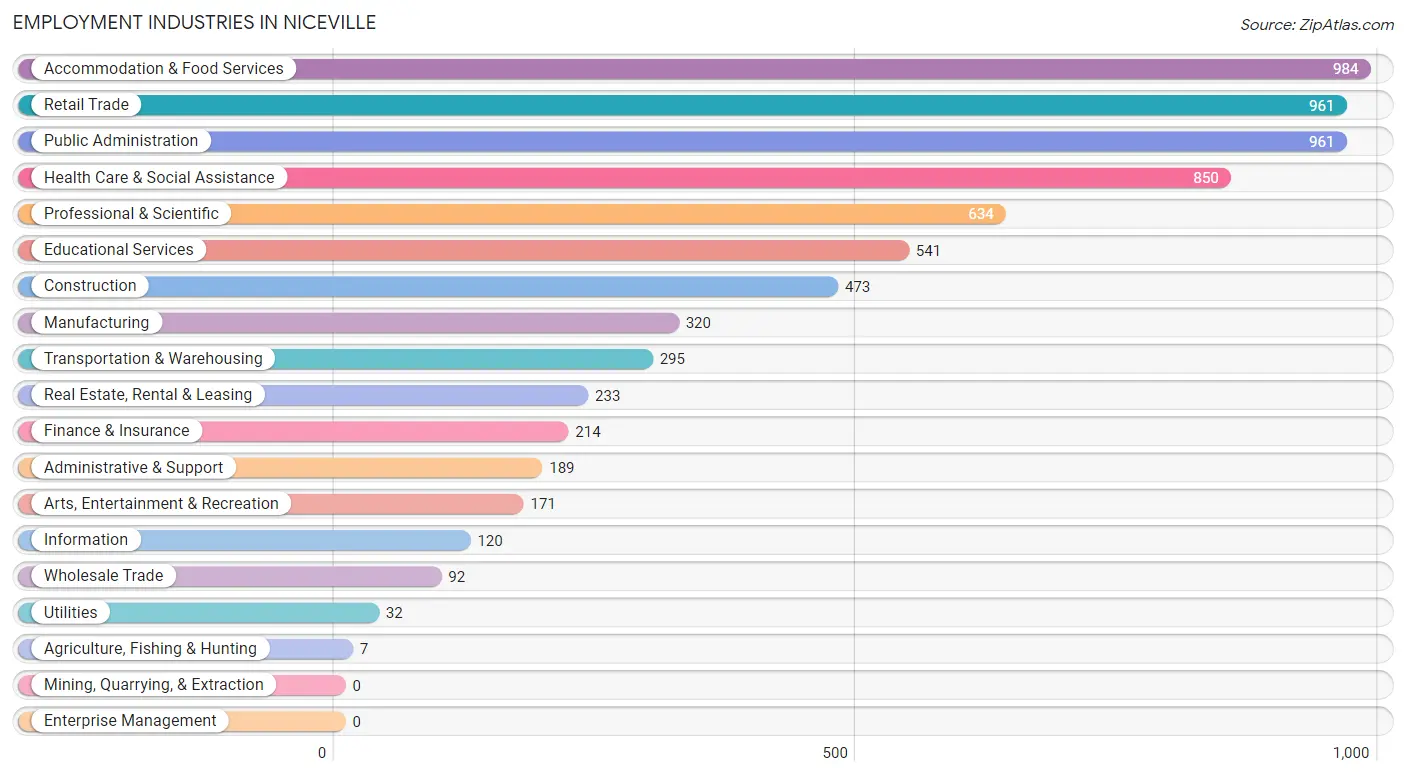
Employment Industries in Niceville
The major employment industries in Niceville include Accommodation & Food Services (984 | 13.5%), Retail Trade (961 | 13.2%), Public Administration (961 | 13.2%), Health Care & Social Assistance (850 | 11.7%), and Professional & Scientific (634 | 8.7%).
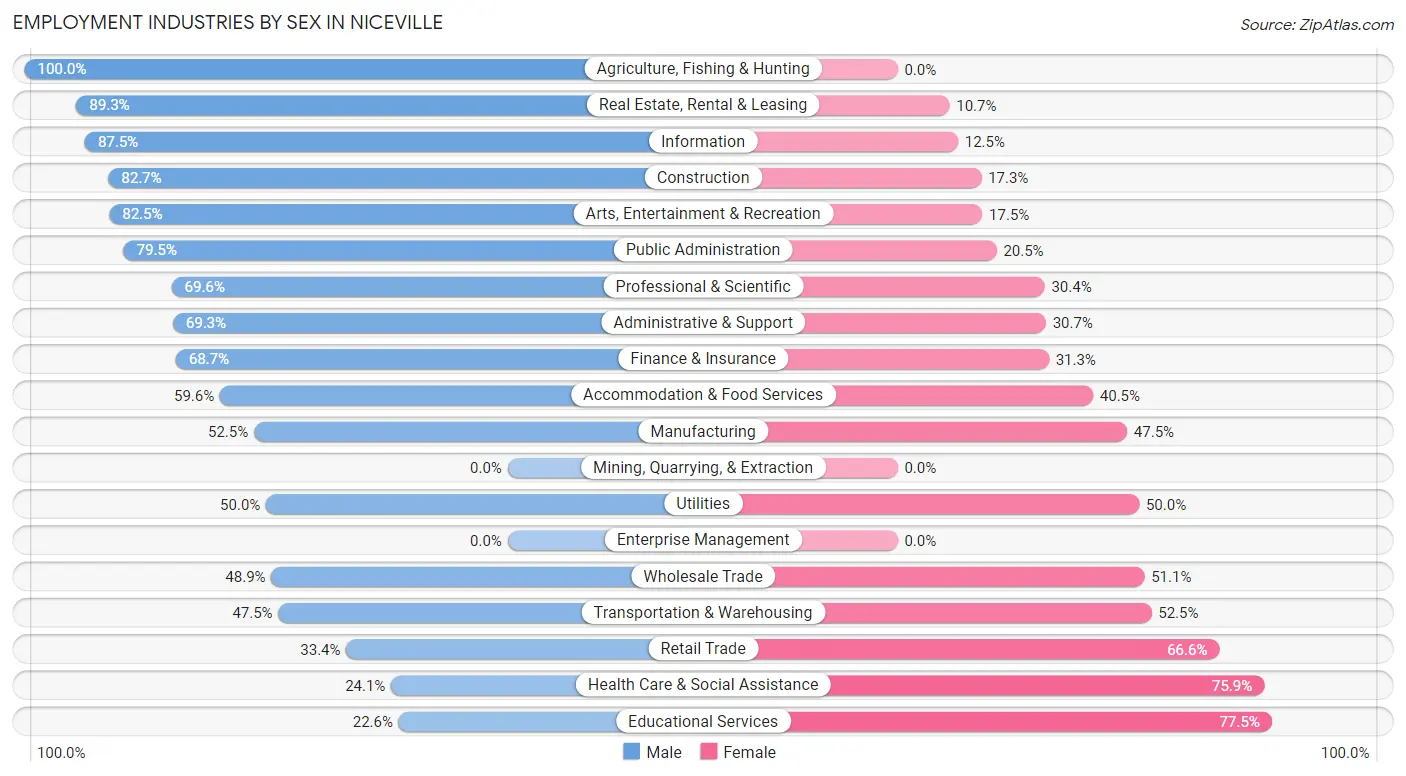
Employment Industries by Sex in Niceville
The Niceville industries that see more men than women are Agriculture, Fishing & Hunting (100.0%), Real Estate, Rental & Leasing (89.3%), and Information (87.5%), whereas the industries that tend to have a higher number of women are Educational Services (77.4%), Health Care & Social Assistance (75.9%), and Retail Trade (66.6%).
| Industry | Male | Female |
| Agriculture, Fishing & Hunting | 7 (100.0%) | 0 (0.0%) |
| Mining, Quarrying, & Extraction | 0 (0.0%) | 0 (0.0%) |
| Construction | 391 (82.7%) | 82 (17.3%) |
| Manufacturing | 168 (52.5%) | 152 (47.5%) |
| Wholesale Trade | 45 (48.9%) | 47 (51.1%) |
| Retail Trade | 321 (33.4%) | 640 (66.6%) |
| Transportation & Warehousing | 140 (47.5%) | 155 (52.5%) |
| Utilities | 16 (50.0%) | 16 (50.0%) |
| Information | 105 (87.5%) | 15 (12.5%) |
| Finance & Insurance | 147 (68.7%) | 67 (31.3%) |
| Real Estate, Rental & Leasing | 208 (89.3%) | 25 (10.7%) |
| Professional & Scientific | 441 (69.6%) | 193 (30.4%) |
| Enterprise Management | 0 (0.0%) | 0 (0.0%) |
| Administrative & Support | 131 (69.3%) | 58 (30.7%) |
| Educational Services | 122 (22.6%) | 419 (77.4%) |
| Health Care & Social Assistance | 205 (24.1%) | 645 (75.9%) |
| Arts, Entertainment & Recreation | 141 (82.5%) | 30 (17.5%) |
| Accommodation & Food Services | 586 (59.6%) | 398 (40.5%) |
| Public Administration | 764 (79.5%) | 197 (20.5%) |
| Total | 4,062 (55.8%) | 3,215 (44.2%) |
Education in Niceville
School Enrollment in Niceville
The most common levels of schooling among the 4,134 students in Niceville are middle school (1,190 | 28.8%), college / undergraduate (948 | 22.9%), and high school (848 | 20.5%).
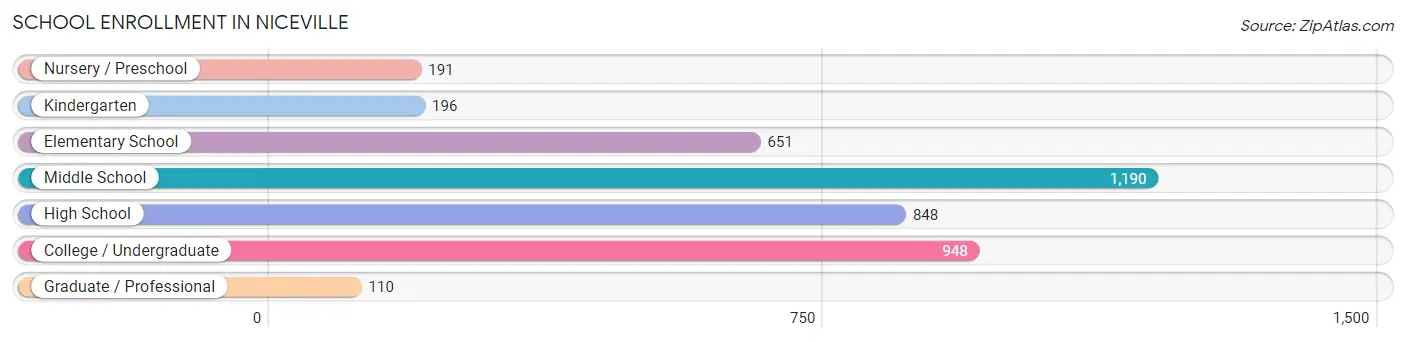
| School Level | # Students | % Students |
| Nursery / Preschool | 191 | 4.6% |
| Kindergarten | 196 | 4.7% |
| Elementary School | 651 | 15.8% |
| Middle School | 1,190 | 28.8% |
| High School | 848 | 20.5% |
| College / Undergraduate | 948 | 22.9% |
| Graduate / Professional | 110 | 2.7% |
| Total | 4,134 | 100.0% |
School Enrollment by Age by Funding Source in Niceville
Out of a total of 4,134 students who are enrolled in schools in Niceville, 711 (17.2%) attend a private institution, while the remaining 3,423 (82.8%) are enrolled in public schools. The age group of 3 to 4 year olds has the highest likelihood of being enrolled in private schools, with 95 (64.6% in the age bracket) enrolled. Conversely, the age group of 15 to 17 year olds has the lowest likelihood of being enrolled in a private school, with 440 (100.0% in the age bracket) attending a public institution.
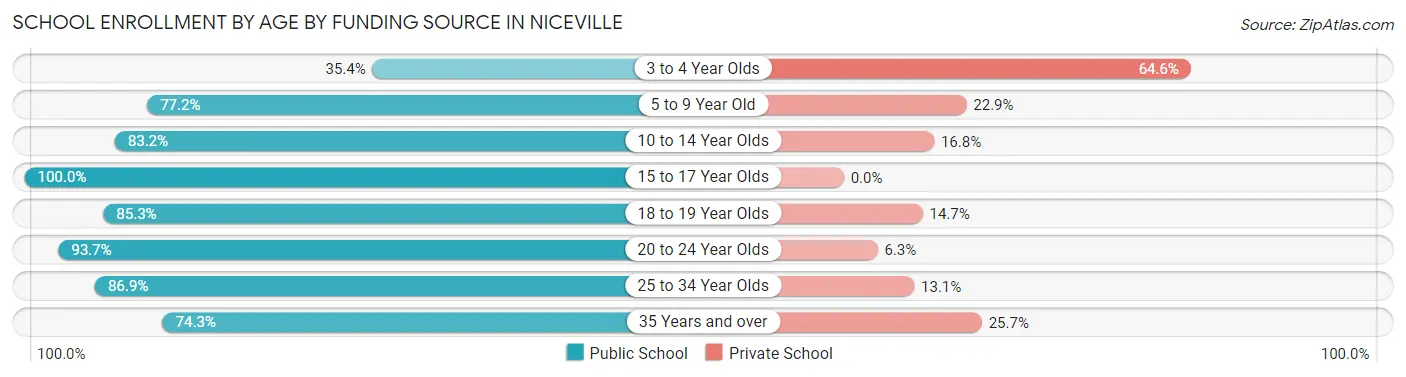
| Age Bracket | Public School | Private School |
| 3 to 4 Year Olds | 52 (35.4%) | 95 (64.6%) |
| 5 to 9 Year Old | 618 (77.1%) | 183 (22.9%) |
| 10 to 14 Year Olds | 1,236 (83.2%) | 250 (16.8%) |
| 15 to 17 Year Olds | 440 (100.0%) | 0 (0.0%) |
| 18 to 19 Year Olds | 366 (85.3%) | 63 (14.7%) |
| 20 to 24 Year Olds | 313 (93.7%) | 21 (6.3%) |
| 25 to 34 Year Olds | 192 (86.9%) | 29 (13.1%) |
| 35 Years and over | 205 (74.3%) | 71 (25.7%) |
| Total | 3,423 (82.8%) | 711 (17.2%) |
Educational Attainment by Field of Study in Niceville
Business (582 | 14.1%), engineering (573 | 13.9%), science & technology (559 | 13.5%), education (416 | 10.1%), and arts & humanities (363 | 8.8%) are the most common fields of study among 4,132 individuals in Niceville who have obtained a bachelor's degree or higher.
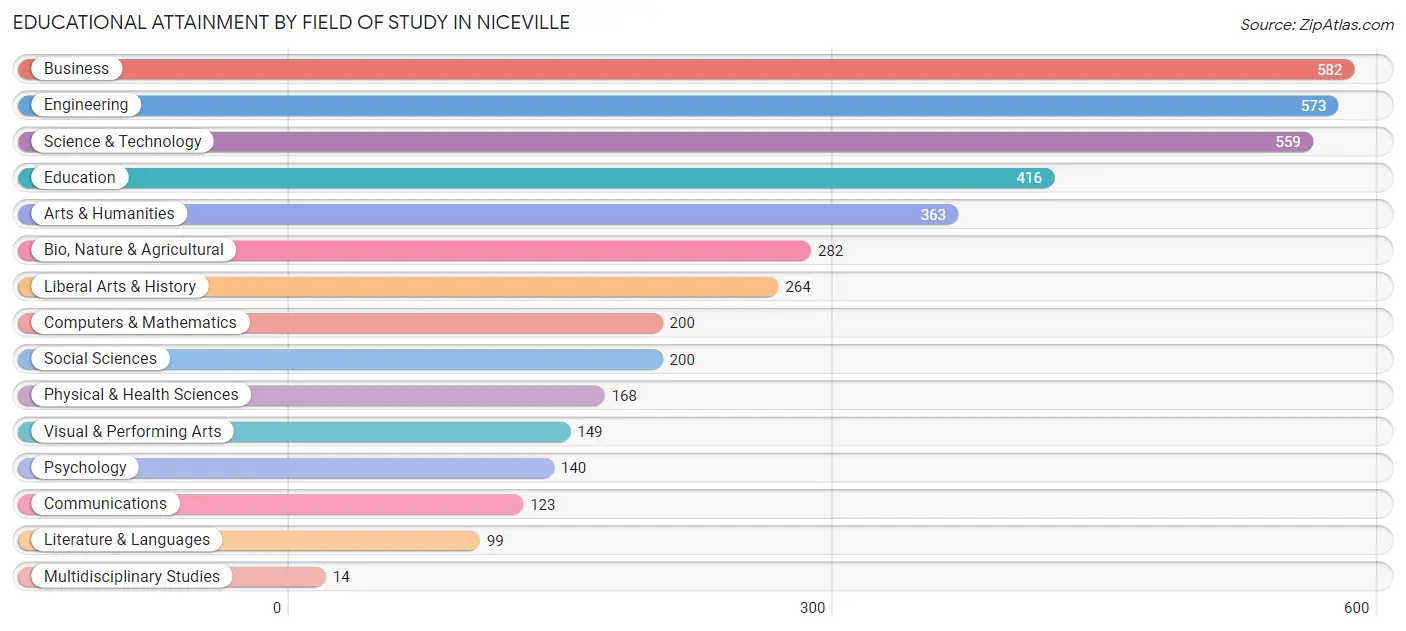
| Field of Study | # Graduates | % Graduates |
| Computers & Mathematics | 200 | 4.8% |
| Bio, Nature & Agricultural | 282 | 6.8% |
| Physical & Health Sciences | 168 | 4.1% |
| Psychology | 140 | 3.4% |
| Social Sciences | 200 | 4.8% |
| Engineering | 573 | 13.9% |
| Multidisciplinary Studies | 14 | 0.3% |
| Science & Technology | 559 | 13.5% |
| Business | 582 | 14.1% |
| Education | 416 | 10.1% |
| Literature & Languages | 99 | 2.4% |
| Liberal Arts & History | 264 | 6.4% |
| Visual & Performing Arts | 149 | 3.6% |
| Communications | 123 | 3.0% |
| Arts & Humanities | 363 | 8.8% |
| Total | 4,132 | 100.0% |
Transportation & Commute in Niceville
Vehicle Availability by Sex in Niceville
The most prevalent vehicle ownership categories in Niceville are males with 2 vehicles (2,071, accounting for 48.4%) and females with 2 vehicles (1,316, making up 64.8%).
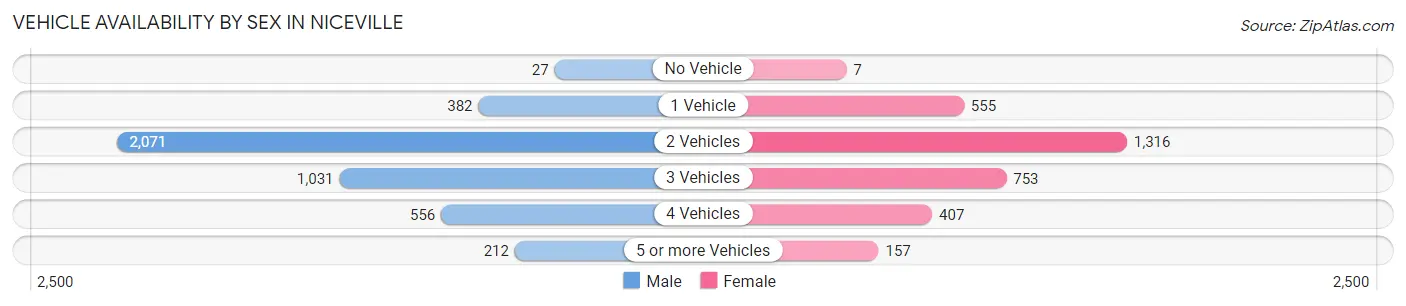
| Vehicles Available | Male | Female |
| No Vehicle | 27 (0.6%) | 7 (0.2%) |
| 1 Vehicle | 382 (8.9%) | 555 (17.4%) |
| 2 Vehicles | 2,071 (48.4%) | 1,316 (41.2%) |
| 3 Vehicles | 1,031 (24.1%) | 753 (23.6%) |
| 4 Vehicles | 556 (13.0%) | 407 (12.7%) |
| 5 or more Vehicles | 212 (5.0%) | 157 (4.9%) |
| Total | 4,279 (100.0%) | 3,195 (100.0%) |
Commute Time in Niceville
The most frequently occuring commute durations in Niceville are 20 to 24 minutes (1,301 commuters, 19.0%), 15 to 19 minutes (1,115 commuters, 16.3%), and 5 to 9 minutes (882 commuters, 12.9%).
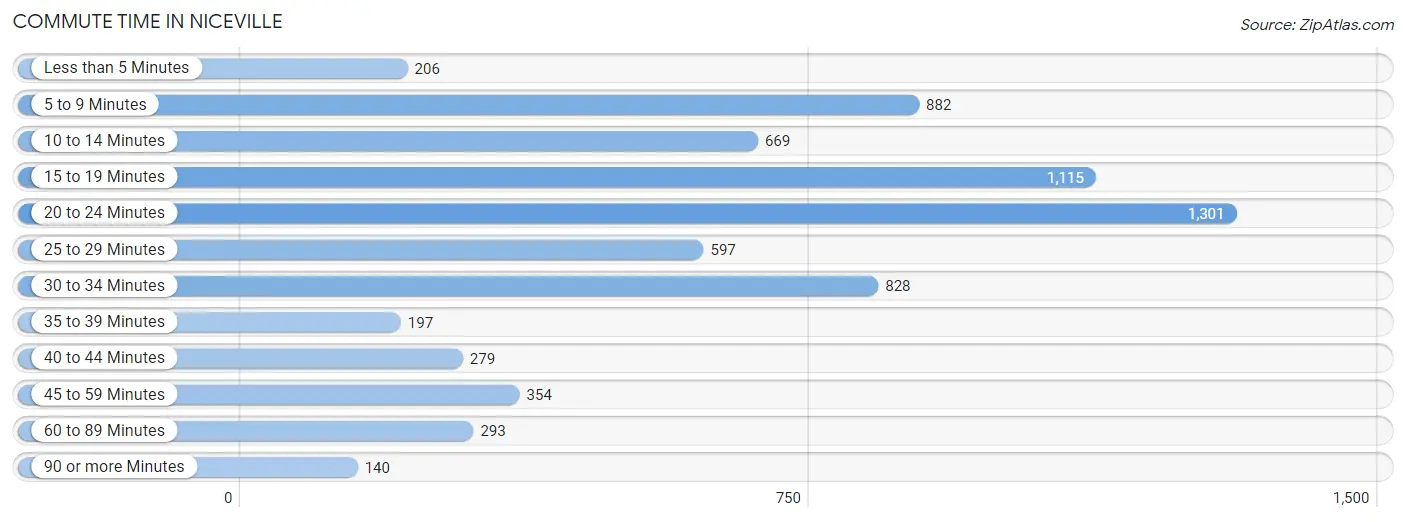
| Commute Time | # Commuters | % Commuters |
| Less than 5 Minutes | 206 | 3.0% |
| 5 to 9 Minutes | 882 | 12.9% |
| 10 to 14 Minutes | 669 | 9.8% |
| 15 to 19 Minutes | 1,115 | 16.3% |
| 20 to 24 Minutes | 1,301 | 19.0% |
| 25 to 29 Minutes | 597 | 8.7% |
| 30 to 34 Minutes | 828 | 12.1% |
| 35 to 39 Minutes | 197 | 2.9% |
| 40 to 44 Minutes | 279 | 4.1% |
| 45 to 59 Minutes | 354 | 5.2% |
| 60 to 89 Minutes | 293 | 4.3% |
| 90 or more Minutes | 140 | 2.0% |
Commute Time by Sex in Niceville
The most common commute times in Niceville are 20 to 24 minutes (830 commuters, 20.5%) for males and 5 to 9 minutes (481 commuters, 17.2%) for females.
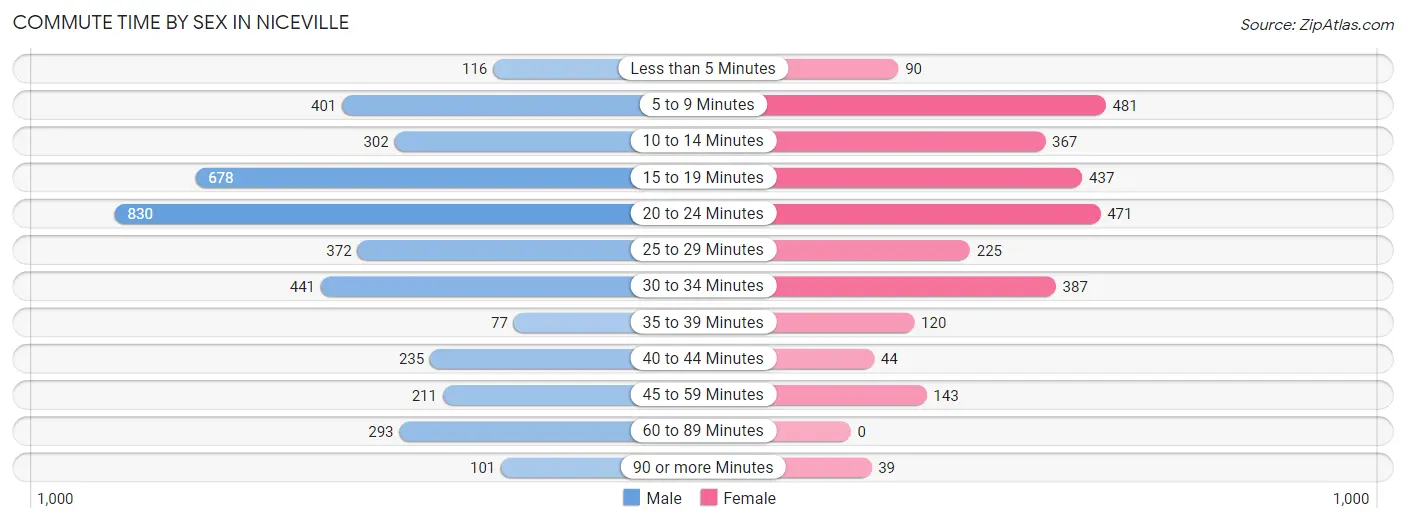
| Commute Time | Male | Female |
| Less than 5 Minutes | 116 (2.9%) | 90 (3.2%) |
| 5 to 9 Minutes | 401 (9.9%) | 481 (17.2%) |
| 10 to 14 Minutes | 302 (7.4%) | 367 (13.1%) |
| 15 to 19 Minutes | 678 (16.7%) | 437 (15.6%) |
| 20 to 24 Minutes | 830 (20.5%) | 471 (16.8%) |
| 25 to 29 Minutes | 372 (9.2%) | 225 (8.0%) |
| 30 to 34 Minutes | 441 (10.9%) | 387 (13.8%) |
| 35 to 39 Minutes | 77 (1.9%) | 120 (4.3%) |
| 40 to 44 Minutes | 235 (5.8%) | 44 (1.6%) |
| 45 to 59 Minutes | 211 (5.2%) | 143 (5.1%) |
| 60 to 89 Minutes | 293 (7.2%) | 0 (0.0%) |
| 90 or more Minutes | 101 (2.5%) | 39 (1.4%) |
Time of Departure to Work by Sex in Niceville
The most frequent times of departure to work in Niceville are 6:30 AM to 6:59 AM (663, 16.3%) for males and 7:00 AM to 7:29 AM (687, 24.5%) for females.
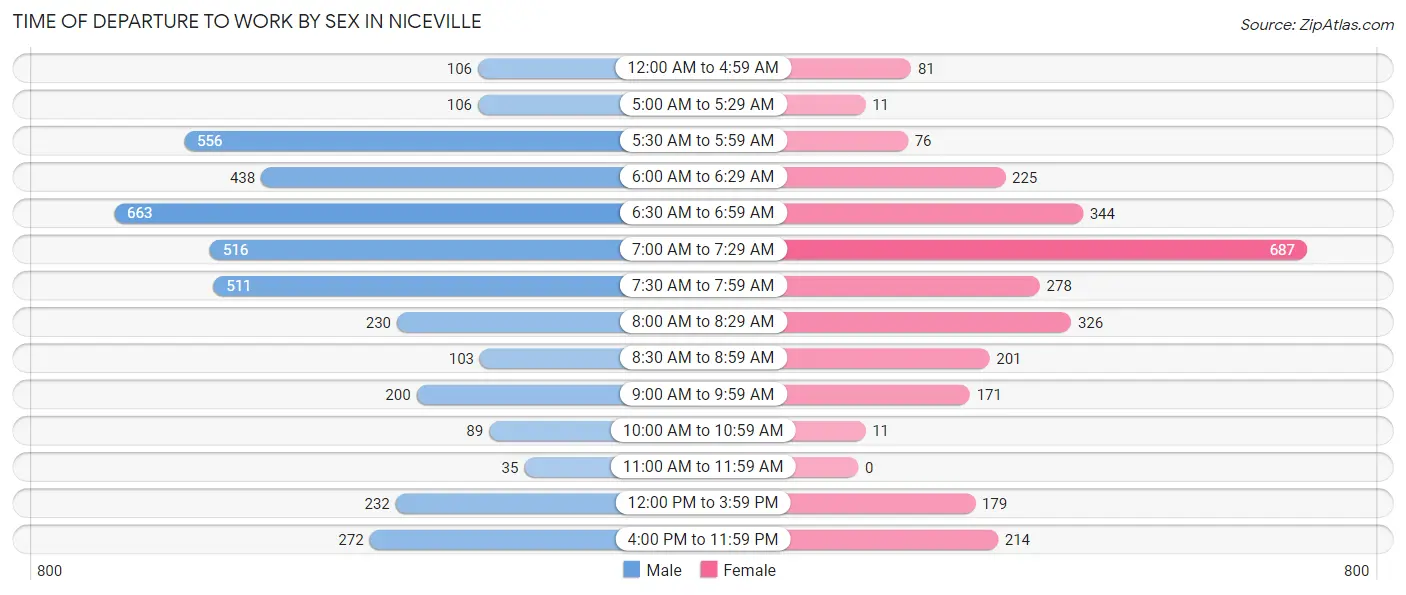
| Time of Departure | Male | Female |
| 12:00 AM to 4:59 AM | 106 (2.6%) | 81 (2.9%) |
| 5:00 AM to 5:29 AM | 106 (2.6%) | 11 (0.4%) |
| 5:30 AM to 5:59 AM | 556 (13.7%) | 76 (2.7%) |
| 6:00 AM to 6:29 AM | 438 (10.8%) | 225 (8.0%) |
| 6:30 AM to 6:59 AM | 663 (16.3%) | 344 (12.3%) |
| 7:00 AM to 7:29 AM | 516 (12.7%) | 687 (24.5%) |
| 7:30 AM to 7:59 AM | 511 (12.6%) | 278 (9.9%) |
| 8:00 AM to 8:29 AM | 230 (5.7%) | 326 (11.6%) |
| 8:30 AM to 8:59 AM | 103 (2.5%) | 201 (7.2%) |
| 9:00 AM to 9:59 AM | 200 (4.9%) | 171 (6.1%) |
| 10:00 AM to 10:59 AM | 89 (2.2%) | 11 (0.4%) |
| 11:00 AM to 11:59 AM | 35 (0.9%) | 0 (0.0%) |
| 12:00 PM to 3:59 PM | 232 (5.7%) | 179 (6.4%) |
| 4:00 PM to 11:59 PM | 272 (6.7%) | 214 (7.6%) |
| Total | 4,057 (100.0%) | 2,804 (100.0%) |
Housing Occupancy in Niceville
Occupancy by Ownership in Niceville
Of the total 5,710 dwellings in Niceville, owner-occupied units account for 4,011 (70.3%), while renter-occupied units make up 1,699 (29.7%).
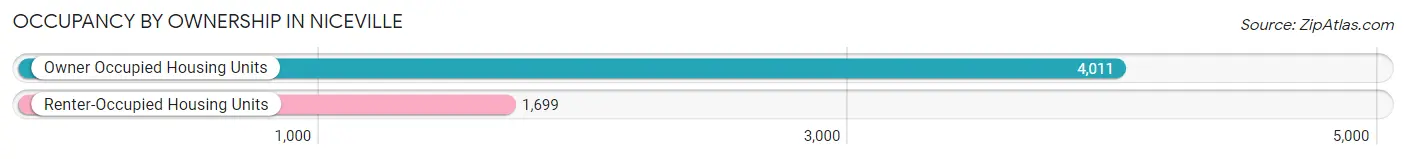
| Occupancy | # Housing Units | % Housing Units |
| Owner Occupied Housing Units | 4,011 | 70.3% |
| Renter-Occupied Housing Units | 1,699 | 29.7% |
| Total Occupied Housing Units | 5,710 | 100.0% |
Occupancy by Household Size in Niceville
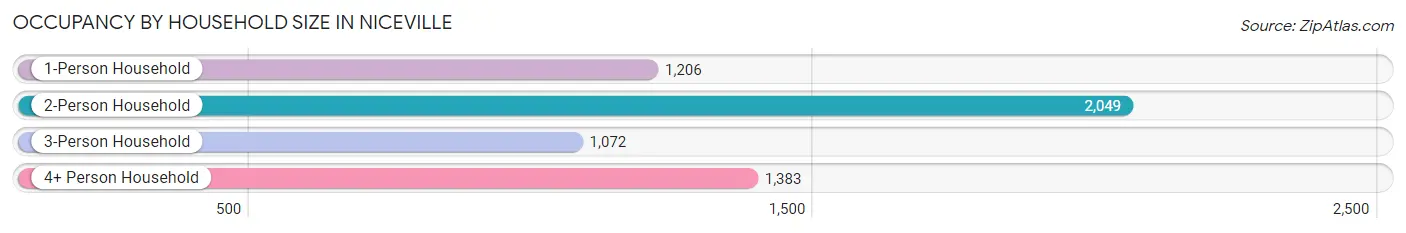
| Household Size | # Housing Units | % Housing Units |
| 1-Person Household | 1,206 | 21.1% |
| 2-Person Household | 2,049 | 35.9% |
| 3-Person Household | 1,072 | 18.8% |
| 4+ Person Household | 1,383 | 24.2% |
| Total Housing Units | 5,710 | 100.0% |
Occupancy by Ownership by Household Size in Niceville
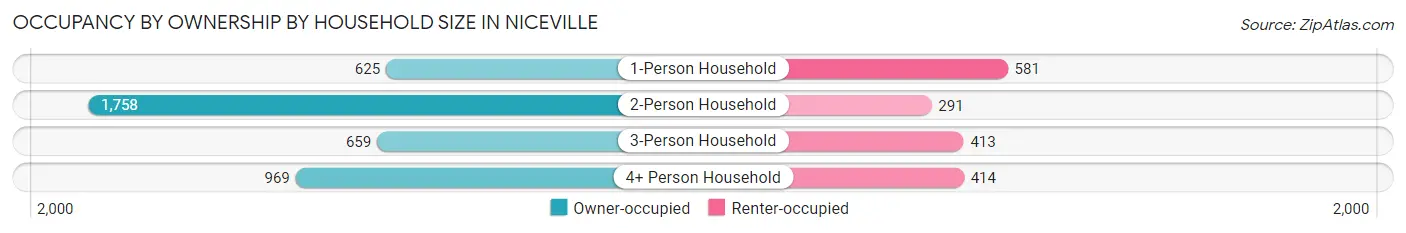
| Household Size | Owner-occupied | Renter-occupied |
| 1-Person Household | 625 (51.8%) | 581 (48.2%) |
| 2-Person Household | 1,758 (85.8%) | 291 (14.2%) |
| 3-Person Household | 659 (61.5%) | 413 (38.5%) |
| 4+ Person Household | 969 (70.1%) | 414 (29.9%) |
| Total Housing Units | 4,011 (70.3%) | 1,699 (29.7%) |
Occupancy by Educational Attainment in Niceville
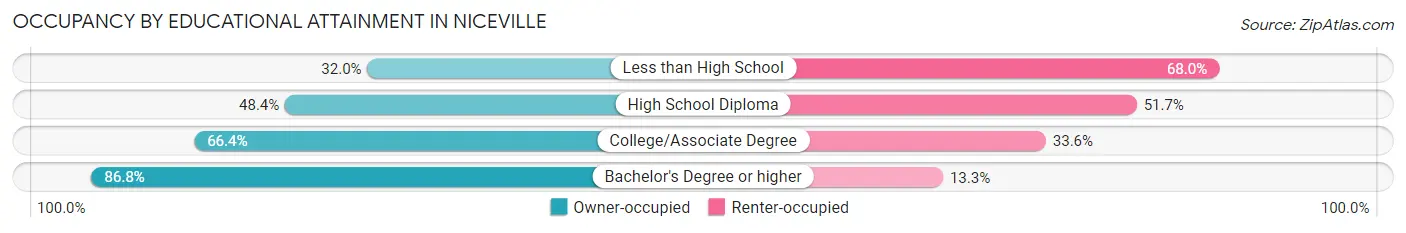
| Household Size | Owner-occupied | Renter-occupied |
| Less than High School | 74 (32.0%) | 157 (68.0%) |
| High School Diploma | 439 (48.3%) | 469 (51.6%) |
| College/Associate Degree | 1,521 (66.4%) | 771 (33.6%) |
| Bachelor's Degree or higher | 1,977 (86.8%) | 302 (13.3%) |
Occupancy by Age of Householder in Niceville
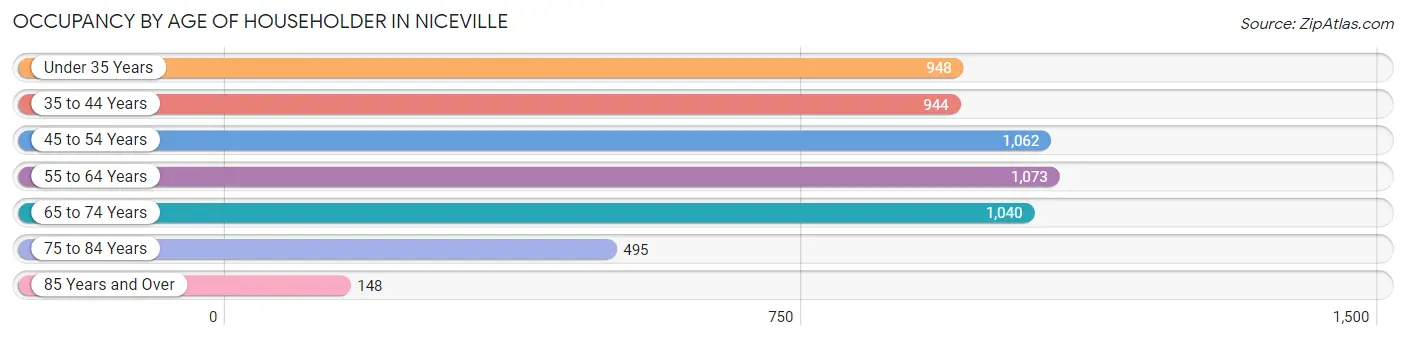
| Age Bracket | # Households | % Households |
| Under 35 Years | 948 | 16.6% |
| 35 to 44 Years | 944 | 16.5% |
| 45 to 54 Years | 1,062 | 18.6% |
| 55 to 64 Years | 1,073 | 18.8% |
| 65 to 74 Years | 1,040 | 18.2% |
| 75 to 84 Years | 495 | 8.7% |
| 85 Years and Over | 148 | 2.6% |
| Total | 5,710 | 100.0% |
Housing Finances in Niceville
Median Income by Occupancy in Niceville
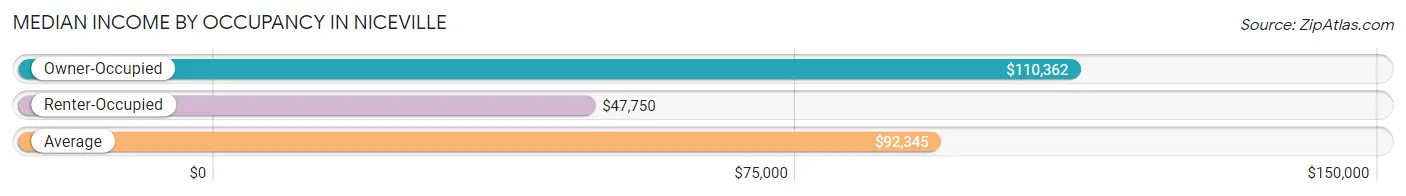
| Occupancy Type | # Households | Median Income |
| Owner-Occupied | 4,011 (70.3%) | $110,362 |
| Renter-Occupied | 1,699 (29.7%) | $47,750 |
| Average | 5,710 (100.0%) | $92,345 |
Occupancy by Householder Income Bracket in Niceville
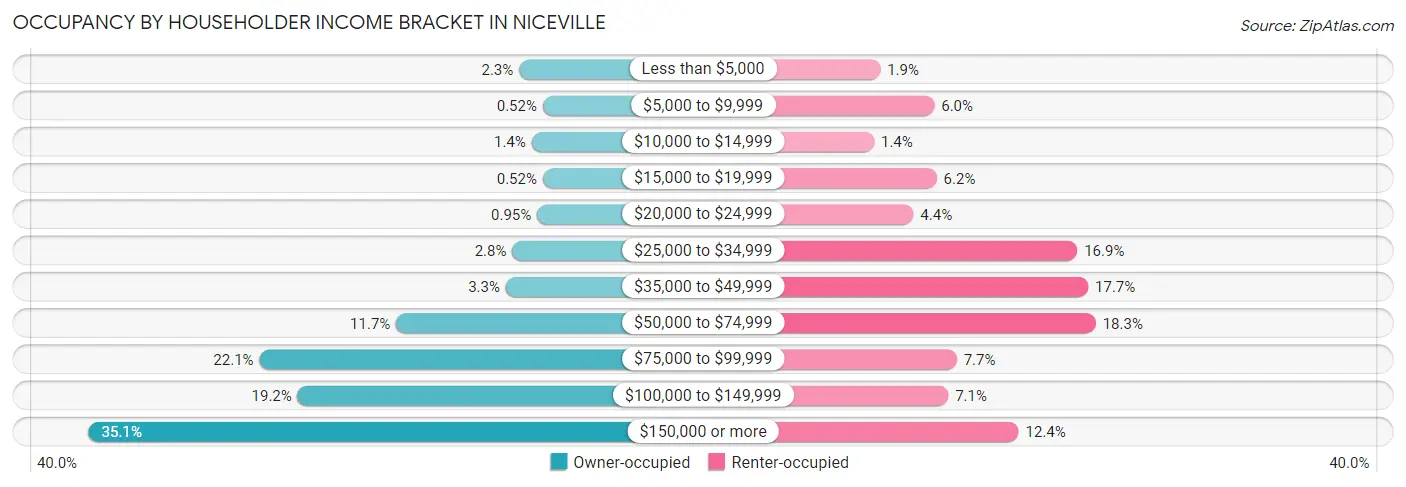
| Income Bracket | Owner-occupied | Renter-occupied |
| Less than $5,000 | 93 (2.3%) | 32 (1.9%) |
| $5,000 to $9,999 | 21 (0.5%) | 102 (6.0%) |
| $10,000 to $14,999 | 55 (1.4%) | 24 (1.4%) |
| $15,000 to $19,999 | 21 (0.5%) | 105 (6.2%) |
| $20,000 to $24,999 | 38 (0.9%) | 75 (4.4%) |
| $25,000 to $34,999 | 114 (2.8%) | 287 (16.9%) |
| $35,000 to $49,999 | 134 (3.3%) | 301 (17.7%) |
| $50,000 to $74,999 | 469 (11.7%) | 311 (18.3%) |
| $75,000 to $99,999 | 887 (22.1%) | 131 (7.7%) |
| $100,000 to $149,999 | 770 (19.2%) | 120 (7.1%) |
| $150,000 or more | 1,409 (35.1%) | 211 (12.4%) |
| Total | 4,011 (100.0%) | 1,699 (100.0%) |
Monthly Housing Cost Tiers in Niceville
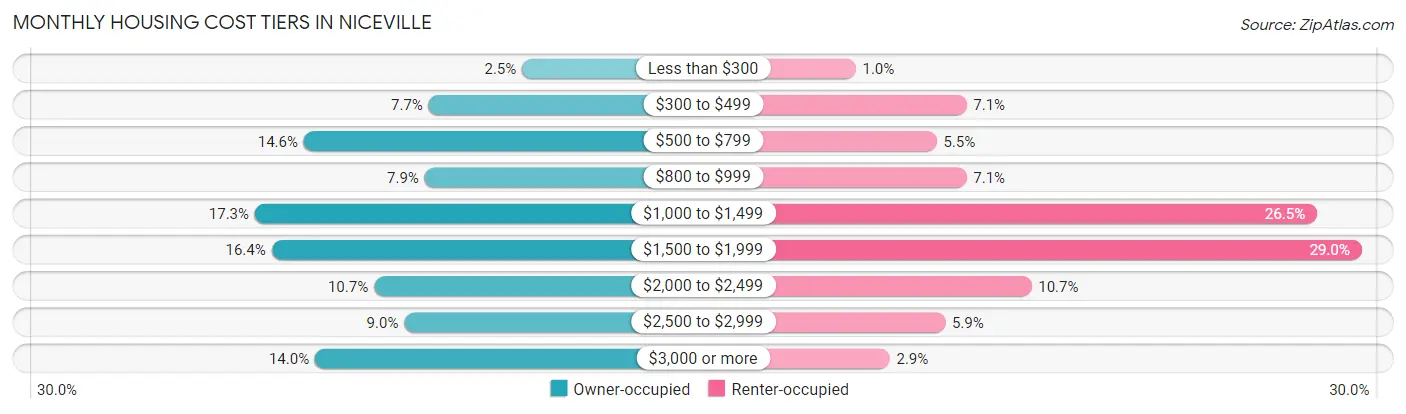
| Monthly Cost | Owner-occupied | Renter-occupied |
| Less than $300 | 101 (2.5%) | 17 (1.0%) |
| $300 to $499 | 308 (7.7%) | 121 (7.1%) |
| $500 to $799 | 585 (14.6%) | 93 (5.5%) |
| $800 to $999 | 317 (7.9%) | 121 (7.1%) |
| $1,000 to $1,499 | 693 (17.3%) | 450 (26.5%) |
| $1,500 to $1,999 | 656 (16.4%) | 492 (29.0%) |
| $2,000 to $2,499 | 429 (10.7%) | 182 (10.7%) |
| $2,500 to $2,999 | 362 (9.0%) | 101 (5.9%) |
| $3,000 or more | 560 (14.0%) | 49 (2.9%) |
| Total | 4,011 (100.0%) | 1,699 (100.0%) |
Physical Housing Characteristics in Niceville
Housing Structures in Niceville
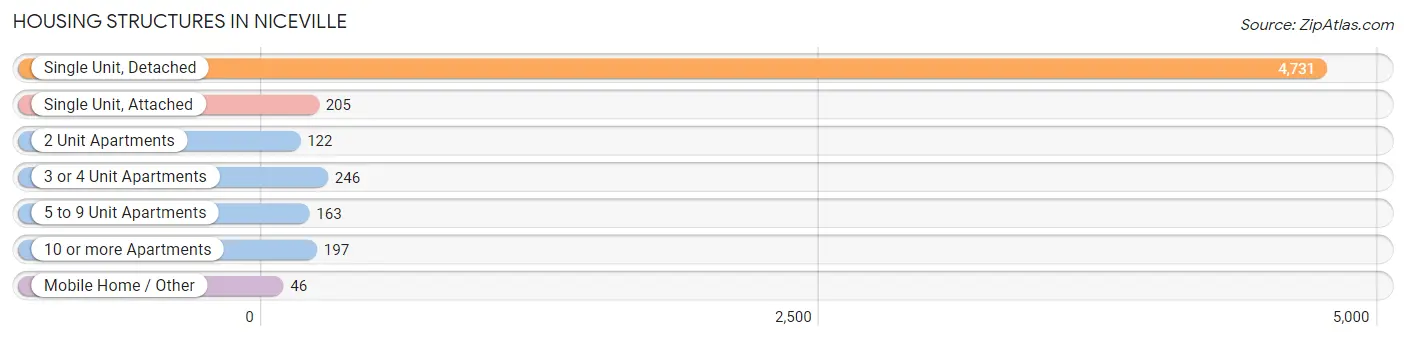
| Structure Type | # Housing Units | % Housing Units |
| Single Unit, Detached | 4,731 | 82.9% |
| Single Unit, Attached | 205 | 3.6% |
| 2 Unit Apartments | 122 | 2.1% |
| 3 or 4 Unit Apartments | 246 | 4.3% |
| 5 to 9 Unit Apartments | 163 | 2.9% |
| 10 or more Apartments | 197 | 3.5% |
| Mobile Home / Other | 46 | 0.8% |
| Total | 5,710 | 100.0% |
Housing Structures by Occupancy in Niceville
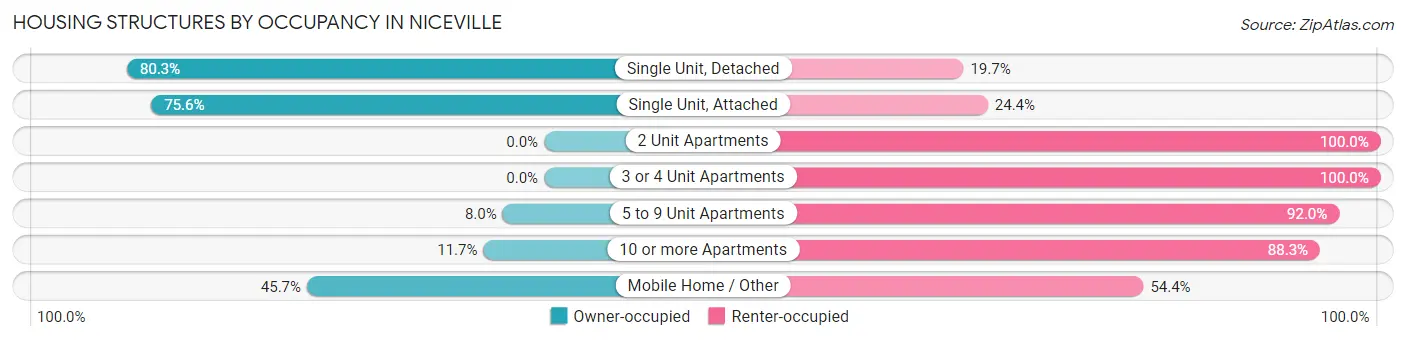
| Structure Type | Owner-occupied | Renter-occupied |
| Single Unit, Detached | 3,799 (80.3%) | 932 (19.7%) |
| Single Unit, Attached | 155 (75.6%) | 50 (24.4%) |
| 2 Unit Apartments | 0 (0.0%) | 122 (100.0%) |
| 3 or 4 Unit Apartments | 0 (0.0%) | 246 (100.0%) |
| 5 to 9 Unit Apartments | 13 (8.0%) | 150 (92.0%) |
| 10 or more Apartments | 23 (11.7%) | 174 (88.3%) |
| Mobile Home / Other | 21 (45.7%) | 25 (54.3%) |
| Total | 4,011 (70.3%) | 1,699 (29.7%) |
Housing Structures by Number of Rooms in Niceville
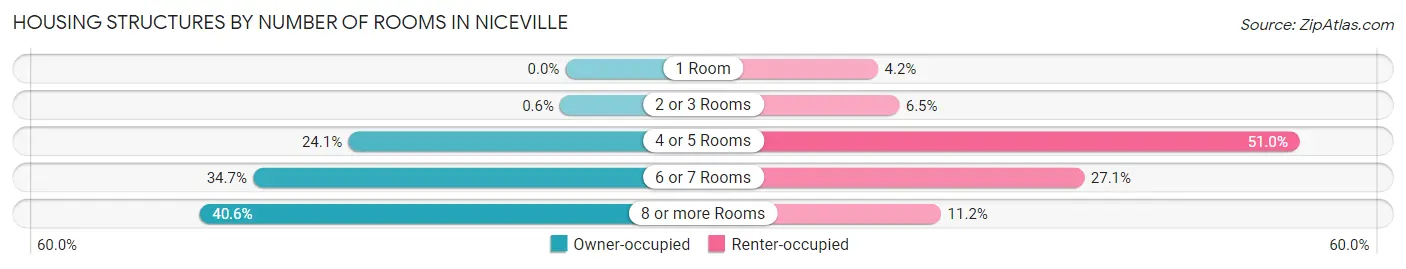
| Number of Rooms | Owner-occupied | Renter-occupied |
| 1 Room | 0 (0.0%) | 71 (4.2%) |
| 2 or 3 Rooms | 24 (0.6%) | 111 (6.5%) |
| 4 or 5 Rooms | 967 (24.1%) | 867 (51.0%) |
| 6 or 7 Rooms | 1,391 (34.7%) | 460 (27.1%) |
| 8 or more Rooms | 1,629 (40.6%) | 190 (11.2%) |
| Total | 4,011 (100.0%) | 1,699 (100.0%) |
Housing Structure by Heating Type in Niceville
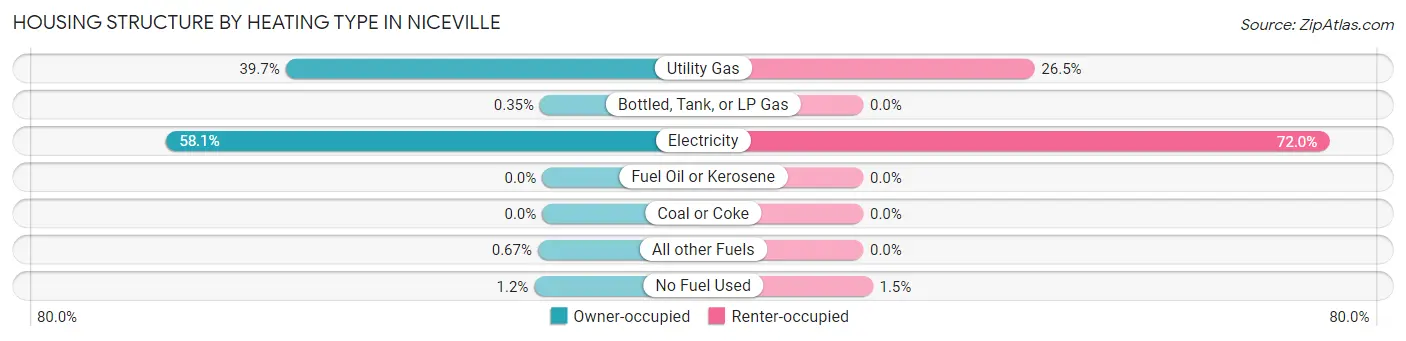
| Heating Type | Owner-occupied | Renter-occupied |
| Utility Gas | 1,591 (39.7%) | 450 (26.5%) |
| Bottled, Tank, or LP Gas | 14 (0.4%) | 0 (0.0%) |
| Electricity | 2,330 (58.1%) | 1,224 (72.0%) |
| Fuel Oil or Kerosene | 0 (0.0%) | 0 (0.0%) |
| Coal or Coke | 0 (0.0%) | 0 (0.0%) |
| All other Fuels | 27 (0.7%) | 0 (0.0%) |
| No Fuel Used | 49 (1.2%) | 25 (1.5%) |
| Total | 4,011 (100.0%) | 1,699 (100.0%) |
Household Vehicle Usage in Niceville
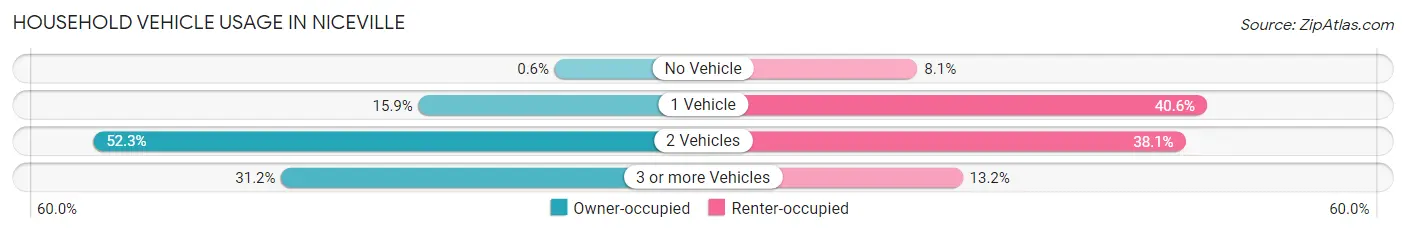
| Vehicles per Household | Owner-occupied | Renter-occupied |
| No Vehicle | 24 (0.6%) | 138 (8.1%) |
| 1 Vehicle | 636 (15.9%) | 689 (40.6%) |
| 2 Vehicles | 2,098 (52.3%) | 648 (38.1%) |
| 3 or more Vehicles | 1,253 (31.2%) | 224 (13.2%) |
| Total | 4,011 (100.0%) | 1,699 (100.0%) |
Real Estate & Mortgages in Niceville
Real Estate and Mortgage Overview in Niceville
| Characteristic | Without Mortgage | With Mortgage |
| Housing Units | 1,493 | 2,518 |
| Median Property Value | $326,800 | $365,700 |
| Median Household Income | $97,981 | $966 |
| Monthly Housing Costs | $674 | $520 |
| Real Estate Taxes | $1,988 | $61 |
Property Value by Mortgage Status in Niceville
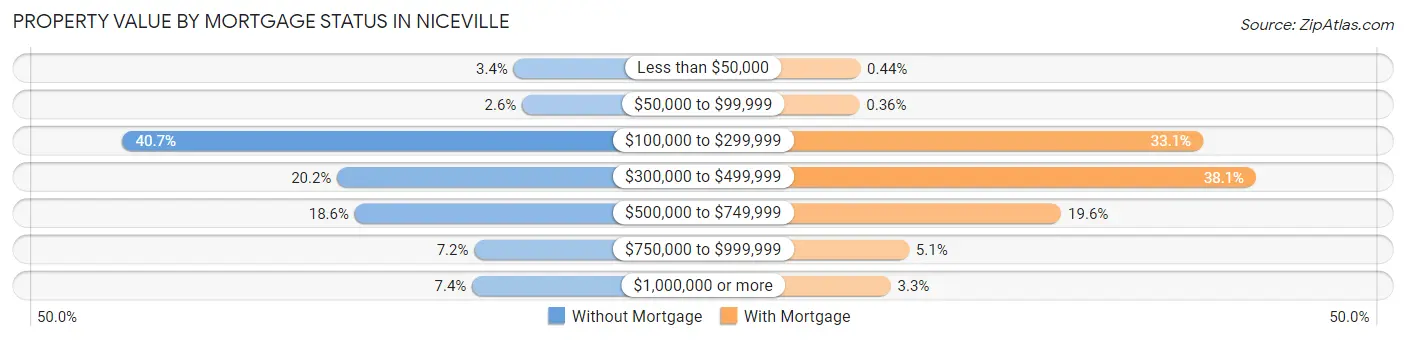
| Property Value | Without Mortgage | With Mortgage |
| Less than $50,000 | 51 (3.4%) | 11 (0.4%) |
| $50,000 to $99,999 | 39 (2.6%) | 9 (0.4%) |
| $100,000 to $299,999 | 607 (40.7%) | 833 (33.1%) |
| $300,000 to $499,999 | 302 (20.2%) | 960 (38.1%) |
| $500,000 to $749,999 | 277 (18.5%) | 493 (19.6%) |
| $750,000 to $999,999 | 107 (7.2%) | 128 (5.1%) |
| $1,000,000 or more | 110 (7.4%) | 84 (3.3%) |
| Total | 1,493 (100.0%) | 2,518 (100.0%) |
Household Income by Mortgage Status in Niceville
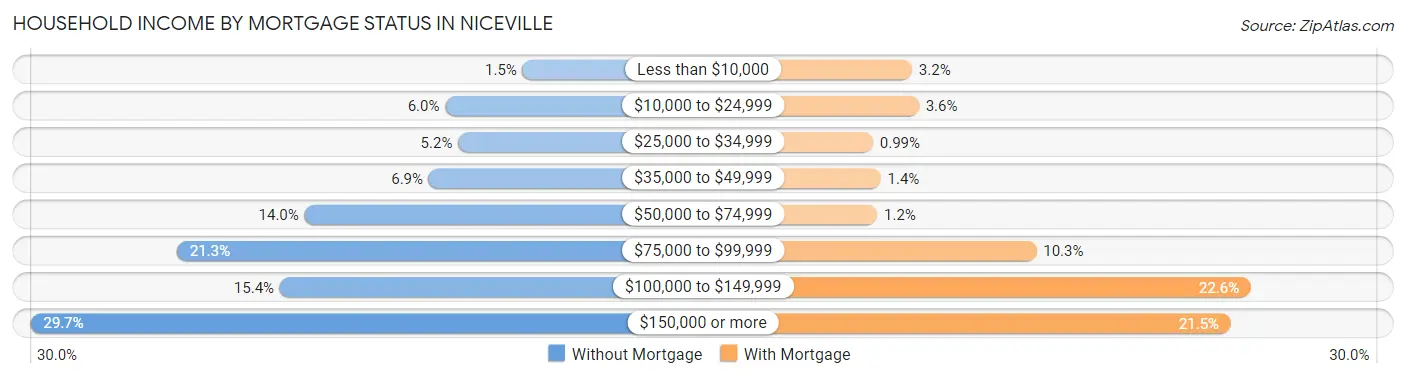
| Household Income | Without Mortgage | With Mortgage |
| Less than $10,000 | 23 (1.5%) | 81 (3.2%) |
| $10,000 to $24,999 | 89 (6.0%) | 91 (3.6%) |
| $25,000 to $34,999 | 78 (5.2%) | 25 (1.0%) |
| $35,000 to $49,999 | 103 (6.9%) | 36 (1.4%) |
| $50,000 to $74,999 | 209 (14.0%) | 31 (1.2%) |
| $75,000 to $99,999 | 318 (21.3%) | 260 (10.3%) |
| $100,000 to $149,999 | 230 (15.4%) | 569 (22.6%) |
| $150,000 or more | 443 (29.7%) | 540 (21.4%) |
| Total | 1,493 (100.0%) | 2,518 (100.0%) |
Property Value to Household Income Ratio in Niceville
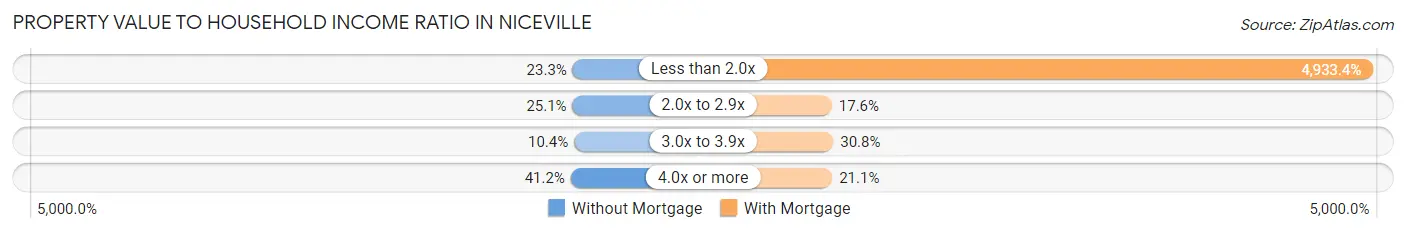
| Value-to-Income Ratio | Without Mortgage | With Mortgage |
| Less than 2.0x | 348 (23.3%) | 124,224 (4,933.4%) |
| 2.0x to 2.9x | 375 (25.1%) | 443 (17.6%) |
| 3.0x to 3.9x | 155 (10.4%) | 776 (30.8%) |
| 4.0x or more | 615 (41.2%) | 532 (21.1%) |
| Total | 1,493 (100.0%) | 2,518 (100.0%) |
Real Estate Taxes by Mortgage Status in Niceville
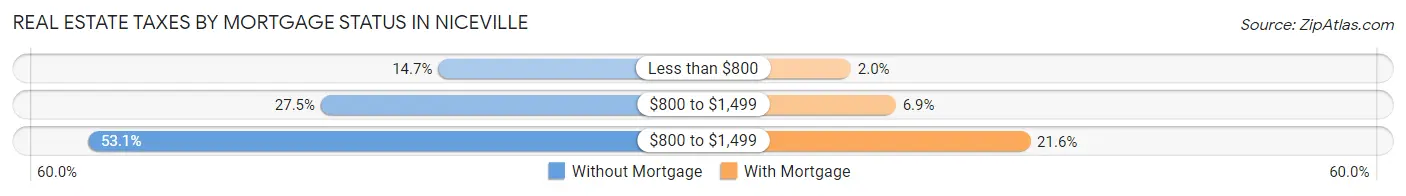
| Property Taxes | Without Mortgage | With Mortgage |
| Less than $800 | 219 (14.7%) | 49 (1.9%) |
| $800 to $1,499 | 411 (27.5%) | 173 (6.9%) |
| $800 to $1,499 | 792 (53.0%) | 544 (21.6%) |
| Total | 1,493 (100.0%) | 2,518 (100.0%) |
Health & Disability in Niceville
Health Insurance Coverage by Age in Niceville
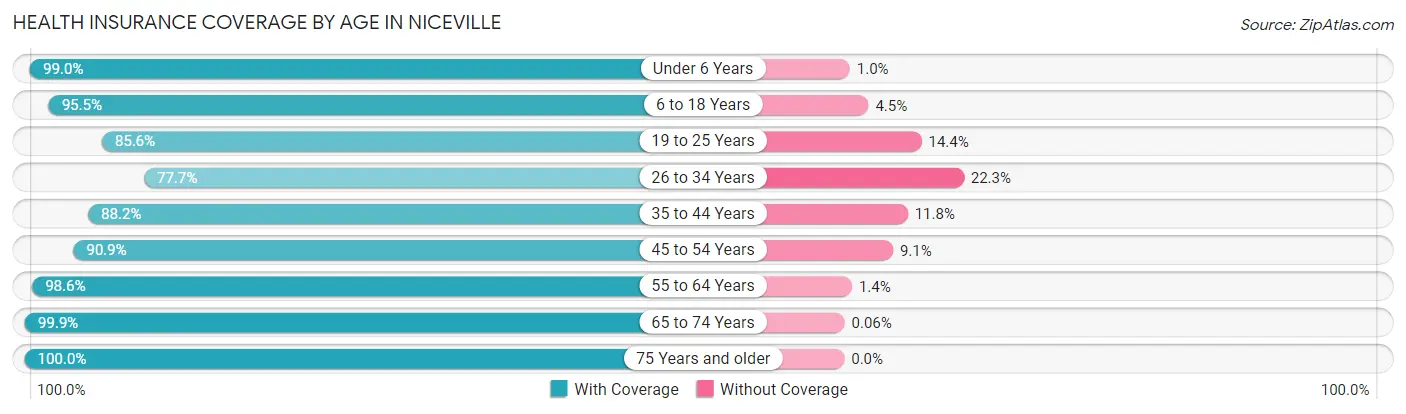
| Age Bracket | With Coverage | Without Coverage |
| Under 6 Years | 1,053 (99.0%) | 11 (1.0%) |
| 6 to 18 Years | 2,798 (95.5%) | 132 (4.5%) |
| 19 to 25 Years | 1,289 (85.6%) | 217 (14.4%) |
| 26 to 34 Years | 973 (77.7%) | 279 (22.3%) |
| 35 to 44 Years | 1,796 (88.2%) | 241 (11.8%) |
| 45 to 54 Years | 1,773 (90.9%) | 177 (9.1%) |
| 55 to 64 Years | 1,792 (98.6%) | 26 (1.4%) |
| 65 to 74 Years | 1,785 (99.9%) | 1 (0.1%) |
| 75 Years and older | 1,020 (100.0%) | 0 (0.0%) |
| Total | 14,279 (92.9%) | 1,084 (7.1%) |
Health Insurance Coverage by Citizenship Status in Niceville
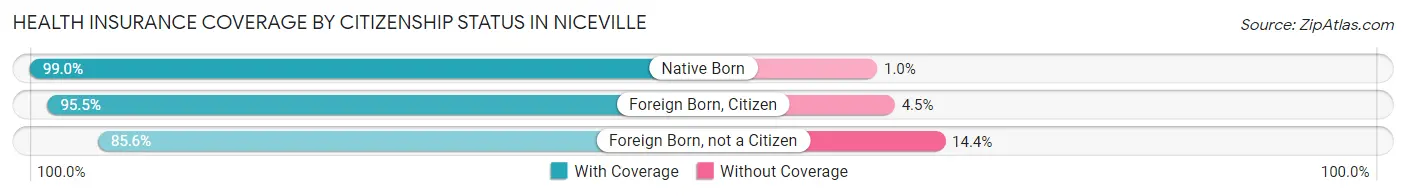
| Citizenship Status | With Coverage | Without Coverage |
| Native Born | 1,053 (99.0%) | 11 (1.0%) |
| Foreign Born, Citizen | 2,798 (95.5%) | 132 (4.5%) |
| Foreign Born, not a Citizen | 1,289 (85.6%) | 217 (14.4%) |
Health Insurance Coverage by Household Income in Niceville
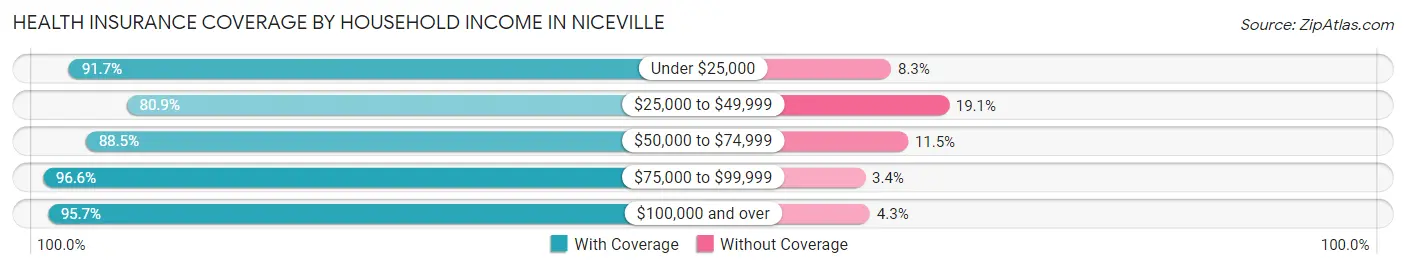
| Household Income | With Coverage | Without Coverage |
| Under $25,000 | 973 (91.7%) | 88 (8.3%) |
| $25,000 to $49,999 | 1,287 (80.9%) | 304 (19.1%) |
| $50,000 to $74,999 | 2,039 (88.5%) | 264 (11.5%) |
| $75,000 to $99,999 | 2,671 (96.6%) | 95 (3.4%) |
| $100,000 and over | 7,308 (95.7%) | 331 (4.3%) |
Public vs Private Health Insurance Coverage by Age in Niceville
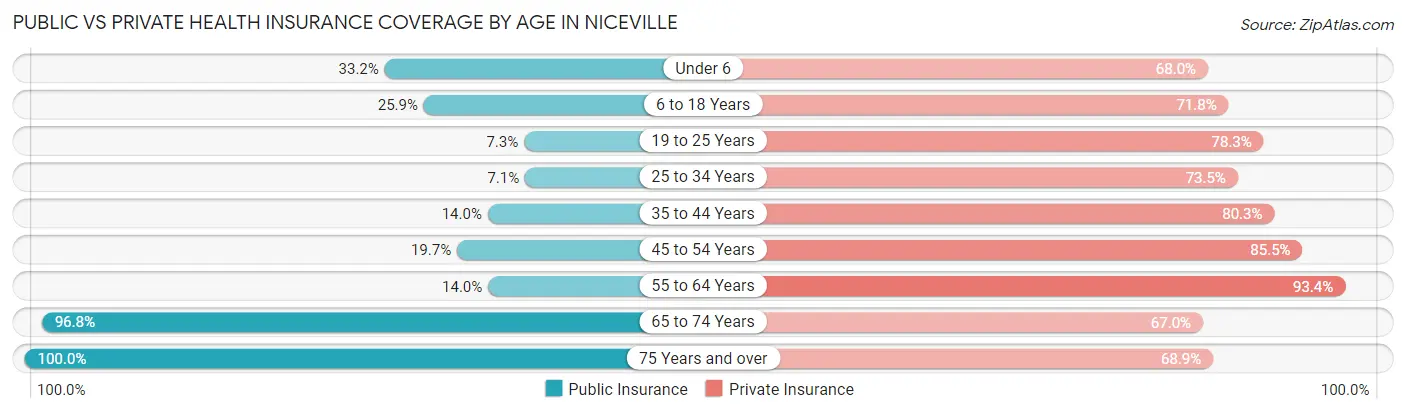
| Age Bracket | Public Insurance | Private Insurance |
| Under 6 | 353 (33.2%) | 723 (67.9%) |
| 6 to 18 Years | 759 (25.9%) | 2,103 (71.8%) |
| 19 to 25 Years | 110 (7.3%) | 1,179 (78.3%) |
| 25 to 34 Years | 89 (7.1%) | 920 (73.5%) |
| 35 to 44 Years | 286 (14.0%) | 1,635 (80.3%) |
| 45 to 54 Years | 385 (19.7%) | 1,667 (85.5%) |
| 55 to 64 Years | 254 (14.0%) | 1,698 (93.4%) |
| 65 to 74 Years | 1,729 (96.8%) | 1,197 (67.0%) |
| 75 Years and over | 1,020 (100.0%) | 703 (68.9%) |
| Total | 4,985 (32.5%) | 11,825 (77.0%) |
Disability Status by Sex by Age in Niceville
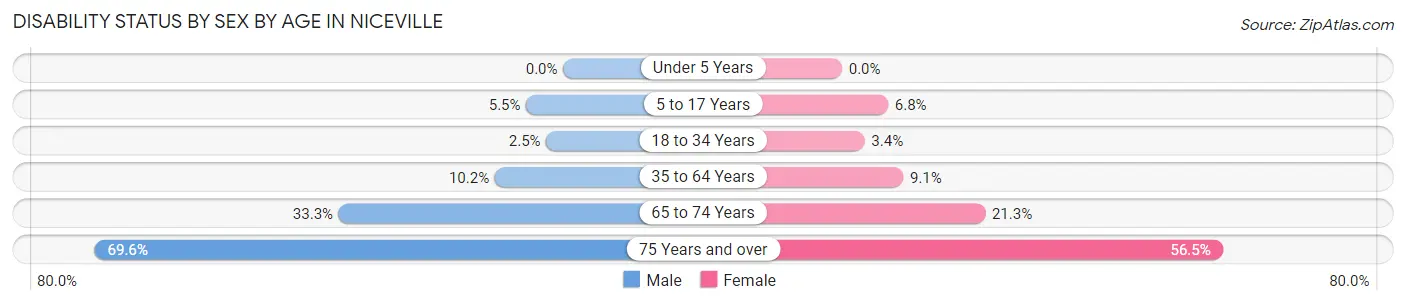
| Age Bracket | Male | Female |
| Under 5 Years | 0 (0.0%) | 0 (0.0%) |
| 5 to 17 Years | 87 (5.5%) | 85 (6.8%) |
| 18 to 34 Years | 35 (2.5%) | 54 (3.4%) |
| 35 to 64 Years | 279 (10.2%) | 278 (9.1%) |
| 65 to 74 Years | 252 (33.3%) | 219 (21.3%) |
| 75 Years and over | 332 (69.6%) | 307 (56.5%) |
Disability Class by Sex by Age in Niceville
Disability Class: Hearing Difficulty
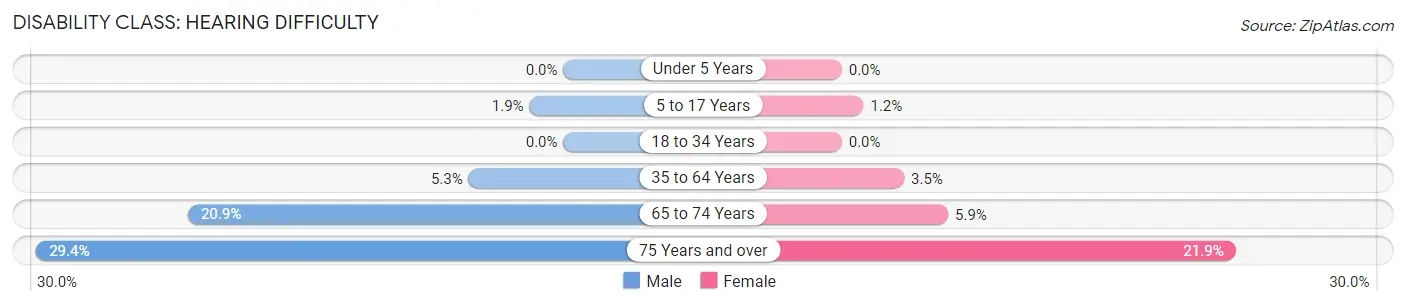
| Age Bracket | Male | Female |
| Under 5 Years | 0 (0.0%) | 0 (0.0%) |
| 5 to 17 Years | 30 (1.9%) | 15 (1.2%) |
| 18 to 34 Years | 0 (0.0%) | 0 (0.0%) |
| 35 to 64 Years | 145 (5.3%) | 106 (3.5%) |
| 65 to 74 Years | 158 (20.9%) | 61 (5.9%) |
| 75 Years and over | 140 (29.3%) | 119 (21.9%) |
Disability Class: Vision Difficulty
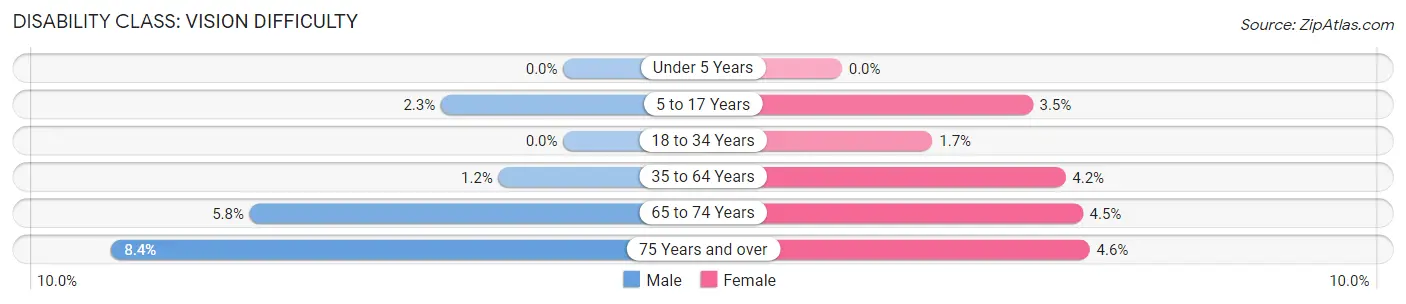
| Age Bracket | Male | Female |
| Under 5 Years | 0 (0.0%) | 0 (0.0%) |
| 5 to 17 Years | 36 (2.3%) | 44 (3.5%) |
| 18 to 34 Years | 0 (0.0%) | 27 (1.7%) |
| 35 to 64 Years | 33 (1.2%) | 127 (4.2%) |
| 65 to 74 Years | 44 (5.8%) | 46 (4.5%) |
| 75 Years and over | 40 (8.4%) | 25 (4.6%) |
Disability Class: Cognitive Difficulty
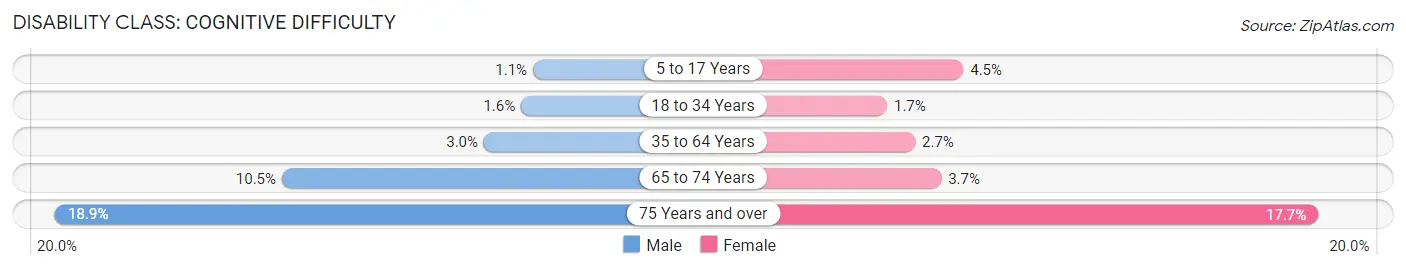
| Age Bracket | Male | Female |
| 5 to 17 Years | 18 (1.1%) | 56 (4.5%) |
| 18 to 34 Years | 22 (1.6%) | 27 (1.7%) |
| 35 to 64 Years | 81 (2.9%) | 83 (2.7%) |
| 65 to 74 Years | 79 (10.4%) | 38 (3.7%) |
| 75 Years and over | 90 (18.9%) | 96 (17.7%) |
Disability Class: Ambulatory Difficulty
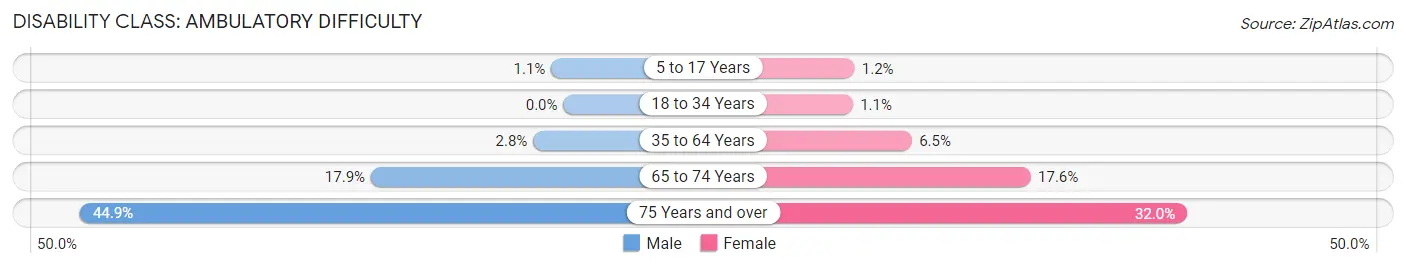
| Age Bracket | Male | Female |
| 5 to 17 Years | 18 (1.1%) | 15 (1.2%) |
| 18 to 34 Years | 0 (0.0%) | 17 (1.1%) |
| 35 to 64 Years | 77 (2.8%) | 200 (6.5%) |
| 65 to 74 Years | 135 (17.9%) | 181 (17.6%) |
| 75 Years and over | 214 (44.9%) | 174 (32.0%) |
Disability Class: Self-Care Difficulty
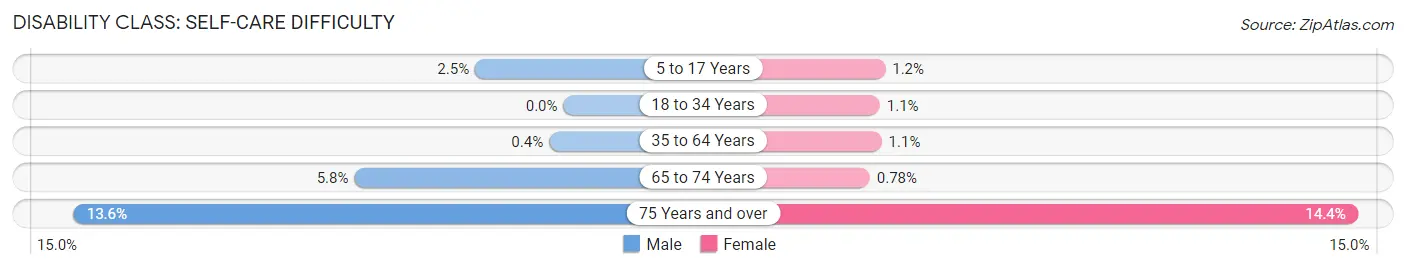
| Age Bracket | Male | Female |
| 5 to 17 Years | 39 (2.5%) | 15 (1.2%) |
| 18 to 34 Years | 0 (0.0%) | 17 (1.1%) |
| 35 to 64 Years | 11 (0.4%) | 34 (1.1%) |
| 65 to 74 Years | 44 (5.8%) | 8 (0.8%) |
| 75 Years and over | 65 (13.6%) | 78 (14.4%) |
Technology Access in Niceville
Computing Device Access in Niceville
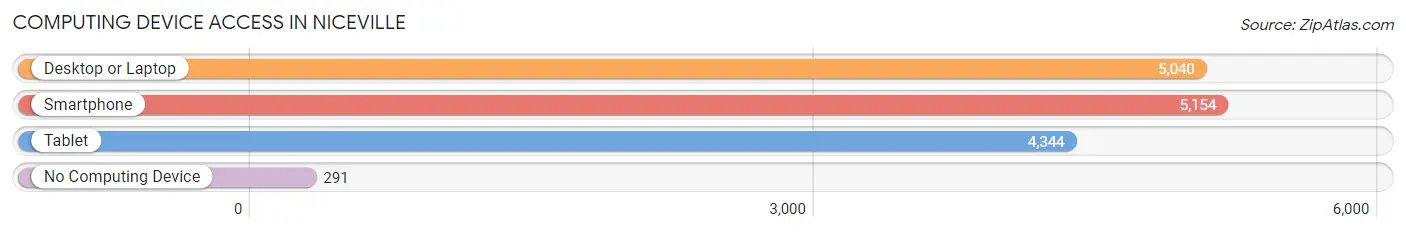
| Device Type | # Households | % Households |
| Desktop or Laptop | 5,040 | 88.3% |
| Smartphone | 5,154 | 90.3% |
| Tablet | 4,344 | 76.1% |
| No Computing Device | 291 | 5.1% |
| Total | 5,710 | 100.0% |
Internet Access in Niceville
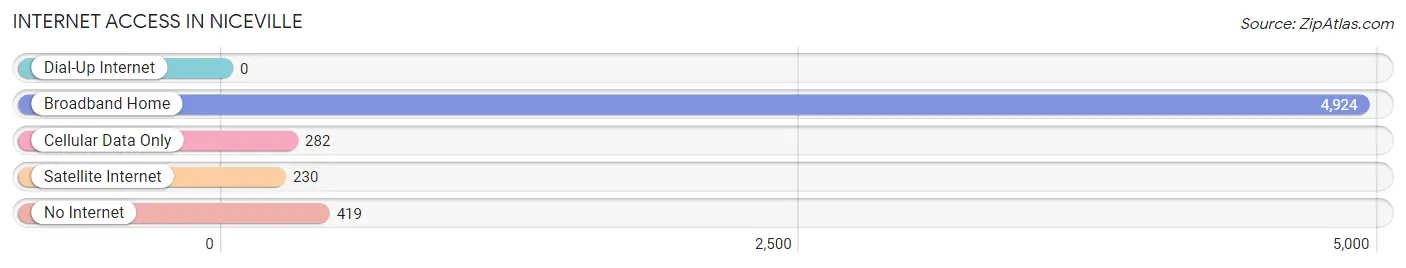
| Internet Type | # Households | % Households |
| Dial-Up Internet | 0 | 0.0% |
| Broadband Home | 4,924 | 86.2% |
| Cellular Data Only | 282 | 4.9% |
| Satellite Internet | 230 | 4.0% |
| No Internet | 419 | 7.3% |
| Total | 5,710 | 100.0% |
Niceville Summary
History
Niceville is a city located in Okaloosa County, Florida. It is part of the Fort Walton Beach-Crestview-Destin Metropolitan Statistical Area. The city was founded in the late 19th century and was originally known as Boggy Bayou. The city was renamed Niceville in 1910 after a local businessman, J.H. Nice. The city was incorporated in 1945 and has since grown to become a thriving community.
Niceville is home to Eglin Air Force Base, which was established in 1935. The base is the largest employer in the area and is responsible for much of the city’s economic growth. The base is home to the Air Force’s 96th Test Wing, which is responsible for testing and evaluating new aircraft and weapons systems.
The city is also home to Northwest Florida State College, which was established in 1964. The college offers a variety of degree programs and is a major contributor to the local economy.
Geography
Niceville is located in the Florida Panhandle, approximately 20 miles east of Pensacola and 40 miles west of Panama City. The city is situated on the shores of Choctawhatchee Bay and is bordered by the cities of Valparaiso and Crestview. The city covers an area of 8.3 square miles and has a population of approximately 13,000 people.
The city has a humid subtropical climate, with hot, humid summers and mild winters. The average annual temperature is 72 degrees Fahrenheit and the average annual precipitation is 62 inches.
Economy
Niceville’s economy is largely driven by Eglin Air Force Base and Northwest Florida State College. The base is the largest employer in the area and is responsible for much of the city’s economic growth. The college is also a major contributor to the local economy, providing jobs and educational opportunities to the community.
In addition to these two major employers, Niceville is home to a variety of small businesses, including restaurants, retail stores, and professional services. The city is also home to a number of manufacturing companies, including Gulf Power, which produces electrical components.
Demographics
As of the 2010 census, the population of Niceville was 12,749. The racial makeup of the city was 87.3% White, 8.2% African American, 0.7% Native American, 1.2% Asian, 0.1% Pacific Islander, and 2.5% from other races. The median household income was $50,945 and the median family income was $60,945.
The city is home to a variety of religious denominations, including Baptist, Methodist, Catholic, and Presbyterian. The city is also home to a variety of cultural and recreational activities, including festivals, museums, and parks.
Conclusion
Niceville is a city located in Okaloosa County, Florida. It is part of the Fort Walton Beach-Crestview-Destin Metropolitan Statistical Area and is home to Eglin Air Force Base and Northwest Florida State College. The city has a humid subtropical climate and is home to a variety of small businesses, manufacturing companies, and religious denominations. The population of Niceville was 12,749 as of the 2010 census and the median household income was $50,945. The city is a thriving community and is a great place to live and work.
Common Questions
What is Per Capita Income in Niceville?
Per Capita income in Niceville is $42,085.
What is the Median Family Income in Niceville?
Median Family Income in Niceville is $102,262.
What is the Median Household income in Niceville?
Median Household Income in Niceville is $92,345.
What is Income or Wage Gap in Niceville?
Income or Wage Gap in Niceville is 48.9%.
Women in Niceville earn 51.1 cents for every dollar earned by a man.
What is Family Income Deficit in Niceville?
Family Income Deficit in Niceville is $11,873.
Families that are below poverty line in Niceville earn $11,873 less on average than the poverty threshold level.
What is Inequality or Gini Index in Niceville?
Inequality or Gini Index in Niceville is 0.41.
What is the Total Population of Niceville?
Total Population of Niceville is 15,804.
What is the Total Male Population of Niceville?
Total Male Population of Niceville is 7,655.
What is the Total Female Population of Niceville?
Total Female Population of Niceville is 8,149.
What is the Ratio of Males per 100 Females in Niceville?
There are 93.94 Males per 100 Females in Niceville.
What is the Ratio of Females per 100 Males in Niceville?
There are 106.45 Females per 100 Males in Niceville.
What is the Median Population Age in Niceville?
Median Population Age in Niceville is 39.1 Years.
What is the Average Family Size in Niceville
Average Family Size in Niceville is 3.1 People.
What is the Average Household Size in Niceville
Average Household Size in Niceville is 2.8 People.
How Large is the Labor Force in Niceville?
There are 7,726 People in the Labor Forcein in Niceville.
What is the Percentage of People in the Labor Force in Niceville?
62.4% of People are in the Labor Force in Niceville.
What is the Unemployment Rate in Niceville?
Unemployment Rate in Niceville is 1.2%.