Neptune Beach, FL Map & Demographics
Neptune Beach Map
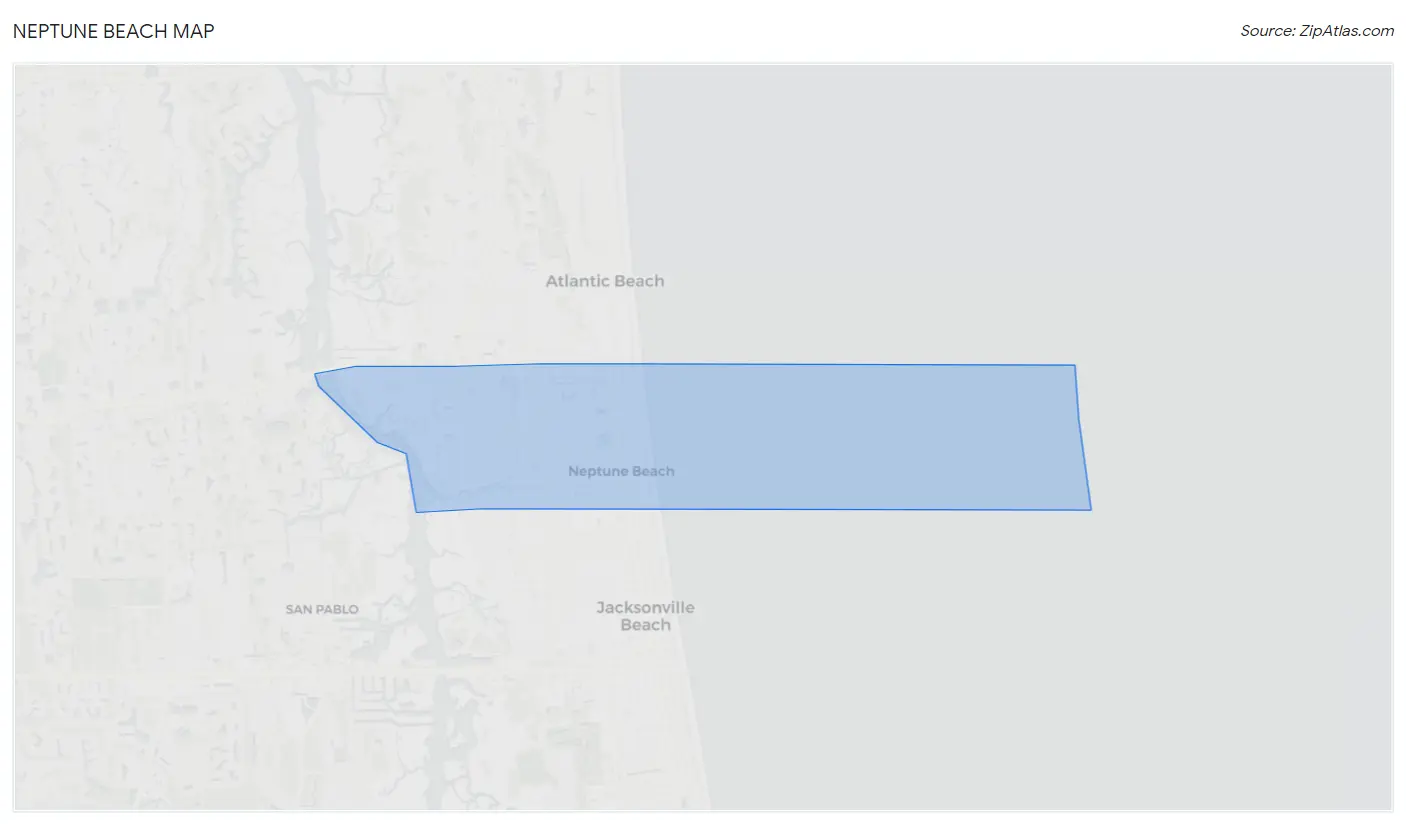
Neptune Beach Overview
$73,054
PER CAPITA INCOME
$120,893
AVG FAMILY INCOME
$109,375
AVG HOUSEHOLD INCOME
34.4%
WAGE / INCOME GAP [ % ]
65.6¢/ $1
WAGE / INCOME GAP [ $ ]
0.49
INEQUALITY / GINI INDEX
6,743
TOTAL POPULATION
3,298
MALE POPULATION
3,445
FEMALE POPULATION
95.73
MALES / 100 FEMALES
104.46
FEMALES / 100 MALES
44.4
MEDIAN AGE
2.7
AVG FAMILY SIZE
2.2
AVG HOUSEHOLD SIZE
4,329
LABOR FORCE [ PEOPLE ]
73.8%
PERCENT IN LABOR FORCE
1.1%
UNEMPLOYMENT RATE
Neptune Beach Zip Codes
Neptune Beach Area Codes
Income in Neptune Beach
Income Overview in Neptune Beach
Per Capita Income in Neptune Beach is $73,054, while median incomes of families and households are $120,893 and $109,375 respectively.
| Characteristic | Number | Measure |
| Per Capita Income | 6,743 | $73,054 |
| Median Family Income | 1,952 | $120,893 |
| Mean Family Income | 1,952 | $184,835 |
| Median Household Income | 3,020 | $109,375 |
| Mean Household Income | 3,020 | $159,944 |
| Income Deficit | 1,952 | $0 |
| Wage / Income Gap (%) | 6,743 | 34.43% |
| Wage / Income Gap ($) | 6,743 | 65.57¢ per $1 |
| Gini / Inequality Index | 6,743 | 0.49 |
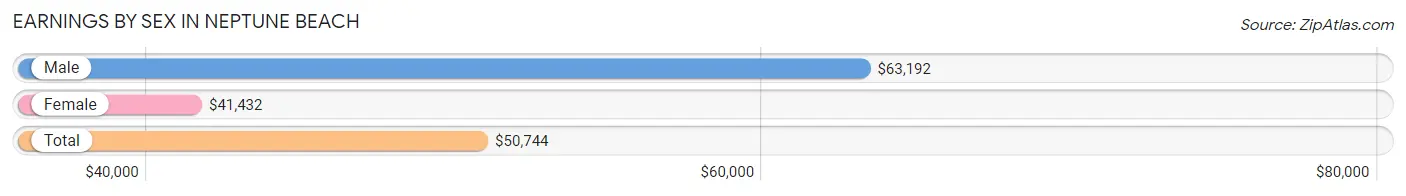
Earnings by Sex in Neptune Beach
Average Earnings in Neptune Beach are $50,744, $63,192 for men and $41,432 for women, a difference of 34.4%.
| Sex | Number | Average Earnings |
| Male | 2,292 (50.7%) | $63,192 |
| Female | 2,227 (49.3%) | $41,432 |
| Total | 4,519 (100.0%) | $50,744 |
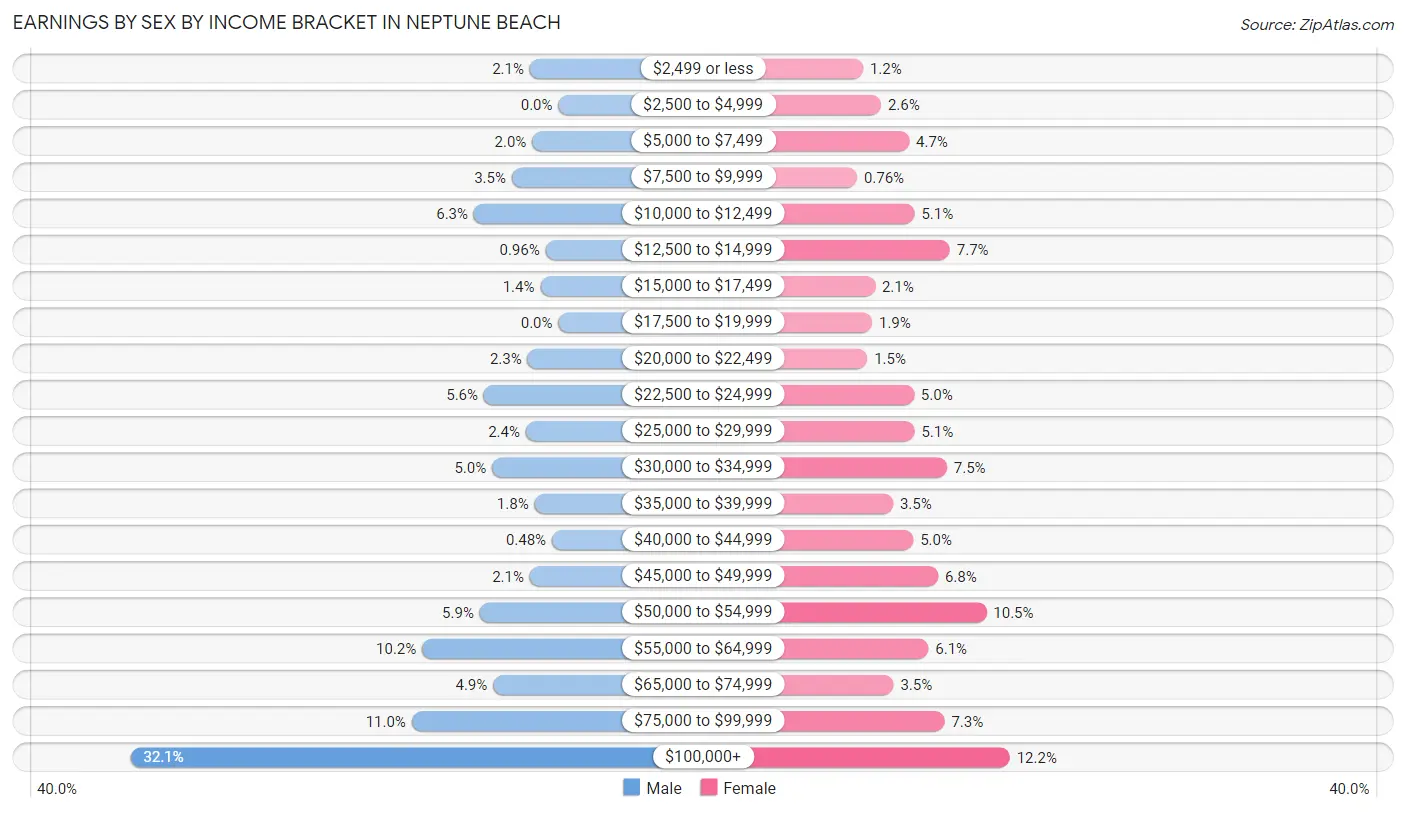
Earnings by Sex by Income Bracket in Neptune Beach
The most common earnings brackets in Neptune Beach are $100,000+ for men (735 | 32.1%) and $100,000+ for women (272 | 12.2%).
| Income | Male | Female |
| $2,499 or less | 49 (2.1%) | 27 (1.2%) |
| $2,500 to $4,999 | 0 (0.0%) | 57 (2.6%) |
| $5,000 to $7,499 | 45 (2.0%) | 104 (4.7%) |
| $7,500 to $9,999 | 80 (3.5%) | 17 (0.8%) |
| $10,000 to $12,499 | 145 (6.3%) | 113 (5.1%) |
| $12,500 to $14,999 | 22 (1.0%) | 172 (7.7%) |
| $15,000 to $17,499 | 31 (1.3%) | 47 (2.1%) |
| $17,500 to $19,999 | 0 (0.0%) | 42 (1.9%) |
| $20,000 to $22,499 | 53 (2.3%) | 34 (1.5%) |
| $22,500 to $24,999 | 128 (5.6%) | 112 (5.0%) |
| $25,000 to $29,999 | 56 (2.4%) | 113 (5.1%) |
| $30,000 to $34,999 | 114 (5.0%) | 167 (7.5%) |
| $35,000 to $39,999 | 41 (1.8%) | 77 (3.5%) |
| $40,000 to $44,999 | 11 (0.5%) | 111 (5.0%) |
| $45,000 to $49,999 | 49 (2.1%) | 152 (6.8%) |
| $50,000 to $54,999 | 135 (5.9%) | 233 (10.5%) |
| $55,000 to $64,999 | 234 (10.2%) | 136 (6.1%) |
| $65,000 to $74,999 | 112 (4.9%) | 78 (3.5%) |
| $75,000 to $99,999 | 252 (11.0%) | 163 (7.3%) |
| $100,000+ | 735 (32.1%) | 272 (12.2%) |
| Total | 2,292 (100.0%) | 2,227 (100.0%) |
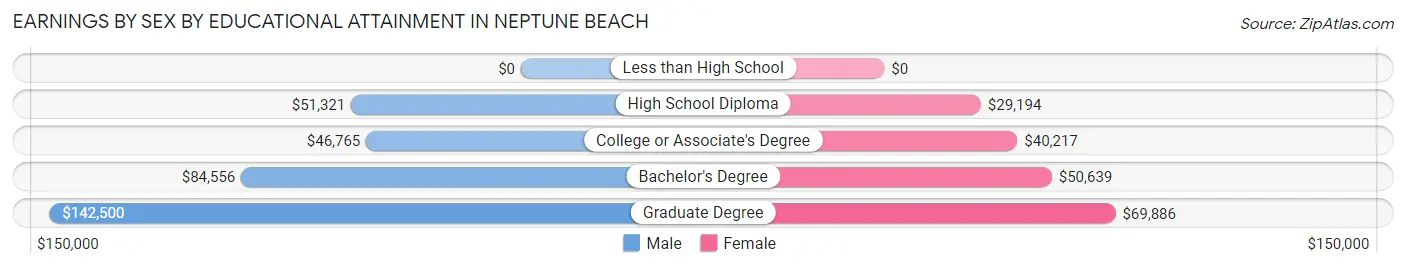
Earnings by Sex by Educational Attainment in Neptune Beach
Average earnings in Neptune Beach are $71,311 for men and $45,720 for women, a difference of 35.9%. Men with an educational attainment of graduate degree enjoy the highest average annual earnings of $142,500, while those with college or associate's degree education earn the least with $46,765. Women with an educational attainment of graduate degree earn the most with the average annual earnings of $69,886, while those with high school diploma education have the smallest earnings of $29,194.
| Educational Attainment | Male Income | Female Income |
| Less than High School | - | - |
| High School Diploma | $51,321 | $29,194 |
| College or Associate's Degree | $46,765 | $40,217 |
| Bachelor's Degree | $84,556 | $50,639 |
| Graduate Degree | $142,500 | $69,886 |
| Total | $71,311 | $45,720 |
Family Income in Neptune Beach
Family Income Brackets in Neptune Beach
According to the Neptune Beach family income data, there are 568 families falling into the $100,000 to $149,999 income range, which is the most common income bracket and makes up 29.1% of all families.
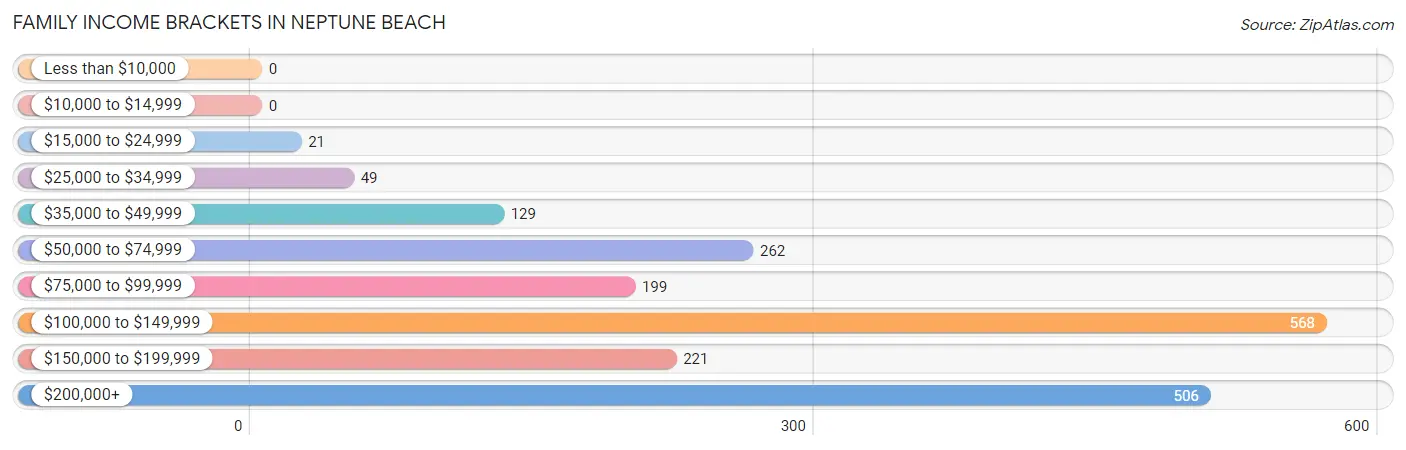
| Income Bracket | # Families | % Families |
| Less than $10,000 | 0 | 0.0% |
| $10,000 to $14,999 | 0 | 0.0% |
| $15,000 to $24,999 | 21 | 1.1% |
| $25,000 to $34,999 | 49 | 2.5% |
| $35,000 to $49,999 | 129 | 6.6% |
| $50,000 to $74,999 | 262 | 13.4% |
| $75,000 to $99,999 | 199 | 10.2% |
| $100,000 to $149,999 | 568 | 29.1% |
| $150,000 to $199,999 | 221 | 11.3% |
| $200,000+ | 506 | 25.9% |
Family Income by Famaliy Size in Neptune Beach
5-person families (48 | 2.5%) account for the highest median family income in Neptune Beach with $152,321 per family, while 2-person families (1,271 | 65.1%) have the highest median income of $56,554 per family member.
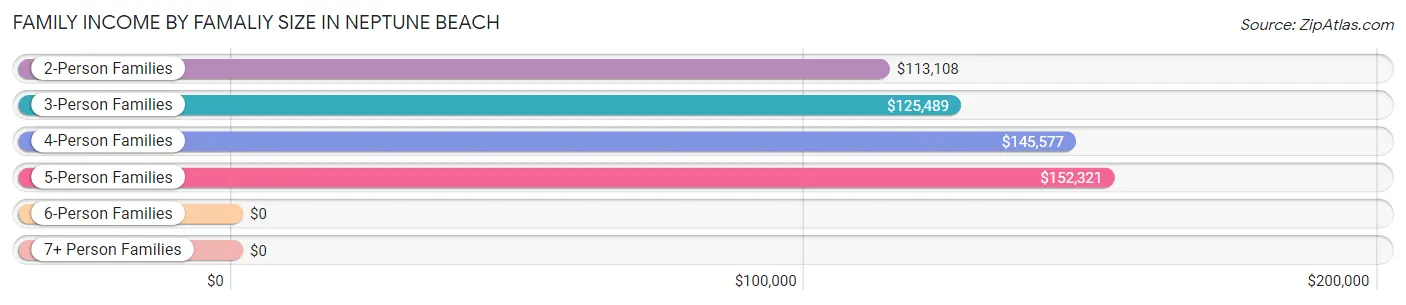
| Income Bracket | # Families | Median Income |
| 2-Person Families | 1,271 (65.1%) | $113,108 |
| 3-Person Families | 355 (18.2%) | $125,489 |
| 4-Person Families | 268 (13.7%) | $145,577 |
| 5-Person Families | 48 (2.5%) | $152,321 |
| 6-Person Families | 0 (0.0%) | $0 |
| 7+ Person Families | 10 (0.5%) | $0 |
| Total | 1,952 (100.0%) | $120,893 |
Family Income by Number of Earners in Neptune Beach
The median family income in Neptune Beach is $120,893, with families comprising 3+ earners (181) having the highest median family income of $211,294, while families with no earners (219) have the lowest median family income of $106,125, accounting for 9.3% and 11.2% of families, respectively.
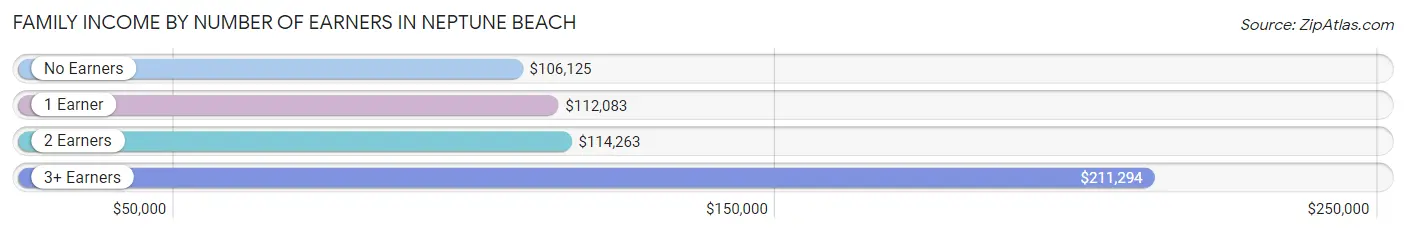
| Number of Earners | # Families | Median Income |
| No Earners | 219 (11.2%) | $106,125 |
| 1 Earner | 467 (23.9%) | $112,083 |
| 2 Earners | 1,085 (55.6%) | $114,263 |
| 3+ Earners | 181 (9.3%) | $211,294 |
| Total | 1,952 (100.0%) | $120,893 |
Household Income in Neptune Beach
Household Income Brackets in Neptune Beach
With 818 households falling in the category, the $100,000 to $149,999 income range is the most frequent in Neptune Beach, accounting for 27.1% of all households.
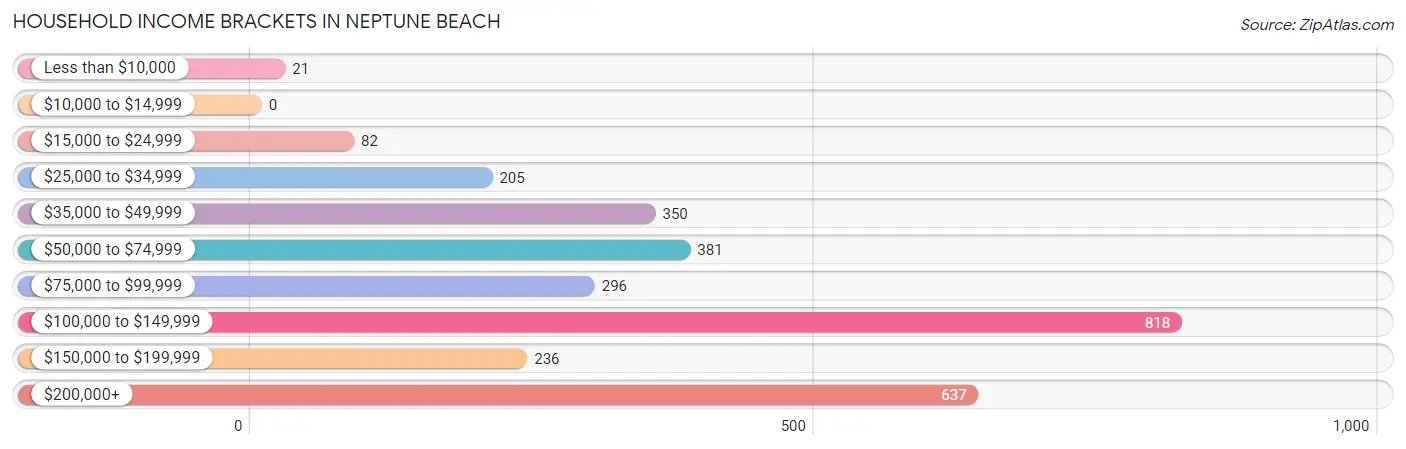
| Income Bracket | # Households | % Households |
| Less than $10,000 | 21 | 0.7% |
| $10,000 to $14,999 | 0 | 0.0% |
| $15,000 to $24,999 | 82 | 2.7% |
| $25,000 to $34,999 | 205 | 6.8% |
| $35,000 to $49,999 | 350 | 11.6% |
| $50,000 to $74,999 | 381 | 12.6% |
| $75,000 to $99,999 | 296 | 9.8% |
| $100,000 to $149,999 | 818 | 27.1% |
| $150,000 to $199,999 | 236 | 7.8% |
| $200,000+ | 637 | 21.1% |
Household Income by Householder Age in Neptune Beach
The median household income in Neptune Beach is $109,375, with the highest median household income of $142,759 found in the 45 to 64 years age bracket for the primary householder. A total of 1,065 households (35.3%) fall into this category. Meanwhile, the 15 to 24 years age bracket for the primary householder has the lowest median household income of $48,571, with 126 households (4.2%) in this group.
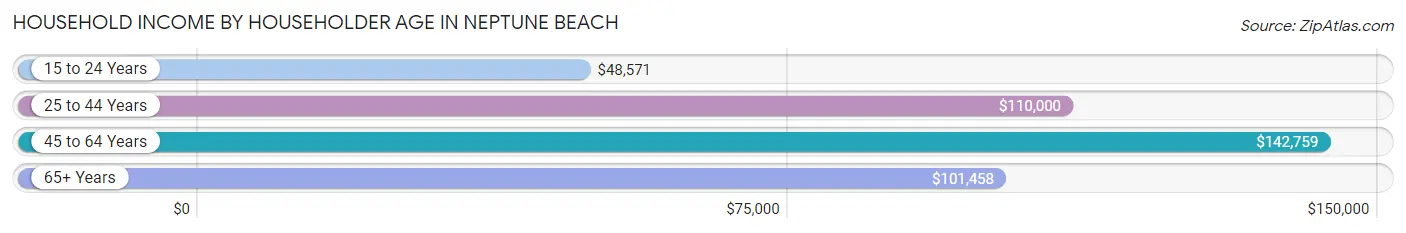
| Income Bracket | # Households | Median Income |
| 15 to 24 Years | 126 (4.2%) | $48,571 |
| 25 to 44 Years | 980 (32.5%) | $110,000 |
| 45 to 64 Years | 1,065 (35.3%) | $142,759 |
| 65+ Years | 849 (28.1%) | $101,458 |
| Total | 3,020 (100.0%) | $109,375 |
Poverty in Neptune Beach
Income Below Poverty by Sex and Age in Neptune Beach
With 2.5% poverty level for males and 2.0% for females among the residents of Neptune Beach, 16 and 17 year old males and 25 to 34 year old females are the most vulnerable to poverty, with 40 males (37.0%) and 48 females (9.1%) in their respective age groups living below the poverty level.
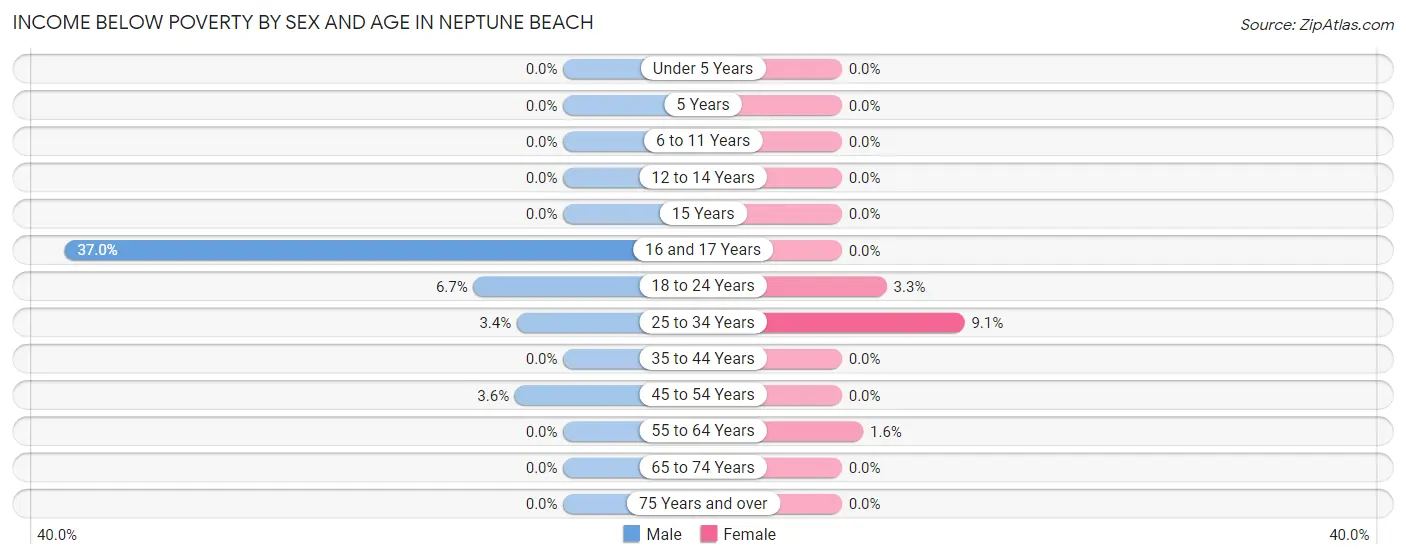
| Age Bracket | Male | Female |
| Under 5 Years | 0 (0.0%) | 0 (0.0%) |
| 5 Years | 0 (0.0%) | 0 (0.0%) |
| 6 to 11 Years | 0 (0.0%) | 0 (0.0%) |
| 12 to 14 Years | 0 (0.0%) | 0 (0.0%) |
| 15 Years | 0 (0.0%) | 0 (0.0%) |
| 16 and 17 Years | 40 (37.0%) | 0 (0.0%) |
| 18 to 24 Years | 14 (6.7%) | 9 (3.3%) |
| 25 to 34 Years | 11 (3.4%) | 48 (9.1%) |
| 35 to 44 Years | 0 (0.0%) | 0 (0.0%) |
| 45 to 54 Years | 16 (3.6%) | 0 (0.0%) |
| 55 to 64 Years | 0 (0.0%) | 11 (1.6%) |
| 65 to 74 Years | 0 (0.0%) | 0 (0.0%) |
| 75 Years and over | 0 (0.0%) | 0 (0.0%) |
| Total | 81 (2.5%) | 68 (2.0%) |
Income Above Poverty by Sex and Age in Neptune Beach
According to the poverty statistics in Neptune Beach, males aged under 5 years and females aged under 5 years are the age groups that are most secure financially, with 100.0% of males and 100.0% of females in these age groups living above the poverty line.
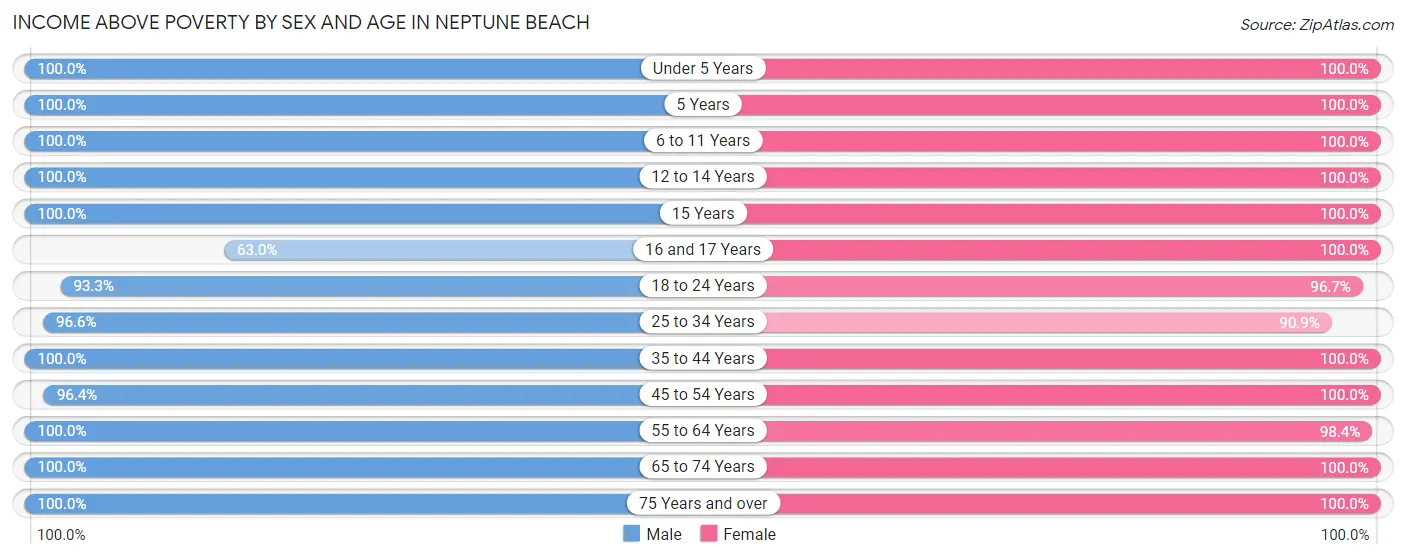
| Age Bracket | Male | Female |
| Under 5 Years | 131 (100.0%) | 144 (100.0%) |
| 5 Years | 24 (100.0%) | 14 (100.0%) |
| 6 to 11 Years | 237 (100.0%) | 97 (100.0%) |
| 12 to 14 Years | 70 (100.0%) | 129 (100.0%) |
| 15 Years | 5 (100.0%) | 26 (100.0%) |
| 16 and 17 Years | 68 (63.0%) | 73 (100.0%) |
| 18 to 24 Years | 196 (93.3%) | 261 (96.7%) |
| 25 to 34 Years | 309 (96.6%) | 479 (90.9%) |
| 35 to 44 Years | 506 (100.0%) | 548 (100.0%) |
| 45 to 54 Years | 430 (96.4%) | 268 (100.0%) |
| 55 to 64 Years | 579 (100.0%) | 684 (98.4%) |
| 65 to 74 Years | 540 (100.0%) | 411 (100.0%) |
| 75 Years and over | 122 (100.0%) | 243 (100.0%) |
| Total | 3,217 (97.5%) | 3,377 (98.0%) |
Income Below Poverty Among Married-Couple Families in Neptune Beach
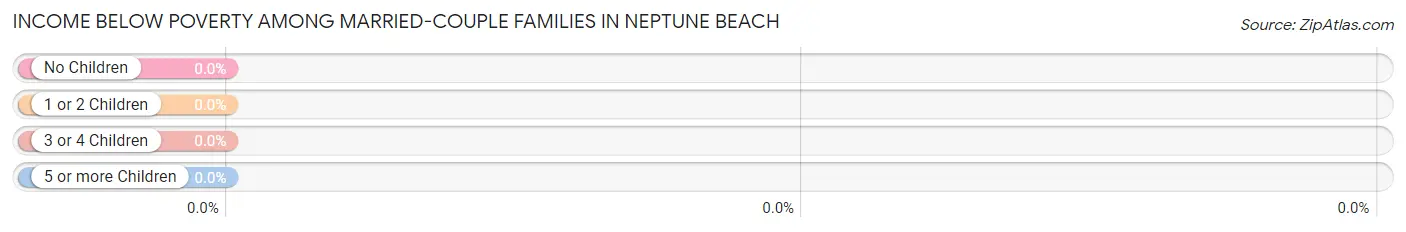
| Children | Above Poverty | Below Poverty |
| No Children | 1,340 (100.0%) | 0 (0.0%) |
| 1 or 2 Children | 359 (100.0%) | 0 (0.0%) |
| 3 or 4 Children | 43 (100.0%) | 0 (0.0%) |
| 5 or more Children | 0 (0.0%) | 0 (0.0%) |
| Total | 1,742 (100.0%) | 0 (0.0%) |
Income Below Poverty Among Single-Parent Households in Neptune Beach
| Children | Single Father | Single Mother |
| No Children | 0 (0.0%) | 0 (0.0%) |
| 1 or 2 Children | 0 (0.0%) | 0 (0.0%) |
| 3 or 4 Children | 0 (0.0%) | 0 (0.0%) |
| 5 or more Children | 0 (0.0%) | 0 (0.0%) |
| Total | 0 (0.0%) | 0 (0.0%) |
Income Below Poverty Among Married-Couple vs Single-Parent Households in Neptune Beach
| Children | Married-Couple Families | Single-Parent Households |
| No Children | 0 (0.0%) | 0 (0.0%) |
| 1 or 2 Children | 0 (0.0%) | 0 (0.0%) |
| 3 or 4 Children | 0 (0.0%) | 0 (0.0%) |
| 5 or more Children | 0 (0.0%) | 0 (0.0%) |
| Total | 0 (0.0%) | 0 (0.0%) |
Race in Neptune Beach
The most populous races in Neptune Beach are White / Caucasian (6,417 | 95.2%), Hispanic or Latino (431 | 6.4%), and Two or more Races (160 | 2.4%).
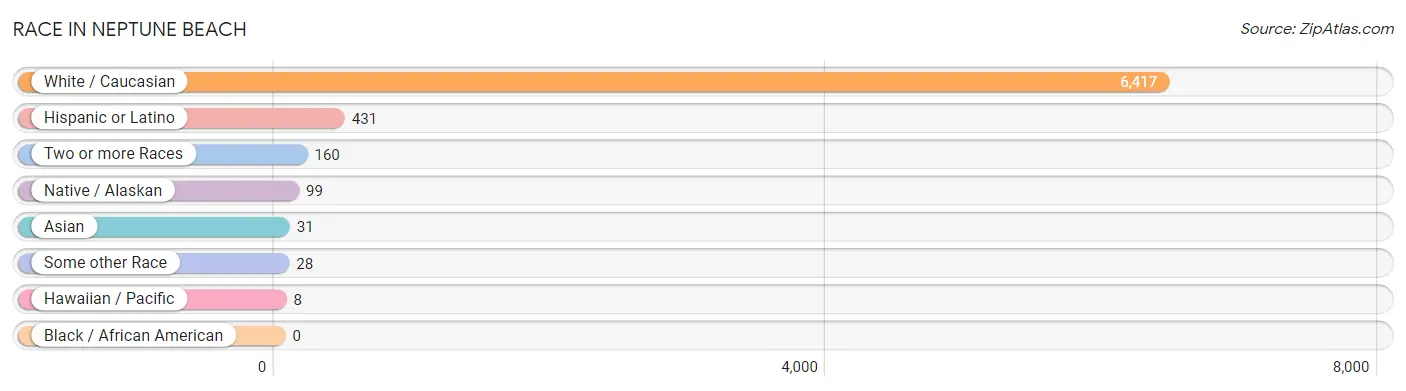
| Race | # Population | % Population |
| Asian | 31 | 0.5% |
| Black / African American | 0 | 0.0% |
| Hawaiian / Pacific | 8 | 0.1% |
| Hispanic or Latino | 431 | 6.4% |
| Native / Alaskan | 99 | 1.5% |
| White / Caucasian | 6,417 | 95.2% |
| Two or more Races | 160 | 2.4% |
| Some other Race | 28 | 0.4% |
| Total | 6,743 | 100.0% |
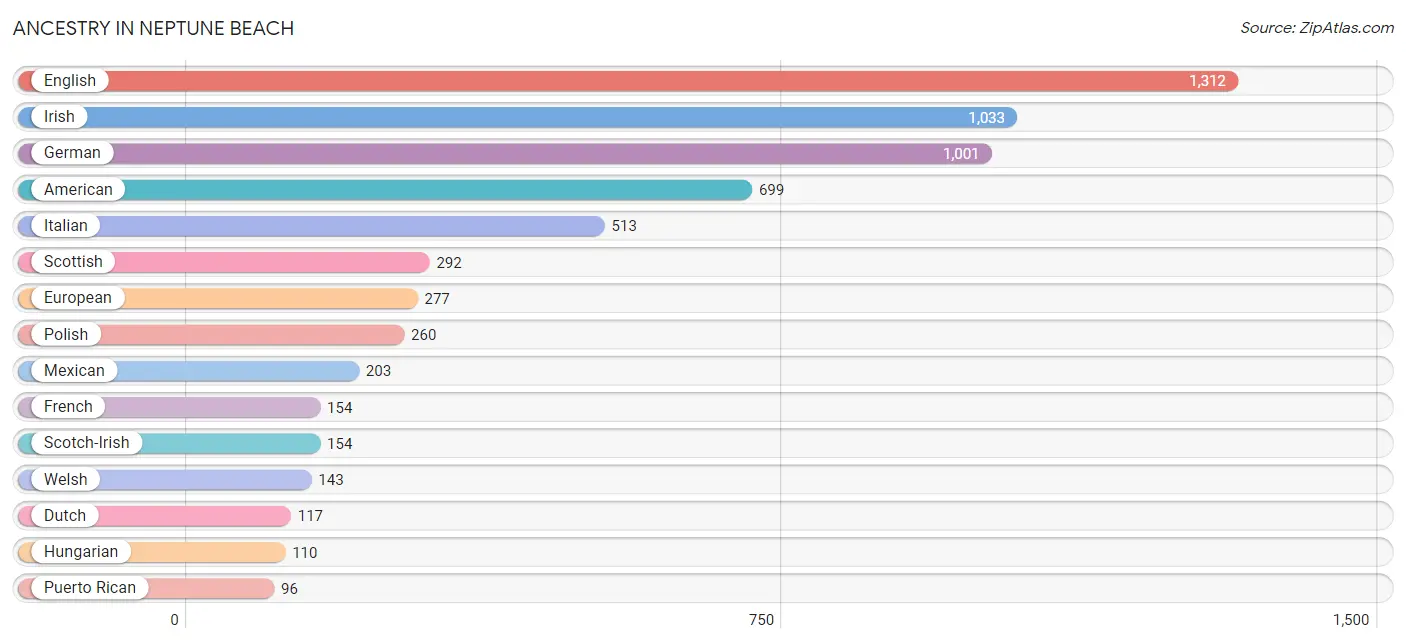
Ancestry in Neptune Beach
The most populous ancestries reported in Neptune Beach are English (1,312 | 19.5%), Irish (1,033 | 15.3%), German (1,001 | 14.8%), American (699 | 10.4%), and Italian (513 | 7.6%), together accounting for 67.6% of all Neptune Beach residents.
| Ancestry | # Population | % Population |
| American | 699 | 10.4% |
| Arab | 88 | 1.3% |
| Argentinean | 29 | 0.4% |
| Austrian | 9 | 0.1% |
| Brazilian | 10 | 0.2% |
| British | 84 | 1.3% |
| Canadian | 9 | 0.1% |
| Celtic | 11 | 0.2% |
| Central American | 21 | 0.3% |
| Cherokee | 7 | 0.1% |
| Choctaw | 92 | 1.4% |
| Colombian | 38 | 0.6% |
| Croatian | 24 | 0.4% |
| Cuban | 10 | 0.2% |
| Czech | 50 | 0.7% |
| Danish | 52 | 0.8% |
| Dutch | 117 | 1.7% |
| English | 1,312 | 19.5% |
| European | 277 | 4.1% |
| French | 154 | 2.3% |
| French Canadian | 25 | 0.4% |
| German | 1,001 | 14.8% |
| Greek | 40 | 0.6% |
| Guatemalan | 15 | 0.2% |
| Honduran | 6 | 0.1% |
| Hungarian | 110 | 1.6% |
| Indian (Asian) | 13 | 0.2% |
| Irish | 1,033 | 15.3% |
| Iroquois | 7 | 0.1% |
| Italian | 513 | 7.6% |
| Korean | 34 | 0.5% |
| Lebanese | 10 | 0.2% |
| Mexican | 203 | 3.0% |
| Moroccan | 41 | 0.6% |
| Native Hawaiian | 8 | 0.1% |
| Northern European | 58 | 0.9% |
| Norwegian | 7 | 0.1% |
| Polish | 260 | 3.9% |
| Portuguese | 9 | 0.1% |
| Puerto Rican | 96 | 1.4% |
| Russian | 87 | 1.3% |
| Scotch-Irish | 154 | 2.3% |
| Scottish | 292 | 4.3% |
| Slavic | 81 | 1.2% |
| Slovene | 8 | 0.1% |
| South American | 76 | 1.1% |
| Spaniard | 25 | 0.4% |
| Swedish | 18 | 0.3% |
| Swiss | 66 | 1.0% |
| Syrian | 10 | 0.2% |
| Venezuelan | 9 | 0.1% |
| Welsh | 143 | 2.1% | View All 52 Rows |
Immigrants in Neptune Beach
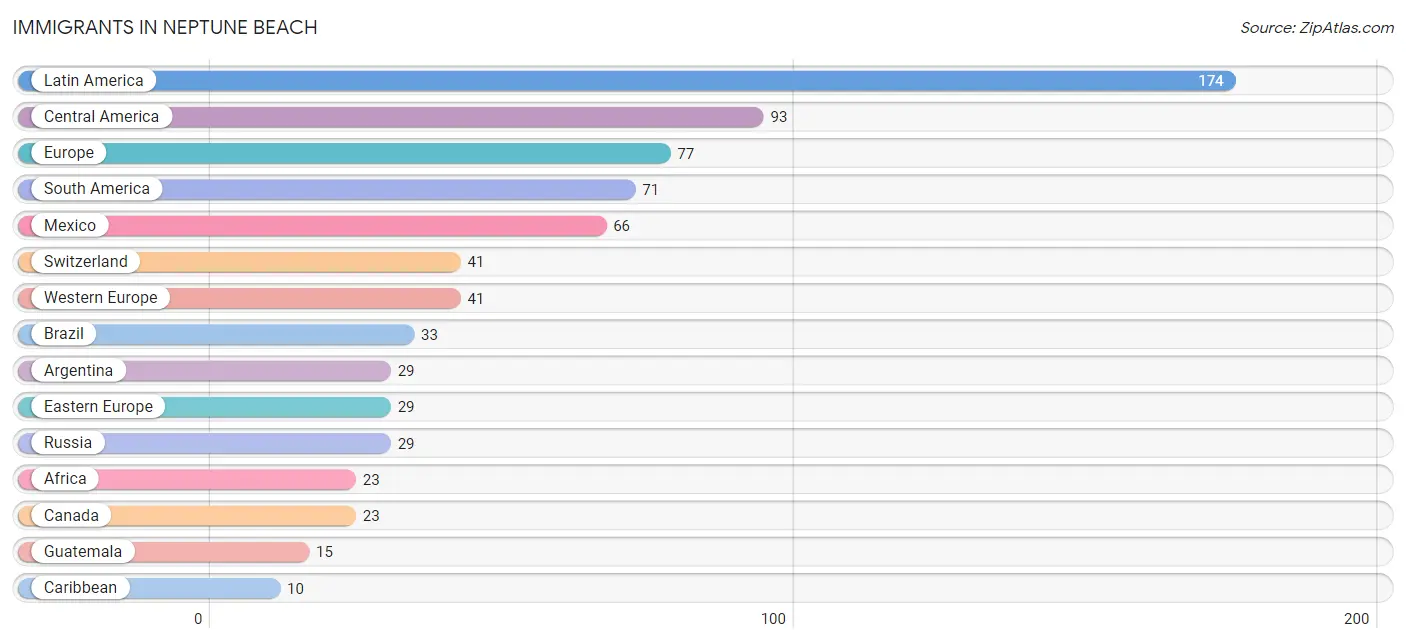
The most numerous immigrant groups reported in Neptune Beach came from Latin America (174 | 2.6%), Central America (93 | 1.4%), Europe (77 | 1.1%), South America (71 | 1.1%), and Mexico (66 | 1.0%), together accounting for 7.1% of all Neptune Beach residents.
| Immigration Origin | # Population | % Population |
| Africa | 23 | 0.3% |
| Argentina | 29 | 0.4% |
| Asia | 2 | 0.0% |
| Brazil | 33 | 0.5% |
| Canada | 23 | 0.3% |
| Caribbean | 10 | 0.2% |
| Central America | 93 | 1.4% |
| Cuba | 10 | 0.2% |
| Eastern Europe | 29 | 0.4% |
| Europe | 77 | 1.1% |
| Guatemala | 15 | 0.2% |
| Latin America | 174 | 2.6% |
| Mexico | 66 | 1.0% |
| Nicaragua | 5 | 0.1% |
| Pakistan | 2 | 0.0% |
| Panama | 7 | 0.1% |
| Russia | 29 | 0.4% |
| South America | 71 | 1.1% |
| South Central Asia | 2 | 0.0% |
| Southern Europe | 7 | 0.1% |
| Spain | 7 | 0.1% |
| Switzerland | 41 | 0.6% |
| Venezuela | 9 | 0.1% |
| Western Europe | 41 | 0.6% | View All 24 Rows |
Sex and Age in Neptune Beach
Sex and Age in Neptune Beach
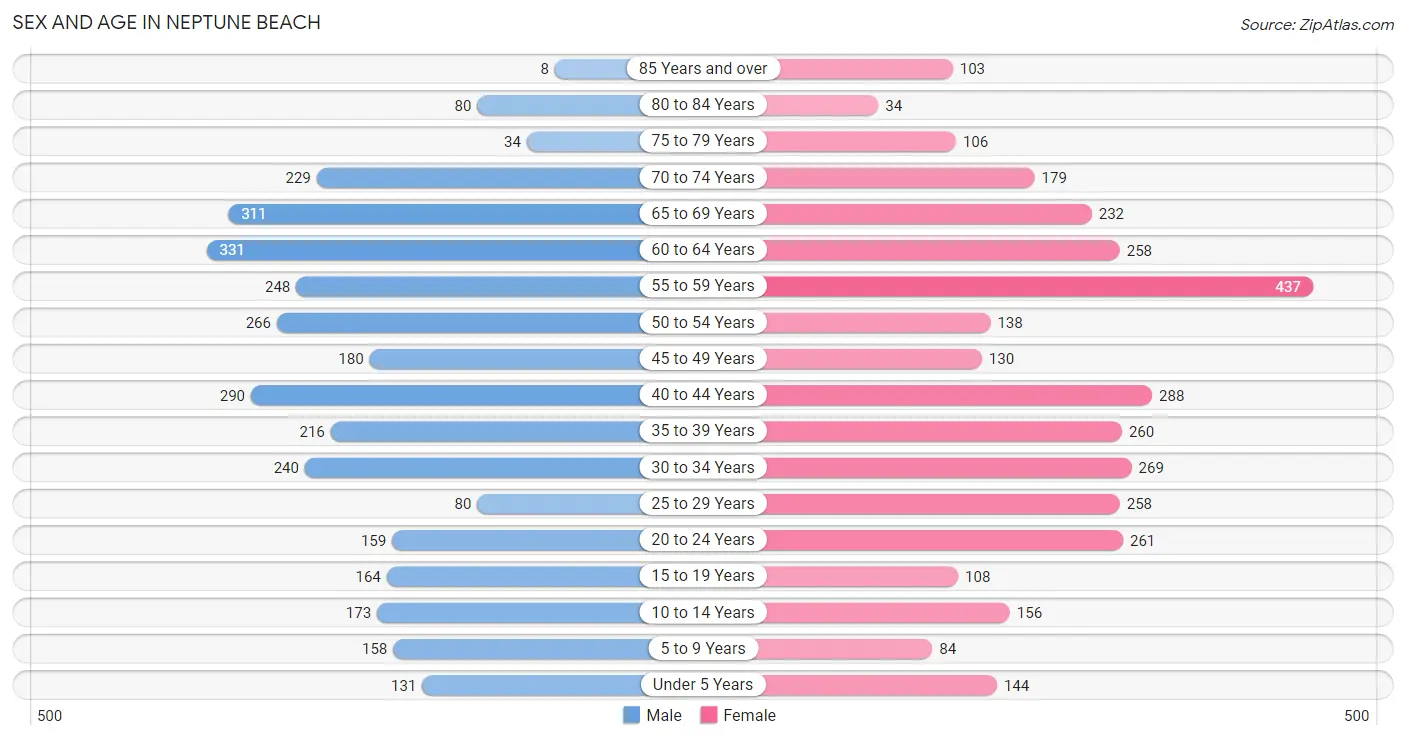
The most populous age groups in Neptune Beach are 60 to 64 Years (331 | 10.0%) for men and 55 to 59 Years (437 | 12.7%) for women.
| Age Bracket | Male | Female |
| Under 5 Years | 131 (4.0%) | 144 (4.2%) |
| 5 to 9 Years | 158 (4.8%) | 84 (2.4%) |
| 10 to 14 Years | 173 (5.2%) | 156 (4.5%) |
| 15 to 19 Years | 164 (5.0%) | 108 (3.1%) |
| 20 to 24 Years | 159 (4.8%) | 261 (7.6%) |
| 25 to 29 Years | 80 (2.4%) | 258 (7.5%) |
| 30 to 34 Years | 240 (7.3%) | 269 (7.8%) |
| 35 to 39 Years | 216 (6.6%) | 260 (7.5%) |
| 40 to 44 Years | 290 (8.8%) | 288 (8.4%) |
| 45 to 49 Years | 180 (5.5%) | 130 (3.8%) |
| 50 to 54 Years | 266 (8.1%) | 138 (4.0%) |
| 55 to 59 Years | 248 (7.5%) | 437 (12.7%) |
| 60 to 64 Years | 331 (10.0%) | 258 (7.5%) |
| 65 to 69 Years | 311 (9.4%) | 232 (6.7%) |
| 70 to 74 Years | 229 (6.9%) | 179 (5.2%) |
| 75 to 79 Years | 34 (1.0%) | 106 (3.1%) |
| 80 to 84 Years | 80 (2.4%) | 34 (1.0%) |
| 85 Years and over | 8 (0.2%) | 103 (3.0%) |
| Total | 3,298 (100.0%) | 3,445 (100.0%) |
Families and Households in Neptune Beach
Median Family Size in Neptune Beach
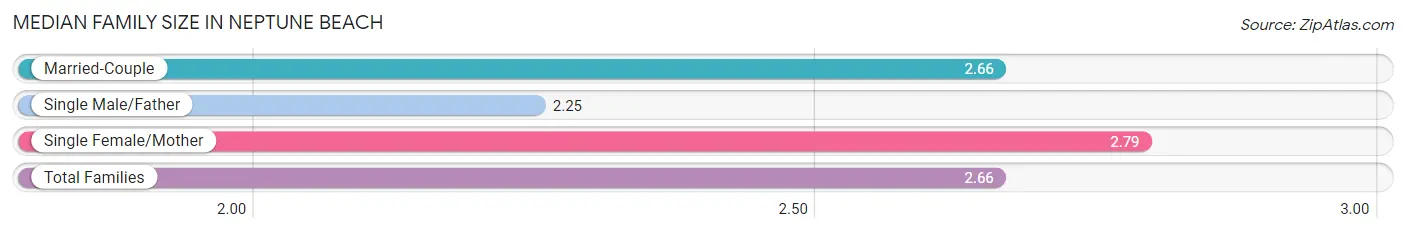
The median family size in Neptune Beach is 2.66 persons per family, with single female/mother families (150 | 7.7%) accounting for the largest median family size of 2.79 persons per family. On the other hand, single male/father families (60 | 3.1%) represent the smallest median family size with 2.25 persons per family.
| Family Type | # Families | Family Size |
| Married-Couple | 1,742 (89.2%) | 2.66 |
| Single Male/Father | 60 (3.1%) | 2.25 |
| Single Female/Mother | 150 (7.7%) | 2.79 |
| Total Families | 1,952 (100.0%) | 2.66 |
Median Household Size in Neptune Beach
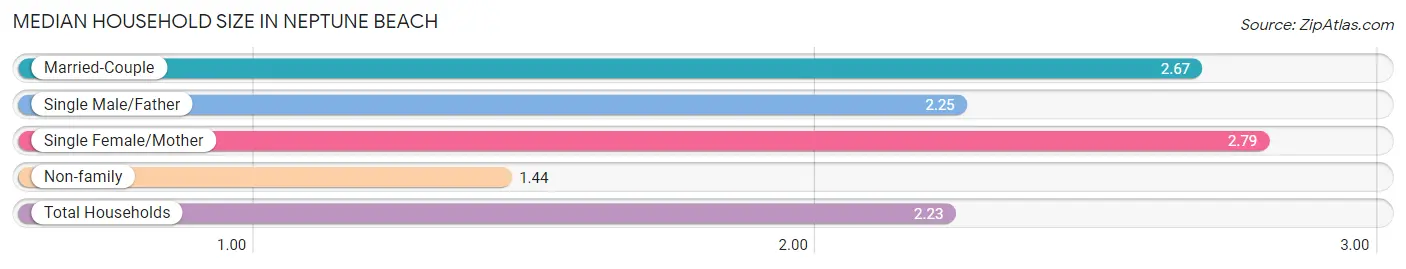
The median household size in Neptune Beach is 2.23 persons per household, with single female/mother households (150 | 5.0%) accounting for the largest median household size of 2.79 persons per household. non-family households (1,068 | 35.4%) represent the smallest median household size with 1.44 persons per household.
| Household Type | # Households | Household Size |
| Married-Couple | 1,742 (57.7%) | 2.67 |
| Single Male/Father | 60 (2.0%) | 2.25 |
| Single Female/Mother | 150 (5.0%) | 2.79 |
| Non-family | 1,068 (35.4%) | 1.44 |
| Total Households | 3,020 (100.0%) | 2.23 |
Household Size by Marriage Status in Neptune Beach
Out of a total of 3,020 households in Neptune Beach, 1,952 (64.6%) are family households, while 1,068 (35.4%) are nonfamily households. The most numerous type of family households are 2-person households, comprising 1,271, and the most common type of nonfamily households are 1-person households, comprising 745.
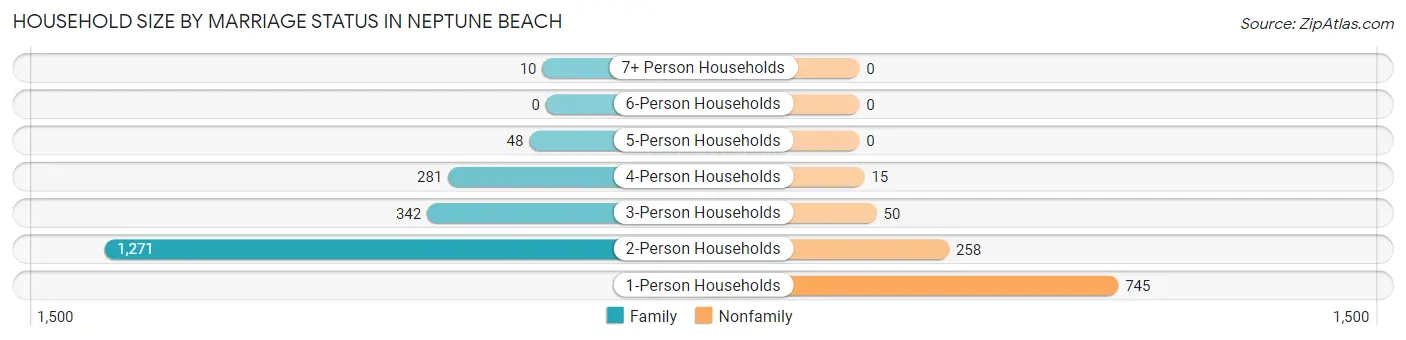
| Household Size | Family Households | Nonfamily Households |
| 1-Person Households | - | 745 (24.7%) |
| 2-Person Households | 1,271 (42.1%) | 258 (8.5%) |
| 3-Person Households | 342 (11.3%) | 50 (1.7%) |
| 4-Person Households | 281 (9.3%) | 15 (0.5%) |
| 5-Person Households | 48 (1.6%) | 0 (0.0%) |
| 6-Person Households | 0 (0.0%) | 0 (0.0%) |
| 7+ Person Households | 10 (0.3%) | 0 (0.0%) |
| Total | 1,952 (64.6%) | 1,068 (35.4%) |
Female Fertility in Neptune Beach
Fertility by Age in Neptune Beach
Average fertility rate in Neptune Beach is 58.0 births per 1,000 women. Women in the age bracket of 20 to 34 years have the highest fertility rate with 74.0 births per 1,000 women. Women in the age bracket of 20 to 34 years acount for 62.4% of all women with births.
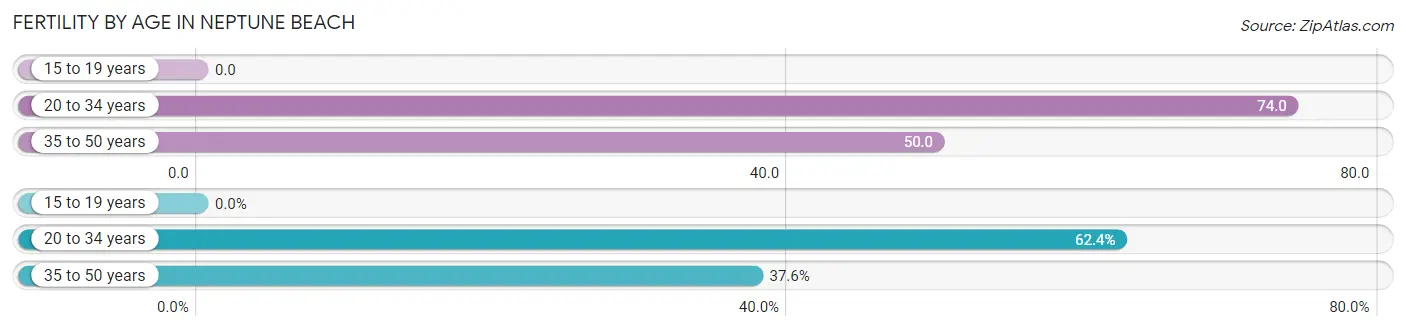
| Age Bracket | Women with Births | Births / 1,000 Women |
| 15 to 19 years | 0 (0.0%) | 0.0 |
| 20 to 34 years | 58 (62.4%) | 74.0 |
| 35 to 50 years | 35 (37.6%) | 50.0 |
| Total | 93 (100.0%) | 58.0 |
Fertility by Age by Marriage Status in Neptune Beach
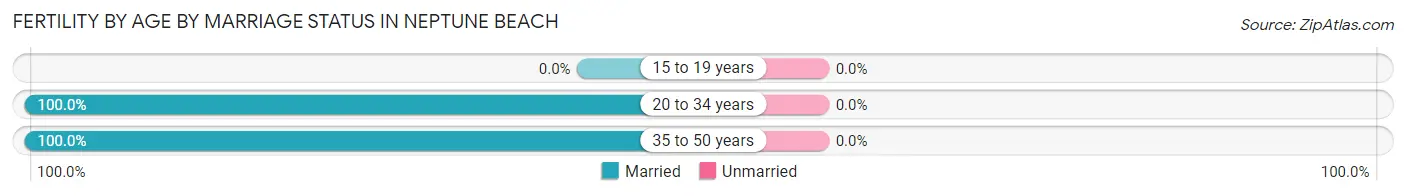
| Age Bracket | Married | Unmarried |
| 15 to 19 years | 0 (0.0%) | 0 (0.0%) |
| 20 to 34 years | 58 (100.0%) | 0 (0.0%) |
| 35 to 50 years | 35 (100.0%) | 0 (0.0%) |
| Total | 93 (100.0%) | 0 (0.0%) |
Fertility by Education in Neptune Beach
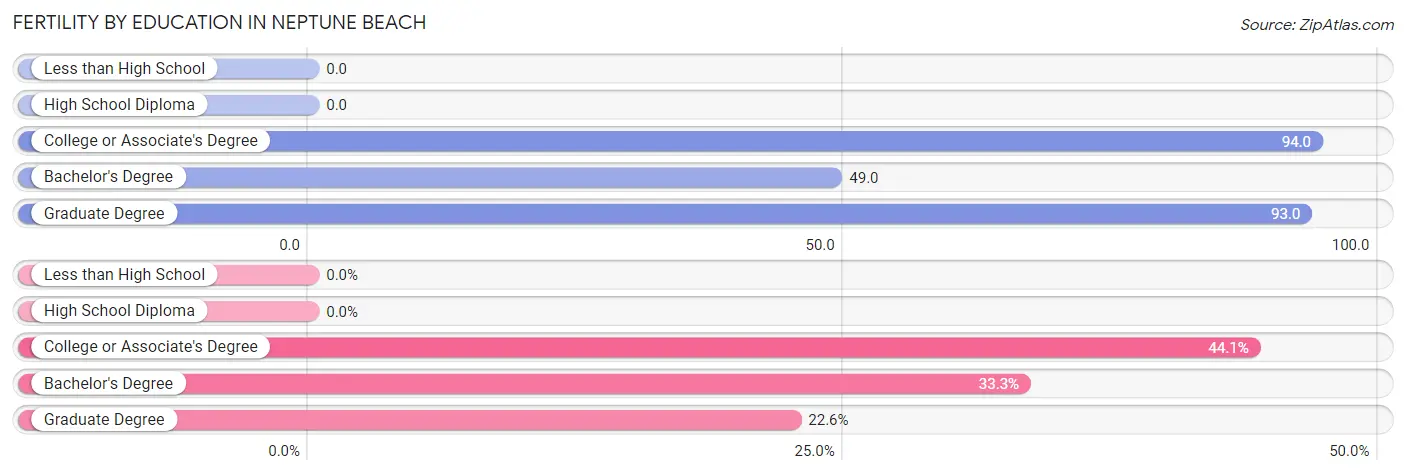
| Educational Attainment | Women with Births | Births / 1,000 Women |
| Less than High School | 0 (0.0%) | 0.0 |
| High School Diploma | 0 (0.0%) | 0.0 |
| College or Associate's Degree | 41 (44.1%) | 94.0 |
| Bachelor's Degree | 31 (33.3%) | 49.0 |
| Graduate Degree | 21 (22.6%) | 93.0 |
| Total | 93 (100.0%) | 58.0 |
Fertility by Education by Marriage Status in Neptune Beach
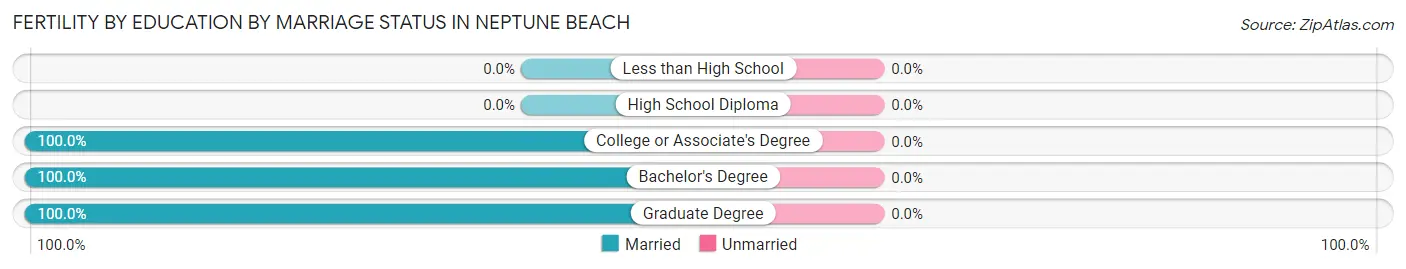
| Educational Attainment | Married | Unmarried |
| Less than High School | 0 (0.0%) | 0 (0.0%) |
| High School Diploma | 0 (0.0%) | 0 (0.0%) |
| College or Associate's Degree | 41 (100.0%) | 0 (0.0%) |
| Bachelor's Degree | 31 (100.0%) | 0 (0.0%) |
| Graduate Degree | 21 (100.0%) | 0 (0.0%) |
| Total | 93 (100.0%) | 0 (0.0%) |
Employment Characteristics in Neptune Beach
Employment by Class of Employer in Neptune Beach
Among the 4,243 employed individuals in Neptune Beach, private company employees (2,932 | 69.1%), self-employed (incorporated) (426 | 10.0%), and self-employed (not incorporated) (239 | 5.6%) make up the most common classes of employment.
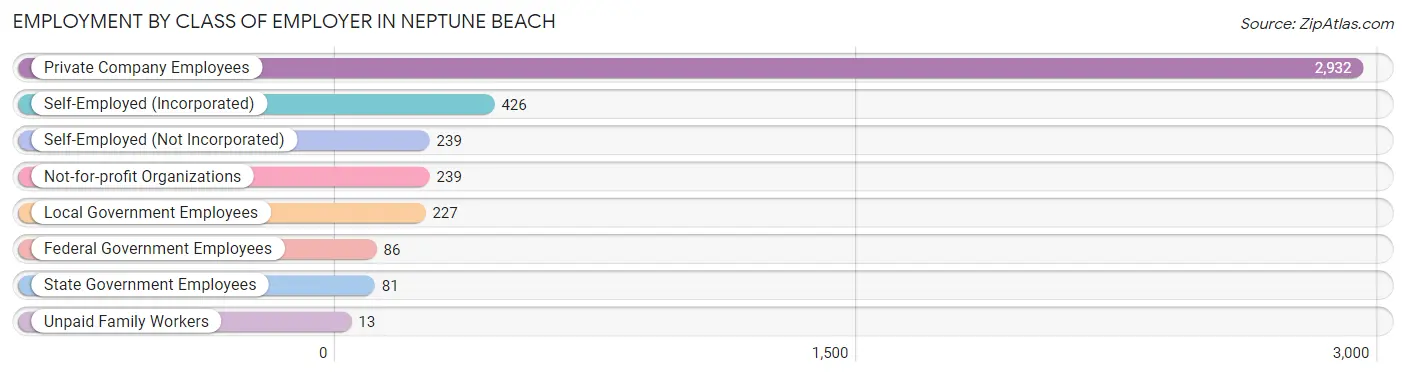
| Employer Class | # Employees | % Employees |
| Private Company Employees | 2,932 | 69.1% |
| Self-Employed (Incorporated) | 426 | 10.0% |
| Self-Employed (Not Incorporated) | 239 | 5.6% |
| Not-for-profit Organizations | 239 | 5.6% |
| Local Government Employees | 227 | 5.3% |
| State Government Employees | 81 | 1.9% |
| Federal Government Employees | 86 | 2.0% |
| Unpaid Family Workers | 13 | 0.3% |
| Total | 4,243 | 100.0% |
Employment Status by Age in Neptune Beach
According to the labor force statistics for Neptune Beach, out of the total population over 16 years of age (5,866), 73.8% or 4,329 individuals are in the labor force, with 1.1% or 48 of them unemployed. The age group with the highest labor force participation rate is 20 to 24 years, with 96.7% or 406 individuals in the labor force. Within the labor force, the 65 to 74 years age range has the highest percentage of unemployed individuals, with 7.6% or 31 of them being unemployed.
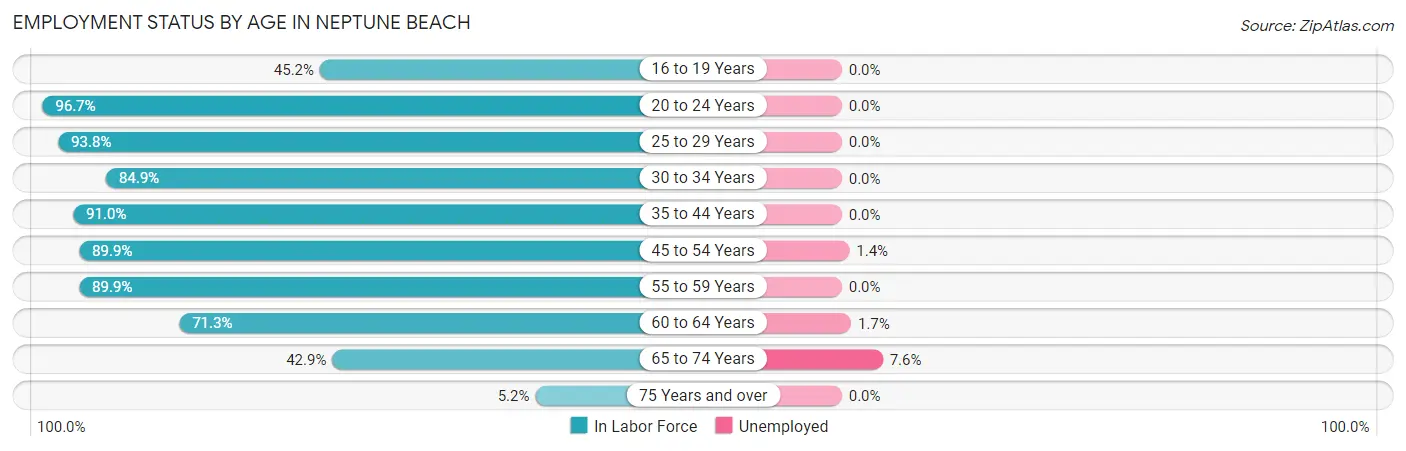
| Age Bracket | In Labor Force | Unemployed |
| 16 to 19 Years | 109 (45.2%) | 0 (0.0%) |
| 20 to 24 Years | 406 (96.7%) | 0 (0.0%) |
| 25 to 29 Years | 317 (93.8%) | 0 (0.0%) |
| 30 to 34 Years | 432 (84.9%) | 0 (0.0%) |
| 35 to 44 Years | 959 (91.0%) | 0 (0.0%) |
| 45 to 54 Years | 642 (89.9%) | 9 (1.4%) |
| 55 to 59 Years | 616 (89.9%) | 0 (0.0%) |
| 60 to 64 Years | 420 (71.3%) | 7 (1.7%) |
| 65 to 74 Years | 408 (42.9%) | 31 (7.6%) |
| 75 Years and over | 19 (5.2%) | 0 (0.0%) |
| Total | 4,329 (73.8%) | 48 (1.1%) |
Employment Status by Educational Attainment in Neptune Beach
According to labor force statistics for Neptune Beach, 87.1% of individuals (3,387) out of the total population between 25 and 64 years of age (3,889) are in the labor force, with 0.5% or 17 of them being unemployed. The group with the highest labor force participation rate are those with the educational attainment of less than high school, with 95.5% or 149 individuals in the labor force. Within the labor force, individuals with bachelor's degree or higher education have the highest percentage of unemployment, with 0.8% or 17 of them being unemployed.
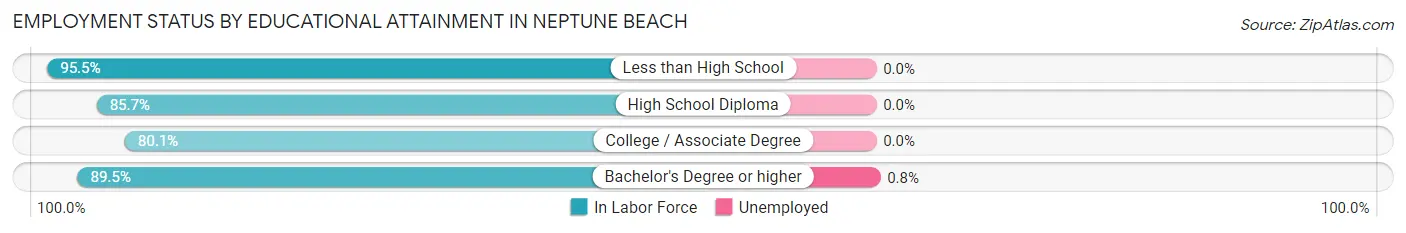
| Educational Attainment | In Labor Force | Unemployed |
| Less than High School | 149 (95.5%) | 0 (0.0%) |
| High School Diploma | 400 (85.7%) | 0 (0.0%) |
| College / Associate Degree | 736 (80.1%) | 0 (0.0%) |
| Bachelor's Degree or higher | 2,101 (89.5%) | 19 (0.8%) |
| Total | 3,387 (87.1%) | 19 (0.5%) |
Employment Occupations by Sex in Neptune Beach
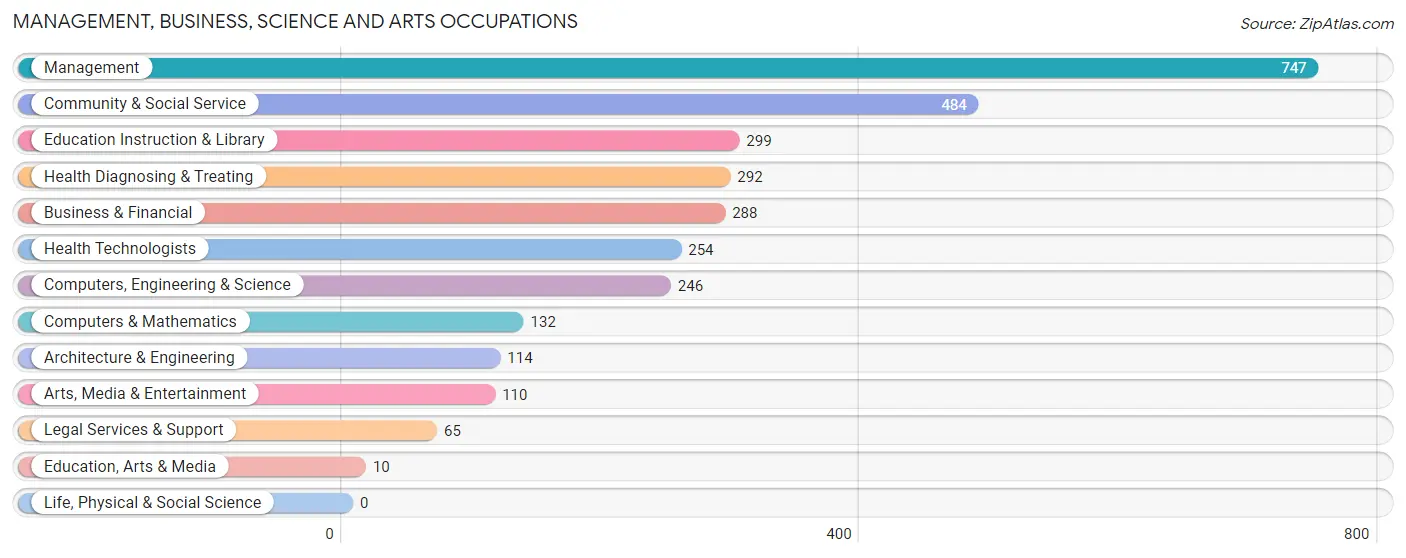
Management, Business, Science and Arts Occupations
The most common Management, Business, Science and Arts occupations in Neptune Beach are Management (747 | 17.4%), Community & Social Service (484 | 11.3%), Education Instruction & Library (299 | 7.0%), Health Diagnosing & Treating (292 | 6.8%), and Business & Financial (288 | 6.7%).
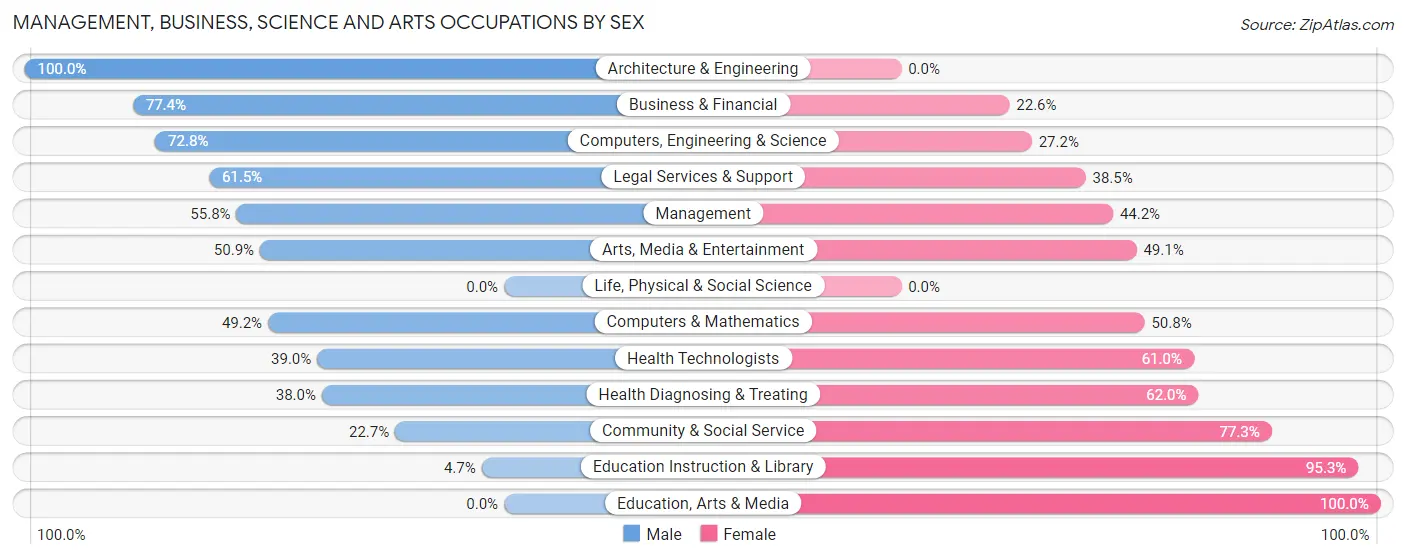
Management, Business, Science and Arts Occupations by Sex
Within the Management, Business, Science and Arts occupations in Neptune Beach, the most male-oriented occupations are Architecture & Engineering (100.0%), Business & Financial (77.4%), and Computers, Engineering & Science (72.8%), while the most female-oriented occupations are Education, Arts & Media (100.0%), Education Instruction & Library (95.3%), and Community & Social Service (77.3%).
| Occupation | Male | Female |
| Management | 417 (55.8%) | 330 (44.2%) |
| Business & Financial | 223 (77.4%) | 65 (22.6%) |
| Computers, Engineering & Science | 179 (72.8%) | 67 (27.2%) |
| Computers & Mathematics | 65 (49.2%) | 67 (50.8%) |
| Architecture & Engineering | 114 (100.0%) | 0 (0.0%) |
| Life, Physical & Social Science | 0 (0.0%) | 0 (0.0%) |
| Community & Social Service | 110 (22.7%) | 374 (77.3%) |
| Education, Arts & Media | 0 (0.0%) | 10 (100.0%) |
| Legal Services & Support | 40 (61.5%) | 25 (38.5%) |
| Education Instruction & Library | 14 (4.7%) | 285 (95.3%) |
| Arts, Media & Entertainment | 56 (50.9%) | 54 (49.1%) |
| Health Diagnosing & Treating | 111 (38.0%) | 181 (62.0%) |
| Health Technologists | 99 (39.0%) | 155 (61.0%) |
| Total (Category) | 1,040 (50.6%) | 1,017 (49.4%) |
| Total (Overall) | 2,164 (50.5%) | 2,117 (49.4%) |
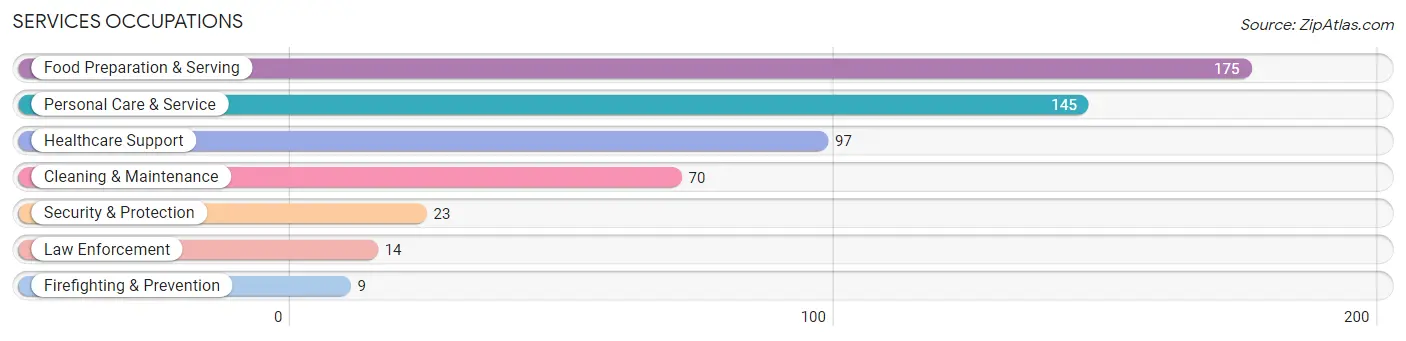
Services Occupations
The most common Services occupations in Neptune Beach are Food Preparation & Serving (175 | 4.1%), Personal Care & Service (145 | 3.4%), Healthcare Support (97 | 2.3%), Cleaning & Maintenance (70 | 1.6%), and Security & Protection (23 | 0.5%).
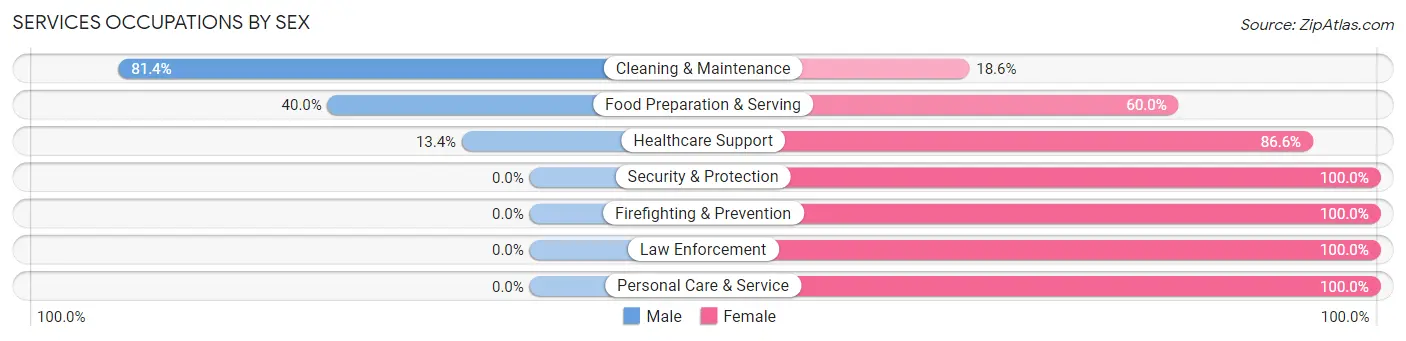
Services Occupations by Sex
Within the Services occupations in Neptune Beach, the most male-oriented occupations are Cleaning & Maintenance (81.4%), Food Preparation & Serving (40.0%), and Healthcare Support (13.4%), while the most female-oriented occupations are Security & Protection (100.0%), Firefighting & Prevention (100.0%), and Law Enforcement (100.0%).
| Occupation | Male | Female |
| Healthcare Support | 13 (13.4%) | 84 (86.6%) |
| Security & Protection | 0 (0.0%) | 23 (100.0%) |
| Firefighting & Prevention | 0 (0.0%) | 9 (100.0%) |
| Law Enforcement | 0 (0.0%) | 14 (100.0%) |
| Food Preparation & Serving | 70 (40.0%) | 105 (60.0%) |
| Cleaning & Maintenance | 57 (81.4%) | 13 (18.6%) |
| Personal Care & Service | 0 (0.0%) | 145 (100.0%) |
| Total (Category) | 140 (27.5%) | 370 (72.6%) |
| Total (Overall) | 2,164 (50.5%) | 2,117 (49.4%) |
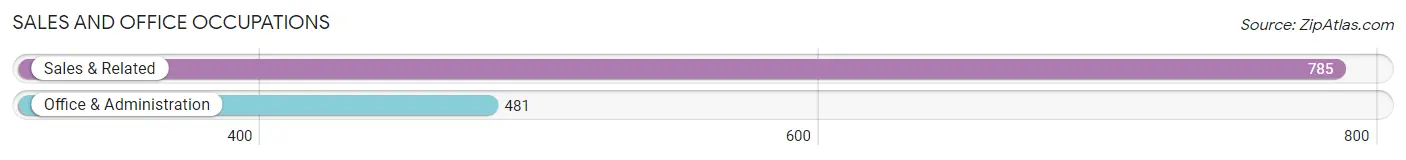
Sales and Office Occupations
The most common Sales and Office occupations in Neptune Beach are Sales & Related (785 | 18.3%), and Office & Administration (481 | 11.2%).
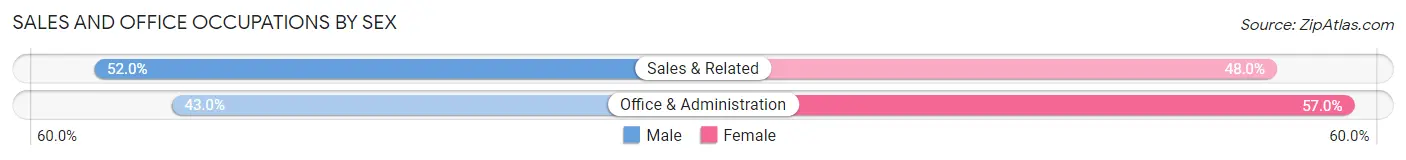
Sales and Office Occupations by Sex
| Occupation | Male | Female |
| Sales & Related | 408 (52.0%) | 377 (48.0%) |
| Office & Administration | 207 (43.0%) | 274 (57.0%) |
| Total (Category) | 615 (48.6%) | 651 (51.4%) |
| Total (Overall) | 2,164 (50.5%) | 2,117 (49.4%) |
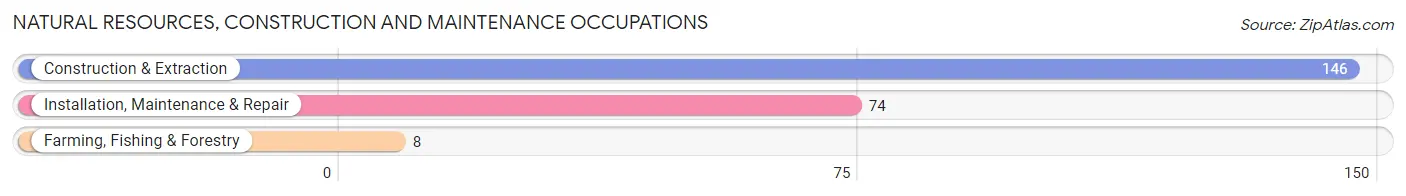
Natural Resources, Construction and Maintenance Occupations
The most common Natural Resources, Construction and Maintenance occupations in Neptune Beach are Construction & Extraction (146 | 3.4%), Installation, Maintenance & Repair (74 | 1.7%), and Farming, Fishing & Forestry (8 | 0.2%).
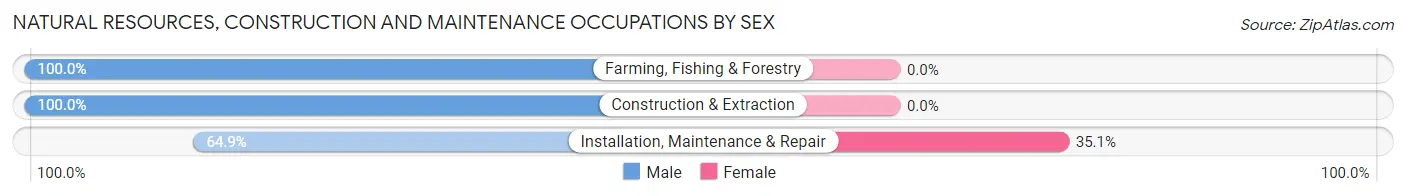
Natural Resources, Construction and Maintenance Occupations by Sex
| Occupation | Male | Female |
| Farming, Fishing & Forestry | 8 (100.0%) | 0 (0.0%) |
| Construction & Extraction | 146 (100.0%) | 0 (0.0%) |
| Installation, Maintenance & Repair | 48 (64.9%) | 26 (35.1%) |
| Total (Category) | 202 (88.6%) | 26 (11.4%) |
| Total (Overall) | 2,164 (50.5%) | 2,117 (49.4%) |
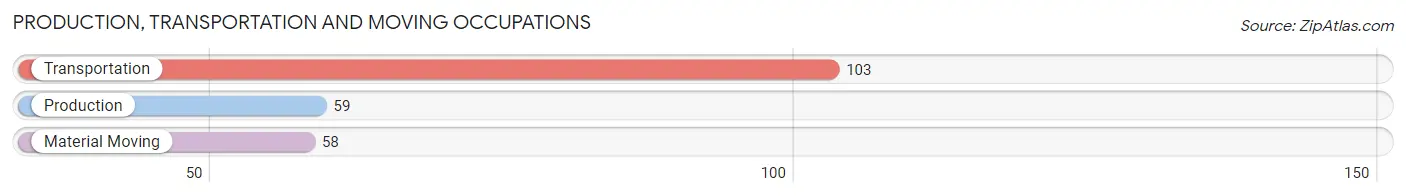
Production, Transportation and Moving Occupations
The most common Production, Transportation and Moving occupations in Neptune Beach are Transportation (103 | 2.4%), Production (59 | 1.4%), and Material Moving (58 | 1.3%).
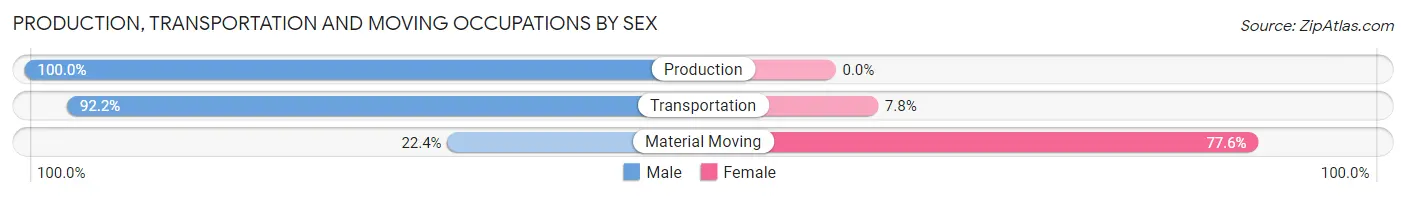
Production, Transportation and Moving Occupations by Sex
| Occupation | Male | Female |
| Production | 59 (100.0%) | 0 (0.0%) |
| Transportation | 95 (92.2%) | 8 (7.8%) |
| Material Moving | 13 (22.4%) | 45 (77.6%) |
| Total (Category) | 167 (75.9%) | 53 (24.1%) |
| Total (Overall) | 2,164 (50.5%) | 2,117 (49.4%) |
Employment Industries by Sex in Neptune Beach
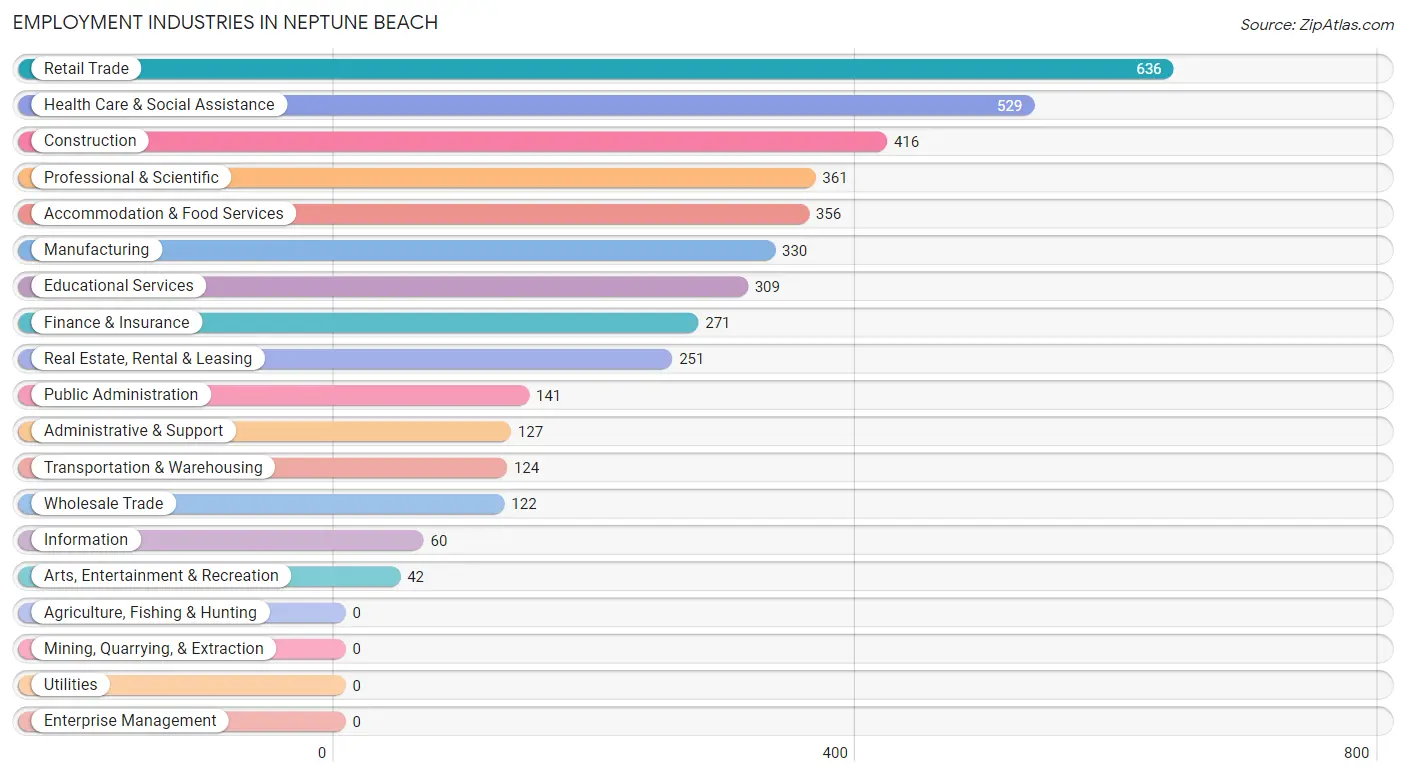
Employment Industries in Neptune Beach
The major employment industries in Neptune Beach include Retail Trade (636 | 14.9%), Health Care & Social Assistance (529 | 12.4%), Construction (416 | 9.7%), Professional & Scientific (361 | 8.4%), and Accommodation & Food Services (356 | 8.3%).
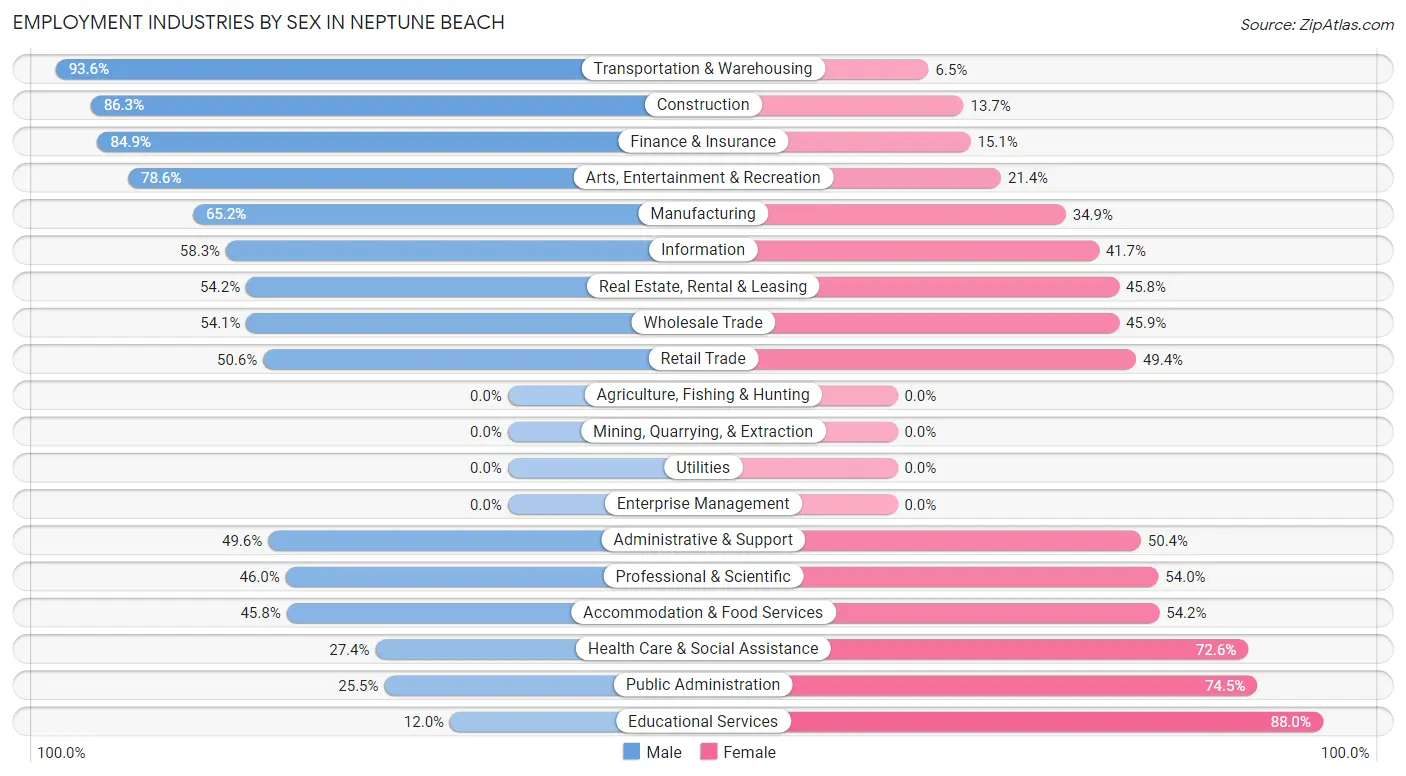
Employment Industries by Sex in Neptune Beach
The Neptune Beach industries that see more men than women are Transportation & Warehousing (93.5%), Construction (86.3%), and Finance & Insurance (84.9%), whereas the industries that tend to have a higher number of women are Educational Services (88.0%), Public Administration (74.5%), and Health Care & Social Assistance (72.6%).
| Industry | Male | Female |
| Agriculture, Fishing & Hunting | 0 (0.0%) | 0 (0.0%) |
| Mining, Quarrying, & Extraction | 0 (0.0%) | 0 (0.0%) |
| Construction | 359 (86.3%) | 57 (13.7%) |
| Manufacturing | 215 (65.1%) | 115 (34.8%) |
| Wholesale Trade | 66 (54.1%) | 56 (45.9%) |
| Retail Trade | 322 (50.6%) | 314 (49.4%) |
| Transportation & Warehousing | 116 (93.5%) | 8 (6.5%) |
| Utilities | 0 (0.0%) | 0 (0.0%) |
| Information | 35 (58.3%) | 25 (41.7%) |
| Finance & Insurance | 230 (84.9%) | 41 (15.1%) |
| Real Estate, Rental & Leasing | 136 (54.2%) | 115 (45.8%) |
| Professional & Scientific | 166 (46.0%) | 195 (54.0%) |
| Enterprise Management | 0 (0.0%) | 0 (0.0%) |
| Administrative & Support | 63 (49.6%) | 64 (50.4%) |
| Educational Services | 37 (12.0%) | 272 (88.0%) |
| Health Care & Social Assistance | 145 (27.4%) | 384 (72.6%) |
| Arts, Entertainment & Recreation | 33 (78.6%) | 9 (21.4%) |
| Accommodation & Food Services | 163 (45.8%) | 193 (54.2%) |
| Public Administration | 36 (25.5%) | 105 (74.5%) |
| Total | 2,164 (50.5%) | 2,117 (49.4%) |
Education in Neptune Beach
School Enrollment in Neptune Beach
The most common levels of schooling among the 1,250 students in Neptune Beach are college / undergraduate (327 | 26.2%), middle school (258 | 20.6%), and elementary school (243 | 19.4%).
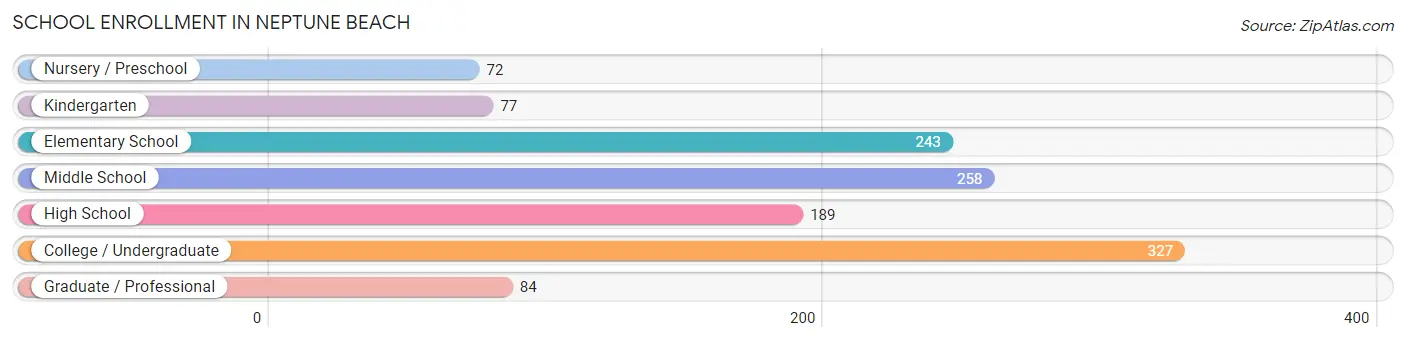
| School Level | # Students | % Students |
| Nursery / Preschool | 72 | 5.8% |
| Kindergarten | 77 | 6.2% |
| Elementary School | 243 | 19.4% |
| Middle School | 258 | 20.6% |
| High School | 189 | 15.1% |
| College / Undergraduate | 327 | 26.2% |
| Graduate / Professional | 84 | 6.7% |
| Total | 1,250 | 100.0% |
School Enrollment by Age by Funding Source in Neptune Beach
Out of a total of 1,250 students who are enrolled in schools in Neptune Beach, 144 (11.5%) attend a private institution, while the remaining 1,106 (88.5%) are enrolled in public schools. The age group of 25 to 34 year olds has the highest likelihood of being enrolled in private schools, with 46 (45.5% in the age bracket) enrolled. Conversely, the age group of 15 to 17 year olds has the lowest likelihood of being enrolled in a private school, with 173 (100.0% in the age bracket) attending a public institution.
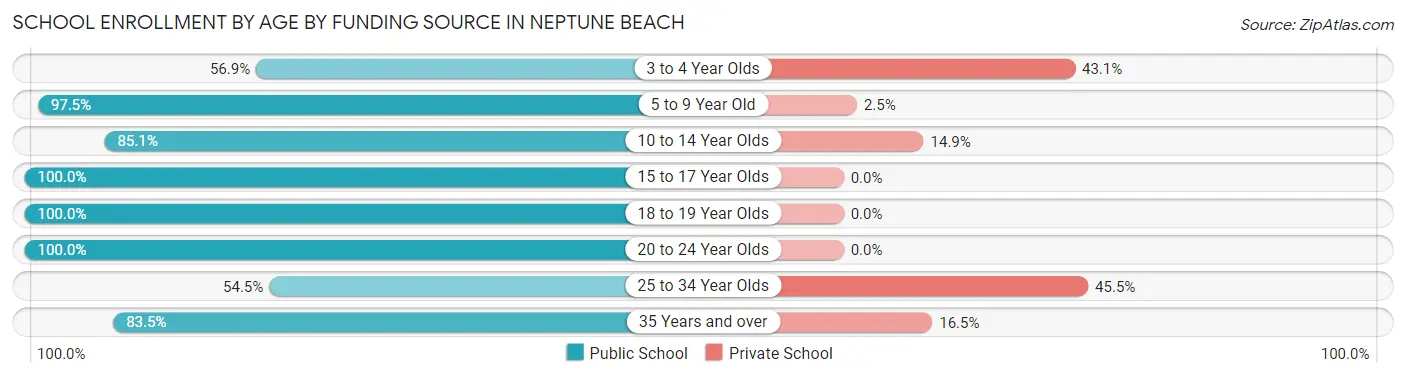
| Age Bracket | Public School | Private School |
| 3 to 4 Year Olds | 33 (56.9%) | 25 (43.1%) |
| 5 to 9 Year Old | 236 (97.5%) | 6 (2.5%) |
| 10 to 14 Year Olds | 280 (85.1%) | 49 (14.9%) |
| 15 to 17 Year Olds | 173 (100.0%) | 0 (0.0%) |
| 18 to 19 Year Olds | 47 (100.0%) | 0 (0.0%) |
| 20 to 24 Year Olds | 191 (100.0%) | 0 (0.0%) |
| 25 to 34 Year Olds | 55 (54.5%) | 46 (45.5%) |
| 35 Years and over | 91 (83.5%) | 18 (16.5%) |
| Total | 1,106 (88.5%) | 144 (11.5%) |
Educational Attainment by Field of Study in Neptune Beach
Business (949 | 28.7%), education (397 | 12.0%), science & technology (286 | 8.6%), arts & humanities (282 | 8.5%), and bio, nature & agricultural (210 | 6.4%) are the most common fields of study among 3,309 individuals in Neptune Beach who have obtained a bachelor's degree or higher.
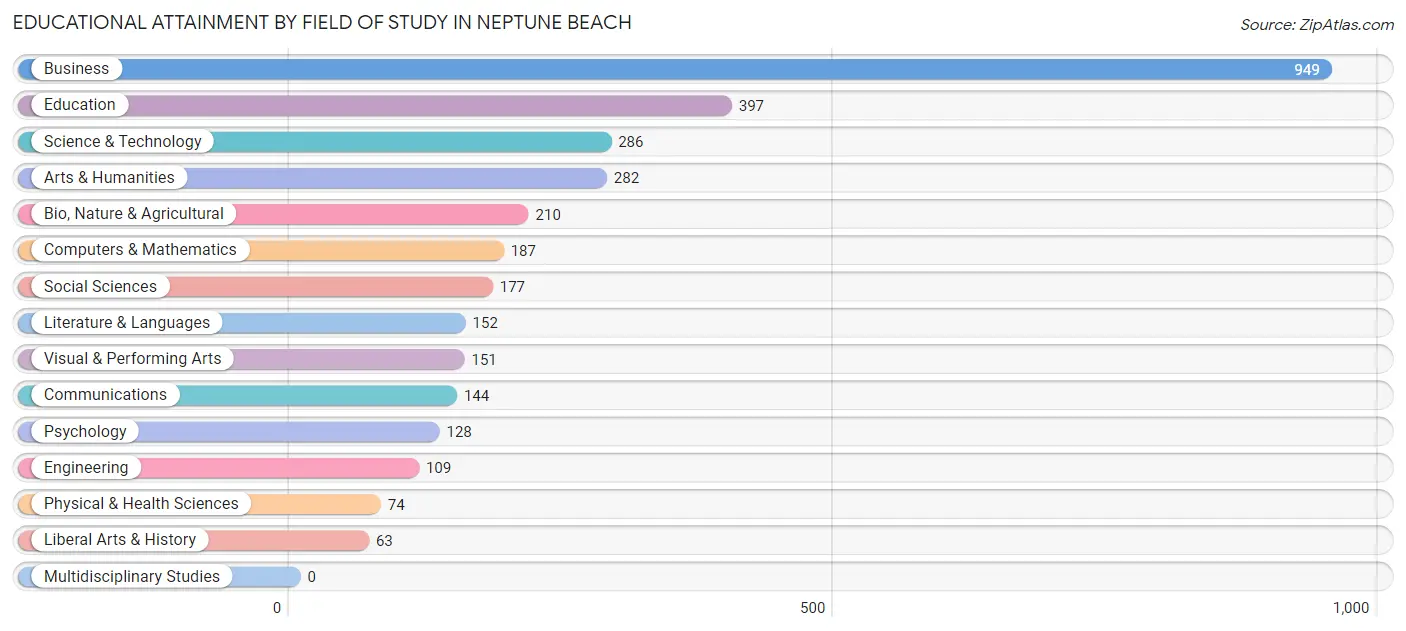
| Field of Study | # Graduates | % Graduates |
| Computers & Mathematics | 187 | 5.7% |
| Bio, Nature & Agricultural | 210 | 6.4% |
| Physical & Health Sciences | 74 | 2.2% |
| Psychology | 128 | 3.9% |
| Social Sciences | 177 | 5.3% |
| Engineering | 109 | 3.3% |
| Multidisciplinary Studies | 0 | 0.0% |
| Science & Technology | 286 | 8.6% |
| Business | 949 | 28.7% |
| Education | 397 | 12.0% |
| Literature & Languages | 152 | 4.6% |
| Liberal Arts & History | 63 | 1.9% |
| Visual & Performing Arts | 151 | 4.6% |
| Communications | 144 | 4.3% |
| Arts & Humanities | 282 | 8.5% |
| Total | 3,309 | 100.0% |
Transportation & Commute in Neptune Beach
Vehicle Availability by Sex in Neptune Beach
The most prevalent vehicle ownership categories in Neptune Beach are males with 2 vehicles (1,270, accounting for 58.9%) and females with 2 vehicles (1,176, making up 60.9%).
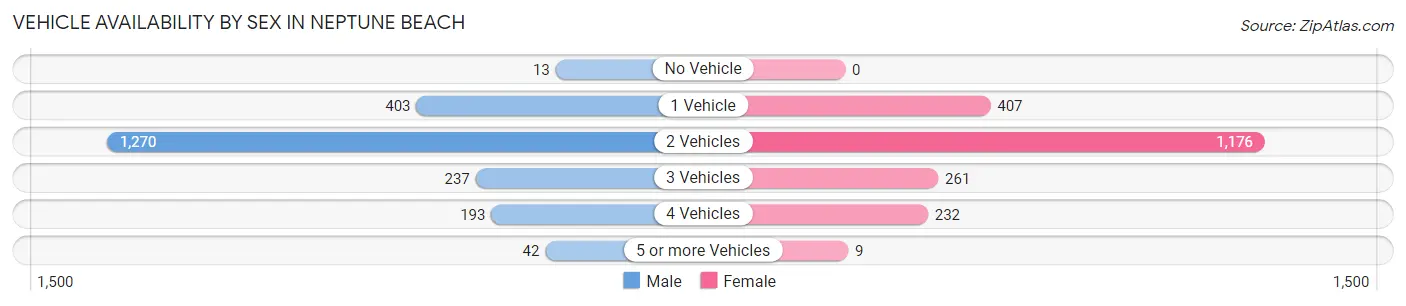
| Vehicles Available | Male | Female |
| No Vehicle | 13 (0.6%) | 0 (0.0%) |
| 1 Vehicle | 403 (18.7%) | 407 (19.5%) |
| 2 Vehicles | 1,270 (58.9%) | 1,176 (56.4%) |
| 3 Vehicles | 237 (11.0%) | 261 (12.5%) |
| 4 Vehicles | 193 (8.9%) | 232 (11.1%) |
| 5 or more Vehicles | 42 (1.9%) | 9 (0.4%) |
| Total | 2,158 (100.0%) | 2,085 (100.0%) |
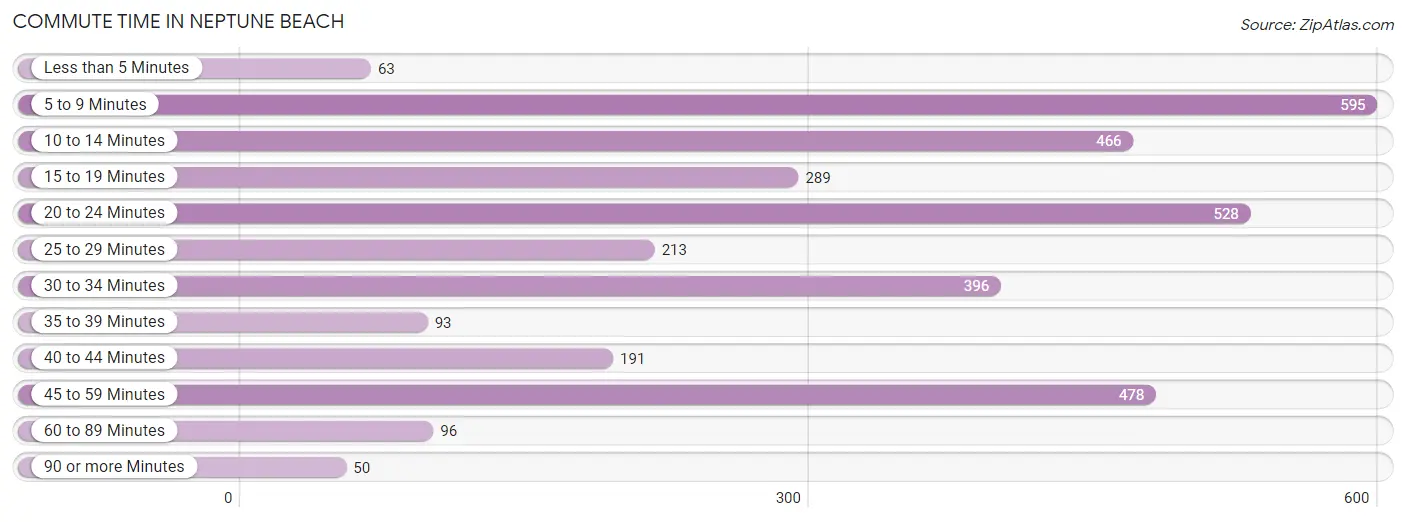
Commute Time in Neptune Beach
The most frequently occuring commute durations in Neptune Beach are 5 to 9 minutes (595 commuters, 17.2%), 20 to 24 minutes (528 commuters, 15.3%), and 45 to 59 minutes (478 commuters, 13.8%).
| Commute Time | # Commuters | % Commuters |
| Less than 5 Minutes | 63 | 1.8% |
| 5 to 9 Minutes | 595 | 17.2% |
| 10 to 14 Minutes | 466 | 13.5% |
| 15 to 19 Minutes | 289 | 8.4% |
| 20 to 24 Minutes | 528 | 15.3% |
| 25 to 29 Minutes | 213 | 6.2% |
| 30 to 34 Minutes | 396 | 11.5% |
| 35 to 39 Minutes | 93 | 2.7% |
| 40 to 44 Minutes | 191 | 5.5% |
| 45 to 59 Minutes | 478 | 13.8% |
| 60 to 89 Minutes | 96 | 2.8% |
| 90 or more Minutes | 50 | 1.5% |
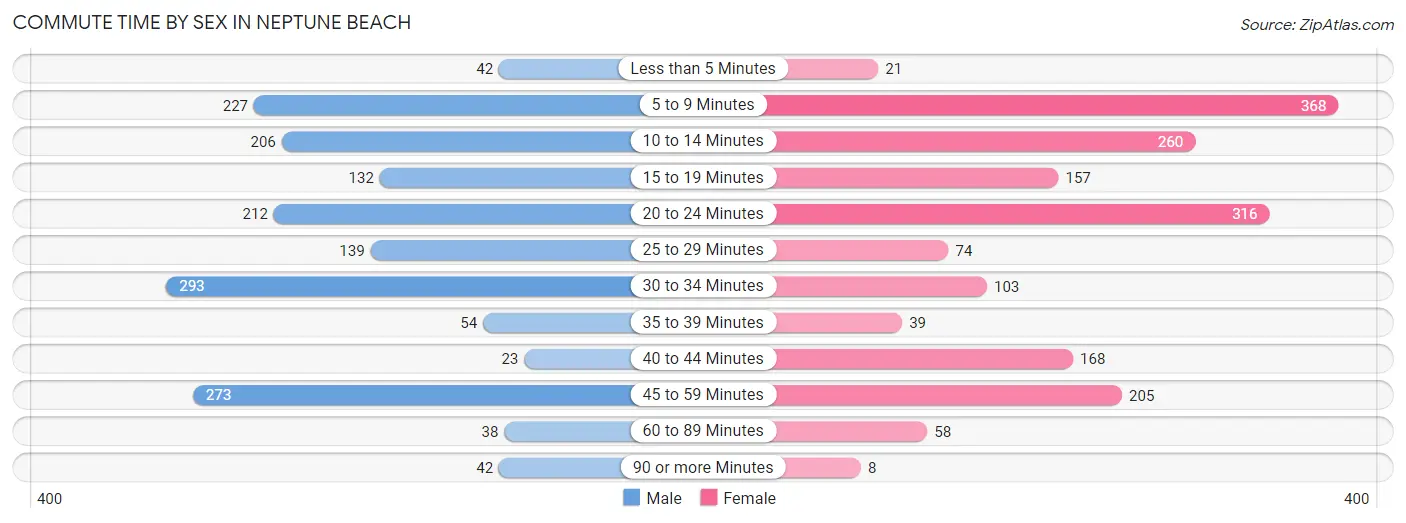
Commute Time by Sex in Neptune Beach
The most common commute times in Neptune Beach are 30 to 34 minutes (293 commuters, 17.4%) for males and 5 to 9 minutes (368 commuters, 20.7%) for females.
| Commute Time | Male | Female |
| Less than 5 Minutes | 42 (2.5%) | 21 (1.2%) |
| 5 to 9 Minutes | 227 (13.5%) | 368 (20.7%) |
| 10 to 14 Minutes | 206 (12.2%) | 260 (14.6%) |
| 15 to 19 Minutes | 132 (7.9%) | 157 (8.8%) |
| 20 to 24 Minutes | 212 (12.6%) | 316 (17.8%) |
| 25 to 29 Minutes | 139 (8.3%) | 74 (4.2%) |
| 30 to 34 Minutes | 293 (17.4%) | 103 (5.8%) |
| 35 to 39 Minutes | 54 (3.2%) | 39 (2.2%) |
| 40 to 44 Minutes | 23 (1.4%) | 168 (9.5%) |
| 45 to 59 Minutes | 273 (16.2%) | 205 (11.5%) |
| 60 to 89 Minutes | 38 (2.3%) | 58 (3.3%) |
| 90 or more Minutes | 42 (2.5%) | 8 (0.4%) |
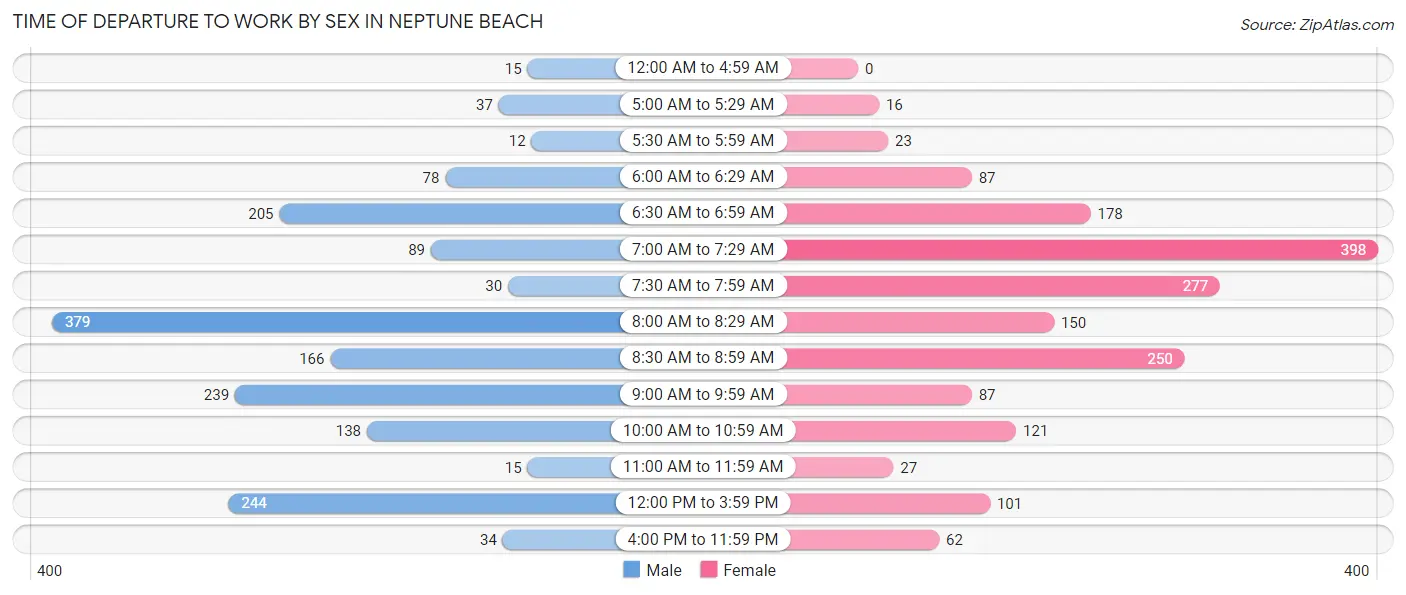
Time of Departure to Work by Sex in Neptune Beach
The most frequent times of departure to work in Neptune Beach are 8:00 AM to 8:29 AM (379, 22.6%) for males and 7:00 AM to 7:29 AM (398, 22.4%) for females.
| Time of Departure | Male | Female |
| 12:00 AM to 4:59 AM | 15 (0.9%) | 0 (0.0%) |
| 5:00 AM to 5:29 AM | 37 (2.2%) | 16 (0.9%) |
| 5:30 AM to 5:59 AM | 12 (0.7%) | 23 (1.3%) |
| 6:00 AM to 6:29 AM | 78 (4.6%) | 87 (4.9%) |
| 6:30 AM to 6:59 AM | 205 (12.2%) | 178 (10.0%) |
| 7:00 AM to 7:29 AM | 89 (5.3%) | 398 (22.4%) |
| 7:30 AM to 7:59 AM | 30 (1.8%) | 277 (15.6%) |
| 8:00 AM to 8:29 AM | 379 (22.6%) | 150 (8.4%) |
| 8:30 AM to 8:59 AM | 166 (9.9%) | 250 (14.1%) |
| 9:00 AM to 9:59 AM | 239 (14.2%) | 87 (4.9%) |
| 10:00 AM to 10:59 AM | 138 (8.2%) | 121 (6.8%) |
| 11:00 AM to 11:59 AM | 15 (0.9%) | 27 (1.5%) |
| 12:00 PM to 3:59 PM | 244 (14.5%) | 101 (5.7%) |
| 4:00 PM to 11:59 PM | 34 (2.0%) | 62 (3.5%) |
| Total | 1,681 (100.0%) | 1,777 (100.0%) |
Housing Occupancy in Neptune Beach
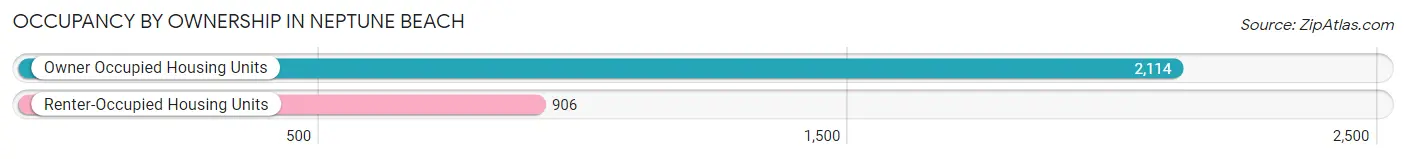
Occupancy by Ownership in Neptune Beach
Of the total 3,020 dwellings in Neptune Beach, owner-occupied units account for 2,114 (70.0%), while renter-occupied units make up 906 (30.0%).
| Occupancy | # Housing Units | % Housing Units |
| Owner Occupied Housing Units | 2,114 | 70.0% |
| Renter-Occupied Housing Units | 906 | 30.0% |
| Total Occupied Housing Units | 3,020 | 100.0% |
Occupancy by Household Size in Neptune Beach
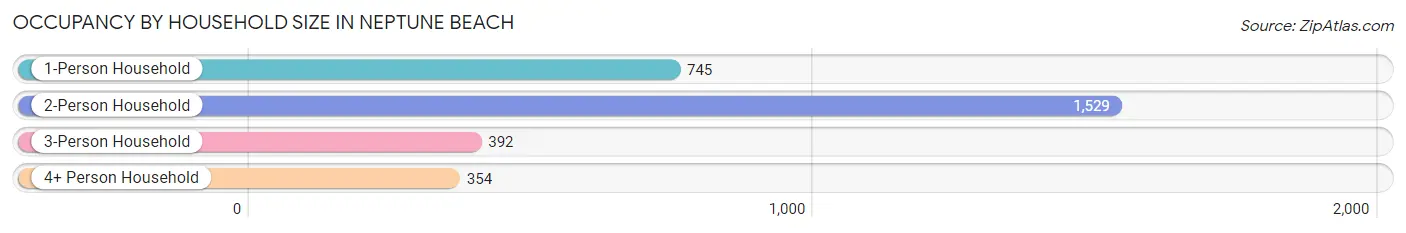
| Household Size | # Housing Units | % Housing Units |
| 1-Person Household | 745 | 24.7% |
| 2-Person Household | 1,529 | 50.6% |
| 3-Person Household | 392 | 13.0% |
| 4+ Person Household | 354 | 11.7% |
| Total Housing Units | 3,020 | 100.0% |
Occupancy by Ownership by Household Size in Neptune Beach
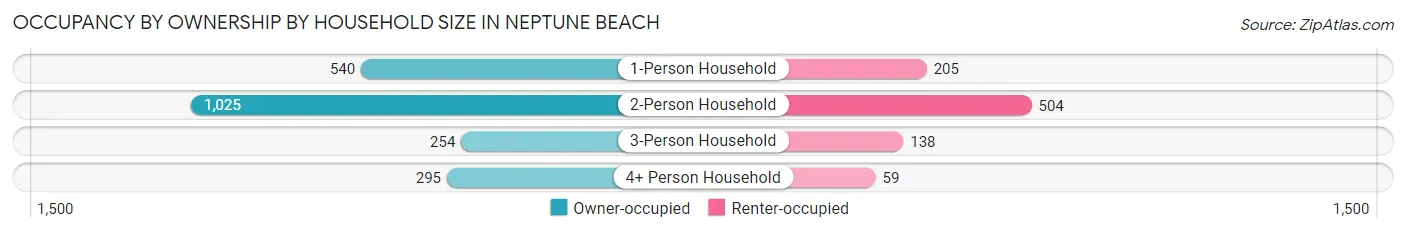
| Household Size | Owner-occupied | Renter-occupied |
| 1-Person Household | 540 (72.5%) | 205 (27.5%) |
| 2-Person Household | 1,025 (67.0%) | 504 (33.0%) |
| 3-Person Household | 254 (64.8%) | 138 (35.2%) |
| 4+ Person Household | 295 (83.3%) | 59 (16.7%) |
| Total Housing Units | 2,114 (70.0%) | 906 (30.0%) |
Occupancy by Educational Attainment in Neptune Beach
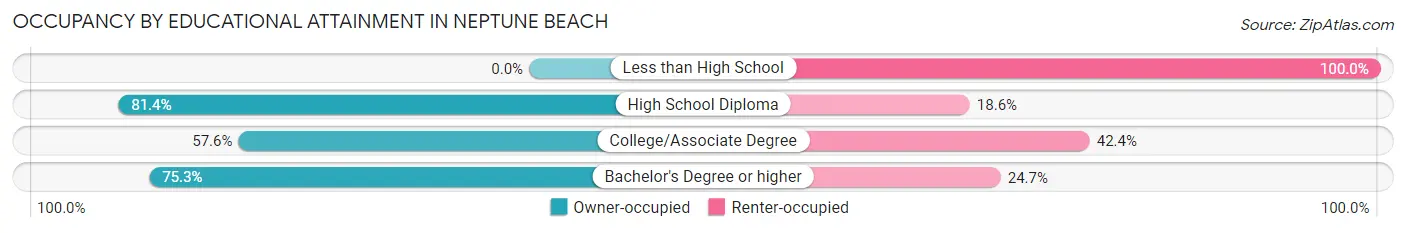
| Household Size | Owner-occupied | Renter-occupied |
| Less than High School | 0 (0.0%) | 62 (100.0%) |
| High School Diploma | 263 (81.4%) | 60 (18.6%) |
| College/Associate Degree | 434 (57.6%) | 319 (42.4%) |
| Bachelor's Degree or higher | 1,417 (75.3%) | 465 (24.7%) |
Occupancy by Age of Householder in Neptune Beach
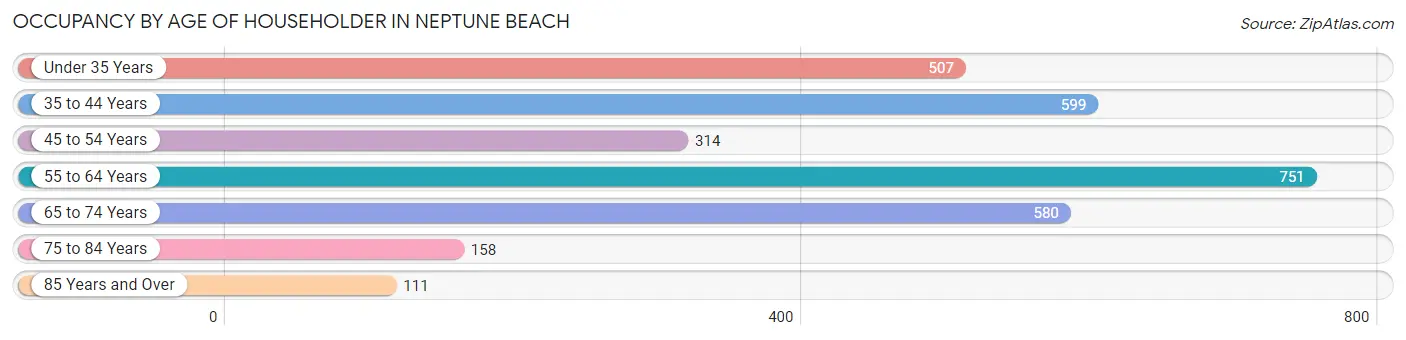
| Age Bracket | # Households | % Households |
| Under 35 Years | 507 | 16.8% |
| 35 to 44 Years | 599 | 19.8% |
| 45 to 54 Years | 314 | 10.4% |
| 55 to 64 Years | 751 | 24.9% |
| 65 to 74 Years | 580 | 19.2% |
| 75 to 84 Years | 158 | 5.2% |
| 85 Years and Over | 111 | 3.7% |
| Total | 3,020 | 100.0% |
Housing Finances in Neptune Beach
Median Income by Occupancy in Neptune Beach
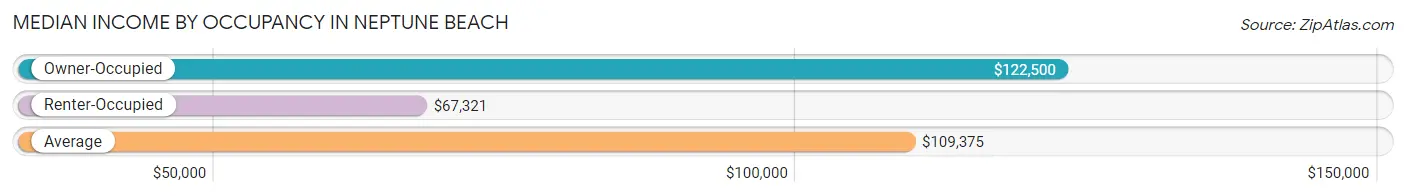
| Occupancy Type | # Households | Median Income |
| Owner-Occupied | 2,114 (70.0%) | $122,500 |
| Renter-Occupied | 906 (30.0%) | $67,321 |
| Average | 3,020 (100.0%) | $109,375 |
Occupancy by Householder Income Bracket in Neptune Beach
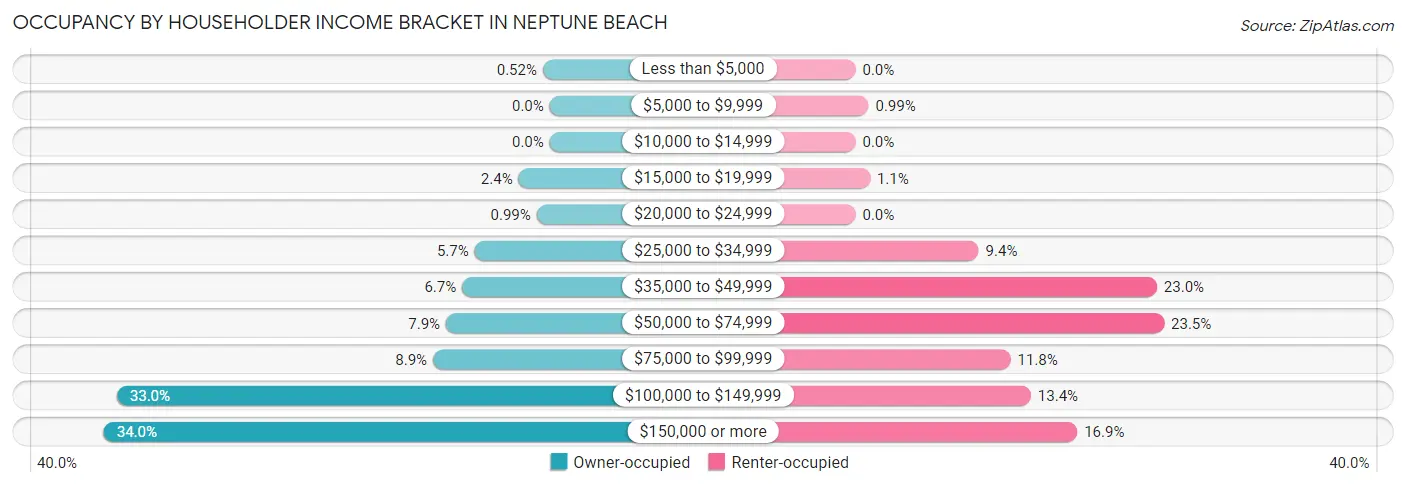
| Income Bracket | Owner-occupied | Renter-occupied |
| Less than $5,000 | 11 (0.5%) | 0 (0.0%) |
| $5,000 to $9,999 | 0 (0.0%) | 9 (1.0%) |
| $10,000 to $14,999 | 0 (0.0%) | 0 (0.0%) |
| $15,000 to $19,999 | 50 (2.4%) | 10 (1.1%) |
| $20,000 to $24,999 | 21 (1.0%) | 0 (0.0%) |
| $25,000 to $34,999 | 121 (5.7%) | 85 (9.4%) |
| $35,000 to $49,999 | 141 (6.7%) | 208 (23.0%) |
| $50,000 to $74,999 | 167 (7.9%) | 213 (23.5%) |
| $75,000 to $99,999 | 188 (8.9%) | 107 (11.8%) |
| $100,000 to $149,999 | 697 (33.0%) | 121 (13.4%) |
| $150,000 or more | 718 (34.0%) | 153 (16.9%) |
| Total | 2,114 (100.0%) | 906 (100.0%) |
Monthly Housing Cost Tiers in Neptune Beach
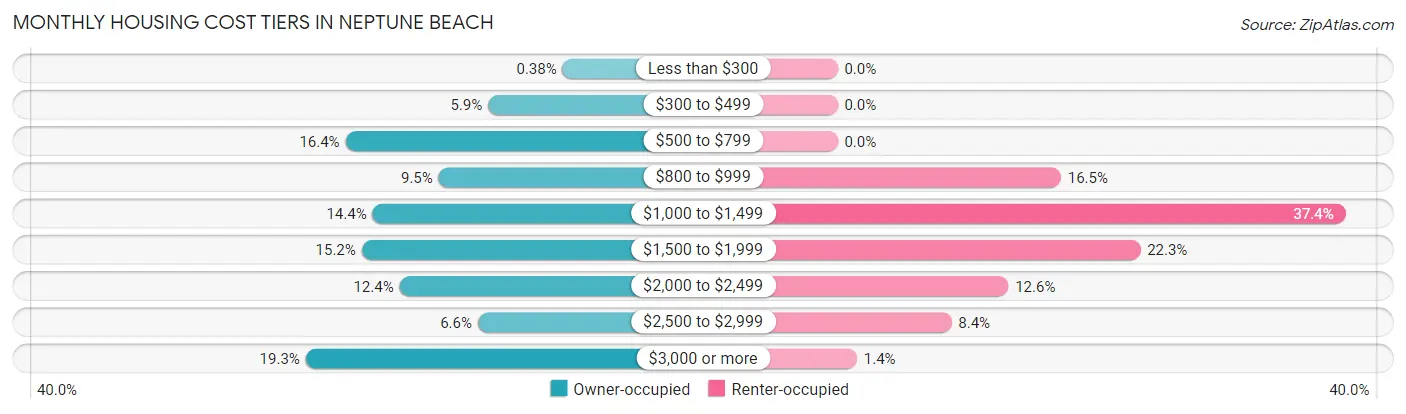
| Monthly Cost | Owner-occupied | Renter-occupied |
| Less than $300 | 8 (0.4%) | 0 (0.0%) |
| $300 to $499 | 124 (5.9%) | 0 (0.0%) |
| $500 to $799 | 346 (16.4%) | 0 (0.0%) |
| $800 to $999 | 201 (9.5%) | 149 (16.5%) |
| $1,000 to $1,499 | 304 (14.4%) | 339 (37.4%) |
| $1,500 to $1,999 | 321 (15.2%) | 202 (22.3%) |
| $2,000 to $2,499 | 262 (12.4%) | 114 (12.6%) |
| $2,500 to $2,999 | 140 (6.6%) | 76 (8.4%) |
| $3,000 or more | 408 (19.3%) | 13 (1.4%) |
| Total | 2,114 (100.0%) | 906 (100.0%) |
Physical Housing Characteristics in Neptune Beach
Housing Structures in Neptune Beach
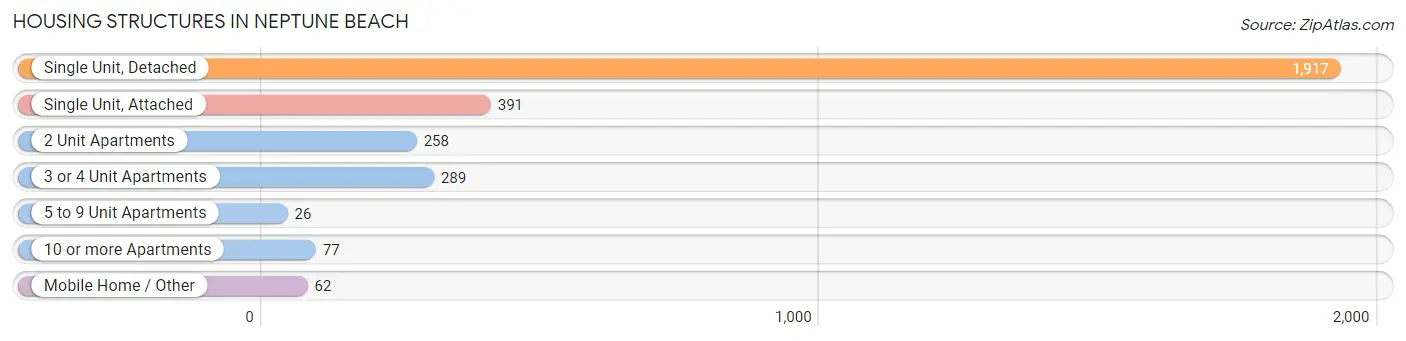
| Structure Type | # Housing Units | % Housing Units |
| Single Unit, Detached | 1,917 | 63.5% |
| Single Unit, Attached | 391 | 13.0% |
| 2 Unit Apartments | 258 | 8.5% |
| 3 or 4 Unit Apartments | 289 | 9.6% |
| 5 to 9 Unit Apartments | 26 | 0.9% |
| 10 or more Apartments | 77 | 2.5% |
| Mobile Home / Other | 62 | 2.1% |
| Total | 3,020 | 100.0% |
Housing Structures by Occupancy in Neptune Beach
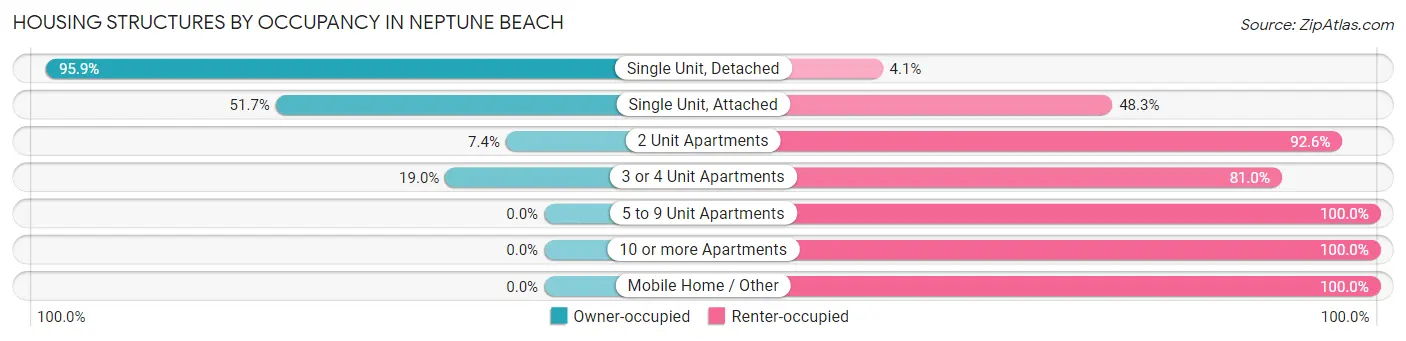
| Structure Type | Owner-occupied | Renter-occupied |
| Single Unit, Detached | 1,838 (95.9%) | 79 (4.1%) |
| Single Unit, Attached | 202 (51.7%) | 189 (48.3%) |
| 2 Unit Apartments | 19 (7.4%) | 239 (92.6%) |
| 3 or 4 Unit Apartments | 55 (19.0%) | 234 (81.0%) |
| 5 to 9 Unit Apartments | 0 (0.0%) | 26 (100.0%) |
| 10 or more Apartments | 0 (0.0%) | 77 (100.0%) |
| Mobile Home / Other | 0 (0.0%) | 62 (100.0%) |
| Total | 2,114 (70.0%) | 906 (30.0%) |
Housing Structures by Number of Rooms in Neptune Beach
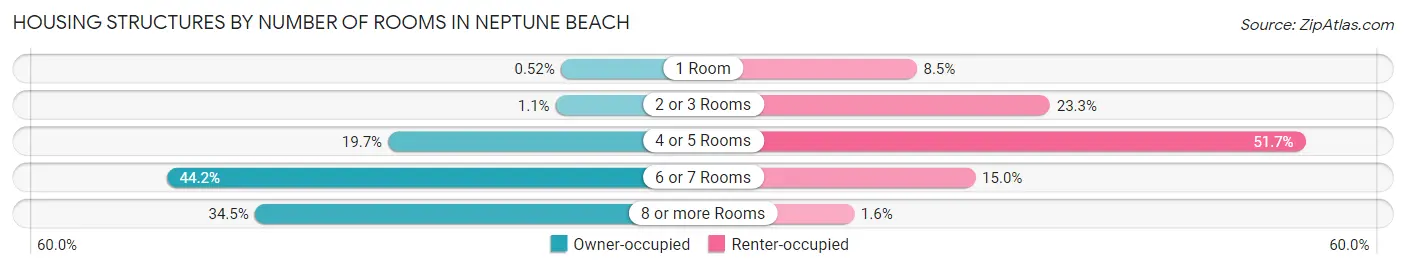
| Number of Rooms | Owner-occupied | Renter-occupied |
| 1 Room | 11 (0.5%) | 77 (8.5%) |
| 2 or 3 Rooms | 23 (1.1%) | 211 (23.3%) |
| 4 or 5 Rooms | 416 (19.7%) | 468 (51.7%) |
| 6 or 7 Rooms | 935 (44.2%) | 136 (15.0%) |
| 8 or more Rooms | 729 (34.5%) | 14 (1.5%) |
| Total | 2,114 (100.0%) | 906 (100.0%) |
Housing Structure by Heating Type in Neptune Beach
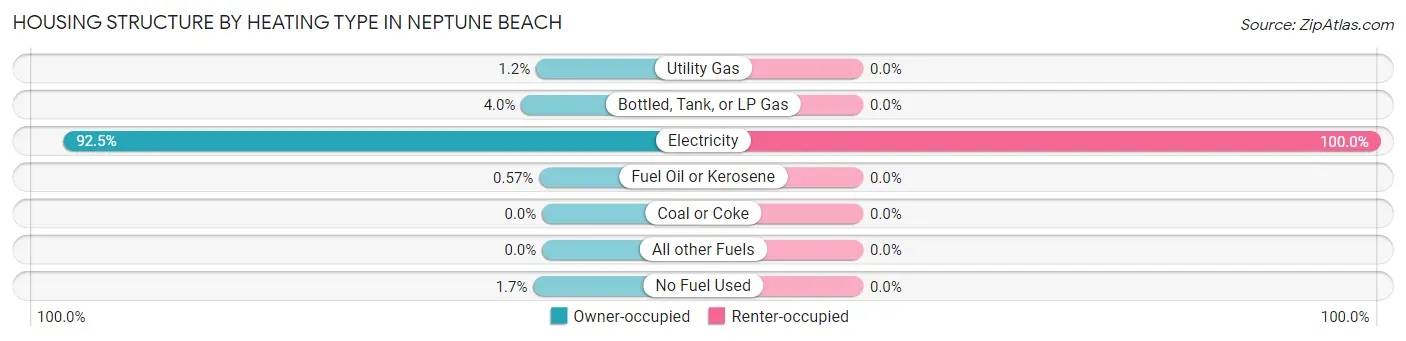
| Heating Type | Owner-occupied | Renter-occupied |
| Utility Gas | 25 (1.2%) | 0 (0.0%) |
| Bottled, Tank, or LP Gas | 85 (4.0%) | 0 (0.0%) |
| Electricity | 1,956 (92.5%) | 906 (100.0%) |
| Fuel Oil or Kerosene | 12 (0.6%) | 0 (0.0%) |
| Coal or Coke | 0 (0.0%) | 0 (0.0%) |
| All other Fuels | 0 (0.0%) | 0 (0.0%) |
| No Fuel Used | 36 (1.7%) | 0 (0.0%) |
| Total | 2,114 (100.0%) | 906 (100.0%) |
Household Vehicle Usage in Neptune Beach
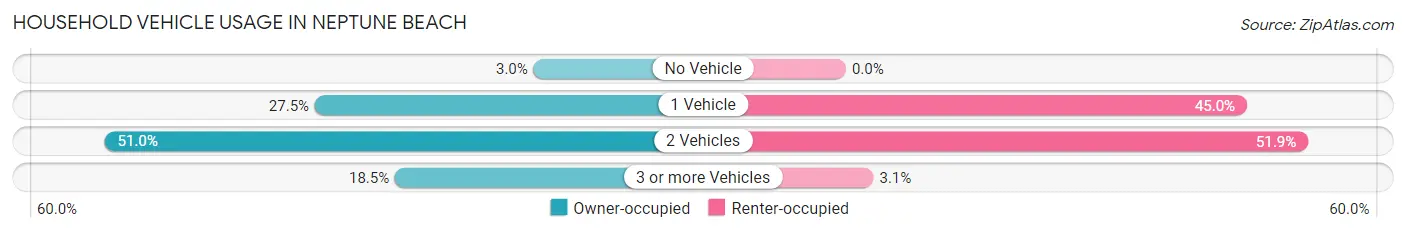
| Vehicles per Household | Owner-occupied | Renter-occupied |
| No Vehicle | 63 (3.0%) | 0 (0.0%) |
| 1 Vehicle | 581 (27.5%) | 408 (45.0%) |
| 2 Vehicles | 1,079 (51.0%) | 470 (51.9%) |
| 3 or more Vehicles | 391 (18.5%) | 28 (3.1%) |
| Total | 2,114 (100.0%) | 906 (100.0%) |
Real Estate & Mortgages in Neptune Beach
Real Estate and Mortgage Overview in Neptune Beach
| Characteristic | Without Mortgage | With Mortgage |
| Housing Units | 845 | 1,269 |
| Median Property Value | $568,900 | $553,800 |
| Median Household Income | $108,620 | $492 |
| Monthly Housing Costs | $776 | $389 |
| Real Estate Taxes | $3,322 | $0 |
Property Value by Mortgage Status in Neptune Beach
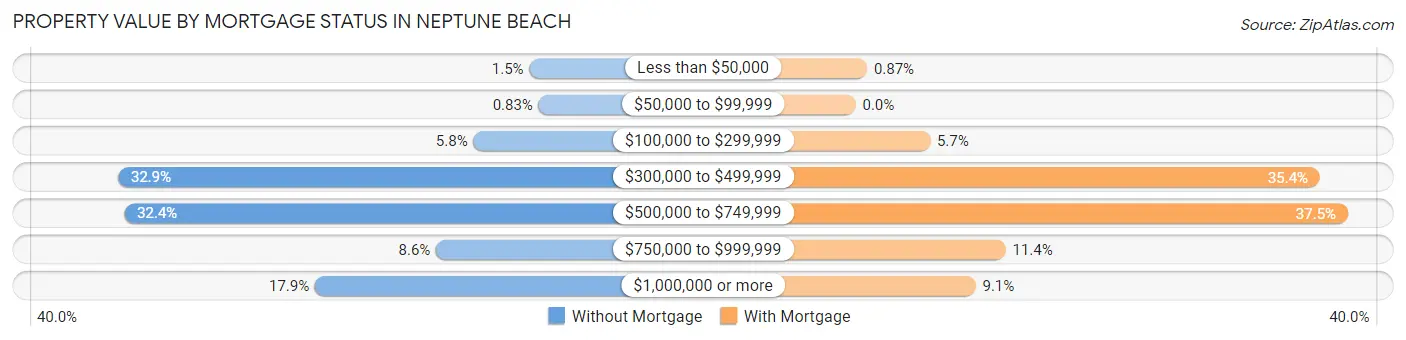
| Property Value | Without Mortgage | With Mortgage |
| Less than $50,000 | 13 (1.5%) | 11 (0.9%) |
| $50,000 to $99,999 | 7 (0.8%) | 0 (0.0%) |
| $100,000 to $299,999 | 49 (5.8%) | 72 (5.7%) |
| $300,000 to $499,999 | 278 (32.9%) | 449 (35.4%) |
| $500,000 to $749,999 | 274 (32.4%) | 476 (37.5%) |
| $750,000 to $999,999 | 73 (8.6%) | 145 (11.4%) |
| $1,000,000 or more | 151 (17.9%) | 116 (9.1%) |
| Total | 845 (100.0%) | 1,269 (100.0%) |
Household Income by Mortgage Status in Neptune Beach
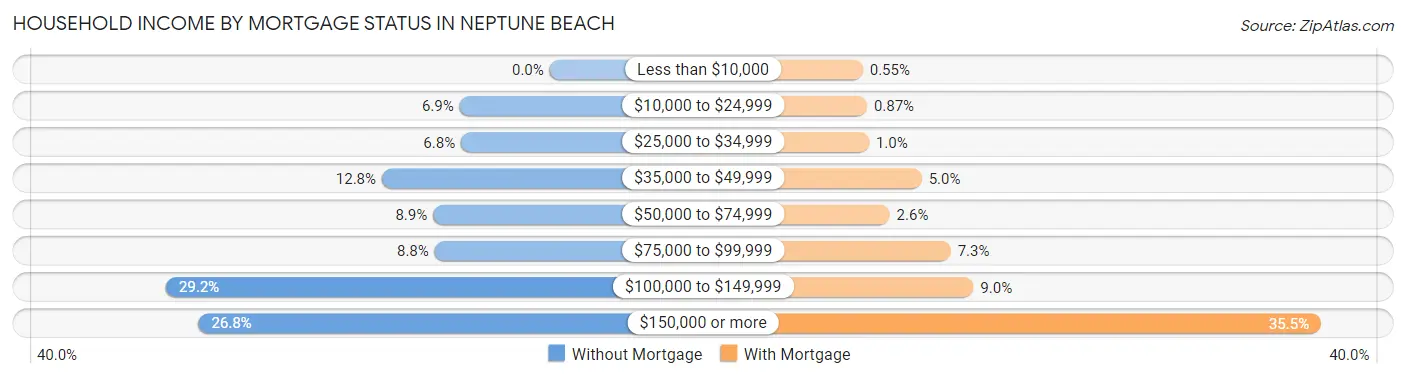
| Household Income | Without Mortgage | With Mortgage |
| Less than $10,000 | 0 (0.0%) | 7 (0.5%) |
| $10,000 to $24,999 | 58 (6.9%) | 11 (0.9%) |
| $25,000 to $34,999 | 57 (6.8%) | 13 (1.0%) |
| $35,000 to $49,999 | 108 (12.8%) | 64 (5.0%) |
| $50,000 to $74,999 | 75 (8.9%) | 33 (2.6%) |
| $75,000 to $99,999 | 74 (8.8%) | 92 (7.2%) |
| $100,000 to $149,999 | 247 (29.2%) | 114 (9.0%) |
| $150,000 or more | 226 (26.8%) | 450 (35.5%) |
| Total | 845 (100.0%) | 1,269 (100.0%) |
Property Value to Household Income Ratio in Neptune Beach
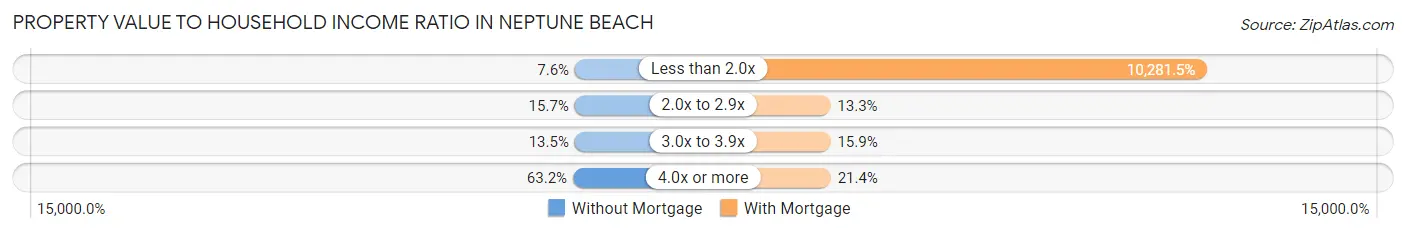
| Value-to-Income Ratio | Without Mortgage | With Mortgage |
| Less than 2.0x | 64 (7.6%) | 130,472 (10,281.5%) |
| 2.0x to 2.9x | 133 (15.7%) | 169 (13.3%) |
| 3.0x to 3.9x | 114 (13.5%) | 202 (15.9%) |
| 4.0x or more | 534 (63.2%) | 272 (21.4%) |
| Total | 845 (100.0%) | 1,269 (100.0%) |
Real Estate Taxes by Mortgage Status in Neptune Beach
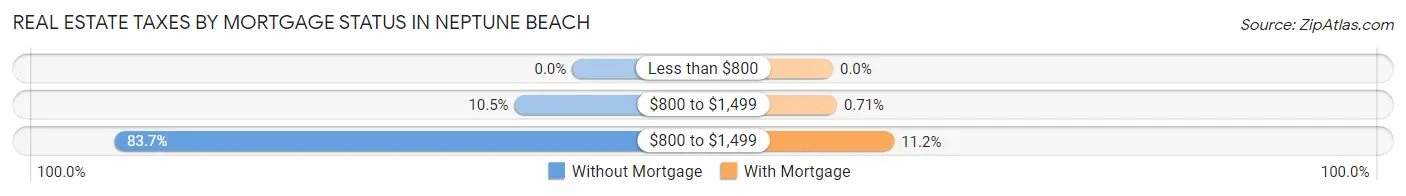
| Property Taxes | Without Mortgage | With Mortgage |
| Less than $800 | 0 (0.0%) | 0 (0.0%) |
| $800 to $1,499 | 89 (10.5%) | 9 (0.7%) |
| $800 to $1,499 | 707 (83.7%) | 142 (11.2%) |
| Total | 845 (100.0%) | 1,269 (100.0%) |
Health & Disability in Neptune Beach
Health Insurance Coverage by Age in Neptune Beach
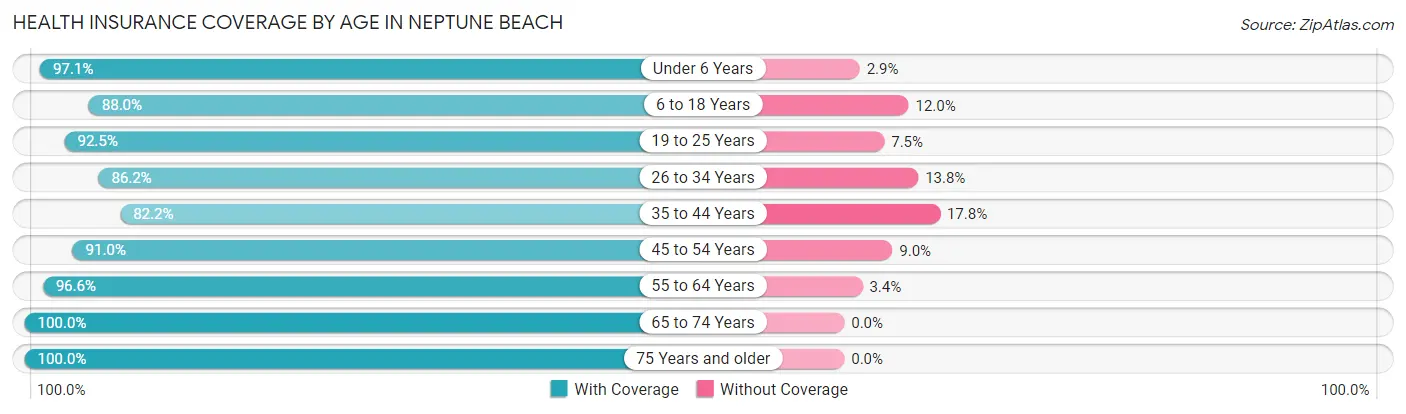
| Age Bracket | With Coverage | Without Coverage |
| Under 6 Years | 304 (97.1%) | 9 (2.9%) |
| 6 to 18 Years | 675 (88.0%) | 92 (12.0%) |
| 19 to 25 Years | 496 (92.5%) | 40 (7.5%) |
| 26 to 34 Years | 663 (86.2%) | 106 (13.8%) |
| 35 to 44 Years | 866 (82.2%) | 188 (17.8%) |
| 45 to 54 Years | 650 (91.0%) | 64 (9.0%) |
| 55 to 64 Years | 1,231 (96.6%) | 43 (3.4%) |
| 65 to 74 Years | 951 (100.0%) | 0 (0.0%) |
| 75 Years and older | 365 (100.0%) | 0 (0.0%) |
| Total | 6,201 (92.0%) | 542 (8.0%) |
Health Insurance Coverage by Citizenship Status in Neptune Beach
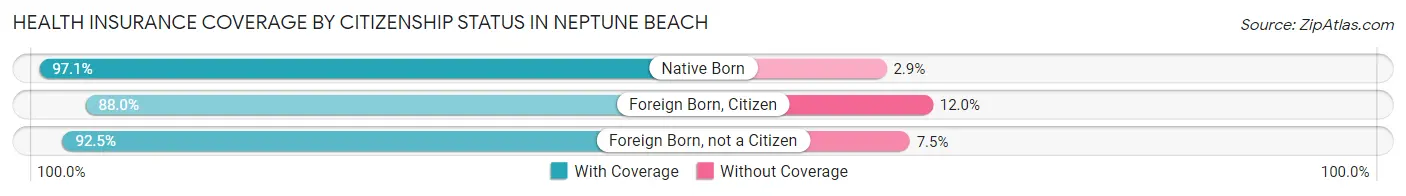
| Citizenship Status | With Coverage | Without Coverage |
| Native Born | 304 (97.1%) | 9 (2.9%) |
| Foreign Born, Citizen | 675 (88.0%) | 92 (12.0%) |
| Foreign Born, not a Citizen | 496 (92.5%) | 40 (7.5%) |
Health Insurance Coverage by Household Income in Neptune Beach
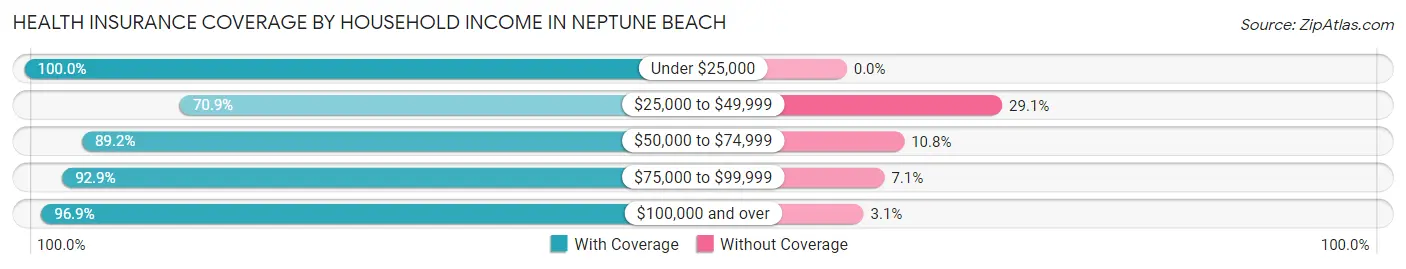
| Household Income | With Coverage | Without Coverage |
| Under $25,000 | 133 (100.0%) | 0 (0.0%) |
| $25,000 to $49,999 | 694 (70.9%) | 285 (29.1%) |
| $50,000 to $74,999 | 672 (89.2%) | 81 (10.8%) |
| $75,000 to $99,999 | 540 (92.9%) | 41 (7.1%) |
| $100,000 and over | 4,162 (96.9%) | 135 (3.1%) |
Public vs Private Health Insurance Coverage by Age in Neptune Beach
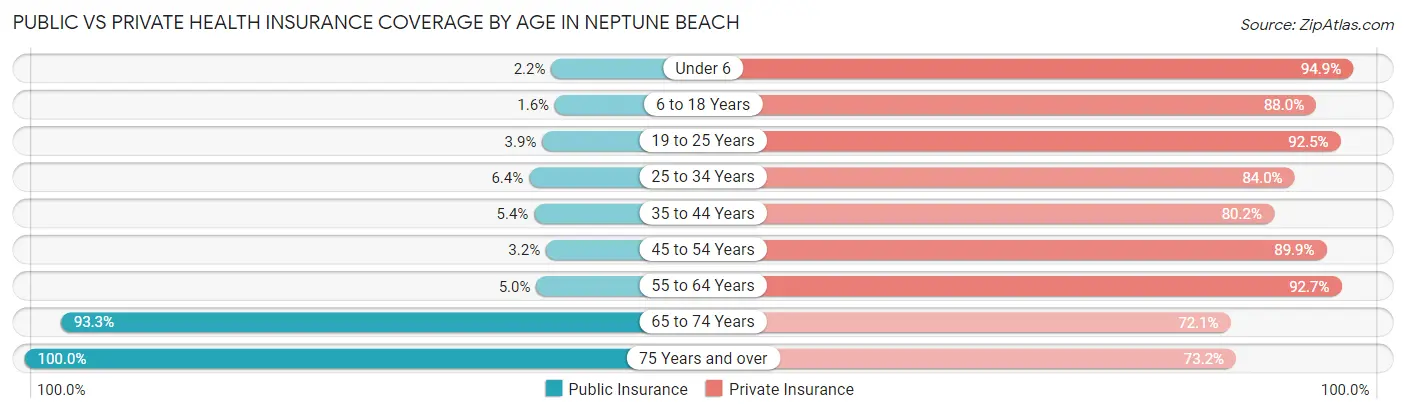
| Age Bracket | Public Insurance | Private Insurance |
| Under 6 | 7 (2.2%) | 297 (94.9%) |
| 6 to 18 Years | 12 (1.6%) | 675 (88.0%) |
| 19 to 25 Years | 21 (3.9%) | 496 (92.5%) |
| 25 to 34 Years | 49 (6.4%) | 646 (84.0%) |
| 35 to 44 Years | 57 (5.4%) | 845 (80.2%) |
| 45 to 54 Years | 23 (3.2%) | 642 (89.9%) |
| 55 to 64 Years | 64 (5.0%) | 1,181 (92.7%) |
| 65 to 74 Years | 887 (93.3%) | 686 (72.1%) |
| 75 Years and over | 365 (100.0%) | 267 (73.2%) |
| Total | 1,485 (22.0%) | 5,735 (85.1%) |
Disability Status by Sex by Age in Neptune Beach
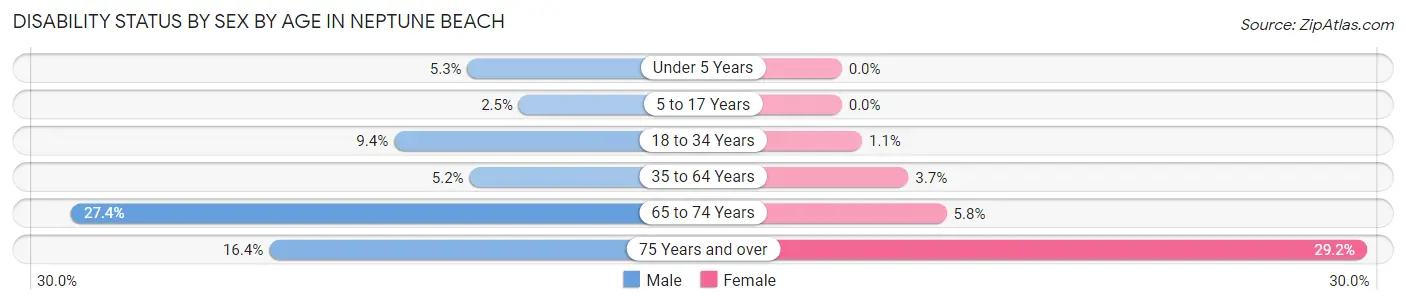
| Age Bracket | Male | Female |
| Under 5 Years | 7 (5.3%) | 0 (0.0%) |
| 5 to 17 Years | 11 (2.5%) | 0 (0.0%) |
| 18 to 34 Years | 50 (9.4%) | 9 (1.1%) |
| 35 to 64 Years | 80 (5.2%) | 56 (3.7%) |
| 65 to 74 Years | 148 (27.4%) | 24 (5.8%) |
| 75 Years and over | 20 (16.4%) | 71 (29.2%) |
Disability Class by Sex by Age in Neptune Beach
Disability Class: Hearing Difficulty
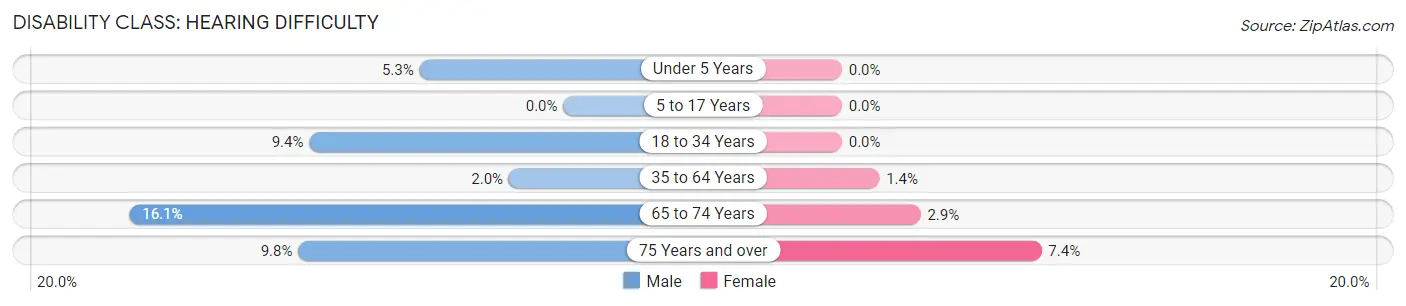
| Age Bracket | Male | Female |
| Under 5 Years | 7 (5.3%) | 0 (0.0%) |
| 5 to 17 Years | 0 (0.0%) | 0 (0.0%) |
| 18 to 34 Years | 50 (9.4%) | 0 (0.0%) |
| 35 to 64 Years | 31 (2.0%) | 21 (1.4%) |
| 65 to 74 Years | 87 (16.1%) | 12 (2.9%) |
| 75 Years and over | 12 (9.8%) | 18 (7.4%) |
Disability Class: Vision Difficulty
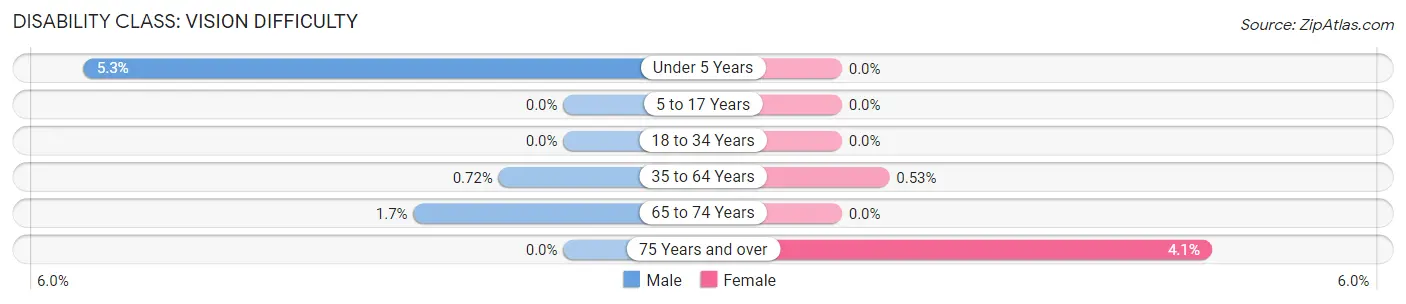
| Age Bracket | Male | Female |
| Under 5 Years | 7 (5.3%) | 0 (0.0%) |
| 5 to 17 Years | 0 (0.0%) | 0 (0.0%) |
| 18 to 34 Years | 0 (0.0%) | 0 (0.0%) |
| 35 to 64 Years | 11 (0.7%) | 8 (0.5%) |
| 65 to 74 Years | 9 (1.7%) | 0 (0.0%) |
| 75 Years and over | 0 (0.0%) | 10 (4.1%) |
Disability Class: Cognitive Difficulty
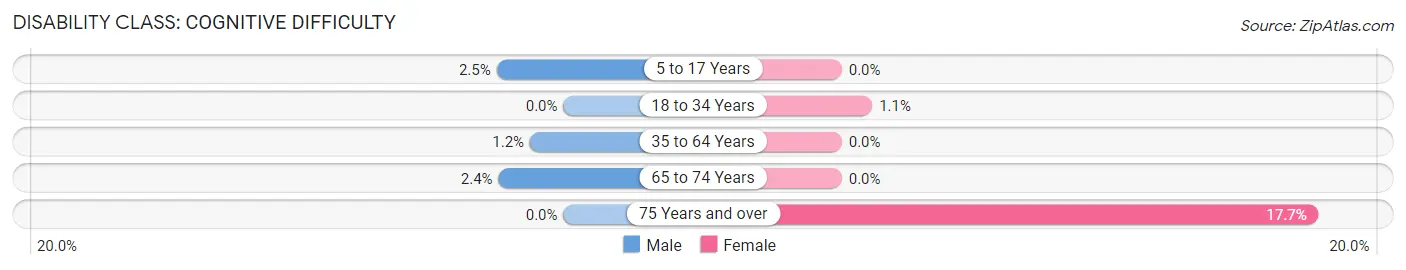
| Age Bracket | Male | Female |
| 5 to 17 Years | 11 (2.5%) | 0 (0.0%) |
| 18 to 34 Years | 0 (0.0%) | 9 (1.1%) |
| 35 to 64 Years | 19 (1.2%) | 0 (0.0%) |
| 65 to 74 Years | 13 (2.4%) | 0 (0.0%) |
| 75 Years and over | 0 (0.0%) | 43 (17.7%) |
Disability Class: Ambulatory Difficulty
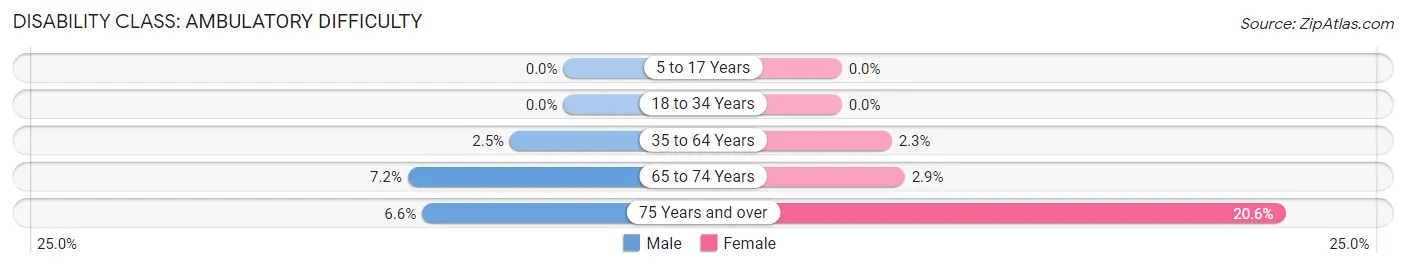
| Age Bracket | Male | Female |
| 5 to 17 Years | 0 (0.0%) | 0 (0.0%) |
| 18 to 34 Years | 0 (0.0%) | 0 (0.0%) |
| 35 to 64 Years | 38 (2.5%) | 35 (2.3%) |
| 65 to 74 Years | 39 (7.2%) | 12 (2.9%) |
| 75 Years and over | 8 (6.6%) | 50 (20.6%) |
Disability Class: Self-Care Difficulty
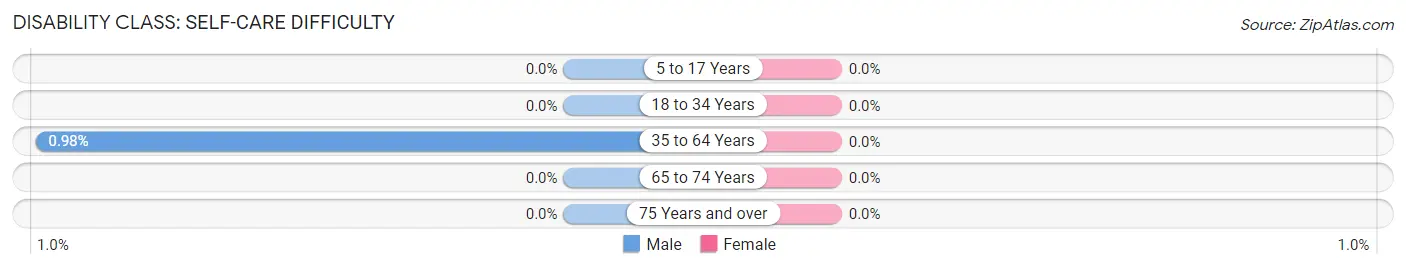
| Age Bracket | Male | Female |
| 5 to 17 Years | 0 (0.0%) | 0 (0.0%) |
| 18 to 34 Years | 0 (0.0%) | 0 (0.0%) |
| 35 to 64 Years | 15 (1.0%) | 0 (0.0%) |
| 65 to 74 Years | 0 (0.0%) | 0 (0.0%) |
| 75 Years and over | 0 (0.0%) | 0 (0.0%) |
Technology Access in Neptune Beach
Computing Device Access in Neptune Beach
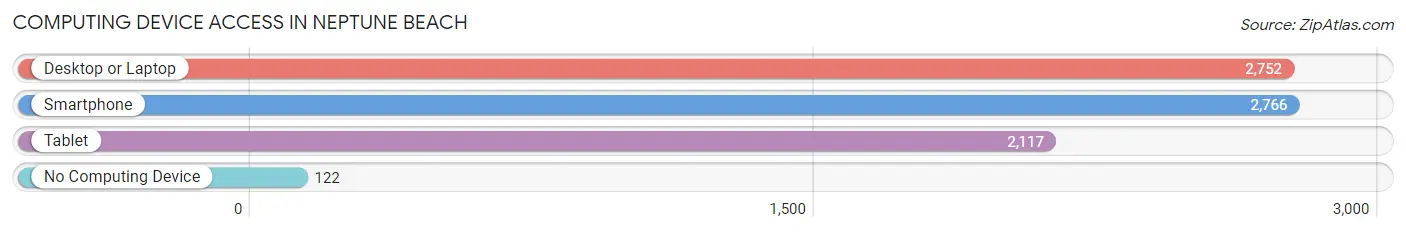
| Device Type | # Households | % Households |
| Desktop or Laptop | 2,752 | 91.1% |
| Smartphone | 2,766 | 91.6% |
| Tablet | 2,117 | 70.1% |
| No Computing Device | 122 | 4.0% |
| Total | 3,020 | 100.0% |
Internet Access in Neptune Beach
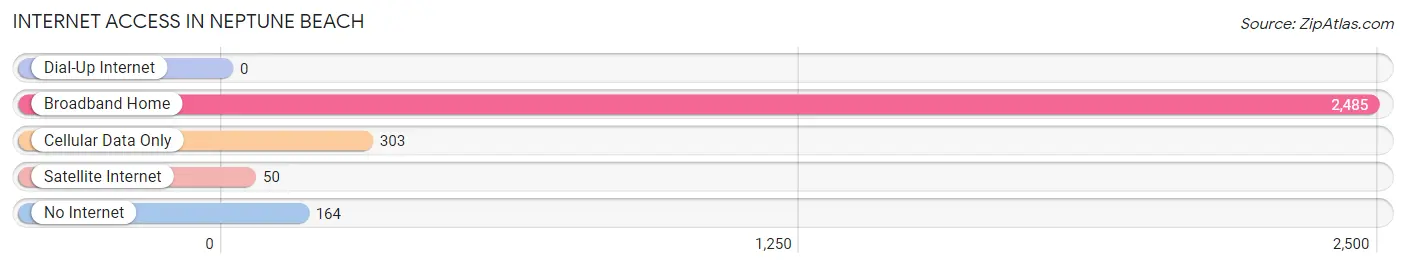
| Internet Type | # Households | % Households |
| Dial-Up Internet | 0 | 0.0% |
| Broadband Home | 2,485 | 82.3% |
| Cellular Data Only | 303 | 10.0% |
| Satellite Internet | 50 | 1.7% |
| No Internet | 164 | 5.4% |
| Total | 3,020 | 100.0% |
Neptune Beach Summary
Neptune Beach is a small city located in Duval County, Florida, United States. It is part of the Jacksonville metropolitan area and is situated on the Atlantic Ocean. The city has a population of approximately 7,000 people and covers an area of 2.6 square miles.
History
Neptune Beach was founded in 1925 by a group of investors who wanted to create a beachfront resort town. The town was named after Neptune, the Roman god of the sea. The town was initially developed as a residential community, but it soon became a popular tourist destination. The town was incorporated in 1931 and has remained a popular beach destination ever since.
Geography
Neptune Beach is located in Duval County, Florida, on the Atlantic Ocean. The city is situated on a barrier island, which is separated from the mainland by the Intracoastal Waterway. The city is bordered by Atlantic Beach to the north, Jacksonville Beach to the south, and the Atlantic Ocean to the east. The city has a total area of 2.6 square miles, of which 0.2 square miles is water.
Economy
Neptune Beach has a thriving economy that is largely based on tourism. The city is home to several popular beachfront resorts, restaurants, and shops. The city also has a vibrant fishing industry, with many local businesses offering charter fishing trips and other services. Additionally, the city is home to several corporate offices, including those of the Florida Times-Union newspaper and the Mayo Clinic.
Demographics
As of the 2010 census, the population of Neptune Beach was 7,037. The racial makeup of the city was 91.3% White, 4.2% African American, 0.3% Native American, 1.3% Asian, 0.1% Pacific Islander, 1.2% from other races, and 1.6% from two or more races. Hispanic or Latino of any race were 4.2% of the population.
The median income for a household in the city was $50,945, and the median income for a family was $60,945. The per capita income for the city was $30,945. About 5.2% of families and 7.2% of the population were below the poverty line, including 8.2% of those under age 18 and 4.2% of those age 65 or over.
Neptune Beach is a small city with a rich history and a vibrant economy. The city is home to several popular beachfront resorts, restaurants, and shops, as well as corporate offices and a thriving fishing industry. The city has a diverse population, with a median income that is slightly higher than the national average. Neptune Beach is a great place to live, work, and play.
Common Questions
What is Per Capita Income in Neptune Beach?
Per Capita income in Neptune Beach is $73,054.
What is the Median Family Income in Neptune Beach?
Median Family Income in Neptune Beach is $120,893.
What is the Median Household income in Neptune Beach?
Median Household Income in Neptune Beach is $109,375.
What is Income or Wage Gap in Neptune Beach?
Income or Wage Gap in Neptune Beach is 34.4%.
Women in Neptune Beach earn 65.6 cents for every dollar earned by a man.
What is Inequality or Gini Index in Neptune Beach?
Inequality or Gini Index in Neptune Beach is 0.49.
What is the Total Population of Neptune Beach?
Total Population of Neptune Beach is 6,743.
What is the Total Male Population of Neptune Beach?
Total Male Population of Neptune Beach is 3,298.
What is the Total Female Population of Neptune Beach?
Total Female Population of Neptune Beach is 3,445.
What is the Ratio of Males per 100 Females in Neptune Beach?
There are 95.73 Males per 100 Females in Neptune Beach.
What is the Ratio of Females per 100 Males in Neptune Beach?
There are 104.46 Females per 100 Males in Neptune Beach.
What is the Median Population Age in Neptune Beach?
Median Population Age in Neptune Beach is 44.4 Years.
What is the Average Family Size in Neptune Beach
Average Family Size in Neptune Beach is 2.7 People.
What is the Average Household Size in Neptune Beach
Average Household Size in Neptune Beach is 2.2 People.
How Large is the Labor Force in Neptune Beach?
There are 4,329 People in the Labor Forcein in Neptune Beach.
What is the Percentage of People in the Labor Force in Neptune Beach?
73.8% of People are in the Labor Force in Neptune Beach.
What is the Unemployment Rate in Neptune Beach?
Unemployment Rate in Neptune Beach is 1.1%.