Molino, FL Map & Demographics
Molino Map
Molino Overview
$33,053
PER CAPITA INCOME
$90,406
AVG FAMILY INCOME
$87,614
AVG HOUSEHOLD INCOME
0.26
INEQUALITY / GINI INDEX
1,253
TOTAL POPULATION
717
MALE POPULATION
536
FEMALE POPULATION
133.77
MALES / 100 FEMALES
74.76
FEMALES / 100 MALES
35.9
MEDIAN AGE
3.0
AVG FAMILY SIZE
2.9
AVG HOUSEHOLD SIZE
773
LABOR FORCE [ PEOPLE ]
82.4%
PERCENT IN LABOR FORCE
Molino Zip Codes
Molino Area Codes
Income in Molino
Income Overview in Molino
Per Capita Income in Molino is $33,053, while median incomes of families and households are $90,406 and $87,614 respectively.
| Characteristic | Number | Measure |
| Per Capita Income | 1,253 | $33,053 |
| Median Family Income | 299 | $90,406 |
| Mean Family Income | 299 | $113,674 |
| Median Household Income | 438 | $87,614 |
| Mean Household Income | 438 | $101,365 |
| Income Deficit | 299 | $0 |
| Wage / Income Gap (%) | 1,253 | 0.00% |
| Wage / Income Gap ($) | 1,253 | 100.00¢ per $1 |
| Gini / Inequality Index | 1,253 | 0.26 |
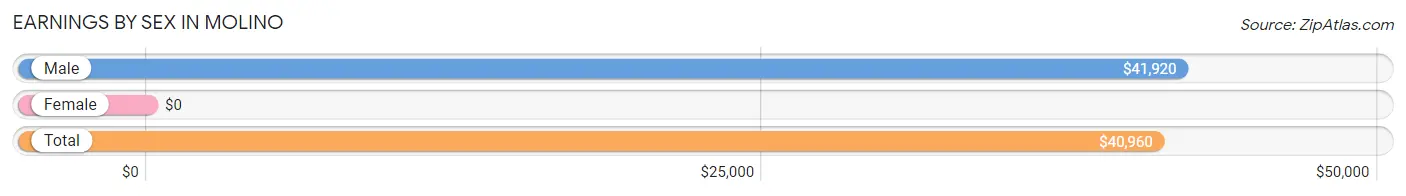
Earnings by Sex in Molino
| Sex | Number | Average Earnings |
| Male | 514 (66.5%) | $41,920 |
| Female | 259 (33.5%) | $0 |
| Total | 773 (100.0%) | $40,960 |
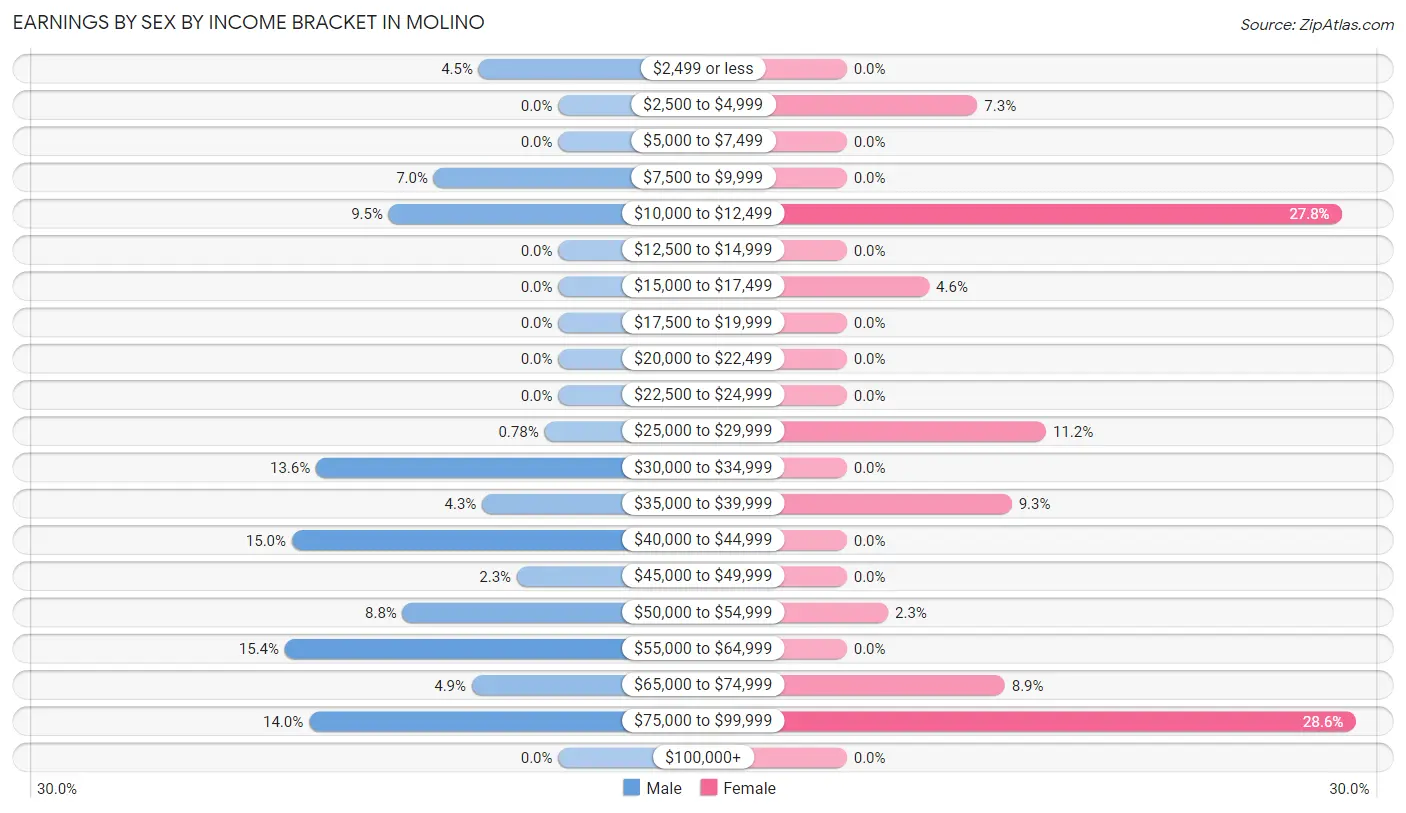
Earnings by Sex by Income Bracket in Molino
The most common earnings brackets in Molino are $55,000 to $64,999 for men (79 | 15.4%) and $75,000 to $99,999 for women (74 | 28.6%).
| Income | Male | Female |
| $2,499 or less | 23 (4.5%) | 0 (0.0%) |
| $2,500 to $4,999 | 0 (0.0%) | 19 (7.3%) |
| $5,000 to $7,499 | 0 (0.0%) | 0 (0.0%) |
| $7,500 to $9,999 | 36 (7.0%) | 0 (0.0%) |
| $10,000 to $12,499 | 49 (9.5%) | 72 (27.8%) |
| $12,500 to $14,999 | 0 (0.0%) | 0 (0.0%) |
| $15,000 to $17,499 | 0 (0.0%) | 12 (4.6%) |
| $17,500 to $19,999 | 0 (0.0%) | 0 (0.0%) |
| $20,000 to $22,499 | 0 (0.0%) | 0 (0.0%) |
| $22,500 to $24,999 | 0 (0.0%) | 0 (0.0%) |
| $25,000 to $29,999 | 4 (0.8%) | 29 (11.2%) |
| $30,000 to $34,999 | 70 (13.6%) | 0 (0.0%) |
| $35,000 to $39,999 | 22 (4.3%) | 24 (9.3%) |
| $40,000 to $44,999 | 77 (15.0%) | 0 (0.0%) |
| $45,000 to $49,999 | 12 (2.3%) | 0 (0.0%) |
| $50,000 to $54,999 | 45 (8.7%) | 6 (2.3%) |
| $55,000 to $64,999 | 79 (15.4%) | 0 (0.0%) |
| $65,000 to $74,999 | 25 (4.9%) | 23 (8.9%) |
| $75,000 to $99,999 | 72 (14.0%) | 74 (28.6%) |
| $100,000+ | 0 (0.0%) | 0 (0.0%) |
| Total | 514 (100.0%) | 259 (100.0%) |
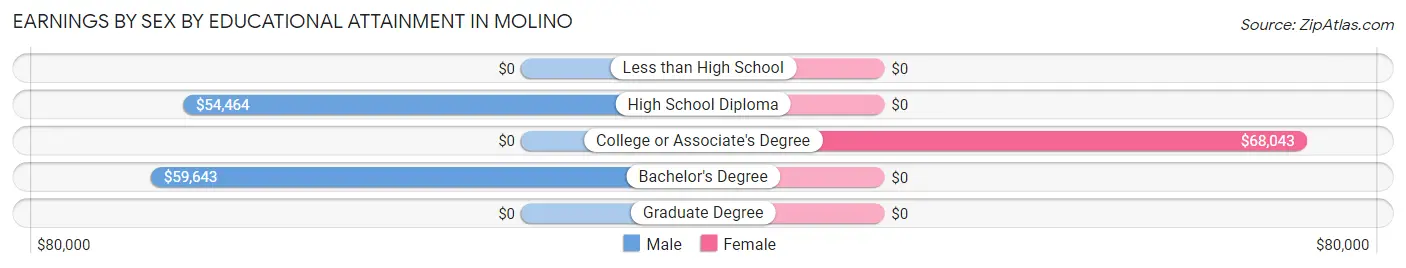
Earnings by Sex by Educational Attainment in Molino
| Educational Attainment | Male Income | Female Income |
| Less than High School | - | - |
| High School Diploma | $54,464 | $0 |
| College or Associate's Degree | - | - |
| Bachelor's Degree | $59,643 | $0 |
| Graduate Degree | - | - |
| Total | $53,083 | $0 |
Family Income in Molino
Family Income Brackets in Molino
According to the Molino family income data, there are 134 families falling into the $75,000 to $99,999 income range, which is the most common income bracket and makes up 44.8% of all families.
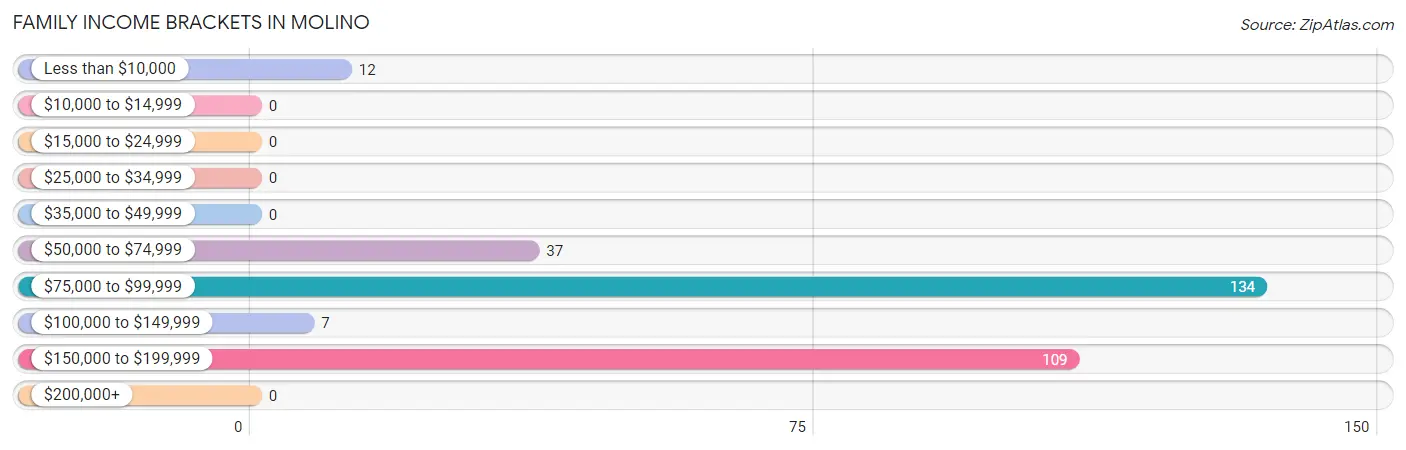
| Income Bracket | # Families | % Families |
| Less than $10,000 | 12 | 4.0% |
| $10,000 to $14,999 | 0 | 0.0% |
| $15,000 to $24,999 | 0 | 0.0% |
| $25,000 to $34,999 | 0 | 0.0% |
| $35,000 to $49,999 | 0 | 0.0% |
| $50,000 to $74,999 | 37 | 12.4% |
| $75,000 to $99,999 | 134 | 44.8% |
| $100,000 to $149,999 | 7 | 2.3% |
| $150,000 to $199,999 | 109 | 36.5% |
| $200,000+ | 0 | 0.0% |
Family Income by Famaliy Size in Molino
4-person families (102 | 34.1%) account for the highest median family income in Molino with $190,339 per family, while 4-person families (102 | 34.1%) have the highest median income of $47,585 per family member.
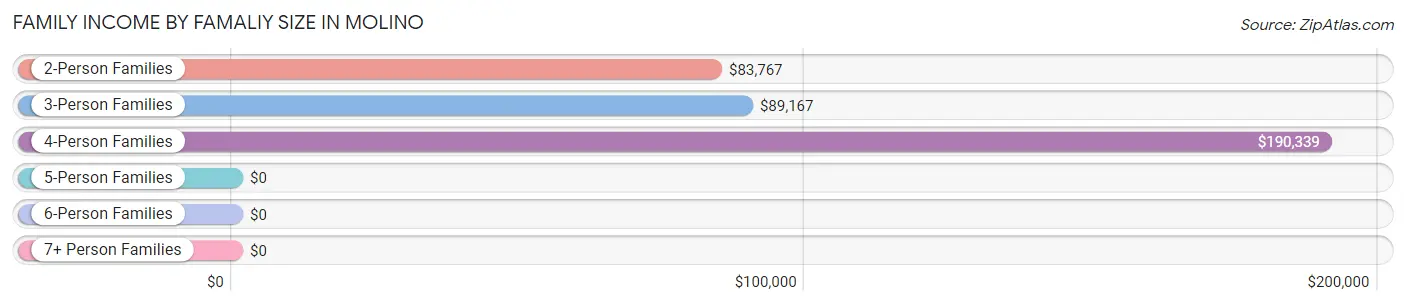
| Income Bracket | # Families | Median Income |
| 2-Person Families | 91 (30.4%) | $83,767 |
| 3-Person Families | 96 (32.1%) | $89,167 |
| 4-Person Families | 102 (34.1%) | $190,339 |
| 5-Person Families | 0 (0.0%) | $0 |
| 6-Person Families | 10 (3.3%) | $0 |
| 7+ Person Families | 0 (0.0%) | $0 |
| Total | 299 (100.0%) | $90,406 |
Family Income by Number of Earners in Molino
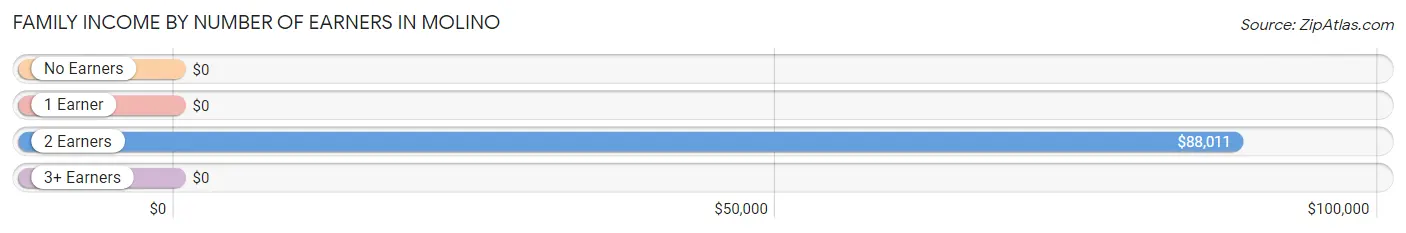
| Number of Earners | # Families | Median Income |
| No Earners | 12 (4.0%) | $0 |
| 1 Earner | 58 (19.4%) | $0 |
| 2 Earners | 153 (51.2%) | $88,011 |
| 3+ Earners | 76 (25.4%) | $0 |
| Total | 299 (100.0%) | $90,406 |
Household Income in Molino
Household Income Brackets in Molino
With 147 households falling in the category, the $75,000 to $99,999 income range is the most frequent in Molino, accounting for 33.6% of all households.
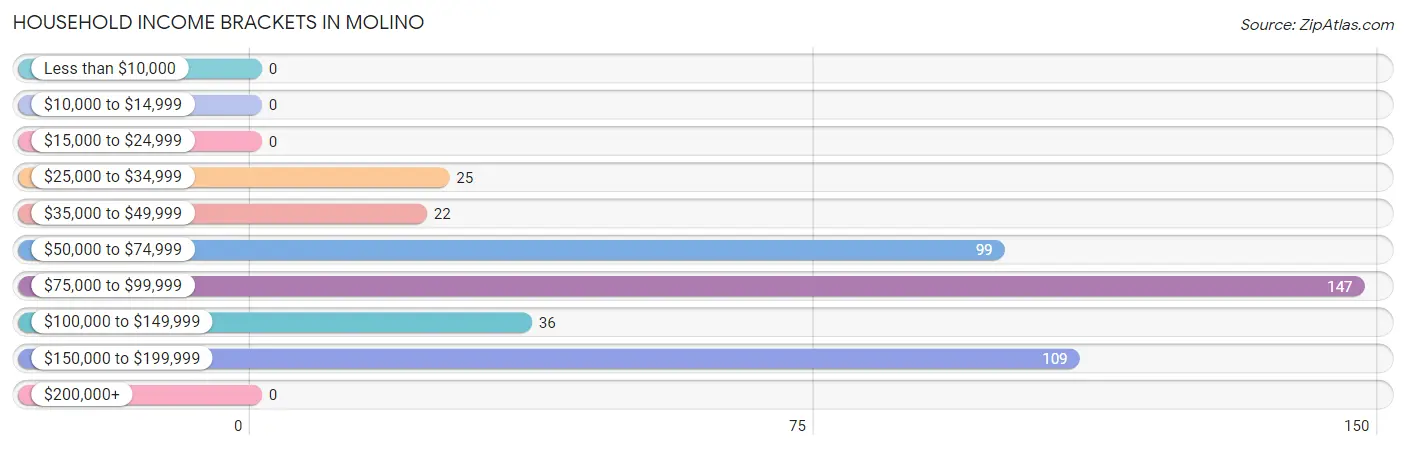
| Income Bracket | # Households | % Households |
| Less than $10,000 | 0 | 0.0% |
| $10,000 to $14,999 | 0 | 0.0% |
| $15,000 to $24,999 | 0 | 0.0% |
| $25,000 to $34,999 | 25 | 5.7% |
| $35,000 to $49,999 | 22 | 5.0% |
| $50,000 to $74,999 | 99 | 22.6% |
| $75,000 to $99,999 | 147 | 33.6% |
| $100,000 to $149,999 | 36 | 8.2% |
| $150,000 to $199,999 | 109 | 24.9% |
| $200,000+ | 0 | 0.0% |
Household Income by Householder Age in Molino
The median household income in Molino is $87,614, with the highest median household income of $108,333 found in the 45 to 64 years age bracket for the primary householder. A total of 246 households (56.2%) fall into this category.
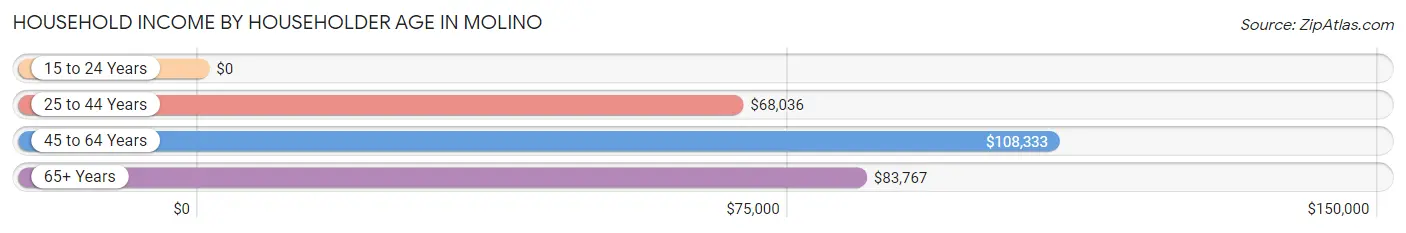
| Income Bracket | # Households | Median Income |
| 15 to 24 Years | 0 (0.0%) | $0 |
| 25 to 44 Years | 101 (23.1%) | $68,036 |
| 45 to 64 Years | 246 (56.2%) | $108,333 |
| 65+ Years | 91 (20.8%) | $83,767 |
| Total | 438 (100.0%) | $87,614 |
Poverty in Molino
Income Below Poverty by Sex and Age in Molino
With 7.5% poverty level for males and 10.8% for females among the residents of Molino, 25 to 34 year old males and under 5 year old females are the most vulnerable to poverty, with 49 males (37.1%) and 20 females (100.0%) in their respective age groups living below the poverty level.
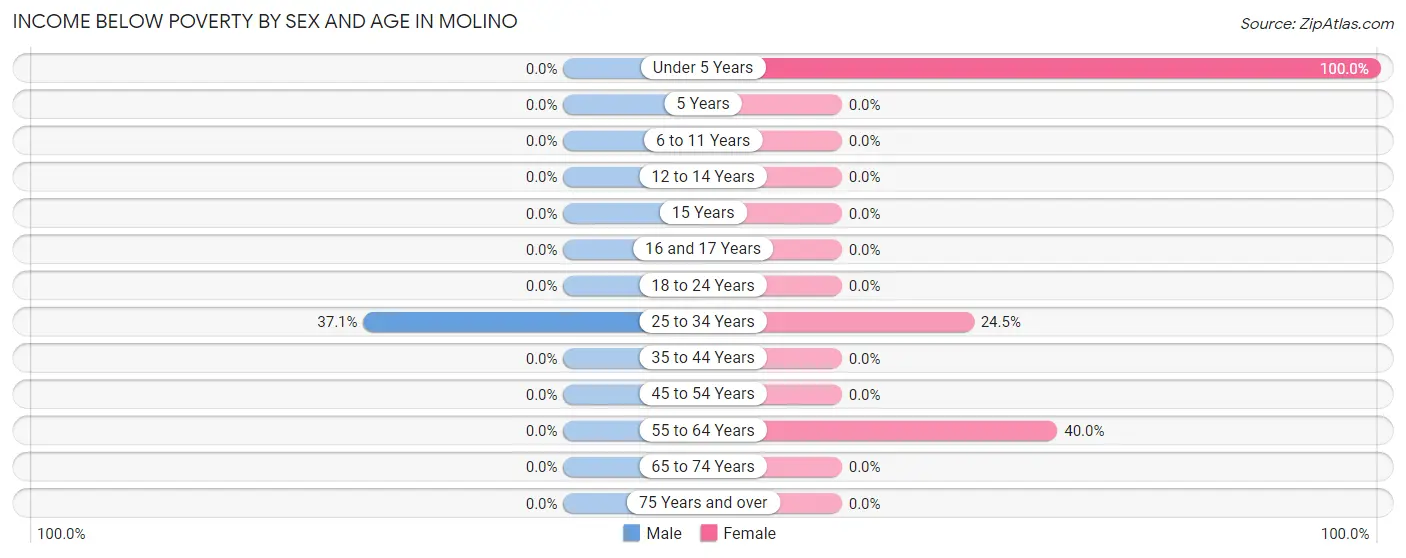
| Age Bracket | Male | Female |
| Under 5 Years | 0 (0.0%) | 20 (100.0%) |
| 5 Years | 0 (0.0%) | 0 (0.0%) |
| 6 to 11 Years | 0 (0.0%) | 0 (0.0%) |
| 12 to 14 Years | 0 (0.0%) | 0 (0.0%) |
| 15 Years | 0 (0.0%) | 0 (0.0%) |
| 16 and 17 Years | 0 (0.0%) | 0 (0.0%) |
| 18 to 24 Years | 0 (0.0%) | 0 (0.0%) |
| 25 to 34 Years | 49 (37.1%) | 12 (24.5%) |
| 35 to 44 Years | 0 (0.0%) | 0 (0.0%) |
| 45 to 54 Years | 0 (0.0%) | 0 (0.0%) |
| 55 to 64 Years | 0 (0.0%) | 20 (40.0%) |
| 65 to 74 Years | 0 (0.0%) | 0 (0.0%) |
| 75 Years and over | 0 (0.0%) | 0 (0.0%) |
| Total | 49 (7.5%) | 52 (10.8%) |
Income Above Poverty by Sex and Age in Molino
According to the poverty statistics in Molino, males aged under 5 years and females aged 5 years are the age groups that are most secure financially, with 100.0% of males and 100.0% of females in these age groups living above the poverty line.
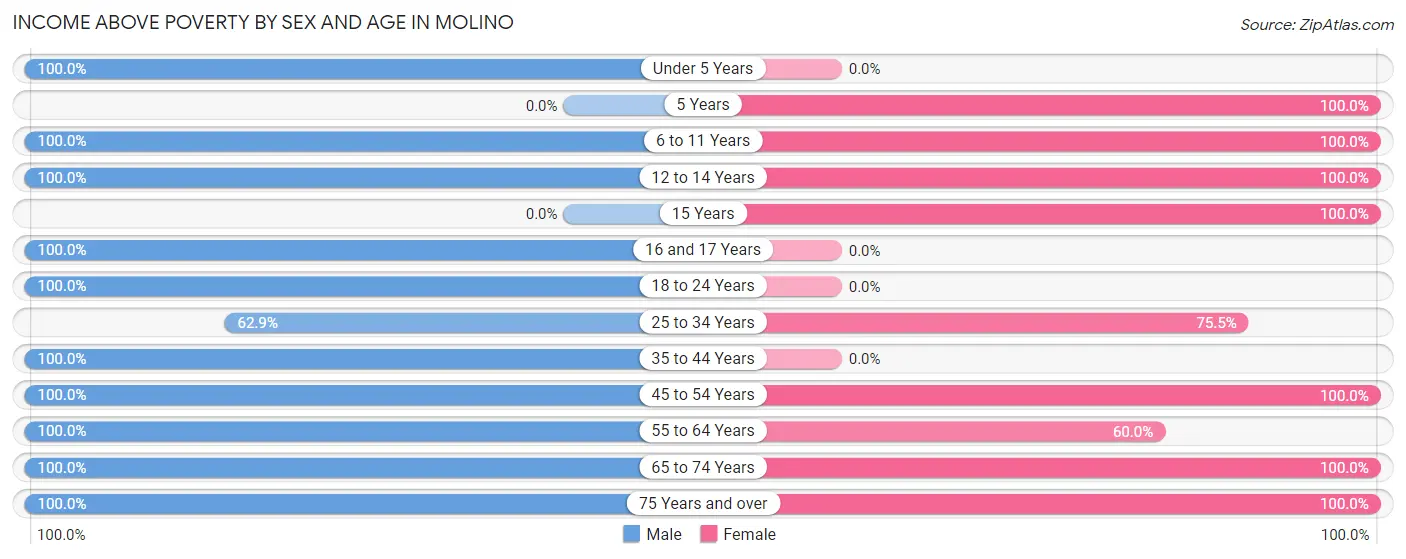
| Age Bracket | Male | Female |
| Under 5 Years | 30 (100.0%) | 0 (0.0%) |
| 5 Years | 0 (0.0%) | 12 (100.0%) |
| 6 to 11 Years | 24 (100.0%) | 27 (100.0%) |
| 12 to 14 Years | 24 (100.0%) | 6 (100.0%) |
| 15 Years | 0 (0.0%) | 53 (100.0%) |
| 16 and 17 Years | 36 (100.0%) | 0 (0.0%) |
| 18 to 24 Years | 70 (100.0%) | 0 (0.0%) |
| 25 to 34 Years | 83 (62.9%) | 37 (75.5%) |
| 35 to 44 Years | 28 (100.0%) | 0 (0.0%) |
| 45 to 54 Years | 147 (100.0%) | 165 (100.0%) |
| 55 to 64 Years | 42 (100.0%) | 30 (60.0%) |
| 65 to 74 Years | 49 (100.0%) | 92 (100.0%) |
| 75 Years and over | 69 (100.0%) | 9 (100.0%) |
| Total | 602 (92.5%) | 431 (89.2%) |
Income Below Poverty Among Married-Couple Families in Molino
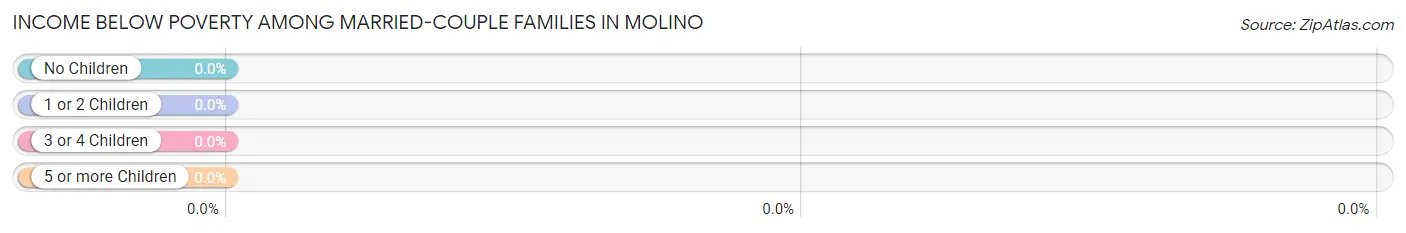
| Children | Above Poverty | Below Poverty |
| No Children | 101 (100.0%) | 0 (0.0%) |
| 1 or 2 Children | 156 (100.0%) | 0 (0.0%) |
| 3 or 4 Children | 0 (0.0%) | 0 (0.0%) |
| 5 or more Children | 0 (0.0%) | 0 (0.0%) |
| Total | 257 (100.0%) | 0 (0.0%) |
Income Below Poverty Among Single-Parent Households in Molino
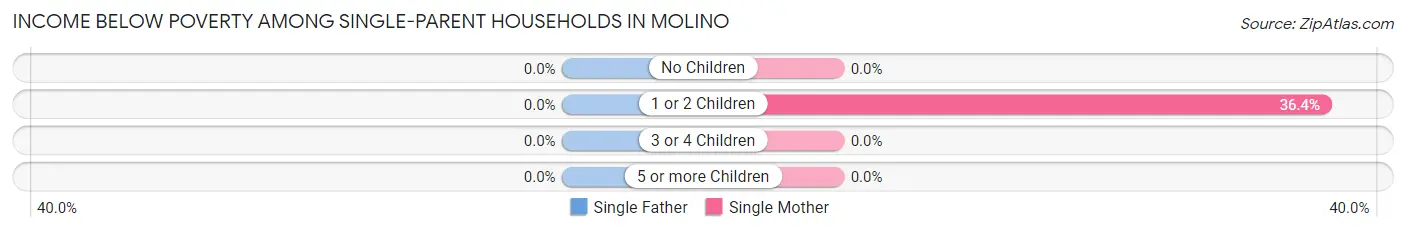
| Children | Single Father | Single Mother |
| No Children | 0 (0.0%) | 0 (0.0%) |
| 1 or 2 Children | 0 (0.0%) | 12 (36.4%) |
| 3 or 4 Children | 0 (0.0%) | 0 (0.0%) |
| 5 or more Children | 0 (0.0%) | 0 (0.0%) |
| Total | 0 (0.0%) | 12 (28.6%) |
Income Below Poverty Among Married-Couple vs Single-Parent Households in Molino
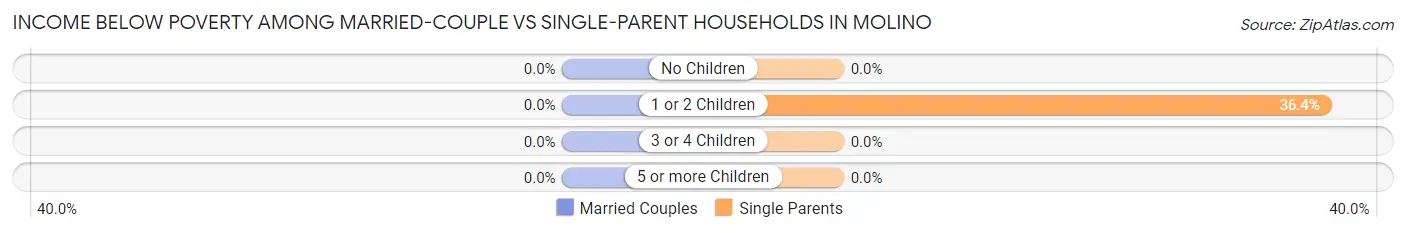
| Children | Married-Couple Families | Single-Parent Households |
| No Children | 0 (0.0%) | 0 (0.0%) |
| 1 or 2 Children | 0 (0.0%) | 12 (36.4%) |
| 3 or 4 Children | 0 (0.0%) | 0 (0.0%) |
| 5 or more Children | 0 (0.0%) | 0 (0.0%) |
| Total | 0 (0.0%) | 12 (28.6%) |
Race in Molino
The most populous races in Molino are White / Caucasian (814 | 65.0%), Two or more Races (252 | 20.1%), and Black / African American (169 | 13.5%).
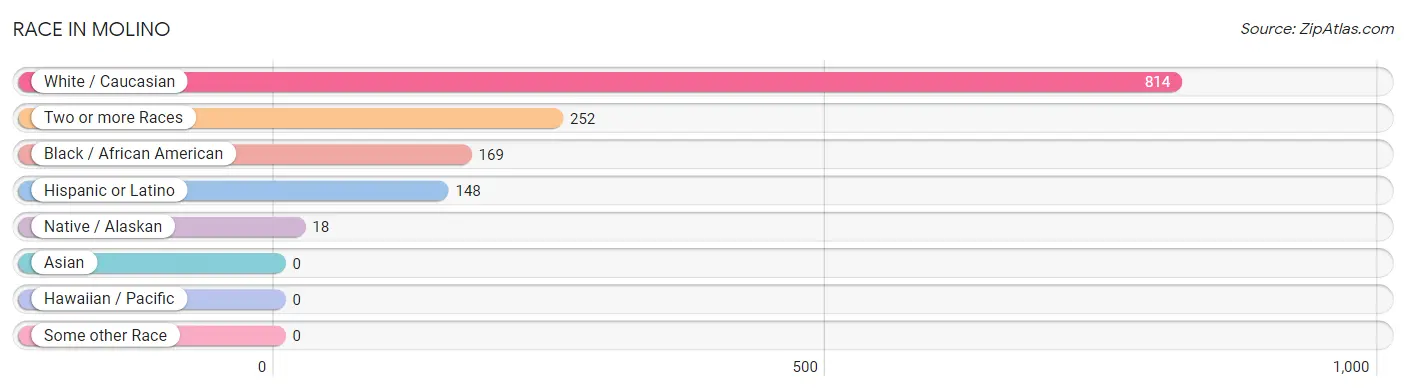
| Race | # Population | % Population |
| Asian | 0 | 0.0% |
| Black / African American | 169 | 13.5% |
| Hawaiian / Pacific | 0 | 0.0% |
| Hispanic or Latino | 148 | 11.8% |
| Native / Alaskan | 18 | 1.4% |
| White / Caucasian | 814 | 65.0% |
| Two or more Races | 252 | 20.1% |
| Some other Race | 0 | 0.0% |
| Total | 1,253 | 100.0% |
Ancestry in Molino
The most populous ancestries reported in Molino are Italian (161 | 12.9%), Puerto Rican (148 | 11.8%), Russian (131 | 10.4%), German (122 | 9.7%), and Irish (115 | 9.2%), together accounting for 54.0% of all Molino residents.
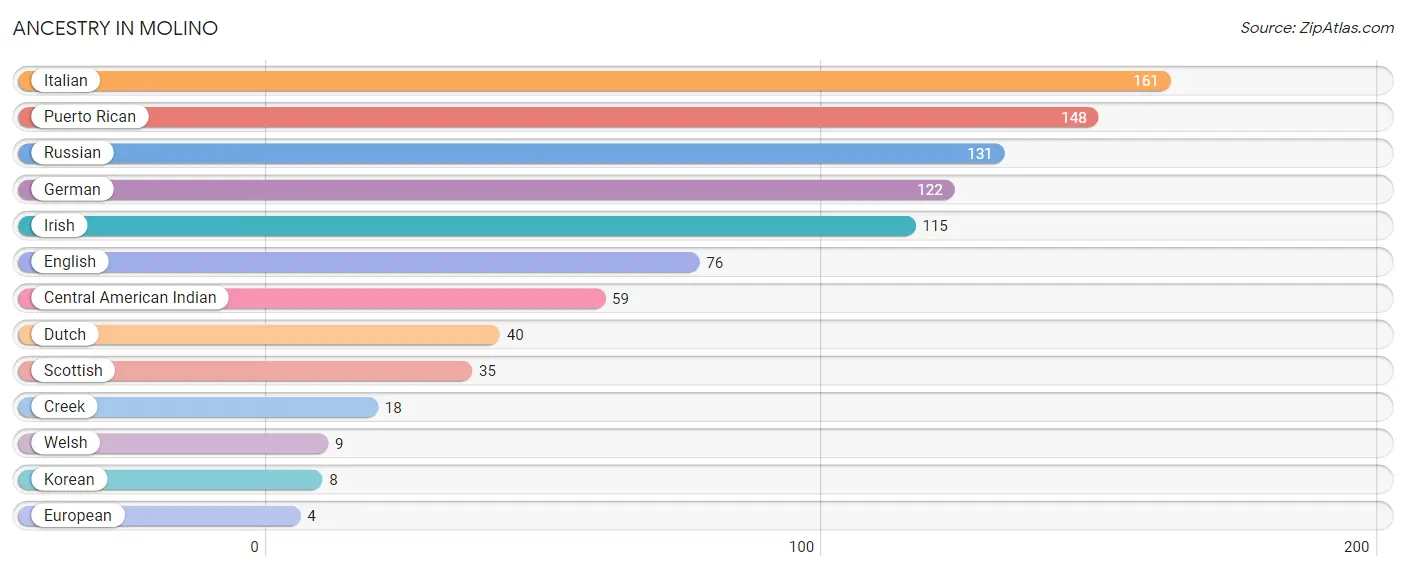
| Ancestry | # Population | % Population |
| Central American Indian | 59 | 4.7% |
| Creek | 18 | 1.4% |
| Dutch | 40 | 3.2% |
| English | 76 | 6.1% |
| European | 4 | 0.3% |
| German | 122 | 9.7% |
| Irish | 115 | 9.2% |
| Italian | 161 | 12.9% |
| Korean | 8 | 0.6% |
| Puerto Rican | 148 | 11.8% |
| Russian | 131 | 10.4% |
| Scottish | 35 | 2.8% |
| Welsh | 9 | 0.7% | View All 13 Rows |
Immigrants in Molino
The most numerous immigrant groups reported in Molino came from Europe (9 | 0.7%), and Northern Europe (9 | 0.7%), together accounting for 1.4% of all Molino residents.
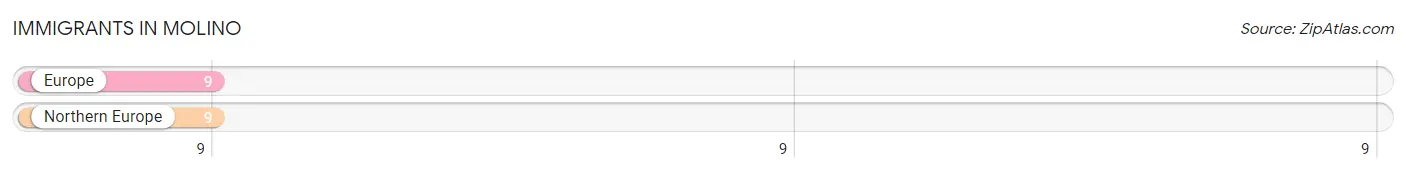
| Immigration Origin | # Population | % Population |
| Europe | 9 | 0.7% |
| Northern Europe | 9 | 0.7% | View All 2 Rows |
Sex and Age in Molino
Sex and Age in Molino
The most populous age groups in Molino are 50 to 54 Years (140 | 19.5%) for men and 50 to 54 Years (128 | 23.9%) for women.
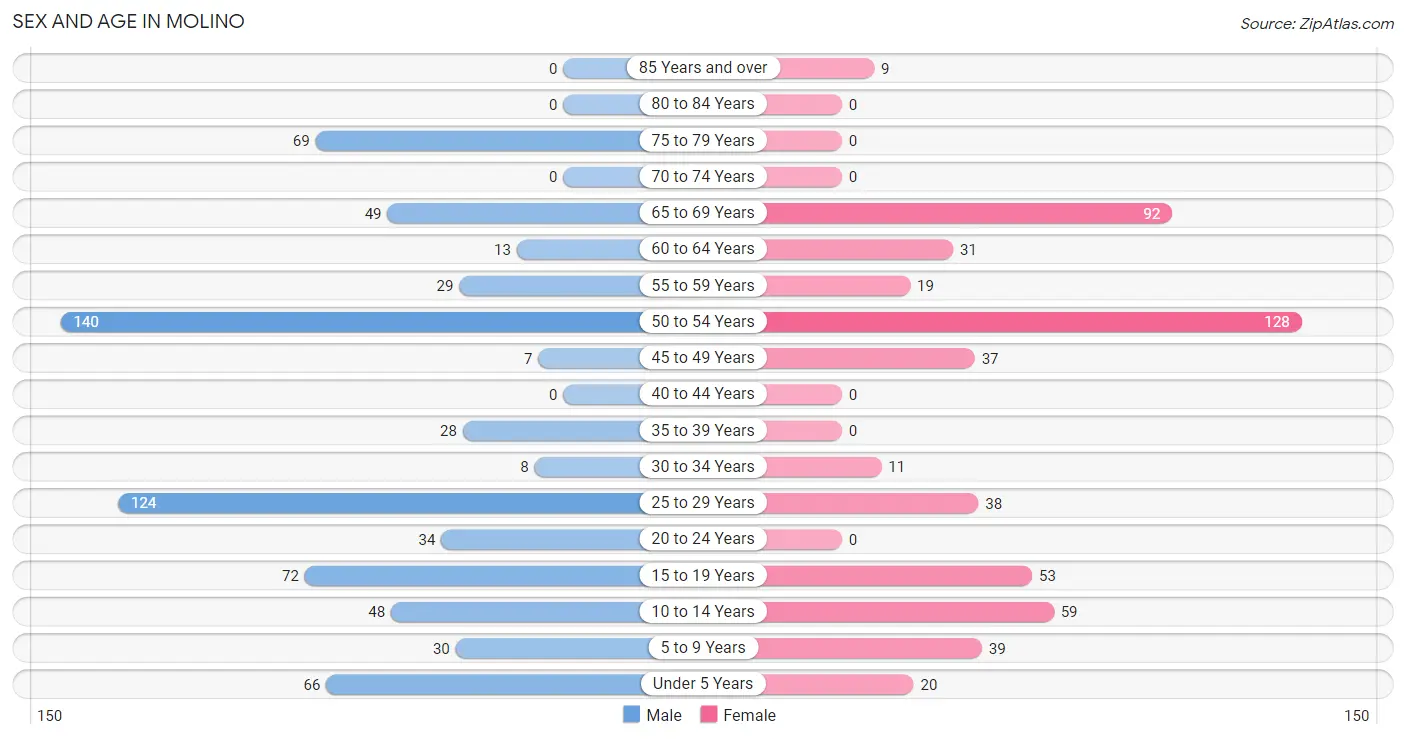
| Age Bracket | Male | Female |
| Under 5 Years | 66 (9.2%) | 20 (3.7%) |
| 5 to 9 Years | 30 (4.2%) | 39 (7.3%) |
| 10 to 14 Years | 48 (6.7%) | 59 (11.0%) |
| 15 to 19 Years | 72 (10.0%) | 53 (9.9%) |
| 20 to 24 Years | 34 (4.7%) | 0 (0.0%) |
| 25 to 29 Years | 124 (17.3%) | 38 (7.1%) |
| 30 to 34 Years | 8 (1.1%) | 11 (2.1%) |
| 35 to 39 Years | 28 (3.9%) | 0 (0.0%) |
| 40 to 44 Years | 0 (0.0%) | 0 (0.0%) |
| 45 to 49 Years | 7 (1.0%) | 37 (6.9%) |
| 50 to 54 Years | 140 (19.5%) | 128 (23.9%) |
| 55 to 59 Years | 29 (4.0%) | 19 (3.5%) |
| 60 to 64 Years | 13 (1.8%) | 31 (5.8%) |
| 65 to 69 Years | 49 (6.8%) | 92 (17.2%) |
| 70 to 74 Years | 0 (0.0%) | 0 (0.0%) |
| 75 to 79 Years | 69 (9.6%) | 0 (0.0%) |
| 80 to 84 Years | 0 (0.0%) | 0 (0.0%) |
| 85 Years and over | 0 (0.0%) | 9 (1.7%) |
| Total | 717 (100.0%) | 536 (100.0%) |
Families and Households in Molino
Median Family Size in Molino
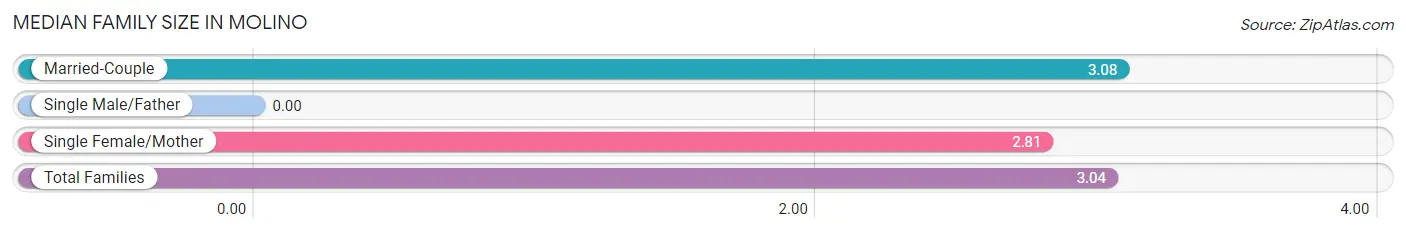
| Family Type | # Families | Family Size |
| Married-Couple | 257 (86.0%) | 3.08 |
| Single Male/Father | 0 (0.0%) | - |
| Single Female/Mother | 42 (14.1%) | 2.81 |
| Total Families | 299 (100.0%) | 3.04 |
Median Household Size in Molino
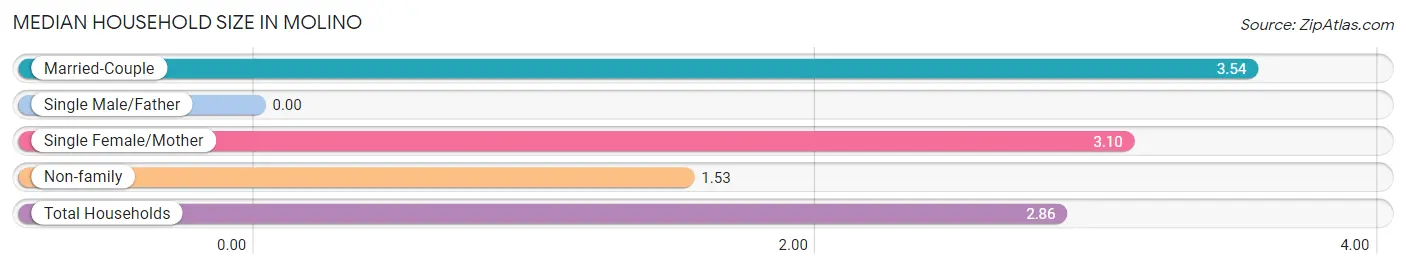
| Household Type | # Households | Household Size |
| Married-Couple | 257 (58.7%) | 3.54 |
| Single Male/Father | 0 (0.0%) | - |
| Single Female/Mother | 42 (9.6%) | 3.10 |
| Non-family | 139 (31.7%) | 1.53 |
| Total Households | 438 (100.0%) | 2.86 |
Household Size by Marriage Status in Molino
Out of a total of 438 households in Molino, 299 (68.3%) are family households, while 139 (31.7%) are nonfamily households. The most numerous type of family households are 4-person households, comprising 114, and the most common type of nonfamily households are 1-person households, comprising 61.
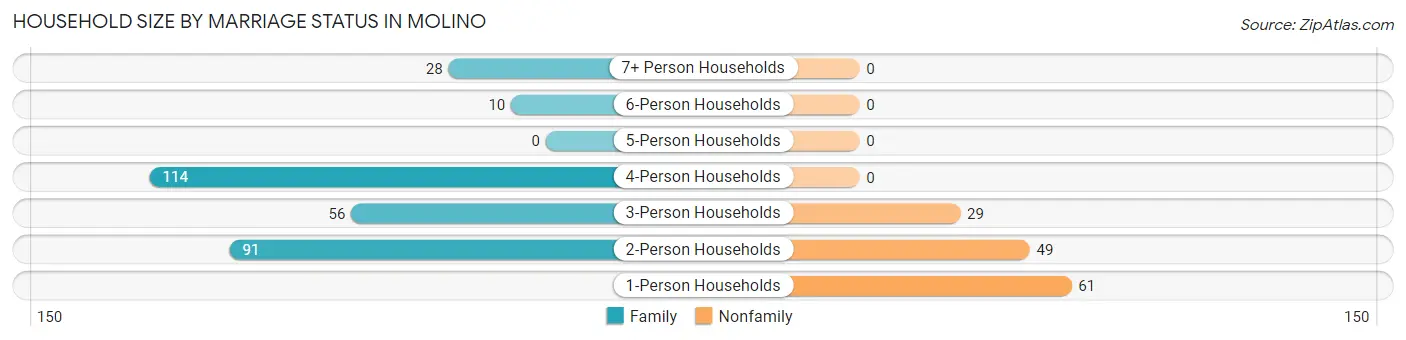
| Household Size | Family Households | Nonfamily Households |
| 1-Person Households | - | 61 (13.9%) |
| 2-Person Households | 91 (20.8%) | 49 (11.2%) |
| 3-Person Households | 56 (12.8%) | 29 (6.6%) |
| 4-Person Households | 114 (26.0%) | 0 (0.0%) |
| 5-Person Households | 0 (0.0%) | 0 (0.0%) |
| 6-Person Households | 10 (2.3%) | 0 (0.0%) |
| 7+ Person Households | 28 (6.4%) | 0 (0.0%) |
| Total | 299 (68.3%) | 139 (31.7%) |
Female Fertility in Molino
Fertility by Age in Molino
| Age Bracket | Women with Births | Births / 1,000 Women |
| 15 to 19 years | 0 (0.0%) | 0.0 |
| 20 to 34 years | 0 (0.0%) | 0.0 |
| 35 to 50 years | 0 (0.0%) | 0.0 |
| Total | 0 (0.0%) | 0.0 |
Fertility by Age by Marriage Status in Molino
| Age Bracket | Married | Unmarried |
| 15 to 19 years | 0 (0.0%) | 0 (0.0%) |
| 20 to 34 years | 0 (0.0%) | 0 (0.0%) |
| 35 to 50 years | 0 (0.0%) | 0 (0.0%) |
| Total | 0 (0.0%) | 0 (0.0%) |
Fertility by Education in Molino
| Educational Attainment | Women with Births | Births / 1,000 Women |
| Less than High School | 0 (0.0%) | 0.0 |
| High School Diploma | 0 (0.0%) | 0.0 |
| College or Associate's Degree | 0 (0.0%) | 0.0 |
| Bachelor's Degree | 0 (0.0%) | 0.0 |
| Graduate Degree | 0 (0.0%) | 0.0 |
| Total | 0 (0.0%) | 0.0 |
Fertility by Education by Marriage Status in Molino
| Educational Attainment | Married | Unmarried |
| Less than High School | 0 (0.0%) | 0 (0.0%) |
| High School Diploma | 0 (0.0%) | 0 (0.0%) |
| College or Associate's Degree | 0 (0.0%) | 0 (0.0%) |
| Bachelor's Degree | 0 (0.0%) | 0 (0.0%) |
| Graduate Degree | 0 (0.0%) | 0 (0.0%) |
| Total | 0 (0.0%) | 0 (0.0%) |
Employment Characteristics in Molino
Employment by Class of Employer in Molino
Among the 773 employed individuals in Molino, private company employees (631 | 81.6%), local government employees (56 | 7.2%), and not-for-profit organizations (36 | 4.7%) make up the most common classes of employment.
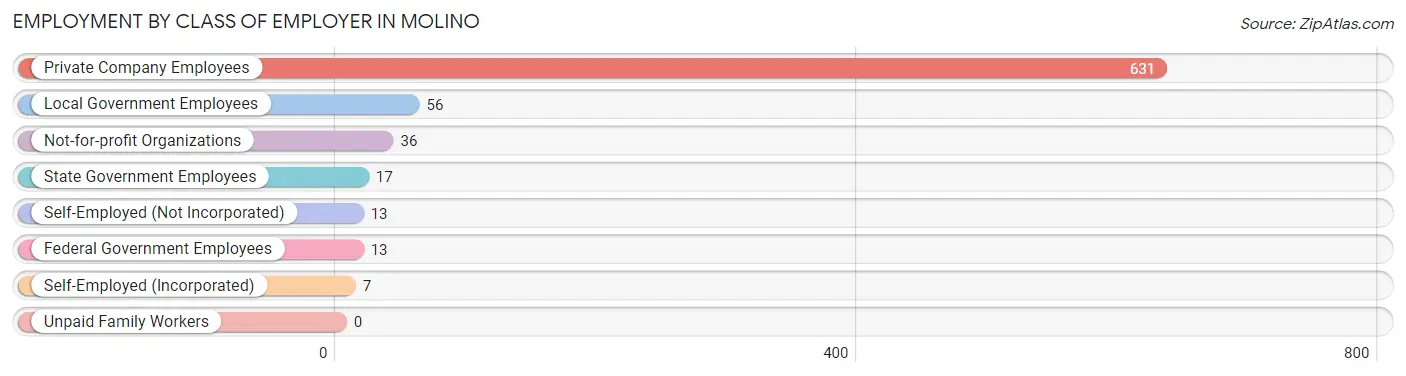
| Employer Class | # Employees | % Employees |
| Private Company Employees | 631 | 81.6% |
| Self-Employed (Incorporated) | 7 | 0.9% |
| Self-Employed (Not Incorporated) | 13 | 1.7% |
| Not-for-profit Organizations | 36 | 4.7% |
| Local Government Employees | 56 | 7.2% |
| State Government Employees | 17 | 2.2% |
| Federal Government Employees | 13 | 1.7% |
| Unpaid Family Workers | 0 | 0.0% |
| Total | 773 | 100.0% |
Employment Status by Age in Molino
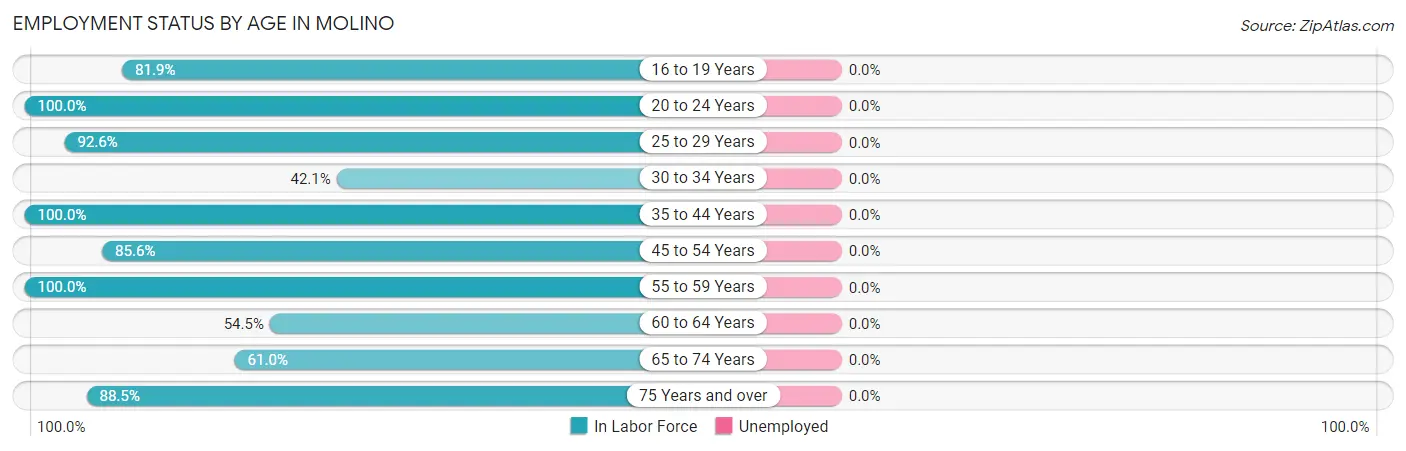
| Age Bracket | In Labor Force | Unemployed |
| 16 to 19 Years | 59 (81.9%) | 0 (0.0%) |
| 20 to 24 Years | 34 (100.0%) | 0 (0.0%) |
| 25 to 29 Years | 150 (92.6%) | 0 (0.0%) |
| 30 to 34 Years | 8 (42.1%) | 0 (0.0%) |
| 35 to 44 Years | 28 (100.0%) | 0 (0.0%) |
| 45 to 54 Years | 267 (85.6%) | 0 (0.0%) |
| 55 to 59 Years | 48 (100.0%) | 0 (0.0%) |
| 60 to 64 Years | 24 (54.5%) | 0 (0.0%) |
| 65 to 74 Years | 86 (61.0%) | 0 (0.0%) |
| 75 Years and over | 69 (88.5%) | 0 (0.0%) |
| Total | 773 (82.4%) | 0 (0.0%) |
Employment Status by Educational Attainment in Molino
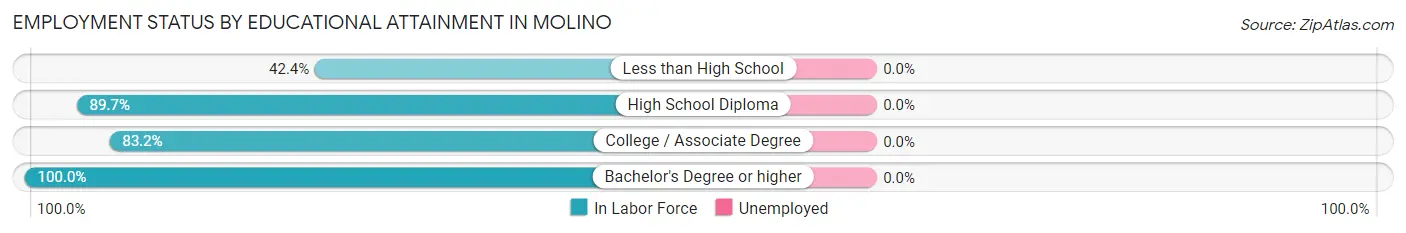
| Educational Attainment | In Labor Force | Unemployed |
| Less than High School | 14 (42.4%) | 0 (0.0%) |
| High School Diploma | 201 (89.7%) | 0 (0.0%) |
| College / Associate Degree | 228 (83.2%) | 0 (0.0%) |
| Bachelor's Degree or higher | 82 (100.0%) | 0 (0.0%) |
| Total | 525 (85.6%) | 0 (0.0%) |
Employment Occupations by Sex in Molino
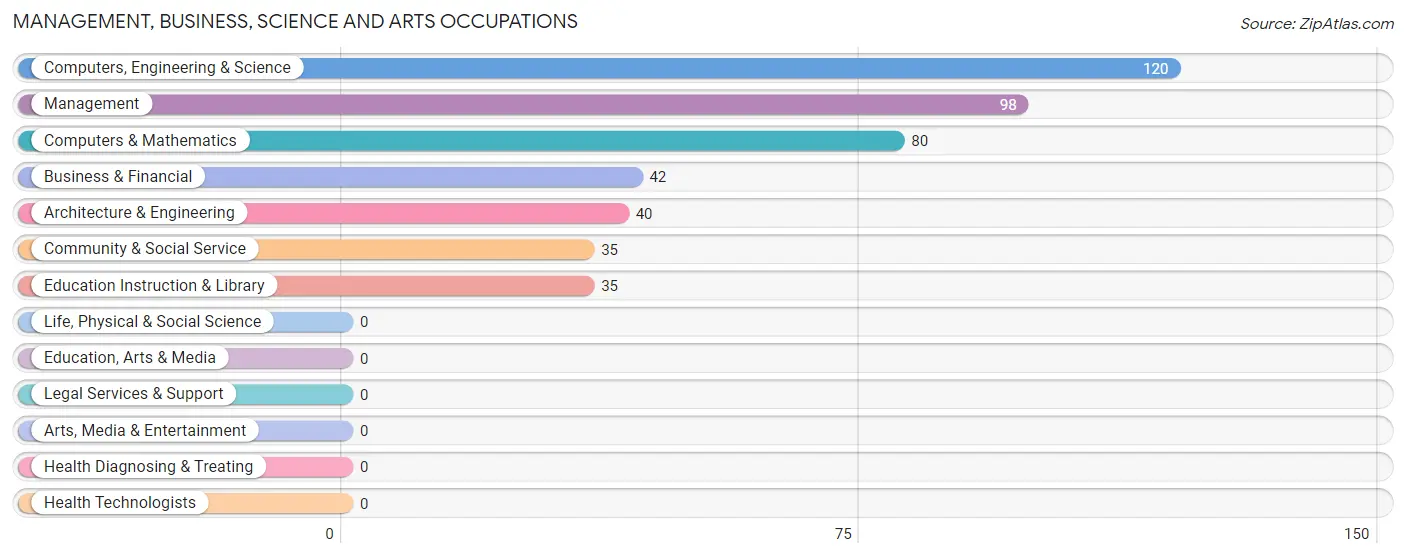
Management, Business, Science and Arts Occupations
The most common Management, Business, Science and Arts occupations in Molino are Computers, Engineering & Science (120 | 15.5%), Management (98 | 12.7%), Computers & Mathematics (80 | 10.3%), Business & Financial (42 | 5.4%), and Architecture & Engineering (40 | 5.2%).
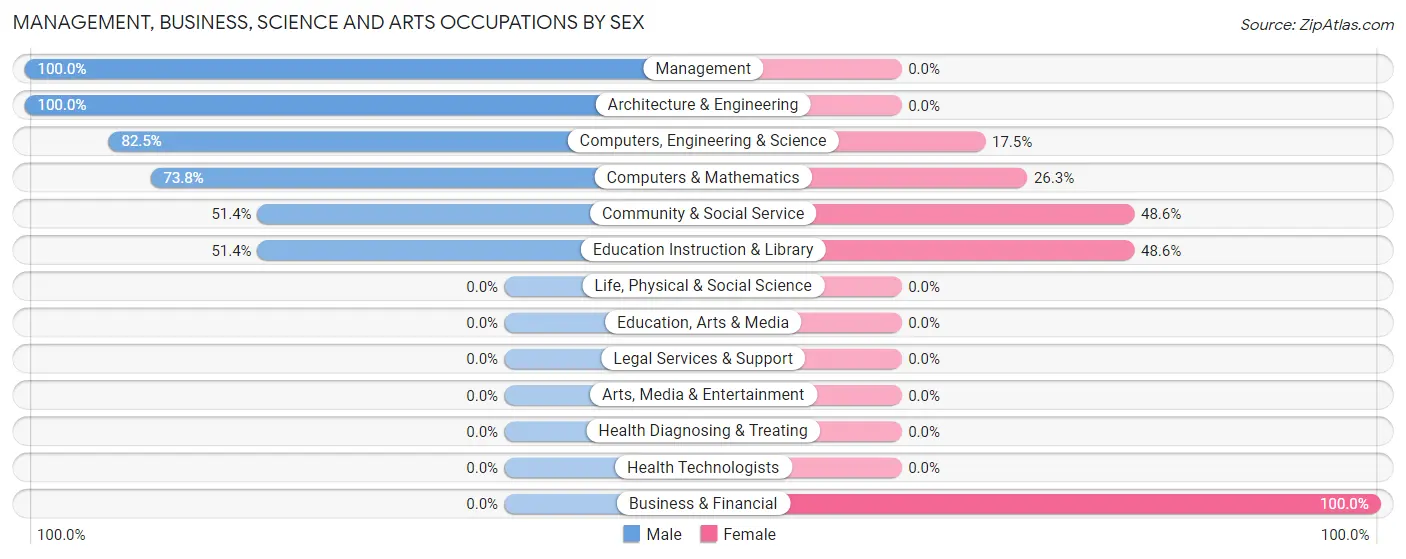
Management, Business, Science and Arts Occupations by Sex
Within the Management, Business, Science and Arts occupations in Molino, the most male-oriented occupations are Management (100.0%), Architecture & Engineering (100.0%), and Computers, Engineering & Science (82.5%), while the most female-oriented occupations are Business & Financial (100.0%), Community & Social Service (48.6%), and Education Instruction & Library (48.6%).
| Occupation | Male | Female |
| Management | 98 (100.0%) | 0 (0.0%) |
| Business & Financial | 0 (0.0%) | 42 (100.0%) |
| Computers, Engineering & Science | 99 (82.5%) | 21 (17.5%) |
| Computers & Mathematics | 59 (73.8%) | 21 (26.3%) |
| Architecture & Engineering | 40 (100.0%) | 0 (0.0%) |
| Life, Physical & Social Science | 0 (0.0%) | 0 (0.0%) |
| Community & Social Service | 18 (51.4%) | 17 (48.6%) |
| Education, Arts & Media | 0 (0.0%) | 0 (0.0%) |
| Legal Services & Support | 0 (0.0%) | 0 (0.0%) |
| Education Instruction & Library | 18 (51.4%) | 17 (48.6%) |
| Arts, Media & Entertainment | 0 (0.0%) | 0 (0.0%) |
| Health Diagnosing & Treating | 0 (0.0%) | 0 (0.0%) |
| Health Technologists | 0 (0.0%) | 0 (0.0%) |
| Total (Category) | 215 (72.9%) | 80 (27.1%) |
| Total (Overall) | 514 (66.5%) | 259 (33.5%) |
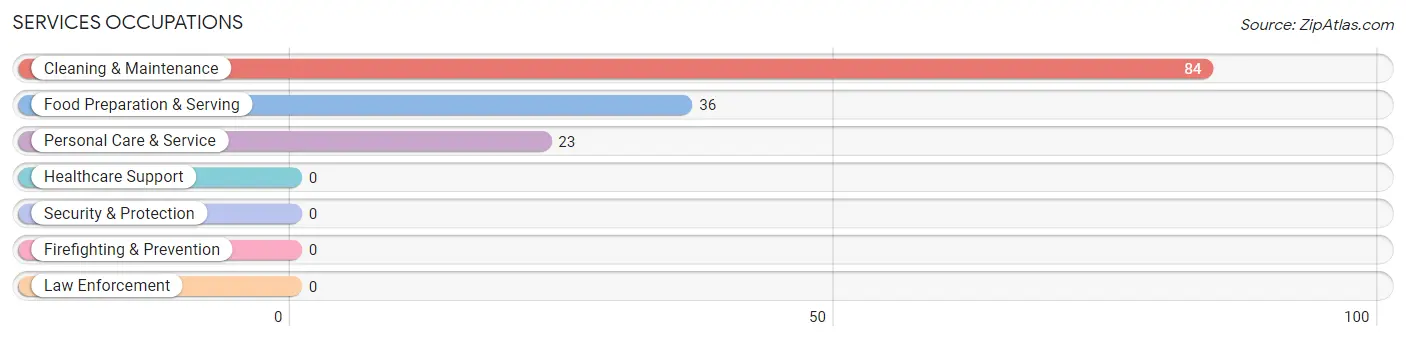
Services Occupations
The most common Services occupations in Molino are Cleaning & Maintenance (84 | 10.9%), Food Preparation & Serving (36 | 4.7%), and Personal Care & Service (23 | 3.0%).
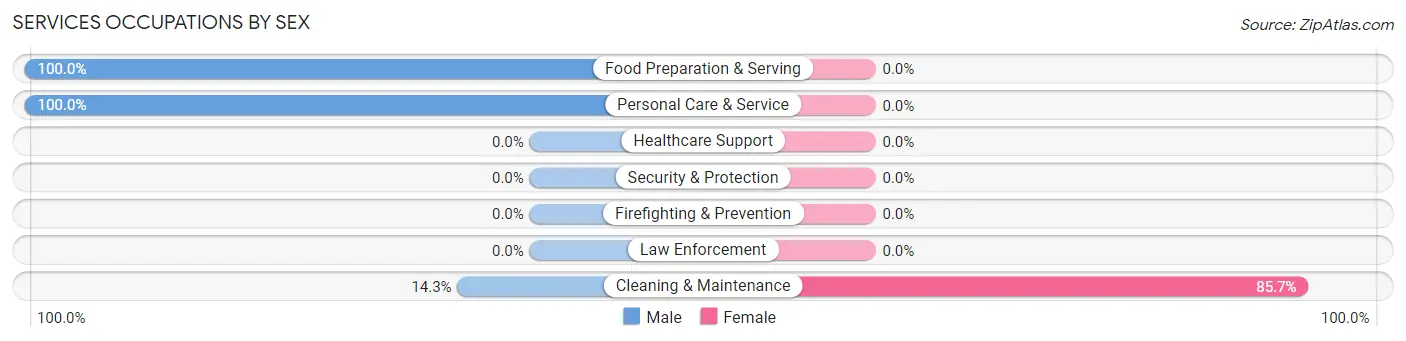
Services Occupations by Sex
| Occupation | Male | Female |
| Healthcare Support | 0 (0.0%) | 0 (0.0%) |
| Security & Protection | 0 (0.0%) | 0 (0.0%) |
| Firefighting & Prevention | 0 (0.0%) | 0 (0.0%) |
| Law Enforcement | 0 (0.0%) | 0 (0.0%) |
| Food Preparation & Serving | 36 (100.0%) | 0 (0.0%) |
| Cleaning & Maintenance | 12 (14.3%) | 72 (85.7%) |
| Personal Care & Service | 23 (100.0%) | 0 (0.0%) |
| Total (Category) | 71 (49.6%) | 72 (50.3%) |
| Total (Overall) | 514 (66.5%) | 259 (33.5%) |
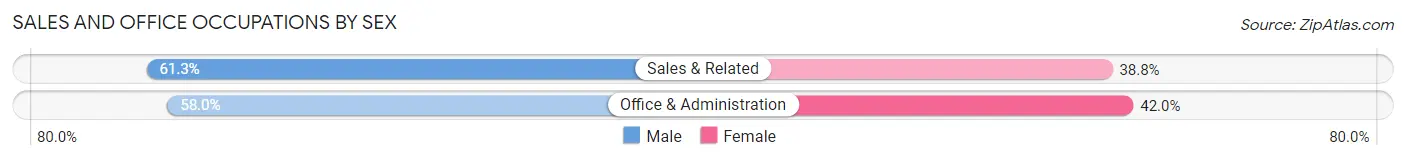
Sales and Office Occupations
The most common Sales and Office occupations in Molino are Office & Administration (112 | 14.5%), and Sales & Related (80 | 10.3%).
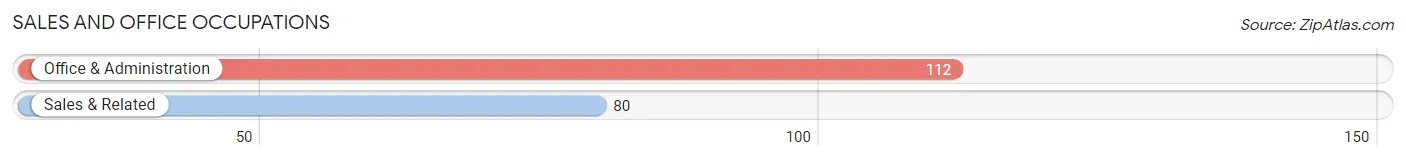
Sales and Office Occupations by Sex
| Occupation | Male | Female |
| Sales & Related | 49 (61.3%) | 31 (38.8%) |
| Office & Administration | 65 (58.0%) | 47 (42.0%) |
| Total (Category) | 114 (59.4%) | 78 (40.6%) |
| Total (Overall) | 514 (66.5%) | 259 (33.5%) |
Natural Resources, Construction and Maintenance Occupations
The most common Natural Resources, Construction and Maintenance occupations in Molino are Construction & Extraction (70 | 9.1%), and Installation, Maintenance & Repair (13 | 1.7%).
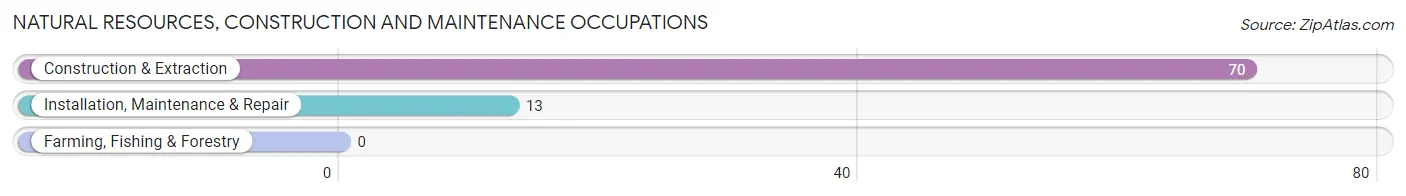
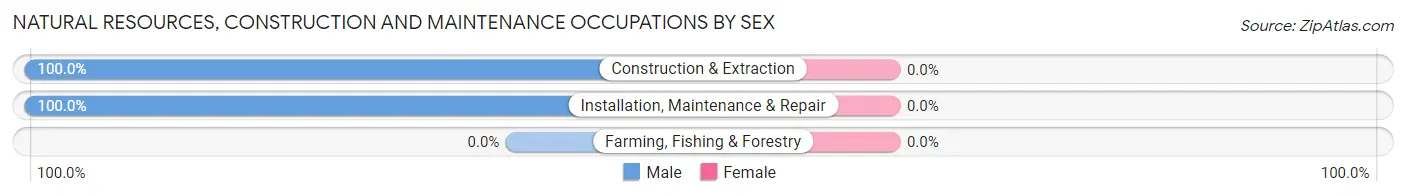
Natural Resources, Construction and Maintenance Occupations by Sex
| Occupation | Male | Female |
| Farming, Fishing & Forestry | 0 (0.0%) | 0 (0.0%) |
| Construction & Extraction | 70 (100.0%) | 0 (0.0%) |
| Installation, Maintenance & Repair | 13 (100.0%) | 0 (0.0%) |
| Total (Category) | 83 (100.0%) | 0 (0.0%) |
| Total (Overall) | 514 (66.5%) | 259 (33.5%) |
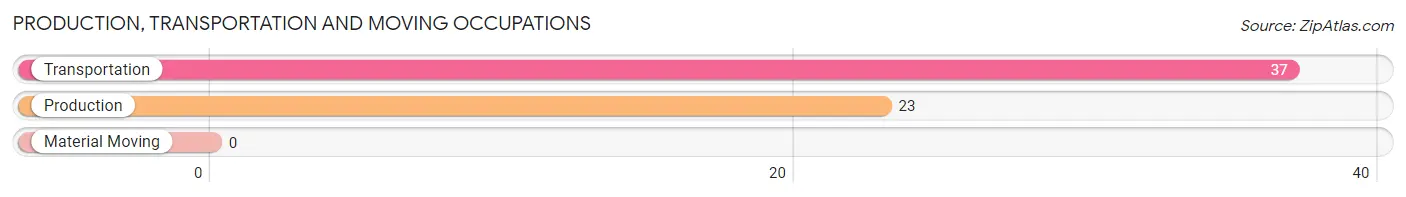
Production, Transportation and Moving Occupations
The most common Production, Transportation and Moving occupations in Molino are Transportation (37 | 4.8%), and Production (23 | 3.0%).
Production, Transportation and Moving Occupations by Sex
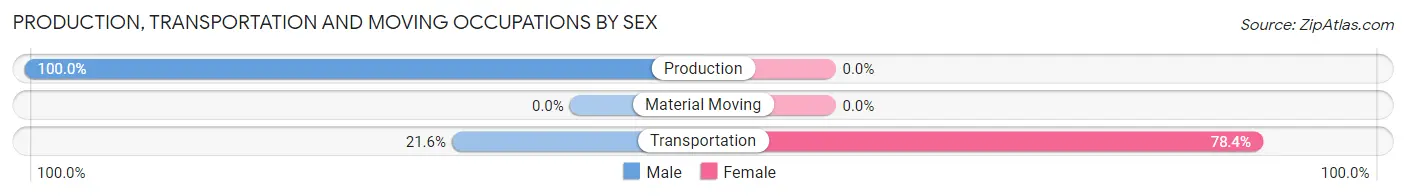
| Occupation | Male | Female |
| Production | 23 (100.0%) | 0 (0.0%) |
| Transportation | 8 (21.6%) | 29 (78.4%) |
| Material Moving | 0 (0.0%) | 0 (0.0%) |
| Total (Category) | 31 (51.7%) | 29 (48.3%) |
| Total (Overall) | 514 (66.5%) | 259 (33.5%) |
Employment Industries by Sex in Molino
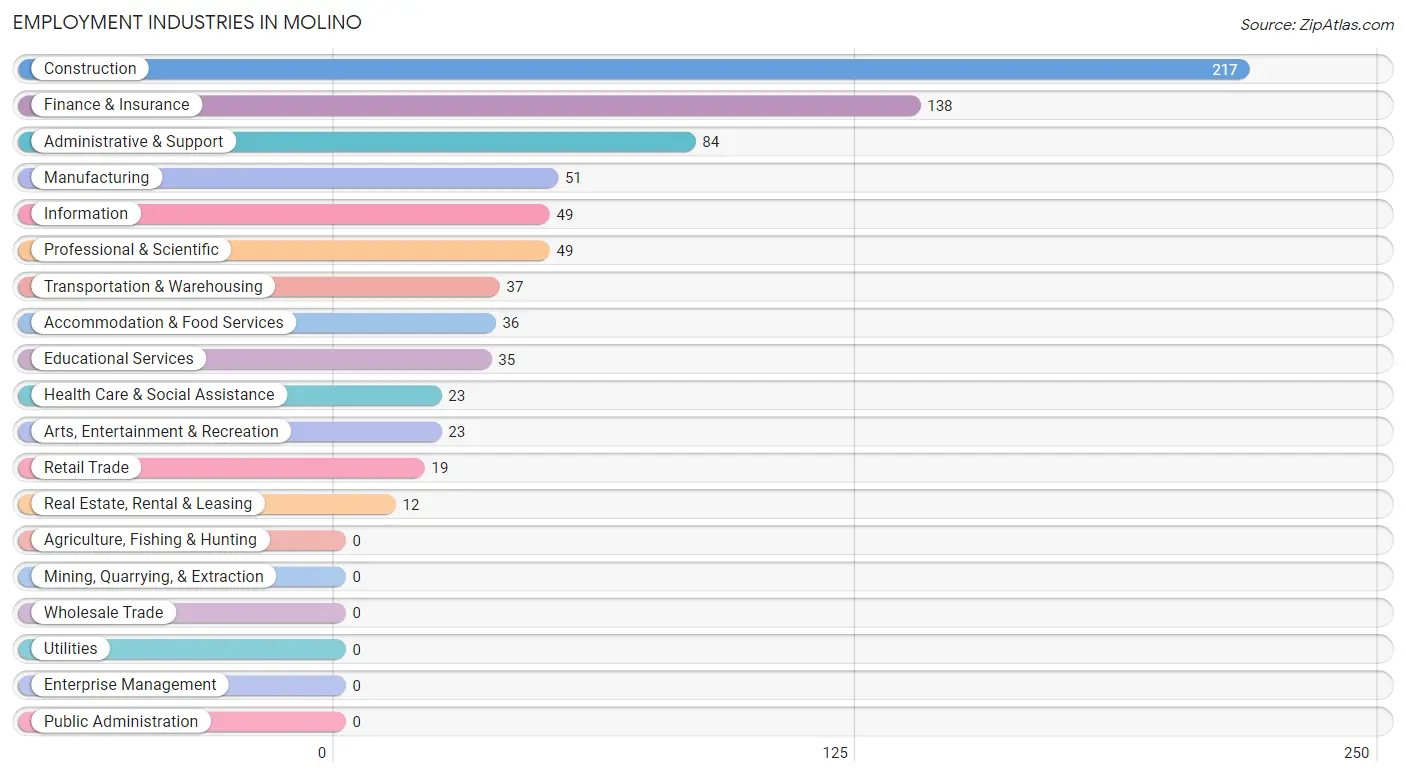
Employment Industries in Molino
The major employment industries in Molino include Construction (217 | 28.1%), Finance & Insurance (138 | 17.8%), Administrative & Support (84 | 10.9%), Manufacturing (51 | 6.6%), and Information (49 | 6.3%).
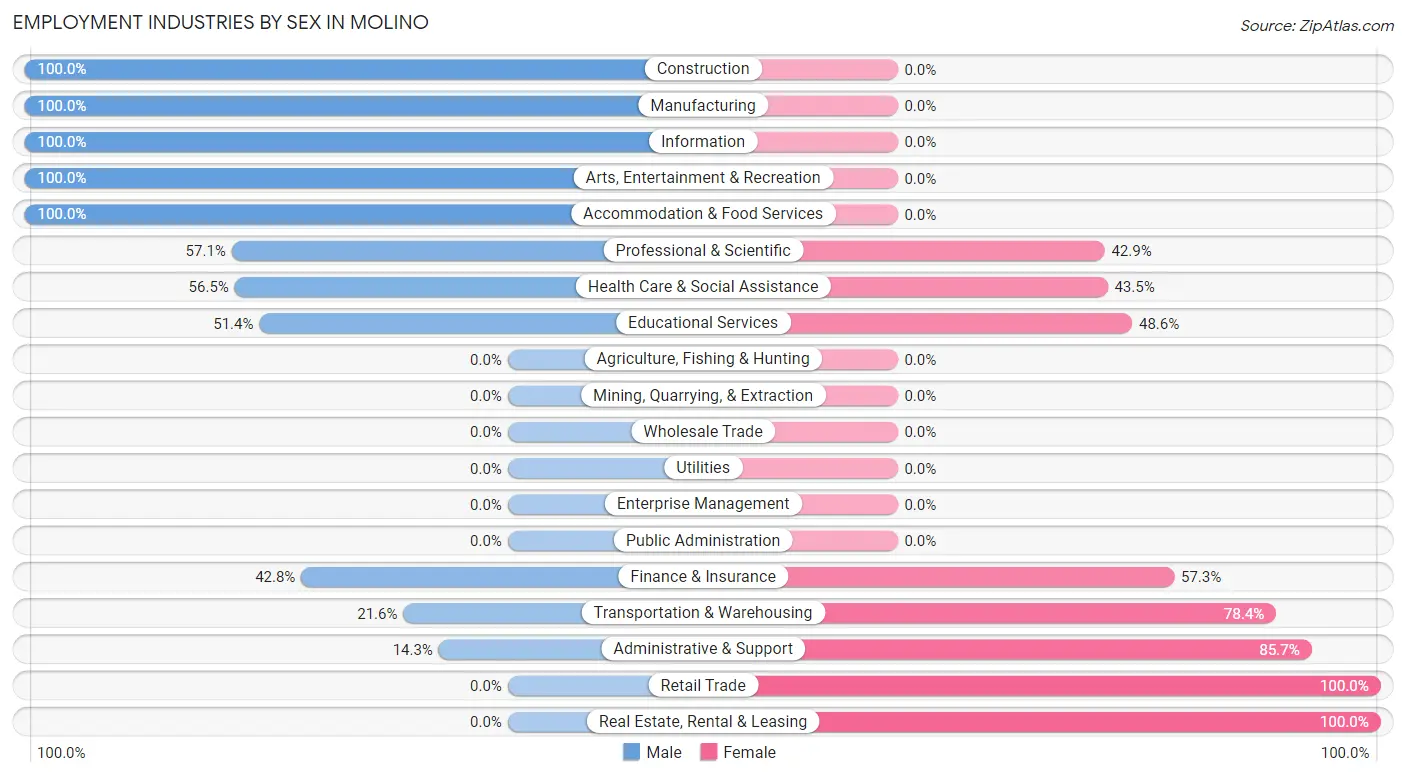
Employment Industries by Sex in Molino
The Molino industries that see more men than women are Construction (100.0%), Manufacturing (100.0%), and Information (100.0%), whereas the industries that tend to have a higher number of women are Retail Trade (100.0%), Real Estate, Rental & Leasing (100.0%), and Administrative & Support (85.7%).
| Industry | Male | Female |
| Agriculture, Fishing & Hunting | 0 (0.0%) | 0 (0.0%) |
| Mining, Quarrying, & Extraction | 0 (0.0%) | 0 (0.0%) |
| Construction | 217 (100.0%) | 0 (0.0%) |
| Manufacturing | 51 (100.0%) | 0 (0.0%) |
| Wholesale Trade | 0 (0.0%) | 0 (0.0%) |
| Retail Trade | 0 (0.0%) | 19 (100.0%) |
| Transportation & Warehousing | 8 (21.6%) | 29 (78.4%) |
| Utilities | 0 (0.0%) | 0 (0.0%) |
| Information | 49 (100.0%) | 0 (0.0%) |
| Finance & Insurance | 59 (42.7%) | 79 (57.3%) |
| Real Estate, Rental & Leasing | 0 (0.0%) | 12 (100.0%) |
| Professional & Scientific | 28 (57.1%) | 21 (42.9%) |
| Enterprise Management | 0 (0.0%) | 0 (0.0%) |
| Administrative & Support | 12 (14.3%) | 72 (85.7%) |
| Educational Services | 18 (51.4%) | 17 (48.6%) |
| Health Care & Social Assistance | 13 (56.5%) | 10 (43.5%) |
| Arts, Entertainment & Recreation | 23 (100.0%) | 0 (0.0%) |
| Accommodation & Food Services | 36 (100.0%) | 0 (0.0%) |
| Public Administration | 0 (0.0%) | 0 (0.0%) |
| Total | 514 (66.5%) | 259 (33.5%) |
Education in Molino
School Enrollment in Molino
The most common levels of schooling among the 357 students in Molino are high school (114 | 31.9%), college / undergraduate (90 | 25.2%), and elementary school (77 | 21.6%).
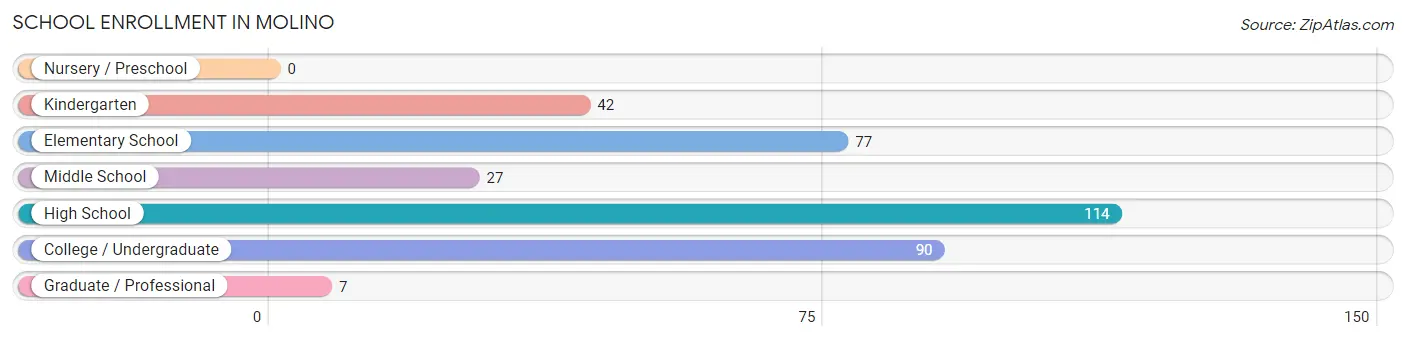
| School Level | # Students | % Students |
| Nursery / Preschool | 0 | 0.0% |
| Kindergarten | 42 | 11.8% |
| Elementary School | 77 | 21.6% |
| Middle School | 27 | 7.6% |
| High School | 114 | 31.9% |
| College / Undergraduate | 90 | 25.2% |
| Graduate / Professional | 7 | 2.0% |
| Total | 357 | 100.0% |
School Enrollment by Age by Funding Source in Molino
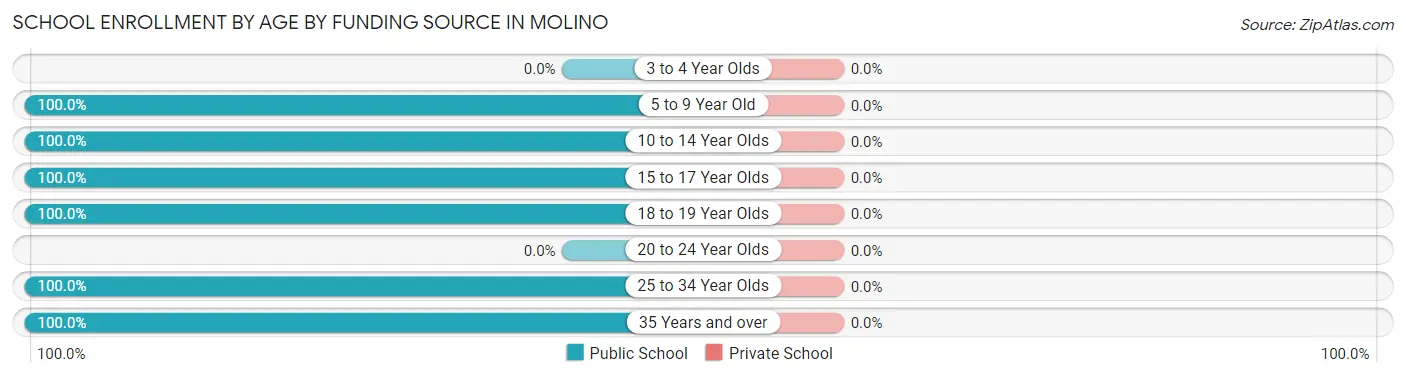
| Age Bracket | Public School | Private School |
| 3 to 4 Year Olds | 0 (0.0%) | 0 (0.0%) |
| 5 to 9 Year Old | 69 (100.0%) | 0 (0.0%) |
| 10 to 14 Year Olds | 107 (100.0%) | 0 (0.0%) |
| 15 to 17 Year Olds | 89 (100.0%) | 0 (0.0%) |
| 18 to 19 Year Olds | 36 (100.0%) | 0 (0.0%) |
| 20 to 24 Year Olds | 0 (0.0%) | 0 (0.0%) |
| 25 to 34 Year Olds | 49 (100.0%) | 0 (0.0%) |
| 35 Years and over | 7 (100.0%) | 0 (0.0%) |
| Total | 357 (100.0%) | 0 (0.0%) |
Educational Attainment by Field of Study in Molino
Education (54 | 29.7%), arts & humanities (47 | 25.8%), computers & mathematics (38 | 20.9%), psychology (35 | 19.2%), and visual & performing arts (8 | 4.4%) are the most common fields of study among 182 individuals in Molino who have obtained a bachelor's degree or higher.
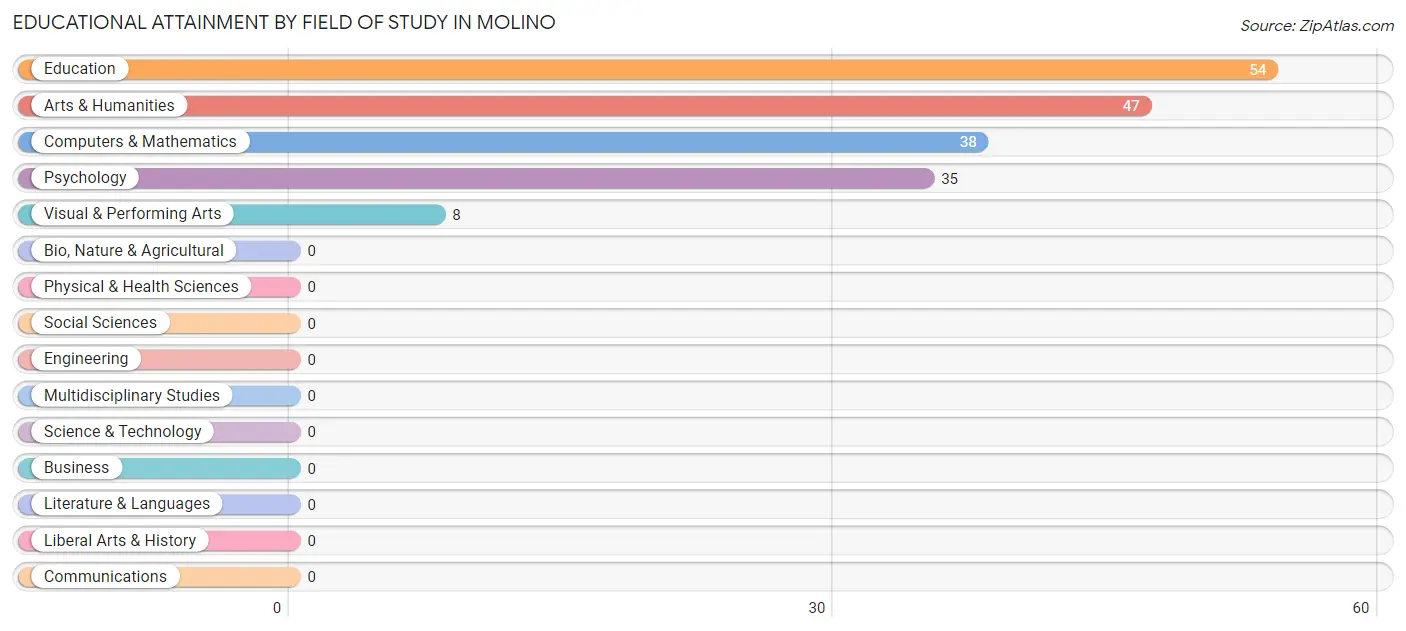
| Field of Study | # Graduates | % Graduates |
| Computers & Mathematics | 38 | 20.9% |
| Bio, Nature & Agricultural | 0 | 0.0% |
| Physical & Health Sciences | 0 | 0.0% |
| Psychology | 35 | 19.2% |
| Social Sciences | 0 | 0.0% |
| Engineering | 0 | 0.0% |
| Multidisciplinary Studies | 0 | 0.0% |
| Science & Technology | 0 | 0.0% |
| Business | 0 | 0.0% |
| Education | 54 | 29.7% |
| Literature & Languages | 0 | 0.0% |
| Liberal Arts & History | 0 | 0.0% |
| Visual & Performing Arts | 8 | 4.4% |
| Communications | 0 | 0.0% |
| Arts & Humanities | 47 | 25.8% |
| Total | 182 | 100.0% |
Transportation & Commute in Molino
Vehicle Availability by Sex in Molino
The most prevalent vehicle ownership categories in Molino are males with 2 vehicles (257, accounting for 50.0%) and females with 2 vehicles (122, making up 99.2%).
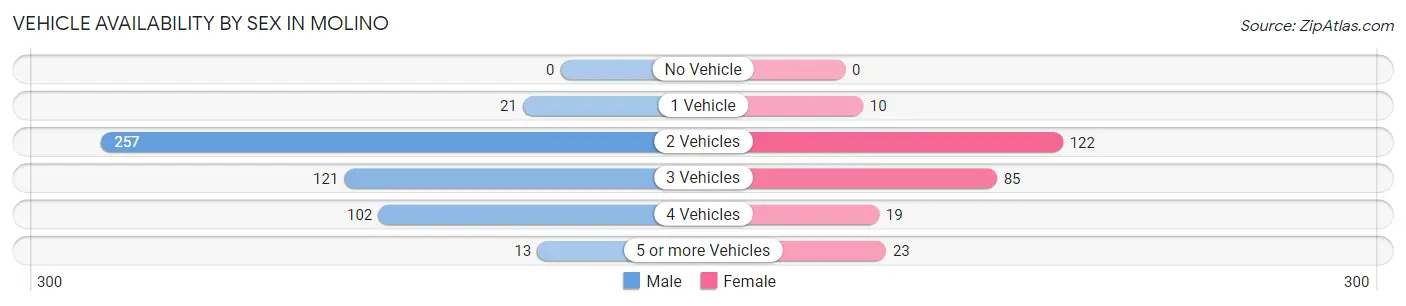
| Vehicles Available | Male | Female |
| No Vehicle | 0 (0.0%) | 0 (0.0%) |
| 1 Vehicle | 21 (4.1%) | 10 (3.9%) |
| 2 Vehicles | 257 (50.0%) | 122 (47.1%) |
| 3 Vehicles | 121 (23.5%) | 85 (32.8%) |
| 4 Vehicles | 102 (19.8%) | 19 (7.3%) |
| 5 or more Vehicles | 13 (2.5%) | 23 (8.9%) |
| Total | 514 (100.0%) | 259 (100.0%) |
Commute Time in Molino
The most frequently occuring commute durations in Molino are 15 to 19 minutes (157 commuters, 23.1%), 30 to 34 minutes (132 commuters, 19.4%), and 35 to 39 minutes (100 commuters, 14.7%).
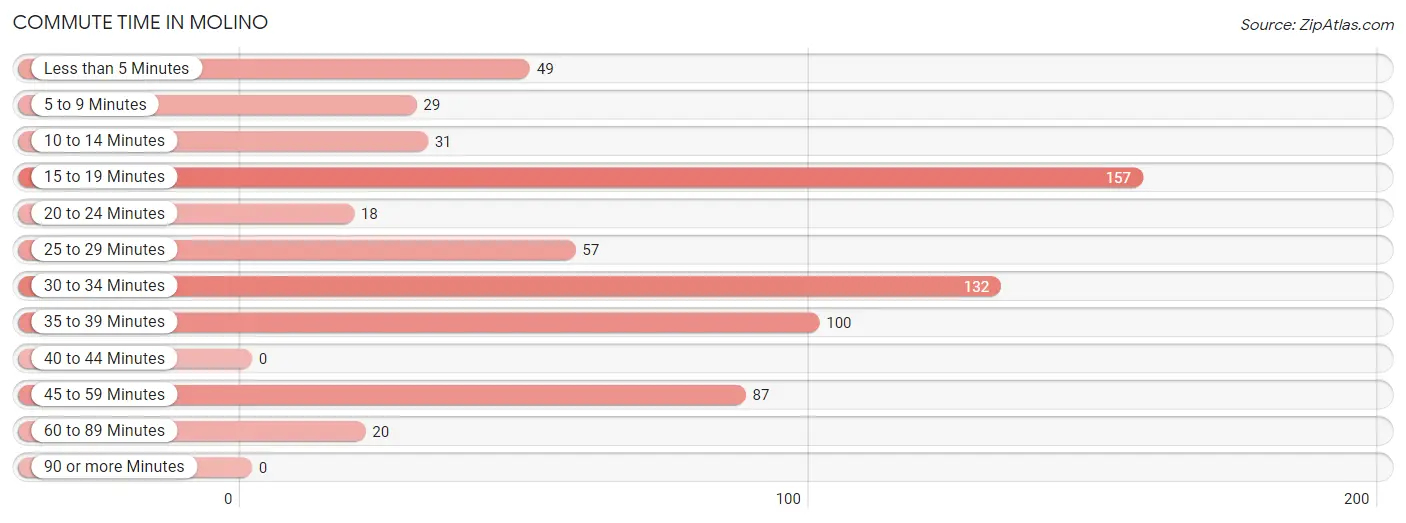
| Commute Time | # Commuters | % Commuters |
| Less than 5 Minutes | 49 | 7.2% |
| 5 to 9 Minutes | 29 | 4.3% |
| 10 to 14 Minutes | 31 | 4.6% |
| 15 to 19 Minutes | 157 | 23.1% |
| 20 to 24 Minutes | 18 | 2.6% |
| 25 to 29 Minutes | 57 | 8.4% |
| 30 to 34 Minutes | 132 | 19.4% |
| 35 to 39 Minutes | 100 | 14.7% |
| 40 to 44 Minutes | 0 | 0.0% |
| 45 to 59 Minutes | 87 | 12.8% |
| 60 to 89 Minutes | 20 | 2.9% |
| 90 or more Minutes | 0 | 0.0% |
Commute Time by Sex in Molino
The most common commute times in Molino are 15 to 19 minutes (157 commuters, 33.8%) for males and 30 to 34 minutes (85 commuters, 39.5%) for females.
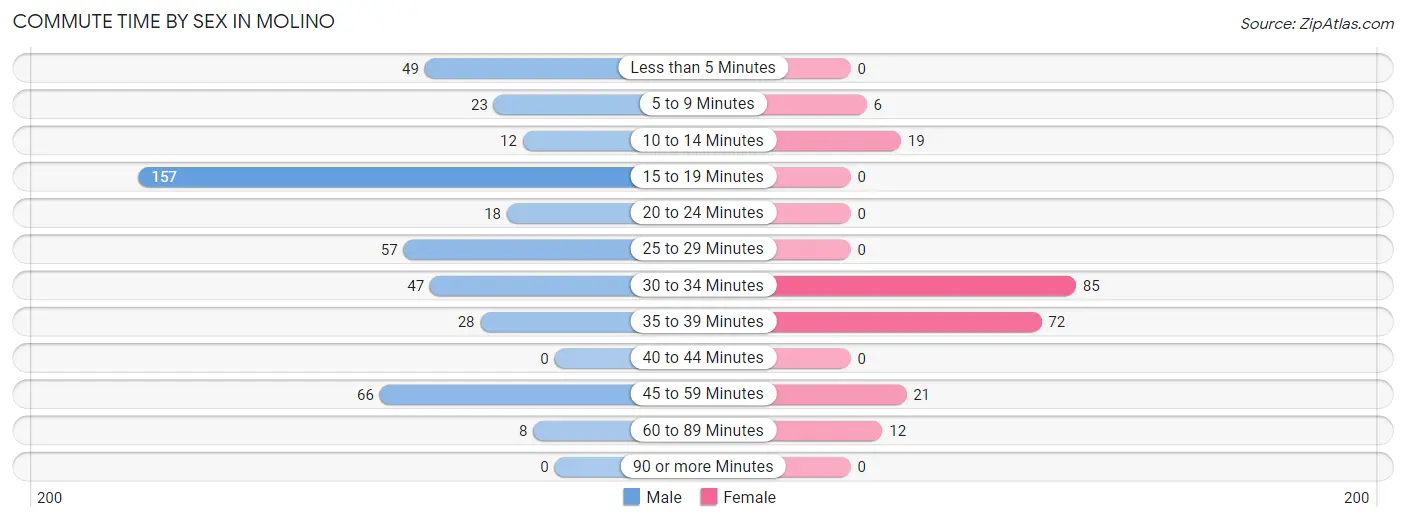
| Commute Time | Male | Female |
| Less than 5 Minutes | 49 (10.5%) | 0 (0.0%) |
| 5 to 9 Minutes | 23 (5.0%) | 6 (2.8%) |
| 10 to 14 Minutes | 12 (2.6%) | 19 (8.8%) |
| 15 to 19 Minutes | 157 (33.8%) | 0 (0.0%) |
| 20 to 24 Minutes | 18 (3.9%) | 0 (0.0%) |
| 25 to 29 Minutes | 57 (12.3%) | 0 (0.0%) |
| 30 to 34 Minutes | 47 (10.1%) | 85 (39.5%) |
| 35 to 39 Minutes | 28 (6.0%) | 72 (33.5%) |
| 40 to 44 Minutes | 0 (0.0%) | 0 (0.0%) |
| 45 to 59 Minutes | 66 (14.2%) | 21 (9.8%) |
| 60 to 89 Minutes | 8 (1.7%) | 12 (5.6%) |
| 90 or more Minutes | 0 (0.0%) | 0 (0.0%) |
Time of Departure to Work by Sex in Molino
The most frequent times of departure to work in Molino are 6:00 AM to 6:29 AM (112, 24.1%) for males and 6:00 AM to 6:29 AM (114, 53.0%) for females.
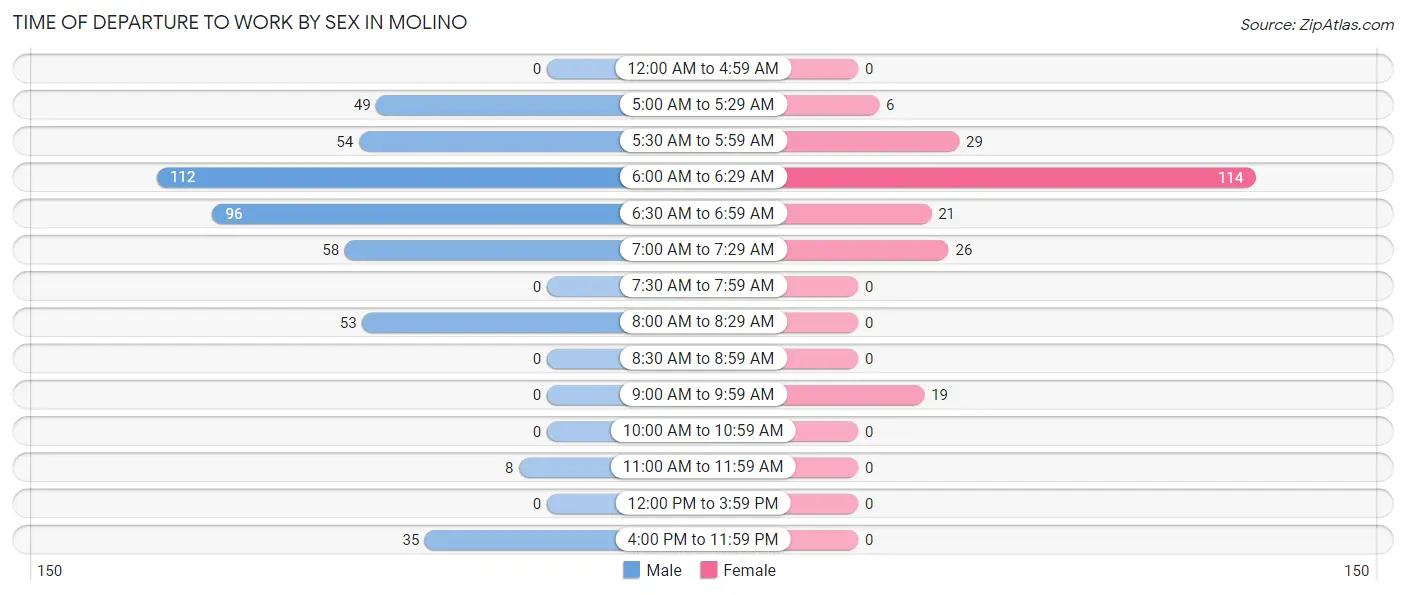
| Time of Departure | Male | Female |
| 12:00 AM to 4:59 AM | 0 (0.0%) | 0 (0.0%) |
| 5:00 AM to 5:29 AM | 49 (10.5%) | 6 (2.8%) |
| 5:30 AM to 5:59 AM | 54 (11.6%) | 29 (13.5%) |
| 6:00 AM to 6:29 AM | 112 (24.1%) | 114 (53.0%) |
| 6:30 AM to 6:59 AM | 96 (20.6%) | 21 (9.8%) |
| 7:00 AM to 7:29 AM | 58 (12.5%) | 26 (12.1%) |
| 7:30 AM to 7:59 AM | 0 (0.0%) | 0 (0.0%) |
| 8:00 AM to 8:29 AM | 53 (11.4%) | 0 (0.0%) |
| 8:30 AM to 8:59 AM | 0 (0.0%) | 0 (0.0%) |
| 9:00 AM to 9:59 AM | 0 (0.0%) | 19 (8.8%) |
| 10:00 AM to 10:59 AM | 0 (0.0%) | 0 (0.0%) |
| 11:00 AM to 11:59 AM | 8 (1.7%) | 0 (0.0%) |
| 12:00 PM to 3:59 PM | 0 (0.0%) | 0 (0.0%) |
| 4:00 PM to 11:59 PM | 35 (7.5%) | 0 (0.0%) |
| Total | 465 (100.0%) | 215 (100.0%) |
Housing Occupancy in Molino
Occupancy by Ownership in Molino
Of the total 438 dwellings in Molino, owner-occupied units account for 330 (75.3%), while renter-occupied units make up 108 (24.7%).
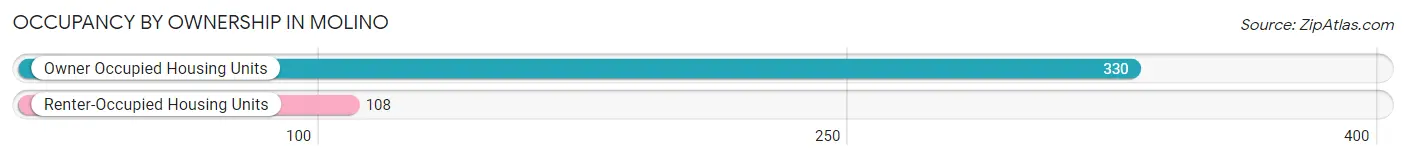
| Occupancy | # Housing Units | % Housing Units |
| Owner Occupied Housing Units | 330 | 75.3% |
| Renter-Occupied Housing Units | 108 | 24.7% |
| Total Occupied Housing Units | 438 | 100.0% |
Occupancy by Household Size in Molino
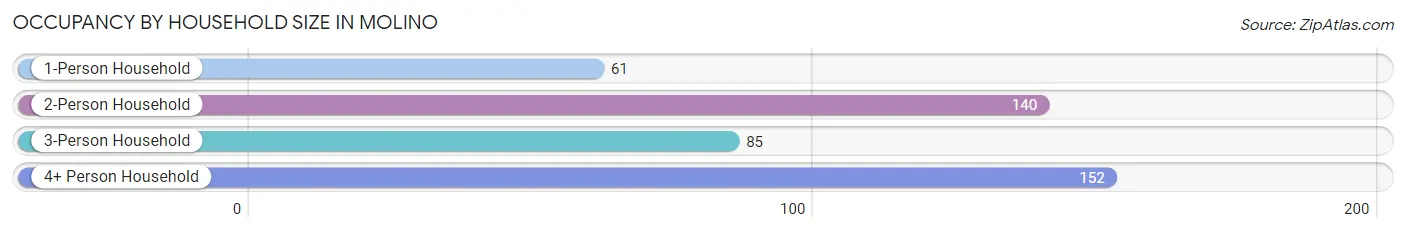
| Household Size | # Housing Units | % Housing Units |
| 1-Person Household | 61 | 13.9% |
| 2-Person Household | 140 | 32.0% |
| 3-Person Household | 85 | 19.4% |
| 4+ Person Household | 152 | 34.7% |
| Total Housing Units | 438 | 100.0% |
Occupancy by Ownership by Household Size in Molino
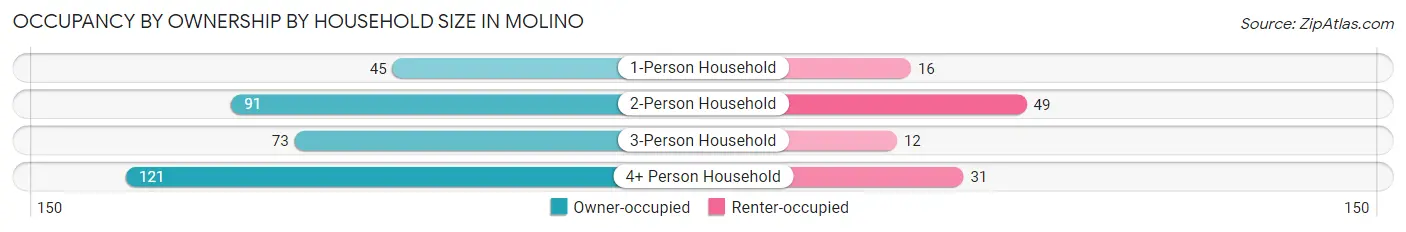
| Household Size | Owner-occupied | Renter-occupied |
| 1-Person Household | 45 (73.8%) | 16 (26.2%) |
| 2-Person Household | 91 (65.0%) | 49 (35.0%) |
| 3-Person Household | 73 (85.9%) | 12 (14.1%) |
| 4+ Person Household | 121 (79.6%) | 31 (20.4%) |
| Total Housing Units | 330 (75.3%) | 108 (24.7%) |
Occupancy by Educational Attainment in Molino
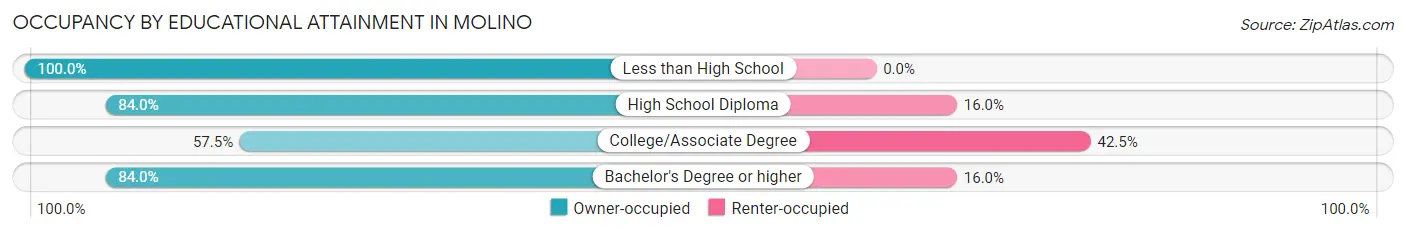
| Household Size | Owner-occupied | Renter-occupied |
| Less than High School | 28 (100.0%) | 0 (0.0%) |
| High School Diploma | 147 (84.0%) | 28 (16.0%) |
| College/Associate Degree | 92 (57.5%) | 68 (42.5%) |
| Bachelor's Degree or higher | 63 (84.0%) | 12 (16.0%) |
Occupancy by Age of Householder in Molino
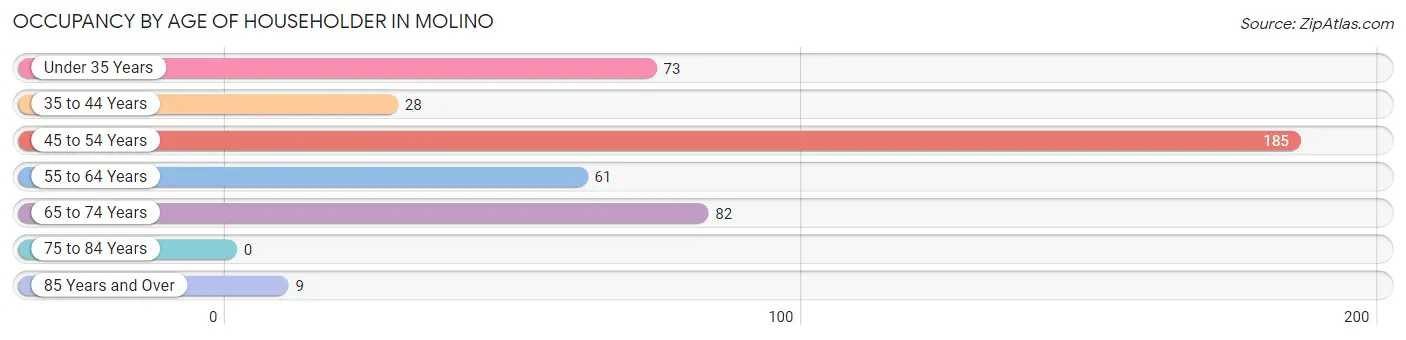
| Age Bracket | # Households | % Households |
| Under 35 Years | 73 | 16.7% |
| 35 to 44 Years | 28 | 6.4% |
| 45 to 54 Years | 185 | 42.2% |
| 55 to 64 Years | 61 | 13.9% |
| 65 to 74 Years | 82 | 18.7% |
| 75 to 84 Years | 0 | 0.0% |
| 85 Years and Over | 9 | 2.1% |
| Total | 438 | 100.0% |
Housing Finances in Molino
Median Income by Occupancy in Molino
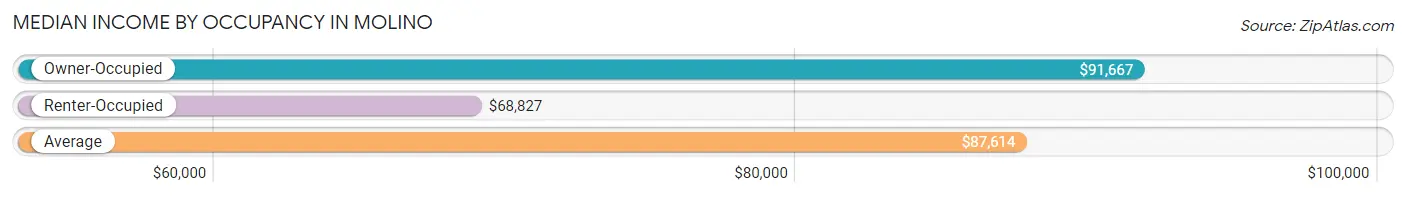
| Occupancy Type | # Households | Median Income |
| Owner-Occupied | 330 (75.3%) | $91,667 |
| Renter-Occupied | 108 (24.7%) | $68,827 |
| Average | 438 (100.0%) | $87,614 |
Occupancy by Householder Income Bracket in Molino
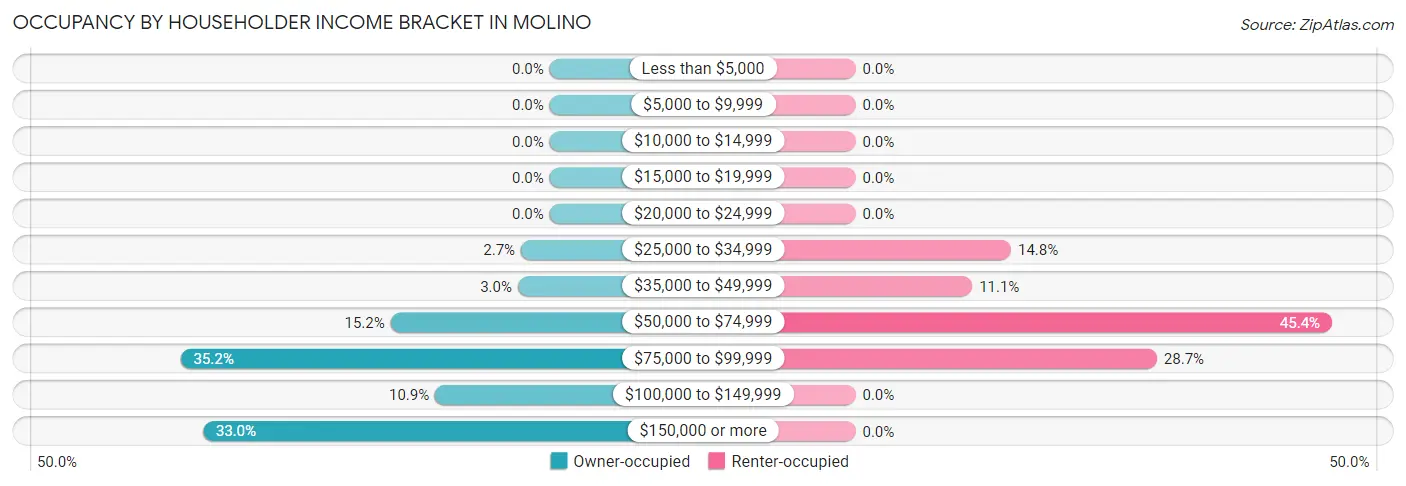
| Income Bracket | Owner-occupied | Renter-occupied |
| Less than $5,000 | 0 (0.0%) | 0 (0.0%) |
| $5,000 to $9,999 | 0 (0.0%) | 0 (0.0%) |
| $10,000 to $14,999 | 0 (0.0%) | 0 (0.0%) |
| $15,000 to $19,999 | 0 (0.0%) | 0 (0.0%) |
| $20,000 to $24,999 | 0 (0.0%) | 0 (0.0%) |
| $25,000 to $34,999 | 9 (2.7%) | 16 (14.8%) |
| $35,000 to $49,999 | 10 (3.0%) | 12 (11.1%) |
| $50,000 to $74,999 | 50 (15.1%) | 49 (45.4%) |
| $75,000 to $99,999 | 116 (35.1%) | 31 (28.7%) |
| $100,000 to $149,999 | 36 (10.9%) | 0 (0.0%) |
| $150,000 or more | 109 (33.0%) | 0 (0.0%) |
| Total | 330 (100.0%) | 108 (100.0%) |
Monthly Housing Cost Tiers in Molino
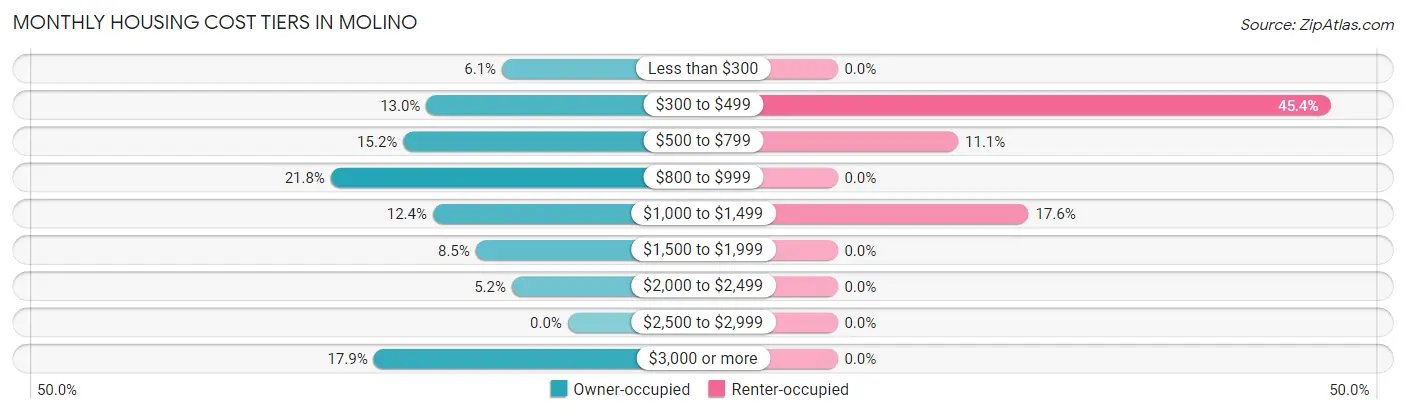
| Monthly Cost | Owner-occupied | Renter-occupied |
| Less than $300 | 20 (6.1%) | 0 (0.0%) |
| $300 to $499 | 43 (13.0%) | 49 (45.4%) |
| $500 to $799 | 50 (15.1%) | 12 (11.1%) |
| $800 to $999 | 72 (21.8%) | 0 (0.0%) |
| $1,000 to $1,499 | 41 (12.4%) | 19 (17.6%) |
| $1,500 to $1,999 | 28 (8.5%) | 0 (0.0%) |
| $2,000 to $2,499 | 17 (5.1%) | 0 (0.0%) |
| $2,500 to $2,999 | 0 (0.0%) | 0 (0.0%) |
| $3,000 or more | 59 (17.9%) | 0 (0.0%) |
| Total | 330 (100.0%) | 108 (100.0%) |
Physical Housing Characteristics in Molino
Housing Structures in Molino
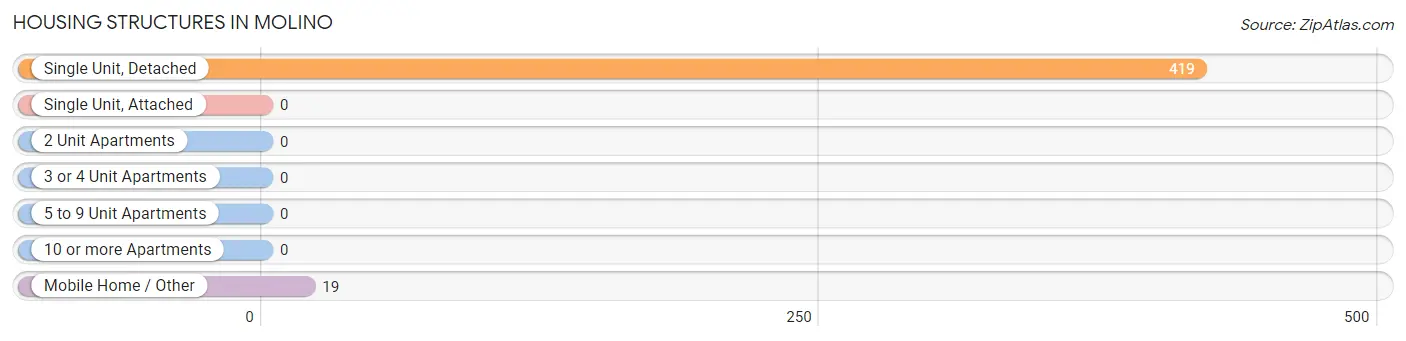
| Structure Type | # Housing Units | % Housing Units |
| Single Unit, Detached | 419 | 95.7% |
| Single Unit, Attached | 0 | 0.0% |
| 2 Unit Apartments | 0 | 0.0% |
| 3 or 4 Unit Apartments | 0 | 0.0% |
| 5 to 9 Unit Apartments | 0 | 0.0% |
| 10 or more Apartments | 0 | 0.0% |
| Mobile Home / Other | 19 | 4.3% |
| Total | 438 | 100.0% |
Housing Structures by Occupancy in Molino
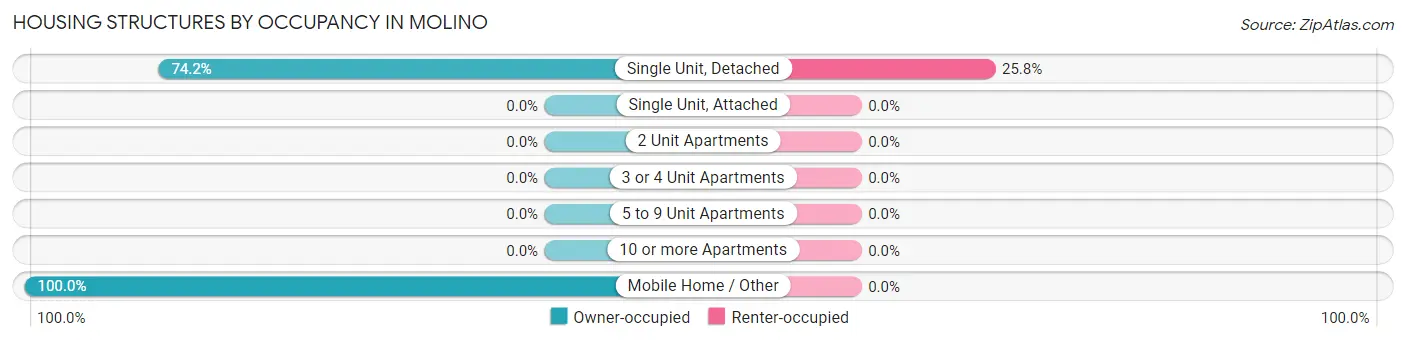
| Structure Type | Owner-occupied | Renter-occupied |
| Single Unit, Detached | 311 (74.2%) | 108 (25.8%) |
| Single Unit, Attached | 0 (0.0%) | 0 (0.0%) |
| 2 Unit Apartments | 0 (0.0%) | 0 (0.0%) |
| 3 or 4 Unit Apartments | 0 (0.0%) | 0 (0.0%) |
| 5 to 9 Unit Apartments | 0 (0.0%) | 0 (0.0%) |
| 10 or more Apartments | 0 (0.0%) | 0 (0.0%) |
| Mobile Home / Other | 19 (100.0%) | 0 (0.0%) |
| Total | 330 (75.3%) | 108 (24.7%) |
Housing Structures by Number of Rooms in Molino
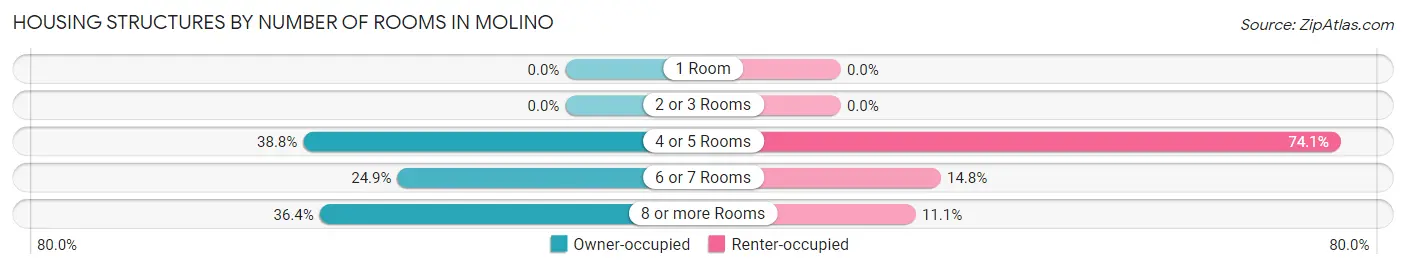
| Number of Rooms | Owner-occupied | Renter-occupied |
| 1 Room | 0 (0.0%) | 0 (0.0%) |
| 2 or 3 Rooms | 0 (0.0%) | 0 (0.0%) |
| 4 or 5 Rooms | 128 (38.8%) | 80 (74.1%) |
| 6 or 7 Rooms | 82 (24.8%) | 16 (14.8%) |
| 8 or more Rooms | 120 (36.4%) | 12 (11.1%) |
| Total | 330 (100.0%) | 108 (100.0%) |
Housing Structure by Heating Type in Molino
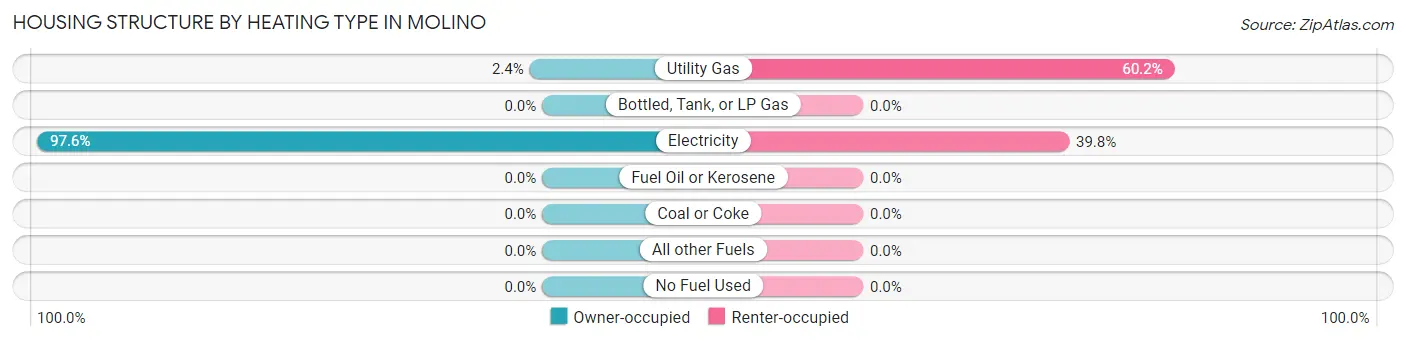
| Heating Type | Owner-occupied | Renter-occupied |
| Utility Gas | 8 (2.4%) | 65 (60.2%) |
| Bottled, Tank, or LP Gas | 0 (0.0%) | 0 (0.0%) |
| Electricity | 322 (97.6%) | 43 (39.8%) |
| Fuel Oil or Kerosene | 0 (0.0%) | 0 (0.0%) |
| Coal or Coke | 0 (0.0%) | 0 (0.0%) |
| All other Fuels | 0 (0.0%) | 0 (0.0%) |
| No Fuel Used | 0 (0.0%) | 0 (0.0%) |
| Total | 330 (100.0%) | 108 (100.0%) |
Household Vehicle Usage in Molino
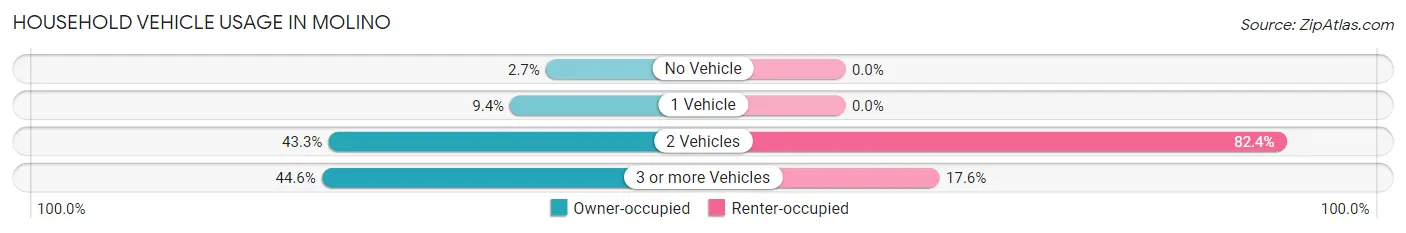
| Vehicles per Household | Owner-occupied | Renter-occupied |
| No Vehicle | 9 (2.7%) | 0 (0.0%) |
| 1 Vehicle | 31 (9.4%) | 0 (0.0%) |
| 2 Vehicles | 143 (43.3%) | 89 (82.4%) |
| 3 or more Vehicles | 147 (44.6%) | 19 (17.6%) |
| Total | 330 (100.0%) | 108 (100.0%) |
Real Estate & Mortgages in Molino
Real Estate and Mortgage Overview in Molino
| Characteristic | Without Mortgage | With Mortgage |
| Housing Units | 113 | 217 |
| Median Property Value | $105,100 | $218,100 |
| Median Household Income | $90,655 | $109 |
| Monthly Housing Costs | $469 | $59 |
| Real Estate Taxes | $1,009 | $72 |
Property Value by Mortgage Status in Molino
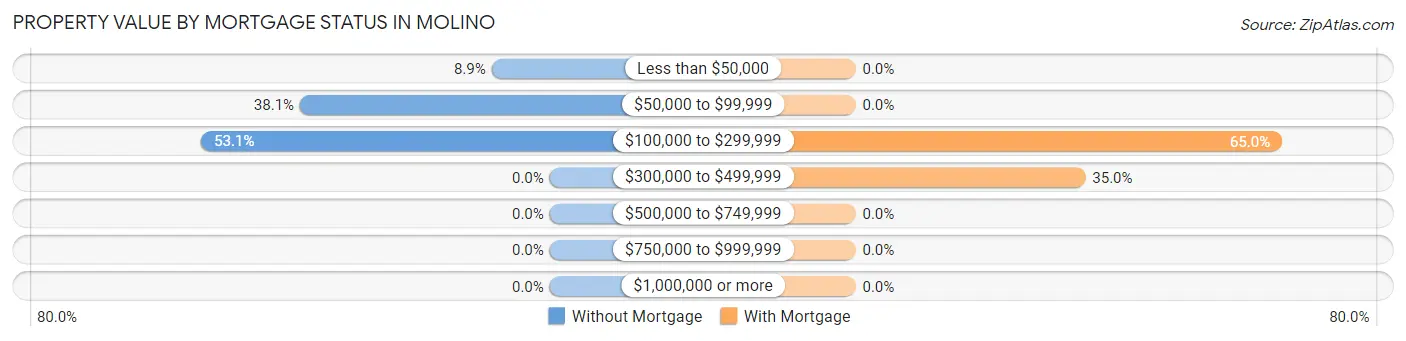
| Property Value | Without Mortgage | With Mortgage |
| Less than $50,000 | 10 (8.8%) | 0 (0.0%) |
| $50,000 to $99,999 | 43 (38.1%) | 0 (0.0%) |
| $100,000 to $299,999 | 60 (53.1%) | 141 (65.0%) |
| $300,000 to $499,999 | 0 (0.0%) | 76 (35.0%) |
| $500,000 to $749,999 | 0 (0.0%) | 0 (0.0%) |
| $750,000 to $999,999 | 0 (0.0%) | 0 (0.0%) |
| $1,000,000 or more | 0 (0.0%) | 0 (0.0%) |
| Total | 113 (100.0%) | 217 (100.0%) |
Household Income by Mortgage Status in Molino
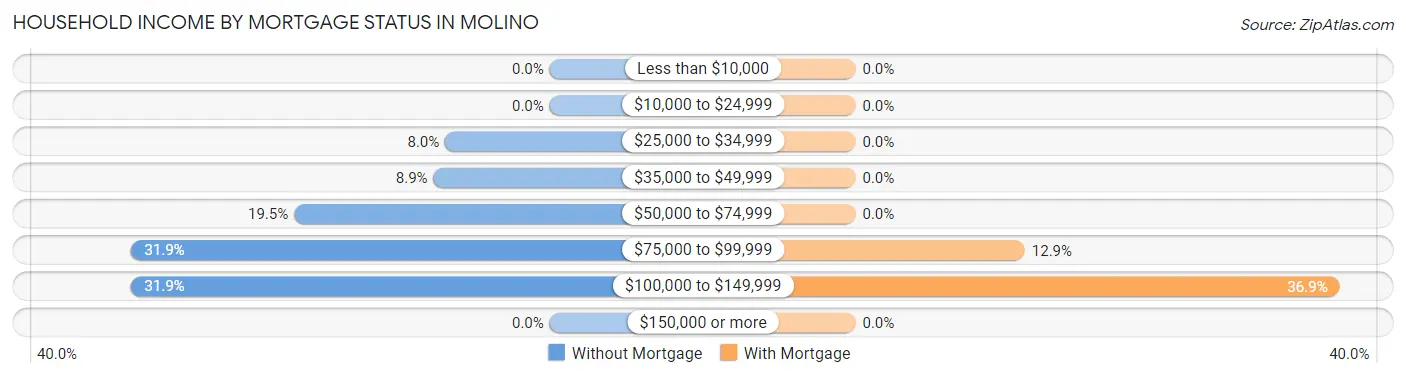
| Household Income | Without Mortgage | With Mortgage |
| Less than $10,000 | 0 (0.0%) | 0 (0.0%) |
| $10,000 to $24,999 | 0 (0.0%) | 0 (0.0%) |
| $25,000 to $34,999 | 9 (8.0%) | 0 (0.0%) |
| $35,000 to $49,999 | 10 (8.8%) | 0 (0.0%) |
| $50,000 to $74,999 | 22 (19.5%) | 0 (0.0%) |
| $75,000 to $99,999 | 36 (31.9%) | 28 (12.9%) |
| $100,000 to $149,999 | 36 (31.9%) | 80 (36.9%) |
| $150,000 or more | 0 (0.0%) | 0 (0.0%) |
| Total | 113 (100.0%) | 217 (100.0%) |
Property Value to Household Income Ratio in Molino
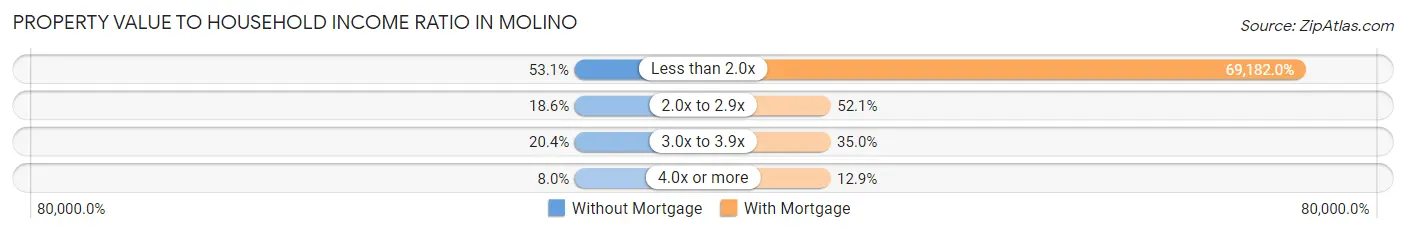
| Value-to-Income Ratio | Without Mortgage | With Mortgage |
| Less than 2.0x | 60 (53.1%) | 150,125 (69,182.0%) |
| 2.0x to 2.9x | 21 (18.6%) | 113 (52.1%) |
| 3.0x to 3.9x | 23 (20.3%) | 76 (35.0%) |
| 4.0x or more | 9 (8.0%) | 28 (12.9%) |
| Total | 113 (100.0%) | 217 (100.0%) |
Real Estate Taxes by Mortgage Status in Molino
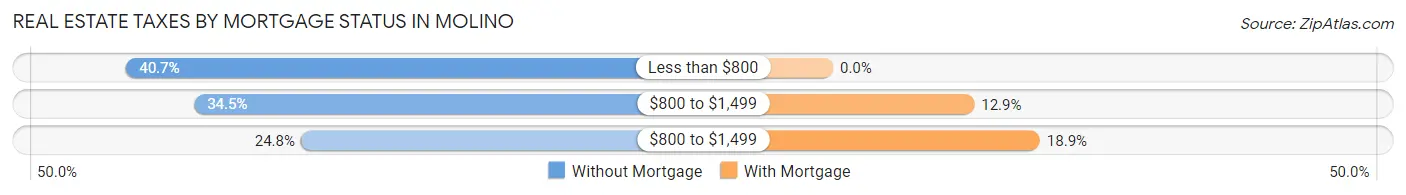
| Property Taxes | Without Mortgage | With Mortgage |
| Less than $800 | 46 (40.7%) | 0 (0.0%) |
| $800 to $1,499 | 39 (34.5%) | 28 (12.9%) |
| $800 to $1,499 | 28 (24.8%) | 41 (18.9%) |
| Total | 113 (100.0%) | 217 (100.0%) |
Health & Disability in Molino
Health Insurance Coverage by Age in Molino
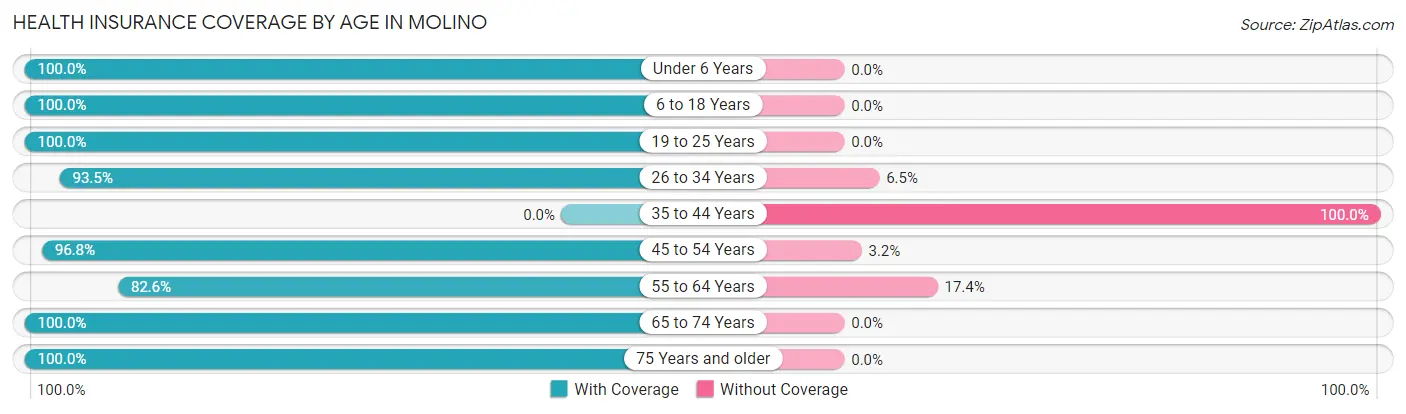
| Age Bracket | With Coverage | Without Coverage |
| Under 6 Years | 128 (100.0%) | 0 (0.0%) |
| 6 to 18 Years | 223 (100.0%) | 0 (0.0%) |
| 19 to 25 Years | 82 (100.0%) | 0 (0.0%) |
| 26 to 34 Years | 158 (93.5%) | 11 (6.5%) |
| 35 to 44 Years | 0 (0.0%) | 28 (100.0%) |
| 45 to 54 Years | 302 (96.8%) | 10 (3.2%) |
| 55 to 64 Years | 76 (82.6%) | 16 (17.4%) |
| 65 to 74 Years | 141 (100.0%) | 0 (0.0%) |
| 75 Years and older | 78 (100.0%) | 0 (0.0%) |
| Total | 1,188 (94.8%) | 65 (5.2%) |
Health Insurance Coverage by Citizenship Status in Molino
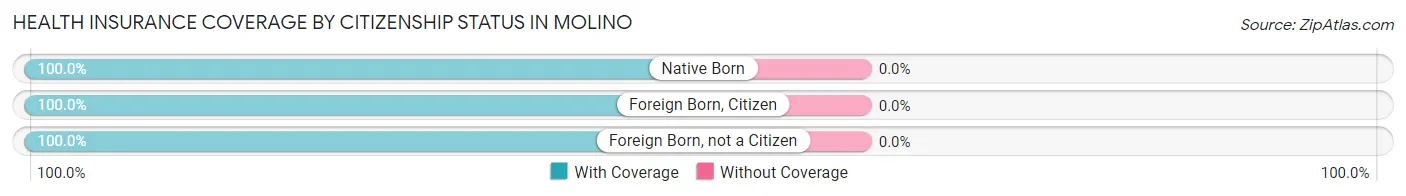
| Citizenship Status | With Coverage | Without Coverage |
| Native Born | 128 (100.0%) | 0 (0.0%) |
| Foreign Born, Citizen | 223 (100.0%) | 0 (0.0%) |
| Foreign Born, not a Citizen | 82 (100.0%) | 0 (0.0%) |
Health Insurance Coverage by Household Income in Molino
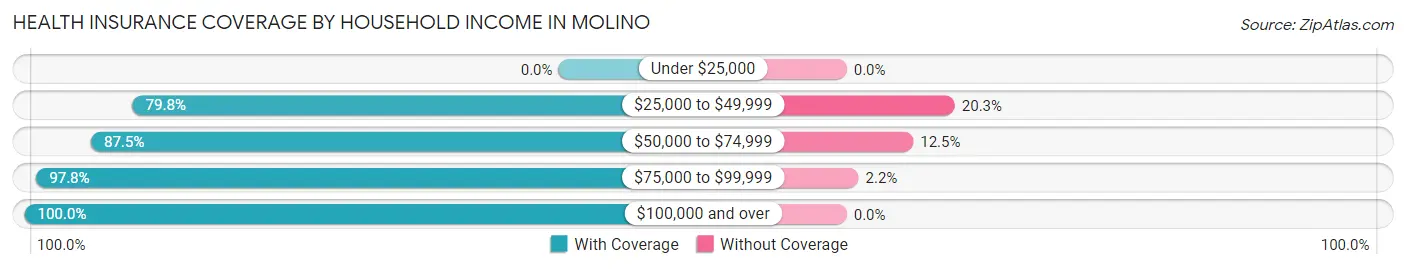
| Household Income | With Coverage | Without Coverage |
| Under $25,000 | 0 (0.0%) | 0 (0.0%) |
| $25,000 to $49,999 | 63 (79.7%) | 16 (20.3%) |
| $50,000 to $74,999 | 274 (87.5%) | 39 (12.5%) |
| $75,000 to $99,999 | 442 (97.8%) | 10 (2.2%) |
| $100,000 and over | 409 (100.0%) | 0 (0.0%) |
Public vs Private Health Insurance Coverage by Age in Molino
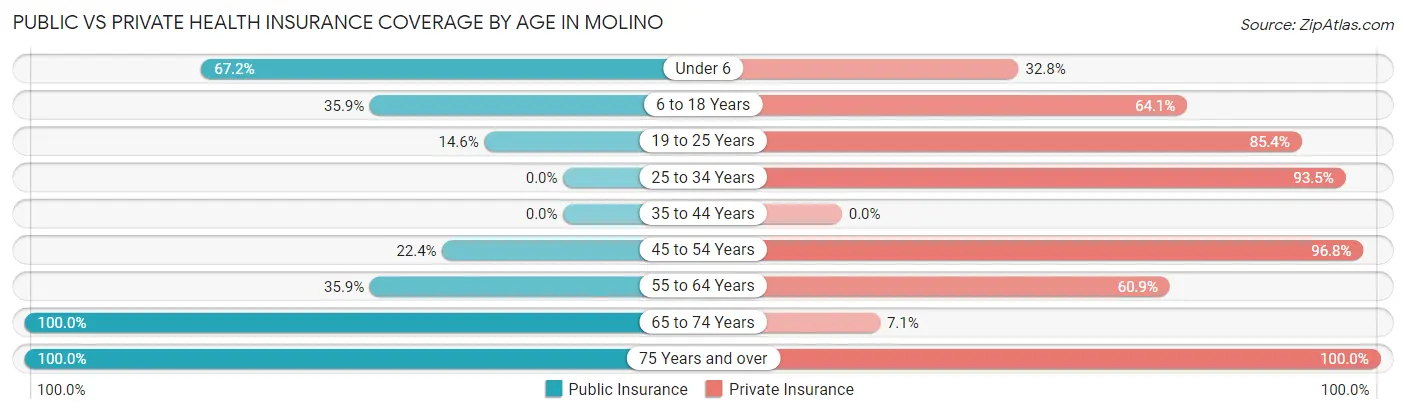
| Age Bracket | Public Insurance | Private Insurance |
| Under 6 | 86 (67.2%) | 42 (32.8%) |
| 6 to 18 Years | 80 (35.9%) | 143 (64.1%) |
| 19 to 25 Years | 12 (14.6%) | 70 (85.4%) |
| 25 to 34 Years | 0 (0.0%) | 158 (93.5%) |
| 35 to 44 Years | 0 (0.0%) | 0 (0.0%) |
| 45 to 54 Years | 70 (22.4%) | 302 (96.8%) |
| 55 to 64 Years | 33 (35.9%) | 56 (60.9%) |
| 65 to 74 Years | 141 (100.0%) | 10 (7.1%) |
| 75 Years and over | 78 (100.0%) | 78 (100.0%) |
| Total | 500 (39.9%) | 859 (68.6%) |
Disability Status by Sex by Age in Molino
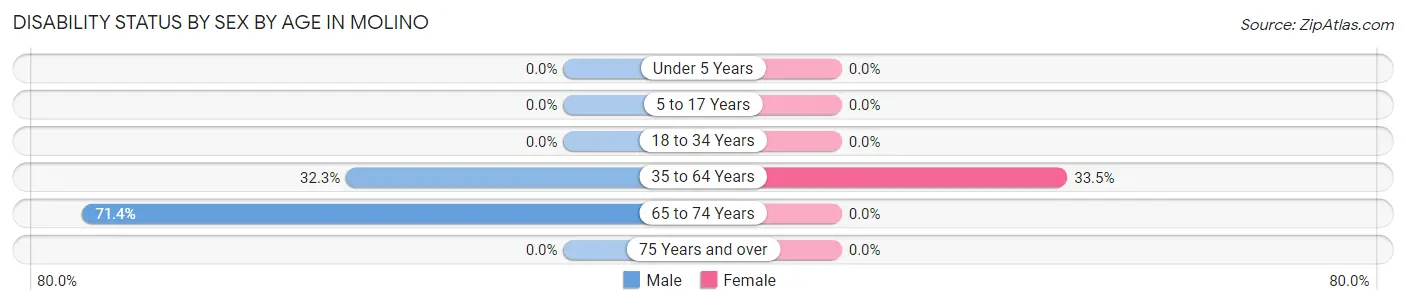
| Age Bracket | Male | Female |
| Under 5 Years | 0 (0.0%) | 0 (0.0%) |
| 5 to 17 Years | 0 (0.0%) | 0 (0.0%) |
| 18 to 34 Years | 0 (0.0%) | 0 (0.0%) |
| 35 to 64 Years | 70 (32.3%) | 72 (33.5%) |
| 65 to 74 Years | 35 (71.4%) | 0 (0.0%) |
| 75 Years and over | 0 (0.0%) | 0 (0.0%) |
Disability Class by Sex by Age in Molino
Disability Class: Hearing Difficulty
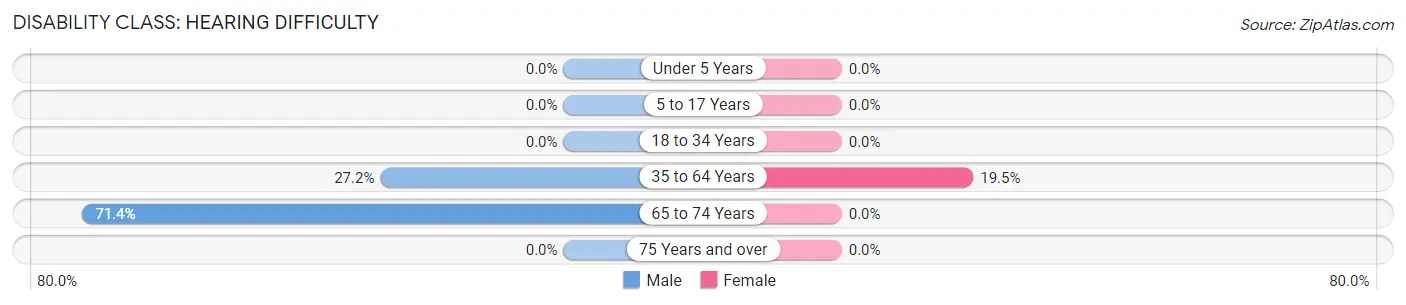
| Age Bracket | Male | Female |
| Under 5 Years | 0 (0.0%) | 0 (0.0%) |
| 5 to 17 Years | 0 (0.0%) | 0 (0.0%) |
| 18 to 34 Years | 0 (0.0%) | 0 (0.0%) |
| 35 to 64 Years | 59 (27.2%) | 42 (19.5%) |
| 65 to 74 Years | 35 (71.4%) | 0 (0.0%) |
| 75 Years and over | 0 (0.0%) | 0 (0.0%) |
Disability Class: Vision Difficulty
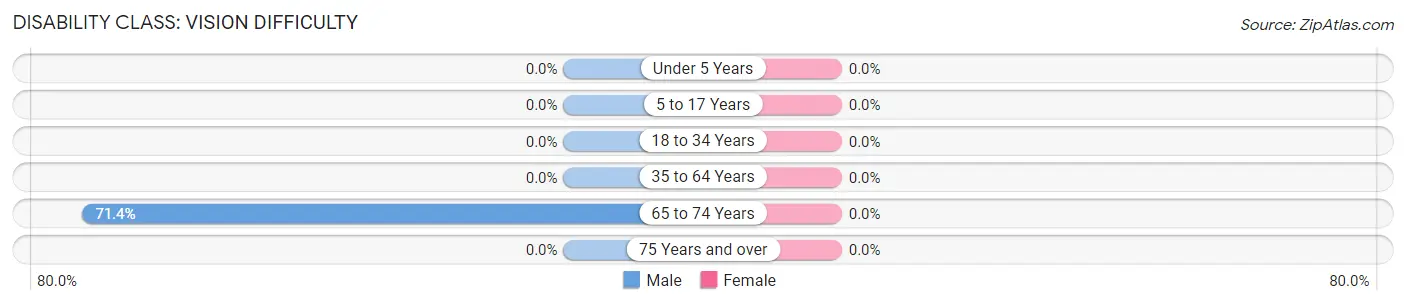
| Age Bracket | Male | Female |
| Under 5 Years | 0 (0.0%) | 0 (0.0%) |
| 5 to 17 Years | 0 (0.0%) | 0 (0.0%) |
| 18 to 34 Years | 0 (0.0%) | 0 (0.0%) |
| 35 to 64 Years | 0 (0.0%) | 0 (0.0%) |
| 65 to 74 Years | 35 (71.4%) | 0 (0.0%) |
| 75 Years and over | 0 (0.0%) | 0 (0.0%) |
Disability Class: Cognitive Difficulty
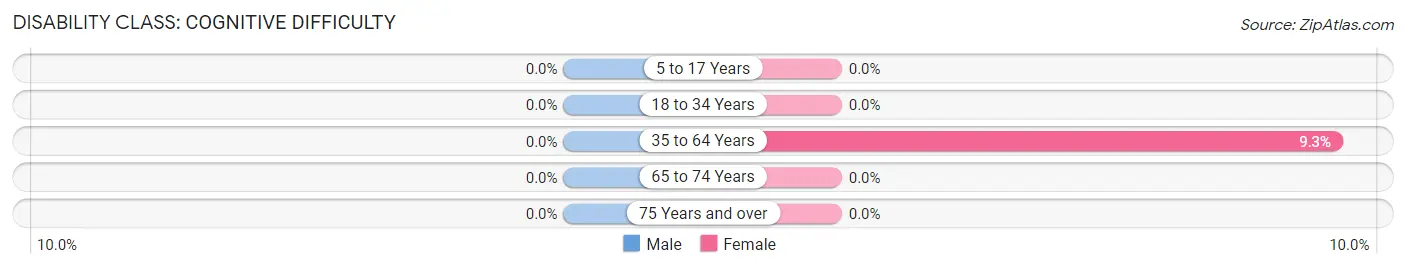
| Age Bracket | Male | Female |
| 5 to 17 Years | 0 (0.0%) | 0 (0.0%) |
| 18 to 34 Years | 0 (0.0%) | 0 (0.0%) |
| 35 to 64 Years | 0 (0.0%) | 20 (9.3%) |
| 65 to 74 Years | 0 (0.0%) | 0 (0.0%) |
| 75 Years and over | 0 (0.0%) | 0 (0.0%) |
Disability Class: Ambulatory Difficulty
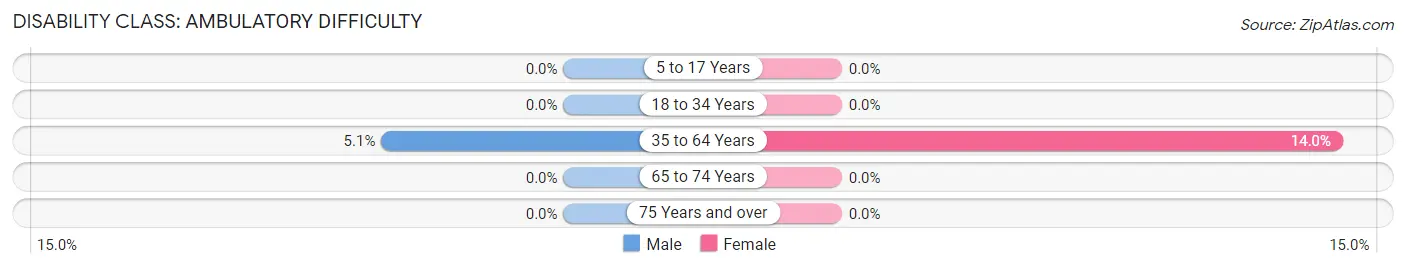
| Age Bracket | Male | Female |
| 5 to 17 Years | 0 (0.0%) | 0 (0.0%) |
| 18 to 34 Years | 0 (0.0%) | 0 (0.0%) |
| 35 to 64 Years | 11 (5.1%) | 30 (14.0%) |
| 65 to 74 Years | 0 (0.0%) | 0 (0.0%) |
| 75 Years and over | 0 (0.0%) | 0 (0.0%) |
Disability Class: Self-Care Difficulty
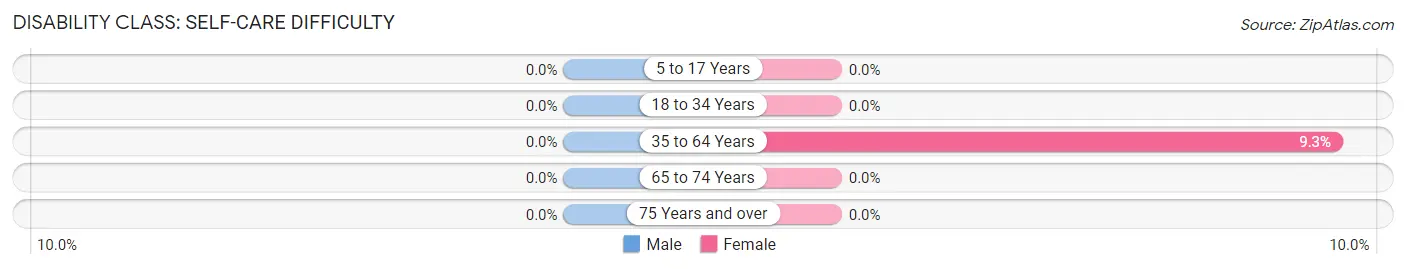
| Age Bracket | Male | Female |
| 5 to 17 Years | 0 (0.0%) | 0 (0.0%) |
| 18 to 34 Years | 0 (0.0%) | 0 (0.0%) |
| 35 to 64 Years | 0 (0.0%) | 20 (9.3%) |
| 65 to 74 Years | 0 (0.0%) | 0 (0.0%) |
| 75 Years and over | 0 (0.0%) | 0 (0.0%) |
Technology Access in Molino
Computing Device Access in Molino
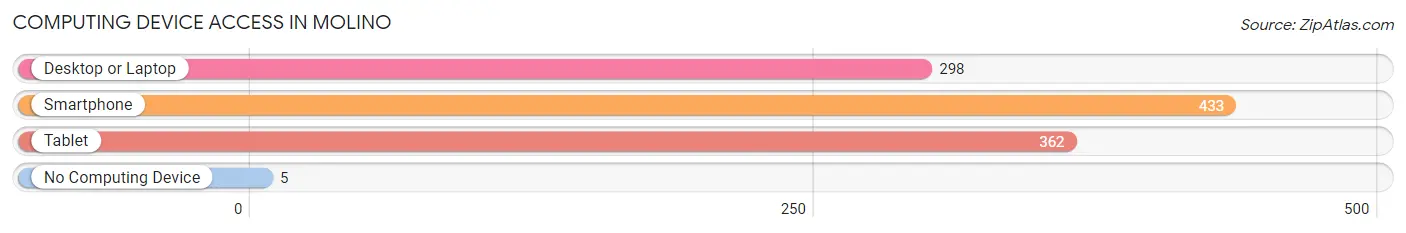
| Device Type | # Households | % Households |
| Desktop or Laptop | 298 | 68.0% |
| Smartphone | 433 | 98.9% |
| Tablet | 362 | 82.7% |
| No Computing Device | 5 | 1.1% |
| Total | 438 | 100.0% |
Internet Access in Molino
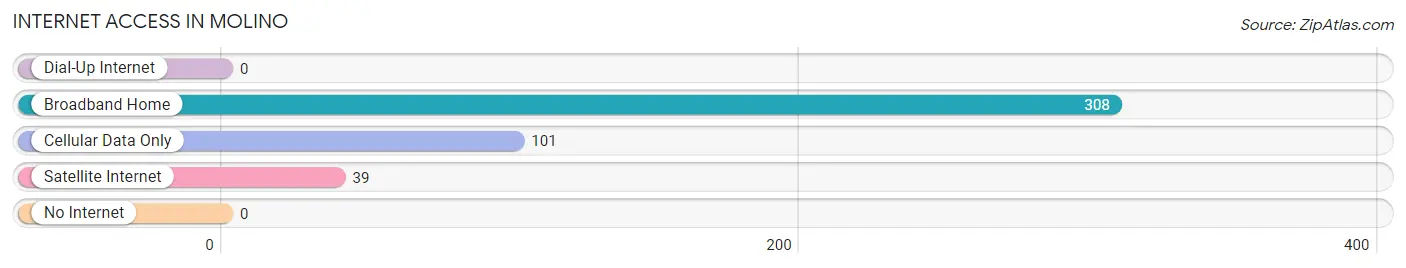
| Internet Type | # Households | % Households |
| Dial-Up Internet | 0 | 0.0% |
| Broadband Home | 308 | 70.3% |
| Cellular Data Only | 101 | 23.1% |
| Satellite Internet | 39 | 8.9% |
| No Internet | 0 | 0.0% |
| Total | 438 | 100.0% |
Molino Summary
Molino is an unincorporated community located in Escambia County, Florida, United States. It is located on the banks of the Escambia River, approximately 20 miles north of Pensacola. The population of Molino was estimated to be 1,845 in 2019.
History
Molino was first settled in the early 1800s by settlers from the Creek Nation. The name Molino is derived from the Spanish word for mill, as the area was home to several grist mills. The first post office in Molino was established in 1845.
In the late 1800s, Molino was a thriving agricultural community, with cotton, corn, and other crops being grown in the area. The town also had a sawmill, a grist mill, and a cotton gin.
In the early 1900s, Molino was home to a number of businesses, including a general store, a blacksmith shop, a livery stable, and a hotel. The town also had a school, a church, and a post office.
Geography
Molino is located in Escambia County, Florida, approximately 20 miles north of Pensacola. The town is situated on the banks of the Escambia River, and is surrounded by rolling hills and forests. The climate in Molino is humid subtropical, with hot, humid summers and mild winters.
Economy
Molino is primarily a rural community, and the economy is largely based on agriculture. The town is home to several farms, which produce a variety of crops, including cotton, corn, soybeans, and peanuts. The town also has a number of small businesses, including convenience stores, restaurants, and auto repair shops.
Demographics
As of 2019, the population of Molino was estimated to be 1,845. The racial makeup of the town was 79.3% White, 16.2% African American, 0.7% Native American, 0.7% Asian, and 3.1% from other races. The median household income in Molino was $37,917, and the median home value was $117,400.
Conclusion
Molino is a small, rural community located in Escambia County, Florida. The town has a long history, dating back to the early 1800s, and is home to a number of farms and small businesses. The population of Molino was estimated to be 1,845 in 2019, and the town has a diverse racial makeup. The economy of Molino is largely based on agriculture, and the town has a median household income of $37,917 and a median home value of $117,400.
Common Questions
What is Per Capita Income in Molino?
Per Capita income in Molino is $33,053.
What is the Median Family Income in Molino?
Median Family Income in Molino is $90,406.
What is the Median Household income in Molino?
Median Household Income in Molino is $87,614.
What is Inequality or Gini Index in Molino?
Inequality or Gini Index in Molino is 0.26.
What is the Total Population of Molino?
Total Population of Molino is 1,253.
What is the Total Male Population of Molino?
Total Male Population of Molino is 717.
What is the Total Female Population of Molino?
Total Female Population of Molino is 536.
What is the Ratio of Males per 100 Females in Molino?
There are 133.77 Males per 100 Females in Molino.
What is the Ratio of Females per 100 Males in Molino?
There are 74.76 Females per 100 Males in Molino.
What is the Median Population Age in Molino?
Median Population Age in Molino is 35.9 Years.
What is the Average Family Size in Molino
Average Family Size in Molino is 3.0 People.
What is the Average Household Size in Molino
Average Household Size in Molino is 2.9 People.
How Large is the Labor Force in Molino?
There are 773 People in the Labor Forcein in Molino.
What is the Percentage of People in the Labor Force in Molino?
82.4% of People are in the Labor Force in Molino.