Mims, FL Map & Demographics
Mims Map
Mims Overview
$37,415
PER CAPITA INCOME
$73,254
AVG FAMILY INCOME
$57,969
AVG HOUSEHOLD INCOME
44.0%
WAGE / INCOME GAP [ % ]
56.0¢/ $1
WAGE / INCOME GAP [ $ ]
0.47
INEQUALITY / GINI INDEX
7,222
TOTAL POPULATION
3,587
MALE POPULATION
3,635
FEMALE POPULATION
98.68
MALES / 100 FEMALES
101.34
FEMALES / 100 MALES
56.4
MEDIAN AGE
2.9
AVG FAMILY SIZE
2.4
AVG HOUSEHOLD SIZE
2,430
LABOR FORCE [ PEOPLE ]
38.7%
PERCENT IN LABOR FORCE
6.5%
UNEMPLOYMENT RATE
Mims Zip Codes
Income in Mims
Income Overview in Mims
Per Capita Income in Mims is $37,415, while median incomes of families and households are $73,254 and $57,969 respectively.
| Characteristic | Number | Measure |
| Per Capita Income | 7,222 | $37,415 |
| Median Family Income | 2,085 | $73,254 |
| Mean Family Income | 2,085 | $103,248 |
| Median Household Income | 3,015 | $57,969 |
| Mean Household Income | 3,015 | $86,342 |
| Income Deficit | 2,085 | $0 |
| Wage / Income Gap (%) | 7,222 | 43.95% |
| Wage / Income Gap ($) | 7,222 | 56.05¢ per $1 |
| Gini / Inequality Index | 7,222 | 0.47 |
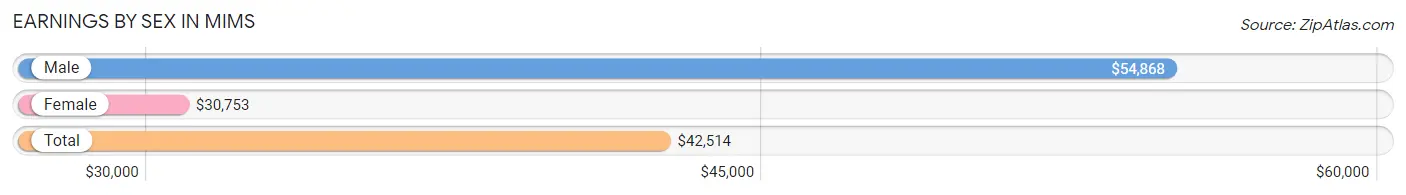
Earnings by Sex in Mims
Average Earnings in Mims are $42,514, $54,868 for men and $30,753 for women, a difference of 44.0%.
| Sex | Number | Average Earnings |
| Male | 1,534 (56.6%) | $54,868 |
| Female | 1,175 (43.4%) | $30,753 |
| Total | 2,709 (100.0%) | $42,514 |
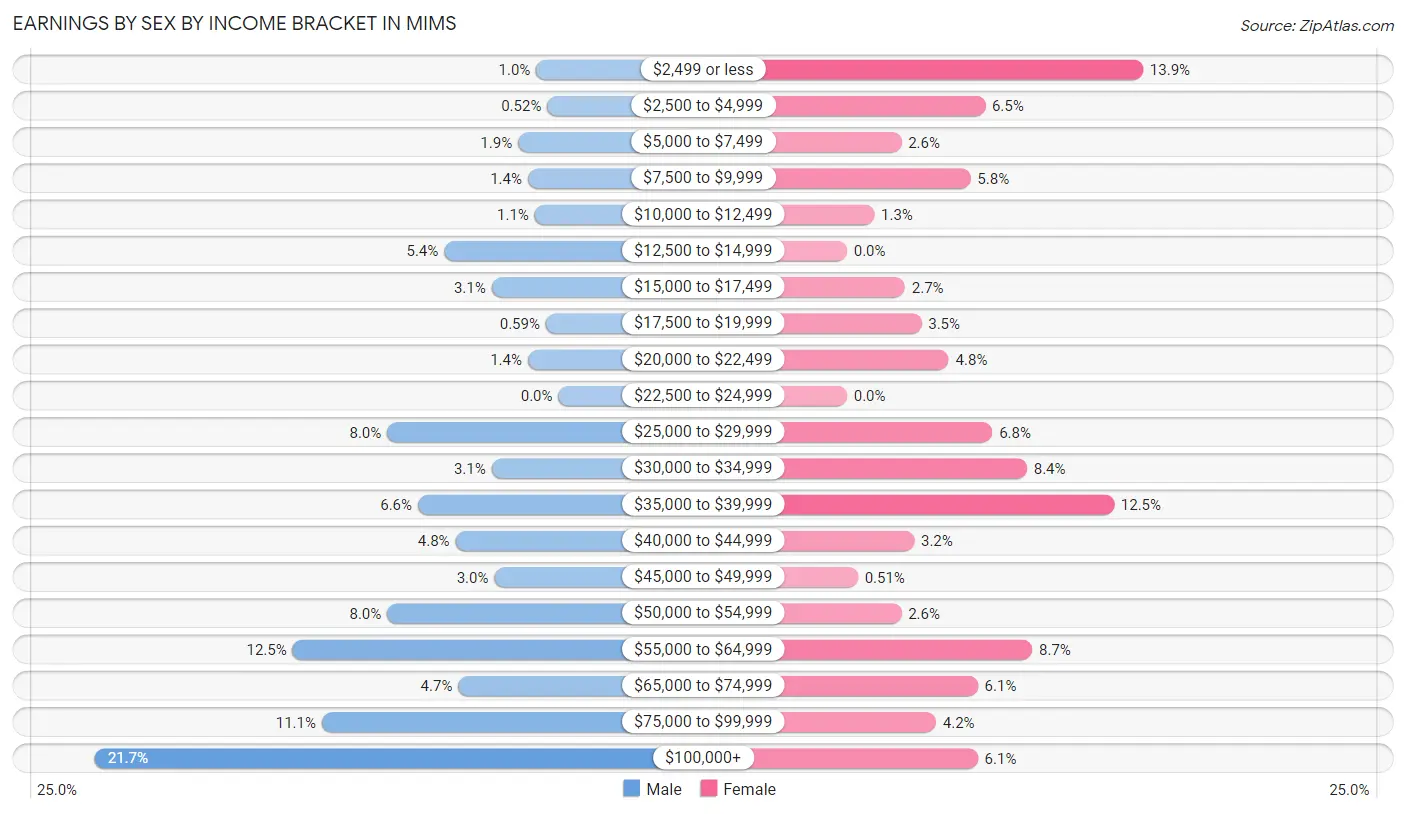
Earnings by Sex by Income Bracket in Mims
The most common earnings brackets in Mims are $100,000+ for men (333 | 21.7%) and $2,499 or less for women (163 | 13.9%).
| Income | Male | Female |
| $2,499 or less | 16 (1.0%) | 163 (13.9%) |
| $2,500 to $4,999 | 8 (0.5%) | 76 (6.5%) |
| $5,000 to $7,499 | 29 (1.9%) | 30 (2.5%) |
| $7,500 to $9,999 | 22 (1.4%) | 68 (5.8%) |
| $10,000 to $12,499 | 17 (1.1%) | 15 (1.3%) |
| $12,500 to $14,999 | 82 (5.3%) | 0 (0.0%) |
| $15,000 to $17,499 | 48 (3.1%) | 32 (2.7%) |
| $17,500 to $19,999 | 9 (0.6%) | 41 (3.5%) |
| $20,000 to $22,499 | 22 (1.4%) | 56 (4.8%) |
| $22,500 to $24,999 | 0 (0.0%) | 0 (0.0%) |
| $25,000 to $29,999 | 123 (8.0%) | 80 (6.8%) |
| $30,000 to $34,999 | 48 (3.1%) | 99 (8.4%) |
| $35,000 to $39,999 | 101 (6.6%) | 147 (12.5%) |
| $40,000 to $44,999 | 74 (4.8%) | 37 (3.2%) |
| $45,000 to $49,999 | 46 (3.0%) | 6 (0.5%) |
| $50,000 to $54,999 | 123 (8.0%) | 30 (2.5%) |
| $55,000 to $64,999 | 191 (12.4%) | 102 (8.7%) |
| $65,000 to $74,999 | 72 (4.7%) | 72 (6.1%) |
| $75,000 to $99,999 | 170 (11.1%) | 49 (4.2%) |
| $100,000+ | 333 (21.7%) | 72 (6.1%) |
| Total | 1,534 (100.0%) | 1,175 (100.0%) |
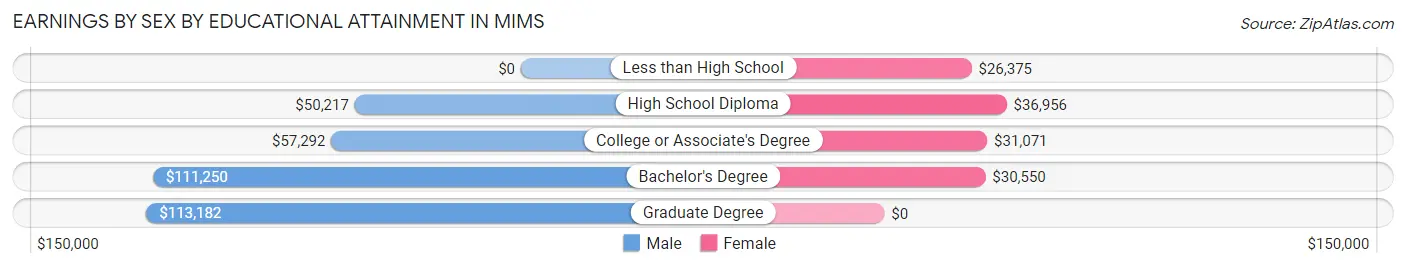
Earnings by Sex by Educational Attainment in Mims
Average earnings in Mims are $55,755 for men and $33,750 for women, a difference of 39.5%. Men with an educational attainment of graduate degree enjoy the highest average annual earnings of $113,182, while those with high school diploma education earn the least with $50,217. Women with an educational attainment of high school diploma earn the most with the average annual earnings of $36,956, while those with less than high school education have the smallest earnings of $26,375.
| Educational Attainment | Male Income | Female Income |
| Less than High School | - | - |
| High School Diploma | $50,217 | $36,956 |
| College or Associate's Degree | $57,292 | $31,071 |
| Bachelor's Degree | $111,250 | $30,550 |
| Graduate Degree | $113,182 | $0 |
| Total | $55,755 | $33,750 |
Family Income in Mims
Family Income Brackets in Mims
According to the Mims family income data, there are 559 families falling into the $100,000 to $149,999 income range, which is the most common income bracket and makes up 26.8% of all families. Conversely, the less than $10,000 income bracket is the least frequent group with only 38 families (1.8%) belonging to this category.
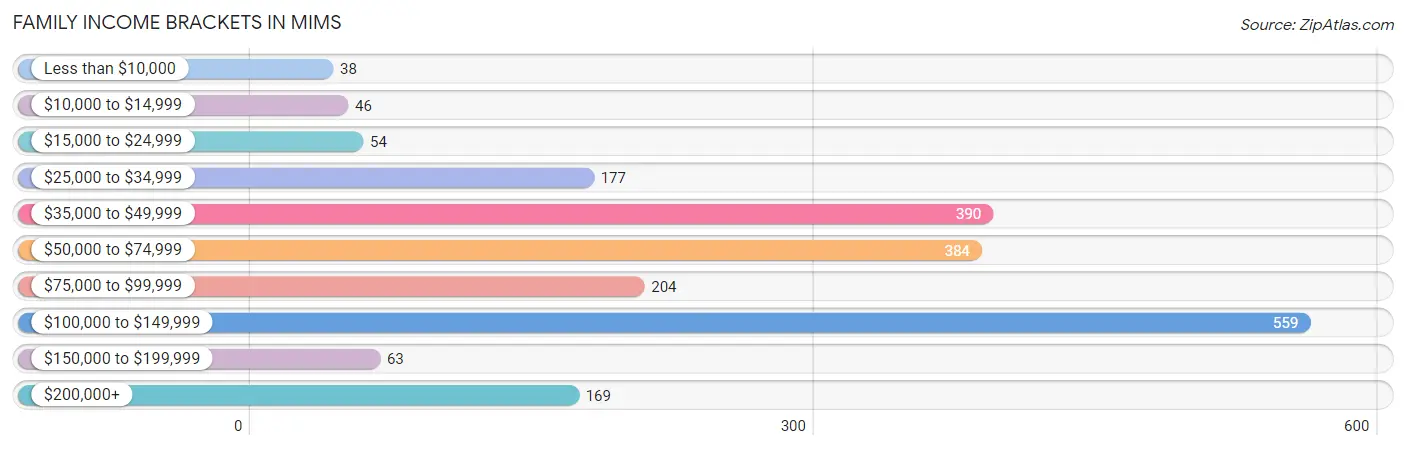
| Income Bracket | # Families | % Families |
| Less than $10,000 | 38 | 1.8% |
| $10,000 to $14,999 | 46 | 2.2% |
| $15,000 to $24,999 | 54 | 2.6% |
| $25,000 to $34,999 | 177 | 8.5% |
| $35,000 to $49,999 | 390 | 18.7% |
| $50,000 to $74,999 | 384 | 18.4% |
| $75,000 to $99,999 | 204 | 9.8% |
| $100,000 to $149,999 | 559 | 26.8% |
| $150,000 to $199,999 | 63 | 3.0% |
| $200,000+ | 169 | 8.1% |
Family Income by Famaliy Size in Mims
6-person families (55 | 2.6%) account for the highest median family income in Mims with $227,629 per family, while 6-person families (55 | 2.6%) have the highest median income of $37,938 per family member.
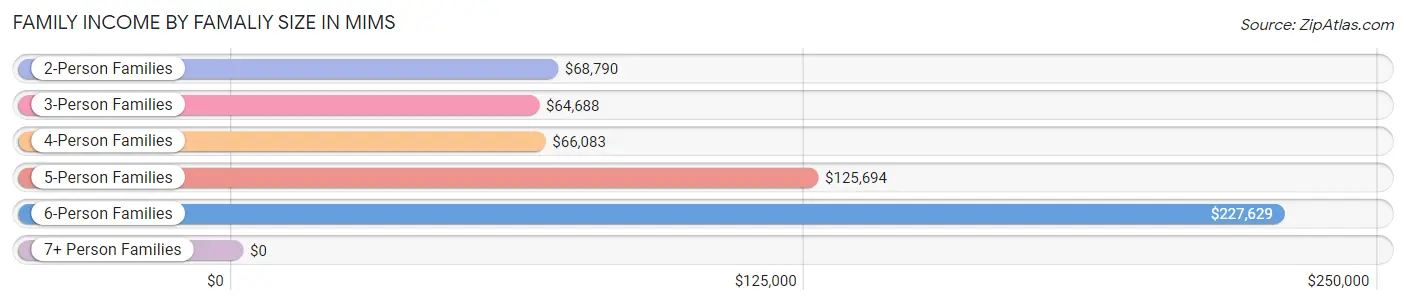
| Income Bracket | # Families | Median Income |
| 2-Person Families | 1,389 (66.6%) | $68,790 |
| 3-Person Families | 281 (13.5%) | $64,688 |
| 4-Person Families | 157 (7.5%) | $66,083 |
| 5-Person Families | 191 (9.2%) | $125,694 |
| 6-Person Families | 55 (2.6%) | $227,629 |
| 7+ Person Families | 12 (0.6%) | $0 |
| Total | 2,085 (100.0%) | $73,254 |
Family Income by Number of Earners in Mims
The median family income in Mims is $73,254, with families comprising 3+ earners (144) having the highest median family income of $228,276, while families with no earners (789) have the lowest median family income of $48,580, accounting for 6.9% and 37.8% of families, respectively.
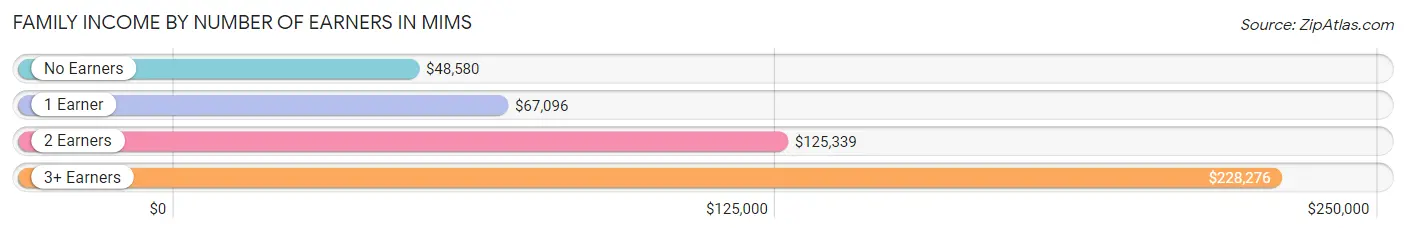
| Number of Earners | # Families | Median Income |
| No Earners | 789 (37.8%) | $48,580 |
| 1 Earner | 573 (27.5%) | $67,096 |
| 2 Earners | 579 (27.8%) | $125,339 |
| 3+ Earners | 144 (6.9%) | $228,276 |
| Total | 2,085 (100.0%) | $73,254 |
Household Income in Mims
Household Income Brackets in Mims
With 672 households falling in the category, the $35,000 to $49,999 income range is the most frequent in Mims, accounting for 22.3% of all households. In contrast, only 51 households (1.7%) fall into the $150,000 to $199,999 income bracket, making it the least populous group.
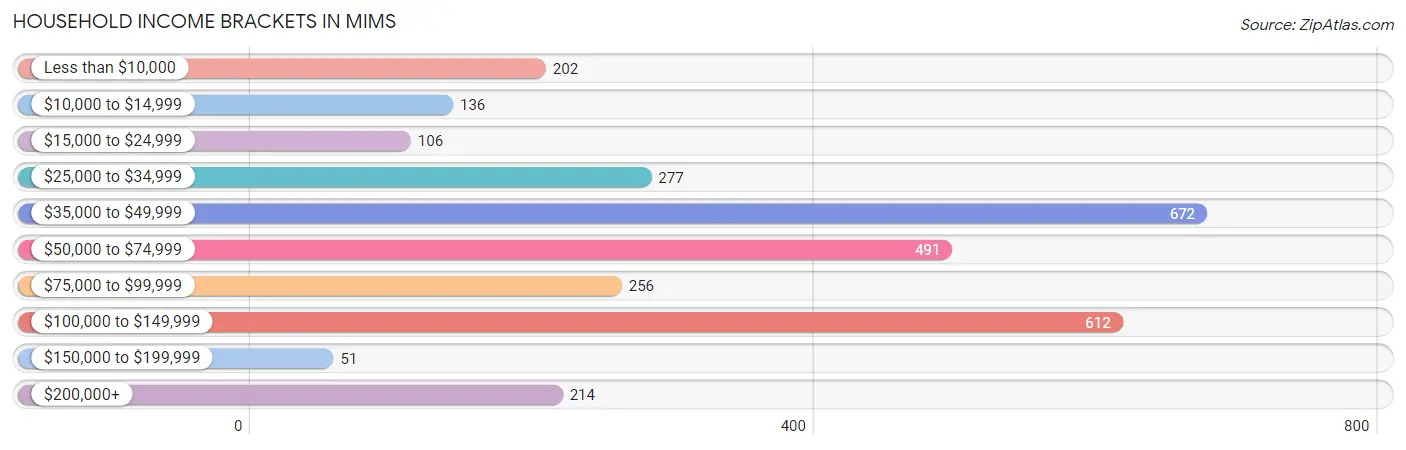
| Income Bracket | # Households | % Households |
| Less than $10,000 | 202 | 6.7% |
| $10,000 to $14,999 | 136 | 4.5% |
| $15,000 to $24,999 | 106 | 3.5% |
| $25,000 to $34,999 | 277 | 9.2% |
| $35,000 to $49,999 | 672 | 22.3% |
| $50,000 to $74,999 | 491 | 16.3% |
| $75,000 to $99,999 | 256 | 8.5% |
| $100,000 to $149,999 | 612 | 20.3% |
| $150,000 to $199,999 | 51 | 1.7% |
| $200,000+ | 214 | 7.1% |
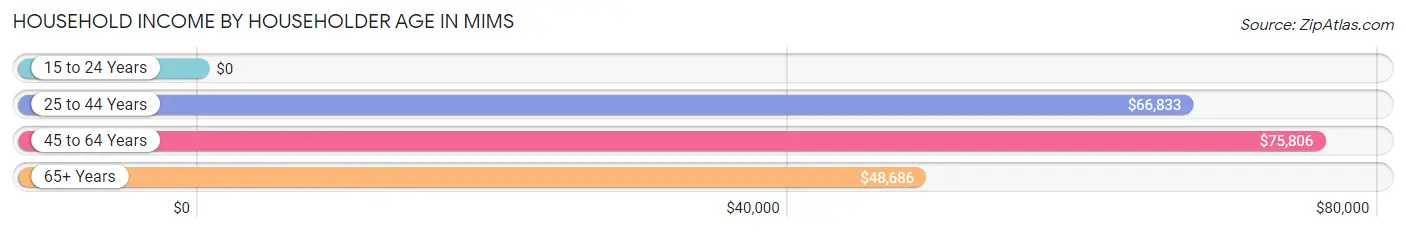
Household Income by Householder Age in Mims
The median household income in Mims is $57,969, with the highest median household income of $75,806 found in the 45 to 64 years age bracket for the primary householder. A total of 1,220 households (40.5%) fall into this category. Meanwhile, the 15 to 24 years age bracket for the primary householder has the lowest median household income of $0, with 15 households (0.5%) in this group.
| Income Bracket | # Households | Median Income |
| 15 to 24 Years | 15 (0.5%) | $0 |
| 25 to 44 Years | 406 (13.5%) | $66,833 |
| 45 to 64 Years | 1,220 (40.5%) | $75,806 |
| 65+ Years | 1,374 (45.6%) | $48,686 |
| Total | 3,015 (100.0%) | $57,969 |
Poverty in Mims
Income Below Poverty by Sex and Age in Mims
With 8.0% poverty level for males and 11.4% for females among the residents of Mims, 15 year old males and 6 to 11 year old females are the most vulnerable to poverty, with 26 males (34.7%) and 71 females (46.7%) in their respective age groups living below the poverty level.
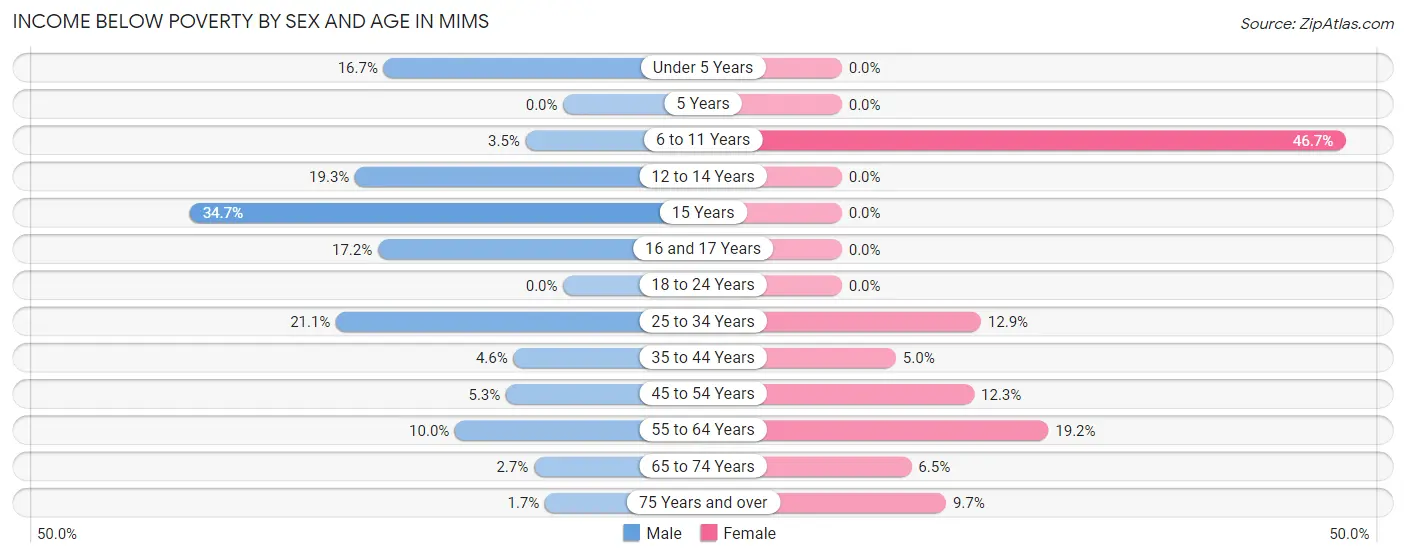
| Age Bracket | Male | Female |
| Under 5 Years | 13 (16.7%) | 0 (0.0%) |
| 5 Years | 0 (0.0%) | 0 (0.0%) |
| 6 to 11 Years | 10 (3.5%) | 71 (46.7%) |
| 12 to 14 Years | 17 (19.3%) | 0 (0.0%) |
| 15 Years | 26 (34.7%) | 0 (0.0%) |
| 16 and 17 Years | 16 (17.2%) | 0 (0.0%) |
| 18 to 24 Years | 0 (0.0%) | 0 (0.0%) |
| 25 to 34 Years | 74 (21.1%) | 39 (12.9%) |
| 35 to 44 Years | 11 (4.6%) | 11 (5.0%) |
| 45 to 54 Years | 24 (5.3%) | 41 (12.3%) |
| 55 to 64 Years | 72 (10.0%) | 147 (19.2%) |
| 65 to 74 Years | 14 (2.7%) | 39 (6.5%) |
| 75 Years and over | 9 (1.7%) | 68 (9.7%) |
| Total | 286 (8.0%) | 416 (11.4%) |
Income Above Poverty by Sex and Age in Mims
According to the poverty statistics in Mims, males aged 18 to 24 years and females aged under 5 years are the age groups that are most secure financially, with 100.0% of males and 100.0% of females in these age groups living above the poverty line.
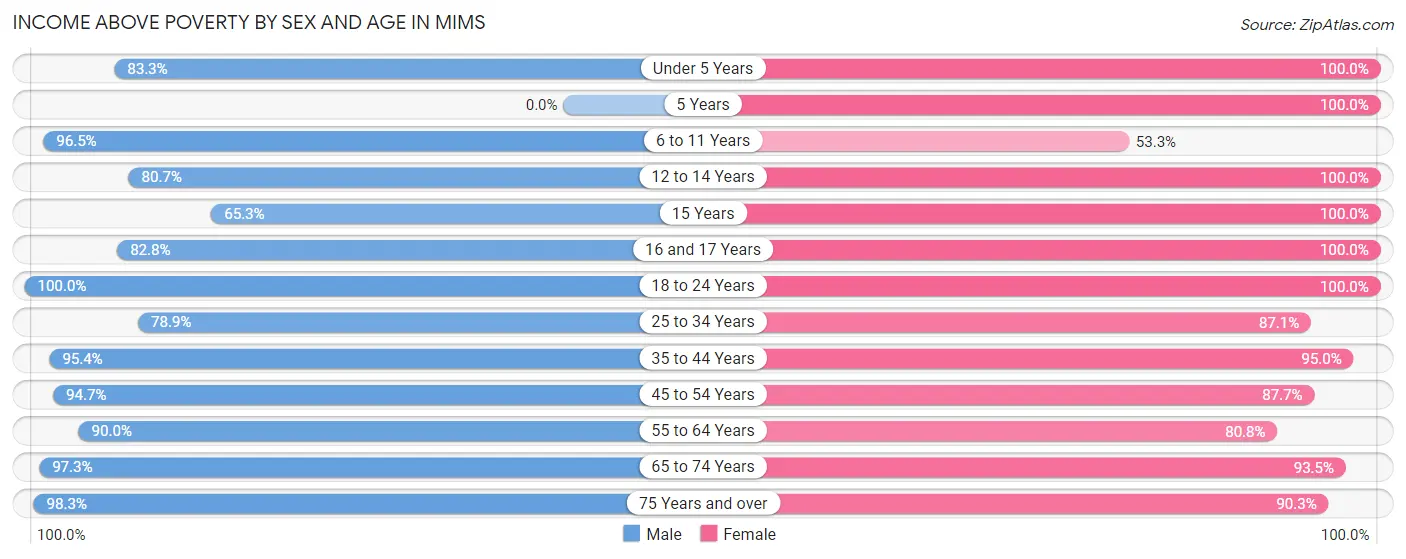
| Age Bracket | Male | Female |
| Under 5 Years | 65 (83.3%) | 60 (100.0%) |
| 5 Years | 0 (0.0%) | 28 (100.0%) |
| 6 to 11 Years | 276 (96.5%) | 81 (53.3%) |
| 12 to 14 Years | 71 (80.7%) | 169 (100.0%) |
| 15 Years | 49 (65.3%) | 7 (100.0%) |
| 16 and 17 Years | 77 (82.8%) | 135 (100.0%) |
| 18 to 24 Years | 163 (100.0%) | 155 (100.0%) |
| 25 to 34 Years | 277 (78.9%) | 263 (87.1%) |
| 35 to 44 Years | 227 (95.4%) | 208 (95.0%) |
| 45 to 54 Years | 428 (94.7%) | 293 (87.7%) |
| 55 to 64 Years | 645 (90.0%) | 620 (80.8%) |
| 65 to 74 Years | 500 (97.3%) | 565 (93.5%) |
| 75 Years and over | 523 (98.3%) | 635 (90.3%) |
| Total | 3,301 (92.0%) | 3,219 (88.6%) |
Income Below Poverty Among Married-Couple Families in Mims
The poverty statistics for married-couple families in Mims show that 4.6% or 83 of the total 1,794 families live below the poverty line. Families with 1 or 2 children have the highest poverty rate of 21.8%, comprising of 48 families. On the other hand, families with 3 or 4 children have the lowest poverty rate of 0.0%, which includes 0 families.
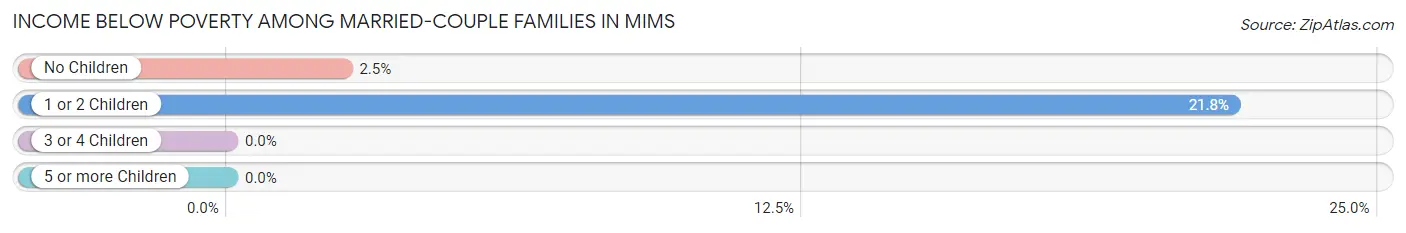
| Children | Above Poverty | Below Poverty |
| No Children | 1,372 (97.5%) | 35 (2.5%) |
| 1 or 2 Children | 172 (78.2%) | 48 (21.8%) |
| 3 or 4 Children | 167 (100.0%) | 0 (0.0%) |
| 5 or more Children | 0 (0.0%) | 0 (0.0%) |
| Total | 1,711 (95.4%) | 83 (4.6%) |
Income Below Poverty Among Single-Parent Households in Mims
According to the poverty data in Mims, 11.5% or 15 single-father households and 19.4% or 31 single-mother households are living below the poverty line. Among single-father households, those with 1 or 2 children have the highest poverty rate, with 15 households (34.1%) experiencing poverty. Likewise, among single-mother households, those with 3 or 4 children have the highest poverty rate, with 10 households (100.0%) falling below the poverty line.
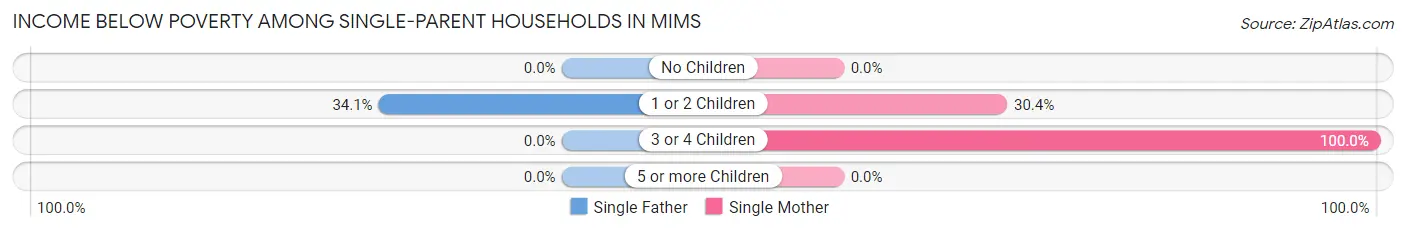
| Children | Single Father | Single Mother |
| No Children | 0 (0.0%) | 0 (0.0%) |
| 1 or 2 Children | 15 (34.1%) | 21 (30.4%) |
| 3 or 4 Children | 0 (0.0%) | 10 (100.0%) |
| 5 or more Children | 0 (0.0%) | 0 (0.0%) |
| Total | 15 (11.5%) | 31 (19.4%) |
Income Below Poverty Among Married-Couple vs Single-Parent Households in Mims
The poverty data for Mims shows that 83 of the married-couple family households (4.6%) and 46 of the single-parent households (15.8%) are living below the poverty level. Within the married-couple family households, those with 1 or 2 children have the highest poverty rate, with 48 households (21.8%) falling below the poverty line. Among the single-parent households, those with 3 or 4 children have the highest poverty rate, with 10 household (100.0%) living below poverty.
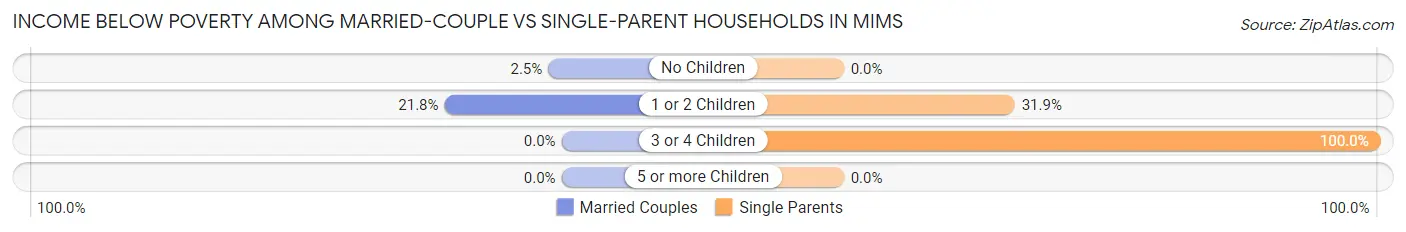
| Children | Married-Couple Families | Single-Parent Households |
| No Children | 35 (2.5%) | 0 (0.0%) |
| 1 or 2 Children | 48 (21.8%) | 36 (31.9%) |
| 3 or 4 Children | 0 (0.0%) | 10 (100.0%) |
| 5 or more Children | 0 (0.0%) | 0 (0.0%) |
| Total | 83 (4.6%) | 46 (15.8%) |
Race in Mims
The most populous races in Mims are White / Caucasian (6,688 | 92.6%), Black / African American (445 | 6.2%), and Hispanic or Latino (71 | 1.0%).
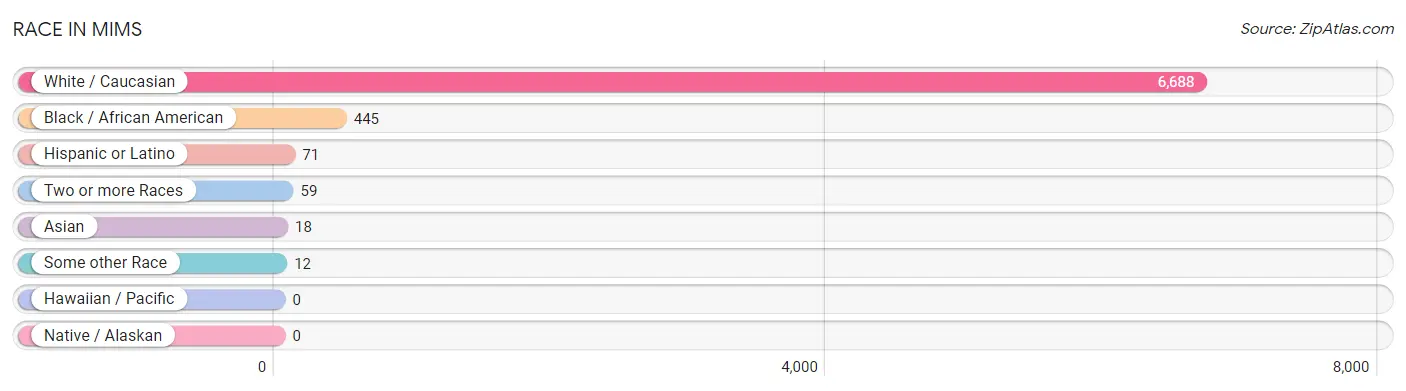
| Race | # Population | % Population |
| Asian | 18 | 0.3% |
| Black / African American | 445 | 6.2% |
| Hawaiian / Pacific | 0 | 0.0% |
| Hispanic or Latino | 71 | 1.0% |
| Native / Alaskan | 0 | 0.0% |
| White / Caucasian | 6,688 | 92.6% |
| Two or more Races | 59 | 0.8% |
| Some other Race | 12 | 0.2% |
| Total | 7,222 | 100.0% |
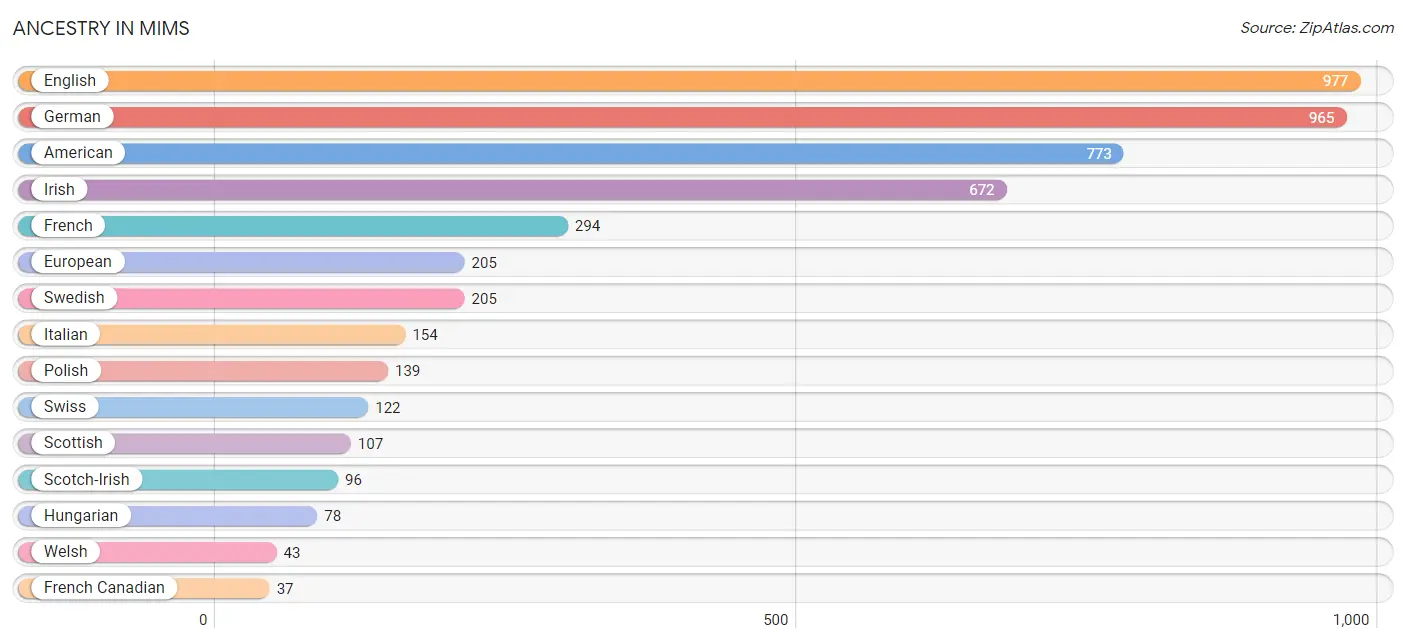
Ancestry in Mims
The most populous ancestries reported in Mims are English (977 | 13.5%), German (965 | 13.4%), American (773 | 10.7%), Irish (672 | 9.3%), and French (294 | 4.1%), together accounting for 51.0% of all Mims residents.
| Ancestry | # Population | % Population |
| American | 773 | 10.7% |
| Austrian | 27 | 0.4% |
| Bahamian | 29 | 0.4% |
| Belgian | 11 | 0.2% |
| British | 26 | 0.4% |
| Canadian | 29 | 0.4% |
| Central American | 5 | 0.1% |
| Central American Indian | 31 | 0.4% |
| Colombian | 7 | 0.1% |
| Cuban | 12 | 0.2% |
| Czech | 9 | 0.1% |
| Danish | 9 | 0.1% |
| Dutch | 17 | 0.2% |
| Eastern European | 33 | 0.5% |
| English | 977 | 13.5% |
| European | 205 | 2.8% |
| French | 294 | 4.1% |
| French Canadian | 37 | 0.5% |
| German | 965 | 13.4% |
| Hungarian | 78 | 1.1% |
| Indian (Asian) | 19 | 0.3% |
| Irish | 672 | 9.3% |
| Italian | 154 | 2.1% |
| Lithuanian | 36 | 0.5% |
| Mexican | 15 | 0.2% |
| Native Hawaiian | 1 | 0.0% |
| Northern European | 8 | 0.1% |
| Norwegian | 16 | 0.2% |
| Polish | 139 | 1.9% |
| Portuguese | 26 | 0.4% |
| Puerto Rican | 24 | 0.3% |
| Russian | 19 | 0.3% |
| Salvadoran | 5 | 0.1% |
| Scotch-Irish | 96 | 1.3% |
| Scottish | 107 | 1.5% |
| South American | 15 | 0.2% |
| Swedish | 205 | 2.8% |
| Swiss | 122 | 1.7% |
| Ukrainian | 12 | 0.2% |
| Uruguayan | 8 | 0.1% |
| Welsh | 43 | 0.6% |
| Yugoslavian | 10 | 0.1% | View All 42 Rows |
Immigrants in Mims
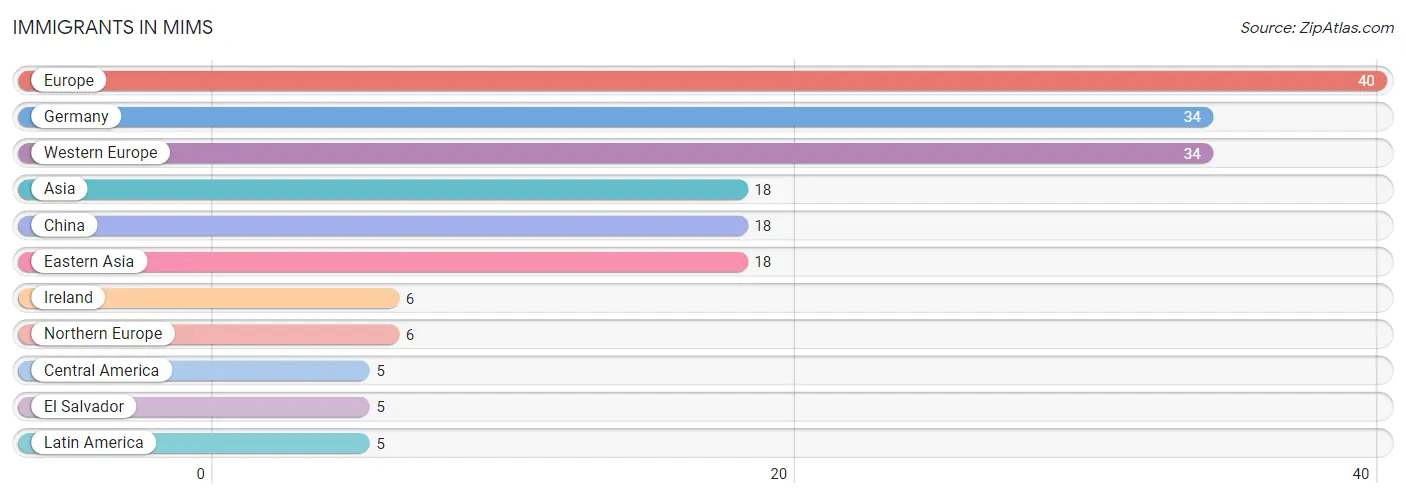
The most numerous immigrant groups reported in Mims came from Europe (40 | 0.5%), Germany (34 | 0.5%), Western Europe (34 | 0.5%), Asia (18 | 0.3%), and China (18 | 0.3%), together accounting for 2.0% of all Mims residents.
| Immigration Origin | # Population | % Population |
| Asia | 18 | 0.3% |
| Central America | 5 | 0.1% |
| China | 18 | 0.3% |
| Eastern Asia | 18 | 0.3% |
| El Salvador | 5 | 0.1% |
| Europe | 40 | 0.5% |
| Germany | 34 | 0.5% |
| Ireland | 6 | 0.1% |
| Latin America | 5 | 0.1% |
| Northern Europe | 6 | 0.1% |
| Western Europe | 34 | 0.5% | View All 11 Rows |
Sex and Age in Mims
Sex and Age in Mims
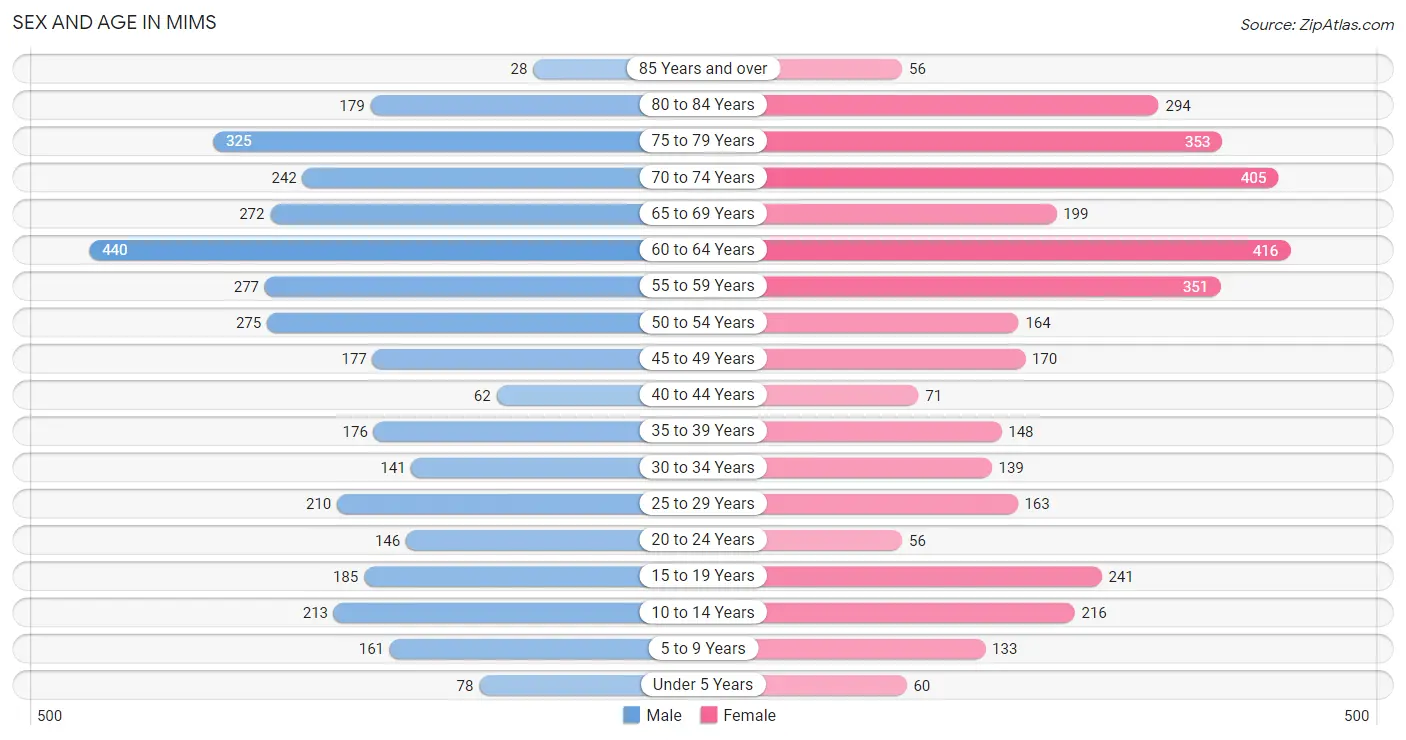
The most populous age groups in Mims are 60 to 64 Years (440 | 12.3%) for men and 60 to 64 Years (416 | 11.4%) for women.
| Age Bracket | Male | Female |
| Under 5 Years | 78 (2.2%) | 60 (1.7%) |
| 5 to 9 Years | 161 (4.5%) | 133 (3.7%) |
| 10 to 14 Years | 213 (5.9%) | 216 (5.9%) |
| 15 to 19 Years | 185 (5.2%) | 241 (6.6%) |
| 20 to 24 Years | 146 (4.1%) | 56 (1.5%) |
| 25 to 29 Years | 210 (5.9%) | 163 (4.5%) |
| 30 to 34 Years | 141 (3.9%) | 139 (3.8%) |
| 35 to 39 Years | 176 (4.9%) | 148 (4.1%) |
| 40 to 44 Years | 62 (1.7%) | 71 (1.9%) |
| 45 to 49 Years | 177 (4.9%) | 170 (4.7%) |
| 50 to 54 Years | 275 (7.7%) | 164 (4.5%) |
| 55 to 59 Years | 277 (7.7%) | 351 (9.7%) |
| 60 to 64 Years | 440 (12.3%) | 416 (11.4%) |
| 65 to 69 Years | 272 (7.6%) | 199 (5.5%) |
| 70 to 74 Years | 242 (6.8%) | 405 (11.1%) |
| 75 to 79 Years | 325 (9.1%) | 353 (9.7%) |
| 80 to 84 Years | 179 (5.0%) | 294 (8.1%) |
| 85 Years and over | 28 (0.8%) | 56 (1.5%) |
| Total | 3,587 (100.0%) | 3,635 (100.0%) |
Families and Households in Mims
Median Family Size in Mims
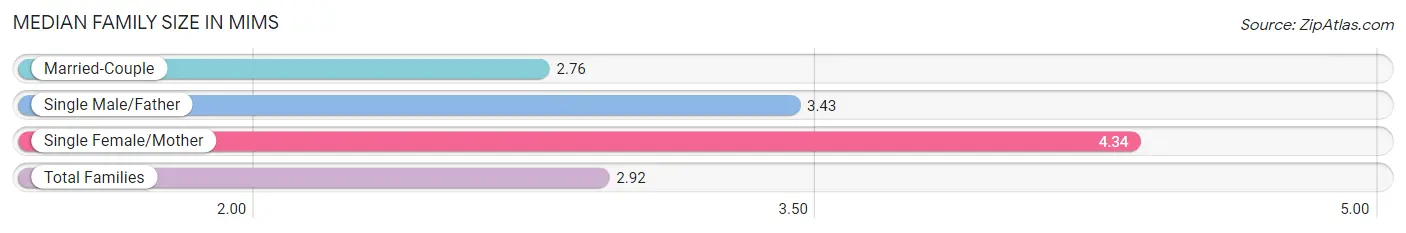
The median family size in Mims is 2.92 persons per family, with single female/mother families (160 | 7.7%) accounting for the largest median family size of 4.34 persons per family. On the other hand, married-couple families (1,794 | 86.0%) represent the smallest median family size with 2.76 persons per family.
| Family Type | # Families | Family Size |
| Married-Couple | 1,794 (86.0%) | 2.76 |
| Single Male/Father | 131 (6.3%) | 3.43 |
| Single Female/Mother | 160 (7.7%) | 4.34 |
| Total Families | 2,085 (100.0%) | 2.92 |
Median Household Size in Mims
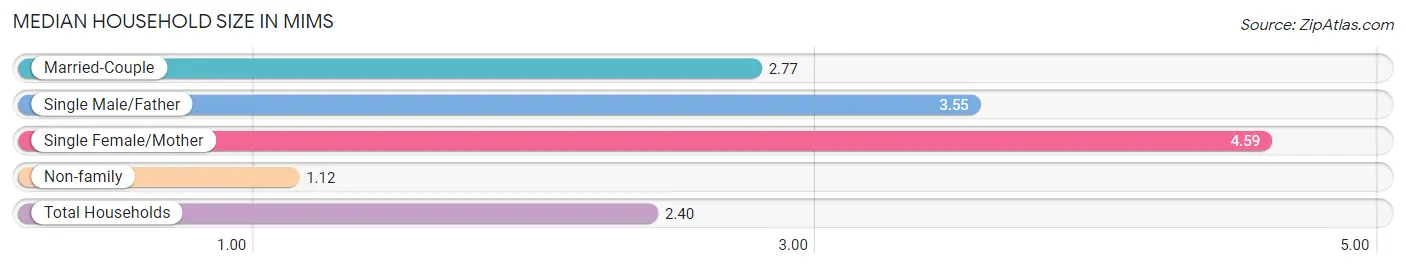
The median household size in Mims is 2.40 persons per household, with single female/mother households (160 | 5.3%) accounting for the largest median household size of 4.59 persons per household. non-family households (930 | 30.8%) represent the smallest median household size with 1.12 persons per household.
| Household Type | # Households | Household Size |
| Married-Couple | 1,794 (59.5%) | 2.77 |
| Single Male/Father | 131 (4.3%) | 3.55 |
| Single Female/Mother | 160 (5.3%) | 4.59 |
| Non-family | 930 (30.8%) | 1.12 |
| Total Households | 3,015 (100.0%) | 2.40 |
Household Size by Marriage Status in Mims
Out of a total of 3,015 households in Mims, 2,085 (69.2%) are family households, while 930 (30.8%) are nonfamily households. The most numerous type of family households are 2-person households, comprising 1,379, and the most common type of nonfamily households are 1-person households, comprising 853.
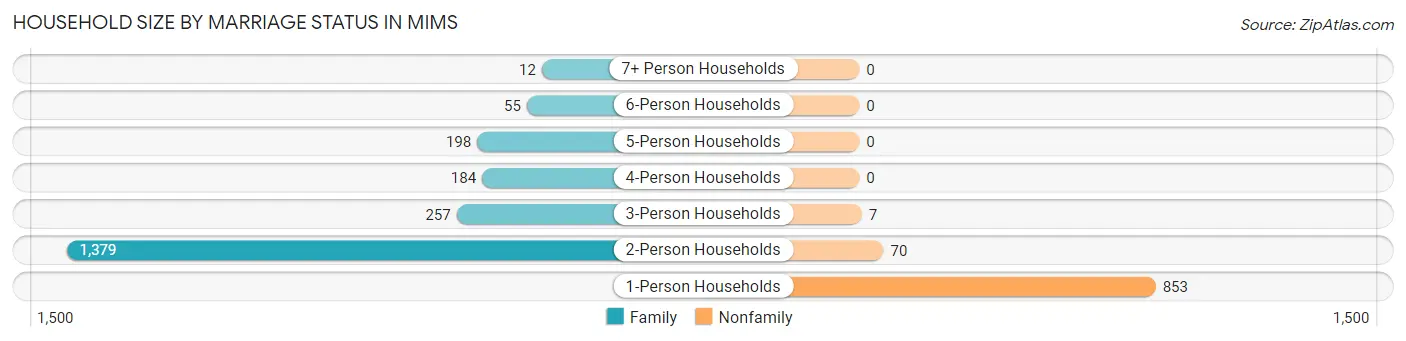
| Household Size | Family Households | Nonfamily Households |
| 1-Person Households | - | 853 (28.3%) |
| 2-Person Households | 1,379 (45.7%) | 70 (2.3%) |
| 3-Person Households | 257 (8.5%) | 7 (0.2%) |
| 4-Person Households | 184 (6.1%) | 0 (0.0%) |
| 5-Person Households | 198 (6.6%) | 0 (0.0%) |
| 6-Person Households | 55 (1.8%) | 0 (0.0%) |
| 7+ Person Households | 12 (0.4%) | 0 (0.0%) |
| Total | 2,085 (69.2%) | 930 (30.8%) |
Female Fertility in Mims
Fertility by Age in Mims
Average fertility rate in Mims is 49.0 births per 1,000 women. Women in the age bracket of 20 to 34 years have the highest fertility rate with 95.0 births per 1,000 women. Women in the age bracket of 20 to 34 years acount for 68.0% of all women with births.
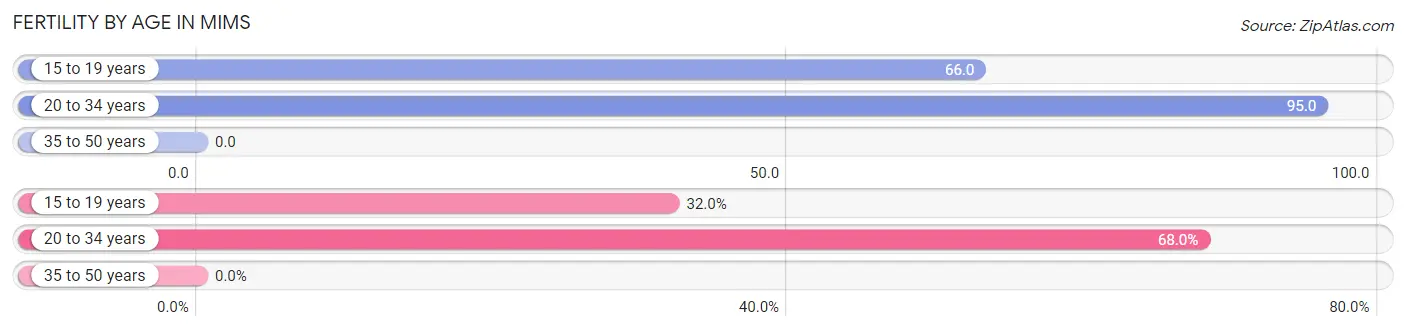
| Age Bracket | Women with Births | Births / 1,000 Women |
| 15 to 19 years | 16 (32.0%) | 66.0 |
| 20 to 34 years | 34 (68.0%) | 95.0 |
| 35 to 50 years | 0 (0.0%) | 0.0 |
| Total | 50 (100.0%) | 49.0 |
Fertility by Age by Marriage Status in Mims
70.0% of women with births (50) in Mims are married. The highest percentage of unmarried women with births falls into 20 to 34 years age bracket with 44.1% of them unmarried at the time of birth, while the lowest percentage of unmarried women with births belong to 15 to 19 years age bracket with 0.0% of them unmarried.
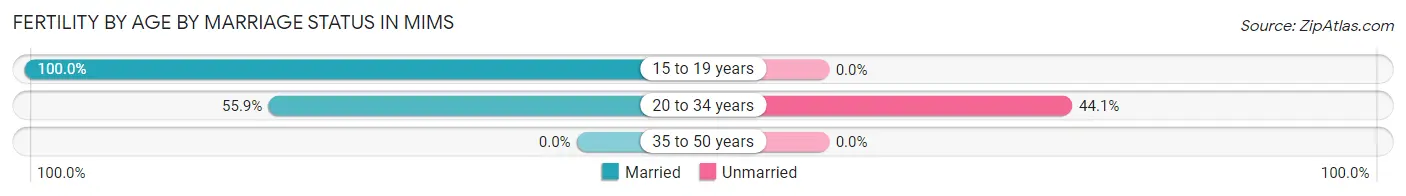
| Age Bracket | Married | Unmarried |
| 15 to 19 years | 16 (100.0%) | 0 (0.0%) |
| 20 to 34 years | 19 (55.9%) | 15 (44.1%) |
| 35 to 50 years | 0 (0.0%) | 0 (0.0%) |
| Total | 35 (70.0%) | 15 (30.0%) |
Fertility by Education in Mims
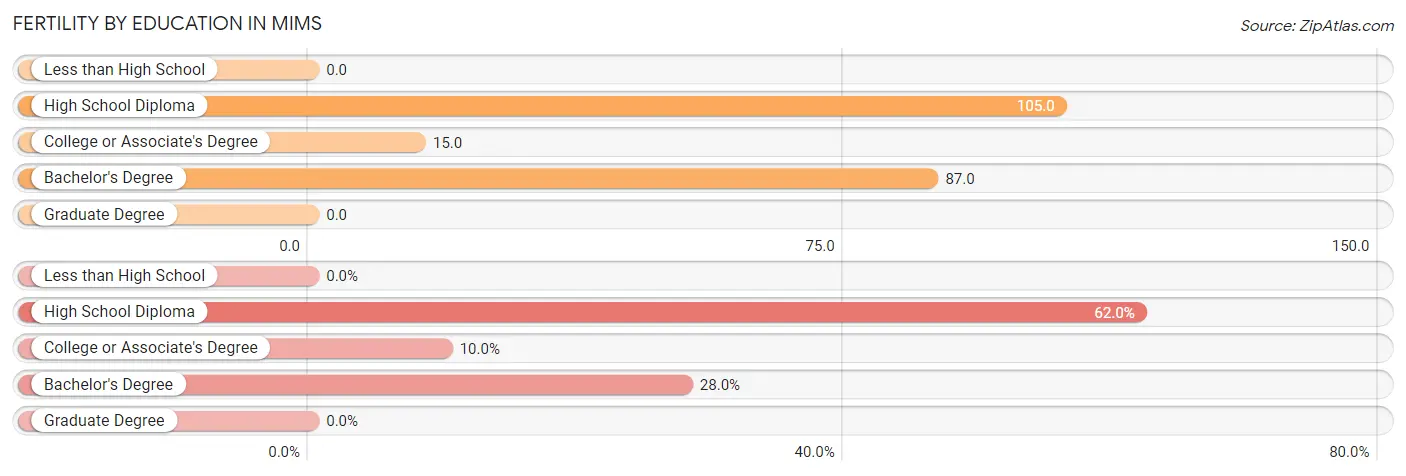
| Educational Attainment | Women with Births | Births / 1,000 Women |
| Less than High School | 0 (0.0%) | 0.0 |
| High School Diploma | 31 (62.0%) | 105.0 |
| College or Associate's Degree | 5 (10.0%) | 15.0 |
| Bachelor's Degree | 14 (28.0%) | 87.0 |
| Graduate Degree | 0 (0.0%) | 0.0 |
| Total | 50 (100.0%) | 49.0 |
Fertility by Education by Marriage Status in Mims
30.0% of women with births in Mims are unmarried. Women with the educational attainment of college or associate's degree are most likely to be married with 100.0% of them married at childbirth, while women with the educational attainment of high school diploma are least likely to be married with 48.4% of them unmarried at childbirth.
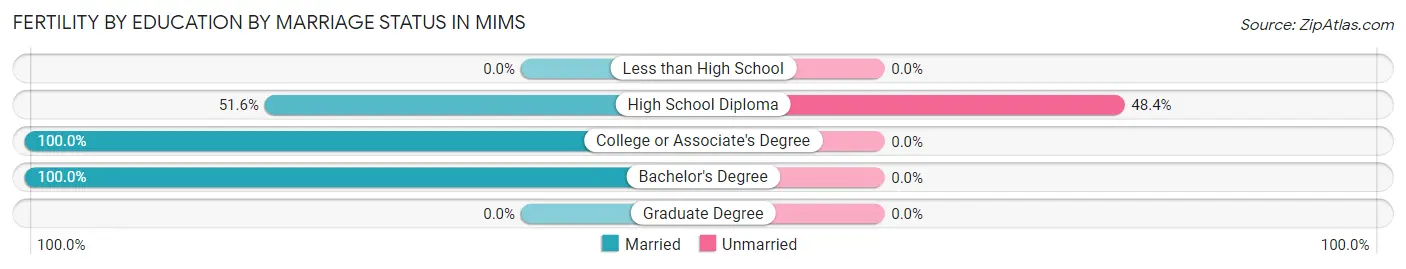
| Educational Attainment | Married | Unmarried |
| Less than High School | 0 (0.0%) | 0 (0.0%) |
| High School Diploma | 16 (51.6%) | 15 (48.4%) |
| College or Associate's Degree | 5 (100.0%) | 0 (0.0%) |
| Bachelor's Degree | 14 (100.0%) | 0 (0.0%) |
| Graduate Degree | 0 (0.0%) | 0 (0.0%) |
| Total | 35 (70.0%) | 15 (30.0%) |
Employment Characteristics in Mims
Employment by Class of Employer in Mims
Among the 2,253 employed individuals in Mims, private company employees (1,491 | 66.2%), not-for-profit organizations (244 | 10.8%), and self-employed (incorporated) (130 | 5.8%) make up the most common classes of employment.
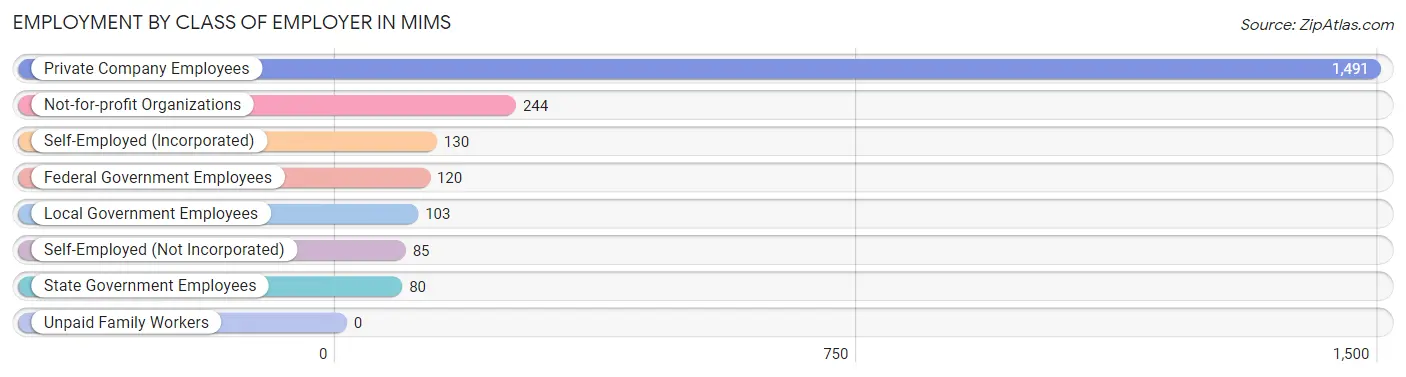
| Employer Class | # Employees | % Employees |
| Private Company Employees | 1,491 | 66.2% |
| Self-Employed (Incorporated) | 130 | 5.8% |
| Self-Employed (Not Incorporated) | 85 | 3.8% |
| Not-for-profit Organizations | 244 | 10.8% |
| Local Government Employees | 103 | 4.6% |
| State Government Employees | 80 | 3.5% |
| Federal Government Employees | 120 | 5.3% |
| Unpaid Family Workers | 0 | 0.0% |
| Total | 2,253 | 100.0% |
Employment Status by Age in Mims
According to the labor force statistics for Mims, out of the total population over 16 years of age (6,279), 38.7% or 2,430 individuals are in the labor force, with 6.5% or 158 of them unemployed. The age group with the highest labor force participation rate is 45 to 54 years, with 81.3% or 639 individuals in the labor force. Within the labor force, the 30 to 34 years age range has the highest percentage of unemployed individuals, with 20.3% or 31 of them being unemployed.
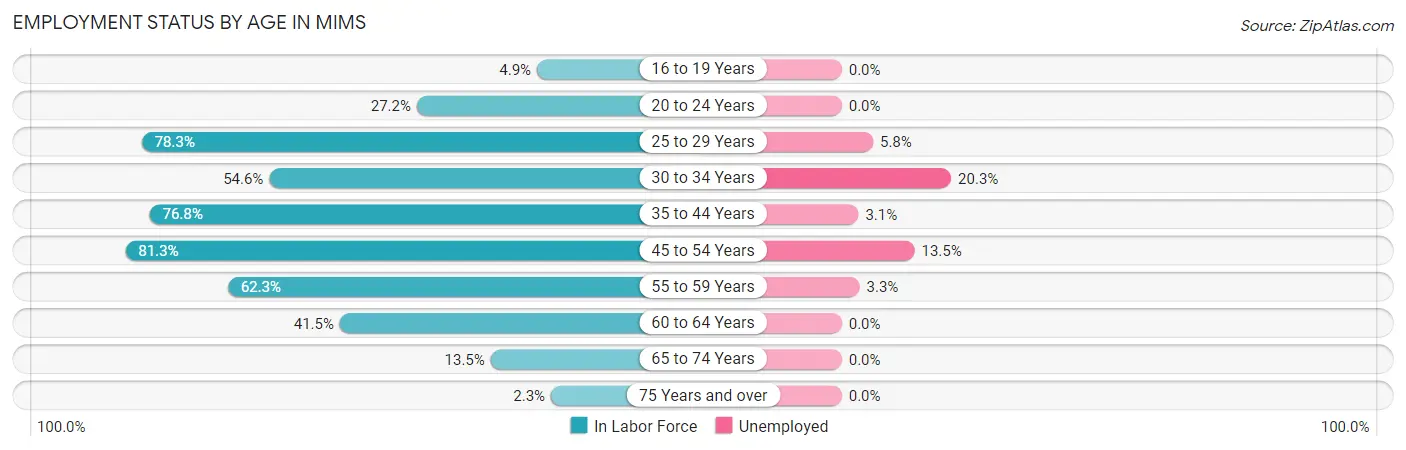
| Age Bracket | In Labor Force | Unemployed |
| 16 to 19 Years | 17 (4.9%) | 0 (0.0%) |
| 20 to 24 Years | 55 (27.2%) | 0 (0.0%) |
| 25 to 29 Years | 292 (78.3%) | 17 (5.8%) |
| 30 to 34 Years | 153 (54.6%) | 31 (20.3%) |
| 35 to 44 Years | 351 (76.8%) | 11 (3.1%) |
| 45 to 54 Years | 639 (81.3%) | 86 (13.5%) |
| 55 to 59 Years | 391 (62.3%) | 13 (3.3%) |
| 60 to 64 Years | 355 (41.5%) | 0 (0.0%) |
| 65 to 74 Years | 151 (13.5%) | 0 (0.0%) |
| 75 Years and over | 28 (2.3%) | 0 (0.0%) |
| Total | 2,430 (38.7%) | 158 (6.5%) |
Employment Status by Educational Attainment in Mims
According to labor force statistics for Mims, 64.5% of individuals (2,180) out of the total population between 25 and 64 years of age (3,380) are in the labor force, with 7.2% or 157 of them being unemployed. The group with the highest labor force participation rate are those with the educational attainment of bachelor's degree or higher, with 65.7% or 438 individuals in the labor force. Within the labor force, individuals with less than high school education have the highest percentage of unemployment, with 33.5% or 72 of them being unemployed.
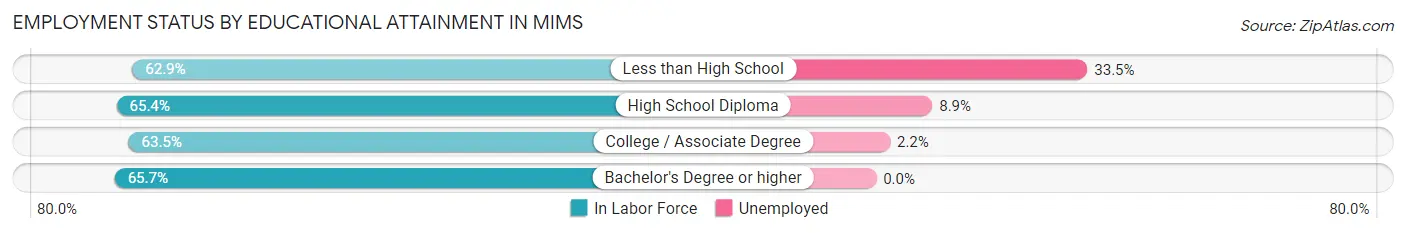
| Educational Attainment | In Labor Force | Unemployed |
| Less than High School | 215 (62.9%) | 115 (33.5%) |
| High School Diploma | 771 (65.4%) | 105 (8.9%) |
| College / Associate Degree | 757 (63.5%) | 26 (2.2%) |
| Bachelor's Degree or higher | 438 (65.7%) | 0 (0.0%) |
| Total | 2,180 (64.5%) | 243 (7.2%) |
Employment Occupations by Sex in Mims
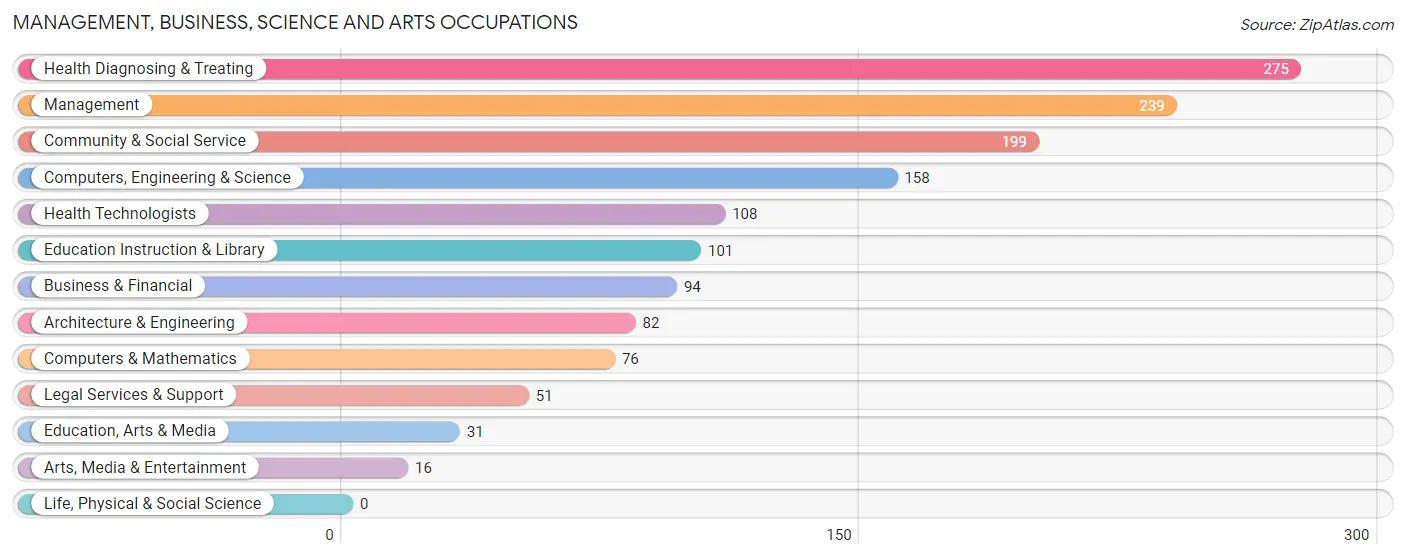
Management, Business, Science and Arts Occupations
The most common Management, Business, Science and Arts occupations in Mims are Health Diagnosing & Treating (275 | 12.1%), Management (239 | 10.5%), Community & Social Service (199 | 8.7%), Computers, Engineering & Science (158 | 7.0%), and Health Technologists (108 | 4.8%).
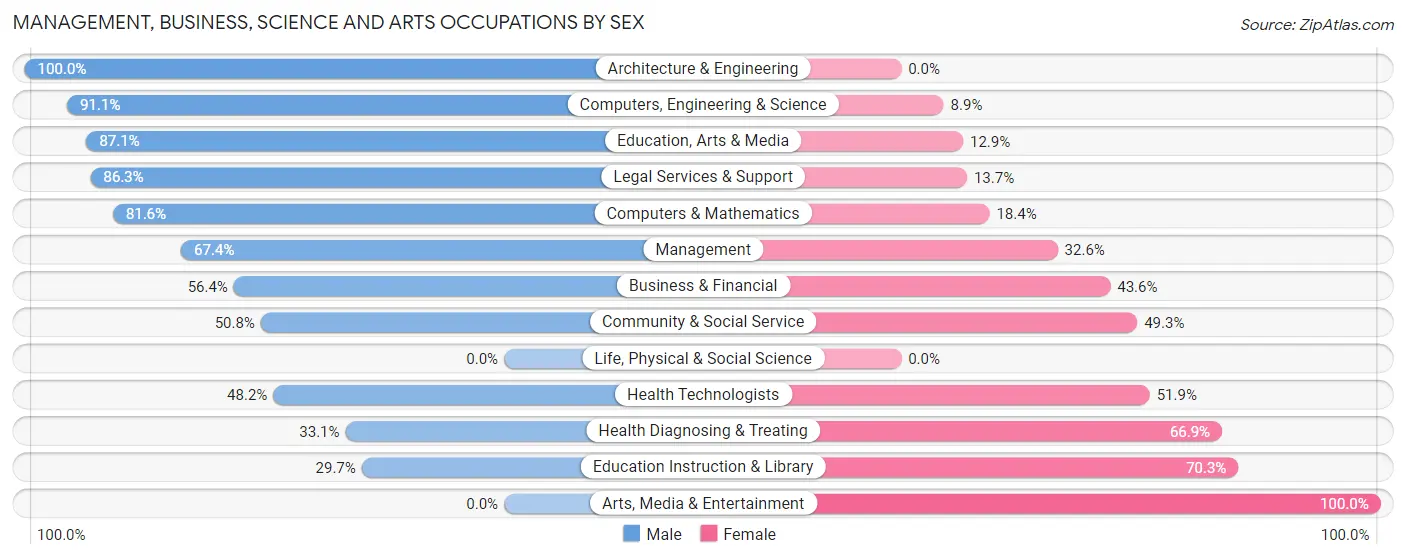
Management, Business, Science and Arts Occupations by Sex
Within the Management, Business, Science and Arts occupations in Mims, the most male-oriented occupations are Architecture & Engineering (100.0%), Computers, Engineering & Science (91.1%), and Education, Arts & Media (87.1%), while the most female-oriented occupations are Arts, Media & Entertainment (100.0%), Education Instruction & Library (70.3%), and Health Diagnosing & Treating (66.9%).
| Occupation | Male | Female |
| Management | 161 (67.4%) | 78 (32.6%) |
| Business & Financial | 53 (56.4%) | 41 (43.6%) |
| Computers, Engineering & Science | 144 (91.1%) | 14 (8.9%) |
| Computers & Mathematics | 62 (81.6%) | 14 (18.4%) |
| Architecture & Engineering | 82 (100.0%) | 0 (0.0%) |
| Life, Physical & Social Science | 0 (0.0%) | 0 (0.0%) |
| Community & Social Service | 101 (50.7%) | 98 (49.2%) |
| Education, Arts & Media | 27 (87.1%) | 4 (12.9%) |
| Legal Services & Support | 44 (86.3%) | 7 (13.7%) |
| Education Instruction & Library | 30 (29.7%) | 71 (70.3%) |
| Arts, Media & Entertainment | 0 (0.0%) | 16 (100.0%) |
| Health Diagnosing & Treating | 91 (33.1%) | 184 (66.9%) |
| Health Technologists | 52 (48.1%) | 56 (51.8%) |
| Total (Category) | 550 (57.0%) | 415 (43.0%) |
| Total (Overall) | 1,408 (61.9%) | 866 (38.1%) |
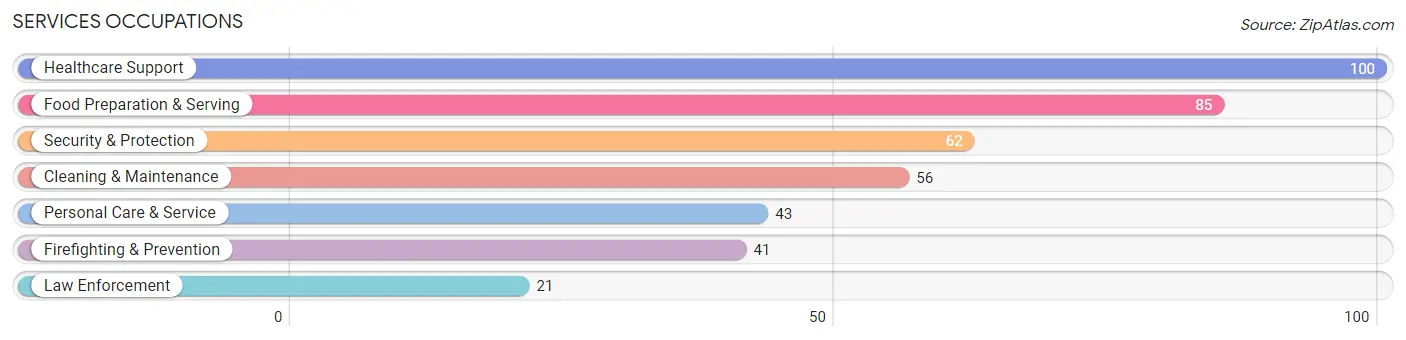
Services Occupations
The most common Services occupations in Mims are Healthcare Support (100 | 4.4%), Food Preparation & Serving (85 | 3.7%), Security & Protection (62 | 2.7%), Cleaning & Maintenance (56 | 2.5%), and Personal Care & Service (43 | 1.9%).
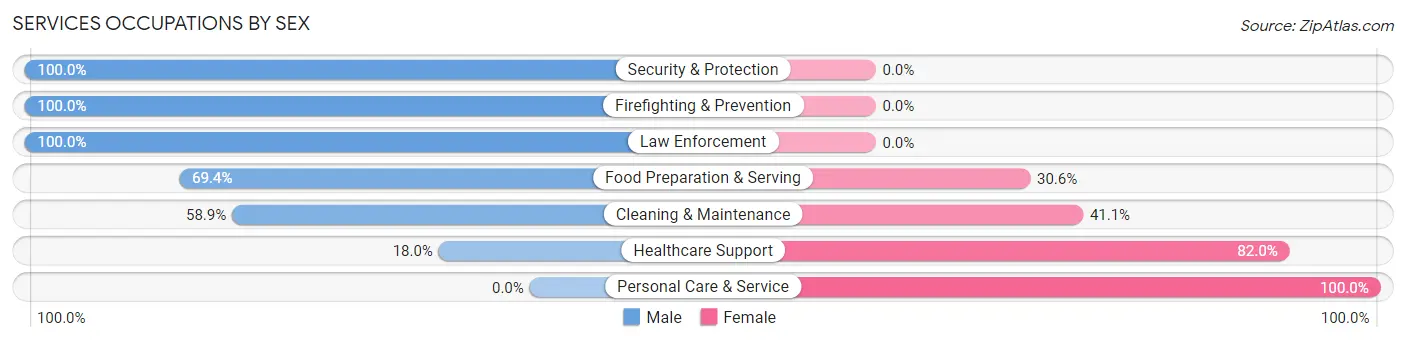
Services Occupations by Sex
Within the Services occupations in Mims, the most male-oriented occupations are Security & Protection (100.0%), Firefighting & Prevention (100.0%), and Law Enforcement (100.0%), while the most female-oriented occupations are Personal Care & Service (100.0%), Healthcare Support (82.0%), and Cleaning & Maintenance (41.1%).
| Occupation | Male | Female |
| Healthcare Support | 18 (18.0%) | 82 (82.0%) |
| Security & Protection | 62 (100.0%) | 0 (0.0%) |
| Firefighting & Prevention | 41 (100.0%) | 0 (0.0%) |
| Law Enforcement | 21 (100.0%) | 0 (0.0%) |
| Food Preparation & Serving | 59 (69.4%) | 26 (30.6%) |
| Cleaning & Maintenance | 33 (58.9%) | 23 (41.1%) |
| Personal Care & Service | 0 (0.0%) | 43 (100.0%) |
| Total (Category) | 172 (49.7%) | 174 (50.3%) |
| Total (Overall) | 1,408 (61.9%) | 866 (38.1%) |
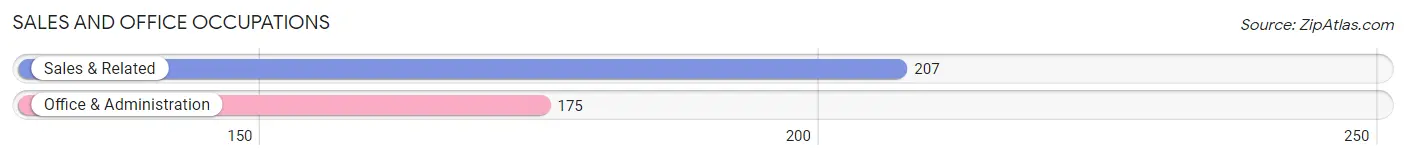
Sales and Office Occupations
The most common Sales and Office occupations in Mims are Sales & Related (207 | 9.1%), and Office & Administration (175 | 7.7%).
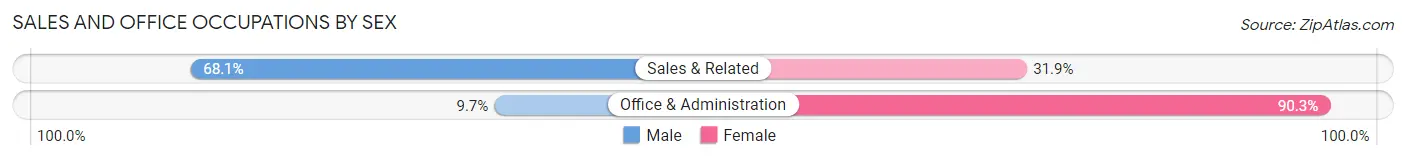
Sales and Office Occupations by Sex
| Occupation | Male | Female |
| Sales & Related | 141 (68.1%) | 66 (31.9%) |
| Office & Administration | 17 (9.7%) | 158 (90.3%) |
| Total (Category) | 158 (41.4%) | 224 (58.6%) |
| Total (Overall) | 1,408 (61.9%) | 866 (38.1%) |
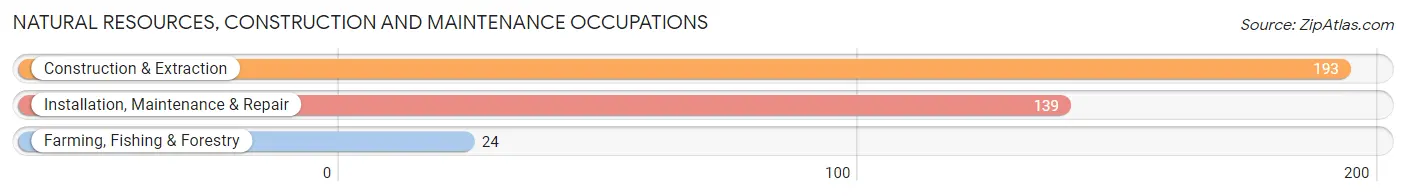
Natural Resources, Construction and Maintenance Occupations
The most common Natural Resources, Construction and Maintenance occupations in Mims are Construction & Extraction (193 | 8.5%), Installation, Maintenance & Repair (139 | 6.1%), and Farming, Fishing & Forestry (24 | 1.1%).
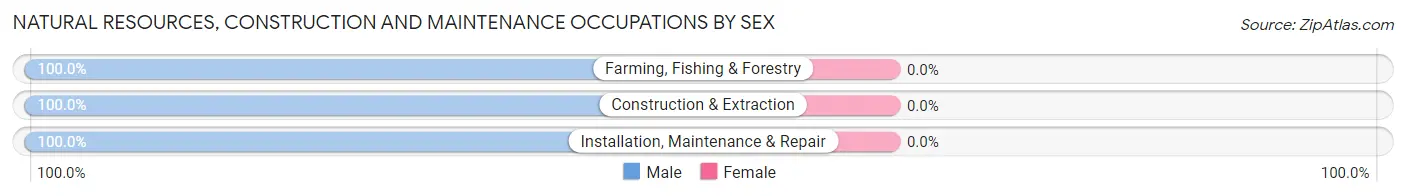
Natural Resources, Construction and Maintenance Occupations by Sex
| Occupation | Male | Female |
| Farming, Fishing & Forestry | 24 (100.0%) | 0 (0.0%) |
| Construction & Extraction | 193 (100.0%) | 0 (0.0%) |
| Installation, Maintenance & Repair | 139 (100.0%) | 0 (0.0%) |
| Total (Category) | 356 (100.0%) | 0 (0.0%) |
| Total (Overall) | 1,408 (61.9%) | 866 (38.1%) |
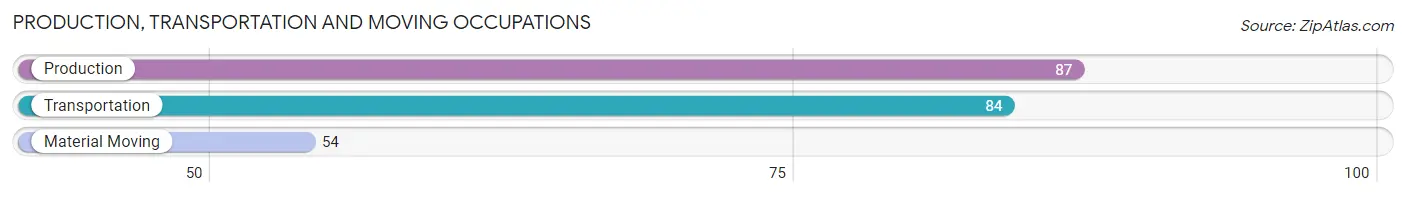
Production, Transportation and Moving Occupations
The most common Production, Transportation and Moving occupations in Mims are Production (87 | 3.8%), Transportation (84 | 3.7%), and Material Moving (54 | 2.4%).
Production, Transportation and Moving Occupations by Sex
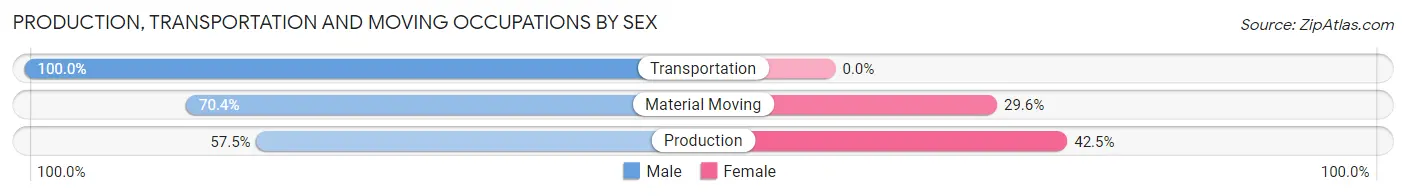
| Occupation | Male | Female |
| Production | 50 (57.5%) | 37 (42.5%) |
| Transportation | 84 (100.0%) | 0 (0.0%) |
| Material Moving | 38 (70.4%) | 16 (29.6%) |
| Total (Category) | 172 (76.4%) | 53 (23.6%) |
| Total (Overall) | 1,408 (61.9%) | 866 (38.1%) |
Employment Industries by Sex in Mims
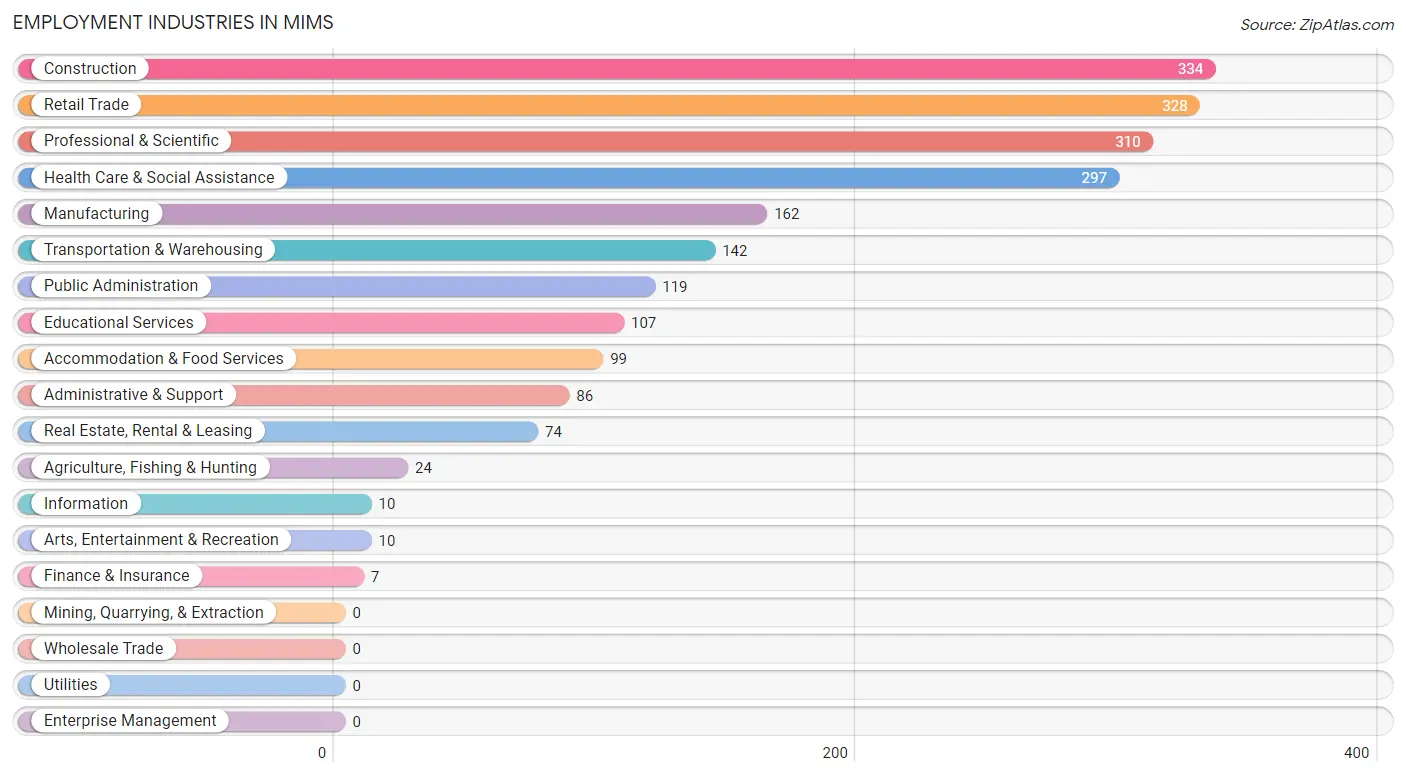
Employment Industries in Mims
The major employment industries in Mims include Construction (334 | 14.7%), Retail Trade (328 | 14.4%), Professional & Scientific (310 | 13.6%), Health Care & Social Assistance (297 | 13.1%), and Manufacturing (162 | 7.1%).
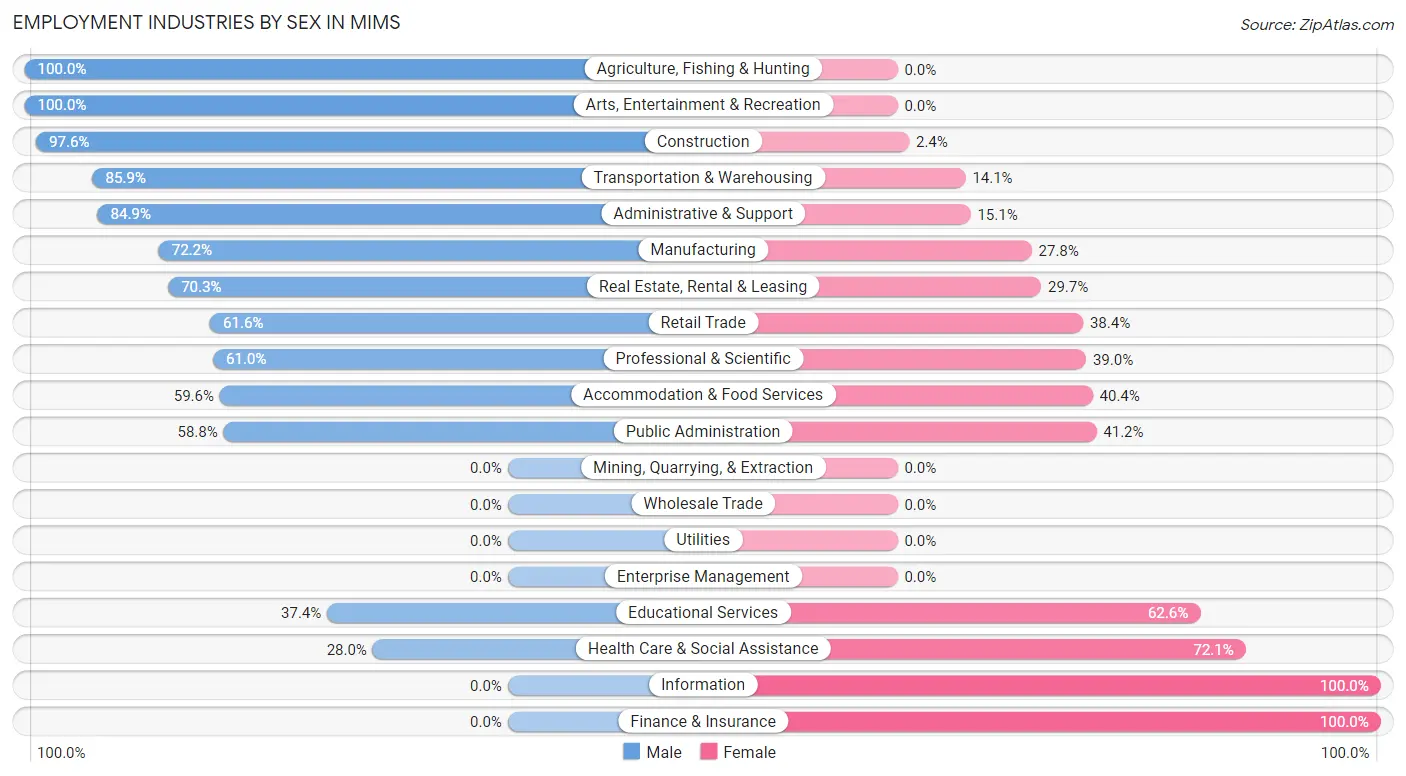
Employment Industries by Sex in Mims
The Mims industries that see more men than women are Agriculture, Fishing & Hunting (100.0%), Arts, Entertainment & Recreation (100.0%), and Construction (97.6%), whereas the industries that tend to have a higher number of women are Information (100.0%), Finance & Insurance (100.0%), and Health Care & Social Assistance (72.1%).
| Industry | Male | Female |
| Agriculture, Fishing & Hunting | 24 (100.0%) | 0 (0.0%) |
| Mining, Quarrying, & Extraction | 0 (0.0%) | 0 (0.0%) |
| Construction | 326 (97.6%) | 8 (2.4%) |
| Manufacturing | 117 (72.2%) | 45 (27.8%) |
| Wholesale Trade | 0 (0.0%) | 0 (0.0%) |
| Retail Trade | 202 (61.6%) | 126 (38.4%) |
| Transportation & Warehousing | 122 (85.9%) | 20 (14.1%) |
| Utilities | 0 (0.0%) | 0 (0.0%) |
| Information | 0 (0.0%) | 10 (100.0%) |
| Finance & Insurance | 0 (0.0%) | 7 (100.0%) |
| Real Estate, Rental & Leasing | 52 (70.3%) | 22 (29.7%) |
| Professional & Scientific | 189 (61.0%) | 121 (39.0%) |
| Enterprise Management | 0 (0.0%) | 0 (0.0%) |
| Administrative & Support | 73 (84.9%) | 13 (15.1%) |
| Educational Services | 40 (37.4%) | 67 (62.6%) |
| Health Care & Social Assistance | 83 (28.0%) | 214 (72.1%) |
| Arts, Entertainment & Recreation | 10 (100.0%) | 0 (0.0%) |
| Accommodation & Food Services | 59 (59.6%) | 40 (40.4%) |
| Public Administration | 70 (58.8%) | 49 (41.2%) |
| Total | 1,408 (61.9%) | 866 (38.1%) |
Education in Mims
School Enrollment in Mims
The most common levels of schooling among the 1,246 students in Mims are high school (462 | 37.1%), middle school (312 | 25.0%), and elementary school (210 | 16.9%).
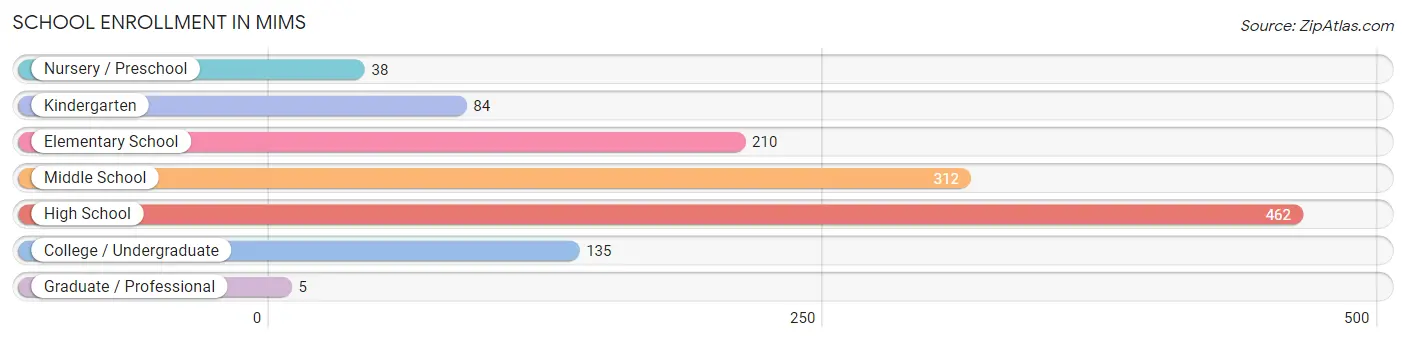
| School Level | # Students | % Students |
| Nursery / Preschool | 38 | 3.0% |
| Kindergarten | 84 | 6.7% |
| Elementary School | 210 | 16.9% |
| Middle School | 312 | 25.0% |
| High School | 462 | 37.1% |
| College / Undergraduate | 135 | 10.8% |
| Graduate / Professional | 5 | 0.4% |
| Total | 1,246 | 100.0% |
School Enrollment by Age by Funding Source in Mims
Out of a total of 1,246 students who are enrolled in schools in Mims, 125 (10.0%) attend a private institution, while the remaining 1,121 (90.0%) are enrolled in public schools. The age group of 35 years and over has the highest likelihood of being enrolled in private schools, with 5 (100.0% in the age bracket) enrolled. Conversely, the age group of 3 to 4 year olds has the lowest likelihood of being enrolled in a private school, with 38 (100.0% in the age bracket) attending a public institution.
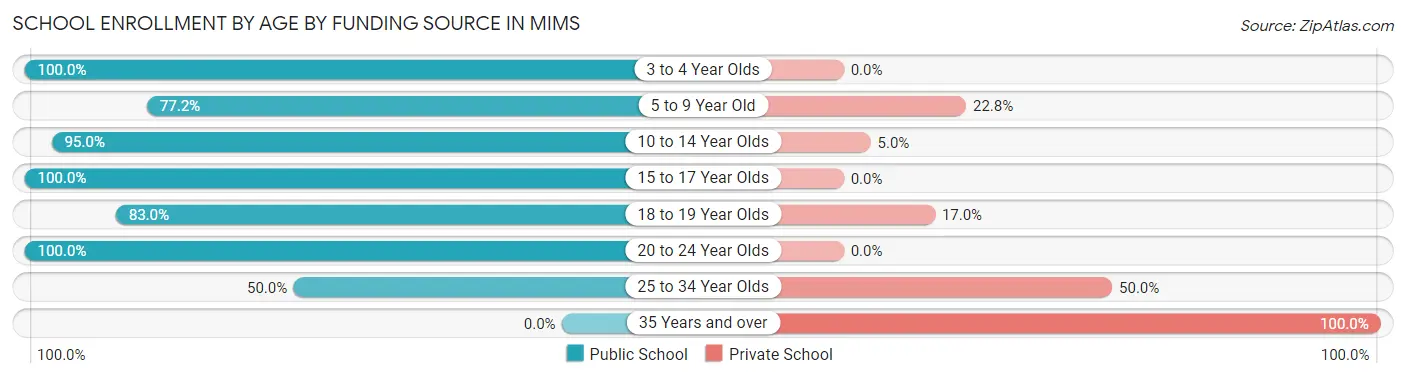
| Age Bracket | Public School | Private School |
| 3 to 4 Year Olds | 38 (100.0%) | 0 (0.0%) |
| 5 to 9 Year Old | 227 (77.2%) | 67 (22.8%) |
| 10 to 14 Year Olds | 379 (95.0%) | 20 (5.0%) |
| 15 to 17 Year Olds | 310 (100.0%) | 0 (0.0%) |
| 18 to 19 Year Olds | 83 (83.0%) | 17 (17.0%) |
| 20 to 24 Year Olds | 68 (100.0%) | 0 (0.0%) |
| 25 to 34 Year Olds | 16 (50.0%) | 16 (50.0%) |
| 35 Years and over | 0 (0.0%) | 5 (100.0%) |
| Total | 1,121 (90.0%) | 125 (10.0%) |
Educational Attainment by Field of Study in Mims
Engineering (211 | 21.2%), education (138 | 13.9%), business (116 | 11.7%), science & technology (112 | 11.3%), and physical & health sciences (66 | 6.6%) are the most common fields of study among 995 individuals in Mims who have obtained a bachelor's degree or higher.
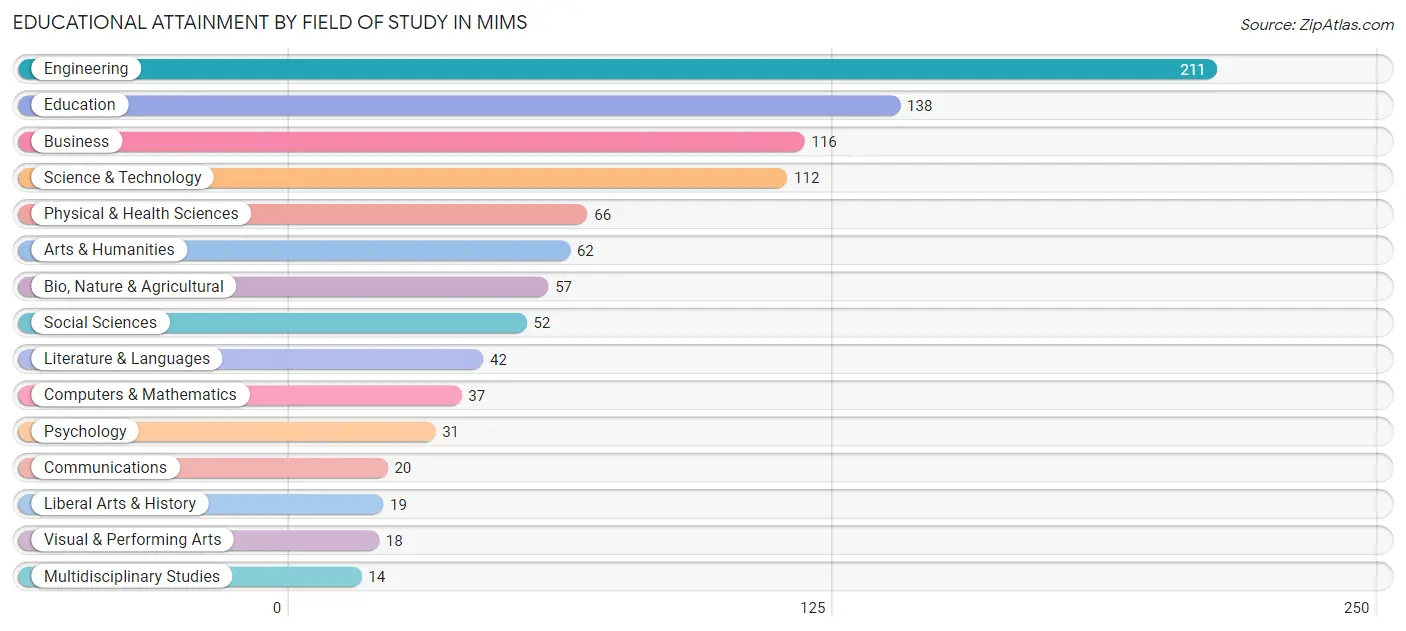
| Field of Study | # Graduates | % Graduates |
| Computers & Mathematics | 37 | 3.7% |
| Bio, Nature & Agricultural | 57 | 5.7% |
| Physical & Health Sciences | 66 | 6.6% |
| Psychology | 31 | 3.1% |
| Social Sciences | 52 | 5.2% |
| Engineering | 211 | 21.2% |
| Multidisciplinary Studies | 14 | 1.4% |
| Science & Technology | 112 | 11.3% |
| Business | 116 | 11.7% |
| Education | 138 | 13.9% |
| Literature & Languages | 42 | 4.2% |
| Liberal Arts & History | 19 | 1.9% |
| Visual & Performing Arts | 18 | 1.8% |
| Communications | 20 | 2.0% |
| Arts & Humanities | 62 | 6.2% |
| Total | 995 | 100.0% |
Transportation & Commute in Mims
Vehicle Availability by Sex in Mims
The most prevalent vehicle ownership categories in Mims are males with 2 vehicles (749, accounting for 54.0%) and females with 2 vehicles (423, making up 86.5%).
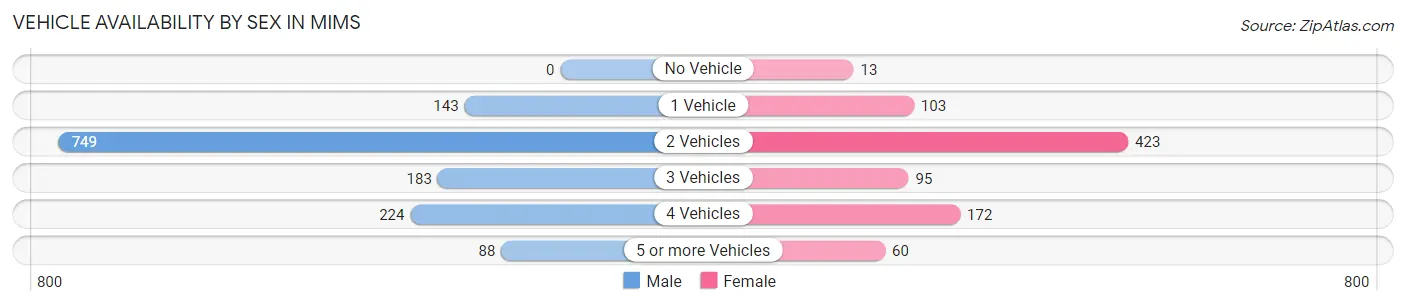
| Vehicles Available | Male | Female |
| No Vehicle | 0 (0.0%) | 13 (1.5%) |
| 1 Vehicle | 143 (10.3%) | 103 (11.9%) |
| 2 Vehicles | 749 (54.0%) | 423 (48.8%) |
| 3 Vehicles | 183 (13.2%) | 95 (11.0%) |
| 4 Vehicles | 224 (16.2%) | 172 (19.9%) |
| 5 or more Vehicles | 88 (6.3%) | 60 (6.9%) |
| Total | 1,387 (100.0%) | 866 (100.0%) |
Commute Time in Mims
The most frequently occuring commute durations in Mims are 15 to 19 minutes (409 commuters, 18.8%), 10 to 14 minutes (320 commuters, 14.7%), and 30 to 34 minutes (291 commuters, 13.4%).
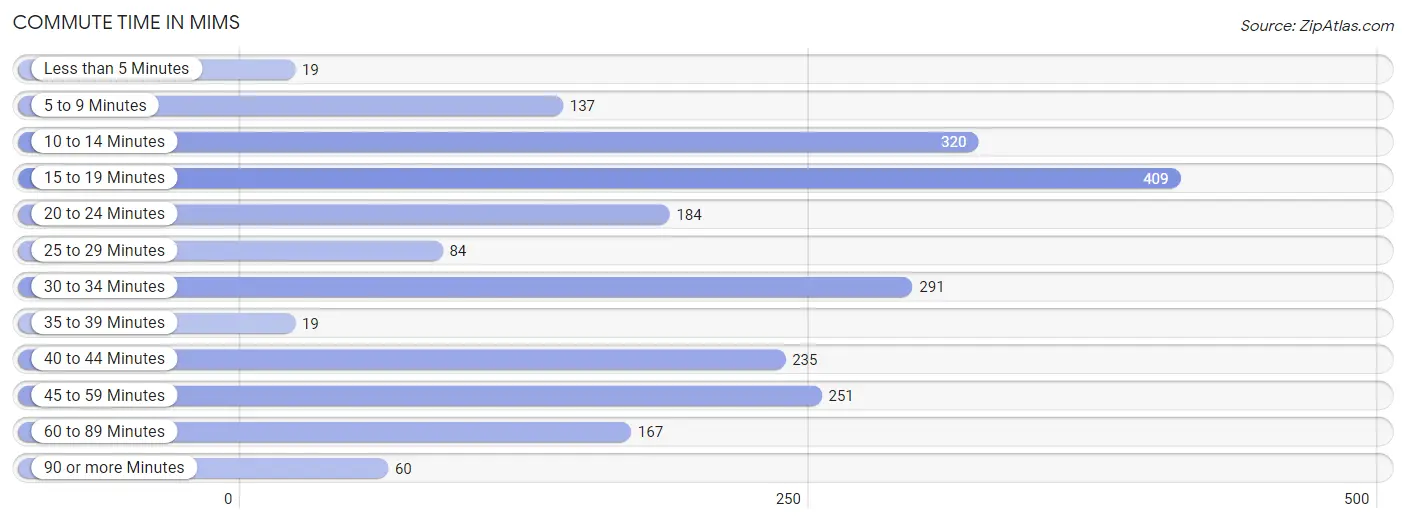
| Commute Time | # Commuters | % Commuters |
| Less than 5 Minutes | 19 | 0.9% |
| 5 to 9 Minutes | 137 | 6.3% |
| 10 to 14 Minutes | 320 | 14.7% |
| 15 to 19 Minutes | 409 | 18.8% |
| 20 to 24 Minutes | 184 | 8.5% |
| 25 to 29 Minutes | 84 | 3.9% |
| 30 to 34 Minutes | 291 | 13.4% |
| 35 to 39 Minutes | 19 | 0.9% |
| 40 to 44 Minutes | 235 | 10.8% |
| 45 to 59 Minutes | 251 | 11.5% |
| 60 to 89 Minutes | 167 | 7.7% |
| 90 or more Minutes | 60 | 2.8% |
Commute Time by Sex in Mims
The most common commute times in Mims are 15 to 19 minutes (261 commuters, 19.9%) for males and 10 to 14 minutes (181 commuters, 20.9%) for females.
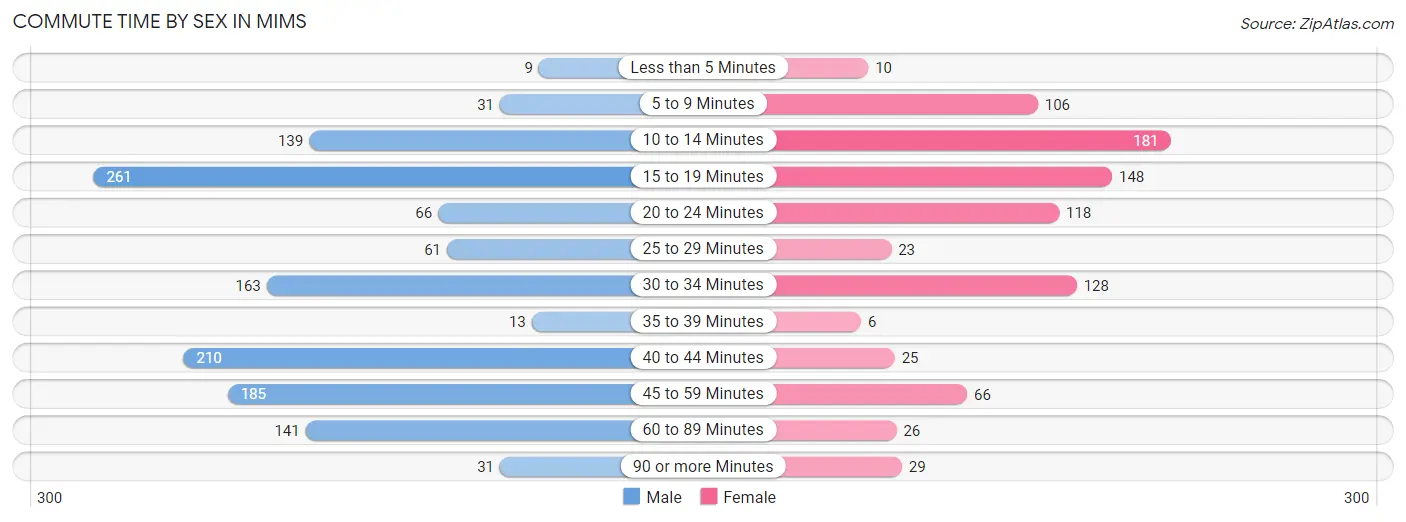
| Commute Time | Male | Female |
| Less than 5 Minutes | 9 (0.7%) | 10 (1.1%) |
| 5 to 9 Minutes | 31 (2.4%) | 106 (12.2%) |
| 10 to 14 Minutes | 139 (10.6%) | 181 (20.9%) |
| 15 to 19 Minutes | 261 (19.9%) | 148 (17.1%) |
| 20 to 24 Minutes | 66 (5.0%) | 118 (13.6%) |
| 25 to 29 Minutes | 61 (4.7%) | 23 (2.7%) |
| 30 to 34 Minutes | 163 (12.4%) | 128 (14.8%) |
| 35 to 39 Minutes | 13 (1.0%) | 6 (0.7%) |
| 40 to 44 Minutes | 210 (16.0%) | 25 (2.9%) |
| 45 to 59 Minutes | 185 (14.1%) | 66 (7.6%) |
| 60 to 89 Minutes | 141 (10.8%) | 26 (3.0%) |
| 90 or more Minutes | 31 (2.4%) | 29 (3.4%) |
Time of Departure to Work by Sex in Mims
The most frequent times of departure to work in Mims are 7:00 AM to 7:29 AM (256, 19.5%) for males and 7:00 AM to 7:29 AM (201, 23.2%) for females.
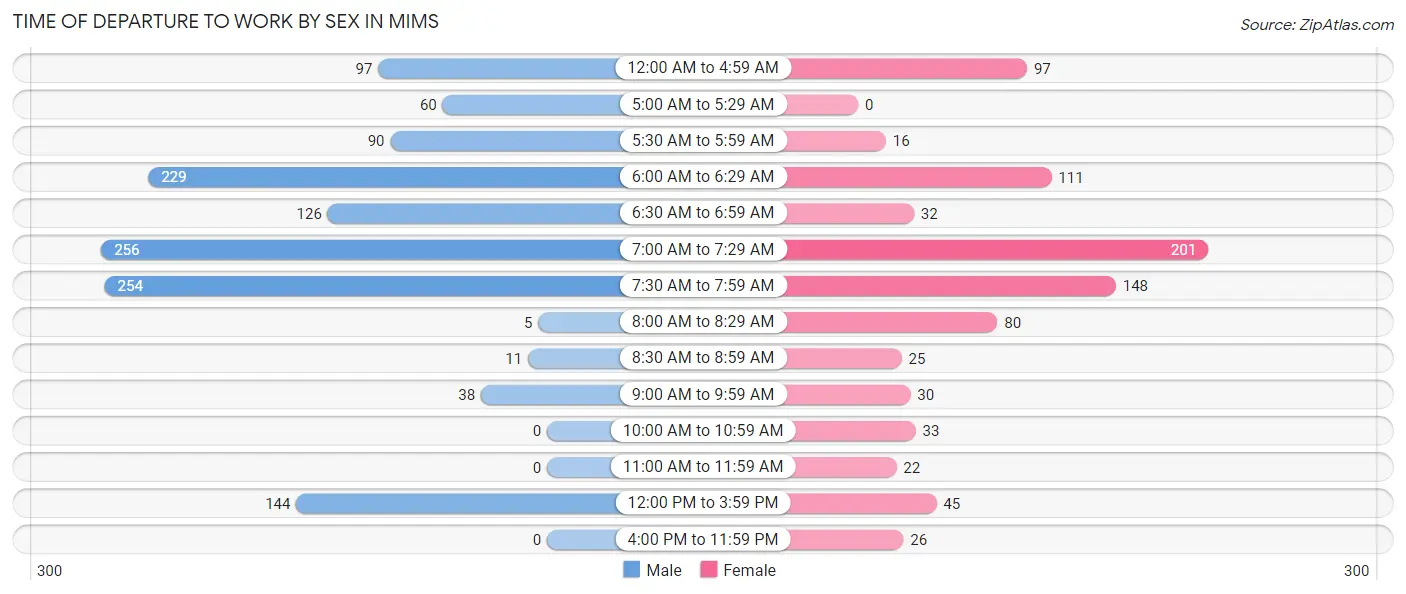
| Time of Departure | Male | Female |
| 12:00 AM to 4:59 AM | 97 (7.4%) | 97 (11.2%) |
| 5:00 AM to 5:29 AM | 60 (4.6%) | 0 (0.0%) |
| 5:30 AM to 5:59 AM | 90 (6.9%) | 16 (1.8%) |
| 6:00 AM to 6:29 AM | 229 (17.5%) | 111 (12.8%) |
| 6:30 AM to 6:59 AM | 126 (9.6%) | 32 (3.7%) |
| 7:00 AM to 7:29 AM | 256 (19.5%) | 201 (23.2%) |
| 7:30 AM to 7:59 AM | 254 (19.4%) | 148 (17.1%) |
| 8:00 AM to 8:29 AM | 5 (0.4%) | 80 (9.2%) |
| 8:30 AM to 8:59 AM | 11 (0.8%) | 25 (2.9%) |
| 9:00 AM to 9:59 AM | 38 (2.9%) | 30 (3.5%) |
| 10:00 AM to 10:59 AM | 0 (0.0%) | 33 (3.8%) |
| 11:00 AM to 11:59 AM | 0 (0.0%) | 22 (2.5%) |
| 12:00 PM to 3:59 PM | 144 (11.0%) | 45 (5.2%) |
| 4:00 PM to 11:59 PM | 0 (0.0%) | 26 (3.0%) |
| Total | 1,310 (100.0%) | 866 (100.0%) |
Housing Occupancy in Mims
Occupancy by Ownership in Mims
Of the total 3,015 dwellings in Mims, owner-occupied units account for 2,773 (92.0%), while renter-occupied units make up 242 (8.0%).
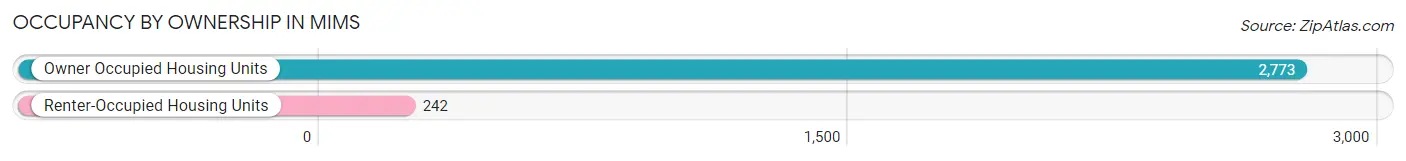
| Occupancy | # Housing Units | % Housing Units |
| Owner Occupied Housing Units | 2,773 | 92.0% |
| Renter-Occupied Housing Units | 242 | 8.0% |
| Total Occupied Housing Units | 3,015 | 100.0% |
Occupancy by Household Size in Mims
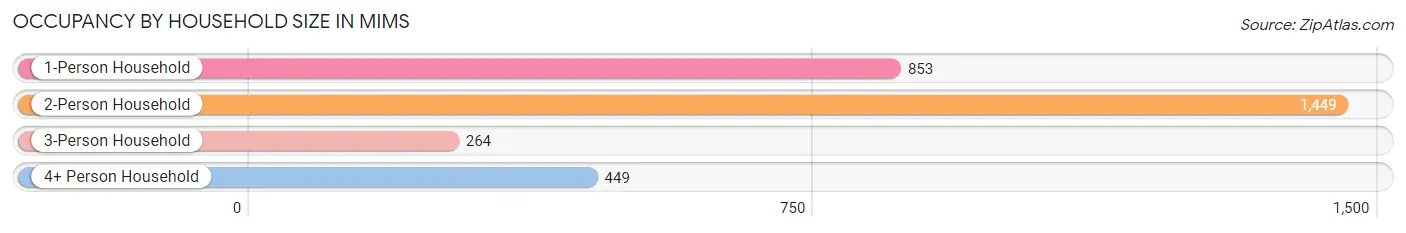
| Household Size | # Housing Units | % Housing Units |
| 1-Person Household | 853 | 28.3% |
| 2-Person Household | 1,449 | 48.1% |
| 3-Person Household | 264 | 8.8% |
| 4+ Person Household | 449 | 14.9% |
| Total Housing Units | 3,015 | 100.0% |
Occupancy by Ownership by Household Size in Mims
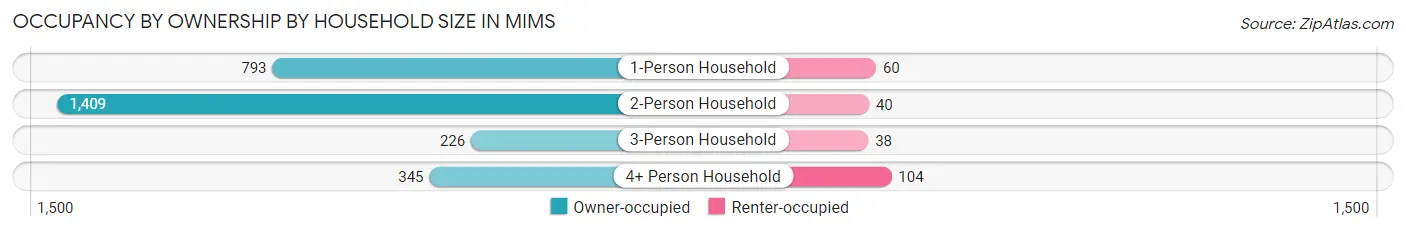
| Household Size | Owner-occupied | Renter-occupied |
| 1-Person Household | 793 (93.0%) | 60 (7.0%) |
| 2-Person Household | 1,409 (97.2%) | 40 (2.8%) |
| 3-Person Household | 226 (85.6%) | 38 (14.4%) |
| 4+ Person Household | 345 (76.8%) | 104 (23.2%) |
| Total Housing Units | 2,773 (92.0%) | 242 (8.0%) |
Occupancy by Educational Attainment in Mims
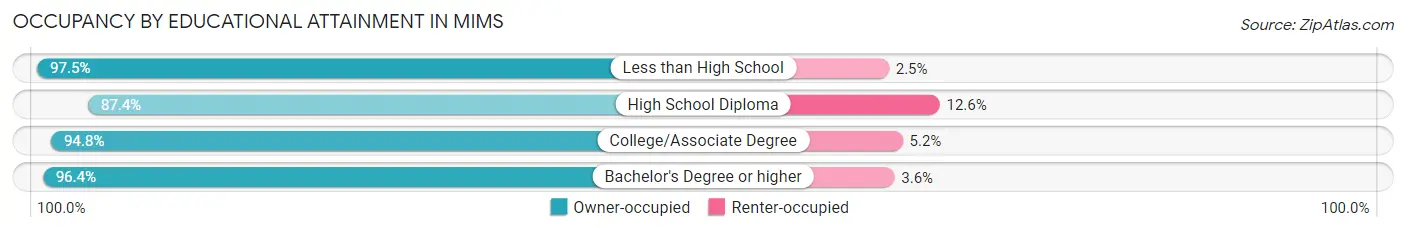
| Household Size | Owner-occupied | Renter-occupied |
| Less than High School | 234 (97.5%) | 6 (2.5%) |
| High School Diploma | 1,190 (87.4%) | 171 (12.6%) |
| College/Associate Degree | 814 (94.8%) | 45 (5.2%) |
| Bachelor's Degree or higher | 535 (96.4%) | 20 (3.6%) |
Occupancy by Age of Householder in Mims
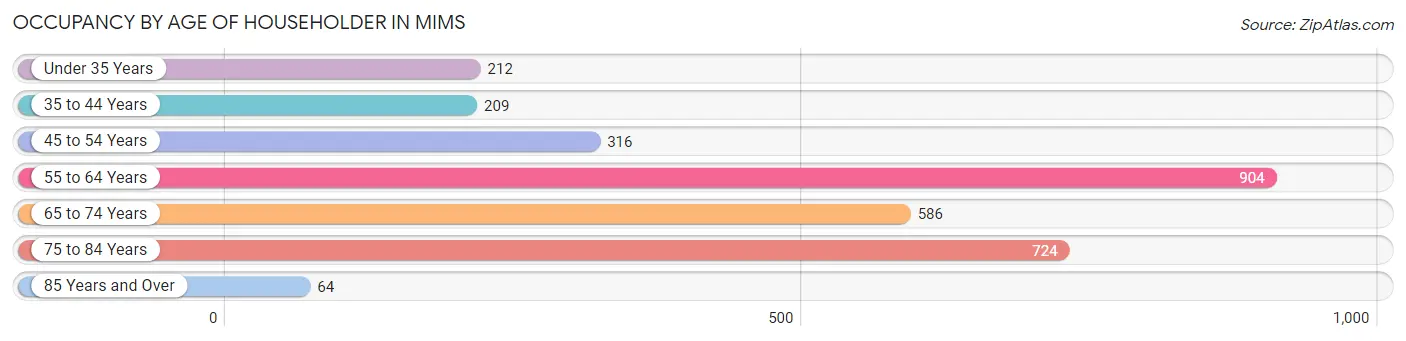
| Age Bracket | # Households | % Households |
| Under 35 Years | 212 | 7.0% |
| 35 to 44 Years | 209 | 6.9% |
| 45 to 54 Years | 316 | 10.5% |
| 55 to 64 Years | 904 | 30.0% |
| 65 to 74 Years | 586 | 19.4% |
| 75 to 84 Years | 724 | 24.0% |
| 85 Years and Over | 64 | 2.1% |
| Total | 3,015 | 100.0% |
Housing Finances in Mims
Median Income by Occupancy in Mims
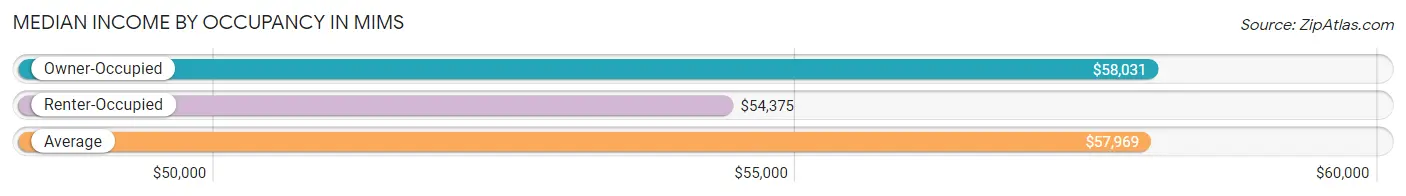
| Occupancy Type | # Households | Median Income |
| Owner-Occupied | 2,773 (92.0%) | $58,031 |
| Renter-Occupied | 242 (8.0%) | $54,375 |
| Average | 3,015 (100.0%) | $57,969 |
Occupancy by Householder Income Bracket in Mims
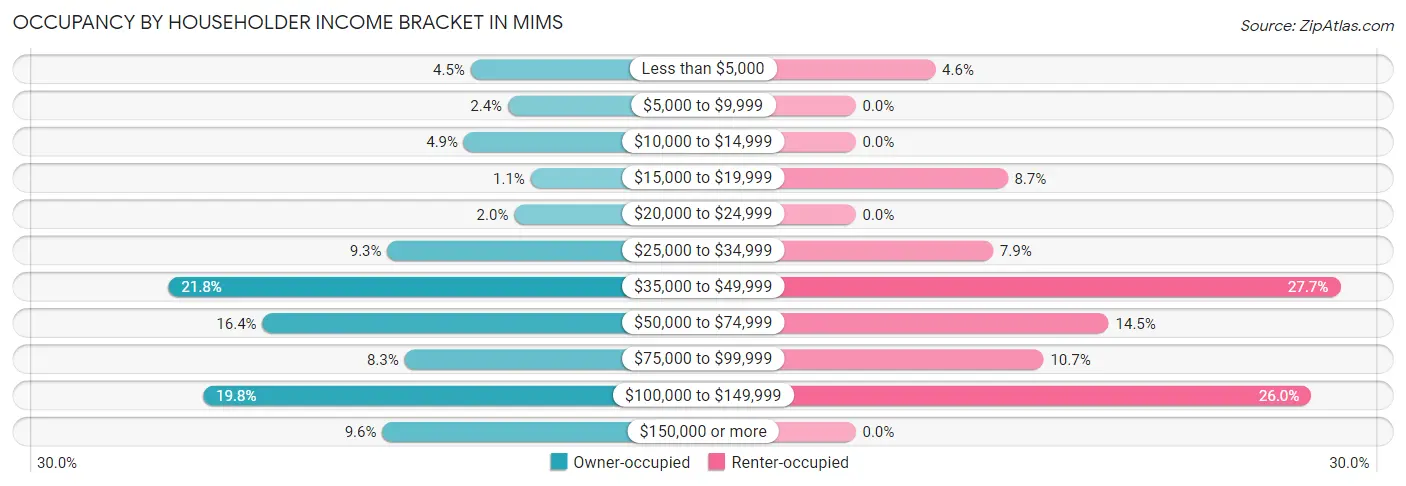
| Income Bracket | Owner-occupied | Renter-occupied |
| Less than $5,000 | 125 (4.5%) | 11 (4.5%) |
| $5,000 to $9,999 | 66 (2.4%) | 0 (0.0%) |
| $10,000 to $14,999 | 136 (4.9%) | 0 (0.0%) |
| $15,000 to $19,999 | 30 (1.1%) | 21 (8.7%) |
| $20,000 to $24,999 | 56 (2.0%) | 0 (0.0%) |
| $25,000 to $34,999 | 257 (9.3%) | 19 (7.9%) |
| $35,000 to $49,999 | 604 (21.8%) | 67 (27.7%) |
| $50,000 to $74,999 | 455 (16.4%) | 35 (14.5%) |
| $75,000 to $99,999 | 230 (8.3%) | 26 (10.7%) |
| $100,000 to $149,999 | 549 (19.8%) | 63 (26.0%) |
| $150,000 or more | 265 (9.6%) | 0 (0.0%) |
| Total | 2,773 (100.0%) | 242 (100.0%) |
Monthly Housing Cost Tiers in Mims
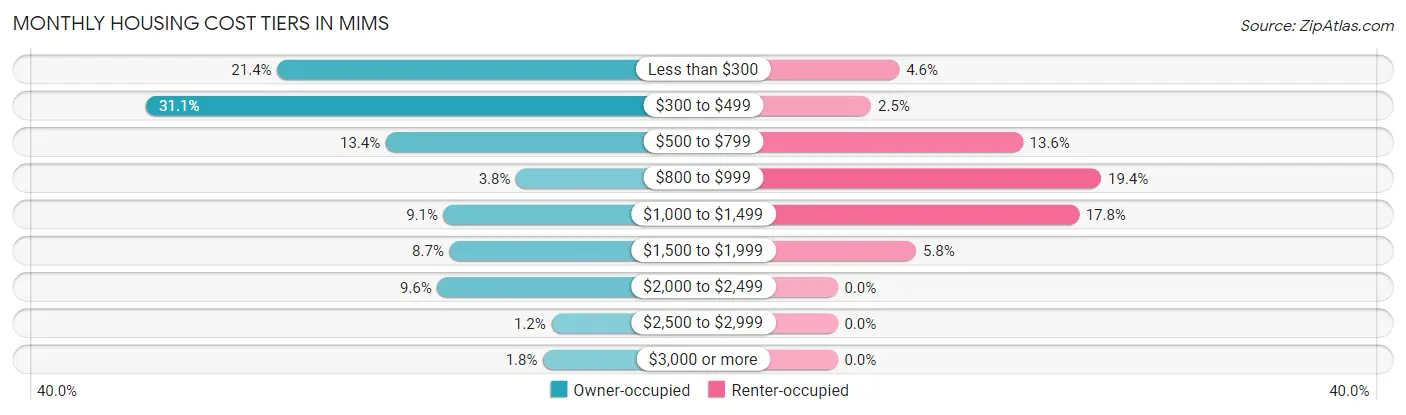
| Monthly Cost | Owner-occupied | Renter-occupied |
| Less than $300 | 593 (21.4%) | 11 (4.5%) |
| $300 to $499 | 861 (31.0%) | 6 (2.5%) |
| $500 to $799 | 371 (13.4%) | 33 (13.6%) |
| $800 to $999 | 105 (3.8%) | 47 (19.4%) |
| $1,000 to $1,499 | 253 (9.1%) | 43 (17.8%) |
| $1,500 to $1,999 | 241 (8.7%) | 14 (5.8%) |
| $2,000 to $2,499 | 266 (9.6%) | 0 (0.0%) |
| $2,500 to $2,999 | 33 (1.2%) | 0 (0.0%) |
| $3,000 or more | 50 (1.8%) | 0 (0.0%) |
| Total | 2,773 (100.0%) | 242 (100.0%) |
Physical Housing Characteristics in Mims
Housing Structures in Mims
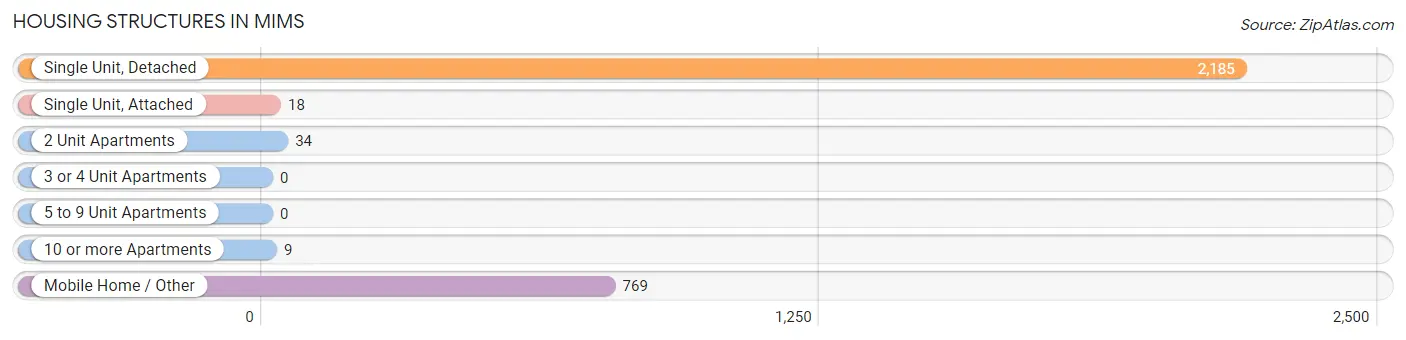
| Structure Type | # Housing Units | % Housing Units |
| Single Unit, Detached | 2,185 | 72.5% |
| Single Unit, Attached | 18 | 0.6% |
| 2 Unit Apartments | 34 | 1.1% |
| 3 or 4 Unit Apartments | 0 | 0.0% |
| 5 to 9 Unit Apartments | 0 | 0.0% |
| 10 or more Apartments | 9 | 0.3% |
| Mobile Home / Other | 769 | 25.5% |
| Total | 3,015 | 100.0% |
Housing Structures by Occupancy in Mims
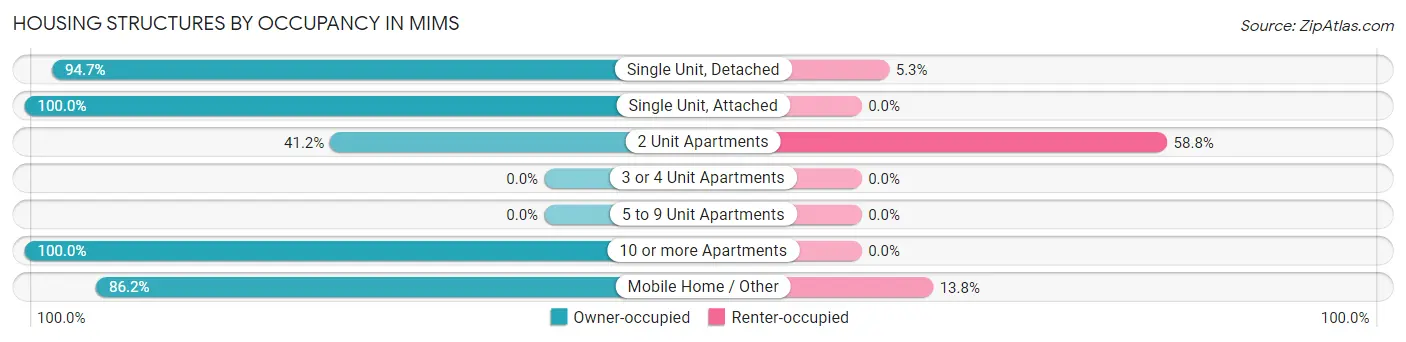
| Structure Type | Owner-occupied | Renter-occupied |
| Single Unit, Detached | 2,069 (94.7%) | 116 (5.3%) |
| Single Unit, Attached | 18 (100.0%) | 0 (0.0%) |
| 2 Unit Apartments | 14 (41.2%) | 20 (58.8%) |
| 3 or 4 Unit Apartments | 0 (0.0%) | 0 (0.0%) |
| 5 to 9 Unit Apartments | 0 (0.0%) | 0 (0.0%) |
| 10 or more Apartments | 9 (100.0%) | 0 (0.0%) |
| Mobile Home / Other | 663 (86.2%) | 106 (13.8%) |
| Total | 2,773 (92.0%) | 242 (8.0%) |
Housing Structures by Number of Rooms in Mims
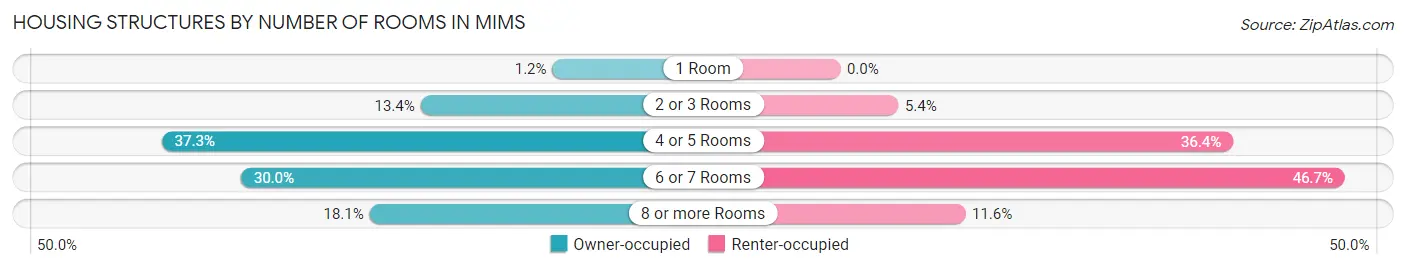
| Number of Rooms | Owner-occupied | Renter-occupied |
| 1 Room | 33 (1.2%) | 0 (0.0%) |
| 2 or 3 Rooms | 371 (13.4%) | 13 (5.4%) |
| 4 or 5 Rooms | 1,035 (37.3%) | 88 (36.4%) |
| 6 or 7 Rooms | 832 (30.0%) | 113 (46.7%) |
| 8 or more Rooms | 502 (18.1%) | 28 (11.6%) |
| Total | 2,773 (100.0%) | 242 (100.0%) |
Housing Structure by Heating Type in Mims
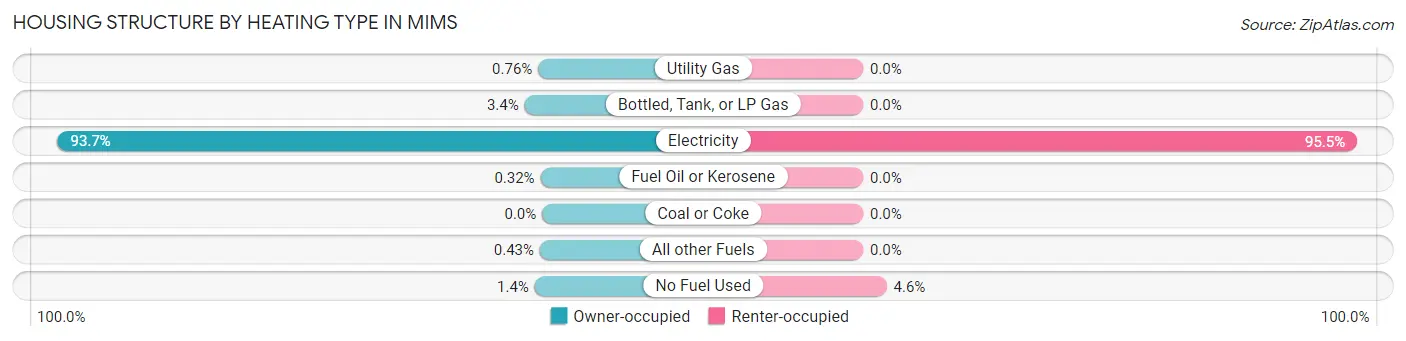
| Heating Type | Owner-occupied | Renter-occupied |
| Utility Gas | 21 (0.8%) | 0 (0.0%) |
| Bottled, Tank, or LP Gas | 94 (3.4%) | 0 (0.0%) |
| Electricity | 2,597 (93.6%) | 231 (95.5%) |
| Fuel Oil or Kerosene | 9 (0.3%) | 0 (0.0%) |
| Coal or Coke | 0 (0.0%) | 0 (0.0%) |
| All other Fuels | 12 (0.4%) | 0 (0.0%) |
| No Fuel Used | 40 (1.4%) | 11 (4.5%) |
| Total | 2,773 (100.0%) | 242 (100.0%) |
Household Vehicle Usage in Mims
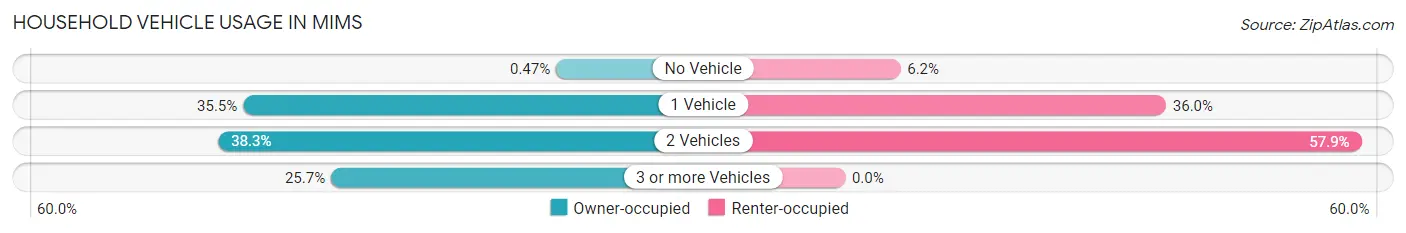
| Vehicles per Household | Owner-occupied | Renter-occupied |
| No Vehicle | 13 (0.5%) | 15 (6.2%) |
| 1 Vehicle | 985 (35.5%) | 87 (35.9%) |
| 2 Vehicles | 1,063 (38.3%) | 140 (57.9%) |
| 3 or more Vehicles | 712 (25.7%) | 0 (0.0%) |
| Total | 2,773 (100.0%) | 242 (100.0%) |
Real Estate & Mortgages in Mims
Real Estate and Mortgage Overview in Mims
| Characteristic | Without Mortgage | With Mortgage |
| Housing Units | 1,747 | 1,026 |
| Median Property Value | $192,500 | $247,100 |
| Median Household Income | $48,575 | $163 |
| Monthly Housing Costs | $368 | $50 |
| Real Estate Taxes | $1,005 | $52 |
Property Value by Mortgage Status in Mims
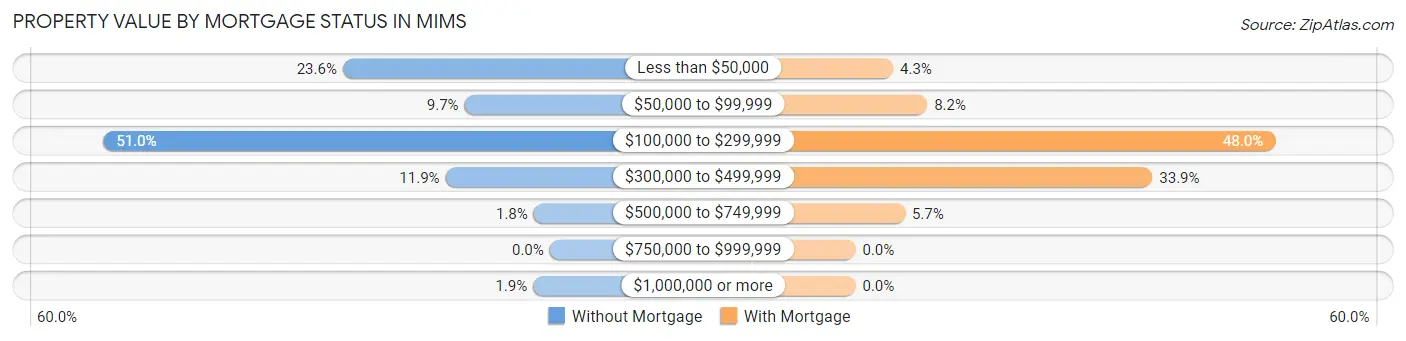
| Property Value | Without Mortgage | With Mortgage |
| Less than $50,000 | 413 (23.6%) | 44 (4.3%) |
| $50,000 to $99,999 | 170 (9.7%) | 84 (8.2%) |
| $100,000 to $299,999 | 891 (51.0%) | 492 (47.9%) |
| $300,000 to $499,999 | 208 (11.9%) | 348 (33.9%) |
| $500,000 to $749,999 | 32 (1.8%) | 58 (5.7%) |
| $750,000 to $999,999 | 0 (0.0%) | 0 (0.0%) |
| $1,000,000 or more | 33 (1.9%) | 0 (0.0%) |
| Total | 1,747 (100.0%) | 1,026 (100.0%) |
Household Income by Mortgage Status in Mims
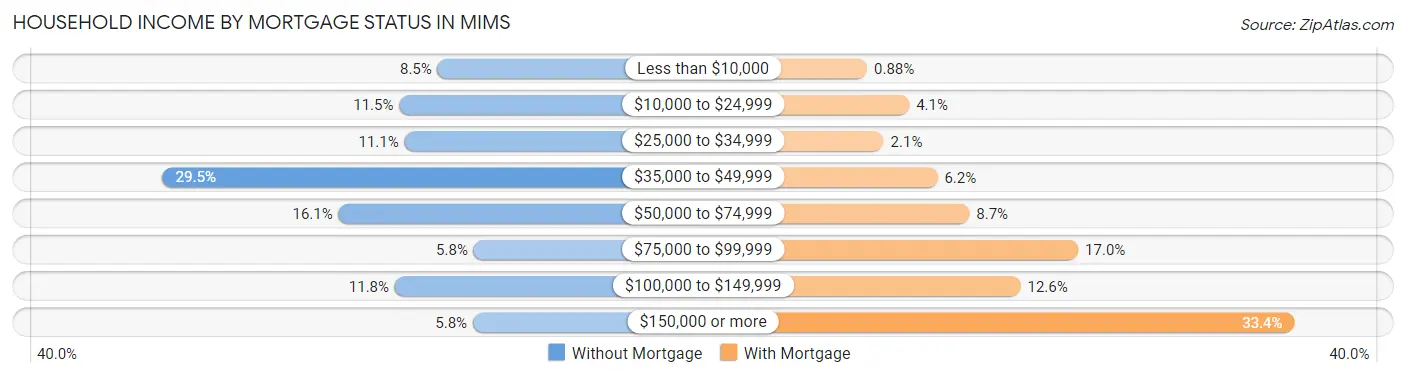
| Household Income | Without Mortgage | With Mortgage |
| Less than $10,000 | 149 (8.5%) | 9 (0.9%) |
| $10,000 to $24,999 | 200 (11.5%) | 42 (4.1%) |
| $25,000 to $34,999 | 193 (11.1%) | 22 (2.1%) |
| $35,000 to $49,999 | 515 (29.5%) | 64 (6.2%) |
| $50,000 to $74,999 | 281 (16.1%) | 89 (8.7%) |
| $75,000 to $99,999 | 101 (5.8%) | 174 (17.0%) |
| $100,000 to $149,999 | 206 (11.8%) | 129 (12.6%) |
| $150,000 or more | 102 (5.8%) | 343 (33.4%) |
| Total | 1,747 (100.0%) | 1,026 (100.0%) |
Property Value to Household Income Ratio in Mims
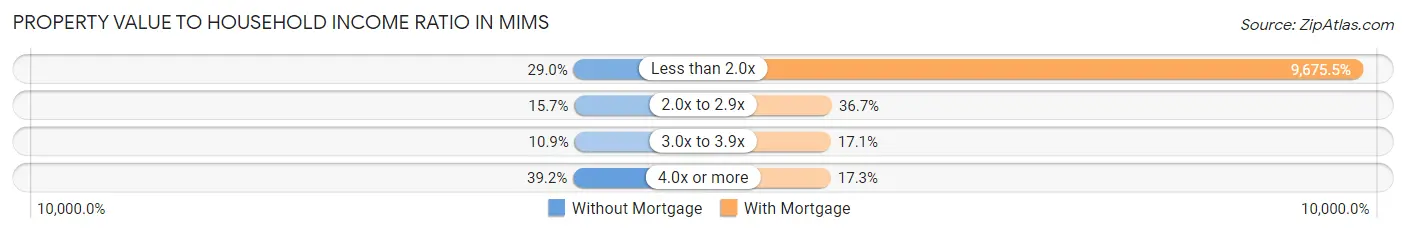
| Value-to-Income Ratio | Without Mortgage | With Mortgage |
| Less than 2.0x | 507 (29.0%) | 99,271 (9,675.5%) |
| 2.0x to 2.9x | 275 (15.7%) | 376 (36.6%) |
| 3.0x to 3.9x | 190 (10.9%) | 175 (17.1%) |
| 4.0x or more | 685 (39.2%) | 177 (17.2%) |
| Total | 1,747 (100.0%) | 1,026 (100.0%) |
Real Estate Taxes by Mortgage Status in Mims
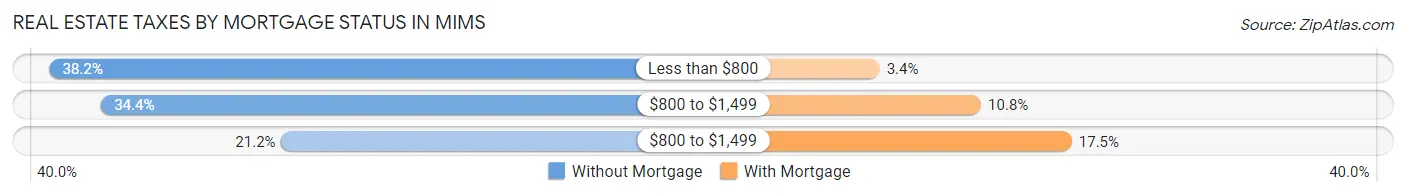
| Property Taxes | Without Mortgage | With Mortgage |
| Less than $800 | 667 (38.2%) | 35 (3.4%) |
| $800 to $1,499 | 601 (34.4%) | 111 (10.8%) |
| $800 to $1,499 | 371 (21.2%) | 179 (17.4%) |
| Total | 1,747 (100.0%) | 1,026 (100.0%) |
Health & Disability in Mims
Health Insurance Coverage by Age in Mims
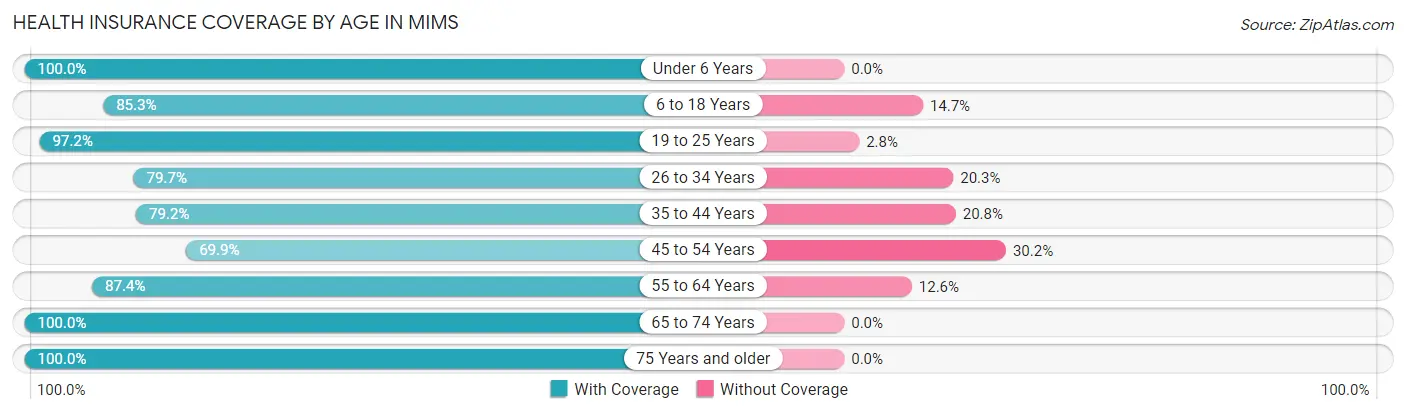
| Age Bracket | With Coverage | Without Coverage |
| Under 6 Years | 166 (100.0%) | 0 (0.0%) |
| 6 to 18 Years | 913 (85.3%) | 157 (14.7%) |
| 19 to 25 Years | 350 (97.2%) | 10 (2.8%) |
| 26 to 34 Years | 435 (79.7%) | 111 (20.3%) |
| 35 to 44 Years | 362 (79.2%) | 95 (20.8%) |
| 45 to 54 Years | 549 (69.9%) | 237 (30.1%) |
| 55 to 64 Years | 1,297 (87.4%) | 187 (12.6%) |
| 65 to 74 Years | 1,118 (100.0%) | 0 (0.0%) |
| 75 Years and older | 1,235 (100.0%) | 0 (0.0%) |
| Total | 6,425 (89.0%) | 797 (11.0%) |
Health Insurance Coverage by Citizenship Status in Mims
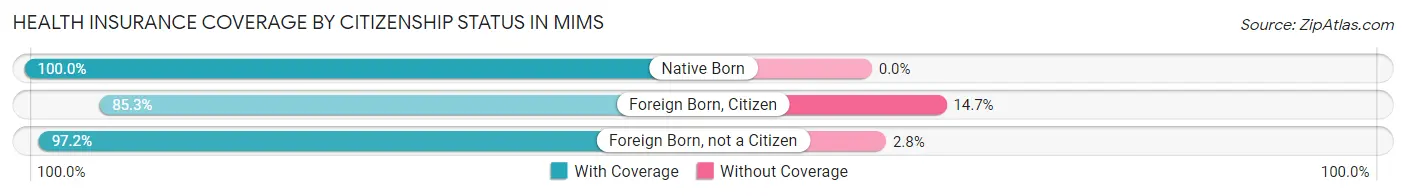
| Citizenship Status | With Coverage | Without Coverage |
| Native Born | 166 (100.0%) | 0 (0.0%) |
| Foreign Born, Citizen | 913 (85.3%) | 157 (14.7%) |
| Foreign Born, not a Citizen | 350 (97.2%) | 10 (2.8%) |
Health Insurance Coverage by Household Income in Mims
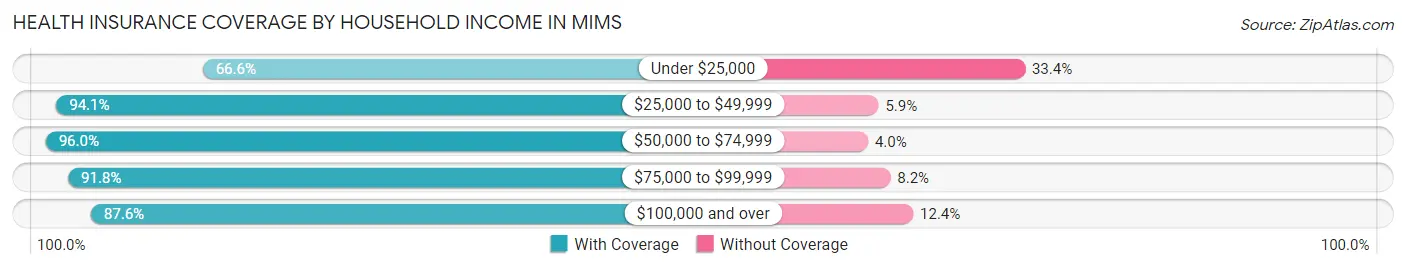
| Household Income | With Coverage | Without Coverage |
| Under $25,000 | 451 (66.6%) | 226 (33.4%) |
| $25,000 to $49,999 | 1,678 (94.1%) | 106 (5.9%) |
| $50,000 to $74,999 | 1,160 (96.0%) | 48 (4.0%) |
| $75,000 to $99,999 | 529 (91.8%) | 47 (8.2%) |
| $100,000 and over | 2,606 (87.6%) | 370 (12.4%) |
Public vs Private Health Insurance Coverage by Age in Mims
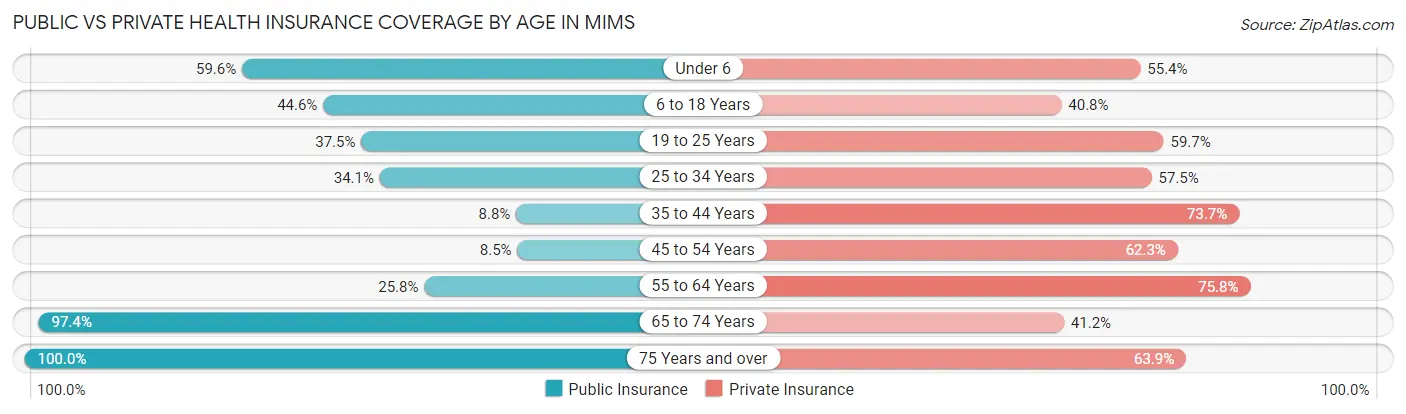
| Age Bracket | Public Insurance | Private Insurance |
| Under 6 | 99 (59.6%) | 92 (55.4%) |
| 6 to 18 Years | 477 (44.6%) | 436 (40.7%) |
| 19 to 25 Years | 135 (37.5%) | 215 (59.7%) |
| 25 to 34 Years | 186 (34.1%) | 314 (57.5%) |
| 35 to 44 Years | 40 (8.7%) | 337 (73.7%) |
| 45 to 54 Years | 67 (8.5%) | 490 (62.3%) |
| 55 to 64 Years | 383 (25.8%) | 1,125 (75.8%) |
| 65 to 74 Years | 1,089 (97.4%) | 461 (41.2%) |
| 75 Years and over | 1,235 (100.0%) | 789 (63.9%) |
| Total | 3,711 (51.4%) | 4,259 (59.0%) |
Disability Status by Sex by Age in Mims
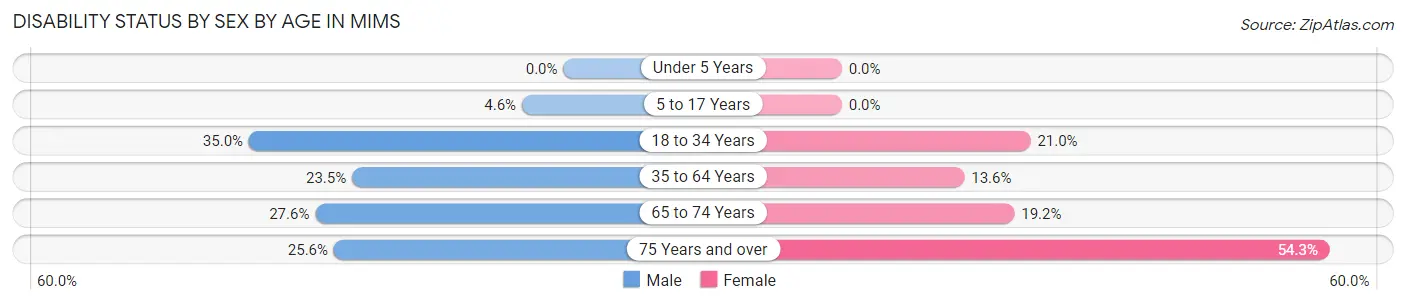
| Age Bracket | Male | Female |
| Under 5 Years | 0 (0.0%) | 0 (0.0%) |
| 5 to 17 Years | 25 (4.6%) | 0 (0.0%) |
| 18 to 34 Years | 180 (35.0%) | 96 (21.0%) |
| 35 to 64 Years | 331 (23.5%) | 180 (13.6%) |
| 65 to 74 Years | 142 (27.6%) | 116 (19.2%) |
| 75 Years and over | 136 (25.6%) | 382 (54.3%) |
Disability Class by Sex by Age in Mims
Disability Class: Hearing Difficulty
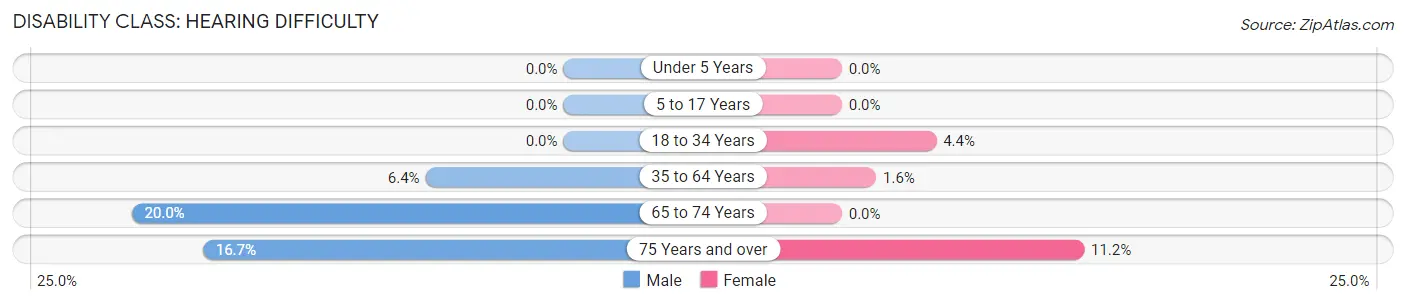
| Age Bracket | Male | Female |
| Under 5 Years | 0 (0.0%) | 0 (0.0%) |
| 5 to 17 Years | 0 (0.0%) | 0 (0.0%) |
| 18 to 34 Years | 0 (0.0%) | 20 (4.4%) |
| 35 to 64 Years | 90 (6.4%) | 21 (1.6%) |
| 65 to 74 Years | 103 (20.0%) | 0 (0.0%) |
| 75 Years and over | 89 (16.7%) | 79 (11.2%) |
Disability Class: Vision Difficulty
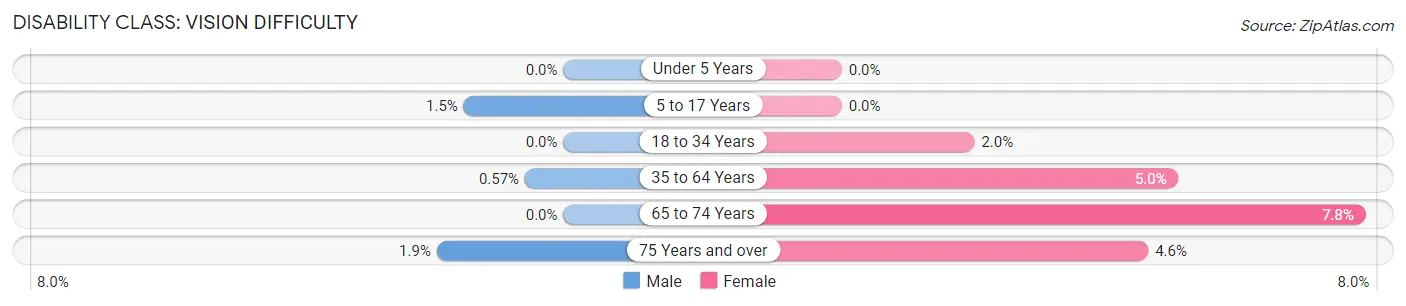
| Age Bracket | Male | Female |
| Under 5 Years | 0 (0.0%) | 0 (0.0%) |
| 5 to 17 Years | 8 (1.5%) | 0 (0.0%) |
| 18 to 34 Years | 0 (0.0%) | 9 (2.0%) |
| 35 to 64 Years | 8 (0.6%) | 66 (5.0%) |
| 65 to 74 Years | 0 (0.0%) | 47 (7.8%) |
| 75 Years and over | 10 (1.9%) | 32 (4.5%) |
Disability Class: Cognitive Difficulty
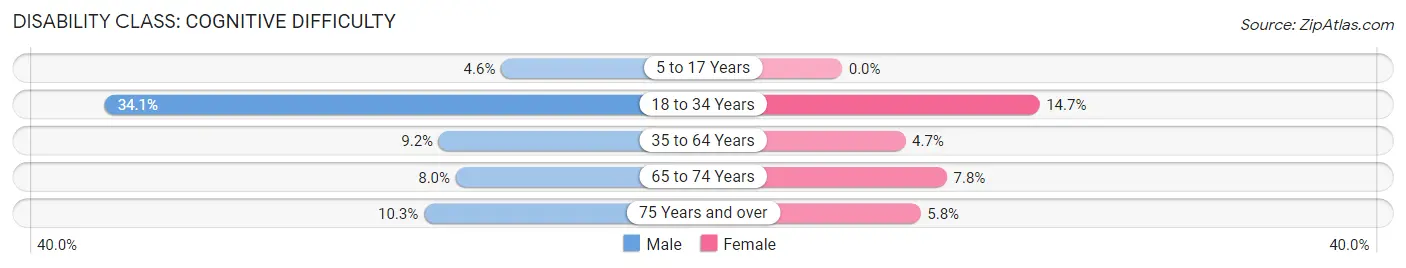
| Age Bracket | Male | Female |
| 5 to 17 Years | 25 (4.6%) | 0 (0.0%) |
| 18 to 34 Years | 175 (34.1%) | 67 (14.7%) |
| 35 to 64 Years | 130 (9.2%) | 62 (4.7%) |
| 65 to 74 Years | 41 (8.0%) | 47 (7.8%) |
| 75 Years and over | 55 (10.3%) | 41 (5.8%) |
Disability Class: Ambulatory Difficulty
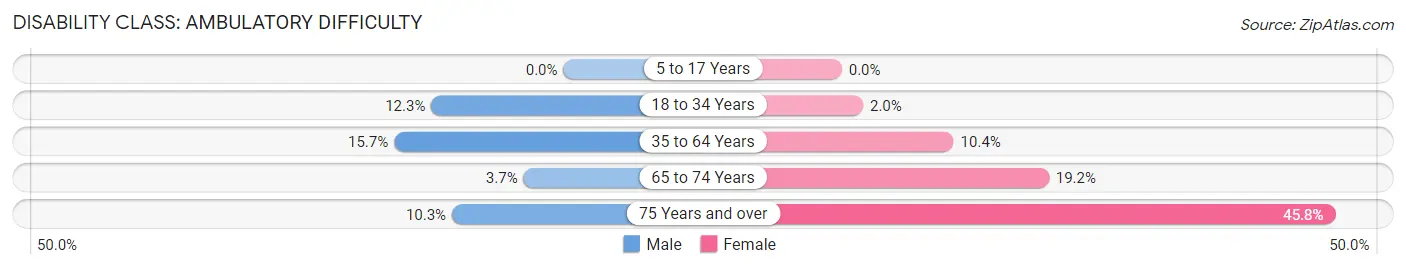
| Age Bracket | Male | Female |
| 5 to 17 Years | 0 (0.0%) | 0 (0.0%) |
| 18 to 34 Years | 63 (12.3%) | 9 (2.0%) |
| 35 to 64 Years | 221 (15.7%) | 137 (10.4%) |
| 65 to 74 Years | 19 (3.7%) | 116 (19.2%) |
| 75 Years and over | 55 (10.3%) | 322 (45.8%) |
Disability Class: Self-Care Difficulty
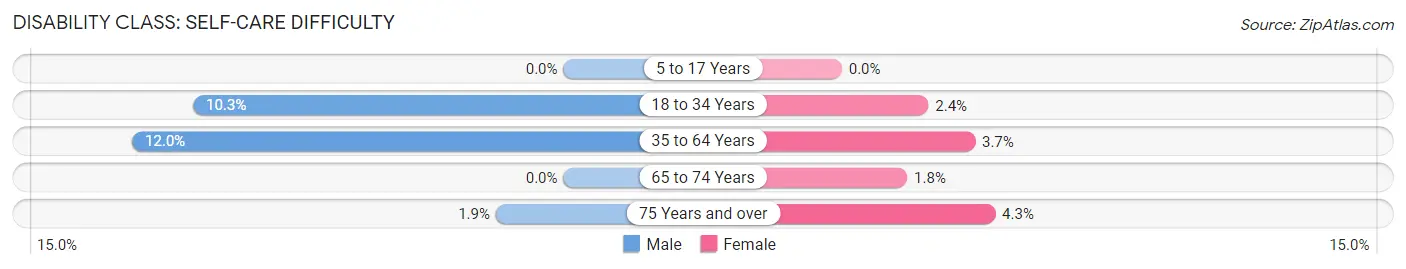
| Age Bracket | Male | Female |
| 5 to 17 Years | 0 (0.0%) | 0 (0.0%) |
| 18 to 34 Years | 53 (10.3%) | 11 (2.4%) |
| 35 to 64 Years | 169 (12.0%) | 49 (3.7%) |
| 65 to 74 Years | 0 (0.0%) | 11 (1.8%) |
| 75 Years and over | 10 (1.9%) | 30 (4.3%) |
Technology Access in Mims
Computing Device Access in Mims
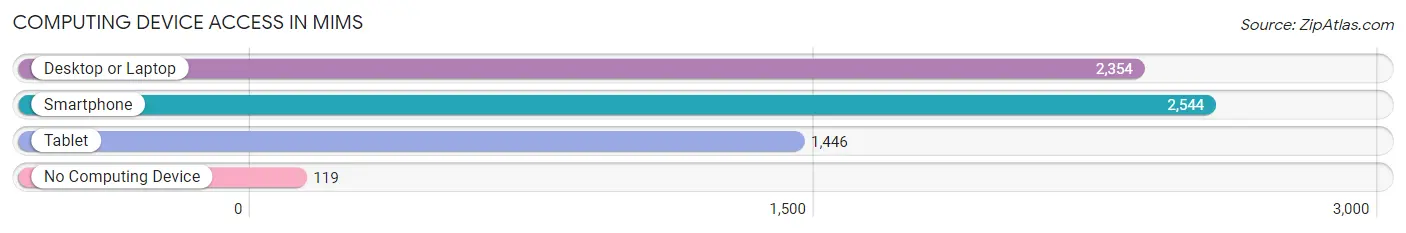
| Device Type | # Households | % Households |
| Desktop or Laptop | 2,354 | 78.1% |
| Smartphone | 2,544 | 84.4% |
| Tablet | 1,446 | 48.0% |
| No Computing Device | 119 | 4.0% |
| Total | 3,015 | 100.0% |
Internet Access in Mims
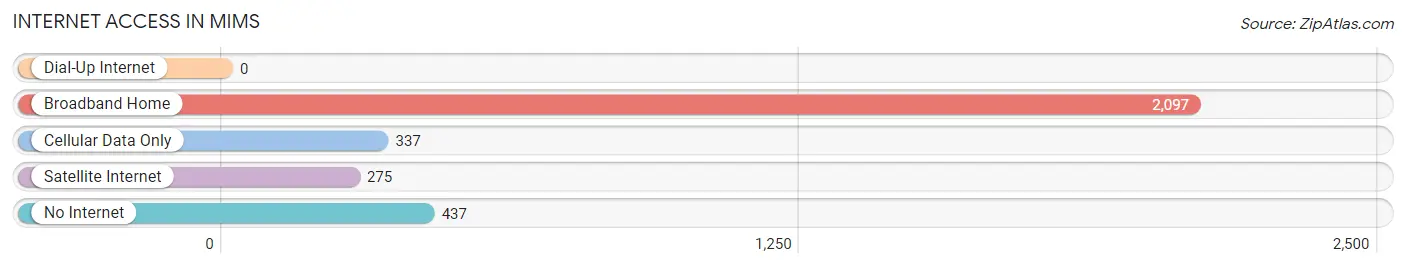
| Internet Type | # Households | % Households |
| Dial-Up Internet | 0 | 0.0% |
| Broadband Home | 2,097 | 69.6% |
| Cellular Data Only | 337 | 11.2% |
| Satellite Internet | 275 | 9.1% |
| No Internet | 437 | 14.5% |
| Total | 3,015 | 100.0% |
Mims Summary
Mims is an unincorporated community located in Brevard County, Florida, United States. It is located on the Indian River, just south of Titusville. The population was estimated to be 2,543 in 2019.
History
Mims was first settled in the late 1800s by a group of settlers from Georgia. The settlement was originally known as "Maxville" after the first settler, Max S. Mims. The settlement was later renamed Mims in honor of Max S. Mims.
The first post office in Mims was established in 1887. The town was incorporated in 1891 and was the first incorporated town in Brevard County.
In the early 1900s, Mims was a thriving agricultural community. The town was known for its citrus groves and vegetable farms. The town also had a sawmill, a turpentine still, and a general store.
In the 1920s, the town began to decline as the citrus industry in Florida began to suffer from a series of freezes. The town was further impacted by the Great Depression and World War II.
In the 1950s, the town began to experience a resurgence as the space industry began to take off in nearby Titusville. The town was home to a number of aerospace companies, including Martin Marietta (now Lockheed Martin).
Geography
Mims is located in Brevard County, Florida, on the Indian River, just south of Titusville. The town is located at 28°37'N 80°48'W.
The town has a total area of 4.2 square miles, of which 4.1 square miles is land and 0.1 square miles is water.
Economy
Mims is home to a number of businesses, including a number of aerospace companies, such as Lockheed Martin. The town is also home to a number of retail stores, restaurants, and other businesses.
The town is also home to a number of agricultural businesses, including citrus groves and vegetable farms.
Demographics
As of the 2010 census, the population of Mims was 2,213. The racial makeup of the town was 79.3% White, 15.2% African American, 0.3% Native American, 0.7% Asian, 0.1% Pacific Islander, 2.2% from other races, and 2.4% from two or more races. Hispanic or Latino of any race were 6.2% of the population.
The median income for a household in Mims was $37,917, and the median income for a family was $45,938. The per capita income for the town was $18,945. About 11.3% of families and 14.2% of the population were below the poverty line, including 19.2% of those under age 18 and 8.2% of those age 65 or over.
Common Questions
What is Per Capita Income in Mims?
Per Capita income in Mims is $37,415.
What is the Median Family Income in Mims?
Median Family Income in Mims is $73,254.
What is the Median Household income in Mims?
Median Household Income in Mims is $57,969.
What is Income or Wage Gap in Mims?
Income or Wage Gap in Mims is 44.0%.
Women in Mims earn 56.0 cents for every dollar earned by a man.
What is Inequality or Gini Index in Mims?
Inequality or Gini Index in Mims is 0.47.
What is the Total Population of Mims?
Total Population of Mims is 7,222.
What is the Total Male Population of Mims?
Total Male Population of Mims is 3,587.
What is the Total Female Population of Mims?
Total Female Population of Mims is 3,635.
What is the Ratio of Males per 100 Females in Mims?
There are 98.68 Males per 100 Females in Mims.
What is the Ratio of Females per 100 Males in Mims?
There are 101.34 Females per 100 Males in Mims.
What is the Median Population Age in Mims?
Median Population Age in Mims is 56.4 Years.
What is the Average Family Size in Mims
Average Family Size in Mims is 2.9 People.
What is the Average Household Size in Mims
Average Household Size in Mims is 2.4 People.
How Large is the Labor Force in Mims?
There are 2,430 People in the Labor Forcein in Mims.
What is the Percentage of People in the Labor Force in Mims?
38.7% of People are in the Labor Force in Mims.
What is the Unemployment Rate in Mims?
Unemployment Rate in Mims is 6.5%.