Middleburg, FL Map & Demographics
Middleburg Map
Middleburg Overview
$33,282
PER CAPITA INCOME
$71,033
AVG FAMILY INCOME
$68,158
AVG HOUSEHOLD INCOME
23.6%
WAGE / INCOME GAP [ % ]
76.4¢/ $1
WAGE / INCOME GAP [ $ ]
0.33
INEQUALITY / GINI INDEX
11,838
TOTAL POPULATION
6,372
MALE POPULATION
5,466
FEMALE POPULATION
116.58
MALES / 100 FEMALES
85.78
FEMALES / 100 MALES
45.7
MEDIAN AGE
2.8
AVG FAMILY SIZE
2.4
AVG HOUSEHOLD SIZE
6,589
LABOR FORCE [ PEOPLE ]
65.8%
PERCENT IN LABOR FORCE
4.7%
UNEMPLOYMENT RATE
Middleburg Zip Codes
Middleburg Area Codes
Income in Middleburg
Income Overview in Middleburg
Per Capita Income in Middleburg is $33,282, while median incomes of families and households are $71,033 and $68,158 respectively.
| Characteristic | Number | Measure |
| Per Capita Income | 11,838 | $33,282 |
| Median Family Income | 3,426 | $71,033 |
| Mean Family Income | 3,426 | $82,023 |
| Median Household Income | 4,965 | $68,158 |
| Mean Household Income | 4,965 | $78,577 |
| Income Deficit | 3,426 | $0 |
| Wage / Income Gap (%) | 11,838 | 23.62% |
| Wage / Income Gap ($) | 11,838 | 76.38¢ per $1 |
| Gini / Inequality Index | 11,838 | 0.33 |
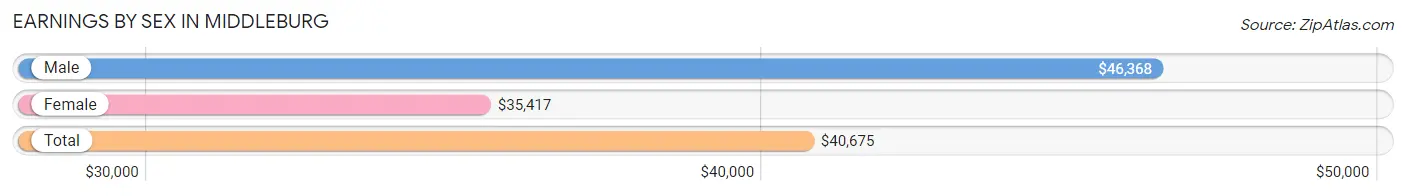
Earnings by Sex in Middleburg
Average Earnings in Middleburg are $40,675, $46,368 for men and $35,417 for women, a difference of 23.6%.
| Sex | Number | Average Earnings |
| Male | 3,760 (56.4%) | $46,368 |
| Female | 2,906 (43.6%) | $35,417 |
| Total | 6,666 (100.0%) | $40,675 |
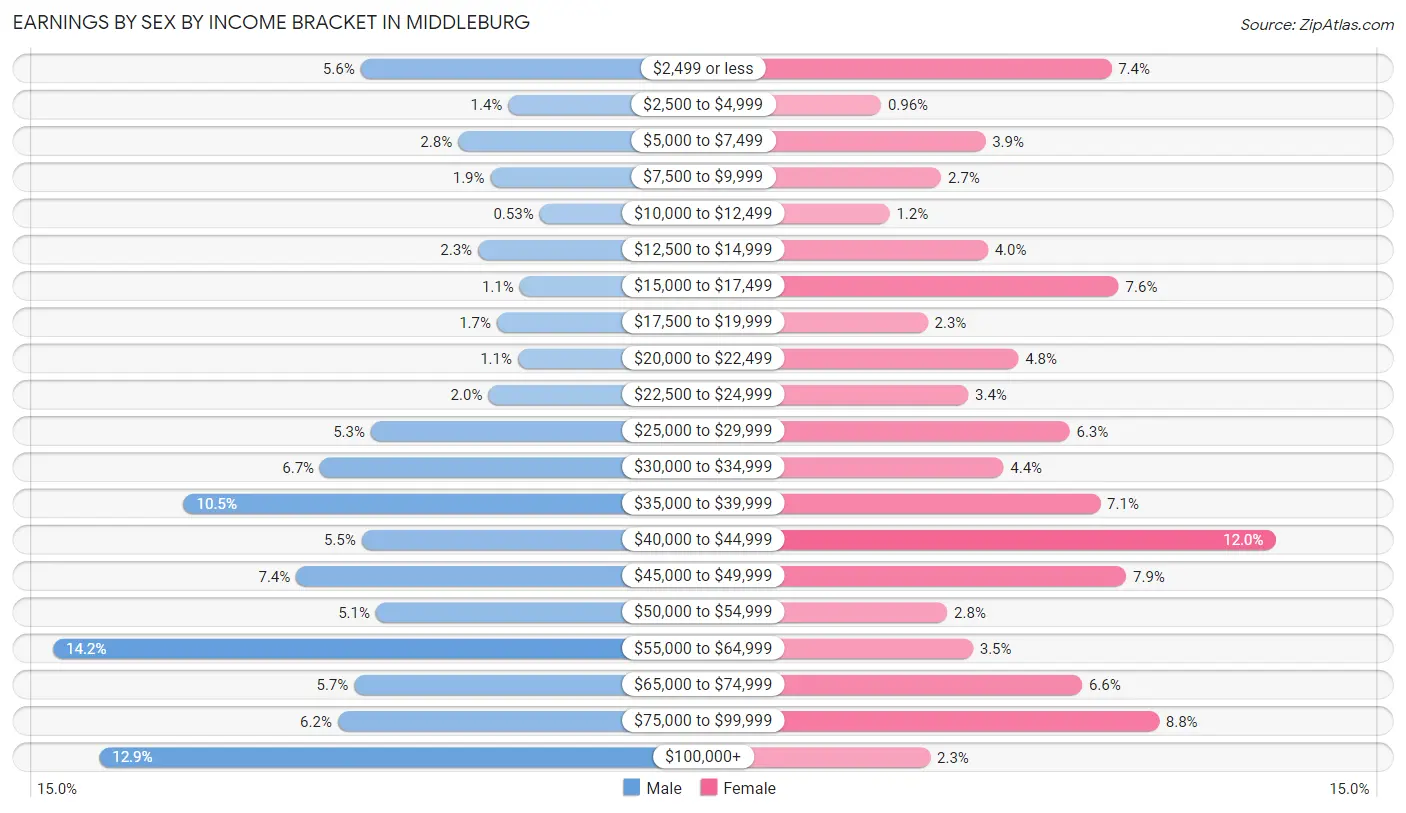
Earnings by Sex by Income Bracket in Middleburg
The most common earnings brackets in Middleburg are $55,000 to $64,999 for men (534 | 14.2%) and $40,000 to $44,999 for women (350 | 12.0%).
| Income | Male | Female |
| $2,499 or less | 209 (5.6%) | 216 (7.4%) |
| $2,500 to $4,999 | 53 (1.4%) | 28 (1.0%) |
| $5,000 to $7,499 | 106 (2.8%) | 113 (3.9%) |
| $7,500 to $9,999 | 72 (1.9%) | 77 (2.6%) |
| $10,000 to $12,499 | 20 (0.5%) | 35 (1.2%) |
| $12,500 to $14,999 | 85 (2.3%) | 115 (4.0%) |
| $15,000 to $17,499 | 41 (1.1%) | 222 (7.6%) |
| $17,500 to $19,999 | 65 (1.7%) | 66 (2.3%) |
| $20,000 to $22,499 | 43 (1.1%) | 140 (4.8%) |
| $22,500 to $24,999 | 74 (2.0%) | 99 (3.4%) |
| $25,000 to $29,999 | 198 (5.3%) | 182 (6.3%) |
| $30,000 to $34,999 | 252 (6.7%) | 128 (4.4%) |
| $35,000 to $39,999 | 396 (10.5%) | 207 (7.1%) |
| $40,000 to $44,999 | 208 (5.5%) | 350 (12.0%) |
| $45,000 to $49,999 | 277 (7.4%) | 228 (7.9%) |
| $50,000 to $54,999 | 193 (5.1%) | 82 (2.8%) |
| $55,000 to $64,999 | 534 (14.2%) | 103 (3.5%) |
| $65,000 to $74,999 | 216 (5.7%) | 192 (6.6%) |
| $75,000 to $99,999 | 233 (6.2%) | 255 (8.8%) |
| $100,000+ | 485 (12.9%) | 68 (2.3%) |
| Total | 3,760 (100.0%) | 2,906 (100.0%) |
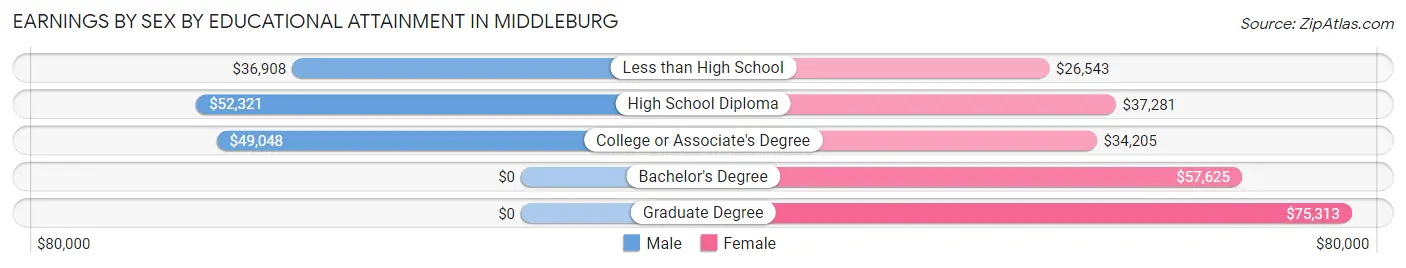
Earnings by Sex by Educational Attainment in Middleburg
Average earnings in Middleburg are $49,327 for men and $36,758 for women, a difference of 25.5%. Men with an educational attainment of high school diploma enjoy the highest average annual earnings of $52,321, while those with less than high school education earn the least with $36,908. Women with an educational attainment of graduate degree earn the most with the average annual earnings of $75,313, while those with less than high school education have the smallest earnings of $26,543.
| Educational Attainment | Male Income | Female Income |
| Less than High School | $36,908 | $26,543 |
| High School Diploma | $52,321 | $37,281 |
| College or Associate's Degree | $49,048 | $34,205 |
| Bachelor's Degree | - | - |
| Graduate Degree | - | - |
| Total | $49,327 | $36,758 |
Family Income in Middleburg
Family Income Brackets in Middleburg
According to the Middleburg family income data, there are 778 families falling into the $50,000 to $74,999 income range, which is the most common income bracket and makes up 22.7% of all families. Conversely, the $10,000 to $14,999 income bracket is the least frequent group with only 38 families (1.1%) belonging to this category.
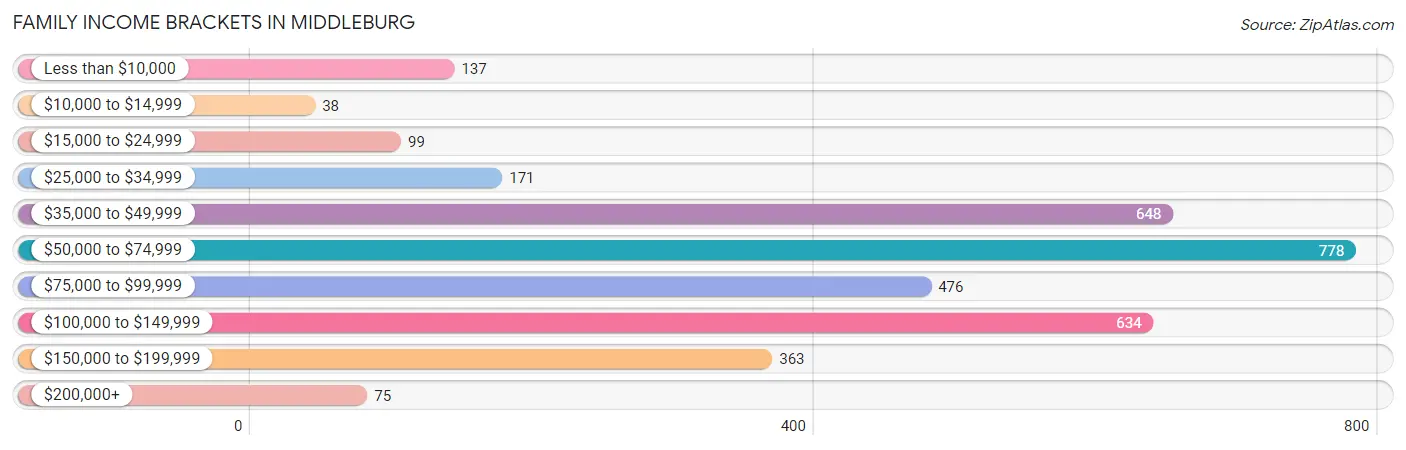
| Income Bracket | # Families | % Families |
| Less than $10,000 | 137 | 4.0% |
| $10,000 to $14,999 | 38 | 1.1% |
| $15,000 to $24,999 | 99 | 2.9% |
| $25,000 to $34,999 | 171 | 5.0% |
| $35,000 to $49,999 | 648 | 18.9% |
| $50,000 to $74,999 | 778 | 22.7% |
| $75,000 to $99,999 | 476 | 13.9% |
| $100,000 to $149,999 | 634 | 18.5% |
| $150,000 to $199,999 | 363 | 10.6% |
| $200,000+ | 75 | 2.2% |
Family Income by Famaliy Size in Middleburg
6-person families (140 | 4.1%) account for the highest median family income in Middleburg with $109,127 per family, while 2-person families (1,914 | 55.9%) have the highest median income of $32,314 per family member.
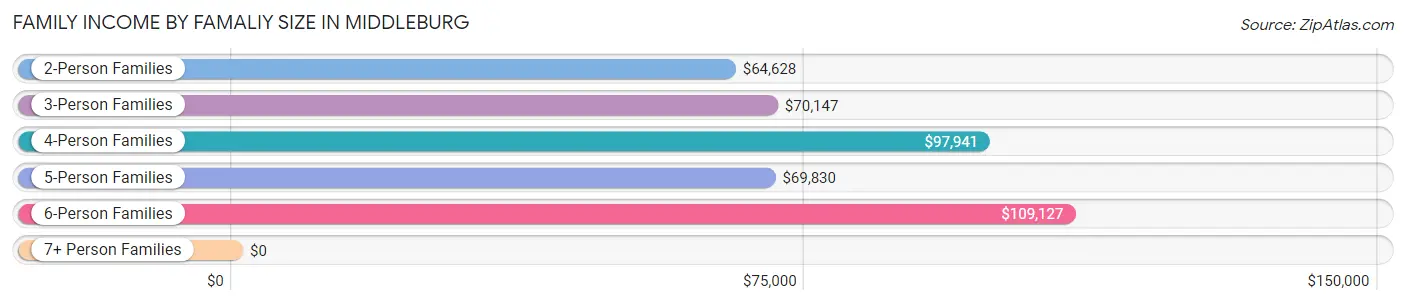
| Income Bracket | # Families | Median Income |
| 2-Person Families | 1,914 (55.9%) | $64,628 |
| 3-Person Families | 758 (22.1%) | $70,147 |
| 4-Person Families | 444 (13.0%) | $97,941 |
| 5-Person Families | 97 (2.8%) | $69,830 |
| 6-Person Families | 140 (4.1%) | $109,127 |
| 7+ Person Families | 73 (2.1%) | $0 |
| Total | 3,426 (100.0%) | $71,033 |
Family Income by Number of Earners in Middleburg
The median family income in Middleburg is $71,033, with families comprising 3+ earners (340) having the highest median family income of $158,562, while families with no earners (486) have the lowest median family income of $36,000, accounting for 9.9% and 14.2% of families, respectively.
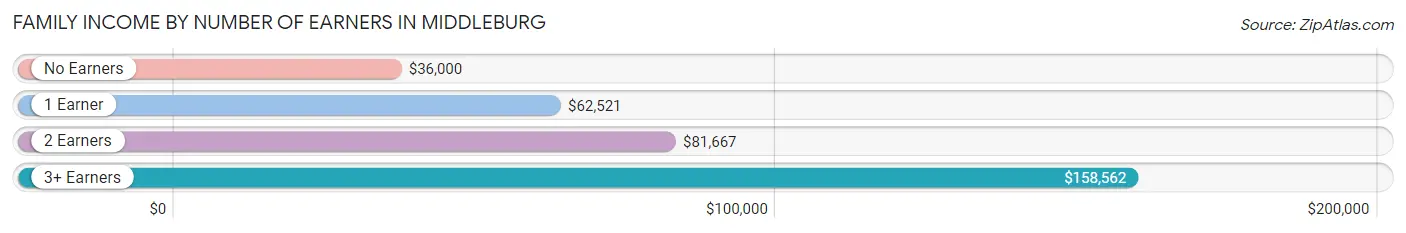
| Number of Earners | # Families | Median Income |
| No Earners | 486 (14.2%) | $36,000 |
| 1 Earner | 1,176 (34.3%) | $62,521 |
| 2 Earners | 1,424 (41.6%) | $81,667 |
| 3+ Earners | 340 (9.9%) | $158,562 |
| Total | 3,426 (100.0%) | $71,033 |
Household Income in Middleburg
Household Income Brackets in Middleburg
With 1,147 households falling in the category, the $50,000 to $74,999 income range is the most frequent in Middleburg, accounting for 23.1% of all households. In contrast, only 65 households (1.3%) fall into the $10,000 to $14,999 income bracket, making it the least populous group.
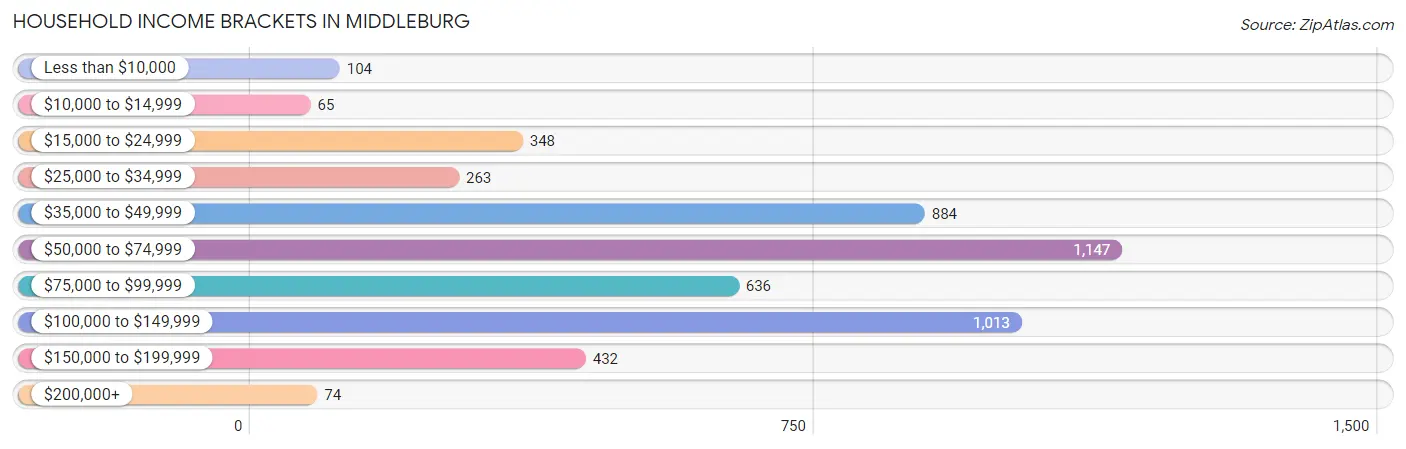
| Income Bracket | # Households | % Households |
| Less than $10,000 | 104 | 2.1% |
| $10,000 to $14,999 | 65 | 1.3% |
| $15,000 to $24,999 | 348 | 7.0% |
| $25,000 to $34,999 | 263 | 5.3% |
| $35,000 to $49,999 | 884 | 17.8% |
| $50,000 to $74,999 | 1,147 | 23.1% |
| $75,000 to $99,999 | 636 | 12.8% |
| $100,000 to $149,999 | 1,013 | 20.4% |
| $150,000 to $199,999 | 432 | 8.7% |
| $200,000+ | 74 | 1.5% |
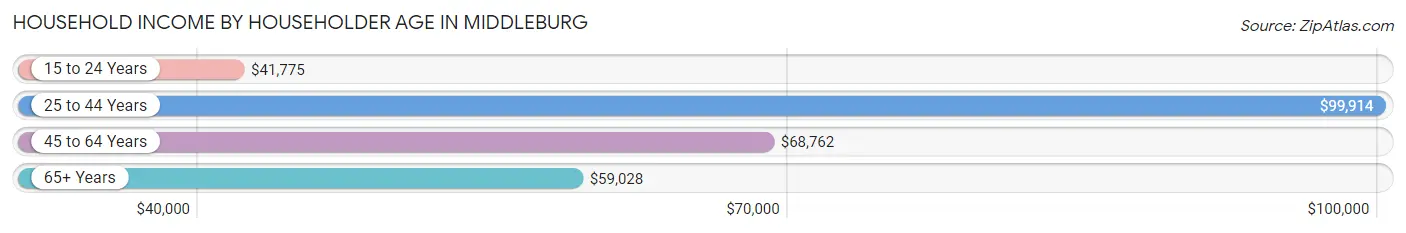
Household Income by Householder Age in Middleburg
The median household income in Middleburg is $68,158, with the highest median household income of $99,914 found in the 25 to 44 years age bracket for the primary householder. A total of 1,234 households (24.8%) fall into this category. Meanwhile, the 15 to 24 years age bracket for the primary householder has the lowest median household income of $41,775, with 172 households (3.5%) in this group.
| Income Bracket | # Households | Median Income |
| 15 to 24 Years | 172 (3.5%) | $41,775 |
| 25 to 44 Years | 1,234 (24.8%) | $99,914 |
| 45 to 64 Years | 2,275 (45.8%) | $68,762 |
| 65+ Years | 1,284 (25.9%) | $59,028 |
| Total | 4,965 (100.0%) | $68,158 |
Poverty in Middleburg
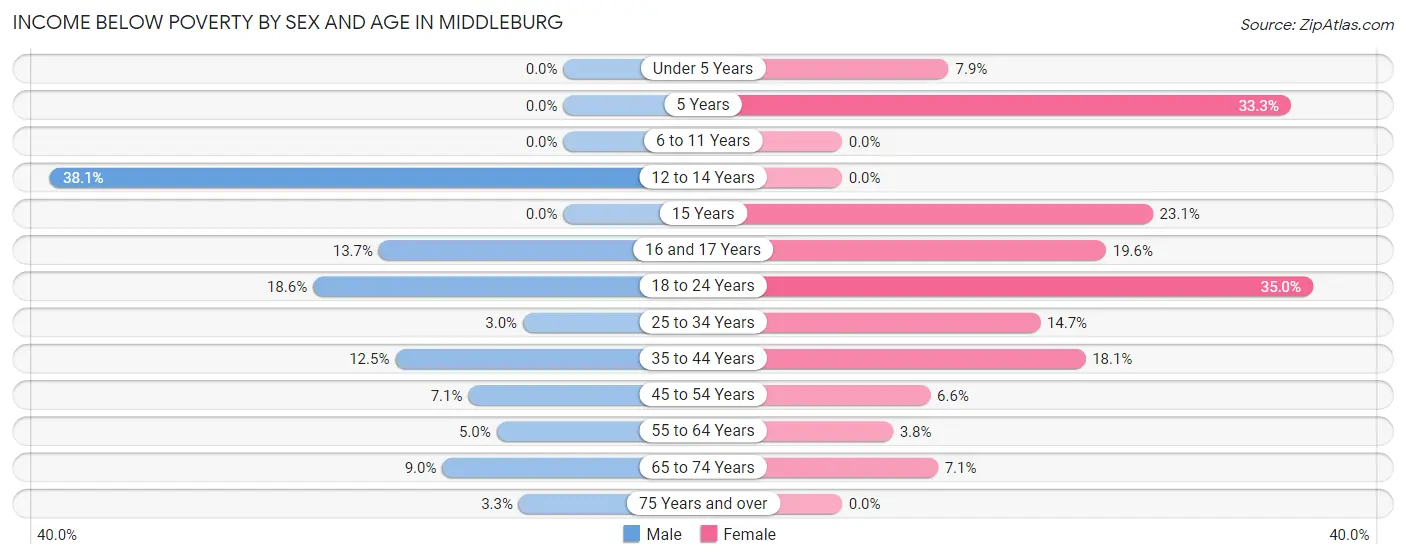
Income Below Poverty by Sex and Age in Middleburg
With 7.9% poverty level for males and 9.9% for females among the residents of Middleburg, 12 to 14 year old males and 18 to 24 year old females are the most vulnerable to poverty, with 40 males (38.1%) and 114 females (35.0%) in their respective age groups living below the poverty level.
| Age Bracket | Male | Female |
| Under 5 Years | 0 (0.0%) | 18 (7.9%) |
| 5 Years | 0 (0.0%) | 19 (33.3%) |
| 6 to 11 Years | 0 (0.0%) | 0 (0.0%) |
| 12 to 14 Years | 40 (38.1%) | 0 (0.0%) |
| 15 Years | 0 (0.0%) | 15 (23.1%) |
| 16 and 17 Years | 10 (13.7%) | 49 (19.6%) |
| 18 to 24 Years | 132 (18.6%) | 114 (35.0%) |
| 25 to 34 Years | 22 (3.0%) | 85 (14.7%) |
| 35 to 44 Years | 103 (12.5%) | 88 (18.1%) |
| 45 to 54 Years | 61 (7.1%) | 73 (6.6%) |
| 55 to 64 Years | 58 (5.0%) | 33 (3.8%) |
| 65 to 74 Years | 66 (9.0%) | 42 (7.1%) |
| 75 Years and over | 8 (3.3%) | 0 (0.0%) |
| Total | 500 (7.9%) | 536 (9.9%) |
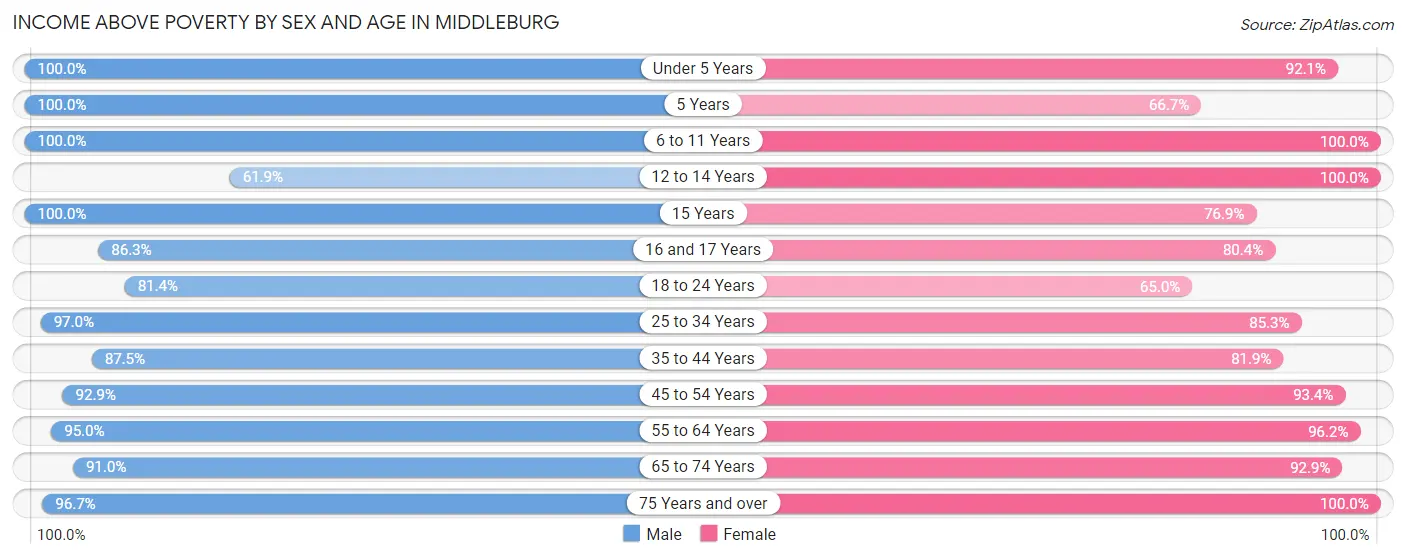
Income Above Poverty by Sex and Age in Middleburg
According to the poverty statistics in Middleburg, males aged under 5 years and females aged 6 to 11 years are the age groups that are most secure financially, with 100.0% of males and 100.0% of females in these age groups living above the poverty line.
| Age Bracket | Male | Female |
| Under 5 Years | 302 (100.0%) | 209 (92.1%) |
| 5 Years | 8 (100.0%) | 38 (66.7%) |
| 6 to 11 Years | 444 (100.0%) | 231 (100.0%) |
| 12 to 14 Years | 65 (61.9%) | 185 (100.0%) |
| 15 Years | 130 (100.0%) | 50 (76.9%) |
| 16 and 17 Years | 63 (86.3%) | 201 (80.4%) |
| 18 to 24 Years | 578 (81.4%) | 212 (65.0%) |
| 25 to 34 Years | 711 (97.0%) | 493 (85.3%) |
| 35 to 44 Years | 722 (87.5%) | 399 (81.9%) |
| 45 to 54 Years | 803 (92.9%) | 1,039 (93.4%) |
| 55 to 64 Years | 1,111 (95.0%) | 840 (96.2%) |
| 65 to 74 Years | 668 (91.0%) | 548 (92.9%) |
| 75 Years and over | 234 (96.7%) | 447 (100.0%) |
| Total | 5,839 (92.1%) | 4,892 (90.1%) |
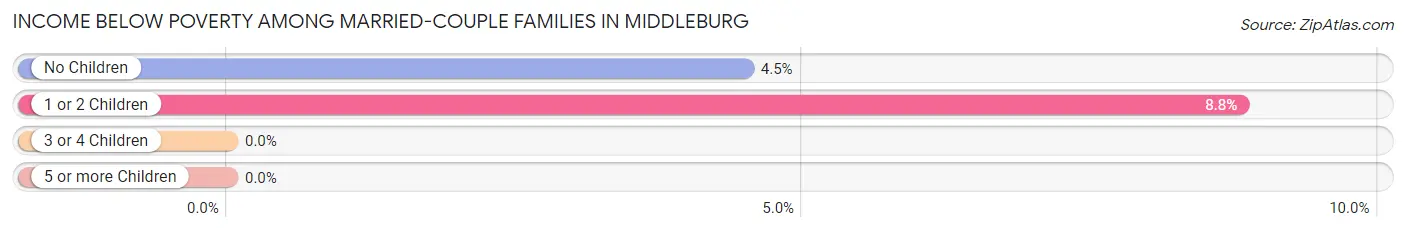
Income Below Poverty Among Married-Couple Families in Middleburg
The poverty statistics for married-couple families in Middleburg show that 5.2% or 136 of the total 2,638 families live below the poverty line. Families with 1 or 2 children have the highest poverty rate of 8.8%, comprising of 58 families. On the other hand, families with 3 or 4 children have the lowest poverty rate of 0.0%, which includes 0 families.
| Children | Above Poverty | Below Poverty |
| No Children | 1,658 (95.5%) | 78 (4.5%) |
| 1 or 2 Children | 601 (91.2%) | 58 (8.8%) |
| 3 or 4 Children | 243 (100.0%) | 0 (0.0%) |
| 5 or more Children | 0 (0.0%) | 0 (0.0%) |
| Total | 2,502 (94.8%) | 136 (5.2%) |
Income Below Poverty Among Single-Parent Households in Middleburg
According to the poverty data in Middleburg, 18.5% or 40 single-father households and 24.6% or 141 single-mother households are living below the poverty line. Among single-father households, those with no children have the highest poverty rate, with 30 households (28.8%) experiencing poverty. Likewise, among single-mother households, those with 1 or 2 children have the highest poverty rate, with 90 households (36.3%) falling below the poverty line.
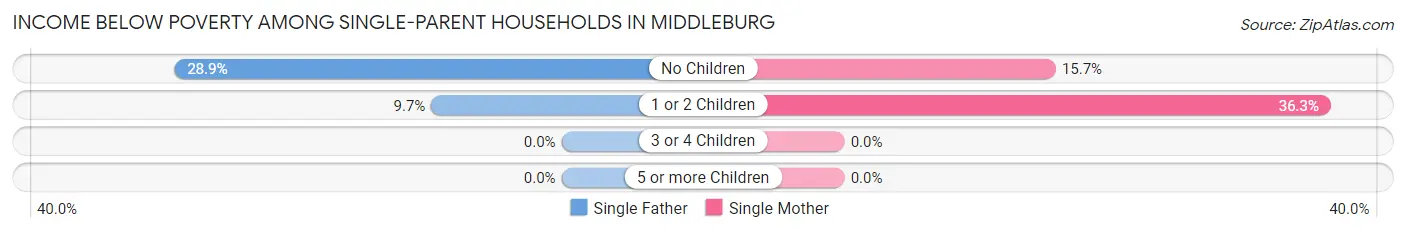
| Children | Single Father | Single Mother |
| No Children | 30 (28.8%) | 51 (15.7%) |
| 1 or 2 Children | 10 (9.7%) | 90 (36.3%) |
| 3 or 4 Children | 0 (0.0%) | 0 (0.0%) |
| 5 or more Children | 0 (0.0%) | 0 (0.0%) |
| Total | 40 (18.5%) | 141 (24.6%) |
Income Below Poverty Among Married-Couple vs Single-Parent Households in Middleburg
The poverty data for Middleburg shows that 136 of the married-couple family households (5.2%) and 181 of the single-parent households (23.0%) are living below the poverty level. Within the married-couple family households, those with 1 or 2 children have the highest poverty rate, with 58 households (8.8%) falling below the poverty line. Among the single-parent households, those with 1 or 2 children have the highest poverty rate, with 100 household (28.5%) living below poverty.
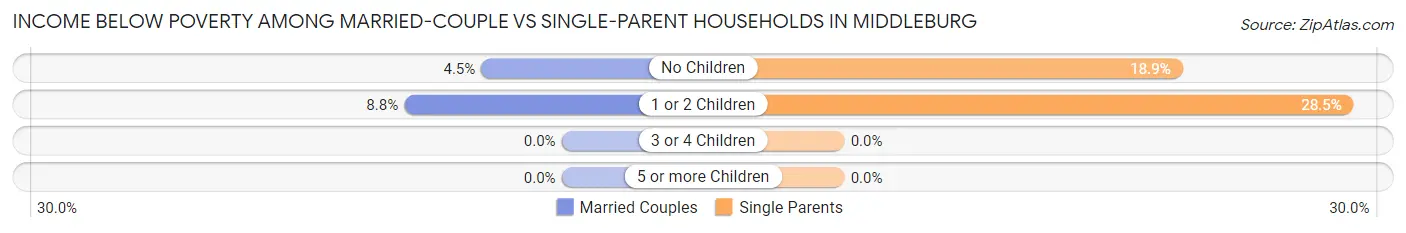
| Children | Married-Couple Families | Single-Parent Households |
| No Children | 78 (4.5%) | 81 (18.9%) |
| 1 or 2 Children | 58 (8.8%) | 100 (28.5%) |
| 3 or 4 Children | 0 (0.0%) | 0 (0.0%) |
| 5 or more Children | 0 (0.0%) | 0 (0.0%) |
| Total | 136 (5.2%) | 181 (23.0%) |
Race in Middleburg
The most populous races in Middleburg are White / Caucasian (10,810 | 91.3%), Hispanic or Latino (655 | 5.5%), and Black / African American (357 | 3.0%).
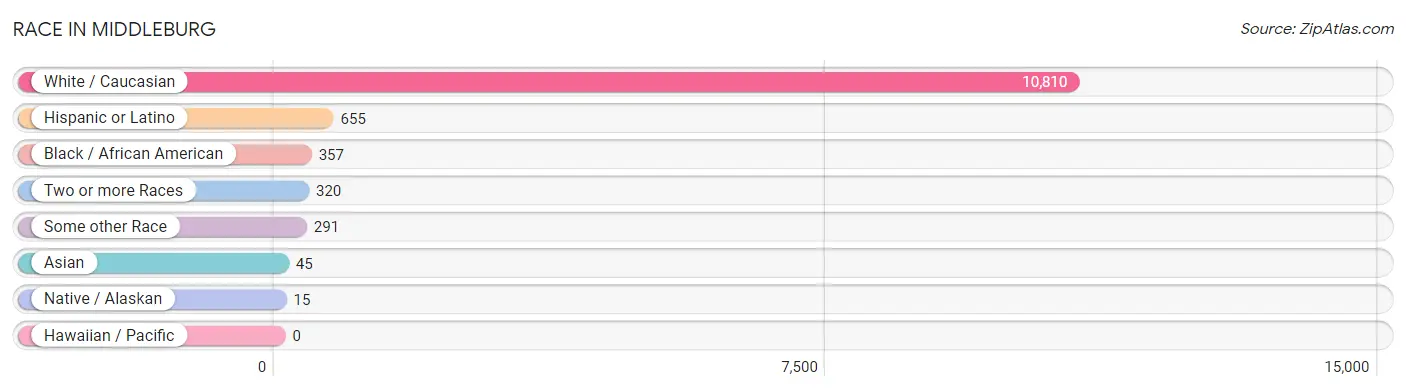
| Race | # Population | % Population |
| Asian | 45 | 0.4% |
| Black / African American | 357 | 3.0% |
| Hawaiian / Pacific | 0 | 0.0% |
| Hispanic or Latino | 655 | 5.5% |
| Native / Alaskan | 15 | 0.1% |
| White / Caucasian | 10,810 | 91.3% |
| Two or more Races | 320 | 2.7% |
| Some other Race | 291 | 2.5% |
| Total | 11,838 | 100.0% |
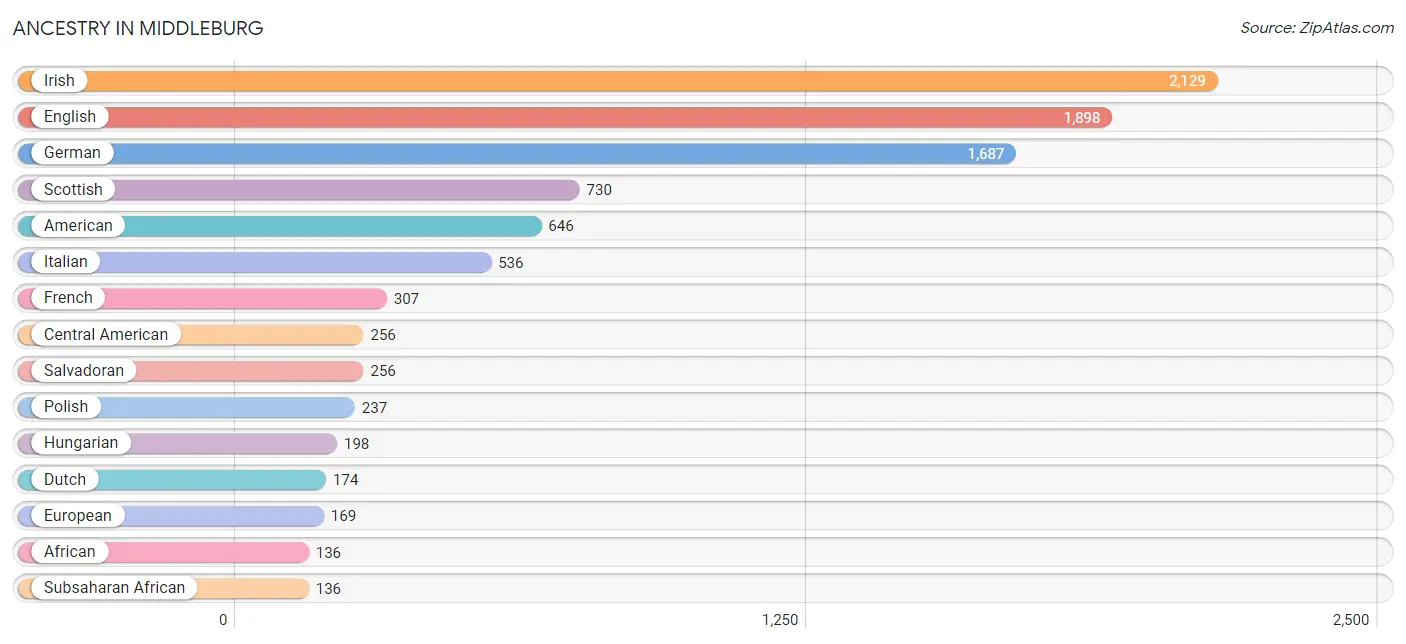
Ancestry in Middleburg
The most populous ancestries reported in Middleburg are Irish (2,129 | 18.0%), English (1,898 | 16.0%), German (1,687 | 14.2%), Scottish (730 | 6.2%), and American (646 | 5.5%), together accounting for 59.9% of all Middleburg residents.
| Ancestry | # Population | % Population |
| African | 136 | 1.1% |
| American | 646 | 5.5% |
| Apache | 42 | 0.4% |
| Arab | 8 | 0.1% |
| Argentinean | 9 | 0.1% |
| Austrian | 39 | 0.3% |
| Bahamian | 31 | 0.3% |
| British | 21 | 0.2% |
| Burmese | 8 | 0.1% |
| Canadian | 9 | 0.1% |
| Central American | 256 | 2.2% |
| Cherokee | 77 | 0.6% |
| Cheyenne | 29 | 0.2% |
| Choctaw | 7 | 0.1% |
| Colombian | 19 | 0.2% |
| Cuban | 21 | 0.2% |
| Danish | 8 | 0.1% |
| Dutch | 174 | 1.5% |
| Eastern European | 8 | 0.1% |
| English | 1,898 | 16.0% |
| European | 169 | 1.4% |
| Finnish | 22 | 0.2% |
| French | 307 | 2.6% |
| French Canadian | 13 | 0.1% |
| German | 1,687 | 14.2% |
| Greek | 13 | 0.1% |
| Hungarian | 198 | 1.7% |
| Irish | 2,129 | 18.0% |
| Italian | 536 | 4.5% |
| Korean | 53 | 0.4% |
| Lithuanian | 10 | 0.1% |
| Mexican | 126 | 1.1% |
| Northern European | 26 | 0.2% |
| Norwegian | 129 | 1.1% |
| Pennsylvania German | 7 | 0.1% |
| Peruvian | 85 | 0.7% |
| Polish | 237 | 2.0% |
| Puerto Rican | 133 | 1.1% |
| Russian | 51 | 0.4% |
| Salvadoran | 256 | 2.2% |
| Scandinavian | 81 | 0.7% |
| Scotch-Irish | 117 | 1.0% |
| Scottish | 730 | 6.2% |
| Slavic | 16 | 0.1% |
| Slovak | 38 | 0.3% |
| South American | 113 | 0.9% |
| Subsaharan African | 136 | 1.1% |
| Swedish | 58 | 0.5% |
| Swiss | 28 | 0.2% |
| Syrian | 8 | 0.1% |
| Thai | 22 | 0.2% |
| Welsh | 126 | 1.1% |
| West Indian | 52 | 0.4% | View All 53 Rows |
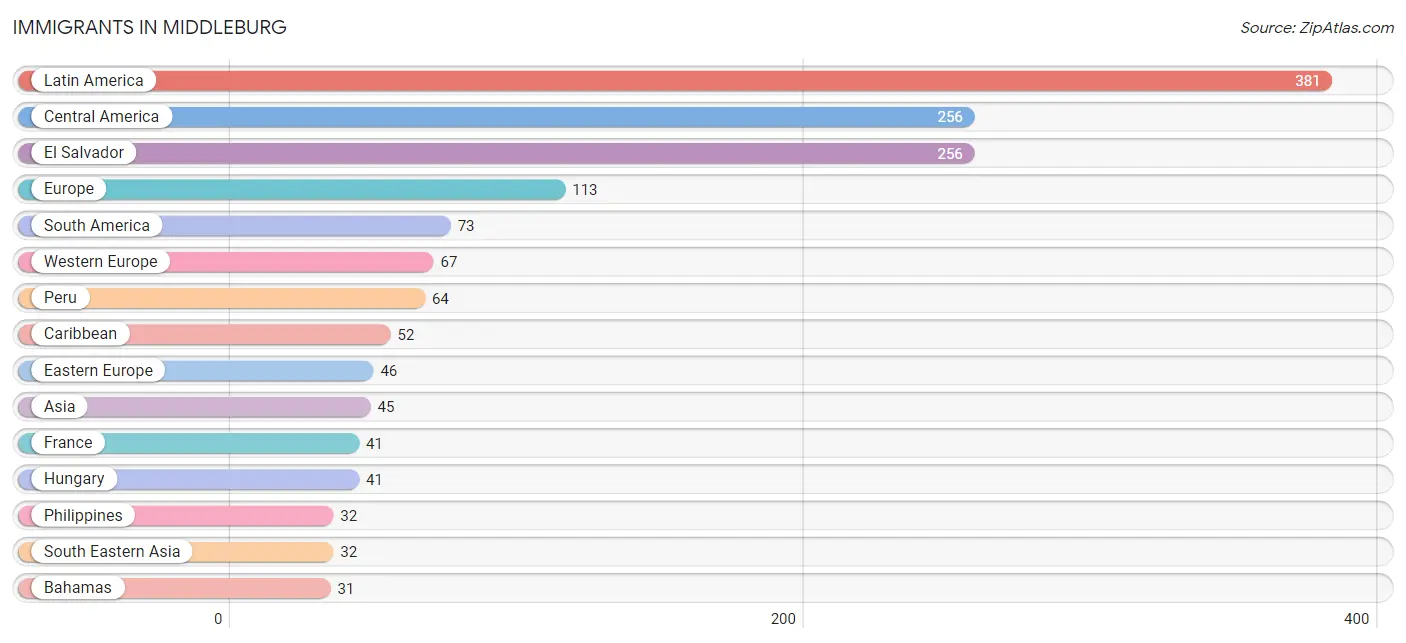
Immigrants in Middleburg
The most numerous immigrant groups reported in Middleburg came from Latin America (381 | 3.2%), Central America (256 | 2.2%), El Salvador (256 | 2.2%), Europe (113 | 0.9%), and South America (73 | 0.6%), together accounting for 9.1% of all Middleburg residents.
| Immigration Origin | # Population | % Population |
| Africa | 20 | 0.2% |
| Argentina | 9 | 0.1% |
| Asia | 45 | 0.4% |
| Bahamas | 31 | 0.3% |
| Cameroon | 20 | 0.2% |
| Canada | 9 | 0.1% |
| Caribbean | 52 | 0.4% |
| Central America | 256 | 2.2% |
| Cuba | 21 | 0.2% |
| Eastern Europe | 46 | 0.4% |
| El Salvador | 256 | 2.2% |
| Europe | 113 | 0.9% |
| France | 41 | 0.4% |
| Germany | 26 | 0.2% |
| Hungary | 41 | 0.4% |
| India | 13 | 0.1% |
| Latin America | 381 | 3.2% |
| Middle Africa | 20 | 0.2% |
| Peru | 64 | 0.5% |
| Philippines | 32 | 0.3% |
| Poland | 5 | 0.0% |
| South America | 73 | 0.6% |
| South Central Asia | 13 | 0.1% |
| South Eastern Asia | 32 | 0.3% |
| Western Europe | 67 | 0.6% | View All 25 Rows |
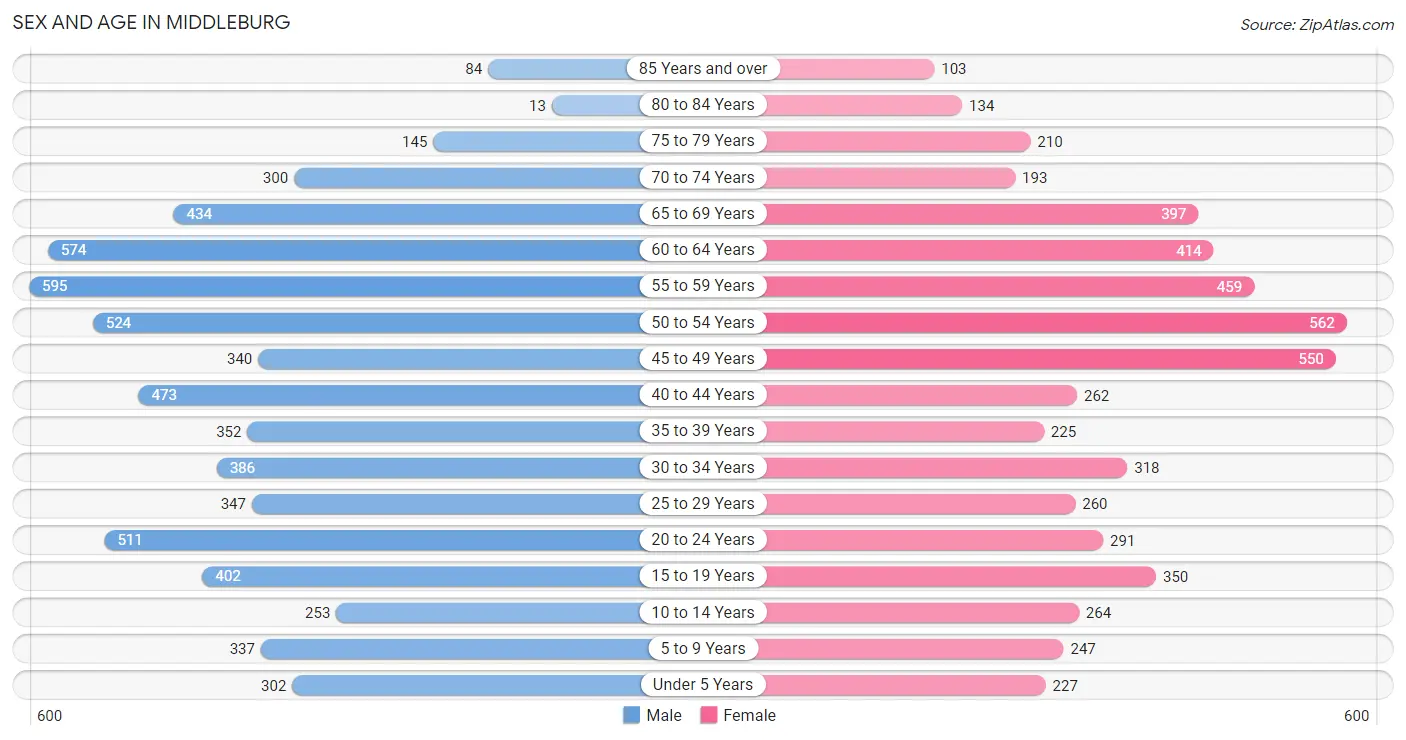
Sex and Age in Middleburg
Sex and Age in Middleburg
The most populous age groups in Middleburg are 55 to 59 Years (595 | 9.3%) for men and 50 to 54 Years (562 | 10.3%) for women.
| Age Bracket | Male | Female |
| Under 5 Years | 302 (4.7%) | 227 (4.2%) |
| 5 to 9 Years | 337 (5.3%) | 247 (4.5%) |
| 10 to 14 Years | 253 (4.0%) | 264 (4.8%) |
| 15 to 19 Years | 402 (6.3%) | 350 (6.4%) |
| 20 to 24 Years | 511 (8.0%) | 291 (5.3%) |
| 25 to 29 Years | 347 (5.4%) | 260 (4.8%) |
| 30 to 34 Years | 386 (6.1%) | 318 (5.8%) |
| 35 to 39 Years | 352 (5.5%) | 225 (4.1%) |
| 40 to 44 Years | 473 (7.4%) | 262 (4.8%) |
| 45 to 49 Years | 340 (5.3%) | 550 (10.1%) |
| 50 to 54 Years | 524 (8.2%) | 562 (10.3%) |
| 55 to 59 Years | 595 (9.3%) | 459 (8.4%) |
| 60 to 64 Years | 574 (9.0%) | 414 (7.6%) |
| 65 to 69 Years | 434 (6.8%) | 397 (7.3%) |
| 70 to 74 Years | 300 (4.7%) | 193 (3.5%) |
| 75 to 79 Years | 145 (2.3%) | 210 (3.8%) |
| 80 to 84 Years | 13 (0.2%) | 134 (2.5%) |
| 85 Years and over | 84 (1.3%) | 103 (1.9%) |
| Total | 6,372 (100.0%) | 5,466 (100.0%) |
Families and Households in Middleburg
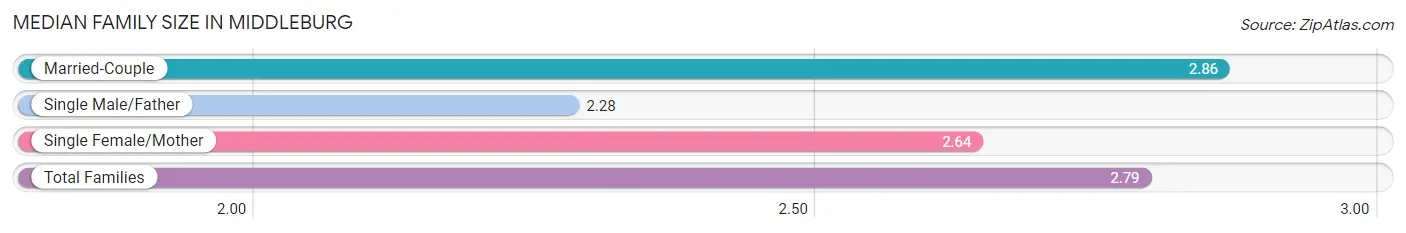
Median Family Size in Middleburg
The median family size in Middleburg is 2.79 persons per family, with married-couple families (2,638 | 77.0%) accounting for the largest median family size of 2.86 persons per family. On the other hand, single male/father families (216 | 6.3%) represent the smallest median family size with 2.28 persons per family.
| Family Type | # Families | Family Size |
| Married-Couple | 2,638 (77.0%) | 2.86 |
| Single Male/Father | 216 (6.3%) | 2.28 |
| Single Female/Mother | 572 (16.7%) | 2.64 |
| Total Families | 3,426 (100.0%) | 2.79 |
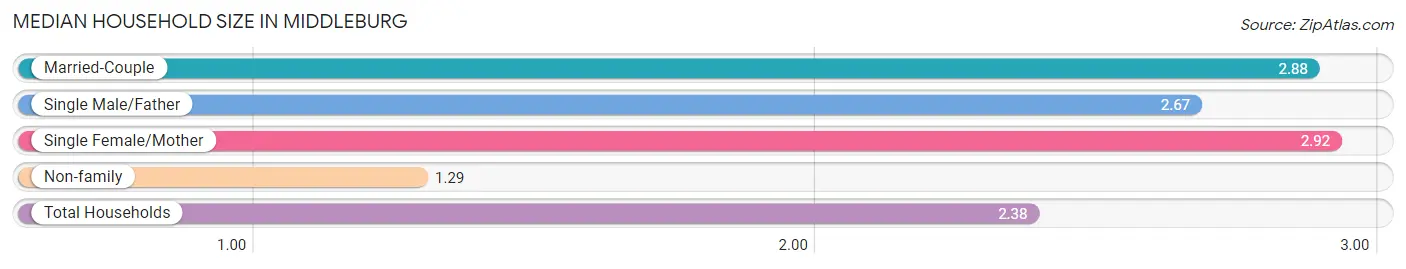
Median Household Size in Middleburg
The median household size in Middleburg is 2.38 persons per household, with single female/mother households (572 | 11.5%) accounting for the largest median household size of 2.92 persons per household. non-family households (1,539 | 31.0%) represent the smallest median household size with 1.29 persons per household.
| Household Type | # Households | Household Size |
| Married-Couple | 2,638 (53.1%) | 2.88 |
| Single Male/Father | 216 (4.3%) | 2.67 |
| Single Female/Mother | 572 (11.5%) | 2.92 |
| Non-family | 1,539 (31.0%) | 1.29 |
| Total Households | 4,965 (100.0%) | 2.38 |
Household Size by Marriage Status in Middleburg
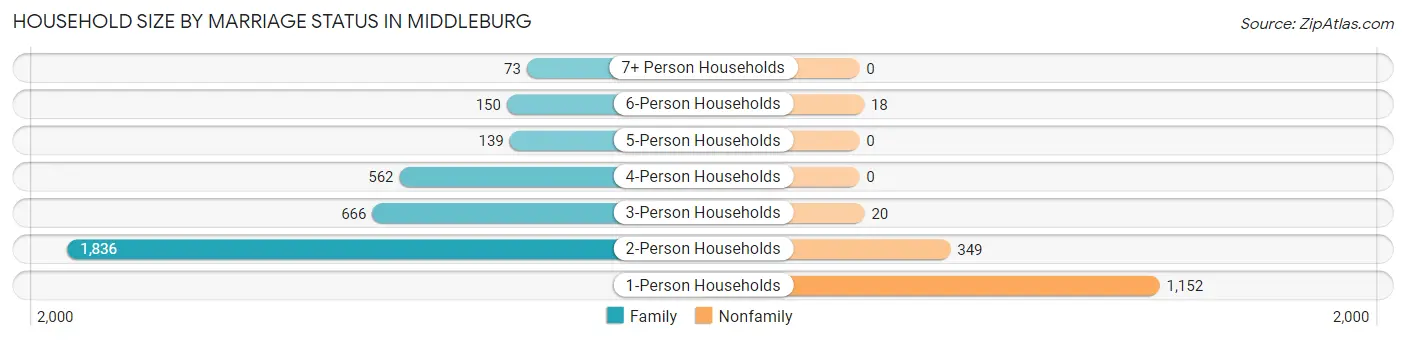
Out of a total of 4,965 households in Middleburg, 3,426 (69.0%) are family households, while 1,539 (31.0%) are nonfamily households. The most numerous type of family households are 2-person households, comprising 1,836, and the most common type of nonfamily households are 1-person households, comprising 1,152.
| Household Size | Family Households | Nonfamily Households |
| 1-Person Households | - | 1,152 (23.2%) |
| 2-Person Households | 1,836 (37.0%) | 349 (7.0%) |
| 3-Person Households | 666 (13.4%) | 20 (0.4%) |
| 4-Person Households | 562 (11.3%) | 0 (0.0%) |
| 5-Person Households | 139 (2.8%) | 0 (0.0%) |
| 6-Person Households | 150 (3.0%) | 18 (0.4%) |
| 7+ Person Households | 73 (1.5%) | 0 (0.0%) |
| Total | 3,426 (69.0%) | 1,539 (31.0%) |
Female Fertility in Middleburg
Fertility by Age in Middleburg
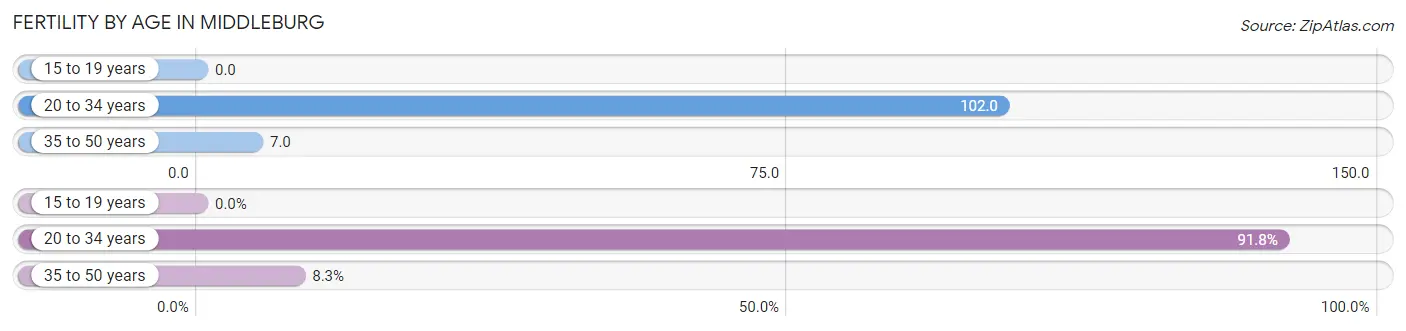
Average fertility rate in Middleburg is 42.0 births per 1,000 women. Women in the age bracket of 20 to 34 years have the highest fertility rate with 102.0 births per 1,000 women. Women in the age bracket of 20 to 34 years acount for 91.7% of all women with births.
| Age Bracket | Women with Births | Births / 1,000 Women |
| 15 to 19 years | 0 (0.0%) | 0.0 |
| 20 to 34 years | 89 (91.7%) | 102.0 |
| 35 to 50 years | 8 (8.3%) | 7.0 |
| Total | 97 (100.0%) | 42.0 |
Fertility by Age by Marriage Status in Middleburg
85.6% of women with births (97) in Middleburg are married. The highest percentage of unmarried women with births falls into 20 to 34 years age bracket with 15.7% of them unmarried at the time of birth, while the lowest percentage of unmarried women with births belong to 35 to 50 years age bracket with 0.0% of them unmarried.
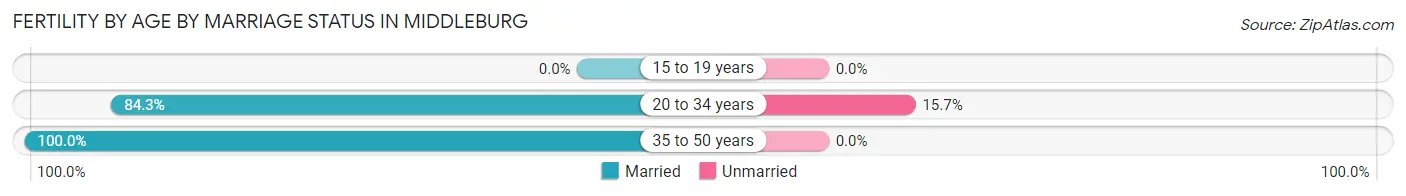
| Age Bracket | Married | Unmarried |
| 15 to 19 years | 0 (0.0%) | 0 (0.0%) |
| 20 to 34 years | 75 (84.3%) | 14 (15.7%) |
| 35 to 50 years | 8 (100.0%) | 0 (0.0%) |
| Total | 83 (85.6%) | 14 (14.4%) |
Fertility by Education in Middleburg
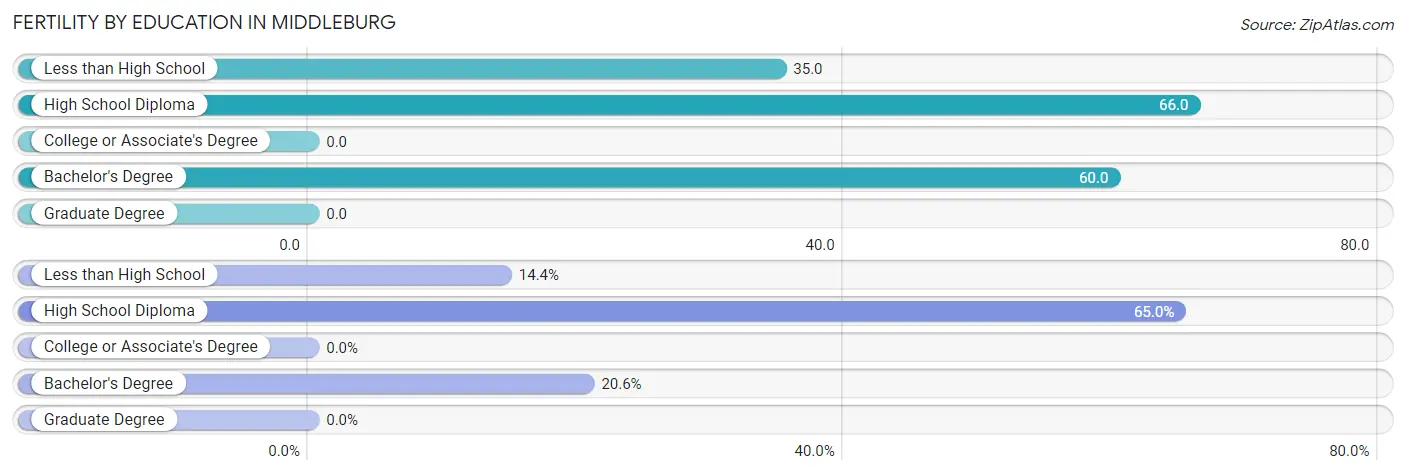
| Educational Attainment | Women with Births | Births / 1,000 Women |
| Less than High School | 14 (14.4%) | 35.0 |
| High School Diploma | 63 (64.9%) | 66.0 |
| College or Associate's Degree | 0 (0.0%) | 0.0 |
| Bachelor's Degree | 20 (20.6%) | 60.0 |
| Graduate Degree | 0 (0.0%) | 0.0 |
| Total | 97 (100.0%) | 42.0 |
Fertility by Education by Marriage Status in Middleburg
14.4% of women with births in Middleburg are unmarried. Women with the educational attainment of high school diploma are most likely to be married with 100.0% of them married at childbirth, while women with the educational attainment of less than high school are least likely to be married with 100.0% of them unmarried at childbirth.
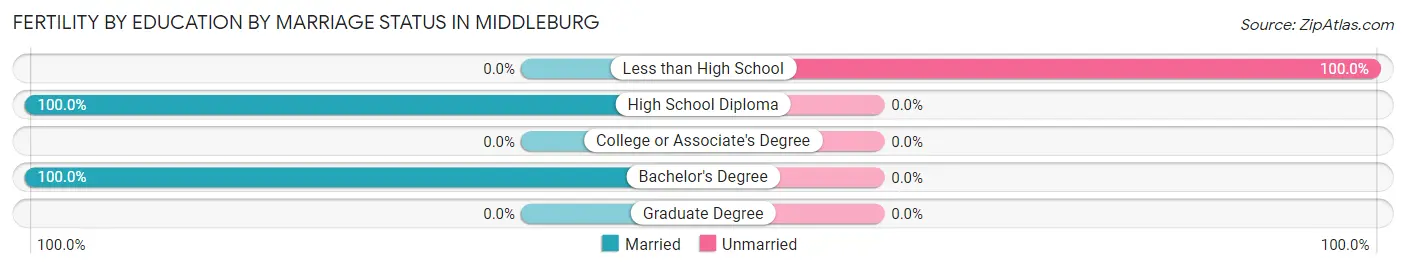
| Educational Attainment | Married | Unmarried |
| Less than High School | 0 (0.0%) | 14 (100.0%) |
| High School Diploma | 63 (100.0%) | 0 (0.0%) |
| College or Associate's Degree | 0 (0.0%) | 0 (0.0%) |
| Bachelor's Degree | 20 (100.0%) | 0 (0.0%) |
| Graduate Degree | 0 (0.0%) | 0 (0.0%) |
| Total | 83 (85.6%) | 14 (14.4%) |
Employment Characteristics in Middleburg
Employment by Class of Employer in Middleburg
Among the 6,227 employed individuals in Middleburg, private company employees (4,528 | 72.7%), not-for-profit organizations (379 | 6.1%), and local government employees (358 | 5.8%) make up the most common classes of employment.
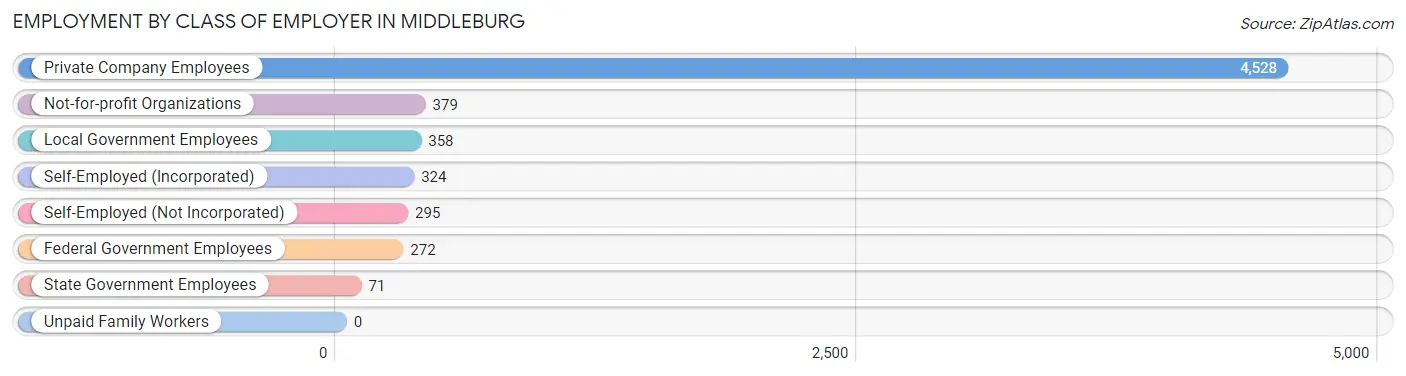
| Employer Class | # Employees | % Employees |
| Private Company Employees | 4,528 | 72.7% |
| Self-Employed (Incorporated) | 324 | 5.2% |
| Self-Employed (Not Incorporated) | 295 | 4.7% |
| Not-for-profit Organizations | 379 | 6.1% |
| Local Government Employees | 358 | 5.8% |
| State Government Employees | 71 | 1.1% |
| Federal Government Employees | 272 | 4.4% |
| Unpaid Family Workers | 0 | 0.0% |
| Total | 6,227 | 100.0% |
Employment Status by Age in Middleburg
According to the labor force statistics for Middleburg, out of the total population over 16 years of age (10,013), 65.8% or 6,589 individuals are in the labor force, with 4.7% or 310 of them unemployed. The age group with the highest labor force participation rate is 35 to 44 years, with 90.4% or 1,186 individuals in the labor force. Within the labor force, the 16 to 19 years age range has the highest percentage of unemployed individuals, with 49.6% or 124 of them being unemployed.
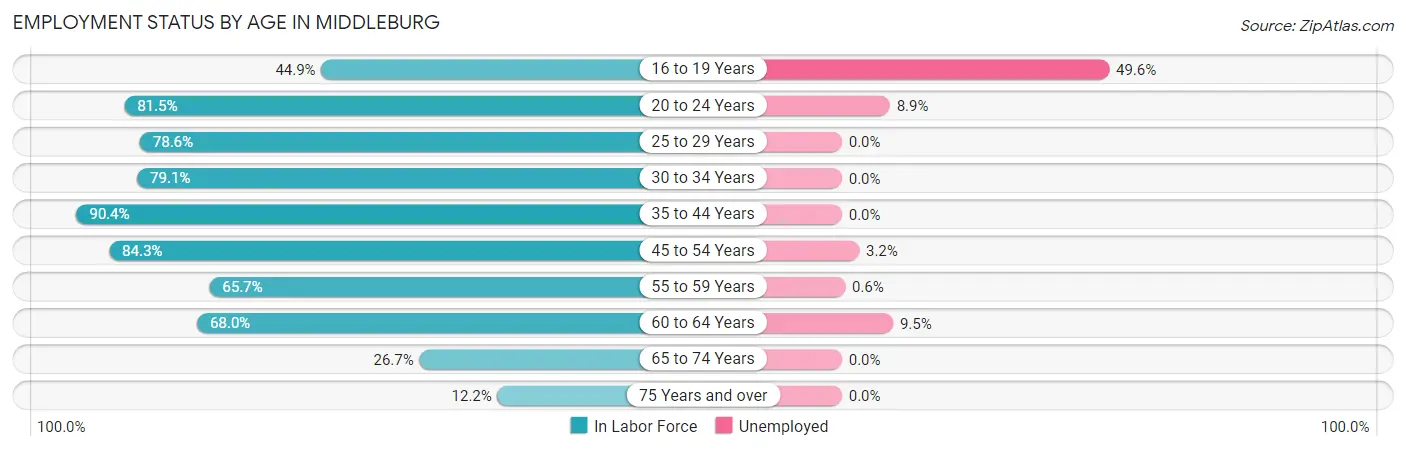
| Age Bracket | In Labor Force | Unemployed |
| 16 to 19 Years | 250 (44.9%) | 124 (49.6%) |
| 20 to 24 Years | 654 (81.5%) | 58 (8.9%) |
| 25 to 29 Years | 477 (78.6%) | 0 (0.0%) |
| 30 to 34 Years | 557 (79.1%) | 0 (0.0%) |
| 35 to 44 Years | 1,186 (90.4%) | 0 (0.0%) |
| 45 to 54 Years | 1,666 (84.3%) | 53 (3.2%) |
| 55 to 59 Years | 692 (65.7%) | 4 (0.6%) |
| 60 to 64 Years | 672 (68.0%) | 64 (9.5%) |
| 65 to 74 Years | 354 (26.7%) | 0 (0.0%) |
| 75 Years and over | 84 (12.2%) | 0 (0.0%) |
| Total | 6,589 (65.8%) | 310 (4.7%) |
Employment Status by Educational Attainment in Middleburg
According to labor force statistics for Middleburg, 79.1% of individuals (5,253) out of the total population between 25 and 64 years of age (6,641) are in the labor force, with 2.4% or 126 of them being unemployed. The group with the highest labor force participation rate are those with the educational attainment of bachelor's degree or higher, with 91.4% or 1,184 individuals in the labor force. Within the labor force, individuals with bachelor's degree or higher education have the highest percentage of unemployment, with 4.1% or 49 of them being unemployed.
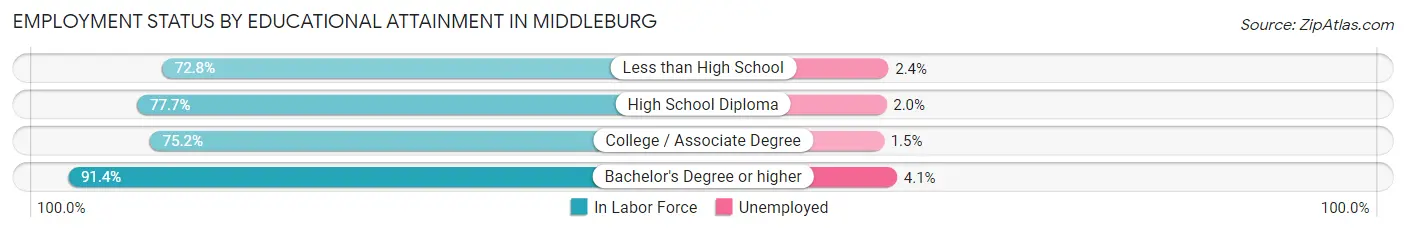
| Educational Attainment | In Labor Force | Unemployed |
| Less than High School | 533 (72.8%) | 18 (2.4%) |
| High School Diploma | 1,953 (77.7%) | 50 (2.0%) |
| College / Associate Degree | 1,579 (75.2%) | 32 (1.5%) |
| Bachelor's Degree or higher | 1,184 (91.4%) | 53 (4.1%) |
| Total | 5,253 (79.1%) | 159 (2.4%) |
Employment Occupations by Sex in Middleburg
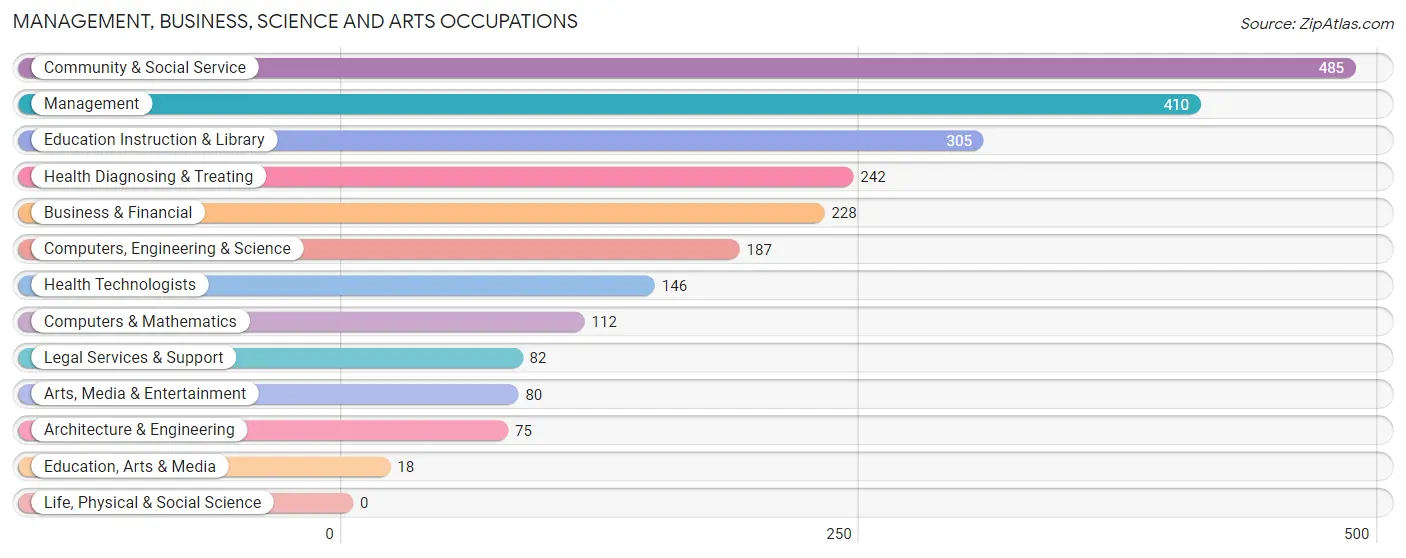
Management, Business, Science and Arts Occupations
The most common Management, Business, Science and Arts occupations in Middleburg are Community & Social Service (485 | 7.9%), Management (410 | 6.7%), Education Instruction & Library (305 | 5.0%), Health Diagnosing & Treating (242 | 3.9%), and Business & Financial (228 | 3.7%).
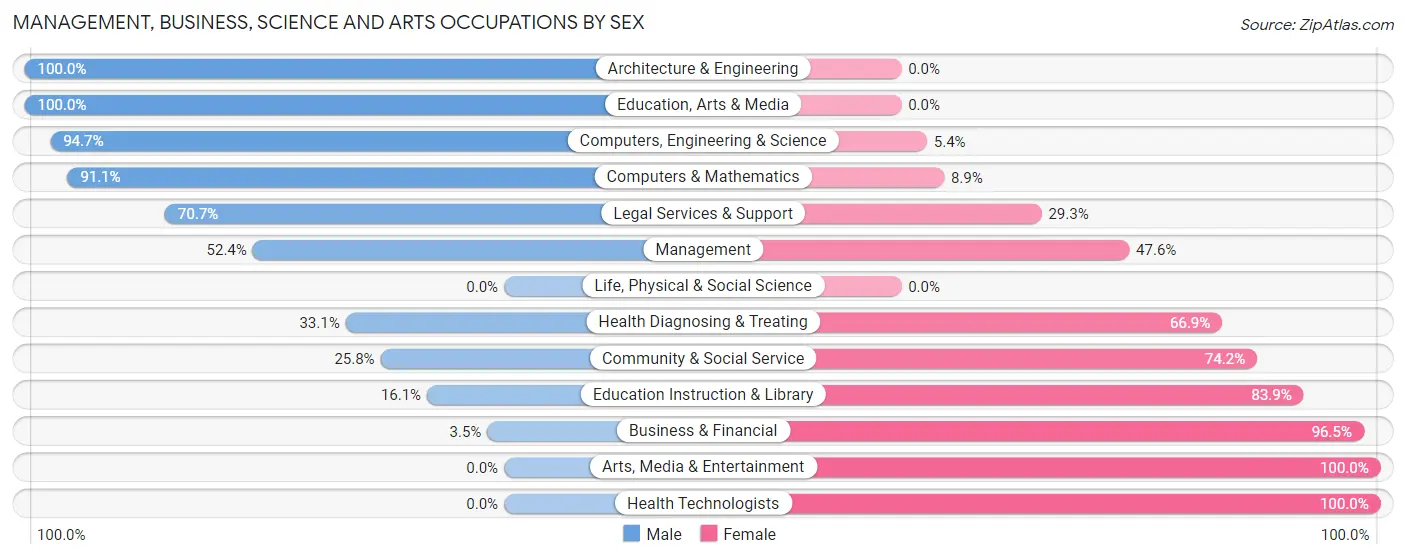
Management, Business, Science and Arts Occupations by Sex
Within the Management, Business, Science and Arts occupations in Middleburg, the most male-oriented occupations are Architecture & Engineering (100.0%), Education, Arts & Media (100.0%), and Computers, Engineering & Science (94.7%), while the most female-oriented occupations are Arts, Media & Entertainment (100.0%), Health Technologists (100.0%), and Business & Financial (96.5%).
| Occupation | Male | Female |
| Management | 215 (52.4%) | 195 (47.6%) |
| Business & Financial | 8 (3.5%) | 220 (96.5%) |
| Computers, Engineering & Science | 177 (94.7%) | 10 (5.3%) |
| Computers & Mathematics | 102 (91.1%) | 10 (8.9%) |
| Architecture & Engineering | 75 (100.0%) | 0 (0.0%) |
| Life, Physical & Social Science | 0 (0.0%) | 0 (0.0%) |
| Community & Social Service | 125 (25.8%) | 360 (74.2%) |
| Education, Arts & Media | 18 (100.0%) | 0 (0.0%) |
| Legal Services & Support | 58 (70.7%) | 24 (29.3%) |
| Education Instruction & Library | 49 (16.1%) | 256 (83.9%) |
| Arts, Media & Entertainment | 0 (0.0%) | 80 (100.0%) |
| Health Diagnosing & Treating | 80 (33.1%) | 162 (66.9%) |
| Health Technologists | 0 (0.0%) | 146 (100.0%) |
| Total (Category) | 605 (39.0%) | 947 (61.0%) |
| Total (Overall) | 3,324 (54.2%) | 2,811 (45.8%) |
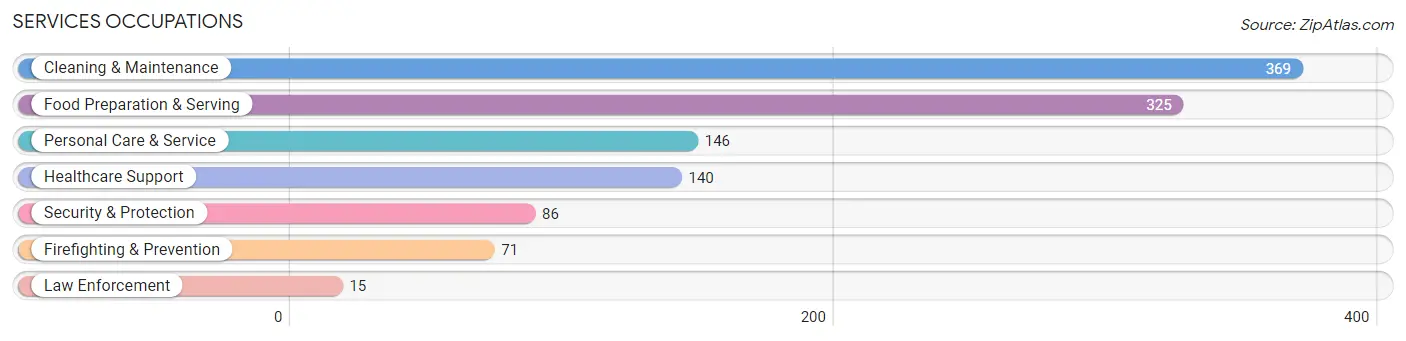
Services Occupations
The most common Services occupations in Middleburg are Cleaning & Maintenance (369 | 6.0%), Food Preparation & Serving (325 | 5.3%), Personal Care & Service (146 | 2.4%), Healthcare Support (140 | 2.3%), and Security & Protection (86 | 1.4%).
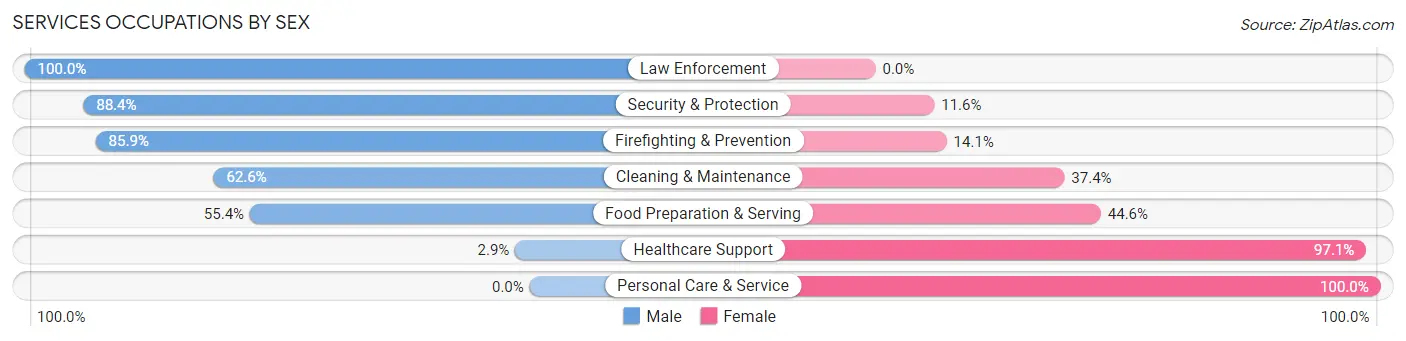
Services Occupations by Sex
Within the Services occupations in Middleburg, the most male-oriented occupations are Law Enforcement (100.0%), Security & Protection (88.4%), and Firefighting & Prevention (85.9%), while the most female-oriented occupations are Personal Care & Service (100.0%), Healthcare Support (97.1%), and Food Preparation & Serving (44.6%).
| Occupation | Male | Female |
| Healthcare Support | 4 (2.9%) | 136 (97.1%) |
| Security & Protection | 76 (88.4%) | 10 (11.6%) |
| Firefighting & Prevention | 61 (85.9%) | 10 (14.1%) |
| Law Enforcement | 15 (100.0%) | 0 (0.0%) |
| Food Preparation & Serving | 180 (55.4%) | 145 (44.6%) |
| Cleaning & Maintenance | 231 (62.6%) | 138 (37.4%) |
| Personal Care & Service | 0 (0.0%) | 146 (100.0%) |
| Total (Category) | 491 (46.1%) | 575 (53.9%) |
| Total (Overall) | 3,324 (54.2%) | 2,811 (45.8%) |
Sales and Office Occupations
The most common Sales and Office occupations in Middleburg are Office & Administration (867 | 14.1%), and Sales & Related (692 | 11.3%).
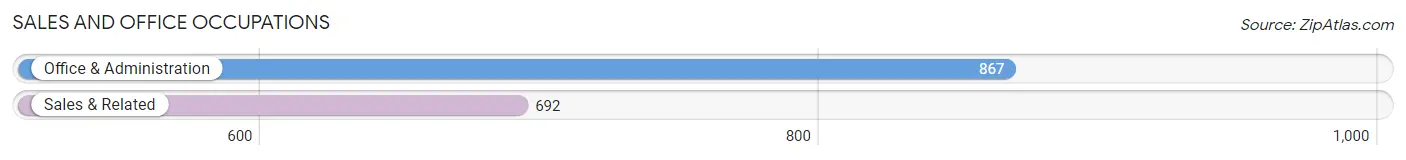
Sales and Office Occupations by Sex

| Occupation | Male | Female |
| Sales & Related | 272 (39.3%) | 420 (60.7%) |
| Office & Administration | 151 (17.4%) | 716 (82.6%) |
| Total (Category) | 423 (27.1%) | 1,136 (72.9%) |
| Total (Overall) | 3,324 (54.2%) | 2,811 (45.8%) |
Natural Resources, Construction and Maintenance Occupations
The most common Natural Resources, Construction and Maintenance occupations in Middleburg are Construction & Extraction (717 | 11.7%), Installation, Maintenance & Repair (474 | 7.7%), and Farming, Fishing & Forestry (27 | 0.4%).
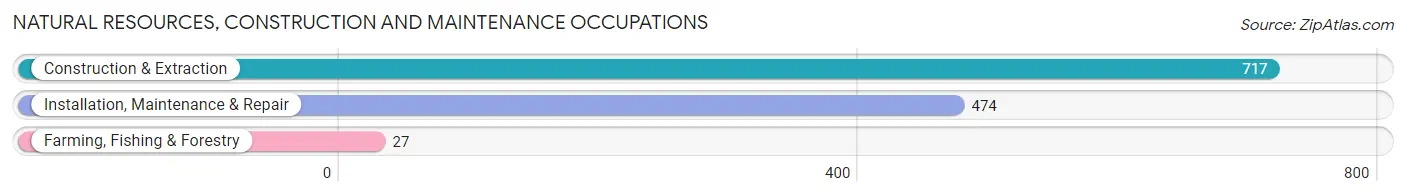
Natural Resources, Construction and Maintenance Occupations by Sex

| Occupation | Male | Female |
| Farming, Fishing & Forestry | 0 (0.0%) | 27 (100.0%) |
| Construction & Extraction | 717 (100.0%) | 0 (0.0%) |
| Installation, Maintenance & Repair | 474 (100.0%) | 0 (0.0%) |
| Total (Category) | 1,191 (97.8%) | 27 (2.2%) |
| Total (Overall) | 3,324 (54.2%) | 2,811 (45.8%) |
Production, Transportation and Moving Occupations
The most common Production, Transportation and Moving occupations in Middleburg are Production (381 | 6.2%), Transportation (247 | 4.0%), and Material Moving (112 | 1.8%).
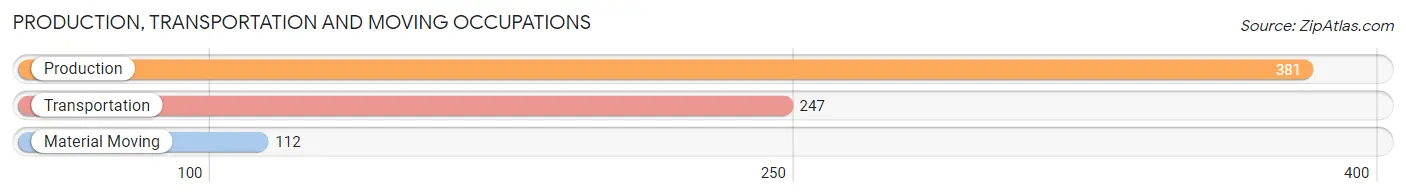
Production, Transportation and Moving Occupations by Sex
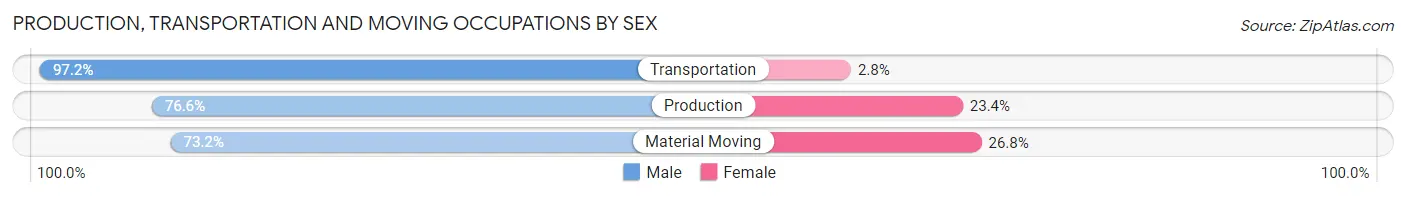
| Occupation | Male | Female |
| Production | 292 (76.6%) | 89 (23.4%) |
| Transportation | 240 (97.2%) | 7 (2.8%) |
| Material Moving | 82 (73.2%) | 30 (26.8%) |
| Total (Category) | 614 (83.0%) | 126 (17.0%) |
| Total (Overall) | 3,324 (54.2%) | 2,811 (45.8%) |
Employment Industries by Sex in Middleburg
Employment Industries in Middleburg
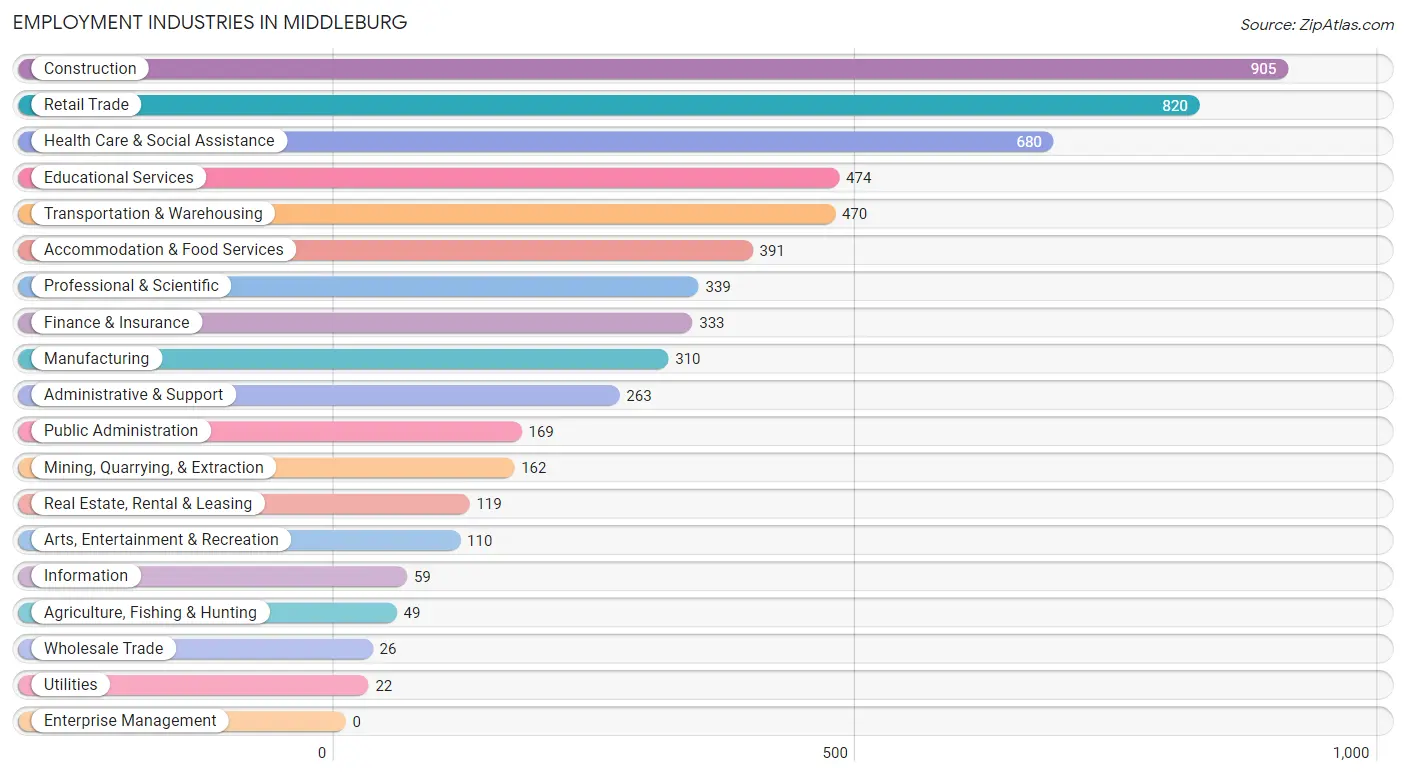
The major employment industries in Middleburg include Construction (905 | 14.7%), Retail Trade (820 | 13.4%), Health Care & Social Assistance (680 | 11.1%), Educational Services (474 | 7.7%), and Transportation & Warehousing (470 | 7.7%).
Employment Industries by Sex in Middleburg
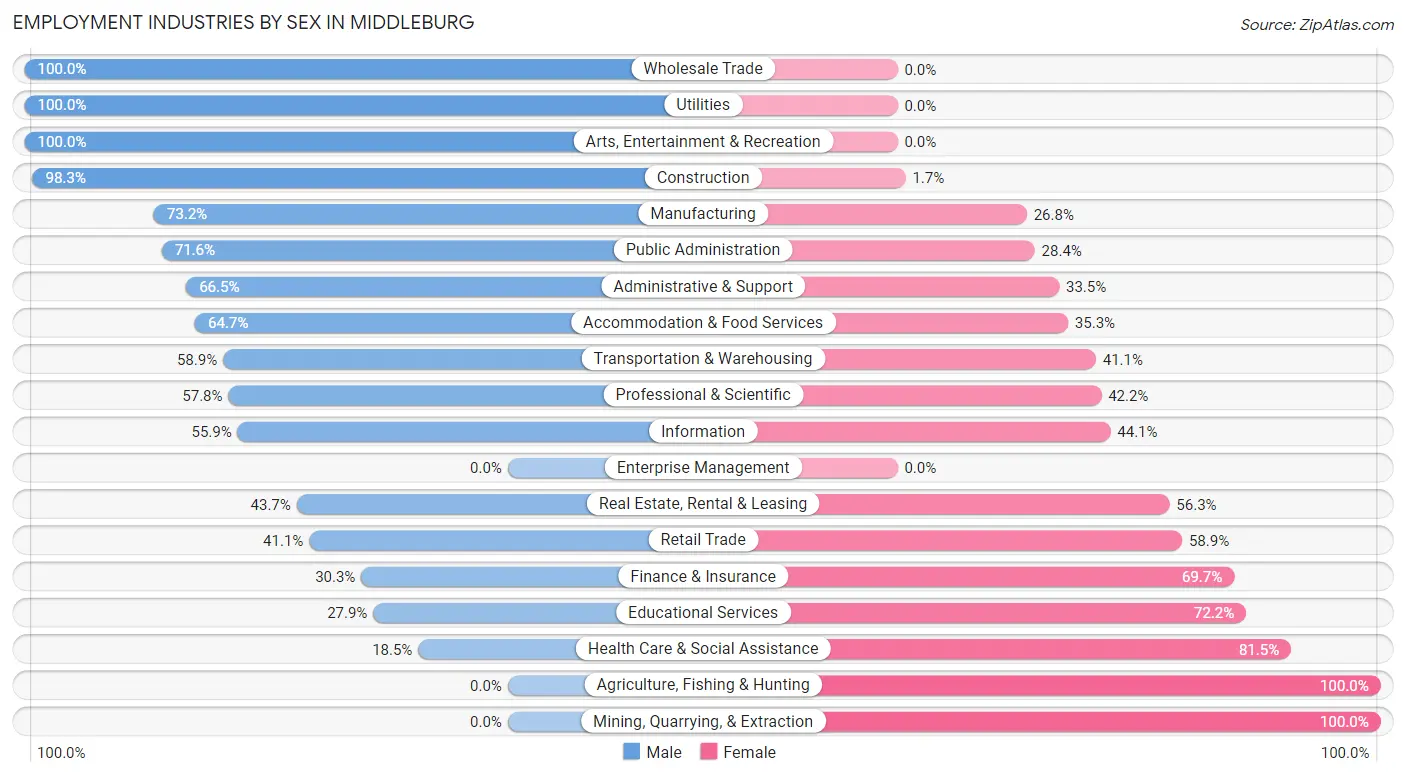
The Middleburg industries that see more men than women are Wholesale Trade (100.0%), Utilities (100.0%), and Arts, Entertainment & Recreation (100.0%), whereas the industries that tend to have a higher number of women are Agriculture, Fishing & Hunting (100.0%), Mining, Quarrying, & Extraction (100.0%), and Health Care & Social Assistance (81.5%).
| Industry | Male | Female |
| Agriculture, Fishing & Hunting | 0 (0.0%) | 49 (100.0%) |
| Mining, Quarrying, & Extraction | 0 (0.0%) | 162 (100.0%) |
| Construction | 890 (98.3%) | 15 (1.7%) |
| Manufacturing | 227 (73.2%) | 83 (26.8%) |
| Wholesale Trade | 26 (100.0%) | 0 (0.0%) |
| Retail Trade | 337 (41.1%) | 483 (58.9%) |
| Transportation & Warehousing | 277 (58.9%) | 193 (41.1%) |
| Utilities | 22 (100.0%) | 0 (0.0%) |
| Information | 33 (55.9%) | 26 (44.1%) |
| Finance & Insurance | 101 (30.3%) | 232 (69.7%) |
| Real Estate, Rental & Leasing | 52 (43.7%) | 67 (56.3%) |
| Professional & Scientific | 196 (57.8%) | 143 (42.2%) |
| Enterprise Management | 0 (0.0%) | 0 (0.0%) |
| Administrative & Support | 175 (66.5%) | 88 (33.5%) |
| Educational Services | 132 (27.9%) | 342 (72.2%) |
| Health Care & Social Assistance | 126 (18.5%) | 554 (81.5%) |
| Arts, Entertainment & Recreation | 110 (100.0%) | 0 (0.0%) |
| Accommodation & Food Services | 253 (64.7%) | 138 (35.3%) |
| Public Administration | 121 (71.6%) | 48 (28.4%) |
| Total | 3,324 (54.2%) | 2,811 (45.8%) |
Education in Middleburg
School Enrollment in Middleburg
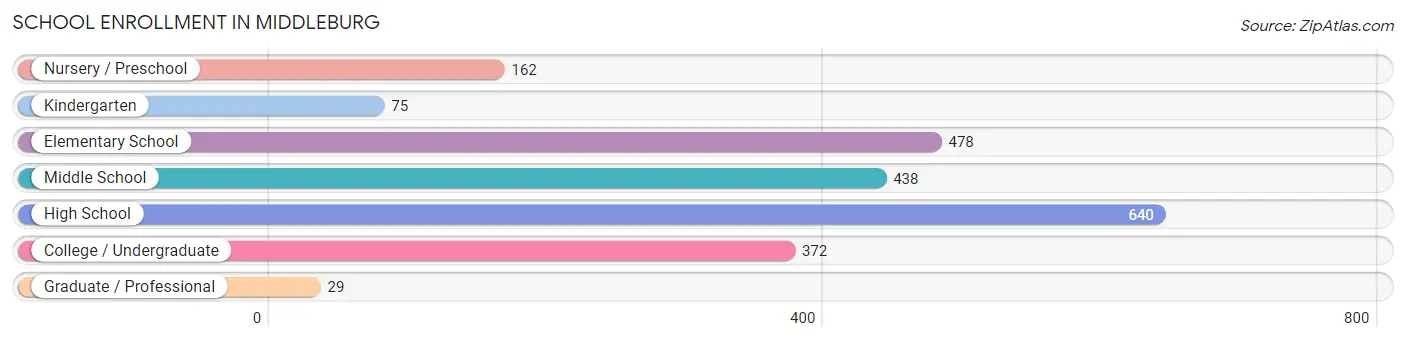
The most common levels of schooling among the 2,194 students in Middleburg are high school (640 | 29.2%), elementary school (478 | 21.8%), and middle school (438 | 20.0%).
| School Level | # Students | % Students |
| Nursery / Preschool | 162 | 7.4% |
| Kindergarten | 75 | 3.4% |
| Elementary School | 478 | 21.8% |
| Middle School | 438 | 20.0% |
| High School | 640 | 29.2% |
| College / Undergraduate | 372 | 17.0% |
| Graduate / Professional | 29 | 1.3% |
| Total | 2,194 | 100.0% |
School Enrollment by Age by Funding Source in Middleburg
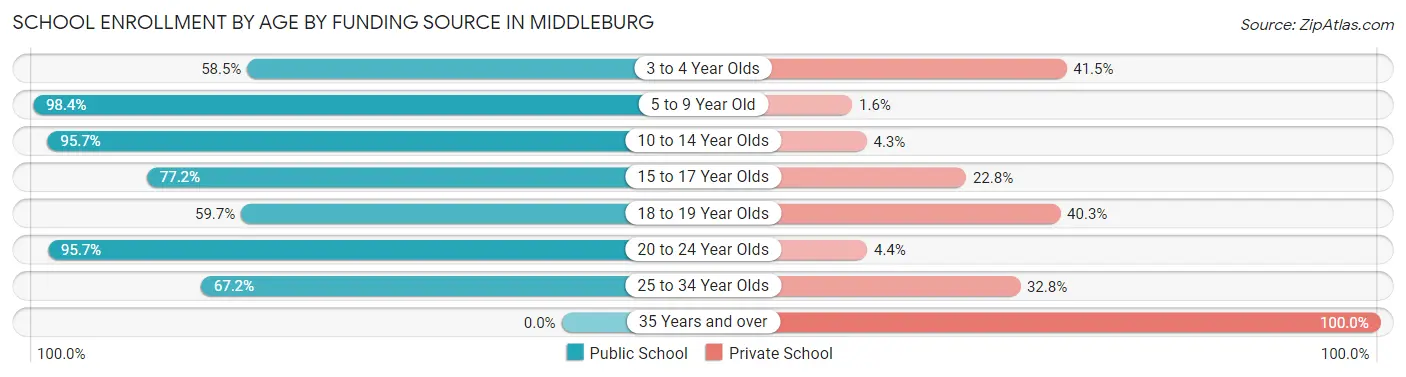
Out of a total of 2,194 students who are enrolled in schools in Middleburg, 371 (16.9%) attend a private institution, while the remaining 1,823 (83.1%) are enrolled in public schools. The age group of 35 years and over has the highest likelihood of being enrolled in private schools, with 49 (100.0% in the age bracket) enrolled. Conversely, the age group of 5 to 9 year old has the lowest likelihood of being enrolled in a private school, with 501 (98.4% in the age bracket) attending a public institution.
| Age Bracket | Public School | Private School |
| 3 to 4 Year Olds | 96 (58.5%) | 68 (41.5%) |
| 5 to 9 Year Old | 501 (98.4%) | 8 (1.6%) |
| 10 to 14 Year Olds | 495 (95.7%) | 22 (4.3%) |
| 15 to 17 Year Olds | 400 (77.2%) | 118 (22.8%) |
| 18 to 19 Year Olds | 111 (59.7%) | 75 (40.3%) |
| 20 to 24 Year Olds | 176 (95.7%) | 8 (4.3%) |
| 25 to 34 Year Olds | 45 (67.2%) | 22 (32.8%) |
| 35 Years and over | 0 (0.0%) | 49 (100.0%) |
| Total | 1,823 (83.1%) | 371 (16.9%) |
Educational Attainment by Field of Study in Middleburg
Education (326 | 20.1%), business (298 | 18.4%), computers & mathematics (180 | 11.1%), communications (129 | 8.0%), and liberal arts & history (124 | 7.7%) are the most common fields of study among 1,619 individuals in Middleburg who have obtained a bachelor's degree or higher.
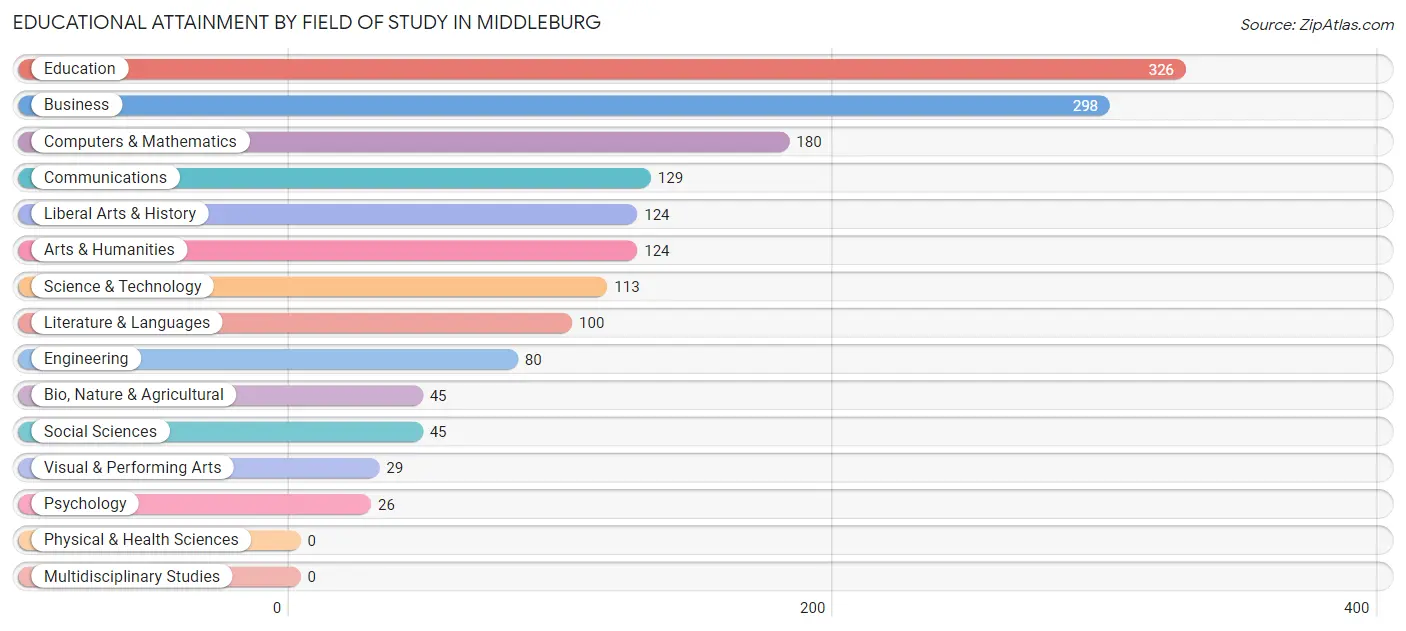
| Field of Study | # Graduates | % Graduates |
| Computers & Mathematics | 180 | 11.1% |
| Bio, Nature & Agricultural | 45 | 2.8% |
| Physical & Health Sciences | 0 | 0.0% |
| Psychology | 26 | 1.6% |
| Social Sciences | 45 | 2.8% |
| Engineering | 80 | 4.9% |
| Multidisciplinary Studies | 0 | 0.0% |
| Science & Technology | 113 | 7.0% |
| Business | 298 | 18.4% |
| Education | 326 | 20.1% |
| Literature & Languages | 100 | 6.2% |
| Liberal Arts & History | 124 | 7.7% |
| Visual & Performing Arts | 29 | 1.8% |
| Communications | 129 | 8.0% |
| Arts & Humanities | 124 | 7.7% |
| Total | 1,619 | 100.0% |
Transportation & Commute in Middleburg
Vehicle Availability by Sex in Middleburg
The most prevalent vehicle ownership categories in Middleburg are males with 2 vehicles (1,401, accounting for 40.6%) and females with 2 vehicles (1,044, making up 50.5%).
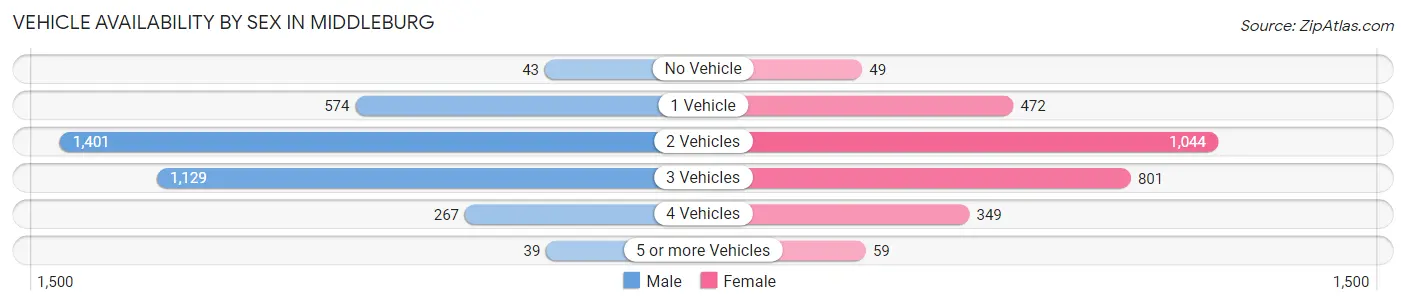
| Vehicles Available | Male | Female |
| No Vehicle | 43 (1.3%) | 49 (1.8%) |
| 1 Vehicle | 574 (16.6%) | 472 (17.0%) |
| 2 Vehicles | 1,401 (40.6%) | 1,044 (37.6%) |
| 3 Vehicles | 1,129 (32.7%) | 801 (28.9%) |
| 4 Vehicles | 267 (7.7%) | 349 (12.6%) |
| 5 or more Vehicles | 39 (1.1%) | 59 (2.1%) |
| Total | 3,453 (100.0%) | 2,774 (100.0%) |
Commute Time in Middleburg
The most frequently occuring commute durations in Middleburg are 45 to 59 minutes (1,265 commuters, 21.7%), 60 to 89 minutes (1,113 commuters, 19.1%), and 30 to 34 minutes (995 commuters, 17.1%).
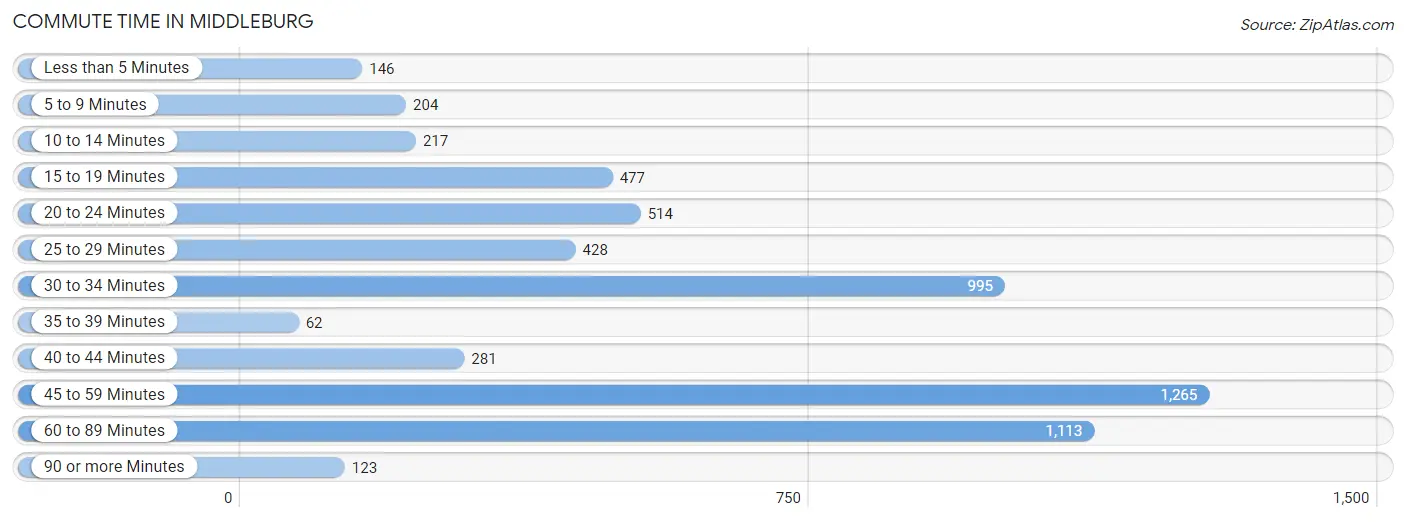
| Commute Time | # Commuters | % Commuters |
| Less than 5 Minutes | 146 | 2.5% |
| 5 to 9 Minutes | 204 | 3.5% |
| 10 to 14 Minutes | 217 | 3.7% |
| 15 to 19 Minutes | 477 | 8.2% |
| 20 to 24 Minutes | 514 | 8.8% |
| 25 to 29 Minutes | 428 | 7.3% |
| 30 to 34 Minutes | 995 | 17.1% |
| 35 to 39 Minutes | 62 | 1.1% |
| 40 to 44 Minutes | 281 | 4.8% |
| 45 to 59 Minutes | 1,265 | 21.7% |
| 60 to 89 Minutes | 1,113 | 19.1% |
| 90 or more Minutes | 123 | 2.1% |
Commute Time by Sex in Middleburg
The most common commute times in Middleburg are 45 to 59 minutes (897 commuters, 27.1%) for males and 30 to 34 minutes (461 commuters, 18.3%) for females.
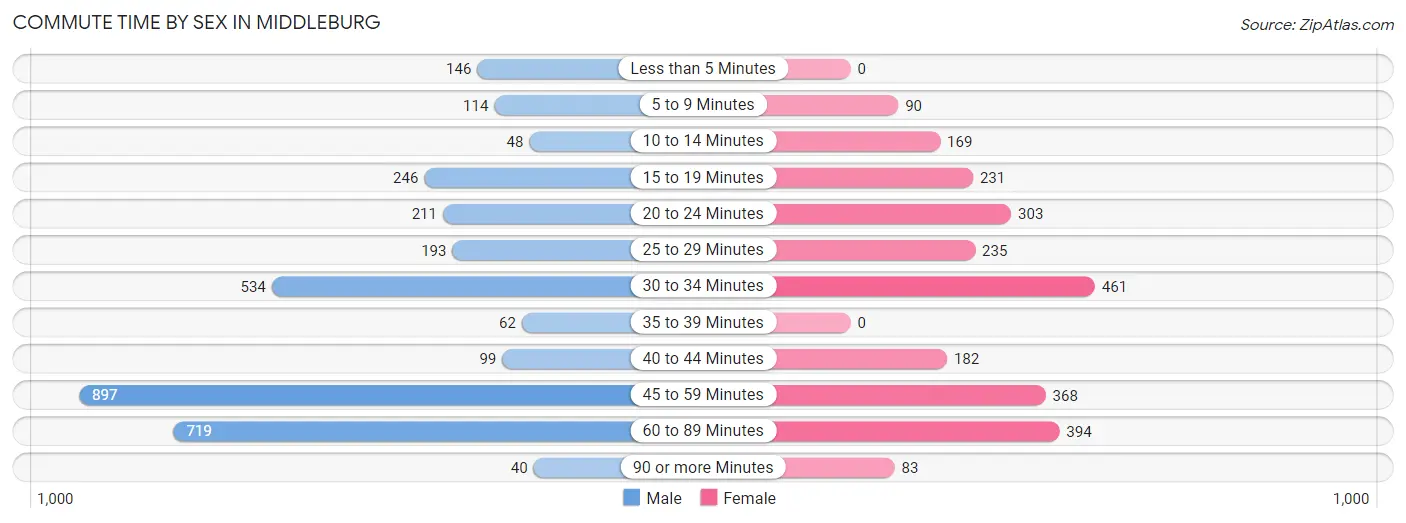
| Commute Time | Male | Female |
| Less than 5 Minutes | 146 (4.4%) | 0 (0.0%) |
| 5 to 9 Minutes | 114 (3.5%) | 90 (3.6%) |
| 10 to 14 Minutes | 48 (1.5%) | 169 (6.7%) |
| 15 to 19 Minutes | 246 (7.4%) | 231 (9.2%) |
| 20 to 24 Minutes | 211 (6.4%) | 303 (12.0%) |
| 25 to 29 Minutes | 193 (5.8%) | 235 (9.3%) |
| 30 to 34 Minutes | 534 (16.1%) | 461 (18.3%) |
| 35 to 39 Minutes | 62 (1.9%) | 0 (0.0%) |
| 40 to 44 Minutes | 99 (3.0%) | 182 (7.2%) |
| 45 to 59 Minutes | 897 (27.1%) | 368 (14.6%) |
| 60 to 89 Minutes | 719 (21.7%) | 394 (15.7%) |
| 90 or more Minutes | 40 (1.2%) | 83 (3.3%) |
Time of Departure to Work by Sex in Middleburg
The most frequent times of departure to work in Middleburg are 6:30 AM to 6:59 AM (586, 17.7%) for males and 7:00 AM to 7:29 AM (396, 15.7%) for females.
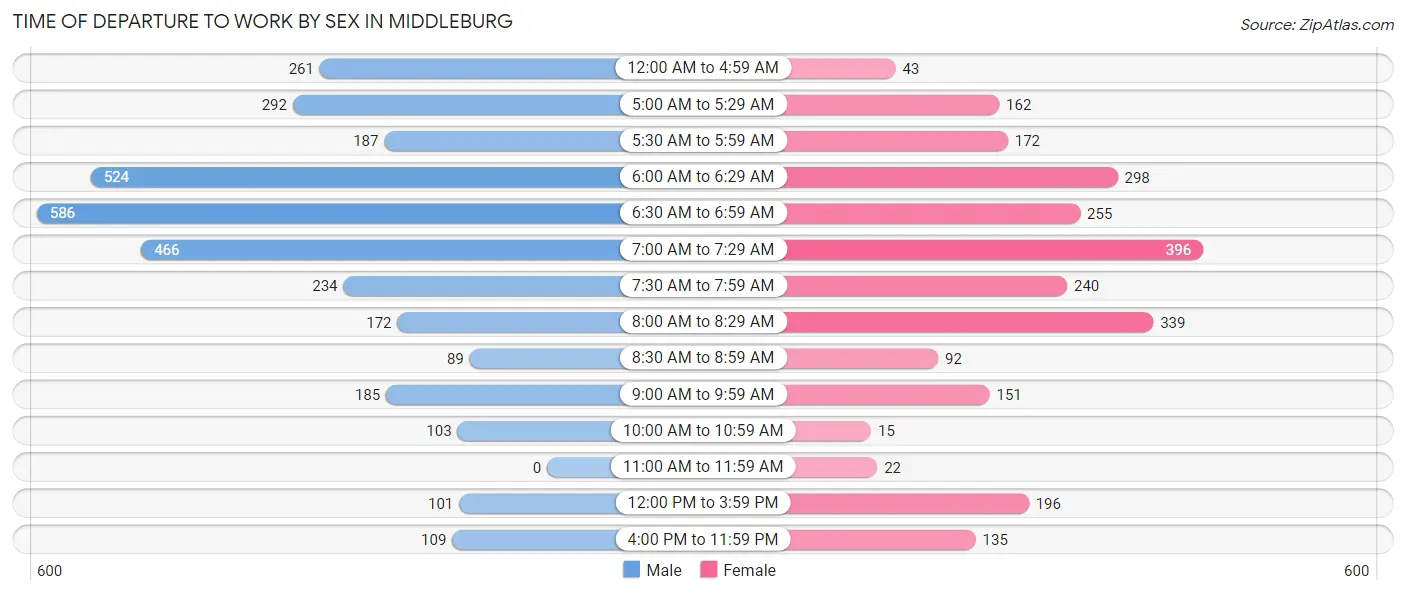
| Time of Departure | Male | Female |
| 12:00 AM to 4:59 AM | 261 (7.9%) | 43 (1.7%) |
| 5:00 AM to 5:29 AM | 292 (8.8%) | 162 (6.4%) |
| 5:30 AM to 5:59 AM | 187 (5.7%) | 172 (6.8%) |
| 6:00 AM to 6:29 AM | 524 (15.8%) | 298 (11.8%) |
| 6:30 AM to 6:59 AM | 586 (17.7%) | 255 (10.1%) |
| 7:00 AM to 7:29 AM | 466 (14.1%) | 396 (15.7%) |
| 7:30 AM to 7:59 AM | 234 (7.1%) | 240 (9.5%) |
| 8:00 AM to 8:29 AM | 172 (5.2%) | 339 (13.5%) |
| 8:30 AM to 8:59 AM | 89 (2.7%) | 92 (3.7%) |
| 9:00 AM to 9:59 AM | 185 (5.6%) | 151 (6.0%) |
| 10:00 AM to 10:59 AM | 103 (3.1%) | 15 (0.6%) |
| 11:00 AM to 11:59 AM | 0 (0.0%) | 22 (0.9%) |
| 12:00 PM to 3:59 PM | 101 (3.0%) | 196 (7.8%) |
| 4:00 PM to 11:59 PM | 109 (3.3%) | 135 (5.4%) |
| Total | 3,309 (100.0%) | 2,516 (100.0%) |
Housing Occupancy in Middleburg
Occupancy by Ownership in Middleburg
Of the total 4,965 dwellings in Middleburg, owner-occupied units account for 4,183 (84.3%), while renter-occupied units make up 782 (15.8%).
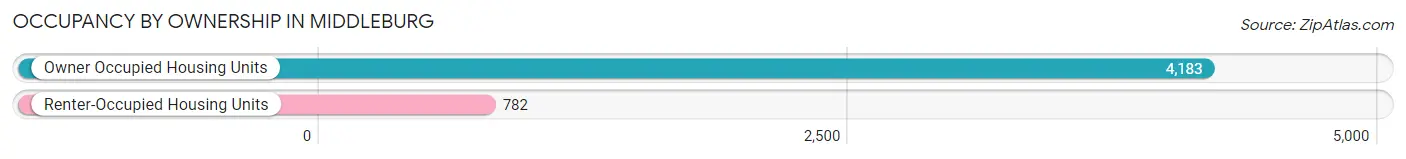
| Occupancy | # Housing Units | % Housing Units |
| Owner Occupied Housing Units | 4,183 | 84.3% |
| Renter-Occupied Housing Units | 782 | 15.8% |
| Total Occupied Housing Units | 4,965 | 100.0% |
Occupancy by Household Size in Middleburg
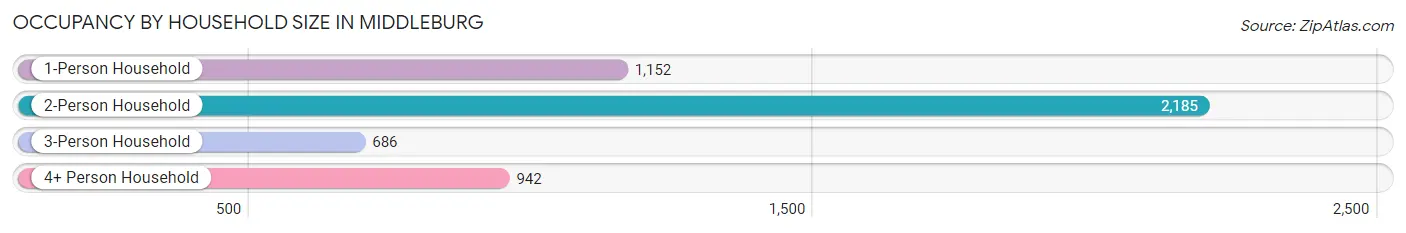
| Household Size | # Housing Units | % Housing Units |
| 1-Person Household | 1,152 | 23.2% |
| 2-Person Household | 2,185 | 44.0% |
| 3-Person Household | 686 | 13.8% |
| 4+ Person Household | 942 | 19.0% |
| Total Housing Units | 4,965 | 100.0% |
Occupancy by Ownership by Household Size in Middleburg
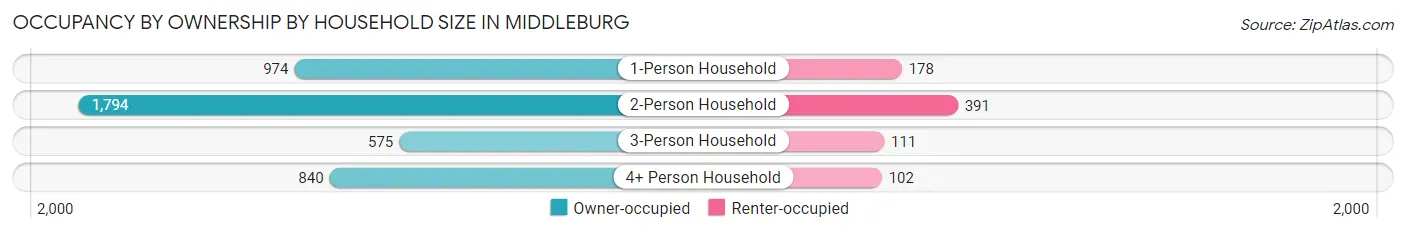
| Household Size | Owner-occupied | Renter-occupied |
| 1-Person Household | 974 (84.6%) | 178 (15.4%) |
| 2-Person Household | 1,794 (82.1%) | 391 (17.9%) |
| 3-Person Household | 575 (83.8%) | 111 (16.2%) |
| 4+ Person Household | 840 (89.2%) | 102 (10.8%) |
| Total Housing Units | 4,183 (84.3%) | 782 (15.8%) |
Occupancy by Educational Attainment in Middleburg
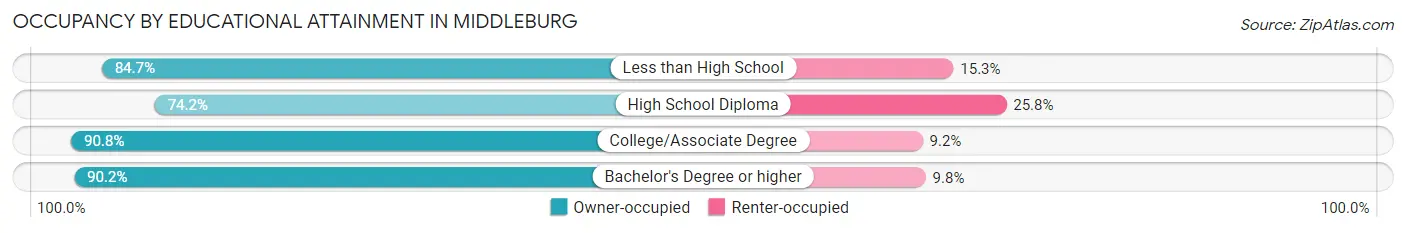
| Household Size | Owner-occupied | Renter-occupied |
| Less than High School | 321 (84.7%) | 58 (15.3%) |
| High School Diploma | 1,323 (74.2%) | 460 (25.8%) |
| College/Associate Degree | 1,675 (90.8%) | 170 (9.2%) |
| Bachelor's Degree or higher | 864 (90.2%) | 94 (9.8%) |
Occupancy by Age of Householder in Middleburg
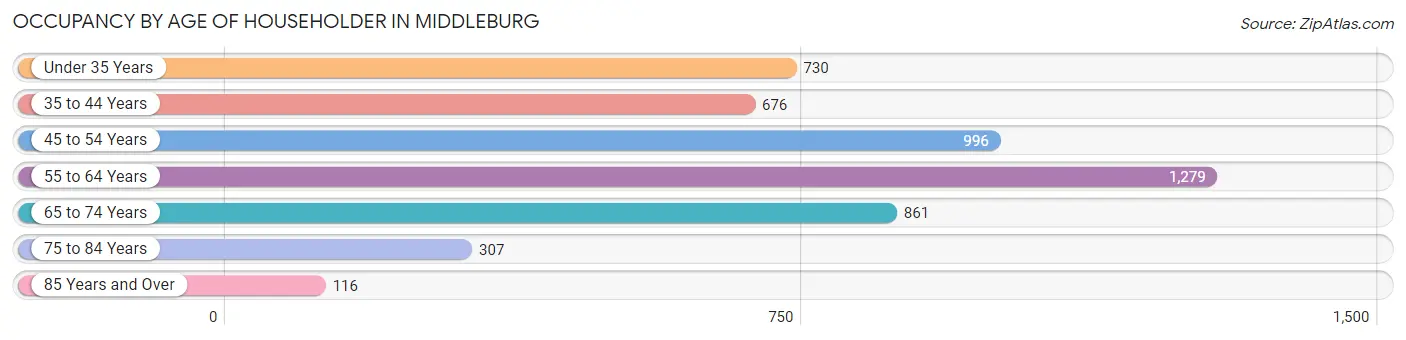
| Age Bracket | # Households | % Households |
| Under 35 Years | 730 | 14.7% |
| 35 to 44 Years | 676 | 13.6% |
| 45 to 54 Years | 996 | 20.1% |
| 55 to 64 Years | 1,279 | 25.8% |
| 65 to 74 Years | 861 | 17.3% |
| 75 to 84 Years | 307 | 6.2% |
| 85 Years and Over | 116 | 2.3% |
| Total | 4,965 | 100.0% |
Housing Finances in Middleburg
Median Income by Occupancy in Middleburg
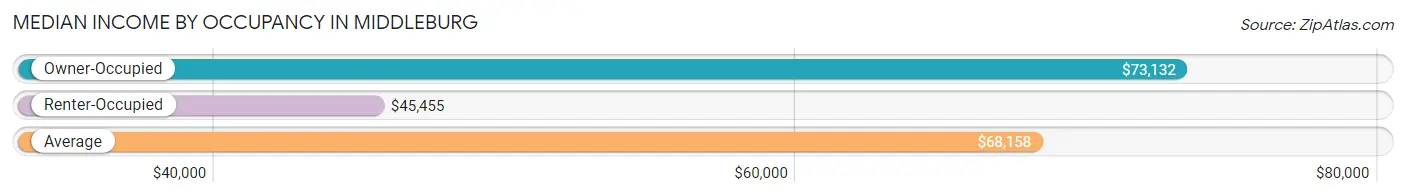
| Occupancy Type | # Households | Median Income |
| Owner-Occupied | 4,183 (84.3%) | $73,132 |
| Renter-Occupied | 782 (15.8%) | $45,455 |
| Average | 4,965 (100.0%) | $68,158 |
Occupancy by Householder Income Bracket in Middleburg
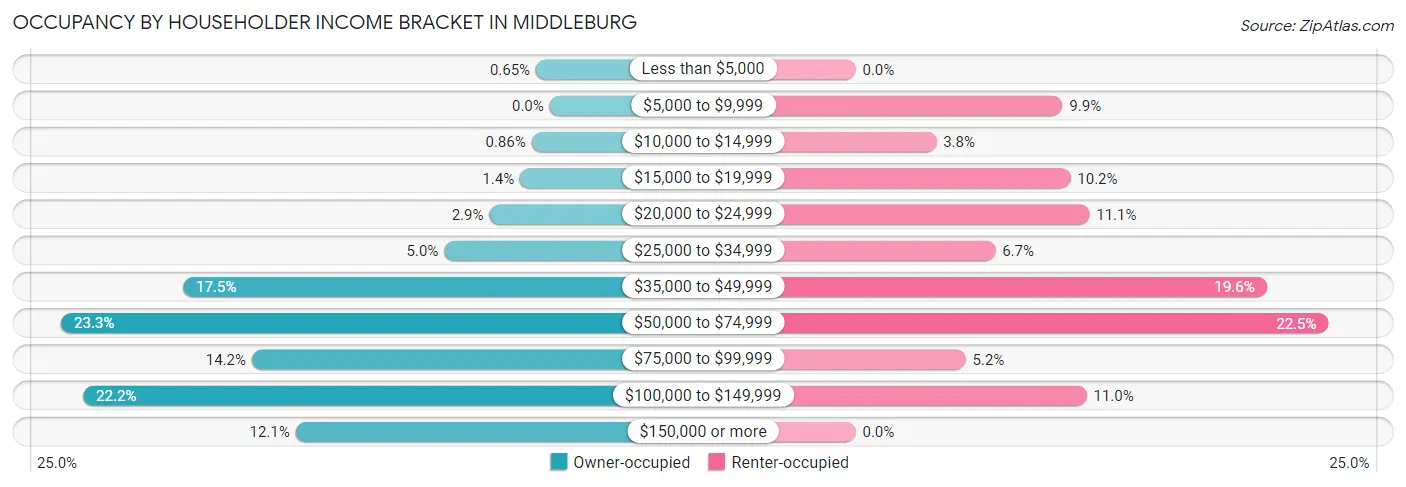
| Income Bracket | Owner-occupied | Renter-occupied |
| Less than $5,000 | 27 (0.6%) | 0 (0.0%) |
| $5,000 to $9,999 | 0 (0.0%) | 77 (9.9%) |
| $10,000 to $14,999 | 36 (0.9%) | 30 (3.8%) |
| $15,000 to $19,999 | 59 (1.4%) | 80 (10.2%) |
| $20,000 to $24,999 | 120 (2.9%) | 87 (11.1%) |
| $25,000 to $34,999 | 210 (5.0%) | 52 (6.7%) |
| $35,000 to $49,999 | 730 (17.4%) | 153 (19.6%) |
| $50,000 to $74,999 | 973 (23.3%) | 176 (22.5%) |
| $75,000 to $99,999 | 593 (14.2%) | 41 (5.2%) |
| $100,000 to $149,999 | 929 (22.2%) | 86 (11.0%) |
| $150,000 or more | 506 (12.1%) | 0 (0.0%) |
| Total | 4,183 (100.0%) | 782 (100.0%) |
Monthly Housing Cost Tiers in Middleburg
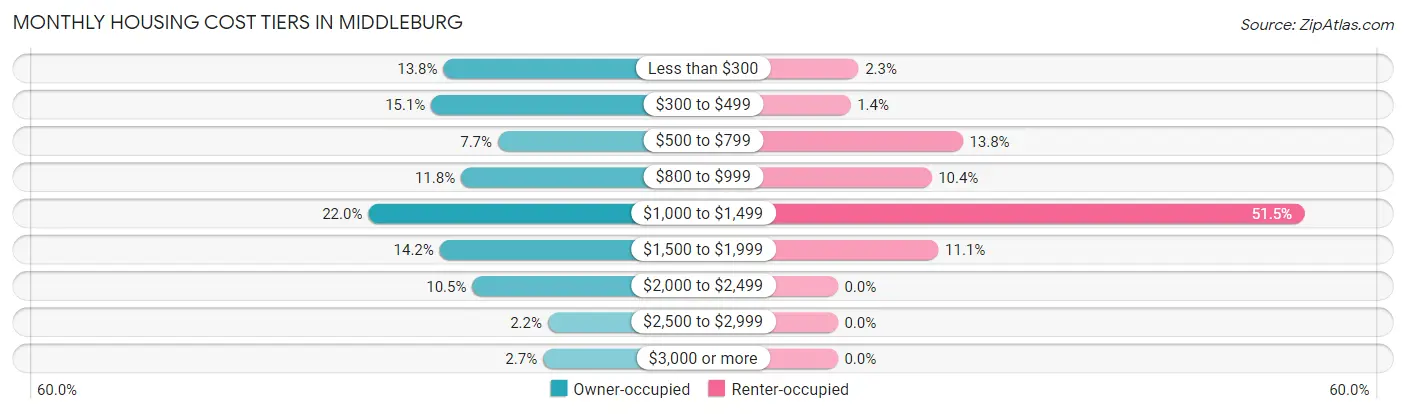
| Monthly Cost | Owner-occupied | Renter-occupied |
| Less than $300 | 575 (13.8%) | 18 (2.3%) |
| $300 to $499 | 631 (15.1%) | 11 (1.4%) |
| $500 to $799 | 323 (7.7%) | 108 (13.8%) |
| $800 to $999 | 493 (11.8%) | 81 (10.4%) |
| $1,000 to $1,499 | 922 (22.0%) | 403 (51.5%) |
| $1,500 to $1,999 | 592 (14.1%) | 87 (11.1%) |
| $2,000 to $2,499 | 441 (10.5%) | 0 (0.0%) |
| $2,500 to $2,999 | 92 (2.2%) | 0 (0.0%) |
| $3,000 or more | 114 (2.7%) | 0 (0.0%) |
| Total | 4,183 (100.0%) | 782 (100.0%) |
Physical Housing Characteristics in Middleburg
Housing Structures in Middleburg
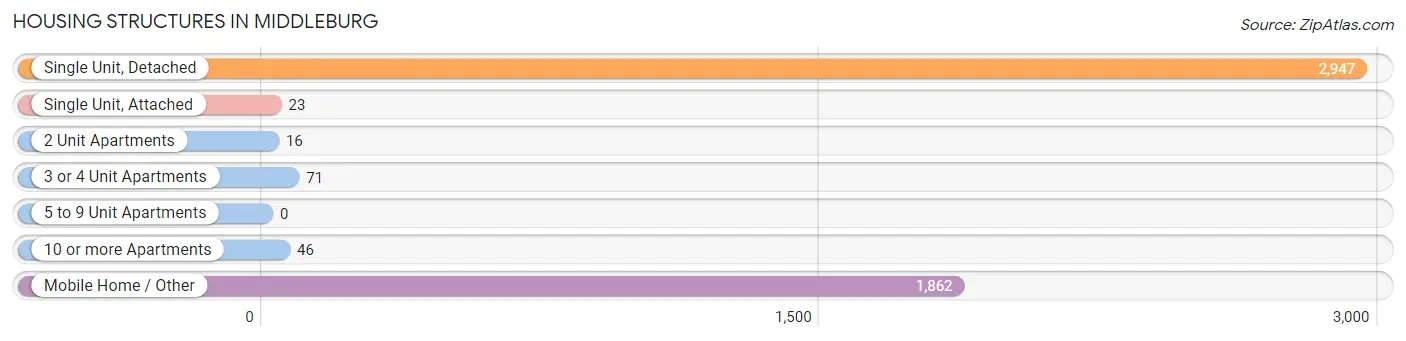
| Structure Type | # Housing Units | % Housing Units |
| Single Unit, Detached | 2,947 | 59.4% |
| Single Unit, Attached | 23 | 0.5% |
| 2 Unit Apartments | 16 | 0.3% |
| 3 or 4 Unit Apartments | 71 | 1.4% |
| 5 to 9 Unit Apartments | 0 | 0.0% |
| 10 or more Apartments | 46 | 0.9% |
| Mobile Home / Other | 1,862 | 37.5% |
| Total | 4,965 | 100.0% |
Housing Structures by Occupancy in Middleburg
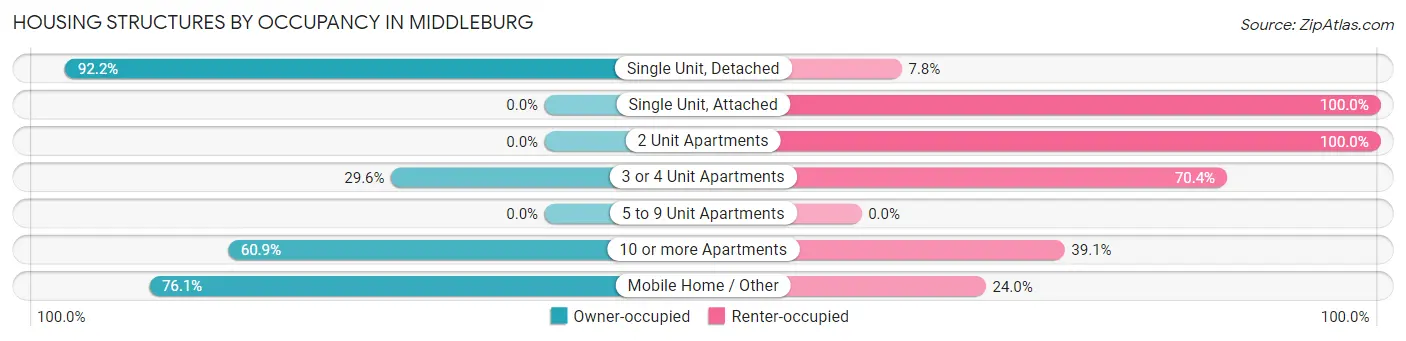
| Structure Type | Owner-occupied | Renter-occupied |
| Single Unit, Detached | 2,718 (92.2%) | 229 (7.8%) |
| Single Unit, Attached | 0 (0.0%) | 23 (100.0%) |
| 2 Unit Apartments | 0 (0.0%) | 16 (100.0%) |
| 3 or 4 Unit Apartments | 21 (29.6%) | 50 (70.4%) |
| 5 to 9 Unit Apartments | 0 (0.0%) | 0 (0.0%) |
| 10 or more Apartments | 28 (60.9%) | 18 (39.1%) |
| Mobile Home / Other | 1,416 (76.0%) | 446 (23.9%) |
| Total | 4,183 (84.3%) | 782 (15.8%) |
Housing Structures by Number of Rooms in Middleburg
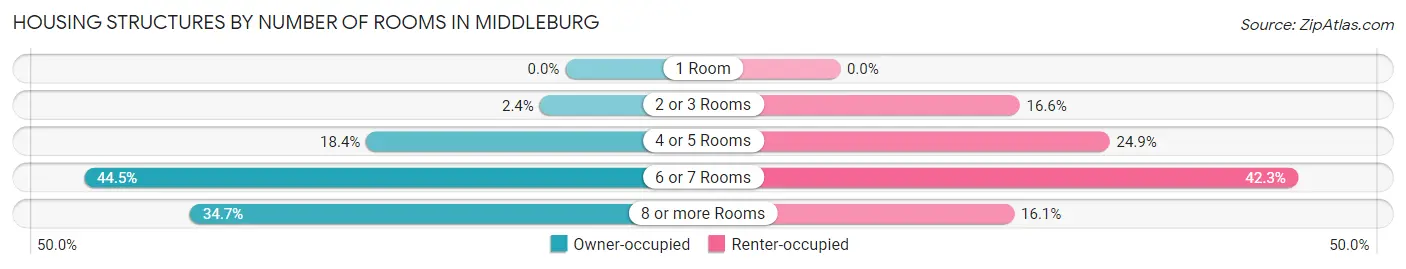
| Number of Rooms | Owner-occupied | Renter-occupied |
| 1 Room | 0 (0.0%) | 0 (0.0%) |
| 2 or 3 Rooms | 99 (2.4%) | 130 (16.6%) |
| 4 or 5 Rooms | 770 (18.4%) | 195 (24.9%) |
| 6 or 7 Rooms | 1,862 (44.5%) | 331 (42.3%) |
| 8 or more Rooms | 1,452 (34.7%) | 126 (16.1%) |
| Total | 4,183 (100.0%) | 782 (100.0%) |
Housing Structure by Heating Type in Middleburg
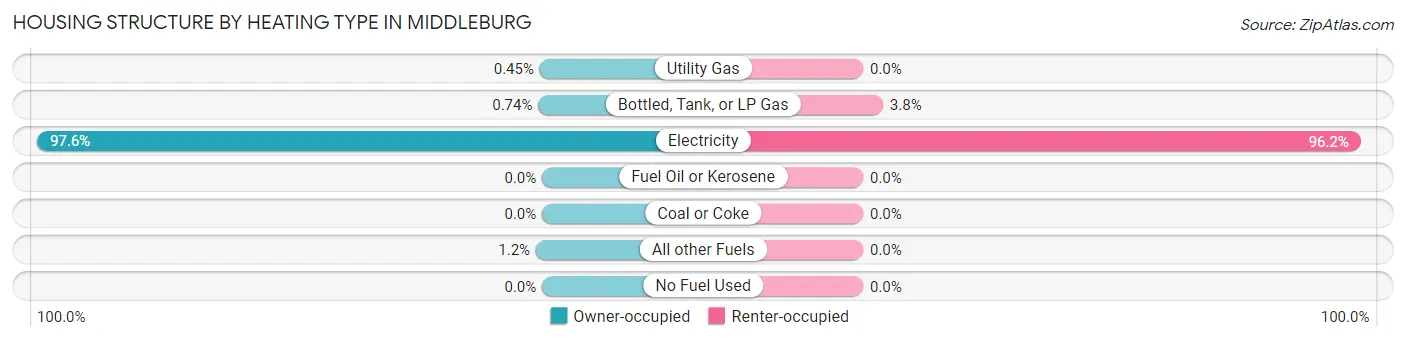
| Heating Type | Owner-occupied | Renter-occupied |
| Utility Gas | 19 (0.4%) | 0 (0.0%) |
| Bottled, Tank, or LP Gas | 31 (0.7%) | 30 (3.8%) |
| Electricity | 4,083 (97.6%) | 752 (96.2%) |
| Fuel Oil or Kerosene | 0 (0.0%) | 0 (0.0%) |
| Coal or Coke | 0 (0.0%) | 0 (0.0%) |
| All other Fuels | 50 (1.2%) | 0 (0.0%) |
| No Fuel Used | 0 (0.0%) | 0 (0.0%) |
| Total | 4,183 (100.0%) | 782 (100.0%) |
Household Vehicle Usage in Middleburg
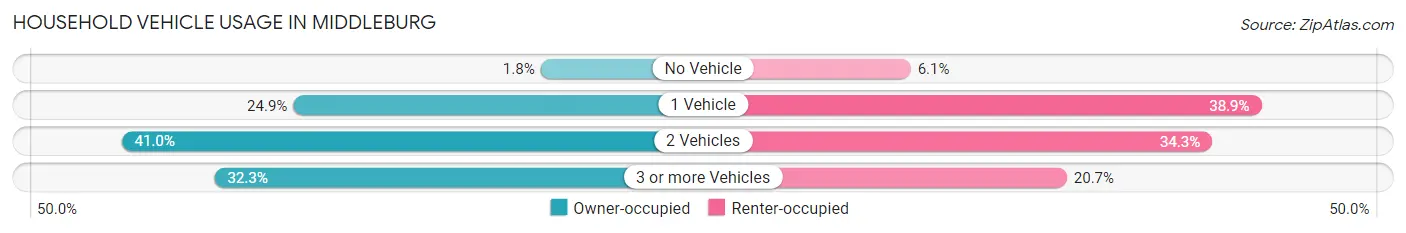
| Vehicles per Household | Owner-occupied | Renter-occupied |
| No Vehicle | 77 (1.8%) | 48 (6.1%) |
| 1 Vehicle | 1,043 (24.9%) | 304 (38.9%) |
| 2 Vehicles | 1,713 (40.9%) | 268 (34.3%) |
| 3 or more Vehicles | 1,350 (32.3%) | 162 (20.7%) |
| Total | 4,183 (100.0%) | 782 (100.0%) |
Real Estate & Mortgages in Middleburg
Real Estate and Mortgage Overview in Middleburg
| Characteristic | Without Mortgage | With Mortgage |
| Housing Units | 1,383 | 2,800 |
| Median Property Value | $195,600 | $228,000 |
| Median Household Income | $55,101 | $457 |
| Monthly Housing Costs | $350 | $114 |
| Real Estate Taxes | $1,178 | $198 |
Property Value by Mortgage Status in Middleburg
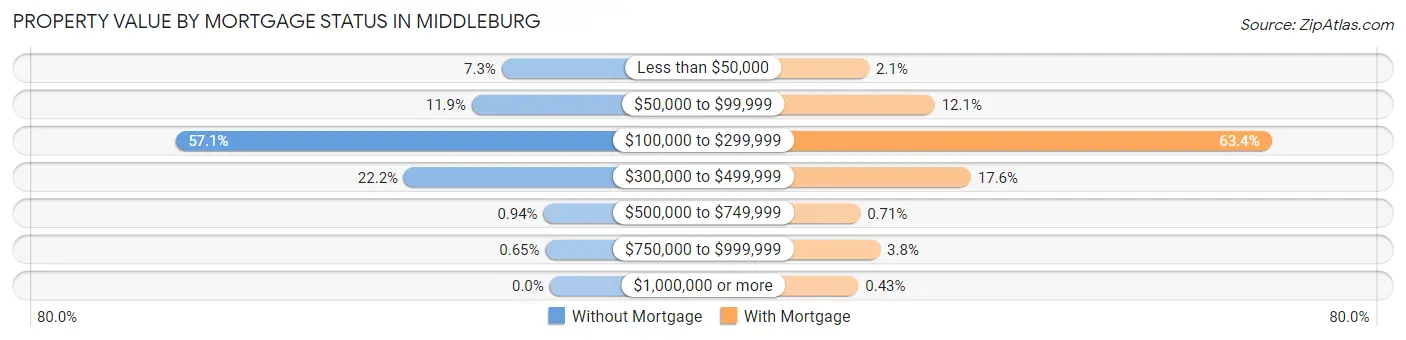
| Property Value | Without Mortgage | With Mortgage |
| Less than $50,000 | 101 (7.3%) | 58 (2.1%) |
| $50,000 to $99,999 | 164 (11.9%) | 338 (12.1%) |
| $100,000 to $299,999 | 789 (57.1%) | 1,775 (63.4%) |
| $300,000 to $499,999 | 307 (22.2%) | 492 (17.6%) |
| $500,000 to $749,999 | 13 (0.9%) | 20 (0.7%) |
| $750,000 to $999,999 | 9 (0.6%) | 105 (3.7%) |
| $1,000,000 or more | 0 (0.0%) | 12 (0.4%) |
| Total | 1,383 (100.0%) | 2,800 (100.0%) |
Household Income by Mortgage Status in Middleburg
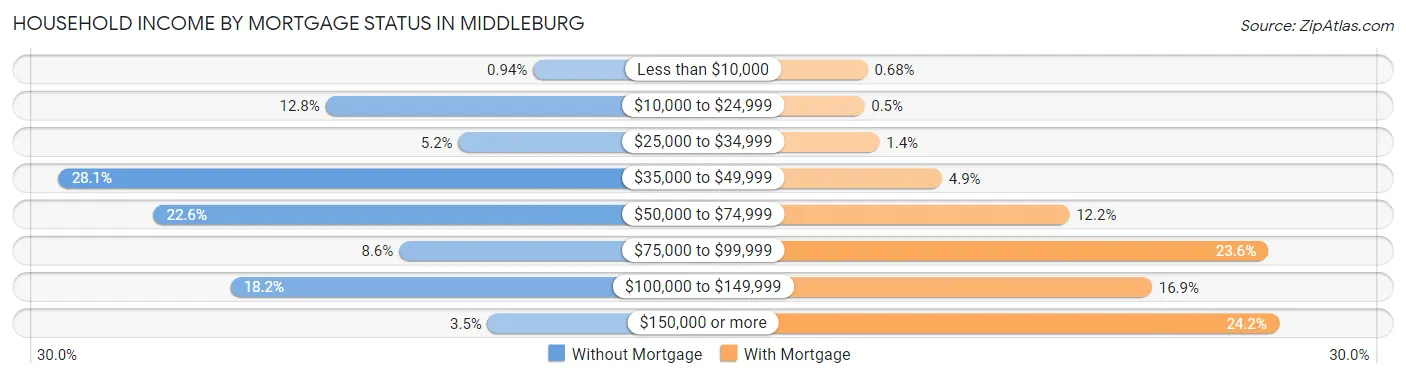
| Household Income | Without Mortgage | With Mortgage |
| Less than $10,000 | 13 (0.9%) | 19 (0.7%) |
| $10,000 to $24,999 | 177 (12.8%) | 14 (0.5%) |
| $25,000 to $34,999 | 72 (5.2%) | 38 (1.4%) |
| $35,000 to $49,999 | 388 (28.1%) | 138 (4.9%) |
| $50,000 to $74,999 | 313 (22.6%) | 342 (12.2%) |
| $75,000 to $99,999 | 119 (8.6%) | 660 (23.6%) |
| $100,000 to $149,999 | 252 (18.2%) | 474 (16.9%) |
| $150,000 or more | 49 (3.5%) | 677 (24.2%) |
| Total | 1,383 (100.0%) | 2,800 (100.0%) |
Property Value to Household Income Ratio in Middleburg
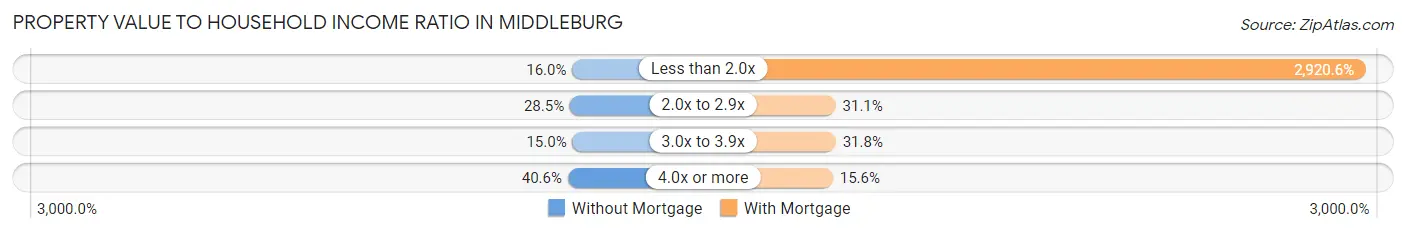
| Value-to-Income Ratio | Without Mortgage | With Mortgage |
| Less than 2.0x | 221 (16.0%) | 81,776 (2,920.6%) |
| 2.0x to 2.9x | 394 (28.5%) | 872 (31.1%) |
| 3.0x to 3.9x | 207 (15.0%) | 889 (31.8%) |
| 4.0x or more | 561 (40.6%) | 436 (15.6%) |
| Total | 1,383 (100.0%) | 2,800 (100.0%) |
Real Estate Taxes by Mortgage Status in Middleburg
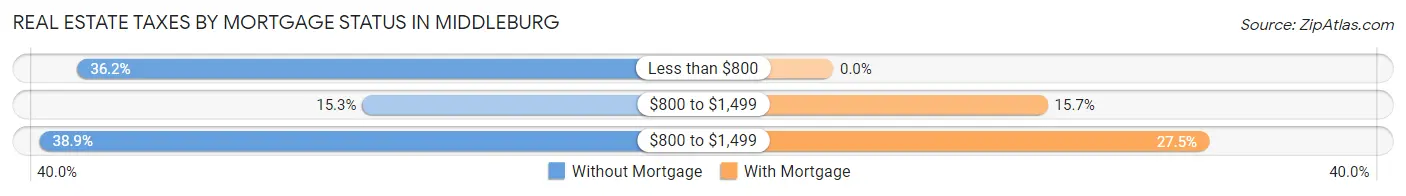
| Property Taxes | Without Mortgage | With Mortgage |
| Less than $800 | 500 (36.1%) | 0 (0.0%) |
| $800 to $1,499 | 212 (15.3%) | 439 (15.7%) |
| $800 to $1,499 | 538 (38.9%) | 769 (27.5%) |
| Total | 1,383 (100.0%) | 2,800 (100.0%) |
Health & Disability in Middleburg
Health Insurance Coverage by Age in Middleburg
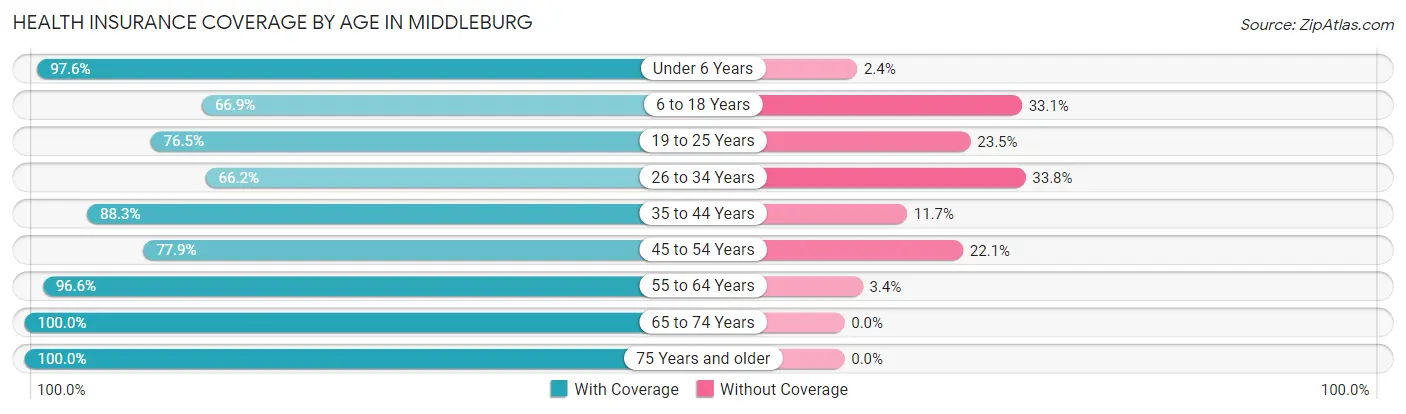
| Age Bracket | With Coverage | Without Coverage |
| Under 6 Years | 580 (97.6%) | 14 (2.4%) |
| 6 to 18 Years | 1,133 (66.9%) | 560 (33.1%) |
| 19 to 25 Years | 745 (76.5%) | 229 (23.5%) |
| 26 to 34 Years | 714 (66.2%) | 364 (33.8%) |
| 35 to 44 Years | 1,159 (88.3%) | 153 (11.7%) |
| 45 to 54 Years | 1,539 (77.9%) | 437 (22.1%) |
| 55 to 64 Years | 1,973 (96.6%) | 69 (3.4%) |
| 65 to 74 Years | 1,324 (100.0%) | 0 (0.0%) |
| 75 Years and older | 689 (100.0%) | 0 (0.0%) |
| Total | 9,856 (84.4%) | 1,826 (15.6%) |
Health Insurance Coverage by Citizenship Status in Middleburg
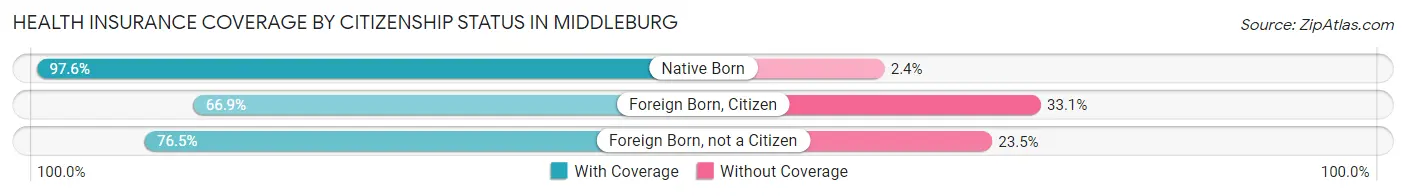
| Citizenship Status | With Coverage | Without Coverage |
| Native Born | 580 (97.6%) | 14 (2.4%) |
| Foreign Born, Citizen | 1,133 (66.9%) | 560 (33.1%) |
| Foreign Born, not a Citizen | 745 (76.5%) | 229 (23.5%) |
Health Insurance Coverage by Household Income in Middleburg
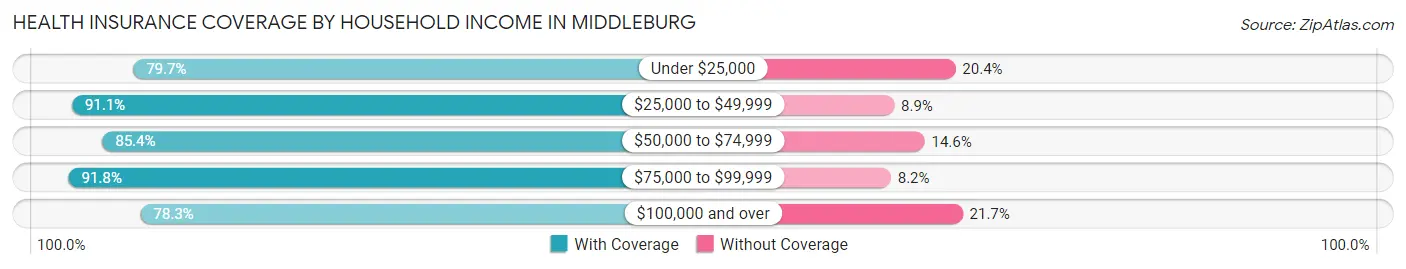
| Household Income | With Coverage | Without Coverage |
| Under $25,000 | 642 (79.6%) | 164 (20.3%) |
| $25,000 to $49,999 | 2,136 (91.1%) | 208 (8.9%) |
| $50,000 to $74,999 | 2,339 (85.4%) | 399 (14.6%) |
| $75,000 to $99,999 | 1,380 (91.8%) | 124 (8.2%) |
| $100,000 and over | 3,359 (78.3%) | 931 (21.7%) |
Public vs Private Health Insurance Coverage by Age in Middleburg
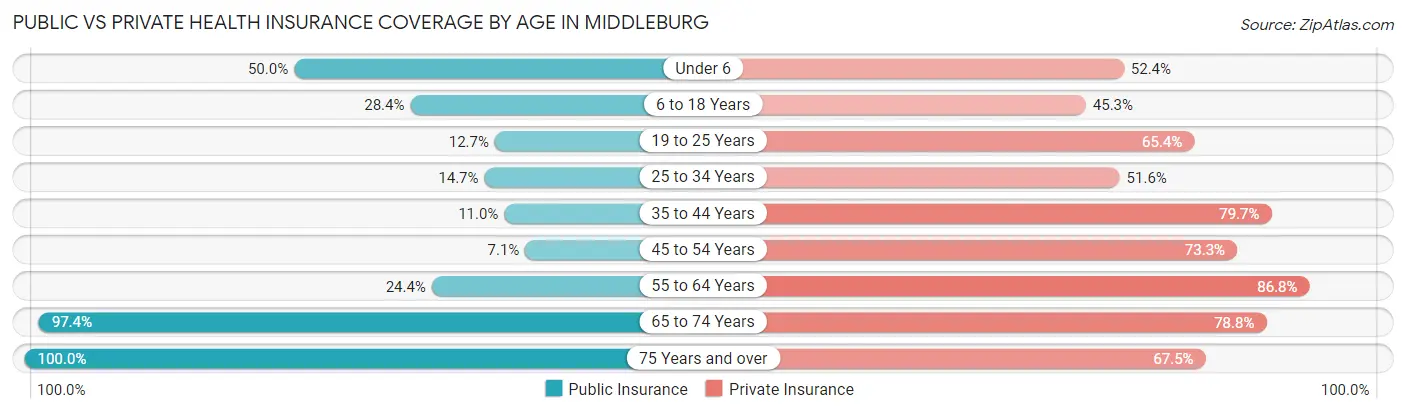
| Age Bracket | Public Insurance | Private Insurance |
| Under 6 | 297 (50.0%) | 311 (52.4%) |
| 6 to 18 Years | 481 (28.4%) | 767 (45.3%) |
| 19 to 25 Years | 124 (12.7%) | 637 (65.4%) |
| 25 to 34 Years | 158 (14.7%) | 556 (51.6%) |
| 35 to 44 Years | 144 (11.0%) | 1,046 (79.7%) |
| 45 to 54 Years | 140 (7.1%) | 1,449 (73.3%) |
| 55 to 64 Years | 499 (24.4%) | 1,772 (86.8%) |
| 65 to 74 Years | 1,289 (97.4%) | 1,043 (78.8%) |
| 75 Years and over | 689 (100.0%) | 465 (67.5%) |
| Total | 3,821 (32.7%) | 8,046 (68.9%) |
Disability Status by Sex by Age in Middleburg
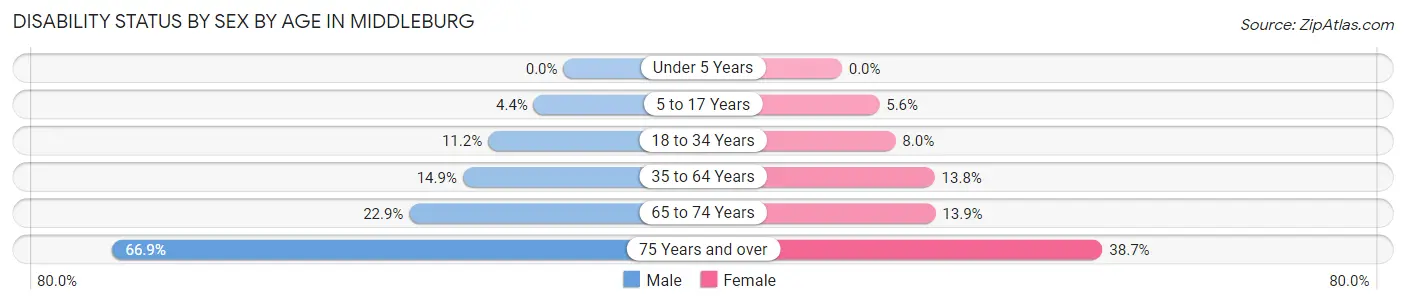
| Age Bracket | Male | Female |
| Under 5 Years | 0 (0.0%) | 0 (0.0%) |
| 5 to 17 Years | 35 (4.4%) | 46 (5.6%) |
| 18 to 34 Years | 144 (11.2%) | 72 (8.0%) |
| 35 to 64 Years | 427 (14.9%) | 341 (13.8%) |
| 65 to 74 Years | 168 (22.9%) | 82 (13.9%) |
| 75 Years and over | 162 (66.9%) | 173 (38.7%) |
Disability Class by Sex by Age in Middleburg
Disability Class: Hearing Difficulty
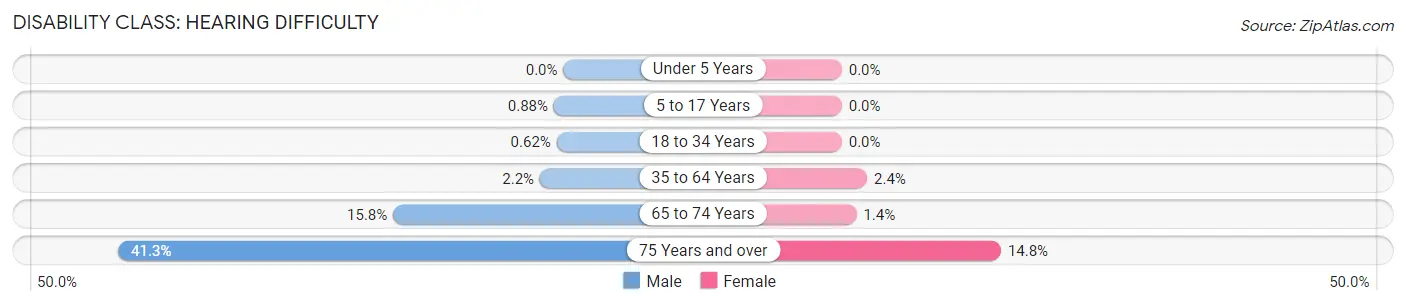
| Age Bracket | Male | Female |
| Under 5 Years | 0 (0.0%) | 0 (0.0%) |
| 5 to 17 Years | 7 (0.9%) | 0 (0.0%) |
| 18 to 34 Years | 8 (0.6%) | 0 (0.0%) |
| 35 to 64 Years | 62 (2.2%) | 58 (2.4%) |
| 65 to 74 Years | 116 (15.8%) | 8 (1.4%) |
| 75 Years and over | 100 (41.3%) | 66 (14.8%) |
Disability Class: Vision Difficulty
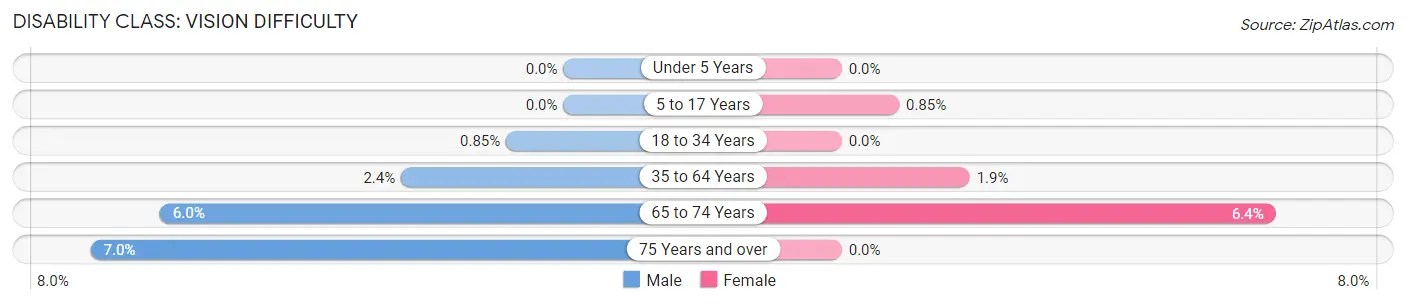
| Age Bracket | Male | Female |
| Under 5 Years | 0 (0.0%) | 0 (0.0%) |
| 5 to 17 Years | 0 (0.0%) | 7 (0.9%) |
| 18 to 34 Years | 11 (0.9%) | 0 (0.0%) |
| 35 to 64 Years | 69 (2.4%) | 47 (1.9%) |
| 65 to 74 Years | 44 (6.0%) | 38 (6.4%) |
| 75 Years and over | 17 (7.0%) | 0 (0.0%) |
Disability Class: Cognitive Difficulty
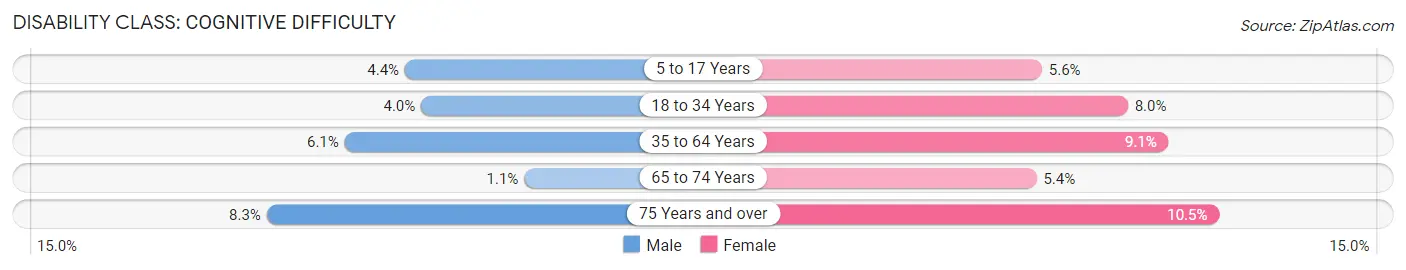
| Age Bracket | Male | Female |
| 5 to 17 Years | 35 (4.4%) | 46 (5.6%) |
| 18 to 34 Years | 51 (4.0%) | 72 (8.0%) |
| 35 to 64 Years | 174 (6.1%) | 225 (9.1%) |
| 65 to 74 Years | 8 (1.1%) | 32 (5.4%) |
| 75 Years and over | 20 (8.3%) | 47 (10.5%) |
Disability Class: Ambulatory Difficulty
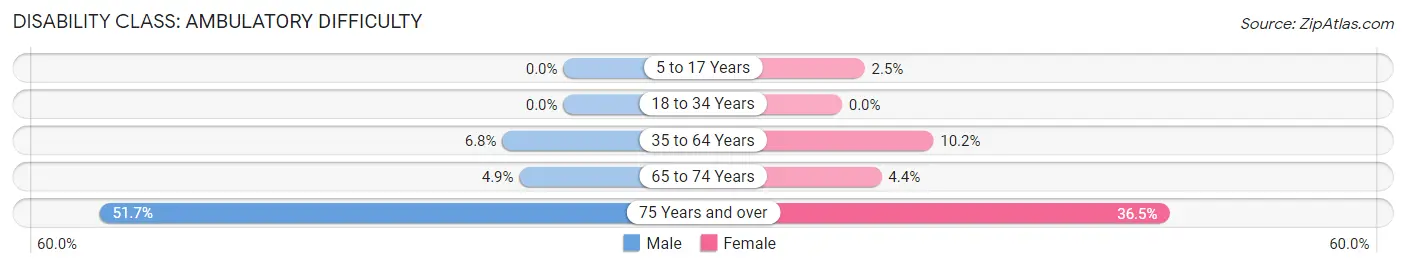
| Age Bracket | Male | Female |
| 5 to 17 Years | 0 (0.0%) | 21 (2.5%) |
| 18 to 34 Years | 0 (0.0%) | 0 (0.0%) |
| 35 to 64 Years | 194 (6.8%) | 252 (10.2%) |
| 65 to 74 Years | 36 (4.9%) | 26 (4.4%) |
| 75 Years and over | 125 (51.6%) | 163 (36.5%) |
Disability Class: Self-Care Difficulty
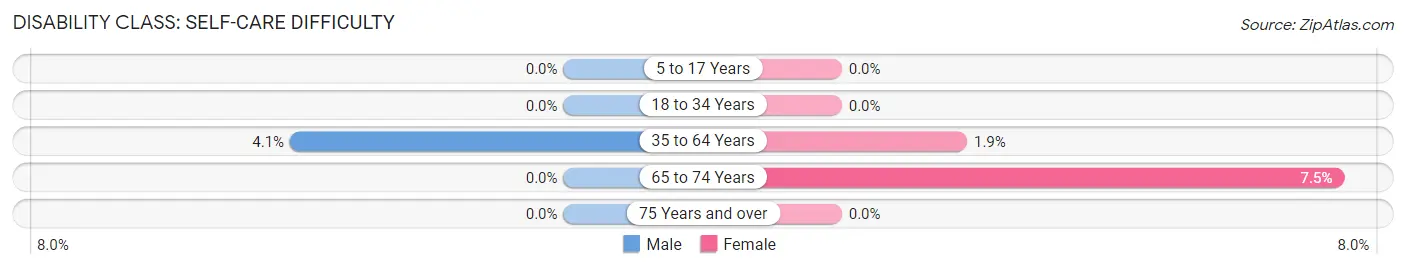
| Age Bracket | Male | Female |
| 5 to 17 Years | 0 (0.0%) | 0 (0.0%) |
| 18 to 34 Years | 0 (0.0%) | 0 (0.0%) |
| 35 to 64 Years | 116 (4.1%) | 46 (1.9%) |
| 65 to 74 Years | 0 (0.0%) | 44 (7.5%) |
| 75 Years and over | 0 (0.0%) | 0 (0.0%) |
Technology Access in Middleburg
Computing Device Access in Middleburg
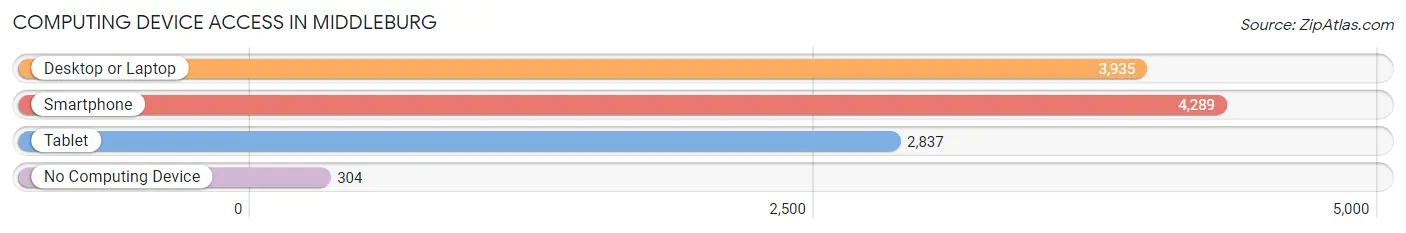
| Device Type | # Households | % Households |
| Desktop or Laptop | 3,935 | 79.2% |
| Smartphone | 4,289 | 86.4% |
| Tablet | 2,837 | 57.1% |
| No Computing Device | 304 | 6.1% |
| Total | 4,965 | 100.0% |
Internet Access in Middleburg
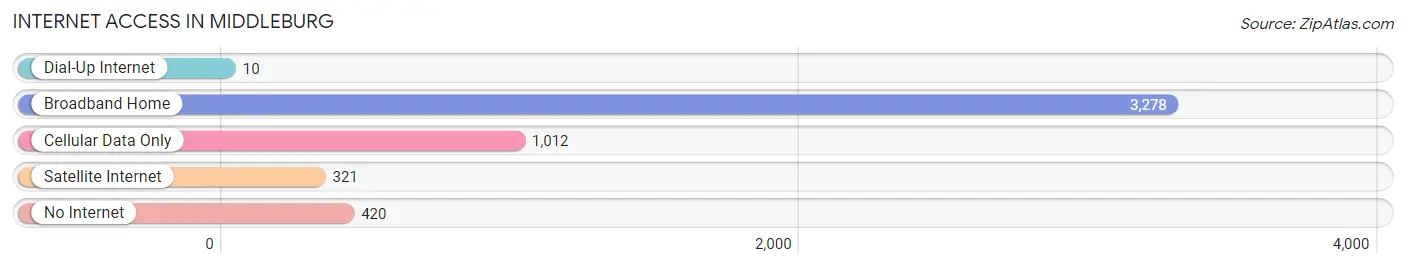
| Internet Type | # Households | % Households |
| Dial-Up Internet | 10 | 0.2% |
| Broadband Home | 3,278 | 66.0% |
| Cellular Data Only | 1,012 | 20.4% |
| Satellite Internet | 321 | 6.5% |
| No Internet | 420 | 8.5% |
| Total | 4,965 | 100.0% |
Middleburg Summary
History
Middleburg is a small town located in Clay County, Florida, United States. It is part of the Jacksonville metropolitan area. The town was founded in 1885 by William and Mary Middleton, who named it after their hometown of Middleburg, Virginia. The town was originally a farming community, but it has since grown into a suburban area.
Middleburg was incorporated in 1887 and has a population of approximately 13,000 people. The town is home to several historic sites, including the Middleburg Historic District, which is listed on the National Register of Historic Places. The district includes several buildings from the 19th century, including the Old Middleburg Town Hall, the Old Middleburg Post Office, and the Old Middleburg Bank.
Middleburg is also home to the Clay County Fairgrounds, which hosts the annual Clay County Fair. The fair features a variety of events, including livestock shows, carnival rides, and live music.
Geography
Middleburg is located in northeastern Clay County, Florida, approximately 25 miles southwest of Jacksonville. The town is situated on the banks of the Black Creek, a tributary of the St. Johns River. The town is bordered by the towns of Orange Park to the north, Green Cove Springs to the east, and Keystone Heights to the south.
The town has a total area of 8.3 square miles, of which 8.2 square miles is land and 0.1 square miles is water. The terrain is mostly flat, with some rolling hills. The climate is humid subtropical, with hot, humid summers and mild winters.
Economy
Middleburg’s economy is largely based on agriculture and tourism. The town is home to several farms, which produce a variety of crops, including corn, soybeans, and hay. The town is also home to several wineries, which produce a variety of wines.
The town is also home to several businesses, including restaurants, retail stores, and professional services. The town is also home to several manufacturing companies, which produce a variety of products, including furniture, clothing, and electronics.
Demographics
As of the 2010 census, Middleburg had a population of 13,008. The racial makeup of the town was 79.2% White, 15.2% African American, 0.5% Native American, 1.2% Asian, 0.1% Pacific Islander, 1.7% from other races, and 2.3% from two or more races. Hispanic or Latino of any race were 5.2% of the population.
The median income for a household in Middleburg was $45,945, and the median income for a family was $54,945. The per capita income for the town was $21,945. About 8.2% of families and 10.2% of the population were below the poverty line, including 14.2% of those under age 18 and 6.2% of those age 65 or over.
Common Questions
What is Per Capita Income in Middleburg?
Per Capita income in Middleburg is $33,282.
What is the Median Family Income in Middleburg?
Median Family Income in Middleburg is $71,033.
What is the Median Household income in Middleburg?
Median Household Income in Middleburg is $68,158.
What is Income or Wage Gap in Middleburg?
Income or Wage Gap in Middleburg is 23.6%.
Women in Middleburg earn 76.4 cents for every dollar earned by a man.
What is Inequality or Gini Index in Middleburg?
Inequality or Gini Index in Middleburg is 0.33.
What is the Total Population of Middleburg?
Total Population of Middleburg is 11,838.
What is the Total Male Population of Middleburg?
Total Male Population of Middleburg is 6,372.
What is the Total Female Population of Middleburg?
Total Female Population of Middleburg is 5,466.
What is the Ratio of Males per 100 Females in Middleburg?
There are 116.58 Males per 100 Females in Middleburg.
What is the Ratio of Females per 100 Males in Middleburg?
There are 85.78 Females per 100 Males in Middleburg.
What is the Median Population Age in Middleburg?
Median Population Age in Middleburg is 45.7 Years.
What is the Average Family Size in Middleburg
Average Family Size in Middleburg is 2.8 People.
What is the Average Household Size in Middleburg
Average Household Size in Middleburg is 2.4 People.
How Large is the Labor Force in Middleburg?
There are 6,589 People in the Labor Forcein in Middleburg.
What is the Percentage of People in the Labor Force in Middleburg?
65.8% of People are in the Labor Force in Middleburg.
What is the Unemployment Rate in Middleburg?
Unemployment Rate in Middleburg is 4.7%.