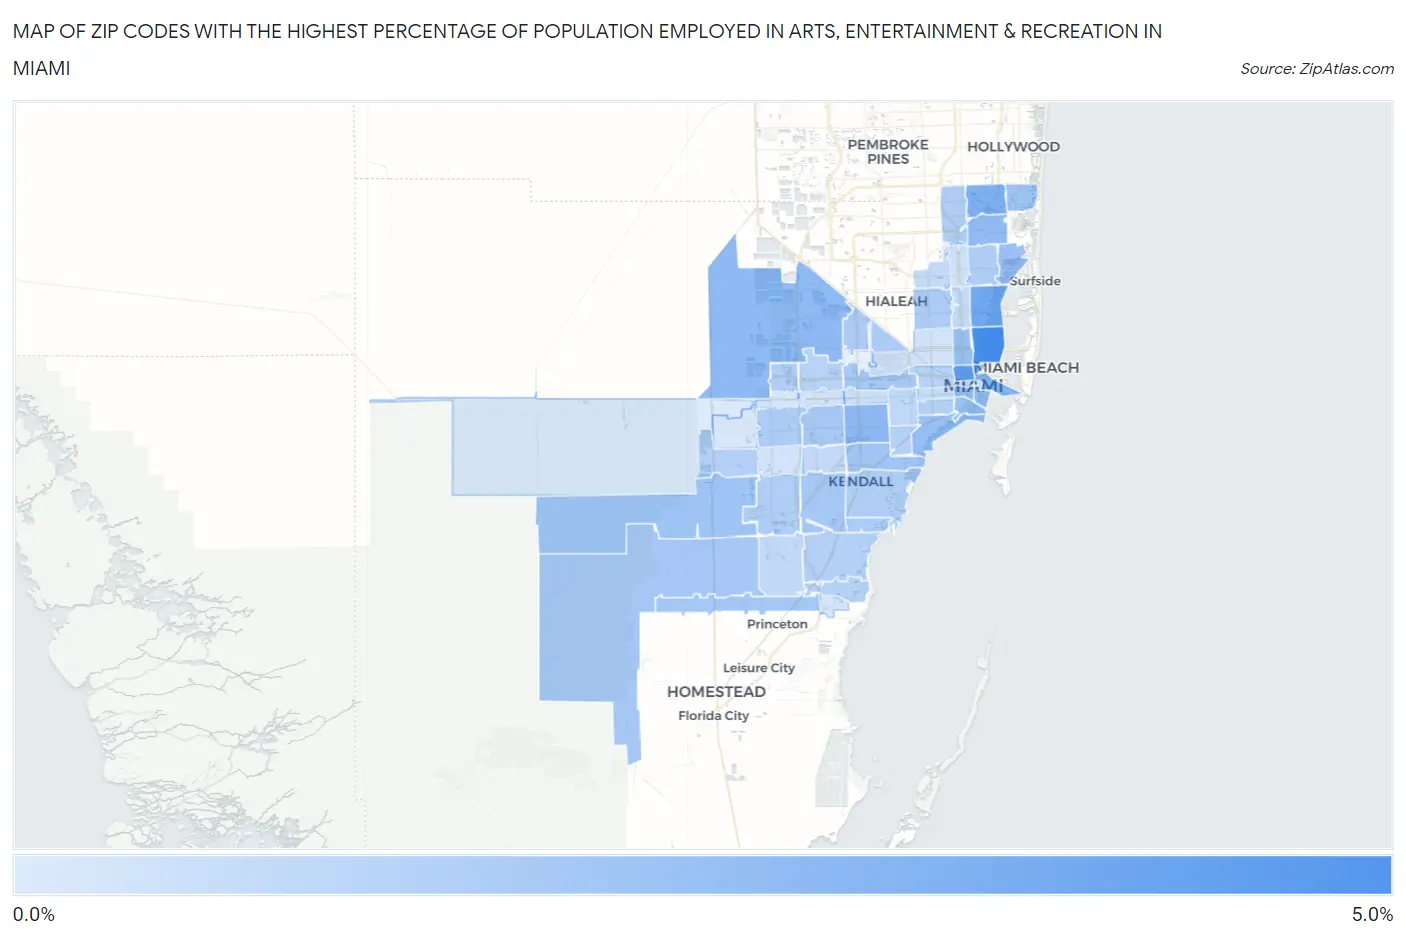
Zip Codes with the Highest Percentage of Population Employed in Arts, Entertainment & Recreation in Miami, FL
RELATED REPORTS & OPTIONS
Arts, Entertainment & Recreation
Miami
Compare Zip Codes
Map of Zip Codes with the Highest Percentage of Population Employed in Arts, Entertainment & Recreation in Miami
0.0%
5.0%
Zip Codes with the Highest Percentage of Population Employed in Arts, Entertainment & Recreation in Miami, FL
| Zip Code | % Employed | vs State | vs National | |
| 1. | 33137 | 4.7% | 2.9%(+1.84)#113 | 2.1%(+2.66)#2,494 |
| 2. | 33136 | 4.2% | 2.9%(+1.27)#156 | 2.1%(+2.09)#3,116 |
| 3. | 33138 | 3.6% | 2.9%(+0.706)#197 | 2.1%(+1.52)#3,938 |
| 4. | 33179 | 3.2% | 2.9%(+0.299)#264 | 2.1%(+1.12)#4,806 |
| 5. | 33132 | 2.9% | 2.9%(+0.050)#313 | 2.1%(+0.867)#5,503 |
| 6. | 33155 | 2.8% | 2.9%(-0.091)#344 | 2.1%(+0.726)#5,958 |
| 7. | 33178 | 2.7% | 2.9%(-0.174)#364 | 2.1%(+0.644)#6,267 |
| 8. | 33162 | 2.7% | 2.9%(-0.236)#373 | 2.1%(+0.581)#6,510 |
| 9. | 33131 | 2.6% | 2.9%(-0.331)#387 | 2.1%(+0.486)#6,881 |
| 10. | 33130 | 2.5% | 2.9%(-0.358)#395 | 2.1%(+0.460)#6,982 |
| 11. | 33129 | 2.5% | 2.9%(-0.384)#401 | 2.1%(+0.434)#7,110 |
| 12. | 33127 | 2.5% | 2.9%(-0.406)#406 | 2.1%(+0.411)#7,202 |
| 13. | 33133 | 2.5% | 2.9%(-0.421)#410 | 2.1%(+0.396)#7,269 |
| 14. | 33181 | 2.4% | 2.9%(-0.485)#420 | 2.1%(+0.332)#7,577 |
| 15. | 33196 | 2.3% | 2.9%(-0.584)#444 | 2.1%(+0.234)#8,044 |
| 16. | 33180 | 2.3% | 2.9%(-0.629)#454 | 2.1%(+0.189)#8,269 |
| 17. | 33143 | 2.2% | 2.9%(-0.682)#460 | 2.1%(+0.136)#8,525 |
| 18. | 33165 | 2.1% | 2.9%(-0.760)#487 | 2.1%(+0.057)#8,995 |
| 19. | 33187 | 2.1% | 2.9%(-0.761)#488 | 2.1%(+0.057)#8,997 |
| 20. | 33176 | 2.1% | 2.9%(-0.763)#490 | 2.1%(+0.055)#9,006 |
| 21. | 33170 | 2.1% | 2.9%(-0.808)#502 | 2.1%(+0.010)#9,260 |
| 22. | 33126 | 2.1% | 2.9%(-0.811)#503 | 2.1%(+0.007)#9,276 |
| 23. | 33175 | 1.9% | 2.9%(-0.957)#534 | 2.1%(-0.140)#10,119 |
| 24. | 33166 | 1.9% | 2.9%(-0.960)#535 | 2.1%(-0.142)#10,130 |
| 25. | 33147 | 1.9% | 2.9%(-0.960)#536 | 2.1%(-0.142)#10,136 |
| 26. | 33158 | 1.9% | 2.9%(-0.982)#542 | 2.1%(-0.164)#10,273 |
| 27. | 33156 | 1.9% | 2.9%(-1.04)#566 | 2.1%(-0.224)#10,637 |
| 28. | 33161 | 1.8% | 2.9%(-1.06)#572 | 2.1%(-0.245)#10,768 |
| 29. | 33169 | 1.8% | 2.9%(-1.07)#574 | 2.1%(-0.255)#10,826 |
| 30. | 33186 | 1.8% | 2.9%(-1.07)#576 | 2.1%(-0.257)#10,845 |
| 31. | 33182 | 1.8% | 2.9%(-1.12)#592 | 2.1%(-0.304)#11,175 |
| 32. | 33157 | 1.8% | 2.9%(-1.14)#594 | 2.1%(-0.322)#11,286 |
| 33. | 33145 | 1.7% | 2.9%(-1.17)#603 | 2.1%(-0.348)#11,482 |
| 34. | 33146 | 1.7% | 2.9%(-1.17)#606 | 2.1%(-0.356)#11,545 |
| 35. | 33193 | 1.7% | 2.9%(-1.18)#607 | 2.1%(-0.361)#11,575 |
| 36. | 33189 | 1.6% | 2.9%(-1.25)#627 | 2.1%(-0.434)#12,094 |
| 37. | 33125 | 1.6% | 2.9%(-1.28)#637 | 2.1%(-0.460)#12,278 |
| 38. | 33172 | 1.6% | 2.9%(-1.29)#642 | 2.1%(-0.471)#12,369 |
| 39. | 33134 | 1.4% | 2.9%(-1.46)#689 | 2.1%(-0.645)#13,703 |
| 40. | 33177 | 1.4% | 2.9%(-1.55)#716 | 2.1%(-0.731)#14,347 |
| 41. | 33173 | 1.3% | 2.9%(-1.55)#717 | 2.1%(-0.735)#14,389 |
| 42. | 33167 | 1.3% | 2.9%(-1.63)#731 | 2.1%(-0.814)#14,952 |
| 43. | 33150 | 1.3% | 2.9%(-1.63)#732 | 2.1%(-0.816)#14,967 |
| 44. | 33128 | 1.3% | 2.9%(-1.65)#740 | 2.1%(-0.830)#15,085 |
| 45. | 33135 | 1.2% | 2.9%(-1.68)#745 | 2.1%(-0.862)#15,314 |
| 46. | 33144 | 1.1% | 2.9%(-1.81)#767 | 2.1%(-0.995)#16,340 |
| 47. | 33168 | 0.95% | 2.9%(-1.95)#796 | 2.1%(-1.14)#17,349 |
| 48. | 33142 | 0.94% | 2.9%(-1.96)#797 | 2.1%(-1.15)#17,422 |
| 49. | 33183 | 0.91% | 2.9%(-1.99)#801 | 2.1%(-1.17)#17,593 |
| 50. | 33174 | 0.89% | 2.9%(-2.01)#803 | 2.1%(-1.19)#17,751 |
| 51. | 33184 | 0.79% | 2.9%(-2.11)#813 | 2.1%(-1.29)#18,464 |
| 52. | 33185 | 0.73% | 2.9%(-2.17)#823 | 2.1%(-1.36)#18,935 |
| 53. | 33190 | 0.69% | 2.9%(-2.21)#828 | 2.1%(-1.39)#19,222 |
| 54. | 33194 | 0.60% | 2.9%(-2.30)#839 | 2.1%(-1.48)#19,809 |
1
Common Questions
What are the Top 10 Zip Codes with the Highest Percentage of Population Employed in Arts, Entertainment & Recreation in Miami, FL?
Top 10 Zip Codes with the Highest Percentage of Population Employed in Arts, Entertainment & Recreation in Miami, FL are:
What zip code has the Highest Percentage of Population Employed in Arts, Entertainment & Recreation in Miami, FL?
33137 has the Highest Percentage of Population Employed in Arts, Entertainment & Recreation in Miami, FL with 4.7%.
What is the Percentage of Population Employed in Arts, Entertainment & Recreation in Miami, FL?
Percentage of Population Employed in Arts, Entertainment & Recreation in Miami is 2.3%.
What is the Percentage of Population Employed in Arts, Entertainment & Recreation in Florida?
Percentage of Population Employed in Arts, Entertainment & Recreation in Florida is 2.9%.
What is the Percentage of Population Employed in Arts, Entertainment & Recreation in the United States?
Percentage of Population Employed in Arts, Entertainment & Recreation in the United States is 2.1%.