Mexico Beach, FL Map & Demographics
Mexico Beach Map
Mexico Beach Overview
$48,275
PER CAPITA INCOME
$83,672
AVG FAMILY INCOME
$61,167
AVG HOUSEHOLD INCOME
45.6%
WAGE / INCOME GAP [ % ]
54.4¢/ $1
WAGE / INCOME GAP [ $ ]
0.38
INEQUALITY / GINI INDEX
1,054
TOTAL POPULATION
579
MALE POPULATION
475
FEMALE POPULATION
121.89
MALES / 100 FEMALES
82.04
FEMALES / 100 MALES
58.2
MEDIAN AGE
2.5
AVG FAMILY SIZE
1.8
AVG HOUSEHOLD SIZE
472
LABOR FORCE [ PEOPLE ]
47.7%
PERCENT IN LABOR FORCE
10.5%
UNEMPLOYMENT RATE
Mexico Beach Zip Codes
Mexico Beach Area Codes
Income in Mexico Beach
Income Overview in Mexico Beach
Per Capita Income in Mexico Beach is $48,275, while median incomes of families and households are $83,672 and $61,167 respectively.
| Characteristic | Number | Measure |
| Per Capita Income | 1,054 | $48,275 |
| Median Family Income | 303 | $83,672 |
| Mean Family Income | 303 | $107,355 |
| Median Household Income | 582 | $61,167 |
| Mean Household Income | 582 | $86,559 |
| Income Deficit | 303 | $0 |
| Wage / Income Gap (%) | 1,054 | 45.60% |
| Wage / Income Gap ($) | 1,054 | 54.40¢ per $1 |
| Gini / Inequality Index | 1,054 | 0.38 |
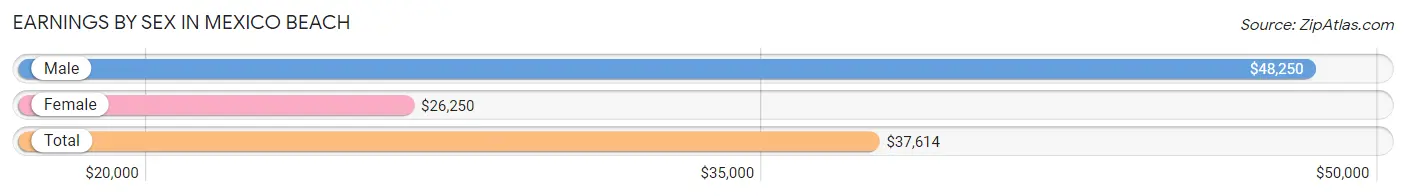
Earnings by Sex in Mexico Beach
Average Earnings in Mexico Beach are $37,614, $48,250 for men and $26,250 for women, a difference of 45.6%.
| Sex | Number | Average Earnings |
| Male | 272 (55.2%) | $48,250 |
| Female | 221 (44.8%) | $26,250 |
| Total | 493 (100.0%) | $37,614 |
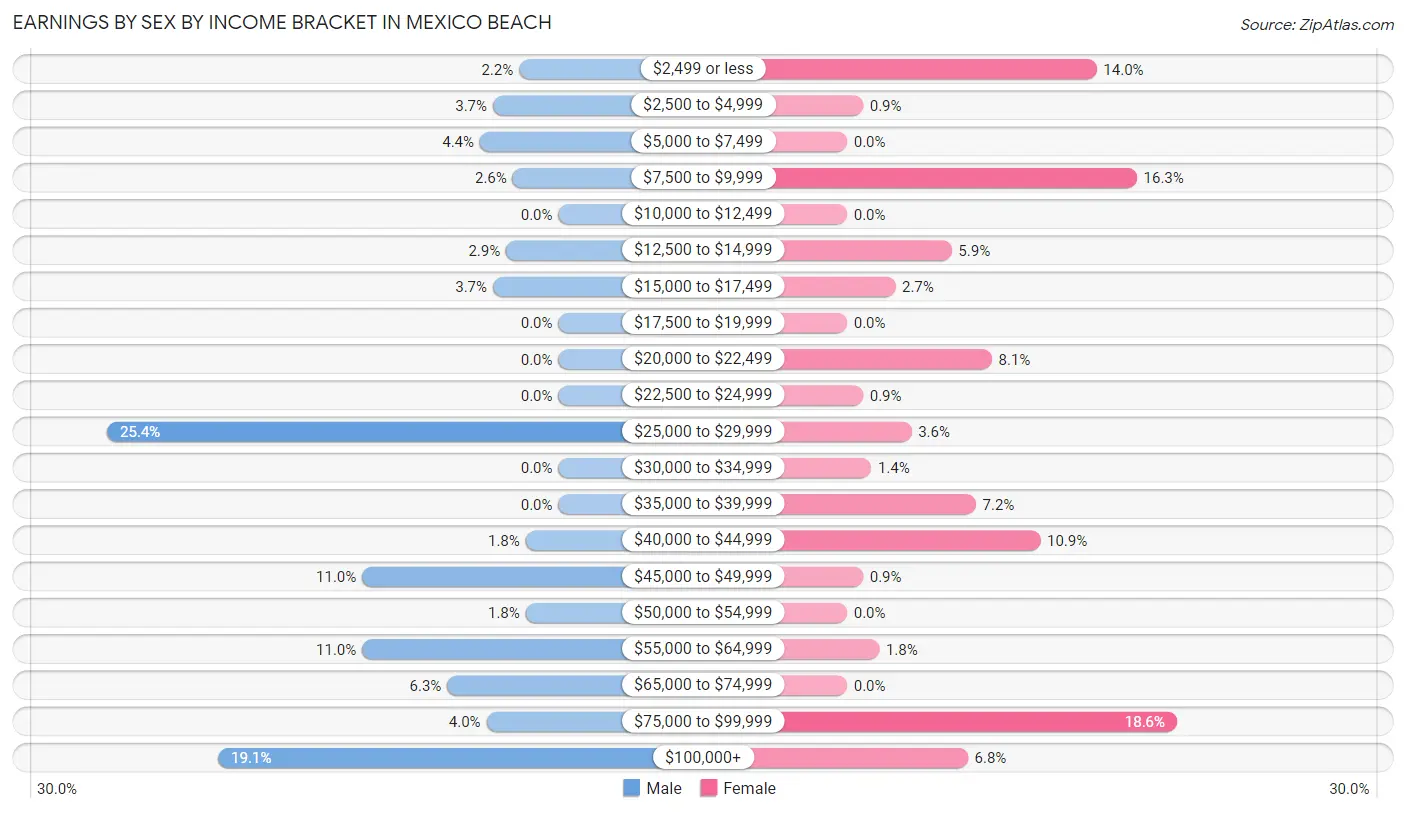
Earnings by Sex by Income Bracket in Mexico Beach
The most common earnings brackets in Mexico Beach are $25,000 to $29,999 for men (69 | 25.4%) and $75,000 to $99,999 for women (41 | 18.5%).
| Income | Male | Female |
| $2,499 or less | 6 (2.2%) | 31 (14.0%) |
| $2,500 to $4,999 | 10 (3.7%) | 2 (0.9%) |
| $5,000 to $7,499 | 12 (4.4%) | 0 (0.0%) |
| $7,500 to $9,999 | 7 (2.6%) | 36 (16.3%) |
| $10,000 to $12,499 | 0 (0.0%) | 0 (0.0%) |
| $12,500 to $14,999 | 8 (2.9%) | 13 (5.9%) |
| $15,000 to $17,499 | 10 (3.7%) | 6 (2.7%) |
| $17,500 to $19,999 | 0 (0.0%) | 0 (0.0%) |
| $20,000 to $22,499 | 0 (0.0%) | 18 (8.1%) |
| $22,500 to $24,999 | 0 (0.0%) | 2 (0.9%) |
| $25,000 to $29,999 | 69 (25.4%) | 8 (3.6%) |
| $30,000 to $34,999 | 0 (0.0%) | 3 (1.4%) |
| $35,000 to $39,999 | 0 (0.0%) | 16 (7.2%) |
| $40,000 to $44,999 | 5 (1.8%) | 24 (10.9%) |
| $45,000 to $49,999 | 30 (11.0%) | 2 (0.9%) |
| $50,000 to $54,999 | 5 (1.8%) | 0 (0.0%) |
| $55,000 to $64,999 | 30 (11.0%) | 4 (1.8%) |
| $65,000 to $74,999 | 17 (6.2%) | 0 (0.0%) |
| $75,000 to $99,999 | 11 (4.0%) | 41 (18.5%) |
| $100,000+ | 52 (19.1%) | 15 (6.8%) |
| Total | 272 (100.0%) | 221 (100.0%) |
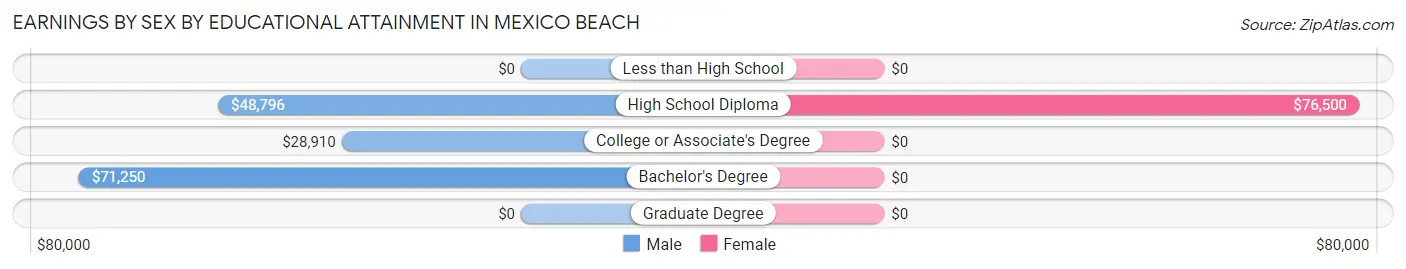
Earnings by Sex by Educational Attainment in Mexico Beach
Average earnings in Mexico Beach are $48,250 for men and $33,333 for women, a difference of 30.9%. Men with an educational attainment of bachelor's degree enjoy the highest average annual earnings of $71,250, while those with college or associate's degree education earn the least with $28,910. Women with an educational attainment of high school diploma earn the most with the average annual earnings of $76,500, while those with high school diploma education have the smallest earnings of $76,500.
| Educational Attainment | Male Income | Female Income |
| Less than High School | - | - |
| High School Diploma | $48,796 | $76,500 |
| College or Associate's Degree | $28,910 | $0 |
| Bachelor's Degree | $71,250 | $0 |
| Graduate Degree | - | - |
| Total | $48,250 | $33,333 |
Family Income in Mexico Beach
Family Income Brackets in Mexico Beach
According to the Mexico Beach family income data, there are 71 families falling into the $50,000 to $74,999 income range, which is the most common income bracket and makes up 23.4% of all families.
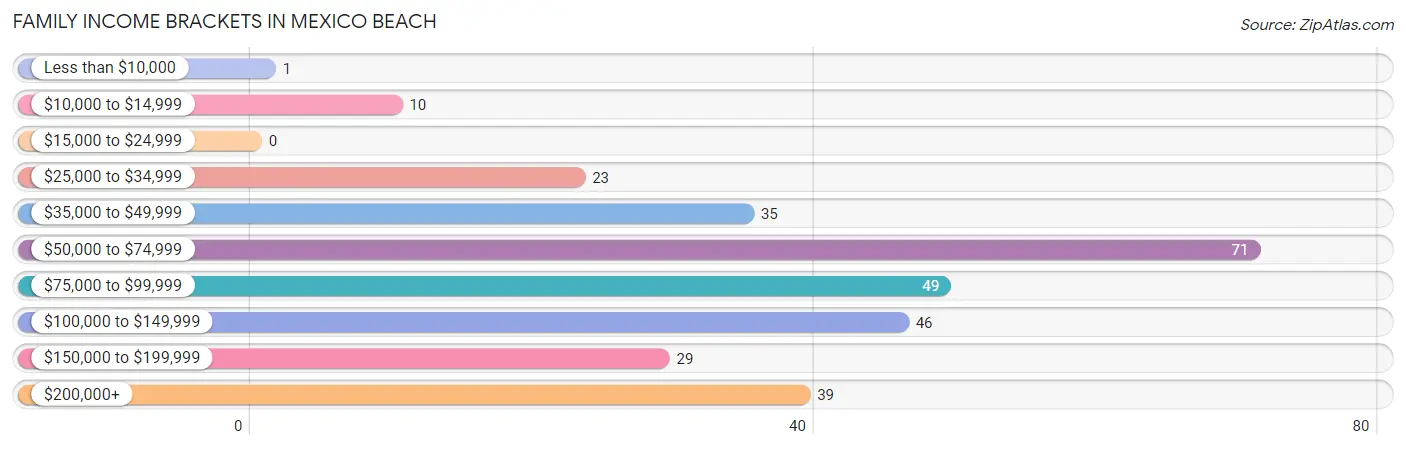
| Income Bracket | # Families | % Families |
| Less than $10,000 | 1 | 0.3% |
| $10,000 to $14,999 | 10 | 3.3% |
| $15,000 to $24,999 | 0 | 0.0% |
| $25,000 to $34,999 | 23 | 7.6% |
| $35,000 to $49,999 | 35 | 11.6% |
| $50,000 to $74,999 | 71 | 23.4% |
| $75,000 to $99,999 | 49 | 16.2% |
| $100,000 to $149,999 | 46 | 15.2% |
| $150,000 to $199,999 | 29 | 9.6% |
| $200,000+ | 39 | 12.9% |
Family Income by Famaliy Size in Mexico Beach
3-person families (41 | 13.5%) account for the highest median family income in Mexico Beach with $88,977 per family, while 2-person families (234 | 77.2%) have the highest median income of $40,625 per family member.
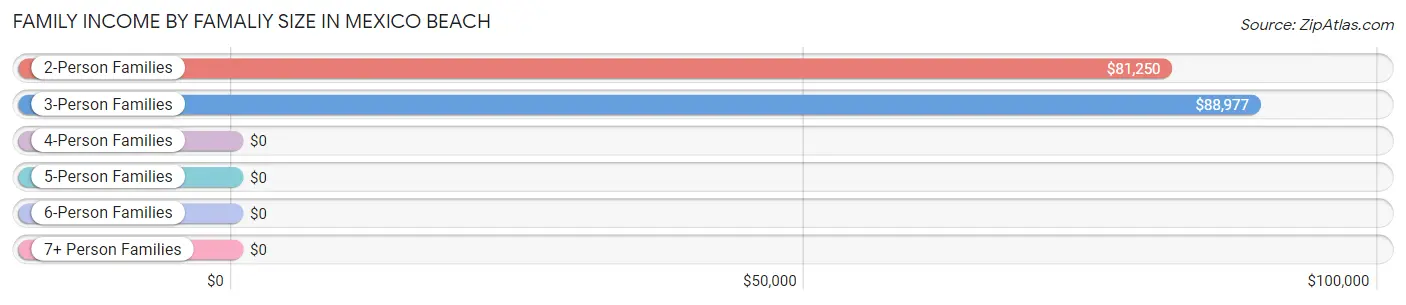
| Income Bracket | # Families | Median Income |
| 2-Person Families | 234 (77.2%) | $81,250 |
| 3-Person Families | 41 (13.5%) | $88,977 |
| 4-Person Families | 28 (9.2%) | $0 |
| 5-Person Families | 0 (0.0%) | $0 |
| 6-Person Families | 0 (0.0%) | $0 |
| 7+ Person Families | 0 (0.0%) | $0 |
| Total | 303 (100.0%) | $83,672 |
Family Income by Number of Earners in Mexico Beach
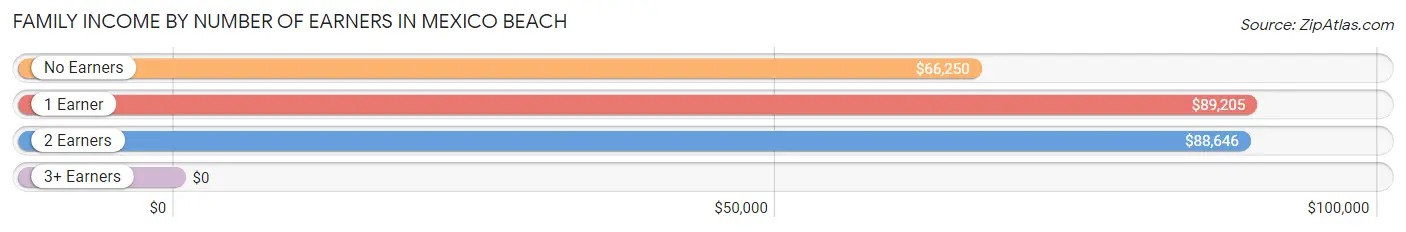
| Number of Earners | # Families | Median Income |
| No Earners | 107 (35.3%) | $66,250 |
| 1 Earner | 65 (21.4%) | $89,205 |
| 2 Earners | 131 (43.2%) | $88,646 |
| 3+ Earners | 0 (0.0%) | $0 |
| Total | 303 (100.0%) | $83,672 |
Household Income in Mexico Beach
Household Income Brackets in Mexico Beach
With 168 households falling in the category, the $50,000 to $74,999 income range is the most frequent in Mexico Beach, accounting for 28.9% of all households. In contrast, only 4 households (0.7%) fall into the less than $10,000 income bracket, making it the least populous group.
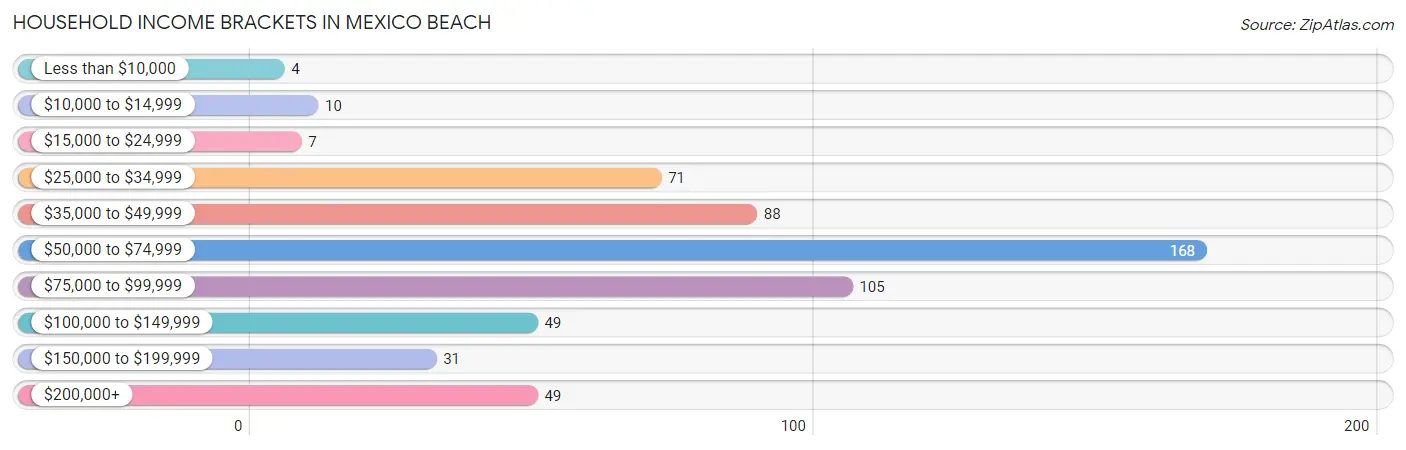
| Income Bracket | # Households | % Households |
| Less than $10,000 | 4 | 0.7% |
| $10,000 to $14,999 | 10 | 1.7% |
| $15,000 to $24,999 | 7 | 1.2% |
| $25,000 to $34,999 | 71 | 12.2% |
| $35,000 to $49,999 | 88 | 15.1% |
| $50,000 to $74,999 | 168 | 28.9% |
| $75,000 to $99,999 | 105 | 18.0% |
| $100,000 to $149,999 | 49 | 8.4% |
| $150,000 to $199,999 | 31 | 5.3% |
| $200,000+ | 49 | 8.4% |
Household Income by Householder Age in Mexico Beach
The median household income in Mexico Beach is $61,167, with the highest median household income of $83,000 found in the 25 to 44 years age bracket for the primary householder. A total of 80 households (13.8%) fall into this category.
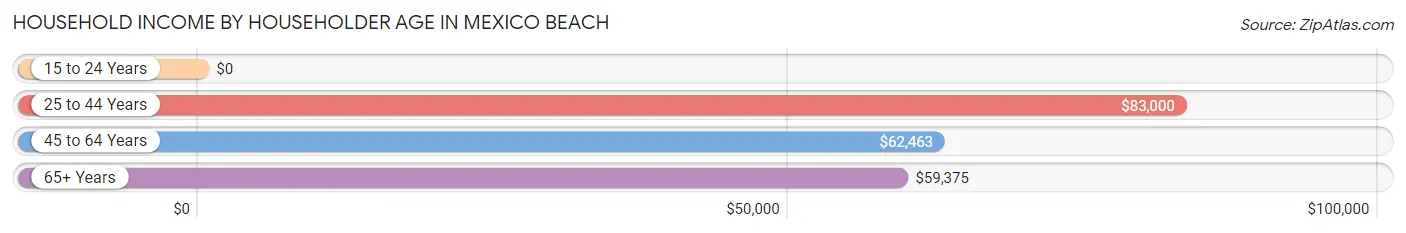
| Income Bracket | # Households | Median Income |
| 15 to 24 Years | 0 (0.0%) | $0 |
| 25 to 44 Years | 80 (13.8%) | $83,000 |
| 45 to 64 Years | 221 (38.0%) | $62,463 |
| 65+ Years | 281 (48.3%) | $59,375 |
| Total | 582 (100.0%) | $61,167 |
Poverty in Mexico Beach
Income Below Poverty by Sex and Age in Mexico Beach
With 1.9% poverty level for males and 3.8% for females among the residents of Mexico Beach, 6 to 11 year old males and 45 to 54 year old females are the most vulnerable to poverty, with 2 males (28.6%) and 7 females (8.0%) in their respective age groups living below the poverty level.
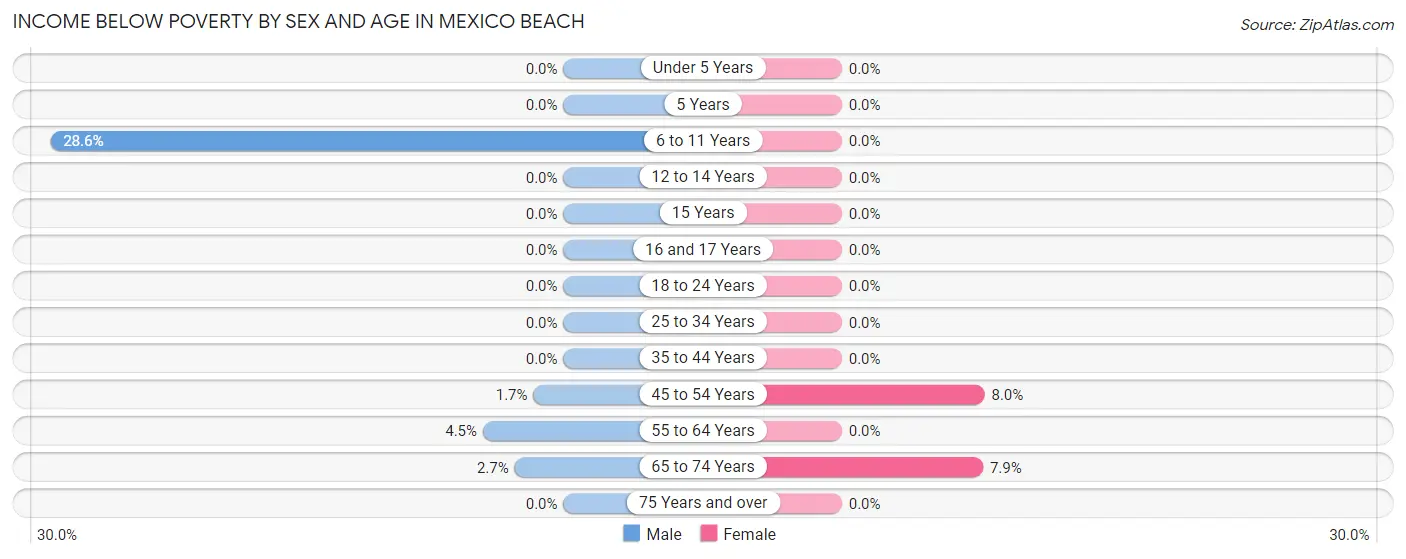
| Age Bracket | Male | Female |
| Under 5 Years | 0 (0.0%) | 0 (0.0%) |
| 5 Years | 0 (0.0%) | 0 (0.0%) |
| 6 to 11 Years | 2 (28.6%) | 0 (0.0%) |
| 12 to 14 Years | 0 (0.0%) | 0 (0.0%) |
| 15 Years | 0 (0.0%) | 0 (0.0%) |
| 16 and 17 Years | 0 (0.0%) | 0 (0.0%) |
| 18 to 24 Years | 0 (0.0%) | 0 (0.0%) |
| 25 to 34 Years | 0 (0.0%) | 0 (0.0%) |
| 35 to 44 Years | 0 (0.0%) | 0 (0.0%) |
| 45 to 54 Years | 2 (1.7%) | 7 (8.0%) |
| 55 to 64 Years | 3 (4.5%) | 0 (0.0%) |
| 65 to 74 Years | 4 (2.7%) | 11 (7.9%) |
| 75 Years and over | 0 (0.0%) | 0 (0.0%) |
| Total | 11 (1.9%) | 18 (3.8%) |
Income Above Poverty by Sex and Age in Mexico Beach
According to the poverty statistics in Mexico Beach, males aged under 5 years and females aged under 5 years are the age groups that are most secure financially, with 100.0% of males and 100.0% of females in these age groups living above the poverty line.
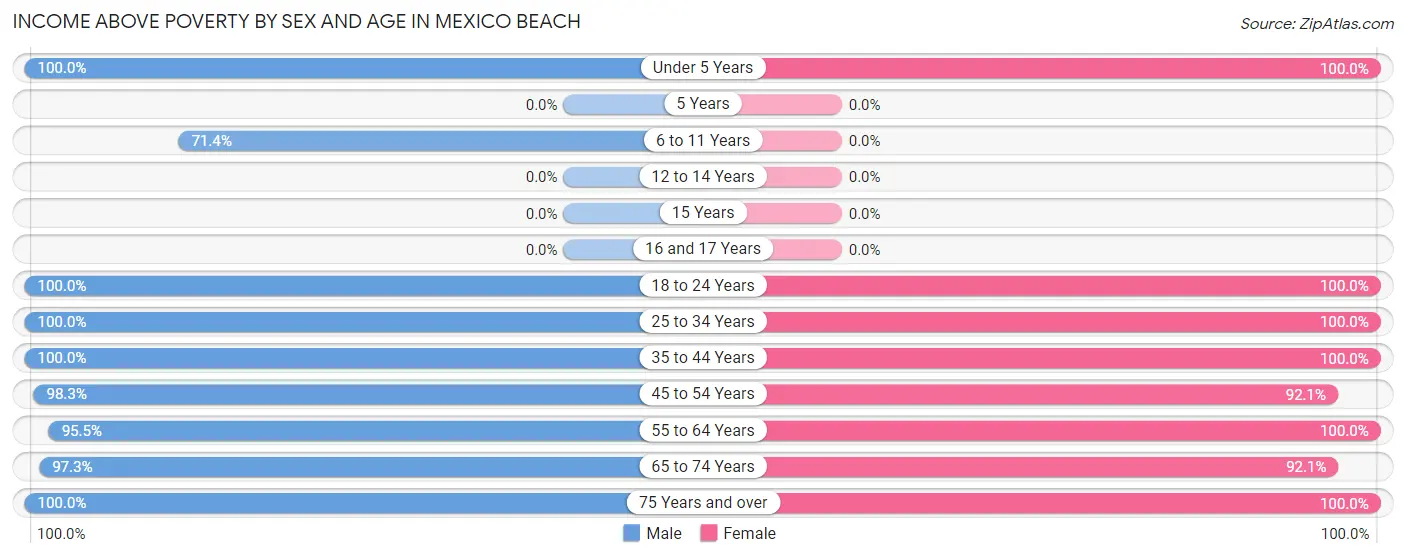
| Age Bracket | Male | Female |
| Under 5 Years | 46 (100.0%) | 12 (100.0%) |
| 5 Years | 0 (0.0%) | 0 (0.0%) |
| 6 to 11 Years | 5 (71.4%) | 0 (0.0%) |
| 12 to 14 Years | 0 (0.0%) | 0 (0.0%) |
| 15 Years | 0 (0.0%) | 0 (0.0%) |
| 16 and 17 Years | 0 (0.0%) | 0 (0.0%) |
| 18 to 24 Years | 42 (100.0%) | 13 (100.0%) |
| 25 to 34 Years | 25 (100.0%) | 26 (100.0%) |
| 35 to 44 Years | 50 (100.0%) | 43 (100.0%) |
| 45 to 54 Years | 118 (98.3%) | 81 (92.0%) |
| 55 to 64 Years | 64 (95.5%) | 113 (100.0%) |
| 65 to 74 Years | 143 (97.3%) | 129 (92.1%) |
| 75 Years and over | 75 (100.0%) | 40 (100.0%) |
| Total | 568 (98.1%) | 457 (96.2%) |
Income Below Poverty Among Married-Couple Families in Mexico Beach
The poverty statistics for married-couple families in Mexico Beach show that 3.6% or 10 of the total 281 families live below the poverty line. Families with 1 or 2 children have the highest poverty rate of 11.8%, comprising of 2 families. On the other hand, families with no children have the lowest poverty rate of 3.0%, which includes 8 families.
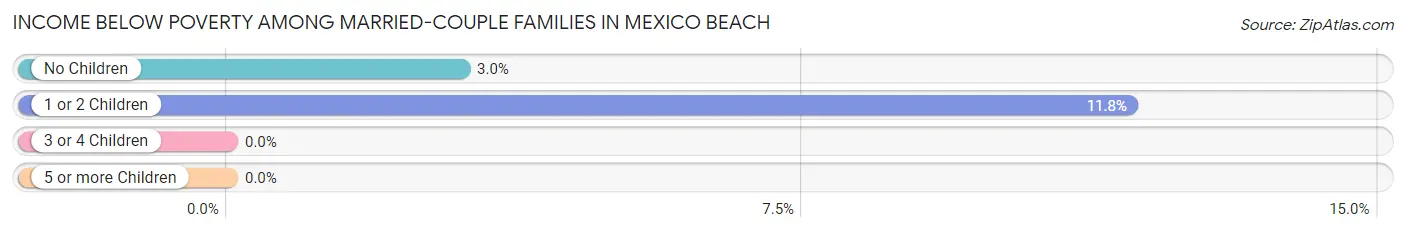
| Children | Above Poverty | Below Poverty |
| No Children | 256 (97.0%) | 8 (3.0%) |
| 1 or 2 Children | 15 (88.2%) | 2 (11.8%) |
| 3 or 4 Children | 0 (0.0%) | 0 (0.0%) |
| 5 or more Children | 0 (0.0%) | 0 (0.0%) |
| Total | 271 (96.4%) | 10 (3.6%) |
Income Below Poverty Among Single-Parent Households in Mexico Beach
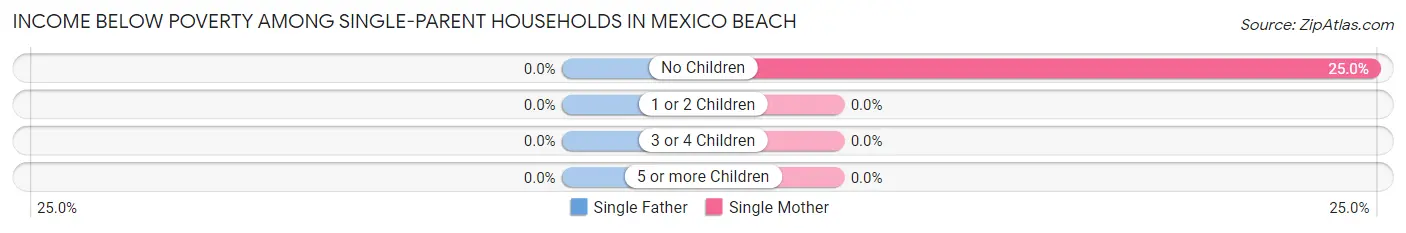
| Children | Single Father | Single Mother |
| No Children | 0 (0.0%) | 1 (25.0%) |
| 1 or 2 Children | 0 (0.0%) | 0 (0.0%) |
| 3 or 4 Children | 0 (0.0%) | 0 (0.0%) |
| 5 or more Children | 0 (0.0%) | 0 (0.0%) |
| Total | 0 (0.0%) | 1 (4.5%) |
Income Below Poverty Among Married-Couple vs Single-Parent Households in Mexico Beach
The poverty data for Mexico Beach shows that 10 of the married-couple family households (3.6%) and 1 of the single-parent households (4.5%) are living below the poverty level. Within the married-couple family households, those with 1 or 2 children have the highest poverty rate, with 2 households (11.8%) falling below the poverty line. Among the single-parent households, those with no children have the highest poverty rate, with 1 household (25.0%) living below poverty.
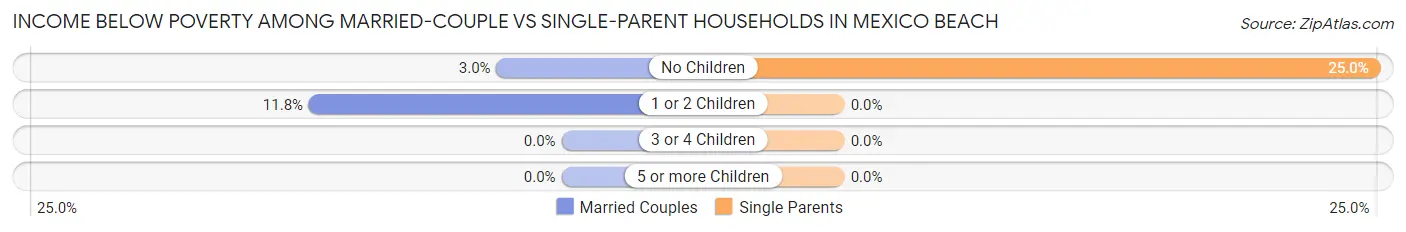
| Children | Married-Couple Families | Single-Parent Households |
| No Children | 8 (3.0%) | 1 (25.0%) |
| 1 or 2 Children | 2 (11.8%) | 0 (0.0%) |
| 3 or 4 Children | 0 (0.0%) | 0 (0.0%) |
| 5 or more Children | 0 (0.0%) | 0 (0.0%) |
| Total | 10 (3.6%) | 1 (4.5%) |
Race in Mexico Beach
The most populous races in Mexico Beach are White / Caucasian (966 | 91.6%), Two or more Races (55 | 5.2%), and Asian (24 | 2.3%).
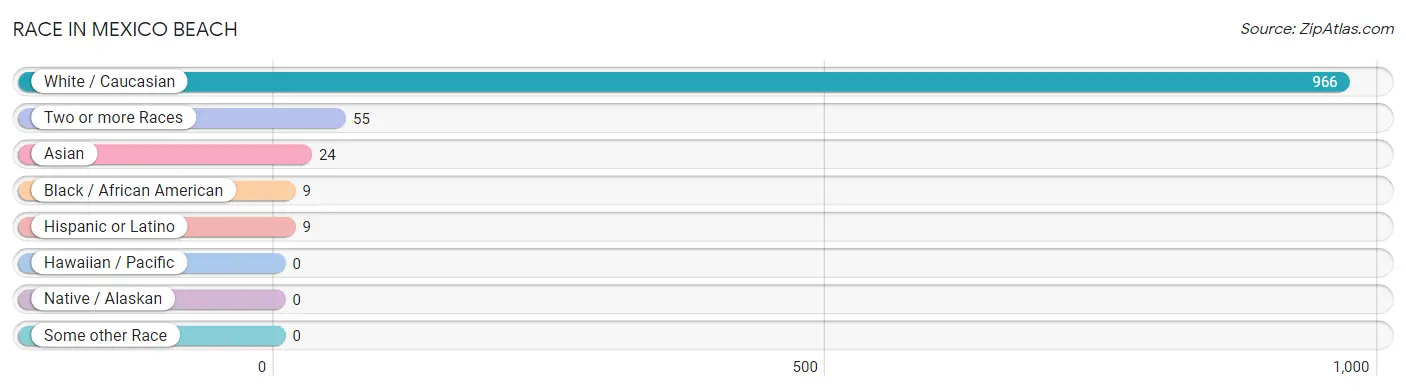
| Race | # Population | % Population |
| Asian | 24 | 2.3% |
| Black / African American | 9 | 0.9% |
| Hawaiian / Pacific | 0 | 0.0% |
| Hispanic or Latino | 9 | 0.9% |
| Native / Alaskan | 0 | 0.0% |
| White / Caucasian | 966 | 91.6% |
| Two or more Races | 55 | 5.2% |
| Some other Race | 0 | 0.0% |
| Total | 1,054 | 100.0% |
Ancestry in Mexico Beach
The most populous ancestries reported in Mexico Beach are English (293 | 27.8%), German (278 | 26.4%), Irish (131 | 12.4%), Korean (56 | 5.3%), and American (41 | 3.9%), together accounting for 75.8% of all Mexico Beach residents.
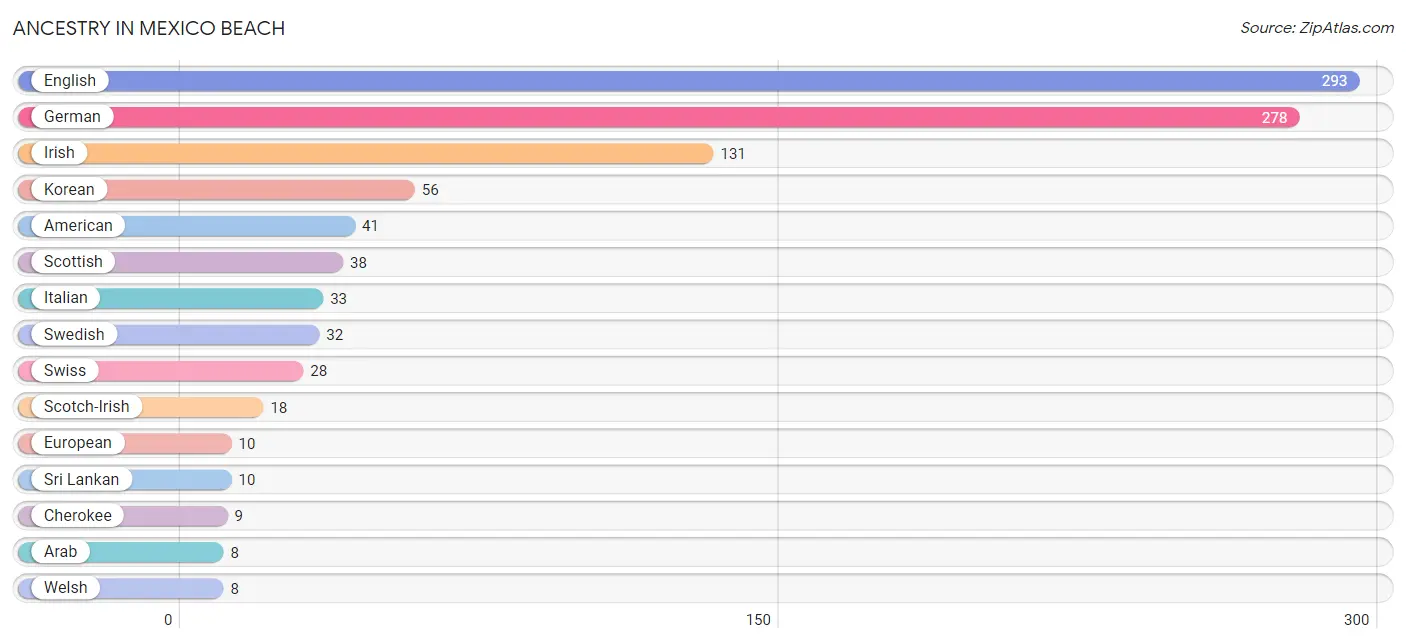
| Ancestry | # Population | % Population |
| American | 41 | 3.9% |
| Arab | 8 | 0.8% |
| British | 6 | 0.6% |
| Cherokee | 9 | 0.9% |
| Croatian | 3 | 0.3% |
| Dutch | 7 | 0.7% |
| Eastern European | 2 | 0.2% |
| English | 293 | 27.8% |
| European | 10 | 0.9% |
| Finnish | 4 | 0.4% |
| French | 7 | 0.7% |
| German | 278 | 26.4% |
| Irish | 131 | 12.4% |
| Italian | 33 | 3.1% |
| Korean | 56 | 5.3% |
| Mexican | 6 | 0.6% |
| Norwegian | 3 | 0.3% |
| Polish | 5 | 0.5% |
| Scotch-Irish | 18 | 1.7% |
| Scottish | 38 | 3.6% |
| Slavic | 2 | 0.2% |
| Spaniard | 3 | 0.3% |
| Sri Lankan | 10 | 0.9% |
| Swedish | 32 | 3.0% |
| Swiss | 28 | 2.7% |
| Welsh | 8 | 0.8% |
| Yugoslavian | 2 | 0.2% | View All 27 Rows |
Immigrants in Mexico Beach
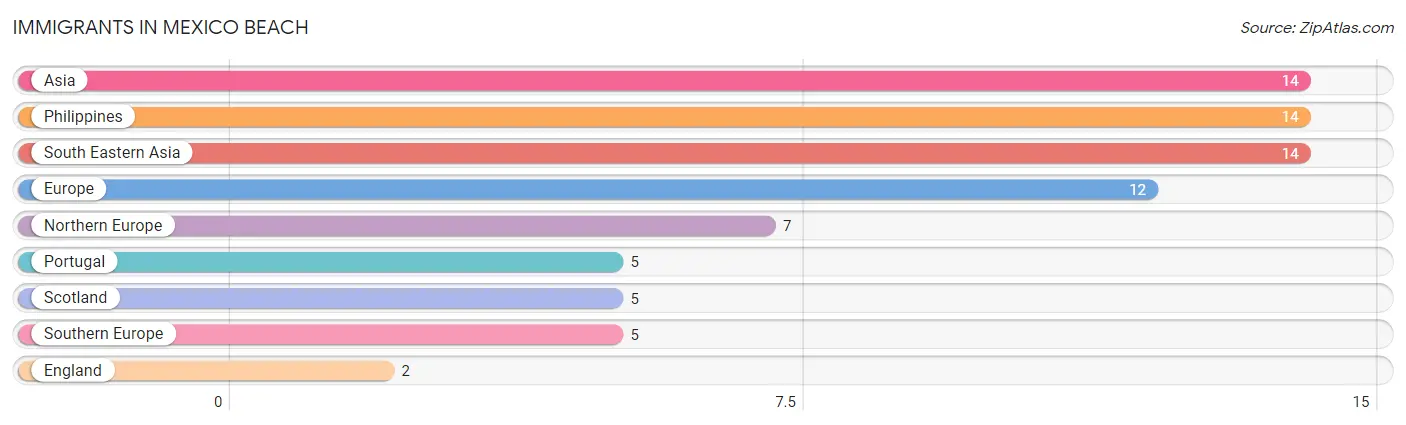
The most numerous immigrant groups reported in Mexico Beach came from Asia (14 | 1.3%), Philippines (14 | 1.3%), South Eastern Asia (14 | 1.3%), Europe (12 | 1.1%), and Northern Europe (7 | 0.7%), together accounting for 5.8% of all Mexico Beach residents.
| Immigration Origin | # Population | % Population |
| Asia | 14 | 1.3% |
| England | 2 | 0.2% |
| Europe | 12 | 1.1% |
| Northern Europe | 7 | 0.7% |
| Philippines | 14 | 1.3% |
| Portugal | 5 | 0.5% |
| Scotland | 5 | 0.5% |
| South Eastern Asia | 14 | 1.3% |
| Southern Europe | 5 | 0.5% | View All 9 Rows |
Sex and Age in Mexico Beach
Sex and Age in Mexico Beach
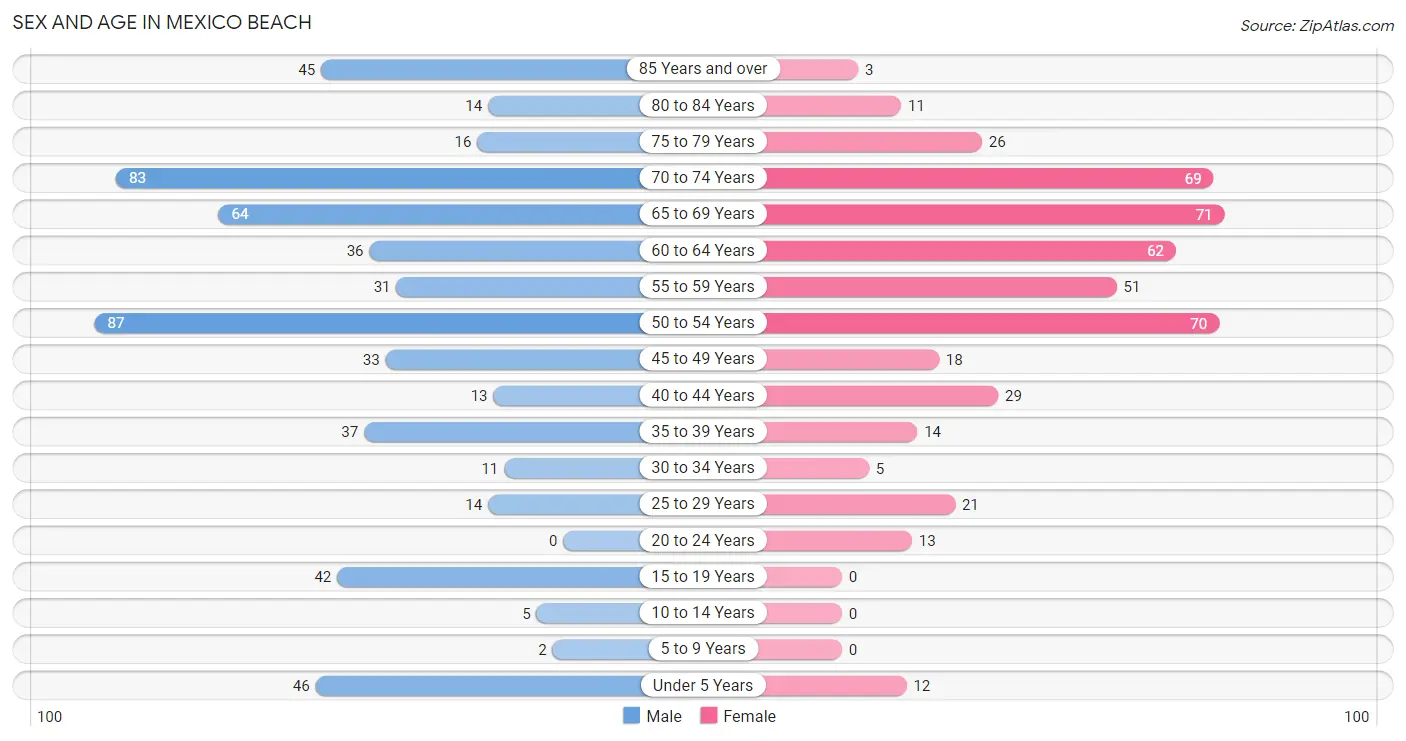
The most populous age groups in Mexico Beach are 50 to 54 Years (87 | 15.0%) for men and 65 to 69 Years (71 | 14.9%) for women.
| Age Bracket | Male | Female |
| Under 5 Years | 46 (7.9%) | 12 (2.5%) |
| 5 to 9 Years | 2 (0.4%) | 0 (0.0%) |
| 10 to 14 Years | 5 (0.9%) | 0 (0.0%) |
| 15 to 19 Years | 42 (7.2%) | 0 (0.0%) |
| 20 to 24 Years | 0 (0.0%) | 13 (2.7%) |
| 25 to 29 Years | 14 (2.4%) | 21 (4.4%) |
| 30 to 34 Years | 11 (1.9%) | 5 (1.1%) |
| 35 to 39 Years | 37 (6.4%) | 14 (2.9%) |
| 40 to 44 Years | 13 (2.2%) | 29 (6.1%) |
| 45 to 49 Years | 33 (5.7%) | 18 (3.8%) |
| 50 to 54 Years | 87 (15.0%) | 70 (14.7%) |
| 55 to 59 Years | 31 (5.3%) | 51 (10.7%) |
| 60 to 64 Years | 36 (6.2%) | 62 (13.1%) |
| 65 to 69 Years | 64 (11.1%) | 71 (14.9%) |
| 70 to 74 Years | 83 (14.3%) | 69 (14.5%) |
| 75 to 79 Years | 16 (2.8%) | 26 (5.5%) |
| 80 to 84 Years | 14 (2.4%) | 11 (2.3%) |
| 85 Years and over | 45 (7.8%) | 3 (0.6%) |
| Total | 579 (100.0%) | 475 (100.0%) |
Families and Households in Mexico Beach
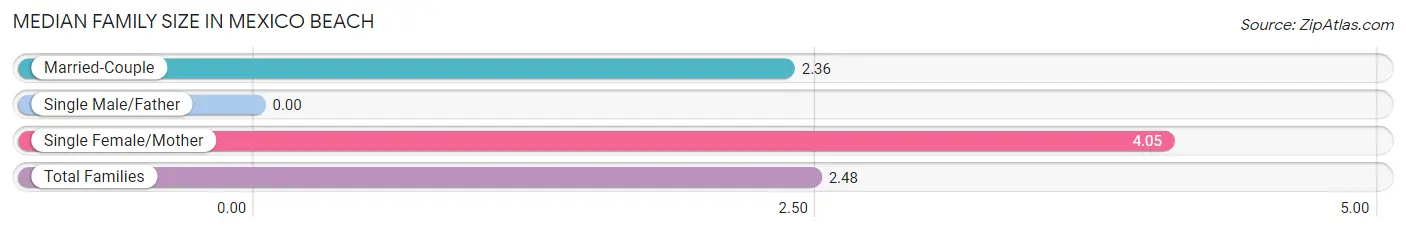
Median Family Size in Mexico Beach
| Family Type | # Families | Family Size |
| Married-Couple | 281 (92.7%) | 2.36 |
| Single Male/Father | 0 (0.0%) | - |
| Single Female/Mother | 22 (7.3%) | 4.05 |
| Total Families | 303 (100.0%) | 2.48 |
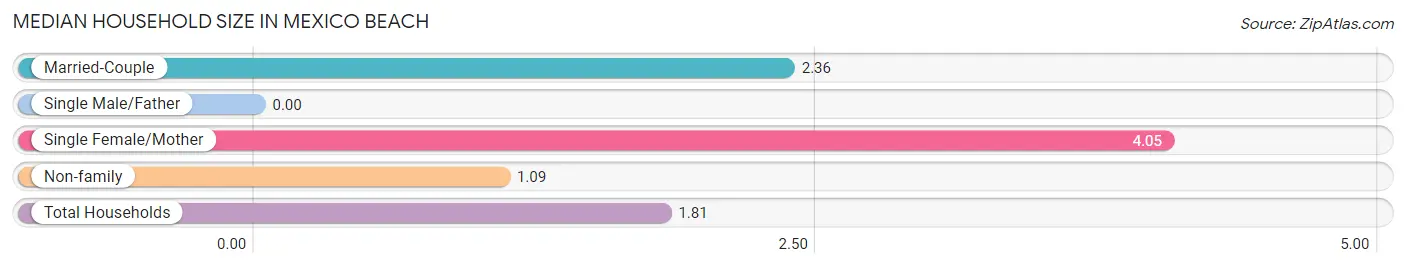
Median Household Size in Mexico Beach
| Household Type | # Households | Household Size |
| Married-Couple | 281 (48.3%) | 2.36 |
| Single Male/Father | 0 (0.0%) | - |
| Single Female/Mother | 22 (3.8%) | 4.05 |
| Non-family | 279 (47.9%) | 1.09 |
| Total Households | 582 (100.0%) | 1.81 |
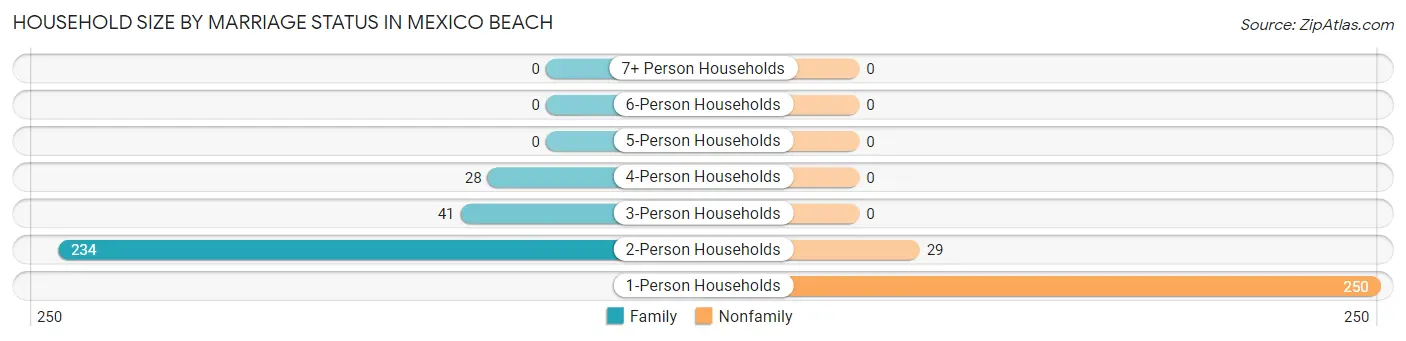
Household Size by Marriage Status in Mexico Beach
Out of a total of 582 households in Mexico Beach, 303 (52.1%) are family households, while 279 (47.9%) are nonfamily households. The most numerous type of family households are 2-person households, comprising 234, and the most common type of nonfamily households are 1-person households, comprising 250.
| Household Size | Family Households | Nonfamily Households |
| 1-Person Households | - | 250 (43.0%) |
| 2-Person Households | 234 (40.2%) | 29 (5.0%) |
| 3-Person Households | 41 (7.0%) | 0 (0.0%) |
| 4-Person Households | 28 (4.8%) | 0 (0.0%) |
| 5-Person Households | 0 (0.0%) | 0 (0.0%) |
| 6-Person Households | 0 (0.0%) | 0 (0.0%) |
| 7+ Person Households | 0 (0.0%) | 0 (0.0%) |
| Total | 303 (52.1%) | 279 (47.9%) |
Female Fertility in Mexico Beach
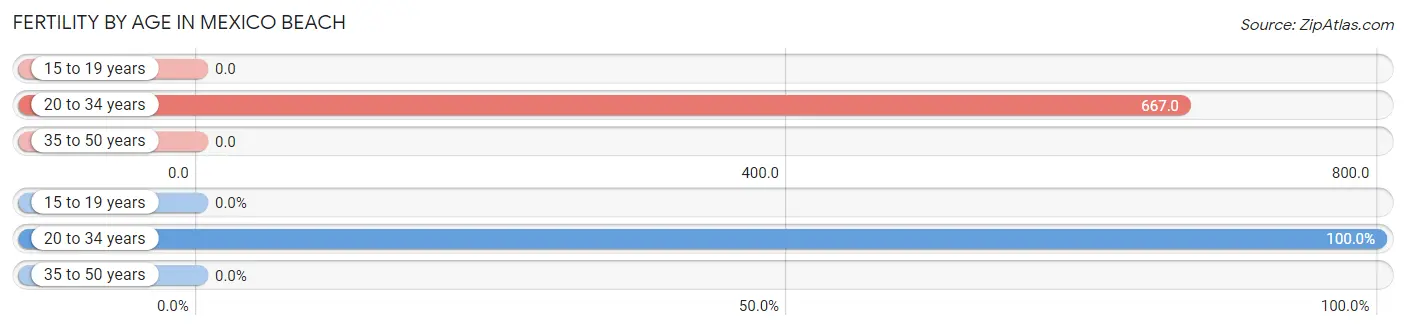
Fertility by Age in Mexico Beach
Average fertility rate in Mexico Beach is 252.0 births per 1,000 women. Women in the age bracket of 20 to 34 years have the highest fertility rate with 667.0 births per 1,000 women. Women in the age bracket of 20 to 34 years acount for 100.0% of all women with births.
| Age Bracket | Women with Births | Births / 1,000 Women |
| 15 to 19 years | 0 (0.0%) | 0.0 |
| 20 to 34 years | 26 (100.0%) | 667.0 |
| 35 to 50 years | 0 (0.0%) | 0.0 |
| Total | 26 (100.0%) | 252.0 |
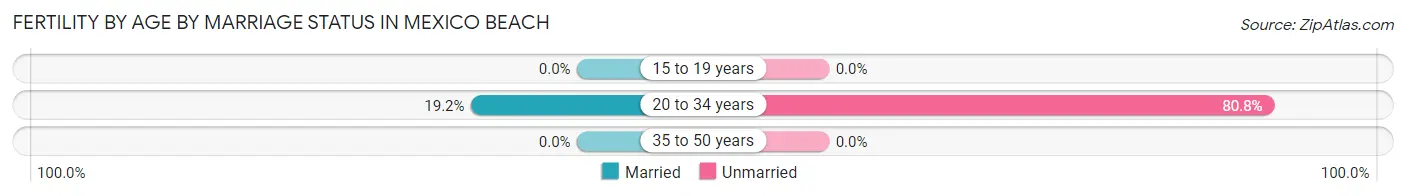
Fertility by Age by Marriage Status in Mexico Beach
19.2% of women with births (26) in Mexico Beach are married. The highest percentage of unmarried women with births falls into 20 to 34 years age bracket with 80.8% of them unmarried at the time of birth, while the lowest percentage of unmarried women with births belong to 20 to 34 years age bracket with 80.8% of them unmarried.
| Age Bracket | Married | Unmarried |
| 15 to 19 years | 0 (0.0%) | 0 (0.0%) |
| 20 to 34 years | 5 (19.2%) | 21 (80.8%) |
| 35 to 50 years | 0 (0.0%) | 0 (0.0%) |
| Total | 5 (19.2%) | 21 (80.8%) |
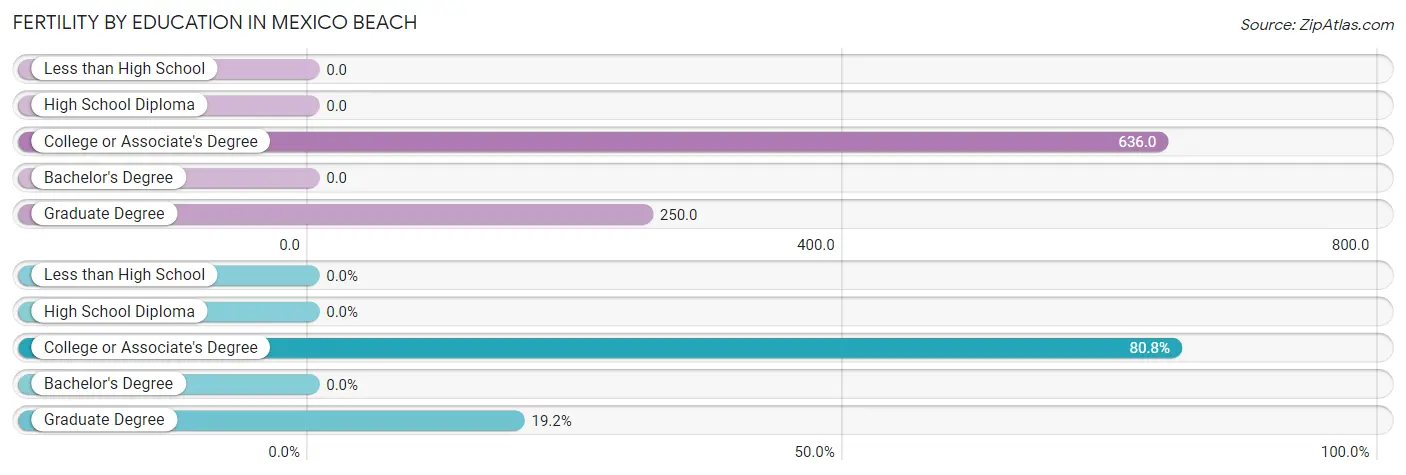
Fertility by Education in Mexico Beach
| Educational Attainment | Women with Births | Births / 1,000 Women |
| Less than High School | 0 (0.0%) | 0.0 |
| High School Diploma | 0 (0.0%) | 0.0 |
| College or Associate's Degree | 21 (80.8%) | 636.0 |
| Bachelor's Degree | 0 (0.0%) | 0.0 |
| Graduate Degree | 5 (19.2%) | 250.0 |
| Total | 26 (100.0%) | 252.0 |
Fertility by Education by Marriage Status in Mexico Beach
80.8% of women with births in Mexico Beach are unmarried. Women with the educational attainment of graduate degree are most likely to be married with 100.0% of them married at childbirth, while women with the educational attainment of college or associate's degree are least likely to be married with 100.0% of them unmarried at childbirth.
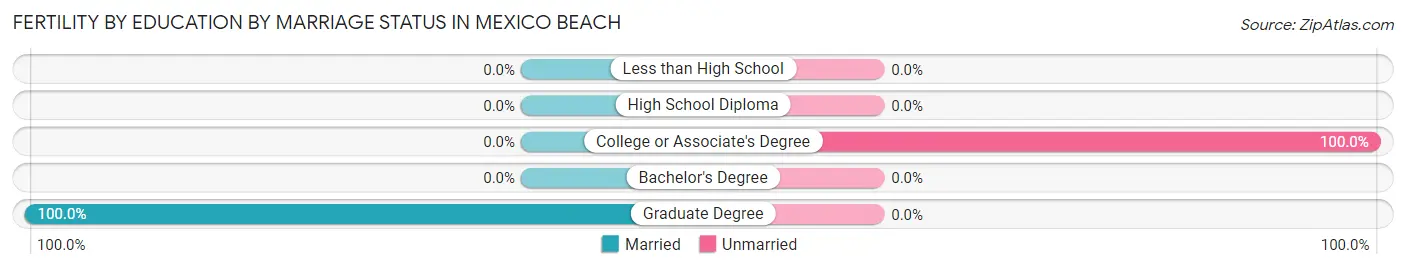
| Educational Attainment | Married | Unmarried |
| Less than High School | 0 (0.0%) | 0 (0.0%) |
| High School Diploma | 0 (0.0%) | 0 (0.0%) |
| College or Associate's Degree | 0 (0.0%) | 21 (100.0%) |
| Bachelor's Degree | 0 (0.0%) | 0 (0.0%) |
| Graduate Degree | 5 (100.0%) | 0 (0.0%) |
| Total | 5 (19.2%) | 21 (80.8%) |
Employment Characteristics in Mexico Beach
Employment by Class of Employer in Mexico Beach
Among the 409 employed individuals in Mexico Beach, private company employees (278 | 68.0%), federal government employees (35 | 8.6%), and self-employed (incorporated) (28 | 6.9%) make up the most common classes of employment.
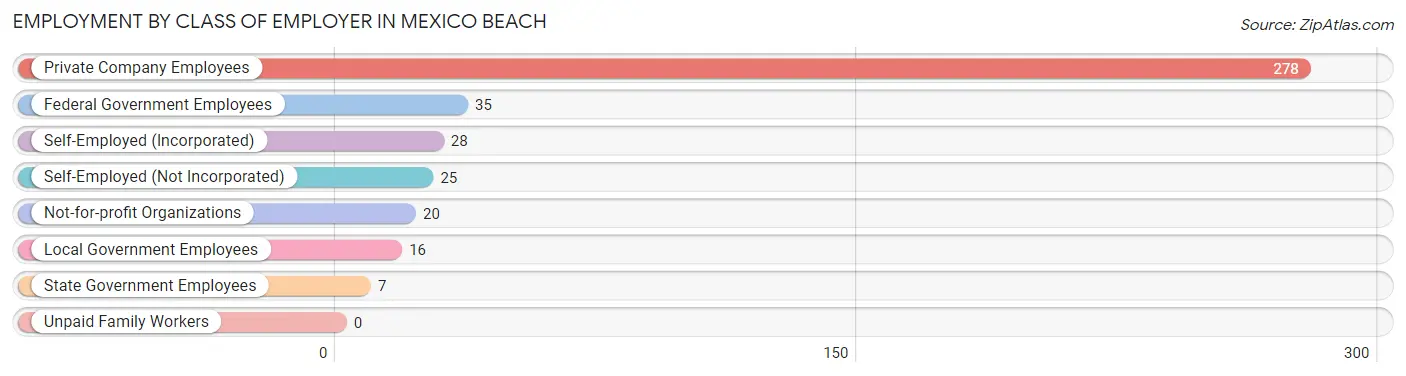
| Employer Class | # Employees | % Employees |
| Private Company Employees | 278 | 68.0% |
| Self-Employed (Incorporated) | 28 | 6.9% |
| Self-Employed (Not Incorporated) | 25 | 6.1% |
| Not-for-profit Organizations | 20 | 4.9% |
| Local Government Employees | 16 | 3.9% |
| State Government Employees | 7 | 1.7% |
| Federal Government Employees | 35 | 8.6% |
| Unpaid Family Workers | 0 | 0.0% |
| Total | 409 | 100.0% |
Employment Status by Age in Mexico Beach
According to the labor force statistics for Mexico Beach, out of the total population over 16 years of age (989), 47.7% or 472 individuals are in the labor force, with 10.5% or 50 of them unemployed. The age group with the highest labor force participation rate is 20 to 24 years, with 100.0% or 13 individuals in the labor force. Within the labor force, the 20 to 24 years age range has the highest percentage of unemployed individuals, with 100.0% or 13 of them being unemployed.
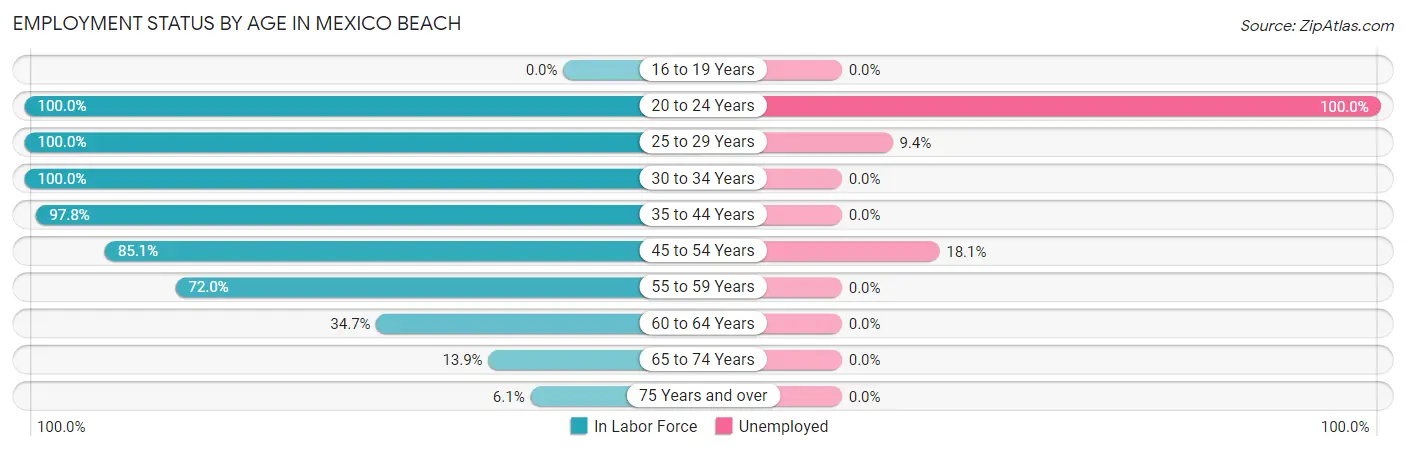
| Age Bracket | In Labor Force | Unemployed |
| 16 to 19 Years | 0 (0.0%) | 0 (0.0%) |
| 20 to 24 Years | 13 (100.0%) | 13 (100.0%) |
| 25 to 29 Years | 35 (100.0%) | 3 (9.4%) |
| 30 to 34 Years | 16 (100.0%) | 0 (0.0%) |
| 35 to 44 Years | 91 (97.8%) | 0 (0.0%) |
| 45 to 54 Years | 177 (85.1%) | 32 (18.1%) |
| 55 to 59 Years | 59 (72.0%) | 0 (0.0%) |
| 60 to 64 Years | 34 (34.7%) | 0 (0.0%) |
| 65 to 74 Years | 40 (13.9%) | 0 (0.0%) |
| 75 Years and over | 7 (6.1%) | 0 (0.0%) |
| Total | 472 (47.7%) | 50 (10.5%) |
Employment Status by Educational Attainment in Mexico Beach
According to labor force statistics for Mexico Beach, 77.4% of individuals (412) out of the total population between 25 and 64 years of age (532) are in the labor force, with 8.8% or 36 of them being unemployed. The group with the highest labor force participation rate are those with the educational attainment of college / associate degree, with 86.8% or 165 individuals in the labor force. Within the labor force, individuals with college / associate degree education have the highest percentage of unemployment, with 18.1% or 30 of them being unemployed.
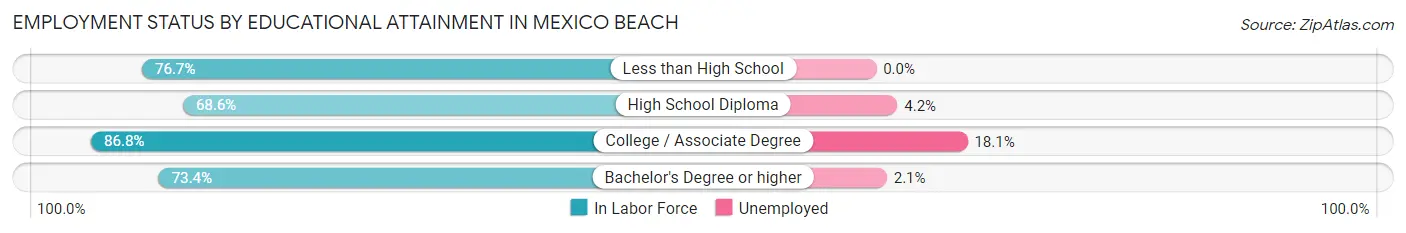
| Educational Attainment | In Labor Force | Unemployed |
| Less than High School | 23 (76.7%) | 0 (0.0%) |
| High School Diploma | 72 (68.6%) | 4 (4.2%) |
| College / Associate Degree | 165 (86.8%) | 34 (18.1%) |
| Bachelor's Degree or higher | 152 (73.4%) | 4 (2.1%) |
| Total | 412 (77.4%) | 47 (8.8%) |
Employment Occupations by Sex in Mexico Beach
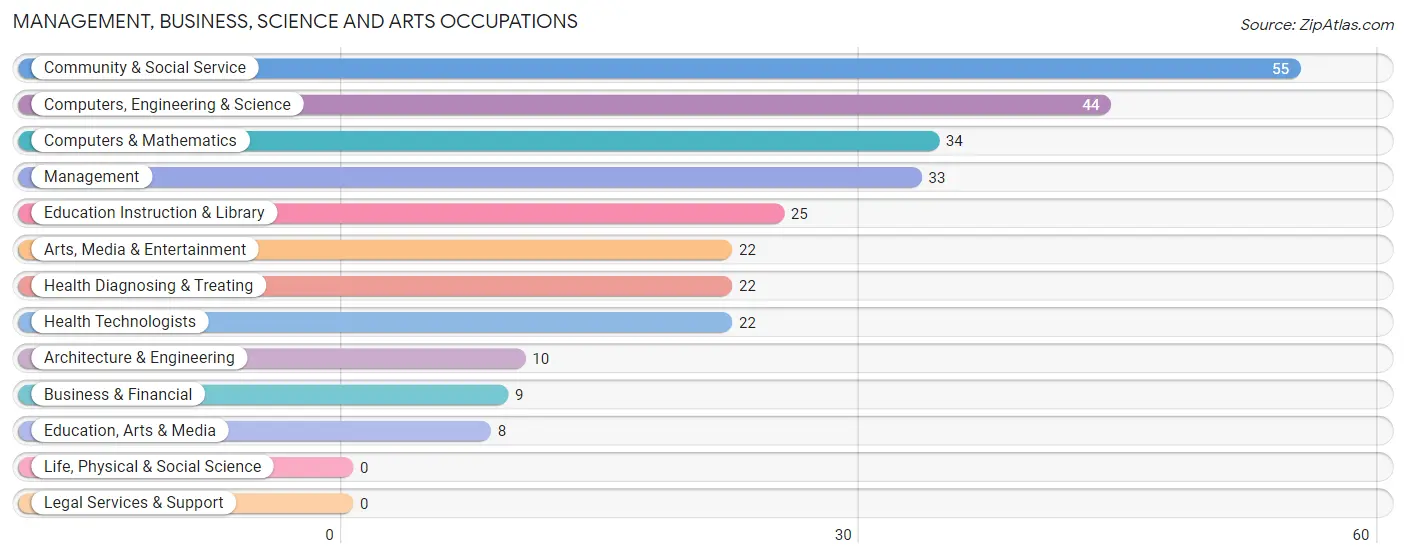
Management, Business, Science and Arts Occupations
The most common Management, Business, Science and Arts occupations in Mexico Beach are Community & Social Service (55 | 13.4%), Computers, Engineering & Science (44 | 10.7%), Computers & Mathematics (34 | 8.3%), Management (33 | 8.0%), and Education Instruction & Library (25 | 6.1%).
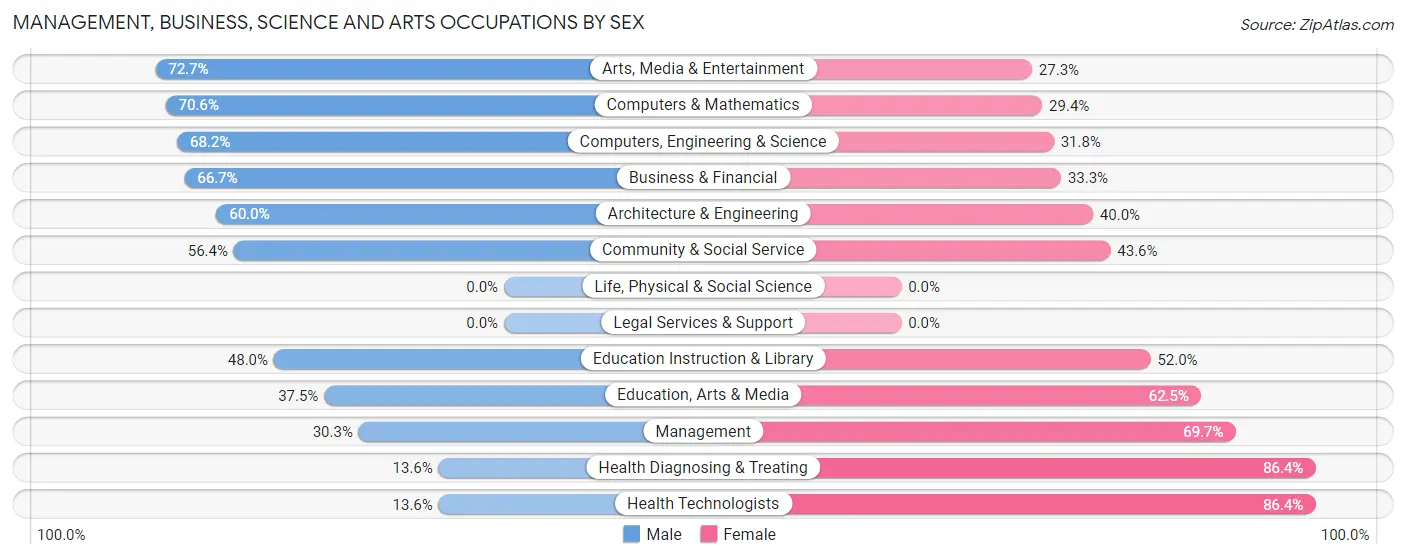
Management, Business, Science and Arts Occupations by Sex
Within the Management, Business, Science and Arts occupations in Mexico Beach, the most male-oriented occupations are Arts, Media & Entertainment (72.7%), Computers & Mathematics (70.6%), and Computers, Engineering & Science (68.2%), while the most female-oriented occupations are Health Diagnosing & Treating (86.4%), Health Technologists (86.4%), and Management (69.7%).
| Occupation | Male | Female |
| Management | 10 (30.3%) | 23 (69.7%) |
| Business & Financial | 6 (66.7%) | 3 (33.3%) |
| Computers, Engineering & Science | 30 (68.2%) | 14 (31.8%) |
| Computers & Mathematics | 24 (70.6%) | 10 (29.4%) |
| Architecture & Engineering | 6 (60.0%) | 4 (40.0%) |
| Life, Physical & Social Science | 0 (0.0%) | 0 (0.0%) |
| Community & Social Service | 31 (56.4%) | 24 (43.6%) |
| Education, Arts & Media | 3 (37.5%) | 5 (62.5%) |
| Legal Services & Support | 0 (0.0%) | 0 (0.0%) |
| Education Instruction & Library | 12 (48.0%) | 13 (52.0%) |
| Arts, Media & Entertainment | 16 (72.7%) | 6 (27.3%) |
| Health Diagnosing & Treating | 3 (13.6%) | 19 (86.4%) |
| Health Technologists | 3 (13.6%) | 19 (86.4%) |
| Total (Category) | 80 (49.1%) | 83 (50.9%) |
| Total (Overall) | 246 (59.9%) | 165 (40.2%) |
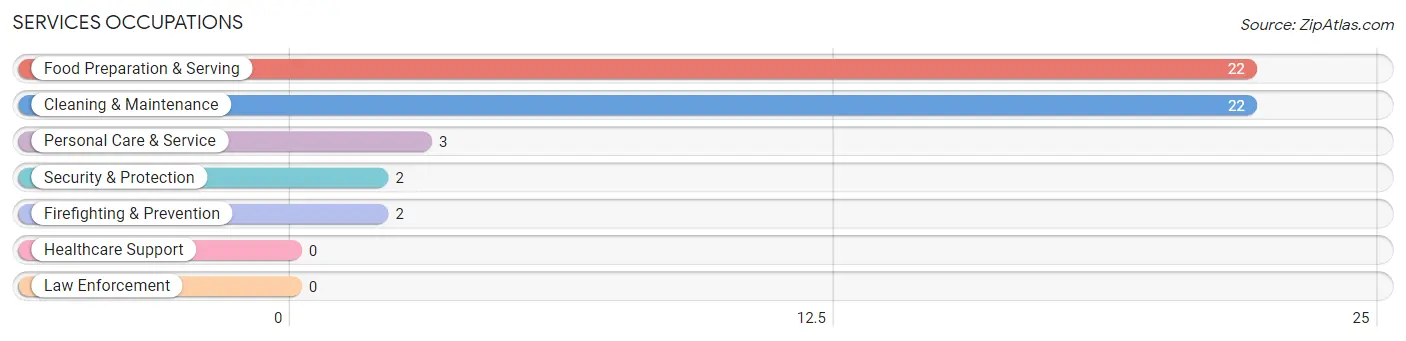
Services Occupations
The most common Services occupations in Mexico Beach are Food Preparation & Serving (22 | 5.3%), Cleaning & Maintenance (22 | 5.3%), Personal Care & Service (3 | 0.7%), Security & Protection (2 | 0.5%), and Firefighting & Prevention (2 | 0.5%).
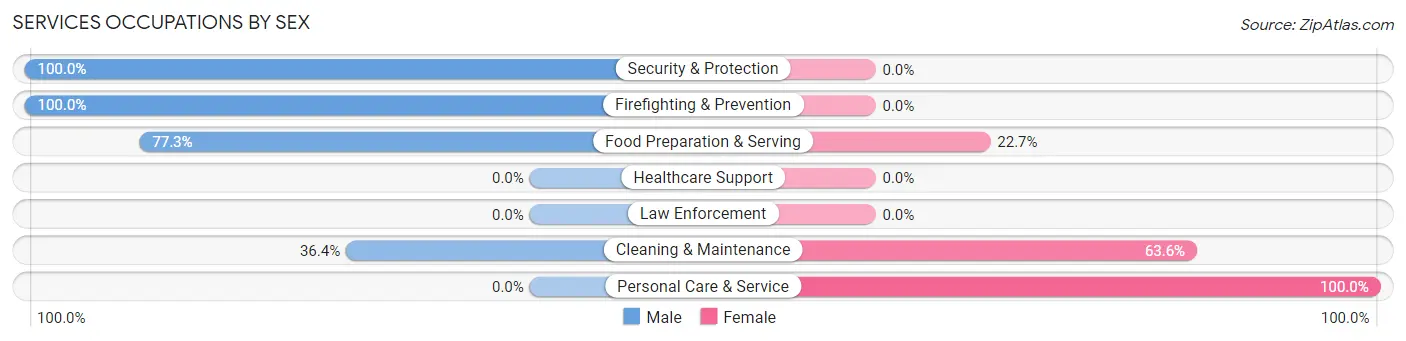
Services Occupations by Sex
Within the Services occupations in Mexico Beach, the most male-oriented occupations are Security & Protection (100.0%), Firefighting & Prevention (100.0%), and Food Preparation & Serving (77.3%), while the most female-oriented occupations are Personal Care & Service (100.0%), Cleaning & Maintenance (63.6%), and Food Preparation & Serving (22.7%).
| Occupation | Male | Female |
| Healthcare Support | 0 (0.0%) | 0 (0.0%) |
| Security & Protection | 2 (100.0%) | 0 (0.0%) |
| Firefighting & Prevention | 2 (100.0%) | 0 (0.0%) |
| Law Enforcement | 0 (0.0%) | 0 (0.0%) |
| Food Preparation & Serving | 17 (77.3%) | 5 (22.7%) |
| Cleaning & Maintenance | 8 (36.4%) | 14 (63.6%) |
| Personal Care & Service | 0 (0.0%) | 3 (100.0%) |
| Total (Category) | 27 (55.1%) | 22 (44.9%) |
| Total (Overall) | 246 (59.9%) | 165 (40.2%) |
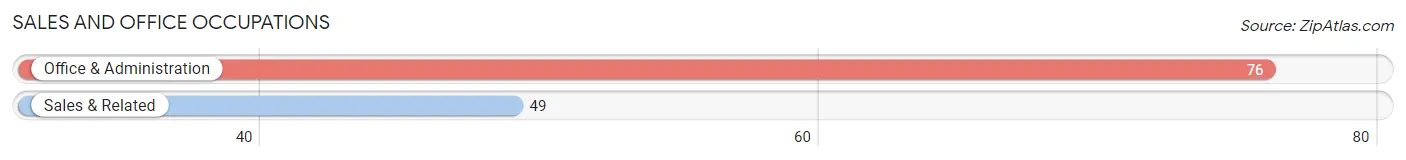
Sales and Office Occupations
The most common Sales and Office occupations in Mexico Beach are Office & Administration (76 | 18.5%), and Sales & Related (49 | 11.9%).
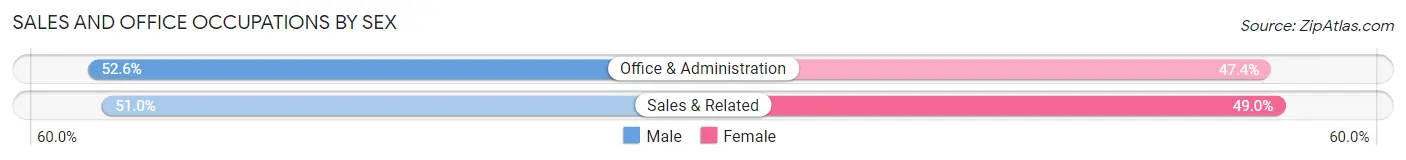
Sales and Office Occupations by Sex
| Occupation | Male | Female |
| Sales & Related | 25 (51.0%) | 24 (49.0%) |
| Office & Administration | 40 (52.6%) | 36 (47.4%) |
| Total (Category) | 65 (52.0%) | 60 (48.0%) |
| Total (Overall) | 246 (59.9%) | 165 (40.2%) |
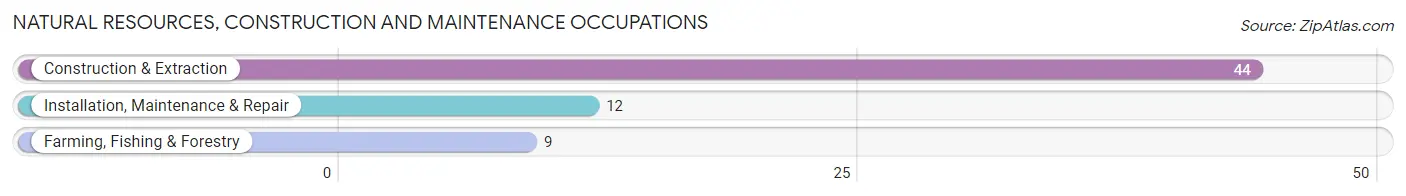
Natural Resources, Construction and Maintenance Occupations
The most common Natural Resources, Construction and Maintenance occupations in Mexico Beach are Construction & Extraction (44 | 10.7%), Installation, Maintenance & Repair (12 | 2.9%), and Farming, Fishing & Forestry (9 | 2.2%).
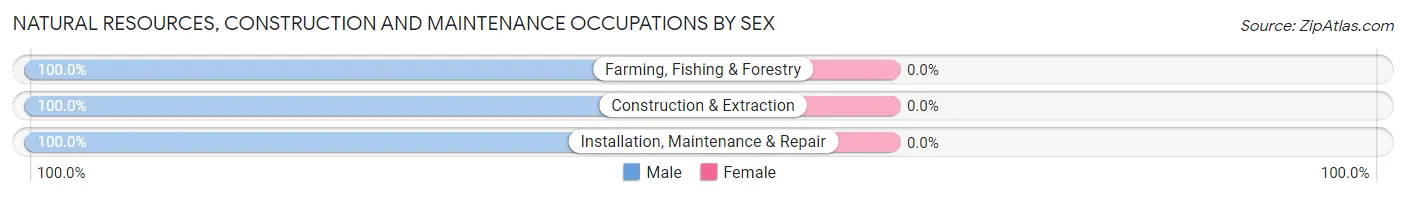
Natural Resources, Construction and Maintenance Occupations by Sex
| Occupation | Male | Female |
| Farming, Fishing & Forestry | 9 (100.0%) | 0 (0.0%) |
| Construction & Extraction | 44 (100.0%) | 0 (0.0%) |
| Installation, Maintenance & Repair | 12 (100.0%) | 0 (0.0%) |
| Total (Category) | 65 (100.0%) | 0 (0.0%) |
| Total (Overall) | 246 (59.9%) | 165 (40.2%) |
Production, Transportation and Moving Occupations
The most common Production, Transportation and Moving occupations in Mexico Beach are , and Transportation (9 | 2.2%).
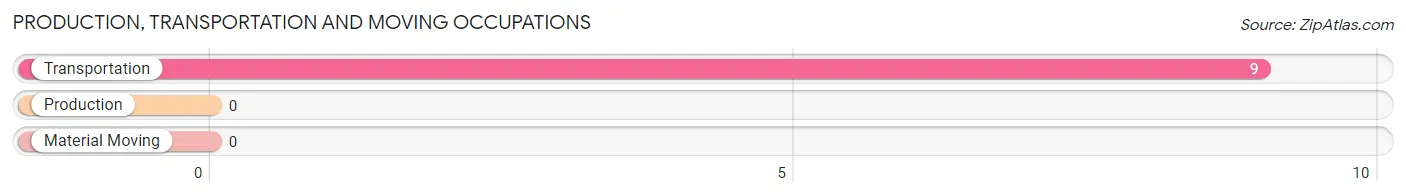
Production, Transportation and Moving Occupations by Sex
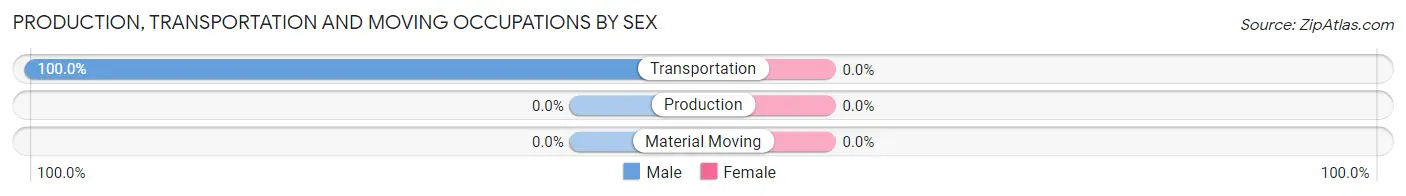
| Occupation | Male | Female |
| Production | 0 (0.0%) | 0 (0.0%) |
| Transportation | 9 (100.0%) | 0 (0.0%) |
| Material Moving | 0 (0.0%) | 0 (0.0%) |
| Total (Category) | 9 (100.0%) | 0 (0.0%) |
| Total (Overall) | 246 (59.9%) | 165 (40.2%) |
Employment Industries by Sex in Mexico Beach
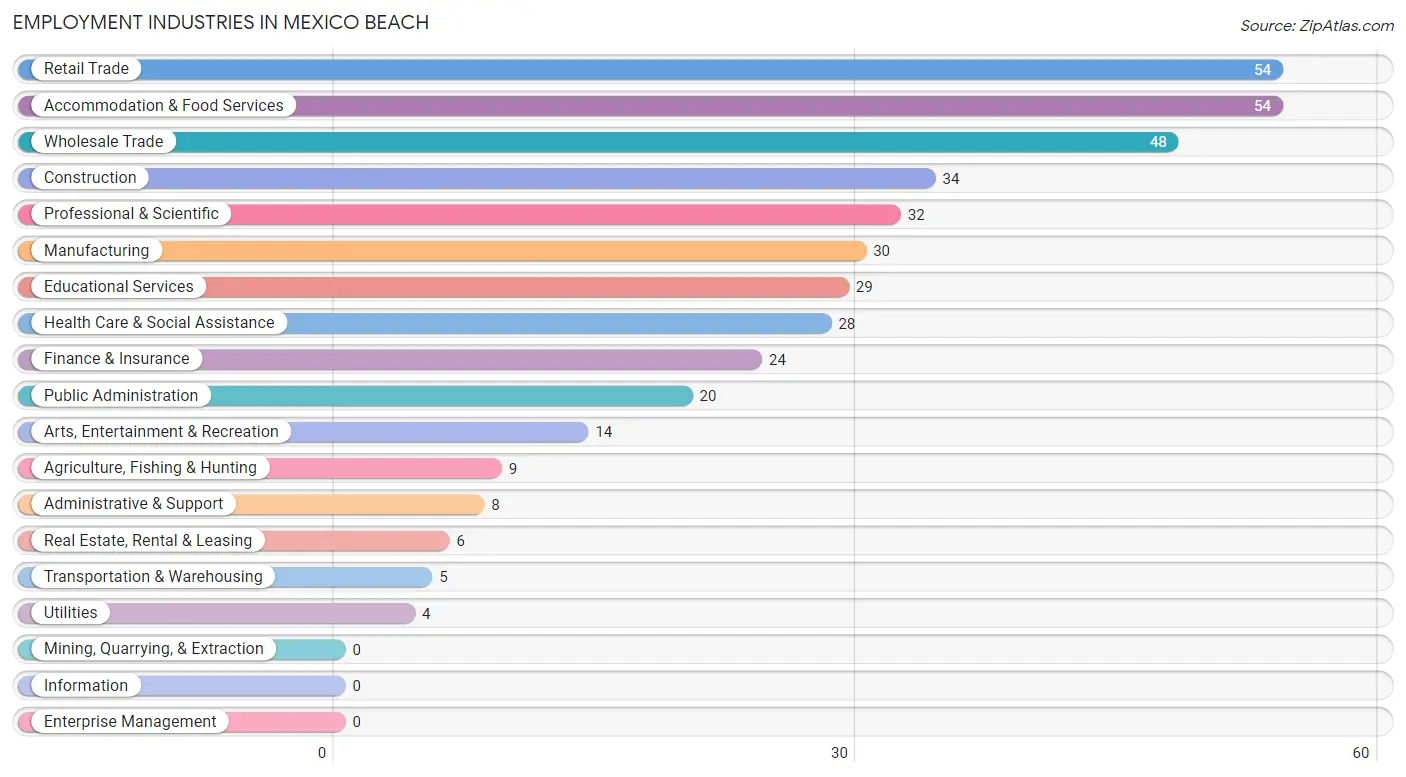
Employment Industries in Mexico Beach
The major employment industries in Mexico Beach include Retail Trade (54 | 13.1%), Accommodation & Food Services (54 | 13.1%), Wholesale Trade (48 | 11.7%), Construction (34 | 8.3%), and Professional & Scientific (32 | 7.8%).
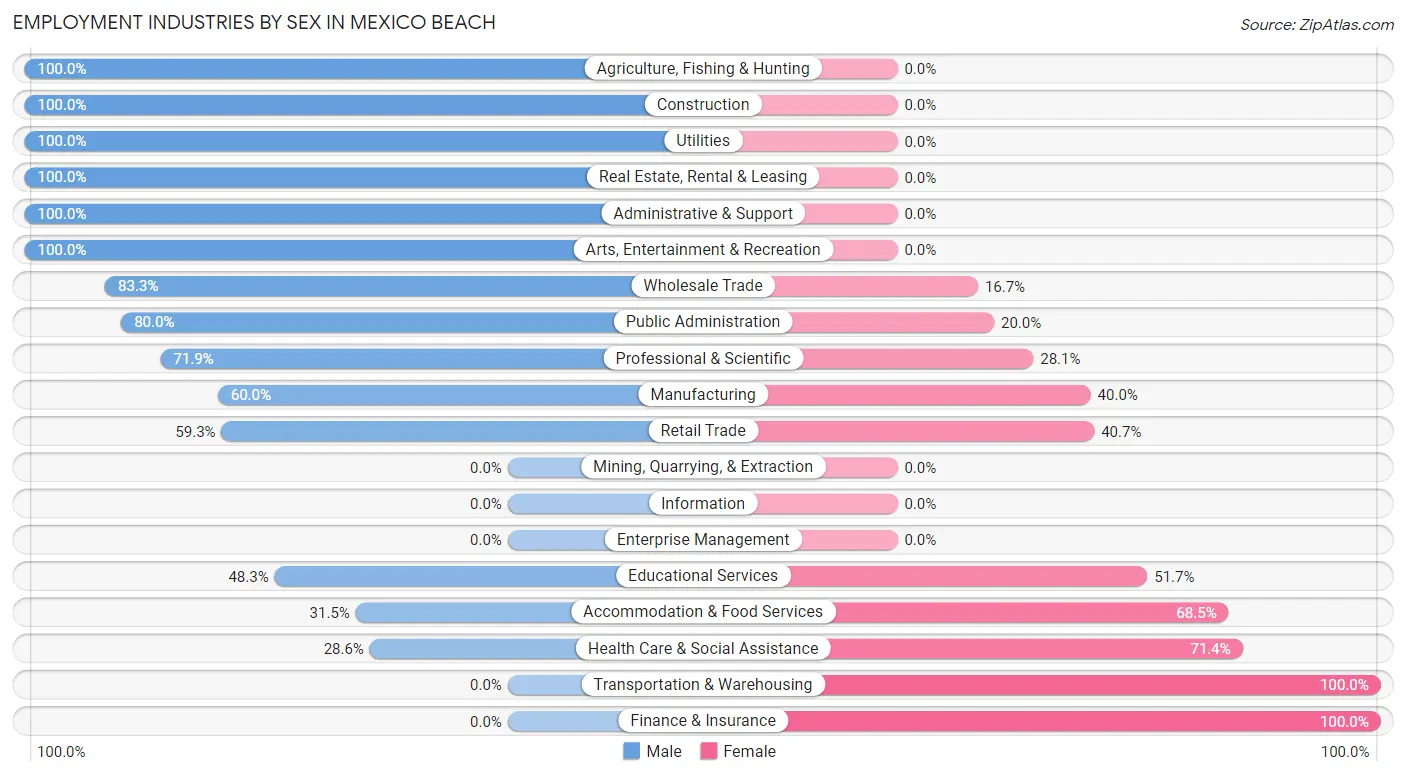
Employment Industries by Sex in Mexico Beach
The Mexico Beach industries that see more men than women are Agriculture, Fishing & Hunting (100.0%), Construction (100.0%), and Utilities (100.0%), whereas the industries that tend to have a higher number of women are Transportation & Warehousing (100.0%), Finance & Insurance (100.0%), and Health Care & Social Assistance (71.4%).
| Industry | Male | Female |
| Agriculture, Fishing & Hunting | 9 (100.0%) | 0 (0.0%) |
| Mining, Quarrying, & Extraction | 0 (0.0%) | 0 (0.0%) |
| Construction | 34 (100.0%) | 0 (0.0%) |
| Manufacturing | 18 (60.0%) | 12 (40.0%) |
| Wholesale Trade | 40 (83.3%) | 8 (16.7%) |
| Retail Trade | 32 (59.3%) | 22 (40.7%) |
| Transportation & Warehousing | 0 (0.0%) | 5 (100.0%) |
| Utilities | 4 (100.0%) | 0 (0.0%) |
| Information | 0 (0.0%) | 0 (0.0%) |
| Finance & Insurance | 0 (0.0%) | 24 (100.0%) |
| Real Estate, Rental & Leasing | 6 (100.0%) | 0 (0.0%) |
| Professional & Scientific | 23 (71.9%) | 9 (28.1%) |
| Enterprise Management | 0 (0.0%) | 0 (0.0%) |
| Administrative & Support | 8 (100.0%) | 0 (0.0%) |
| Educational Services | 14 (48.3%) | 15 (51.7%) |
| Health Care & Social Assistance | 8 (28.6%) | 20 (71.4%) |
| Arts, Entertainment & Recreation | 14 (100.0%) | 0 (0.0%) |
| Accommodation & Food Services | 17 (31.5%) | 37 (68.5%) |
| Public Administration | 16 (80.0%) | 4 (20.0%) |
| Total | 246 (59.9%) | 165 (40.2%) |
Education in Mexico Beach
School Enrollment in Mexico Beach
The most common levels of schooling among the 74 students in Mexico Beach are high school (42 | 56.8%), college / undergraduate (11 | 14.9%), and graduate / professional (9 | 12.2%).
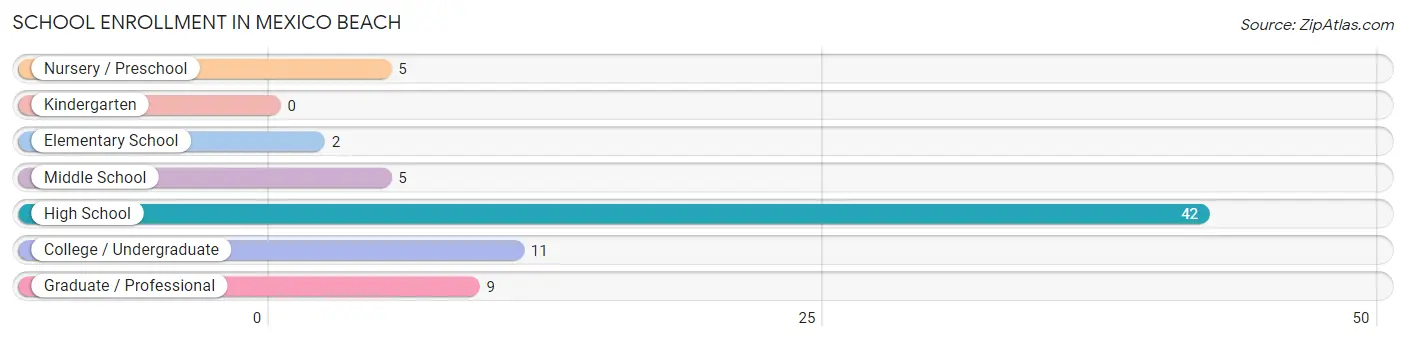
| School Level | # Students | % Students |
| Nursery / Preschool | 5 | 6.8% |
| Kindergarten | 0 | 0.0% |
| Elementary School | 2 | 2.7% |
| Middle School | 5 | 6.8% |
| High School | 42 | 56.8% |
| College / Undergraduate | 11 | 14.9% |
| Graduate / Professional | 9 | 12.2% |
| Total | 74 | 100.0% |
School Enrollment by Age by Funding Source in Mexico Beach
Out of a total of 74 students who are enrolled in schools in Mexico Beach, 8 (10.8%) attend a private institution, while the remaining 66 (89.2%) are enrolled in public schools. The age group of 3 to 4 year olds has the highest likelihood of being enrolled in private schools, with 5 (100.0% in the age bracket) enrolled. Conversely, the age group of 10 to 14 year olds has the lowest likelihood of being enrolled in a private school, with 5 (100.0% in the age bracket) attending a public institution.
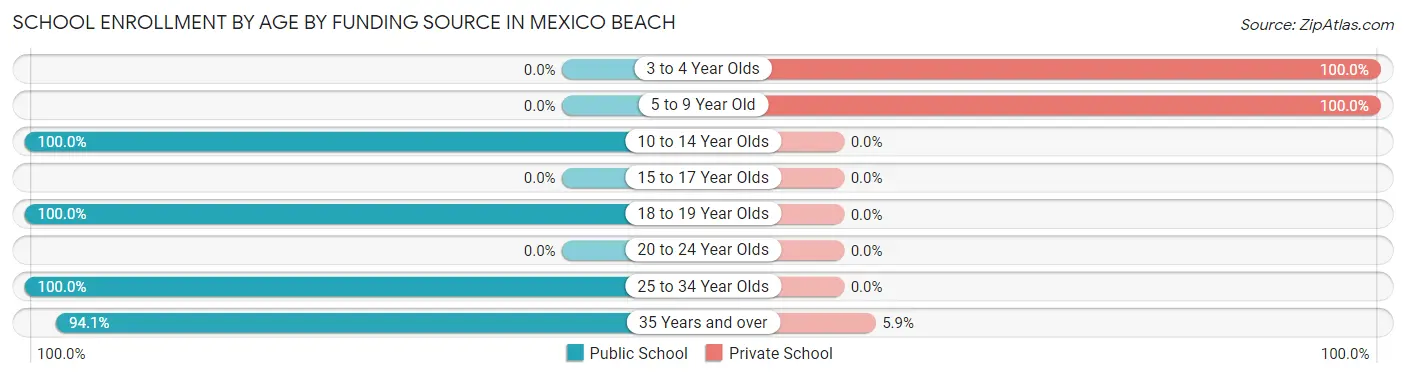
| Age Bracket | Public School | Private School |
| 3 to 4 Year Olds | 0 (0.0%) | 5 (100.0%) |
| 5 to 9 Year Old | 0 (0.0%) | 2 (100.0%) |
| 10 to 14 Year Olds | 5 (100.0%) | 0 (0.0%) |
| 15 to 17 Year Olds | 0 (0.0%) | 0 (0.0%) |
| 18 to 19 Year Olds | 42 (100.0%) | 0 (0.0%) |
| 20 to 24 Year Olds | 0 (0.0%) | 0 (0.0%) |
| 25 to 34 Year Olds | 3 (100.0%) | 0 (0.0%) |
| 35 Years and over | 16 (94.1%) | 1 (5.9%) |
| Total | 66 (89.2%) | 8 (10.8%) |
Educational Attainment by Field of Study in Mexico Beach
Education (82 | 22.4%), business (69 | 18.9%), psychology (29 | 7.9%), arts & humanities (27 | 7.4%), and computers & mathematics (26 | 7.1%) are the most common fields of study among 366 individuals in Mexico Beach who have obtained a bachelor's degree or higher.
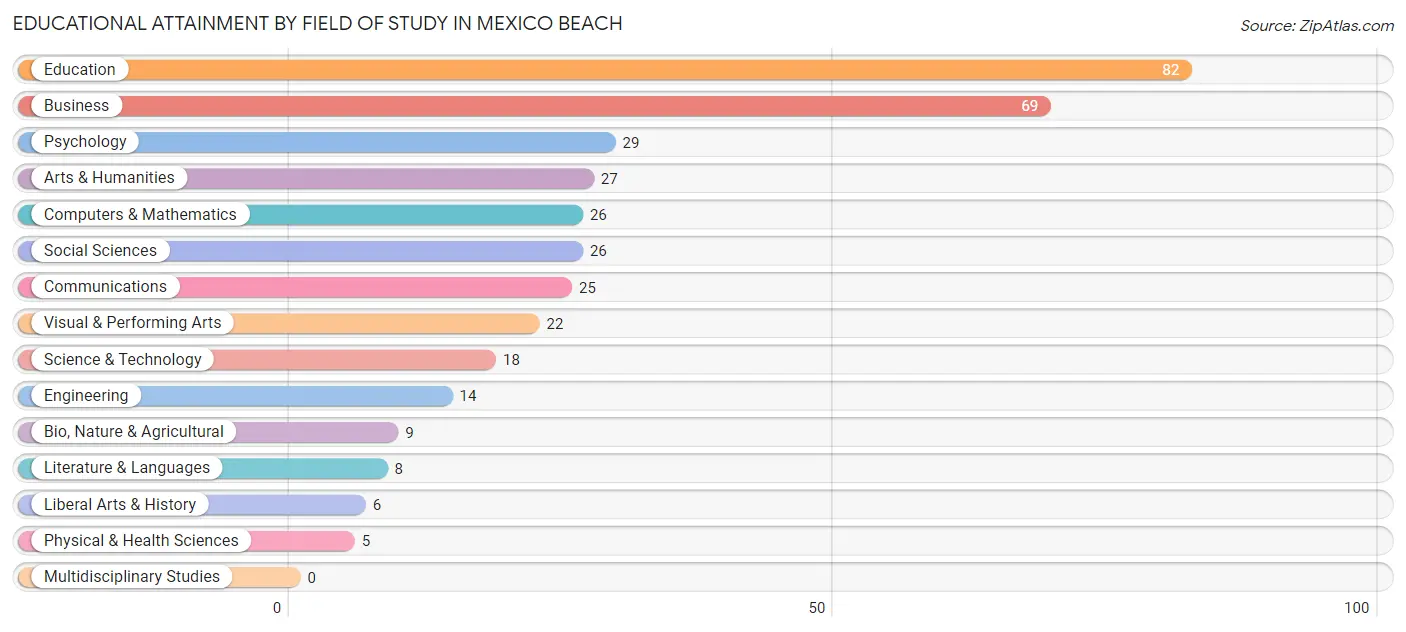
| Field of Study | # Graduates | % Graduates |
| Computers & Mathematics | 26 | 7.1% |
| Bio, Nature & Agricultural | 9 | 2.5% |
| Physical & Health Sciences | 5 | 1.4% |
| Psychology | 29 | 7.9% |
| Social Sciences | 26 | 7.1% |
| Engineering | 14 | 3.8% |
| Multidisciplinary Studies | 0 | 0.0% |
| Science & Technology | 18 | 4.9% |
| Business | 69 | 18.9% |
| Education | 82 | 22.4% |
| Literature & Languages | 8 | 2.2% |
| Liberal Arts & History | 6 | 1.6% |
| Visual & Performing Arts | 22 | 6.0% |
| Communications | 25 | 6.8% |
| Arts & Humanities | 27 | 7.4% |
| Total | 366 | 100.0% |
Transportation & Commute in Mexico Beach
Vehicle Availability by Sex in Mexico Beach
The most prevalent vehicle ownership categories in Mexico Beach are males with 2 vehicles (152, accounting for 60.6%) and females with 2 vehicles (106, making up 96.2%).
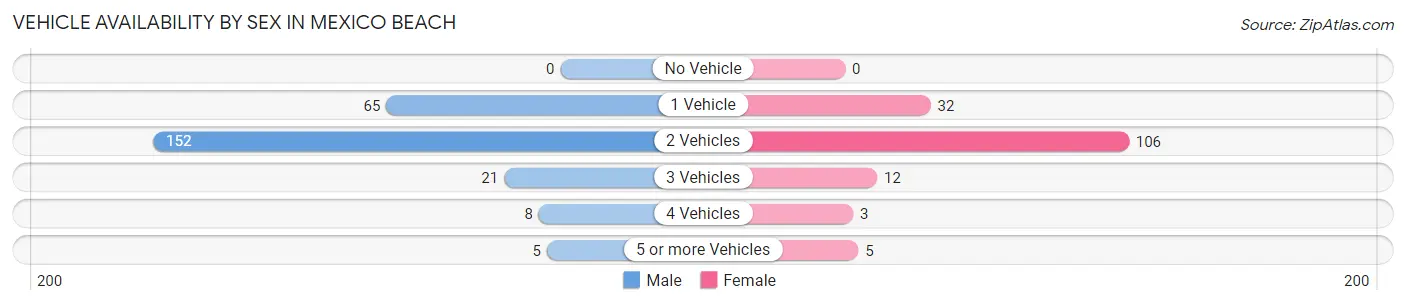
| Vehicles Available | Male | Female |
| No Vehicle | 0 (0.0%) | 0 (0.0%) |
| 1 Vehicle | 65 (25.9%) | 32 (20.3%) |
| 2 Vehicles | 152 (60.6%) | 106 (67.1%) |
| 3 Vehicles | 21 (8.4%) | 12 (7.6%) |
| 4 Vehicles | 8 (3.2%) | 3 (1.9%) |
| 5 or more Vehicles | 5 (2.0%) | 5 (3.2%) |
| Total | 251 (100.0%) | 158 (100.0%) |
Commute Time in Mexico Beach
The most frequently occuring commute durations in Mexico Beach are less than 5 minutes (75 commuters, 22.3%), 15 to 19 minutes (71 commuters, 21.1%), and 20 to 24 minutes (56 commuters, 16.6%).
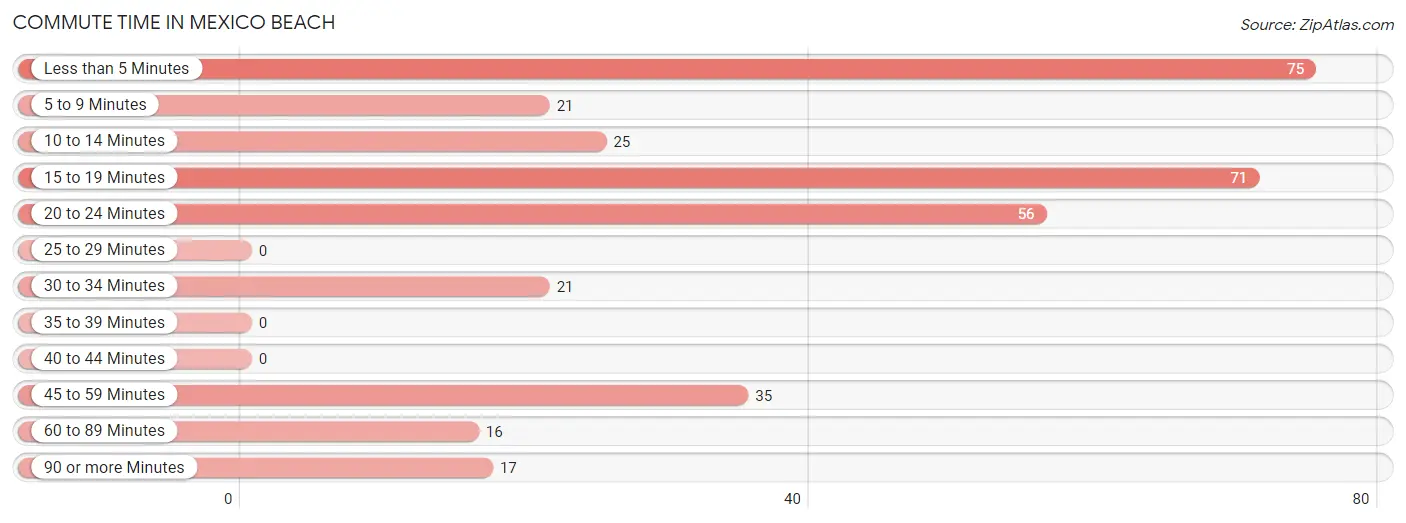
| Commute Time | # Commuters | % Commuters |
| Less than 5 Minutes | 75 | 22.3% |
| 5 to 9 Minutes | 21 | 6.2% |
| 10 to 14 Minutes | 25 | 7.4% |
| 15 to 19 Minutes | 71 | 21.1% |
| 20 to 24 Minutes | 56 | 16.6% |
| 25 to 29 Minutes | 0 | 0.0% |
| 30 to 34 Minutes | 21 | 6.2% |
| 35 to 39 Minutes | 0 | 0.0% |
| 40 to 44 Minutes | 0 | 0.0% |
| 45 to 59 Minutes | 35 | 10.4% |
| 60 to 89 Minutes | 16 | 4.8% |
| 90 or more Minutes | 17 | 5.0% |
Commute Time by Sex in Mexico Beach
The most common commute times in Mexico Beach are 15 to 19 minutes (62 commuters, 27.3%) for males and less than 5 minutes (51 commuters, 46.4%) for females.
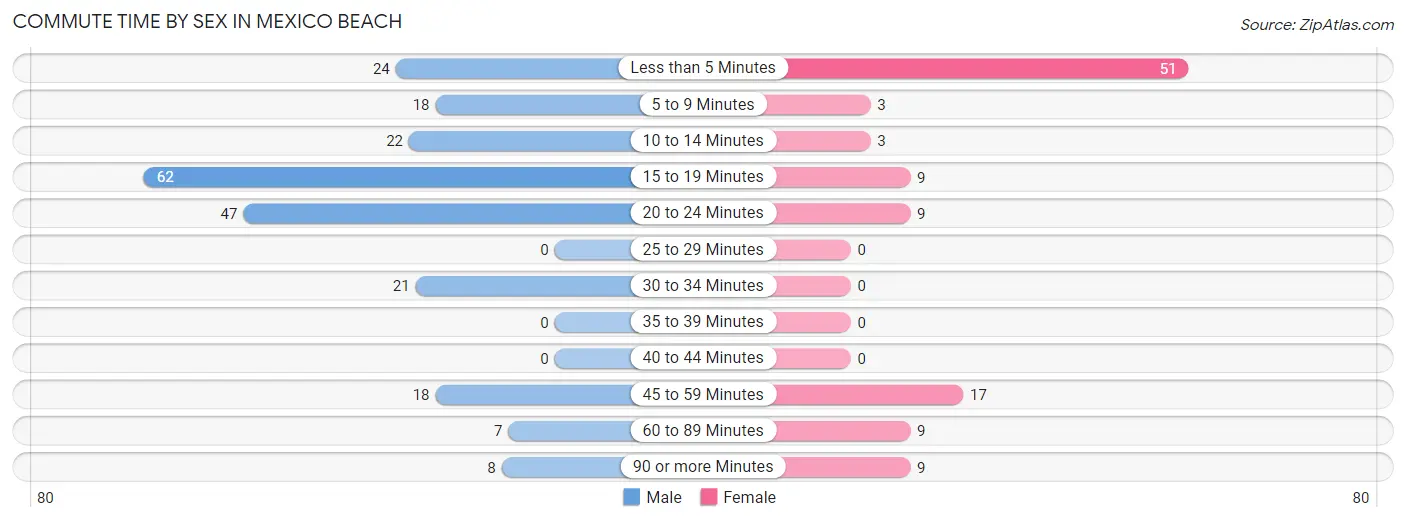
| Commute Time | Male | Female |
| Less than 5 Minutes | 24 (10.6%) | 51 (46.4%) |
| 5 to 9 Minutes | 18 (7.9%) | 3 (2.7%) |
| 10 to 14 Minutes | 22 (9.7%) | 3 (2.7%) |
| 15 to 19 Minutes | 62 (27.3%) | 9 (8.2%) |
| 20 to 24 Minutes | 47 (20.7%) | 9 (8.2%) |
| 25 to 29 Minutes | 0 (0.0%) | 0 (0.0%) |
| 30 to 34 Minutes | 21 (9.2%) | 0 (0.0%) |
| 35 to 39 Minutes | 0 (0.0%) | 0 (0.0%) |
| 40 to 44 Minutes | 0 (0.0%) | 0 (0.0%) |
| 45 to 59 Minutes | 18 (7.9%) | 17 (15.4%) |
| 60 to 89 Minutes | 7 (3.1%) | 9 (8.2%) |
| 90 or more Minutes | 8 (3.5%) | 9 (8.2%) |
Time of Departure to Work by Sex in Mexico Beach
The most frequent times of departure to work in Mexico Beach are 9:00 AM to 9:59 AM (41, 18.1%) for males and 7:00 AM to 7:29 AM (40, 36.4%) for females.
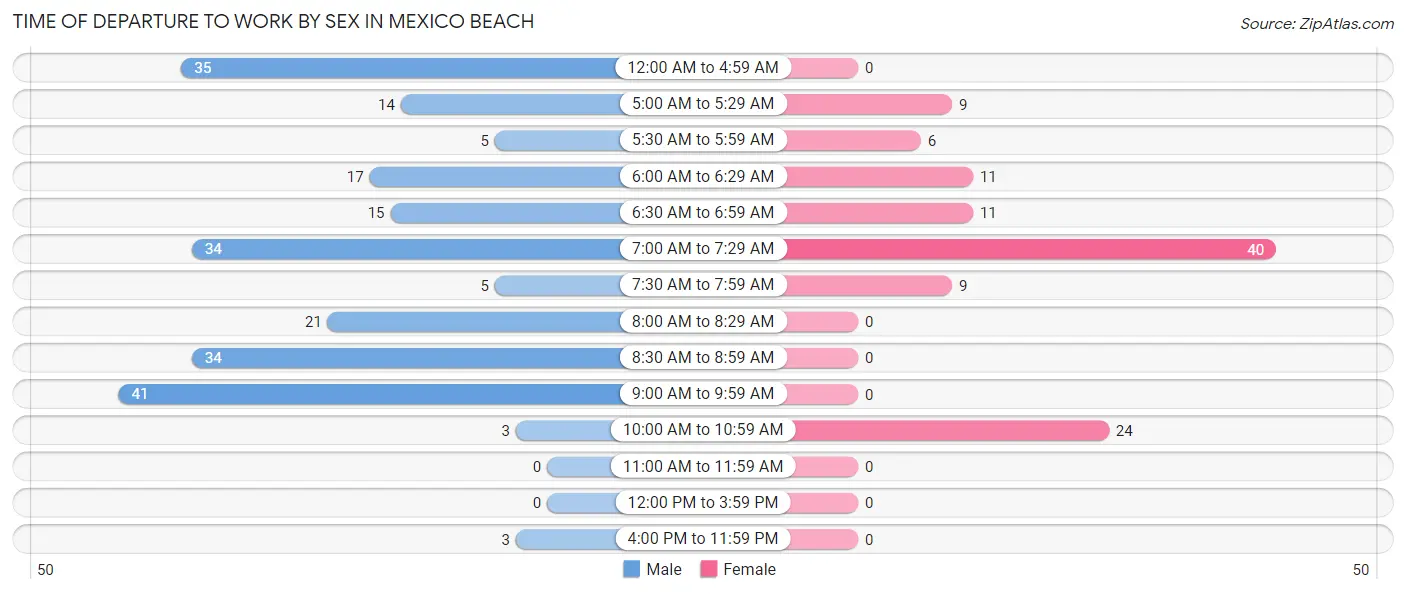
| Time of Departure | Male | Female |
| 12:00 AM to 4:59 AM | 35 (15.4%) | 0 (0.0%) |
| 5:00 AM to 5:29 AM | 14 (6.2%) | 9 (8.2%) |
| 5:30 AM to 5:59 AM | 5 (2.2%) | 6 (5.4%) |
| 6:00 AM to 6:29 AM | 17 (7.5%) | 11 (10.0%) |
| 6:30 AM to 6:59 AM | 15 (6.6%) | 11 (10.0%) |
| 7:00 AM to 7:29 AM | 34 (15.0%) | 40 (36.4%) |
| 7:30 AM to 7:59 AM | 5 (2.2%) | 9 (8.2%) |
| 8:00 AM to 8:29 AM | 21 (9.2%) | 0 (0.0%) |
| 8:30 AM to 8:59 AM | 34 (15.0%) | 0 (0.0%) |
| 9:00 AM to 9:59 AM | 41 (18.1%) | 0 (0.0%) |
| 10:00 AM to 10:59 AM | 3 (1.3%) | 24 (21.8%) |
| 11:00 AM to 11:59 AM | 0 (0.0%) | 0 (0.0%) |
| 12:00 PM to 3:59 PM | 0 (0.0%) | 0 (0.0%) |
| 4:00 PM to 11:59 PM | 3 (1.3%) | 0 (0.0%) |
| Total | 227 (100.0%) | 110 (100.0%) |
Housing Occupancy in Mexico Beach
Occupancy by Ownership in Mexico Beach
Of the total 582 dwellings in Mexico Beach, owner-occupied units account for 454 (78.0%), while renter-occupied units make up 128 (22.0%).
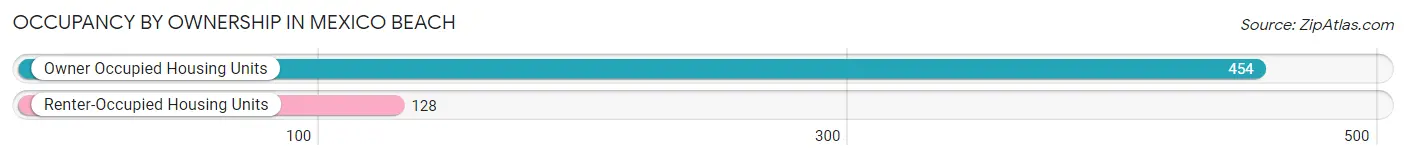
| Occupancy | # Housing Units | % Housing Units |
| Owner Occupied Housing Units | 454 | 78.0% |
| Renter-Occupied Housing Units | 128 | 22.0% |
| Total Occupied Housing Units | 582 | 100.0% |
Occupancy by Household Size in Mexico Beach
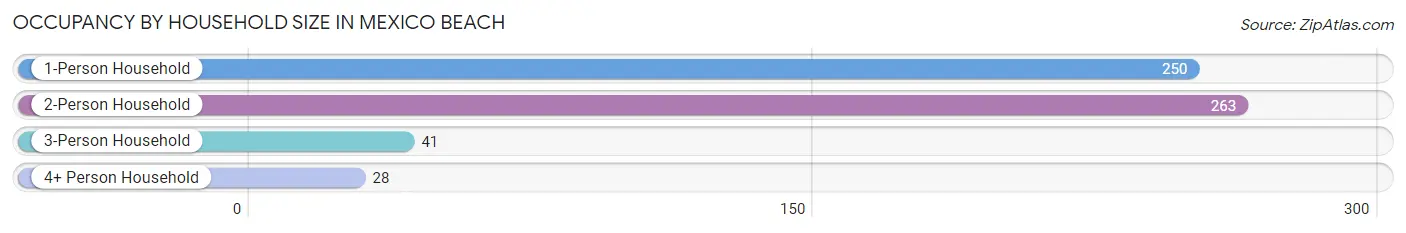
| Household Size | # Housing Units | % Housing Units |
| 1-Person Household | 250 | 43.0% |
| 2-Person Household | 263 | 45.2% |
| 3-Person Household | 41 | 7.0% |
| 4+ Person Household | 28 | 4.8% |
| Total Housing Units | 582 | 100.0% |
Occupancy by Ownership by Household Size in Mexico Beach
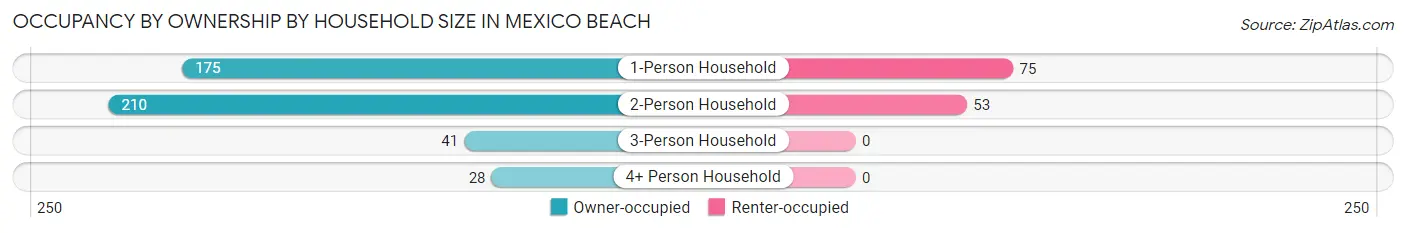
| Household Size | Owner-occupied | Renter-occupied |
| 1-Person Household | 175 (70.0%) | 75 (30.0%) |
| 2-Person Household | 210 (79.8%) | 53 (20.2%) |
| 3-Person Household | 41 (100.0%) | 0 (0.0%) |
| 4+ Person Household | 28 (100.0%) | 0 (0.0%) |
| Total Housing Units | 454 (78.0%) | 128 (22.0%) |
Occupancy by Educational Attainment in Mexico Beach
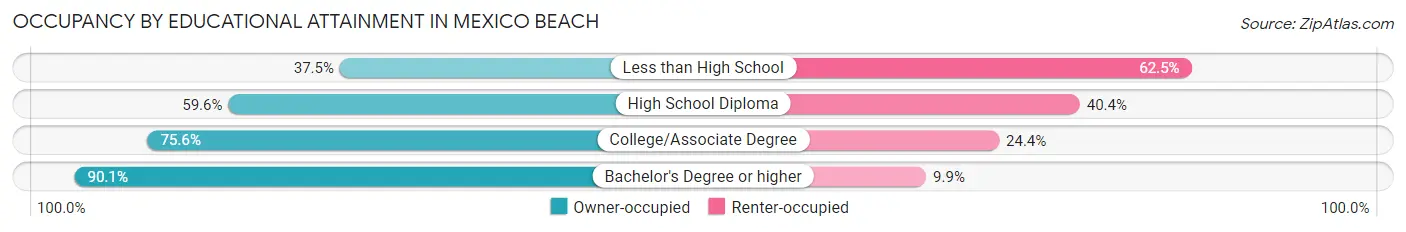
| Household Size | Owner-occupied | Renter-occupied |
| Less than High School | 3 (37.5%) | 5 (62.5%) |
| High School Diploma | 62 (59.6%) | 42 (40.4%) |
| College/Associate Degree | 180 (75.6%) | 58 (24.4%) |
| Bachelor's Degree or higher | 209 (90.1%) | 23 (9.9%) |
Occupancy by Age of Householder in Mexico Beach
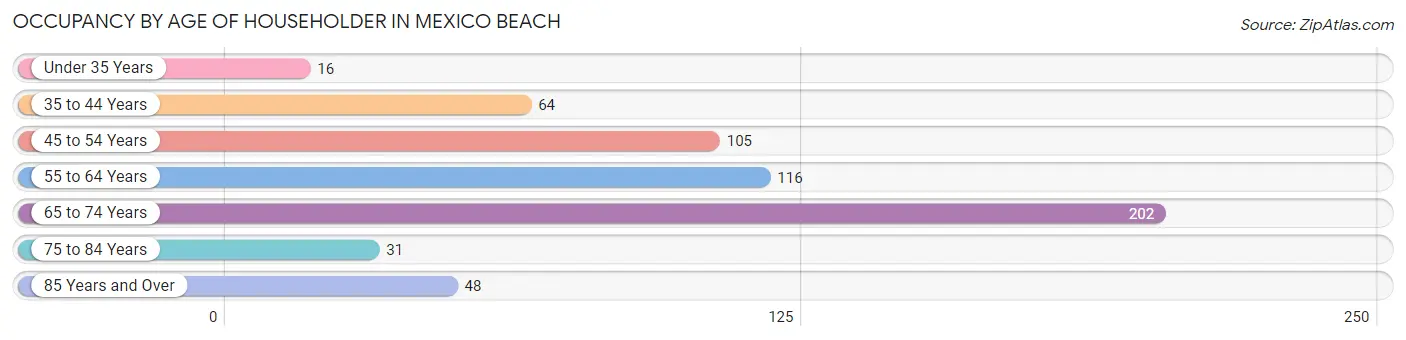
| Age Bracket | # Households | % Households |
| Under 35 Years | 16 | 2.8% |
| 35 to 44 Years | 64 | 11.0% |
| 45 to 54 Years | 105 | 18.0% |
| 55 to 64 Years | 116 | 19.9% |
| 65 to 74 Years | 202 | 34.7% |
| 75 to 84 Years | 31 | 5.3% |
| 85 Years and Over | 48 | 8.3% |
| Total | 582 | 100.0% |
Housing Finances in Mexico Beach
Median Income by Occupancy in Mexico Beach
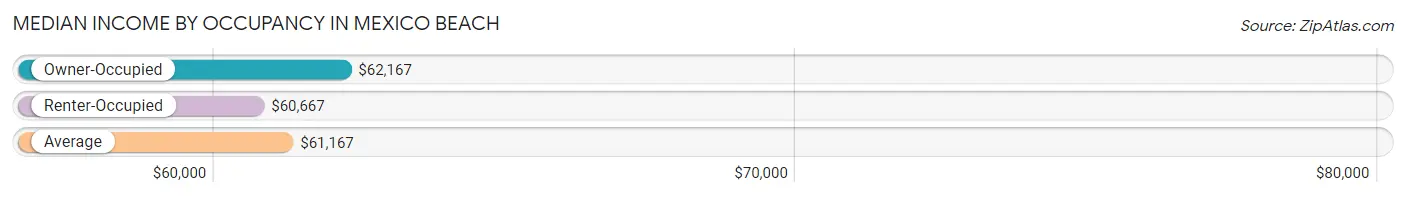
| Occupancy Type | # Households | Median Income |
| Owner-Occupied | 454 (78.0%) | $62,167 |
| Renter-Occupied | 128 (22.0%) | $60,667 |
| Average | 582 (100.0%) | $61,167 |
Occupancy by Householder Income Bracket in Mexico Beach
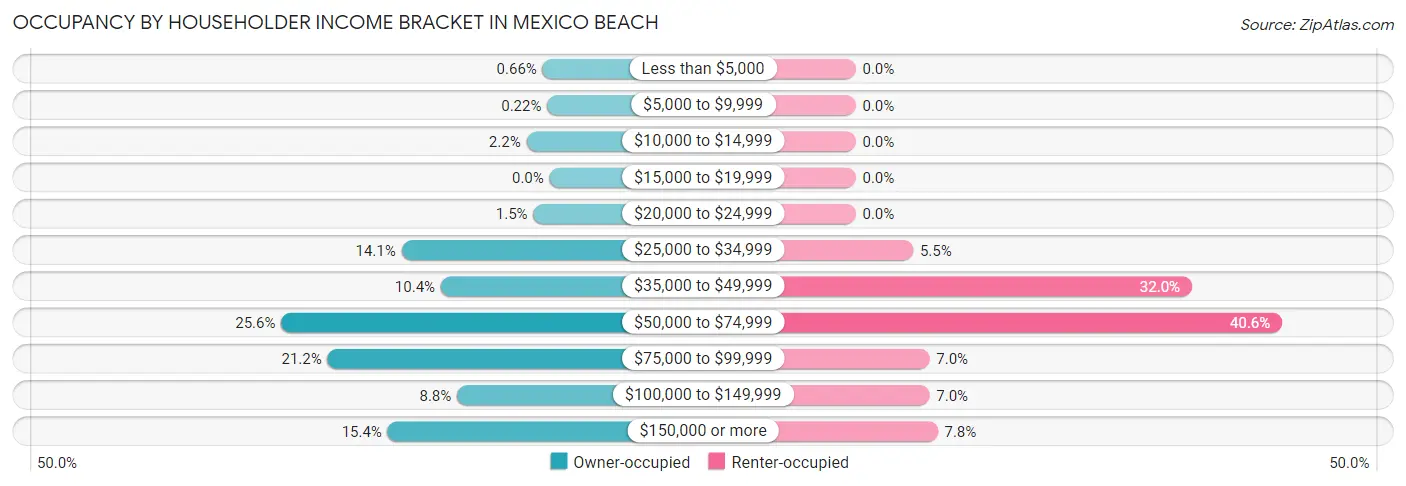
| Income Bracket | Owner-occupied | Renter-occupied |
| Less than $5,000 | 3 (0.7%) | 0 (0.0%) |
| $5,000 to $9,999 | 1 (0.2%) | 0 (0.0%) |
| $10,000 to $14,999 | 10 (2.2%) | 0 (0.0%) |
| $15,000 to $19,999 | 0 (0.0%) | 0 (0.0%) |
| $20,000 to $24,999 | 7 (1.5%) | 0 (0.0%) |
| $25,000 to $34,999 | 64 (14.1%) | 7 (5.5%) |
| $35,000 to $49,999 | 47 (10.3%) | 41 (32.0%) |
| $50,000 to $74,999 | 116 (25.6%) | 52 (40.6%) |
| $75,000 to $99,999 | 96 (21.1%) | 9 (7.0%) |
| $100,000 to $149,999 | 40 (8.8%) | 9 (7.0%) |
| $150,000 or more | 70 (15.4%) | 10 (7.8%) |
| Total | 454 (100.0%) | 128 (100.0%) |
Monthly Housing Cost Tiers in Mexico Beach
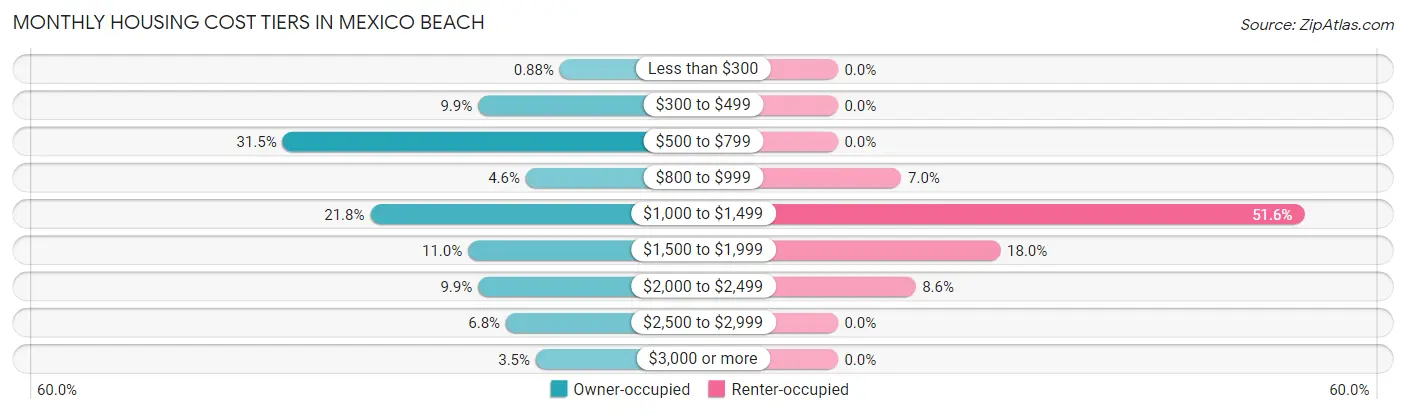
| Monthly Cost | Owner-occupied | Renter-occupied |
| Less than $300 | 4 (0.9%) | 0 (0.0%) |
| $300 to $499 | 45 (9.9%) | 0 (0.0%) |
| $500 to $799 | 143 (31.5%) | 0 (0.0%) |
| $800 to $999 | 21 (4.6%) | 9 (7.0%) |
| $1,000 to $1,499 | 99 (21.8%) | 66 (51.6%) |
| $1,500 to $1,999 | 50 (11.0%) | 23 (18.0%) |
| $2,000 to $2,499 | 45 (9.9%) | 11 (8.6%) |
| $2,500 to $2,999 | 31 (6.8%) | 0 (0.0%) |
| $3,000 or more | 16 (3.5%) | 0 (0.0%) |
| Total | 454 (100.0%) | 128 (100.0%) |
Physical Housing Characteristics in Mexico Beach
Housing Structures in Mexico Beach
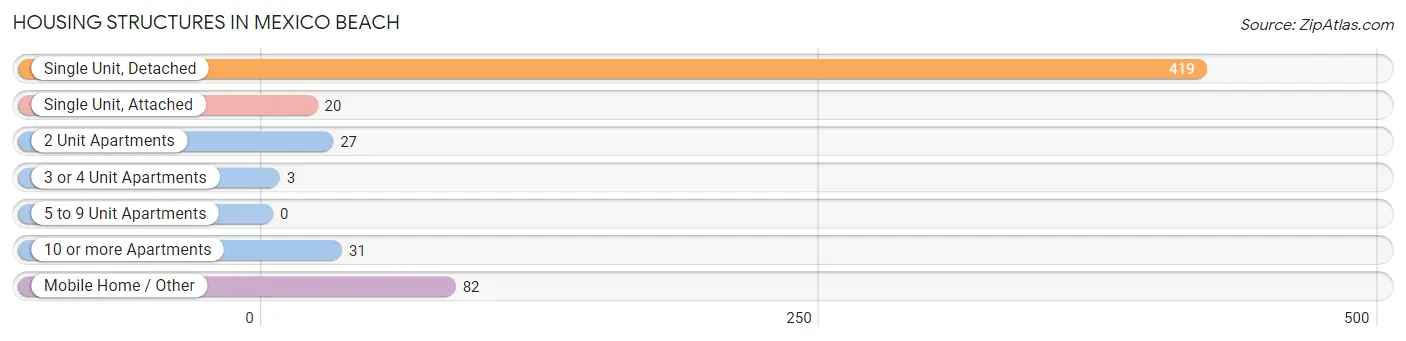
| Structure Type | # Housing Units | % Housing Units |
| Single Unit, Detached | 419 | 72.0% |
| Single Unit, Attached | 20 | 3.4% |
| 2 Unit Apartments | 27 | 4.6% |
| 3 or 4 Unit Apartments | 3 | 0.5% |
| 5 to 9 Unit Apartments | 0 | 0.0% |
| 10 or more Apartments | 31 | 5.3% |
| Mobile Home / Other | 82 | 14.1% |
| Total | 582 | 100.0% |
Housing Structures by Occupancy in Mexico Beach
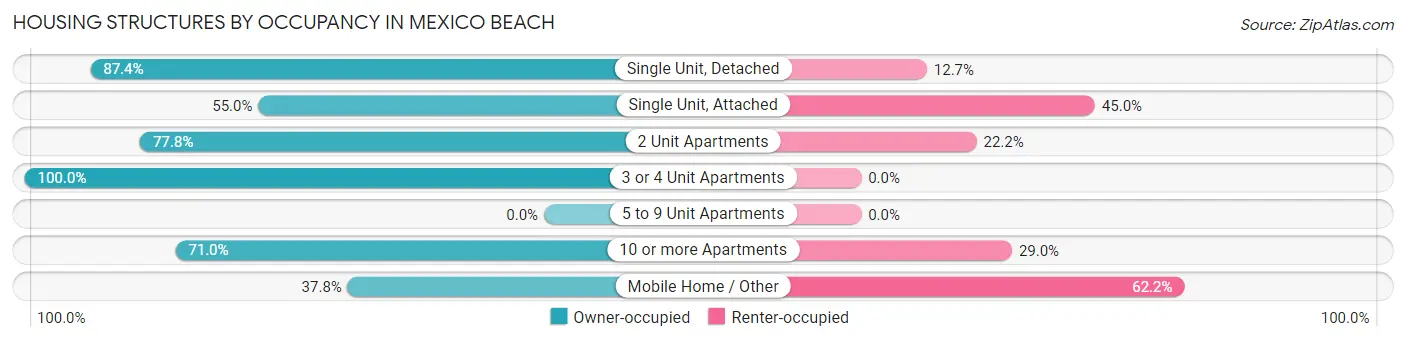
| Structure Type | Owner-occupied | Renter-occupied |
| Single Unit, Detached | 366 (87.4%) | 53 (12.7%) |
| Single Unit, Attached | 11 (55.0%) | 9 (45.0%) |
| 2 Unit Apartments | 21 (77.8%) | 6 (22.2%) |
| 3 or 4 Unit Apartments | 3 (100.0%) | 0 (0.0%) |
| 5 to 9 Unit Apartments | 0 (0.0%) | 0 (0.0%) |
| 10 or more Apartments | 22 (71.0%) | 9 (29.0%) |
| Mobile Home / Other | 31 (37.8%) | 51 (62.2%) |
| Total | 454 (78.0%) | 128 (22.0%) |
Housing Structures by Number of Rooms in Mexico Beach
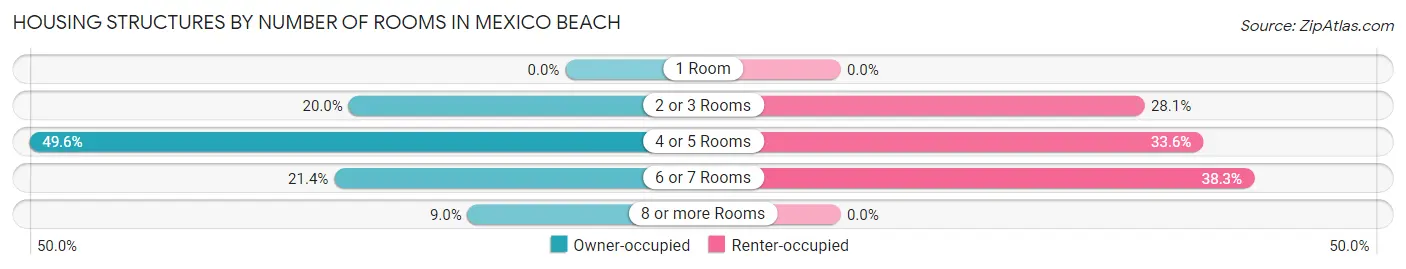
| Number of Rooms | Owner-occupied | Renter-occupied |
| 1 Room | 0 (0.0%) | 0 (0.0%) |
| 2 or 3 Rooms | 91 (20.0%) | 36 (28.1%) |
| 4 or 5 Rooms | 225 (49.6%) | 43 (33.6%) |
| 6 or 7 Rooms | 97 (21.4%) | 49 (38.3%) |
| 8 or more Rooms | 41 (9.0%) | 0 (0.0%) |
| Total | 454 (100.0%) | 128 (100.0%) |
Housing Structure by Heating Type in Mexico Beach
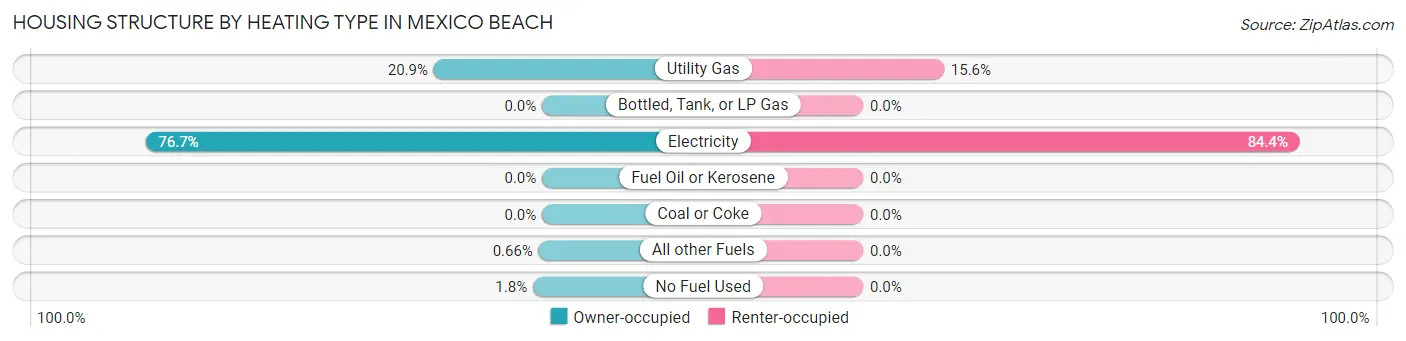
| Heating Type | Owner-occupied | Renter-occupied |
| Utility Gas | 95 (20.9%) | 20 (15.6%) |
| Bottled, Tank, or LP Gas | 0 (0.0%) | 0 (0.0%) |
| Electricity | 348 (76.6%) | 108 (84.4%) |
| Fuel Oil or Kerosene | 0 (0.0%) | 0 (0.0%) |
| Coal or Coke | 0 (0.0%) | 0 (0.0%) |
| All other Fuels | 3 (0.7%) | 0 (0.0%) |
| No Fuel Used | 8 (1.8%) | 0 (0.0%) |
| Total | 454 (100.0%) | 128 (100.0%) |
Household Vehicle Usage in Mexico Beach
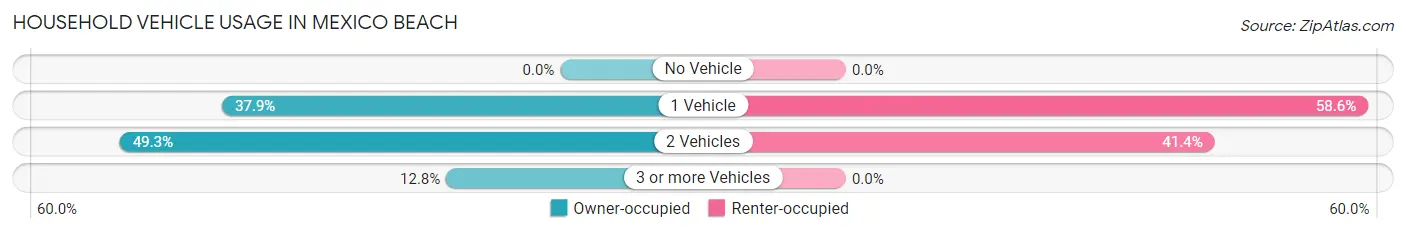
| Vehicles per Household | Owner-occupied | Renter-occupied |
| No Vehicle | 0 (0.0%) | 0 (0.0%) |
| 1 Vehicle | 172 (37.9%) | 75 (58.6%) |
| 2 Vehicles | 224 (49.3%) | 53 (41.4%) |
| 3 or more Vehicles | 58 (12.8%) | 0 (0.0%) |
| Total | 454 (100.0%) | 128 (100.0%) |
Real Estate & Mortgages in Mexico Beach
Real Estate and Mortgage Overview in Mexico Beach
| Characteristic | Without Mortgage | With Mortgage |
| Housing Units | 261 | 193 |
| Median Property Value | $345,200 | $335,400 |
| Median Household Income | $59,554 | $43 |
| Monthly Housing Costs | $684 | $13 |
| Real Estate Taxes | $2,087 | $13 |
Property Value by Mortgage Status in Mexico Beach
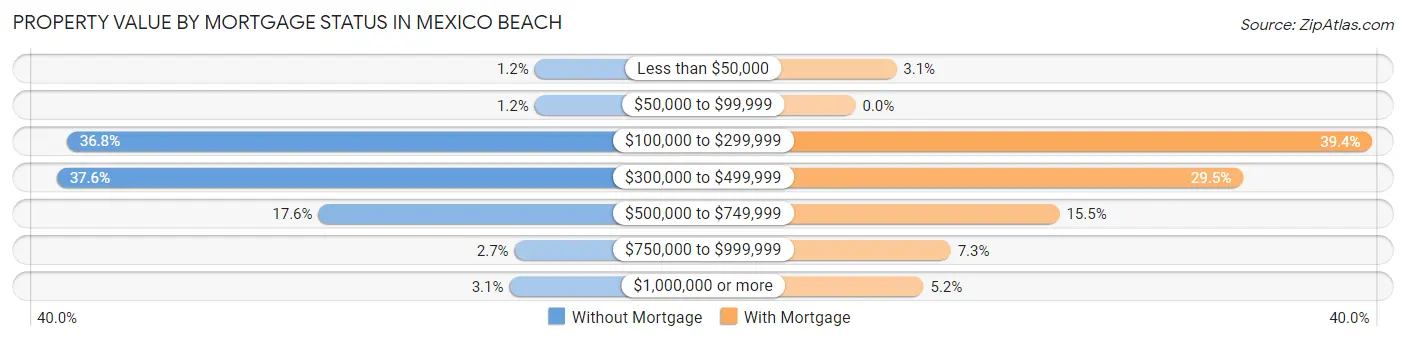
| Property Value | Without Mortgage | With Mortgage |
| Less than $50,000 | 3 (1.1%) | 6 (3.1%) |
| $50,000 to $99,999 | 3 (1.1%) | 0 (0.0%) |
| $100,000 to $299,999 | 96 (36.8%) | 76 (39.4%) |
| $300,000 to $499,999 | 98 (37.6%) | 57 (29.5%) |
| $500,000 to $749,999 | 46 (17.6%) | 30 (15.5%) |
| $750,000 to $999,999 | 7 (2.7%) | 14 (7.2%) |
| $1,000,000 or more | 8 (3.1%) | 10 (5.2%) |
| Total | 261 (100.0%) | 193 (100.0%) |
Household Income by Mortgage Status in Mexico Beach
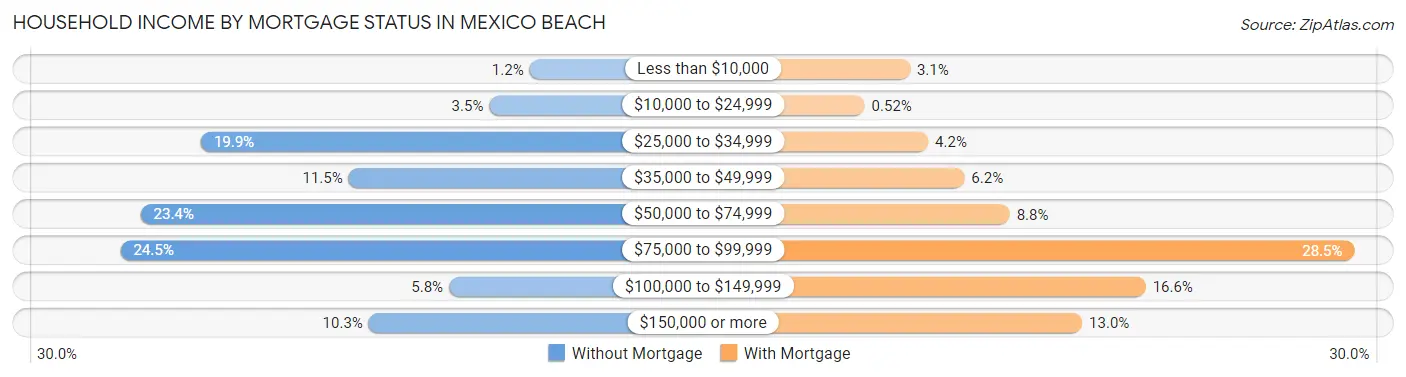
| Household Income | Without Mortgage | With Mortgage |
| Less than $10,000 | 3 (1.1%) | 6 (3.1%) |
| $10,000 to $24,999 | 9 (3.5%) | 1 (0.5%) |
| $25,000 to $34,999 | 52 (19.9%) | 8 (4.2%) |
| $35,000 to $49,999 | 30 (11.5%) | 12 (6.2%) |
| $50,000 to $74,999 | 61 (23.4%) | 17 (8.8%) |
| $75,000 to $99,999 | 64 (24.5%) | 55 (28.5%) |
| $100,000 to $149,999 | 15 (5.8%) | 32 (16.6%) |
| $150,000 or more | 27 (10.3%) | 25 (13.0%) |
| Total | 261 (100.0%) | 193 (100.0%) |
Property Value to Household Income Ratio in Mexico Beach
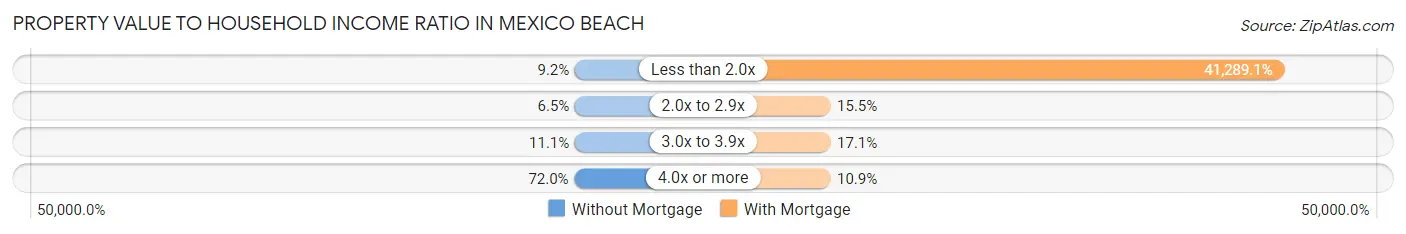
| Value-to-Income Ratio | Without Mortgage | With Mortgage |
| Less than 2.0x | 24 (9.2%) | 79,688 (41,289.1%) |
| 2.0x to 2.9x | 17 (6.5%) | 30 (15.5%) |
| 3.0x to 3.9x | 29 (11.1%) | 33 (17.1%) |
| 4.0x or more | 188 (72.0%) | 21 (10.9%) |
| Total | 261 (100.0%) | 193 (100.0%) |
Real Estate Taxes by Mortgage Status in Mexico Beach
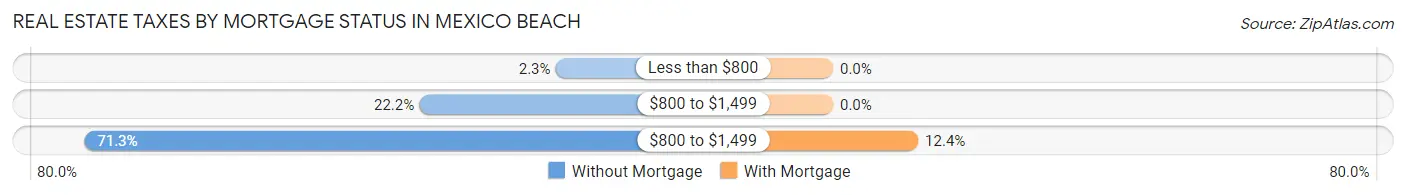
| Property Taxes | Without Mortgage | With Mortgage |
| Less than $800 | 6 (2.3%) | 0 (0.0%) |
| $800 to $1,499 | 58 (22.2%) | 0 (0.0%) |
| $800 to $1,499 | 186 (71.3%) | 24 (12.4%) |
| Total | 261 (100.0%) | 193 (100.0%) |
Health & Disability in Mexico Beach
Health Insurance Coverage by Age in Mexico Beach
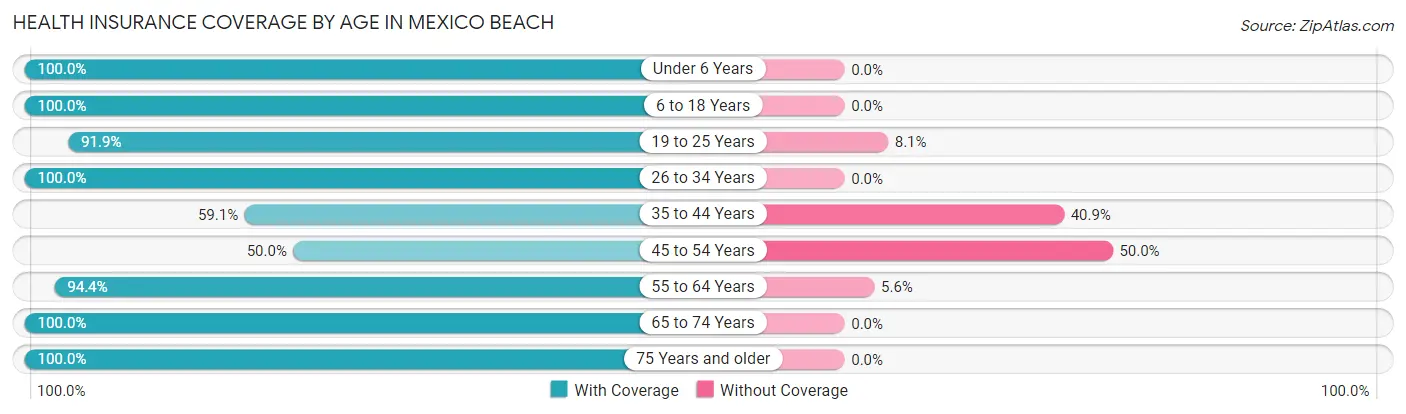
| Age Bracket | With Coverage | Without Coverage |
| Under 6 Years | 58 (100.0%) | 0 (0.0%) |
| 6 to 18 Years | 49 (100.0%) | 0 (0.0%) |
| 19 to 25 Years | 34 (91.9%) | 3 (8.1%) |
| 26 to 34 Years | 19 (100.0%) | 0 (0.0%) |
| 35 to 44 Years | 52 (59.1%) | 36 (40.9%) |
| 45 to 54 Years | 104 (50.0%) | 104 (50.0%) |
| 55 to 64 Years | 170 (94.4%) | 10 (5.6%) |
| 65 to 74 Years | 287 (100.0%) | 0 (0.0%) |
| 75 Years and older | 115 (100.0%) | 0 (0.0%) |
| Total | 888 (85.3%) | 153 (14.7%) |
Health Insurance Coverage by Citizenship Status in Mexico Beach
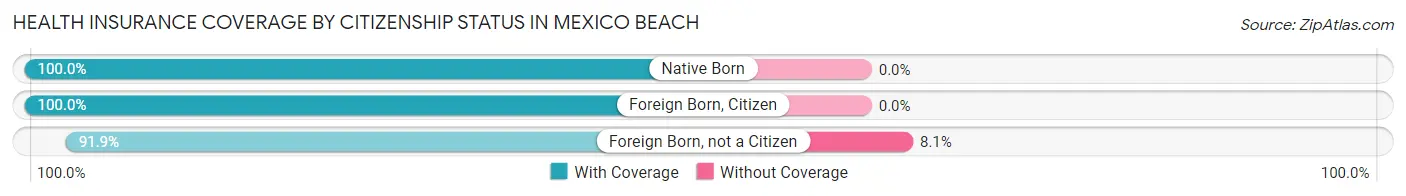
| Citizenship Status | With Coverage | Without Coverage |
| Native Born | 58 (100.0%) | 0 (0.0%) |
| Foreign Born, Citizen | 49 (100.0%) | 0 (0.0%) |
| Foreign Born, not a Citizen | 34 (91.9%) | 3 (8.1%) |
Health Insurance Coverage by Household Income in Mexico Beach
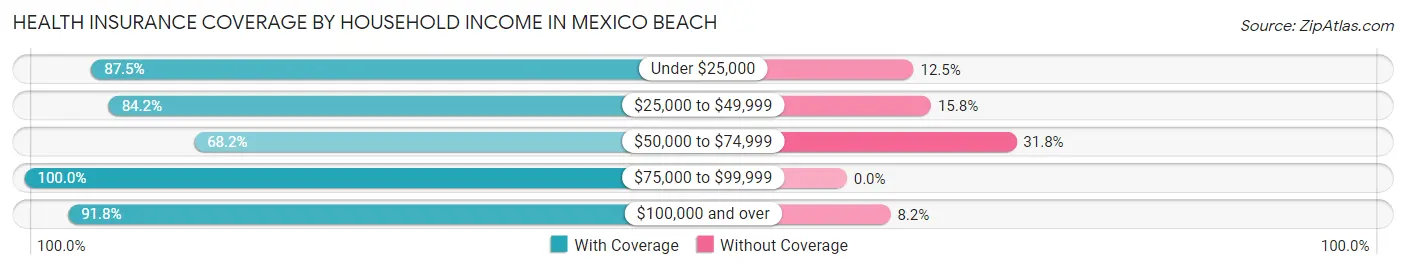
| Household Income | With Coverage | Without Coverage |
| Under $25,000 | 28 (87.5%) | 4 (12.5%) |
| $25,000 to $49,999 | 219 (84.2%) | 41 (15.8%) |
| $50,000 to $74,999 | 176 (68.2%) | 82 (31.8%) |
| $75,000 to $99,999 | 173 (100.0%) | 0 (0.0%) |
| $100,000 and over | 292 (91.8%) | 26 (8.2%) |
Public vs Private Health Insurance Coverage by Age in Mexico Beach
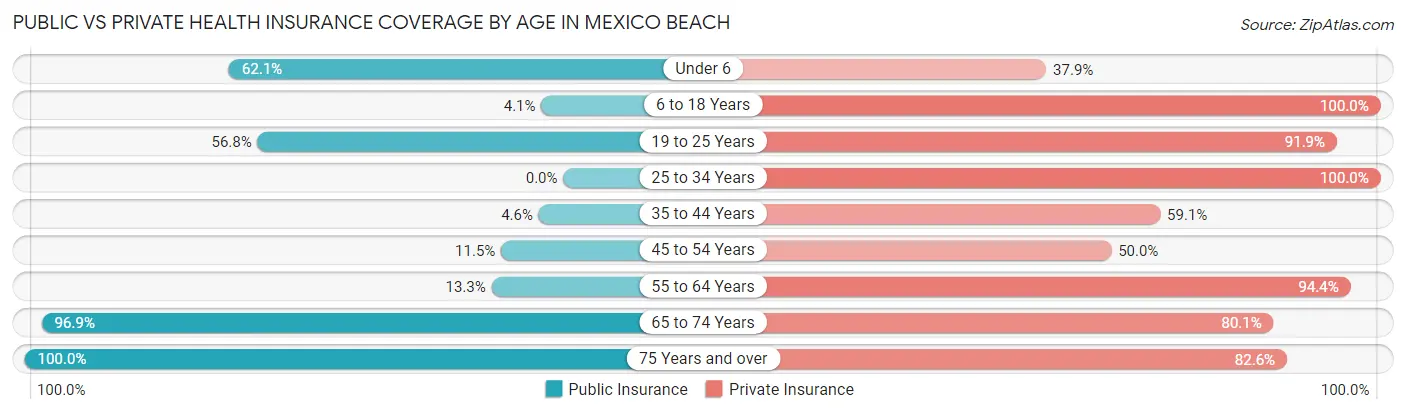
| Age Bracket | Public Insurance | Private Insurance |
| Under 6 | 36 (62.1%) | 22 (37.9%) |
| 6 to 18 Years | 2 (4.1%) | 49 (100.0%) |
| 19 to 25 Years | 21 (56.8%) | 34 (91.9%) |
| 25 to 34 Years | 0 (0.0%) | 19 (100.0%) |
| 35 to 44 Years | 4 (4.5%) | 52 (59.1%) |
| 45 to 54 Years | 24 (11.5%) | 104 (50.0%) |
| 55 to 64 Years | 24 (13.3%) | 170 (94.4%) |
| 65 to 74 Years | 278 (96.9%) | 230 (80.1%) |
| 75 Years and over | 115 (100.0%) | 95 (82.6%) |
| Total | 504 (48.4%) | 775 (74.5%) |
Disability Status by Sex by Age in Mexico Beach
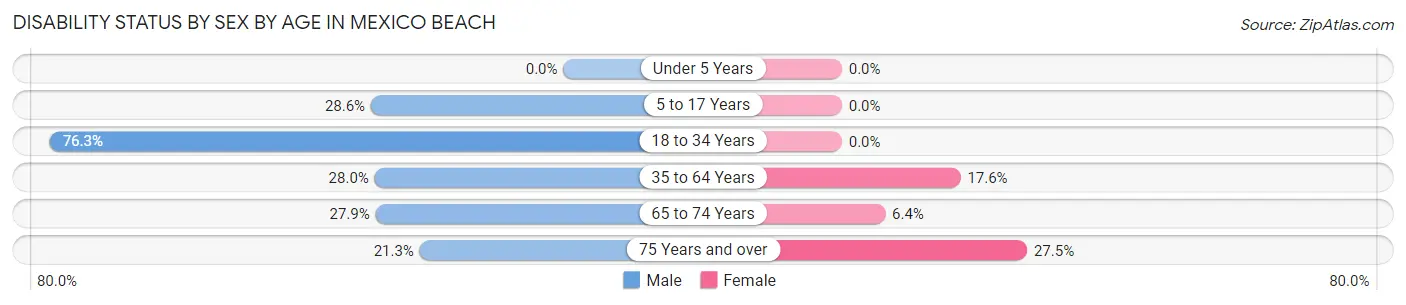
| Age Bracket | Male | Female |
| Under 5 Years | 0 (0.0%) | 0 (0.0%) |
| 5 to 17 Years | 2 (28.6%) | 0 (0.0%) |
| 18 to 34 Years | 45 (76.3%) | 0 (0.0%) |
| 35 to 64 Years | 65 (28.0%) | 43 (17.6%) |
| 65 to 74 Years | 41 (27.9%) | 9 (6.4%) |
| 75 Years and over | 16 (21.3%) | 11 (27.5%) |
Disability Class by Sex by Age in Mexico Beach
Disability Class: Hearing Difficulty
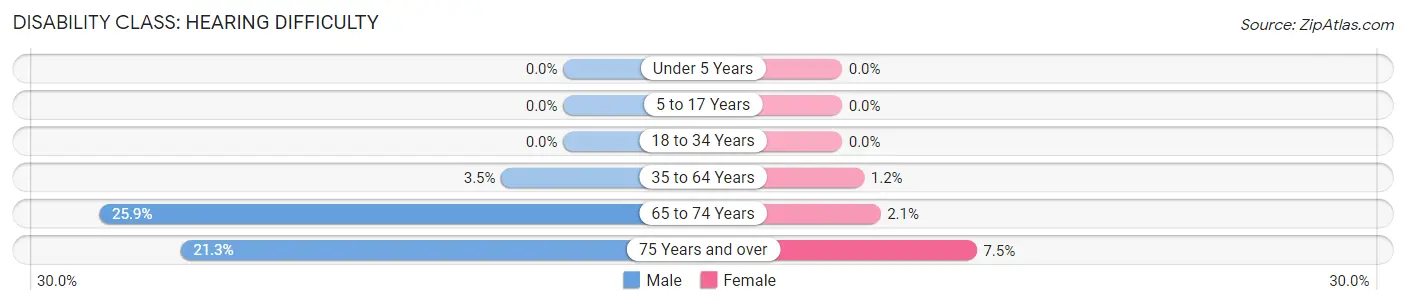
| Age Bracket | Male | Female |
| Under 5 Years | 0 (0.0%) | 0 (0.0%) |
| 5 to 17 Years | 0 (0.0%) | 0 (0.0%) |
| 18 to 34 Years | 0 (0.0%) | 0 (0.0%) |
| 35 to 64 Years | 8 (3.5%) | 3 (1.2%) |
| 65 to 74 Years | 38 (25.9%) | 3 (2.1%) |
| 75 Years and over | 16 (21.3%) | 3 (7.5%) |
Disability Class: Vision Difficulty
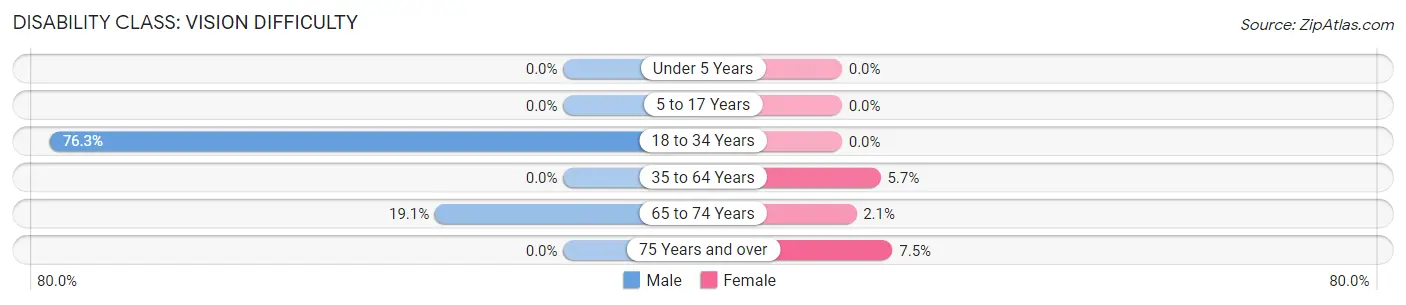
| Age Bracket | Male | Female |
| Under 5 Years | 0 (0.0%) | 0 (0.0%) |
| 5 to 17 Years | 0 (0.0%) | 0 (0.0%) |
| 18 to 34 Years | 45 (76.3%) | 0 (0.0%) |
| 35 to 64 Years | 0 (0.0%) | 14 (5.7%) |
| 65 to 74 Years | 28 (19.1%) | 3 (2.1%) |
| 75 Years and over | 0 (0.0%) | 3 (7.5%) |
Disability Class: Cognitive Difficulty
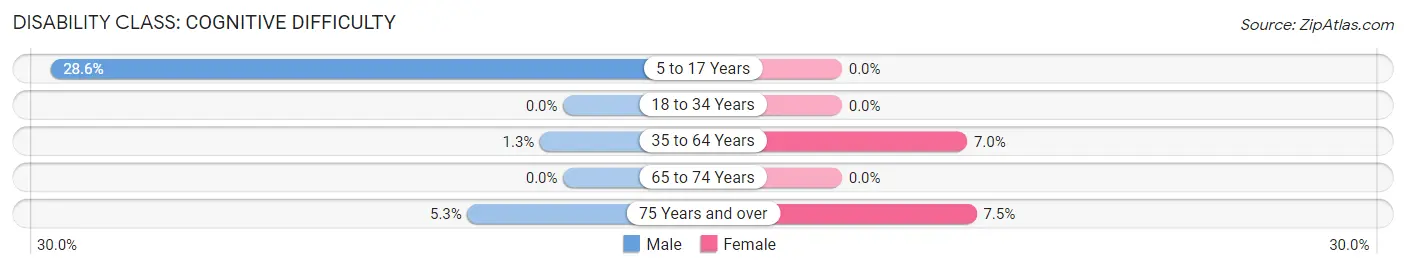
| Age Bracket | Male | Female |
| 5 to 17 Years | 2 (28.6%) | 0 (0.0%) |
| 18 to 34 Years | 0 (0.0%) | 0 (0.0%) |
| 35 to 64 Years | 3 (1.3%) | 17 (7.0%) |
| 65 to 74 Years | 0 (0.0%) | 0 (0.0%) |
| 75 Years and over | 4 (5.3%) | 3 (7.5%) |
Disability Class: Ambulatory Difficulty
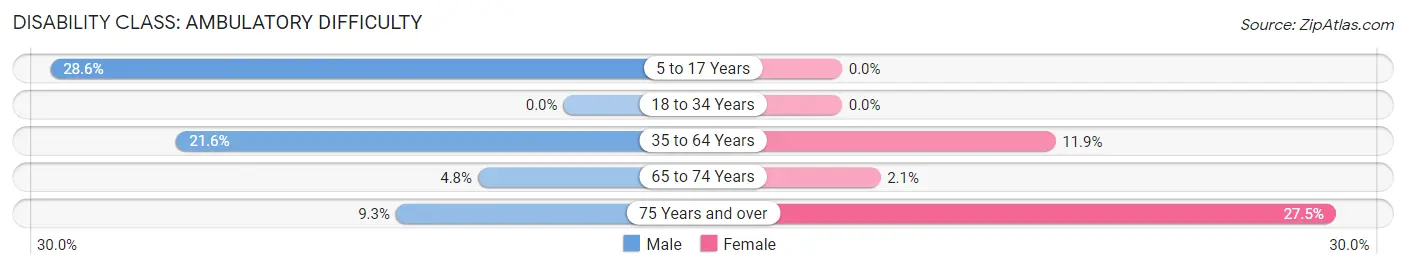
| Age Bracket | Male | Female |
| 5 to 17 Years | 2 (28.6%) | 0 (0.0%) |
| 18 to 34 Years | 0 (0.0%) | 0 (0.0%) |
| 35 to 64 Years | 50 (21.5%) | 29 (11.9%) |
| 65 to 74 Years | 7 (4.8%) | 3 (2.1%) |
| 75 Years and over | 7 (9.3%) | 11 (27.5%) |
Disability Class: Self-Care Difficulty
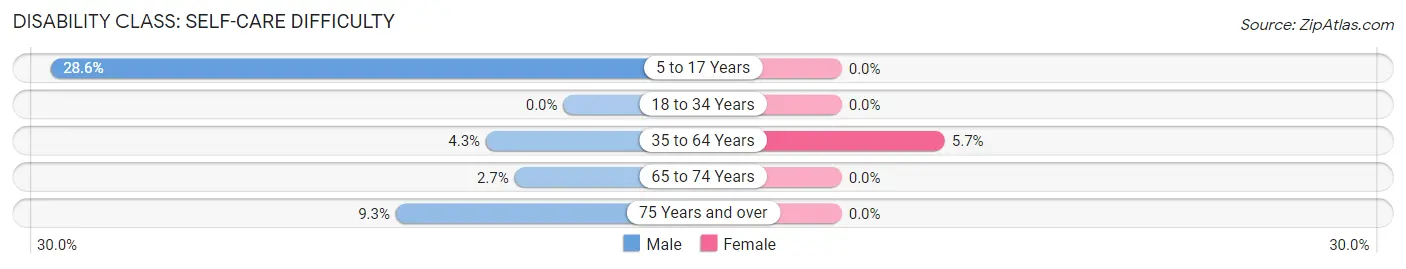
| Age Bracket | Male | Female |
| 5 to 17 Years | 2 (28.6%) | 0 (0.0%) |
| 18 to 34 Years | 0 (0.0%) | 0 (0.0%) |
| 35 to 64 Years | 10 (4.3%) | 14 (5.7%) |
| 65 to 74 Years | 4 (2.7%) | 0 (0.0%) |
| 75 Years and over | 7 (9.3%) | 0 (0.0%) |
Technology Access in Mexico Beach
Computing Device Access in Mexico Beach
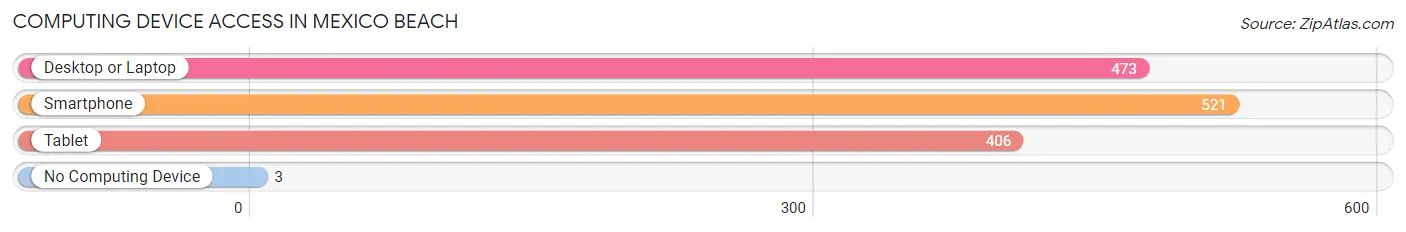
| Device Type | # Households | % Households |
| Desktop or Laptop | 473 | 81.3% |
| Smartphone | 521 | 89.5% |
| Tablet | 406 | 69.8% |
| No Computing Device | 3 | 0.5% |
| Total | 582 | 100.0% |
Internet Access in Mexico Beach
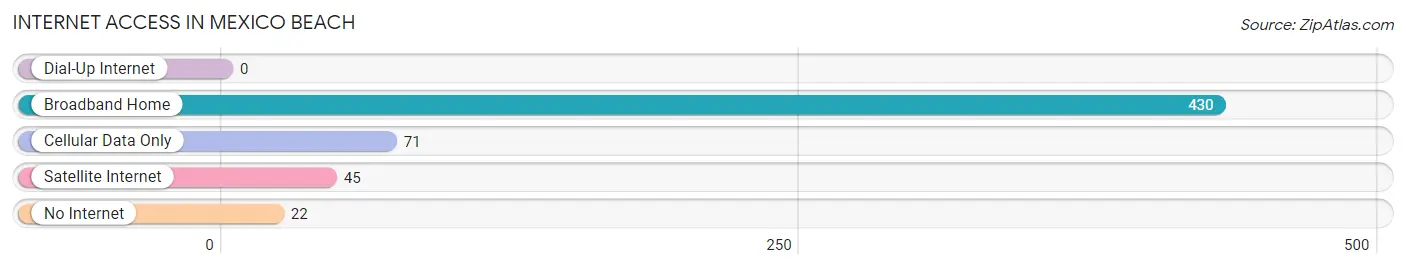
| Internet Type | # Households | % Households |
| Dial-Up Internet | 0 | 0.0% |
| Broadband Home | 430 | 73.9% |
| Cellular Data Only | 71 | 12.2% |
| Satellite Internet | 45 | 7.7% |
| No Internet | 22 | 3.8% |
| Total | 582 | 100.0% |
Mexico Beach Summary
History
Mexico Beach is a small town located in Bay County, Florida, United States. It is situated on the Gulf of Mexico, approximately 20 miles east of Panama City. The town was founded in the 1950s as a beach resort community. It was originally known as “St. Joe Beach”, but the name was changed to Mexico Beach in the 1960s.
The town was originally developed as a resort destination for tourists from the Midwest and Northeast. The town was designed to be a “little piece of Mexico”, with its white sand beaches, palm trees, and Mexican-style architecture. The town was also known for its fishing and shrimping industry.
In the 1970s, the town began to experience a decline in tourism due to the increasing popularity of other beach destinations in Florida. In the 1980s, the town was hit hard by Hurricane Elena, which caused extensive damage to the town’s infrastructure.
In the 1990s, the town began to experience a resurgence in tourism due to its proximity to Panama City and its white sand beaches. The town also began to attract retirees from the Midwest and Northeast.
Geography
Mexico Beach is located in Bay County, Florida, on the Gulf of Mexico. The town is situated on a peninsula, with the Gulf of Mexico to the south and St. Joseph Bay to the north. The town is approximately 20 miles east of Panama City.
The town is bordered by the cities of Port St. Joe and St. Joe Beach to the north, and the city of Panama City Beach to the south. The town is also bordered by the Gulf of Mexico to the west and St. Joseph Bay to the east.
The town has a total area of 2.2 square miles, all of which is land. The town has a humid subtropical climate, with hot, humid summers and mild winters.
Economy
The economy of Mexico Beach is largely based on tourism. The town is a popular destination for beachgoers, retirees, and vacationers from the Midwest and Northeast. The town is also known for its fishing and shrimping industry.
The town is home to several restaurants, hotels, and other businesses that cater to tourists. The town also has a marina, which provides access to the Gulf of Mexico for fishing and other recreational activities.
Demographics
As of the 2010 census, the population of Mexico Beach was 1,072. The population is predominantly white (94.3%), with a small percentage of African Americans (2.3%) and Hispanics (2.2%). The median age of the population is 57.
The median household income in Mexico Beach is $45,000, and the median home value is $250,000. The town has a high rate of homeownership (83.3%), and the unemployment rate is 4.2%.
Conclusion
Mexico Beach is a small town located in Bay County, Florida, on the Gulf of Mexico. The town was founded in the 1950s as a beach resort community, and it has since become a popular destination for tourists, retirees, and vacationers from the Midwest and Northeast. The town’s economy is largely based on tourism, and it is also known for its fishing and shrimping industry. The population of Mexico Beach is predominantly white, with a median age of 57 and a median household income of $45,000. The town has a high rate of homeownership and a low unemployment rate.
Common Questions
What is Per Capita Income in Mexico Beach?
Per Capita income in Mexico Beach is $48,275.
What is the Median Family Income in Mexico Beach?
Median Family Income in Mexico Beach is $83,672.
What is the Median Household income in Mexico Beach?
Median Household Income in Mexico Beach is $61,167.
What is Income or Wage Gap in Mexico Beach?
Income or Wage Gap in Mexico Beach is 45.6%.
Women in Mexico Beach earn 54.4 cents for every dollar earned by a man.
What is Inequality or Gini Index in Mexico Beach?
Inequality or Gini Index in Mexico Beach is 0.38.
What is the Total Population of Mexico Beach?
Total Population of Mexico Beach is 1,054.
What is the Total Male Population of Mexico Beach?
Total Male Population of Mexico Beach is 579.
What is the Total Female Population of Mexico Beach?
Total Female Population of Mexico Beach is 475.
What is the Ratio of Males per 100 Females in Mexico Beach?
There are 121.89 Males per 100 Females in Mexico Beach.
What is the Ratio of Females per 100 Males in Mexico Beach?
There are 82.04 Females per 100 Males in Mexico Beach.
What is the Median Population Age in Mexico Beach?
Median Population Age in Mexico Beach is 58.2 Years.
What is the Average Family Size in Mexico Beach
Average Family Size in Mexico Beach is 2.5 People.
What is the Average Household Size in Mexico Beach
Average Household Size in Mexico Beach is 1.8 People.
How Large is the Labor Force in Mexico Beach?
There are 472 People in the Labor Forcein in Mexico Beach.
What is the Percentage of People in the Labor Force in Mexico Beach?
47.7% of People are in the Labor Force in Mexico Beach.
What is the Unemployment Rate in Mexico Beach?
Unemployment Rate in Mexico Beach is 10.5%.