Merritt Island, FL Map & Demographics
Merritt Island Map
Merritt Island Overview
$48,751
PER CAPITA INCOME
$108,161
AVG FAMILY INCOME
$82,172
AVG HOUSEHOLD INCOME
24.7%
WAGE / INCOME GAP [ % ]
75.3¢/ $1
WAGE / INCOME GAP [ $ ]
$6,917
FAMILY INCOME DEFICIT
0.46
INEQUALITY / GINI INDEX
34,300
TOTAL POPULATION
17,207
MALE POPULATION
17,093
FEMALE POPULATION
100.67
MALES / 100 FEMALES
99.34
FEMALES / 100 MALES
50.2
MEDIAN AGE
3.1
AVG FAMILY SIZE
2.5
AVG HOUSEHOLD SIZE
16,381
LABOR FORCE [ PEOPLE ]
56.2%
PERCENT IN LABOR FORCE
4.2%
UNEMPLOYMENT RATE
Merritt Island Area Codes
Income in Merritt Island
Income Overview in Merritt Island
Per Capita Income in Merritt Island is $48,751, while median incomes of families and households are $108,161 and $82,172 respectively.
| Characteristic | Number | Measure |
| Per Capita Income | 34,300 | $48,751 |
| Median Family Income | 8,899 | $108,161 |
| Mean Family Income | 8,899 | $144,493 |
| Median Household Income | 13,687 | $82,172 |
| Mean Household Income | 13,687 | $116,942 |
| Income Deficit | 8,899 | $6,917 |
| Wage / Income Gap (%) | 34,300 | 24.66% |
| Wage / Income Gap ($) | 34,300 | 75.34¢ per $1 |
| Gini / Inequality Index | 34,300 | 0.46 |
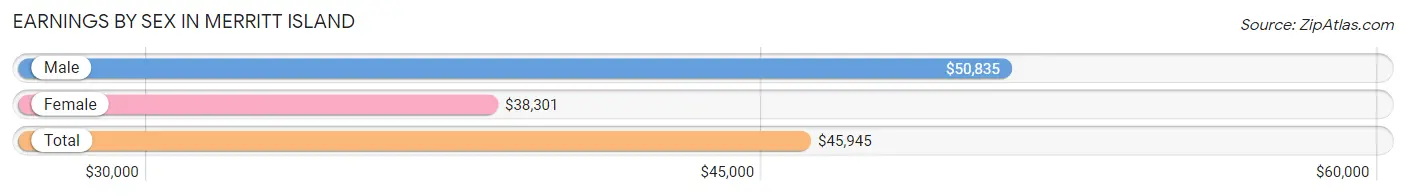
Earnings by Sex in Merritt Island
Average Earnings in Merritt Island are $45,945, $50,835 for men and $38,301 for women, a difference of 24.7%.
| Sex | Number | Average Earnings |
| Male | 9,567 (55.5%) | $50,835 |
| Female | 7,664 (44.5%) | $38,301 |
| Total | 17,231 (100.0%) | $45,945 |
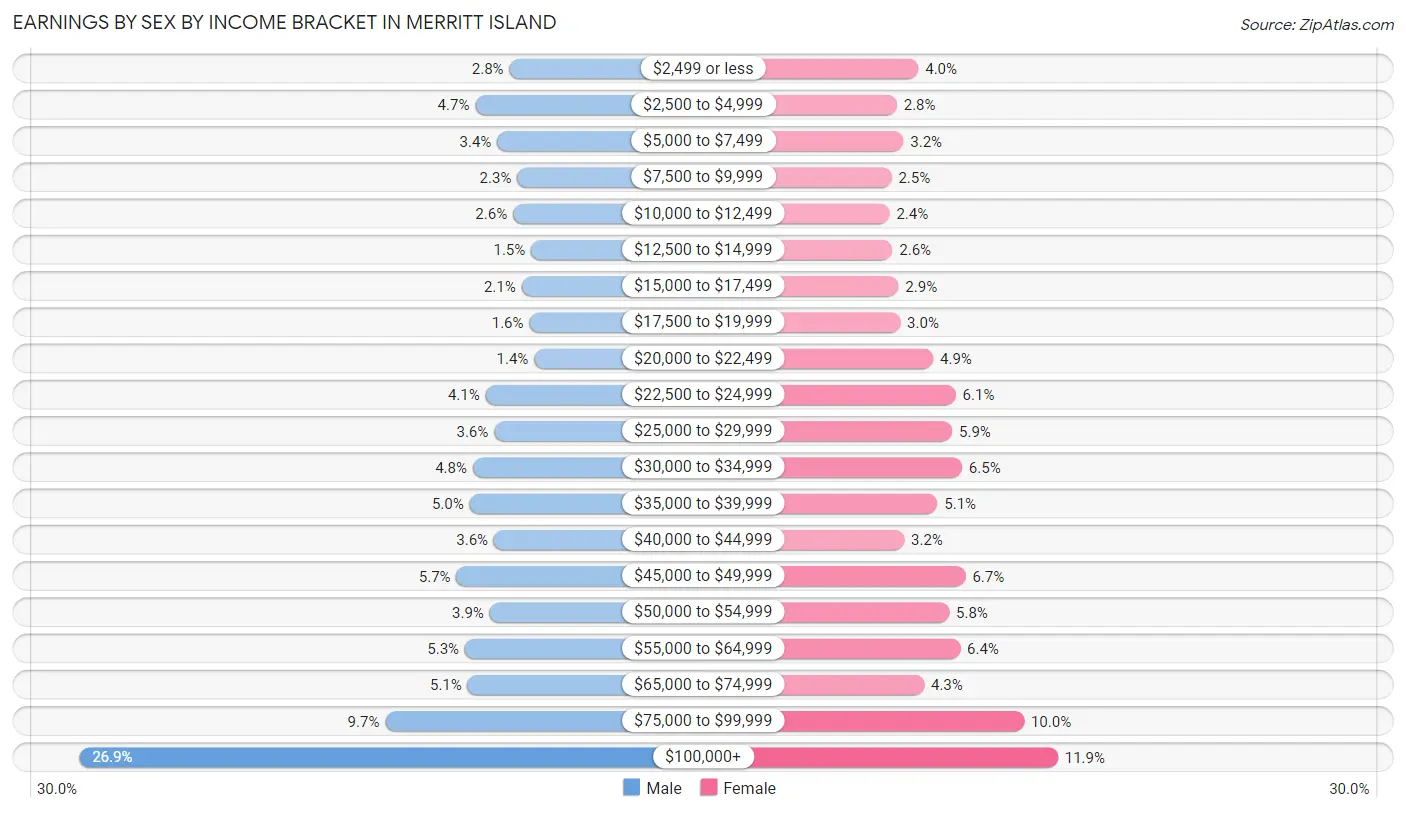
Earnings by Sex by Income Bracket in Merritt Island
The most common earnings brackets in Merritt Island are $100,000+ for men (2,576 | 26.9%) and $100,000+ for women (909 | 11.9%).
| Income | Male | Female |
| $2,499 or less | 263 (2.8%) | 308 (4.0%) |
| $2,500 to $4,999 | 447 (4.7%) | 215 (2.8%) |
| $5,000 to $7,499 | 329 (3.4%) | 244 (3.2%) |
| $7,500 to $9,999 | 221 (2.3%) | 192 (2.5%) |
| $10,000 to $12,499 | 244 (2.5%) | 184 (2.4%) |
| $12,500 to $14,999 | 146 (1.5%) | 196 (2.6%) |
| $15,000 to $17,499 | 198 (2.1%) | 222 (2.9%) |
| $17,500 to $19,999 | 156 (1.6%) | 230 (3.0%) |
| $20,000 to $22,499 | 130 (1.4%) | 372 (4.9%) |
| $22,500 to $24,999 | 391 (4.1%) | 469 (6.1%) |
| $25,000 to $29,999 | 345 (3.6%) | 454 (5.9%) |
| $30,000 to $34,999 | 460 (4.8%) | 496 (6.5%) |
| $35,000 to $39,999 | 477 (5.0%) | 390 (5.1%) |
| $40,000 to $44,999 | 346 (3.6%) | 247 (3.2%) |
| $45,000 to $49,999 | 548 (5.7%) | 511 (6.7%) |
| $50,000 to $54,999 | 369 (3.9%) | 441 (5.8%) |
| $55,000 to $64,999 | 502 (5.2%) | 488 (6.4%) |
| $65,000 to $74,999 | 488 (5.1%) | 333 (4.3%) |
| $75,000 to $99,999 | 931 (9.7%) | 763 (10.0%) |
| $100,000+ | 2,576 (26.9%) | 909 (11.9%) |
| Total | 9,567 (100.0%) | 7,664 (100.0%) |
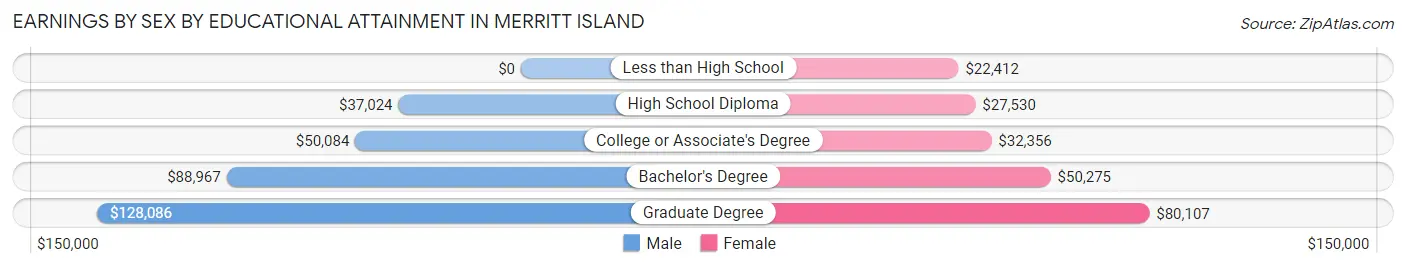
Earnings by Sex by Educational Attainment in Merritt Island
Average earnings in Merritt Island are $60,808 for men and $41,889 for women, a difference of 31.1%. Men with an educational attainment of graduate degree enjoy the highest average annual earnings of $128,086, while those with high school diploma education earn the least with $37,024. Women with an educational attainment of graduate degree earn the most with the average annual earnings of $80,107, while those with less than high school education have the smallest earnings of $22,412.
| Educational Attainment | Male Income | Female Income |
| Less than High School | - | - |
| High School Diploma | $37,024 | $27,530 |
| College or Associate's Degree | $50,084 | $32,356 |
| Bachelor's Degree | $88,967 | $50,275 |
| Graduate Degree | $128,086 | $80,107 |
| Total | $60,808 | $41,889 |
Family Income in Merritt Island
Family Income Brackets in Merritt Island
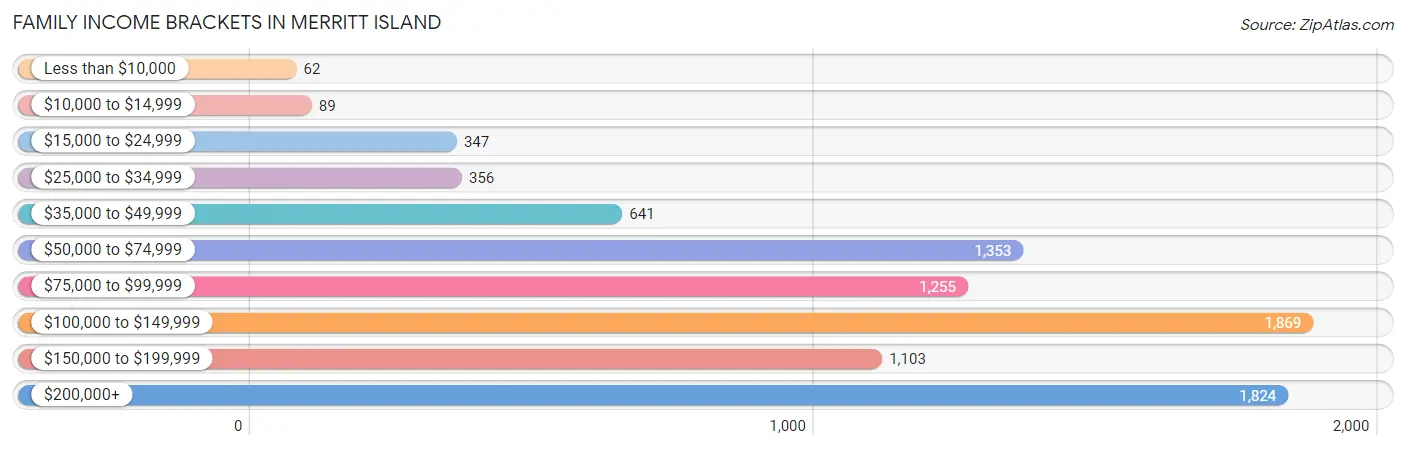
According to the Merritt Island family income data, there are 1,869 families falling into the $100,000 to $149,999 income range, which is the most common income bracket and makes up 21.0% of all families. Conversely, the less than $10,000 income bracket is the least frequent group with only 62 families (0.7%) belonging to this category.
| Income Bracket | # Families | % Families |
| Less than $10,000 | 62 | 0.7% |
| $10,000 to $14,999 | 89 | 1.0% |
| $15,000 to $24,999 | 347 | 3.9% |
| $25,000 to $34,999 | 356 | 4.0% |
| $35,000 to $49,999 | 641 | 7.2% |
| $50,000 to $74,999 | 1,353 | 15.2% |
| $75,000 to $99,999 | 1,255 | 14.1% |
| $100,000 to $149,999 | 1,869 | 21.0% |
| $150,000 to $199,999 | 1,103 | 12.4% |
| $200,000+ | 1,824 | 20.5% |
Family Income by Famaliy Size in Merritt Island
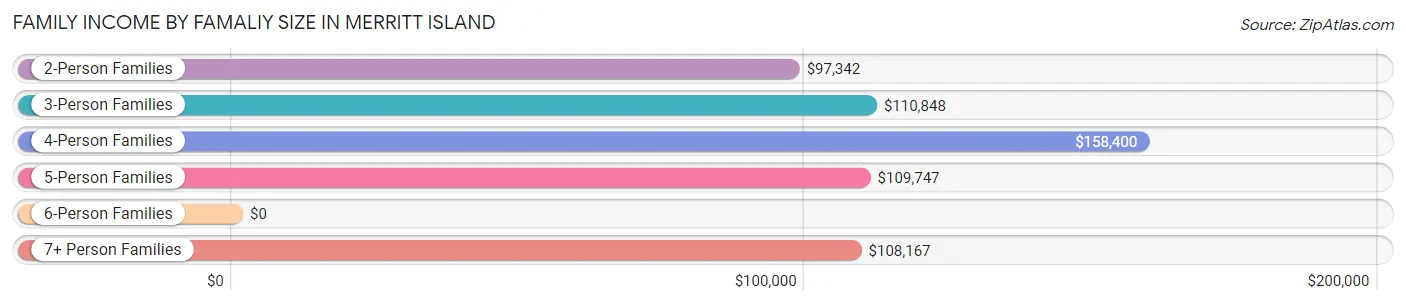
4-person families (1,246 | 14.0%) account for the highest median family income in Merritt Island with $158,400 per family, while 2-person families (5,259 | 59.1%) have the highest median income of $48,671 per family member.
| Income Bracket | # Families | Median Income |
| 2-Person Families | 5,259 (59.1%) | $97,342 |
| 3-Person Families | 1,362 (15.3%) | $110,848 |
| 4-Person Families | 1,246 (14.0%) | $158,400 |
| 5-Person Families | 754 (8.5%) | $109,747 |
| 6-Person Families | 136 (1.5%) | $0 |
| 7+ Person Families | 142 (1.6%) | $108,167 |
| Total | 8,899 (100.0%) | $108,161 |
Family Income by Number of Earners in Merritt Island
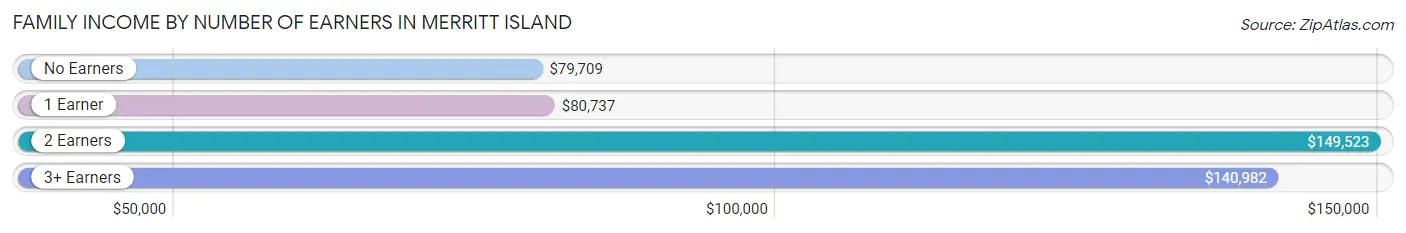
The median family income in Merritt Island is $108,161, with families comprising 2 earners (3,263) having the highest median family income of $149,523, while families with no earners (1,982) have the lowest median family income of $79,709, accounting for 36.7% and 22.3% of families, respectively.
| Number of Earners | # Families | Median Income |
| No Earners | 1,982 (22.3%) | $79,709 |
| 1 Earner | 2,795 (31.4%) | $80,737 |
| 2 Earners | 3,263 (36.7%) | $149,523 |
| 3+ Earners | 859 (9.7%) | $140,982 |
| Total | 8,899 (100.0%) | $108,161 |
Household Income in Merritt Island
Household Income Brackets in Merritt Island
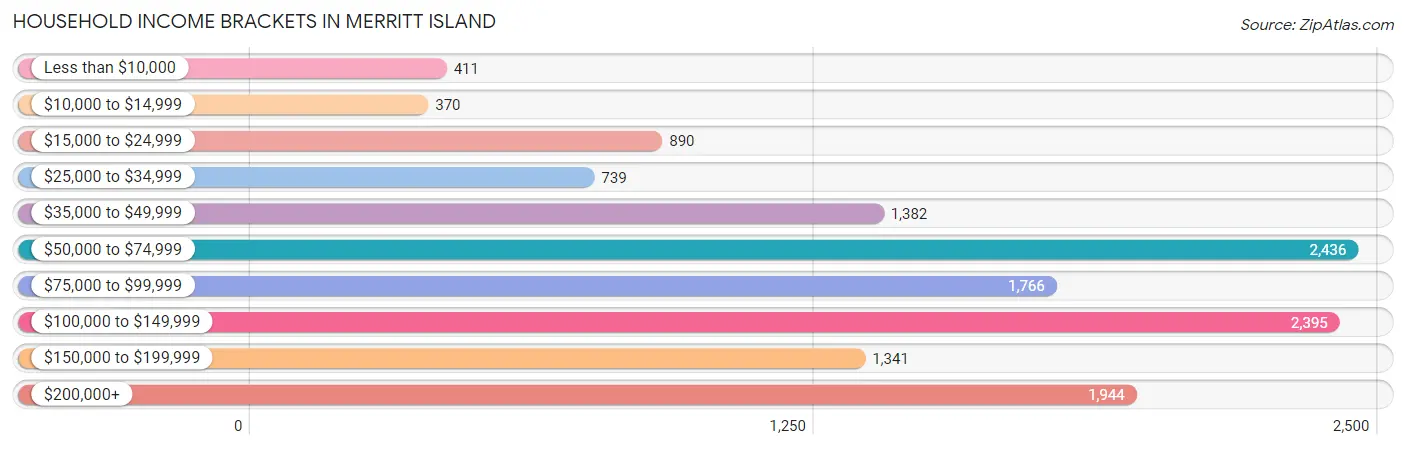
With 2,436 households falling in the category, the $50,000 to $74,999 income range is the most frequent in Merritt Island, accounting for 17.8% of all households. In contrast, only 370 households (2.7%) fall into the $10,000 to $14,999 income bracket, making it the least populous group.
| Income Bracket | # Households | % Households |
| Less than $10,000 | 411 | 3.0% |
| $10,000 to $14,999 | 370 | 2.7% |
| $15,000 to $24,999 | 890 | 6.5% |
| $25,000 to $34,999 | 739 | 5.4% |
| $35,000 to $49,999 | 1,382 | 10.1% |
| $50,000 to $74,999 | 2,436 | 17.8% |
| $75,000 to $99,999 | 1,766 | 12.9% |
| $100,000 to $149,999 | 2,395 | 17.5% |
| $150,000 to $199,999 | 1,341 | 9.8% |
| $200,000+ | 1,944 | 14.2% |
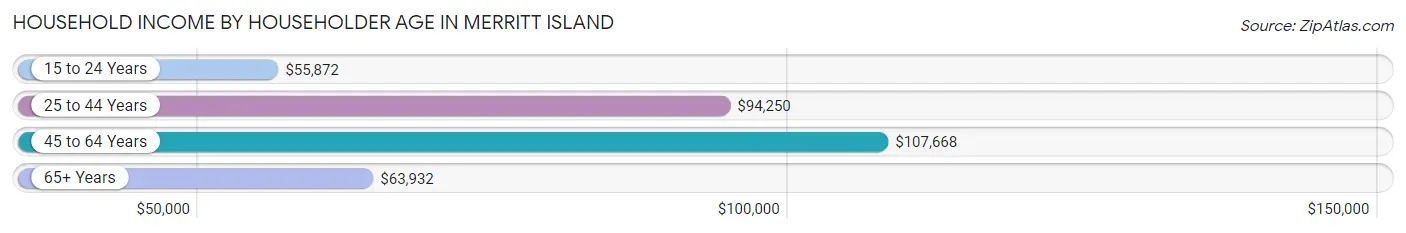
Household Income by Householder Age in Merritt Island
The median household income in Merritt Island is $82,172, with the highest median household income of $107,668 found in the 45 to 64 years age bracket for the primary householder. A total of 5,650 households (41.3%) fall into this category. Meanwhile, the 15 to 24 years age bracket for the primary householder has the lowest median household income of $55,872, with 110 households (0.8%) in this group.
| Income Bracket | # Households | Median Income |
| 15 to 24 Years | 110 (0.8%) | $55,872 |
| 25 to 44 Years | 2,780 (20.3%) | $94,250 |
| 45 to 64 Years | 5,650 (41.3%) | $107,668 |
| 65+ Years | 5,147 (37.6%) | $63,932 |
| Total | 13,687 (100.0%) | $82,172 |
Poverty in Merritt Island
Income Below Poverty by Sex and Age in Merritt Island
With 6.0% poverty level for males and 7.0% for females among the residents of Merritt Island, 15 year old males and 5 year old females are the most vulnerable to poverty, with 77 males (31.2%) and 31 females (9.6%) in their respective age groups living below the poverty level.
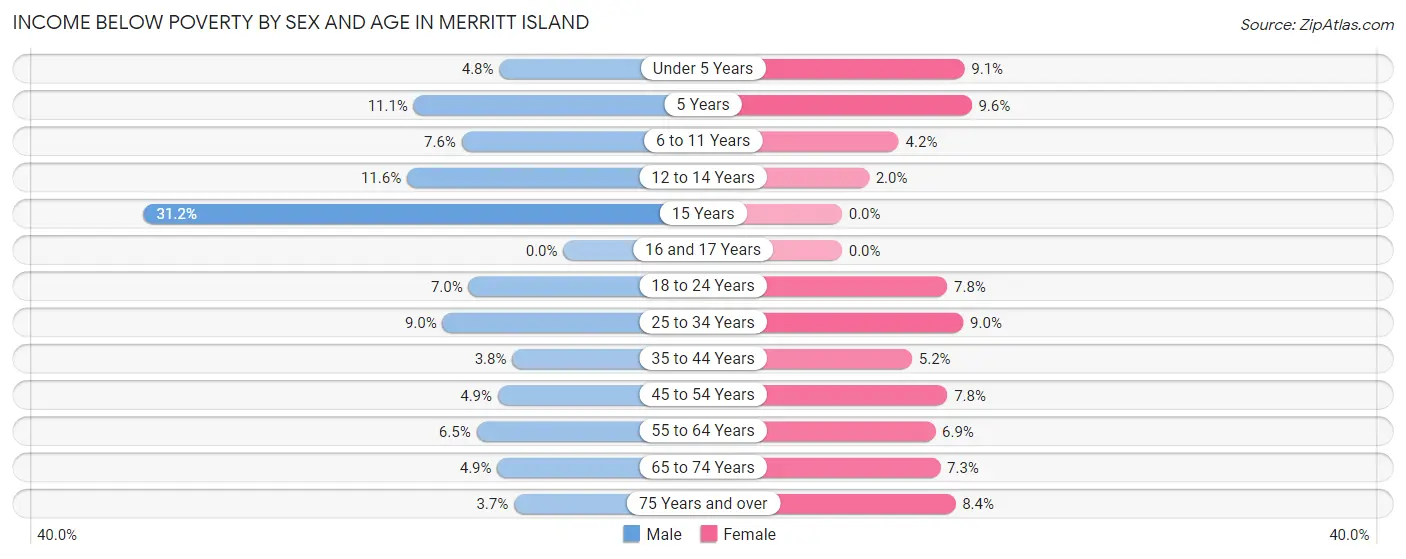
| Age Bracket | Male | Female |
| Under 5 Years | 38 (4.8%) | 69 (9.1%) |
| 5 Years | 10 (11.1%) | 31 (9.6%) |
| 6 to 11 Years | 56 (7.5%) | 39 (4.2%) |
| 12 to 14 Years | 67 (11.6%) | 10 (2.0%) |
| 15 Years | 77 (31.2%) | 0 (0.0%) |
| 16 and 17 Years | 0 (0.0%) | 0 (0.0%) |
| 18 to 24 Years | 103 (7.0%) | 67 (7.8%) |
| 25 to 34 Years | 138 (9.0%) | 138 (9.0%) |
| 35 to 44 Years | 67 (3.8%) | 89 (5.2%) |
| 45 to 54 Years | 112 (4.9%) | 186 (7.8%) |
| 55 to 64 Years | 174 (6.5%) | 217 (6.9%) |
| 65 to 74 Years | 113 (4.9%) | 159 (7.3%) |
| 75 Years and over | 71 (3.7%) | 180 (8.4%) |
| Total | 1,026 (6.0%) | 1,185 (7.0%) |
Income Above Poverty by Sex and Age in Merritt Island
According to the poverty statistics in Merritt Island, males aged 16 and 17 years and females aged 15 years are the age groups that are most secure financially, with 100.0% of males and 100.0% of females in these age groups living above the poverty line.
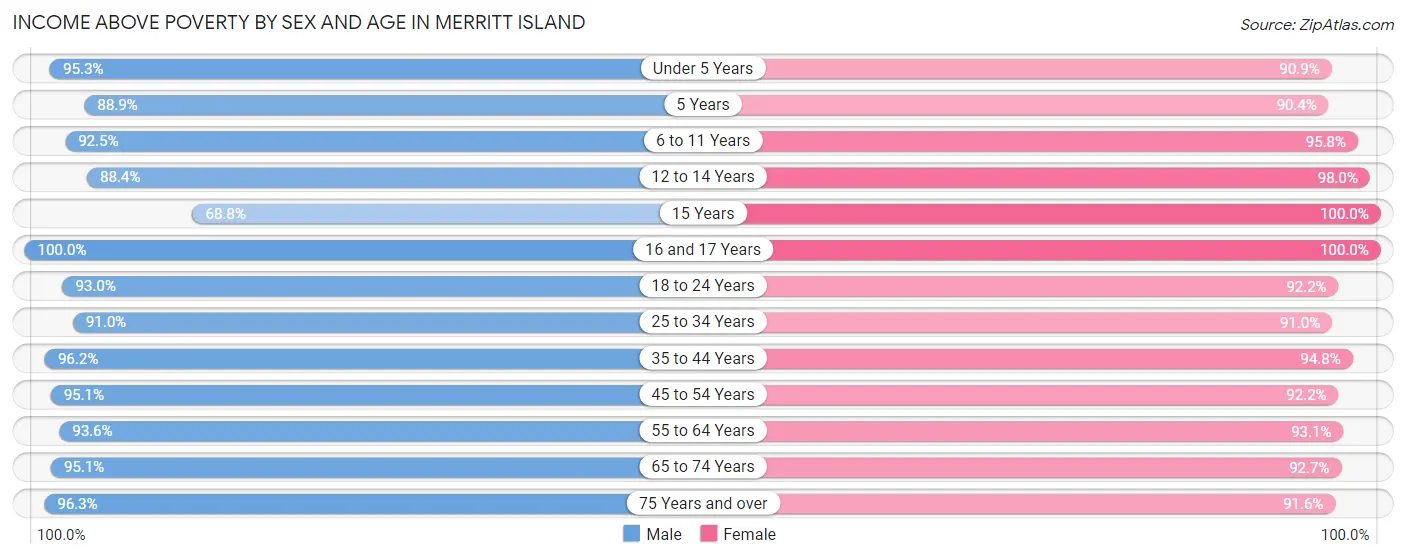
| Age Bracket | Male | Female |
| Under 5 Years | 762 (95.3%) | 689 (90.9%) |
| 5 Years | 80 (88.9%) | 291 (90.4%) |
| 6 to 11 Years | 686 (92.4%) | 886 (95.8%) |
| 12 to 14 Years | 510 (88.4%) | 491 (98.0%) |
| 15 Years | 170 (68.8%) | 124 (100.0%) |
| 16 and 17 Years | 552 (100.0%) | 292 (100.0%) |
| 18 to 24 Years | 1,360 (93.0%) | 790 (92.2%) |
| 25 to 34 Years | 1,400 (91.0%) | 1,394 (91.0%) |
| 35 to 44 Years | 1,700 (96.2%) | 1,621 (94.8%) |
| 45 to 54 Years | 2,191 (95.1%) | 2,189 (92.2%) |
| 55 to 64 Years | 2,525 (93.5%) | 2,914 (93.1%) |
| 65 to 74 Years | 2,193 (95.1%) | 2,020 (92.7%) |
| 75 Years and over | 1,869 (96.3%) | 1,958 (91.6%) |
| Total | 15,998 (94.0%) | 15,659 (93.0%) |
Income Below Poverty Among Married-Couple Families in Merritt Island
The poverty statistics for married-couple families in Merritt Island show that 2.0% or 153 of the total 7,495 families live below the poverty line. Families with 1 or 2 children have the highest poverty rate of 3.4%, comprising of 66 families. On the other hand, families with 3 or 4 children have the lowest poverty rate of 0.0%, which includes 0 families.
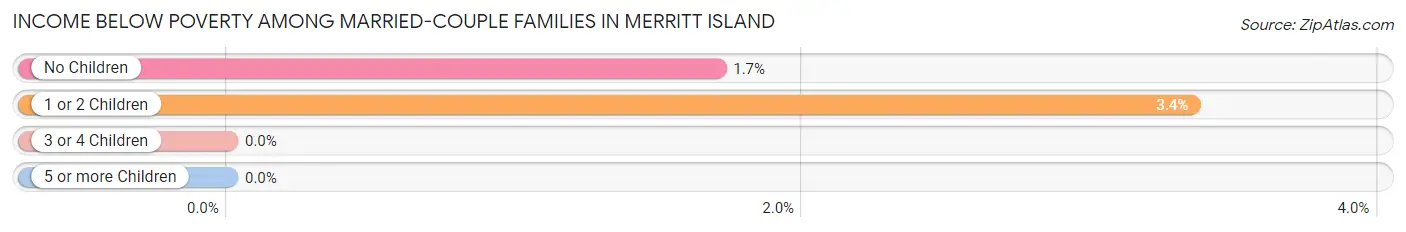
| Children | Above Poverty | Below Poverty |
| No Children | 5,032 (98.3%) | 87 (1.7%) |
| 1 or 2 Children | 1,906 (96.7%) | 66 (3.4%) |
| 3 or 4 Children | 370 (100.0%) | 0 (0.0%) |
| 5 or more Children | 34 (100.0%) | 0 (0.0%) |
| Total | 7,342 (98.0%) | 153 (2.0%) |
Income Below Poverty Among Single-Parent Households in Merritt Island
According to the poverty data in Merritt Island, 14.5% or 62 single-father households and 17.3% or 169 single-mother households are living below the poverty line. Among single-father households, those with no children have the highest poverty rate, with 55 households (16.4%) experiencing poverty. Likewise, among single-mother households, those with 3 or 4 children have the highest poverty rate, with 31 households (57.4%) falling below the poverty line.
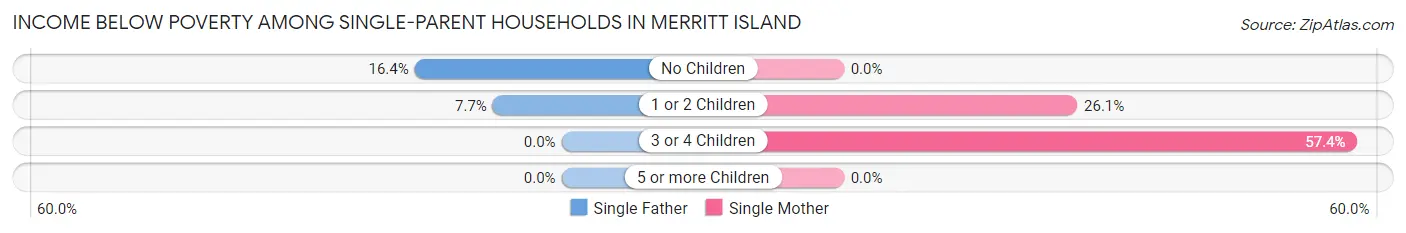
| Children | Single Father | Single Mother |
| No Children | 55 (16.4%) | 0 (0.0%) |
| 1 or 2 Children | 7 (7.7%) | 138 (26.1%) |
| 3 or 4 Children | 0 (0.0%) | 31 (57.4%) |
| 5 or more Children | 0 (0.0%) | 0 (0.0%) |
| Total | 62 (14.5%) | 169 (17.3%) |
Income Below Poverty Among Married-Couple vs Single-Parent Households in Merritt Island
The poverty data for Merritt Island shows that 153 of the married-couple family households (2.0%) and 231 of the single-parent households (16.5%) are living below the poverty level. Within the married-couple family households, those with 1 or 2 children have the highest poverty rate, with 66 households (3.4%) falling below the poverty line. Among the single-parent households, those with 3 or 4 children have the highest poverty rate, with 31 household (57.4%) living below poverty.
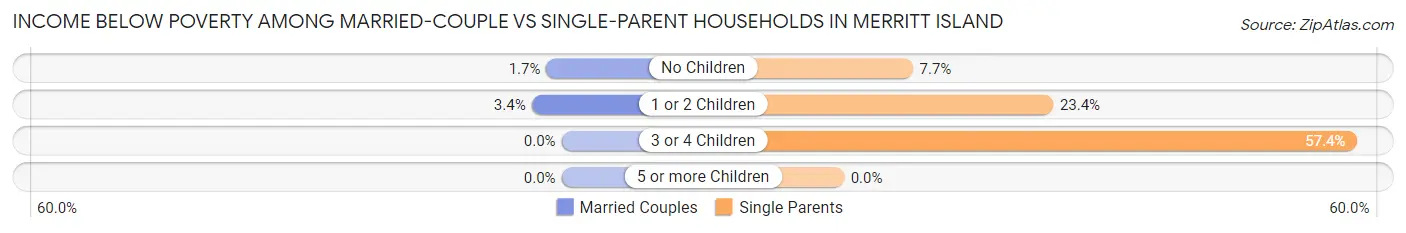
| Children | Married-Couple Families | Single-Parent Households |
| No Children | 87 (1.7%) | 55 (7.7%) |
| 1 or 2 Children | 66 (3.4%) | 145 (23.4%) |
| 3 or 4 Children | 0 (0.0%) | 31 (57.4%) |
| 5 or more Children | 0 (0.0%) | 0 (0.0%) |
| Total | 153 (2.0%) | 231 (16.5%) |
Race in Merritt Island
The most populous races in Merritt Island are White / Caucasian (29,919 | 87.2%), Hispanic or Latino (2,419 | 7.0%), and Two or more Races (1,918 | 5.6%).
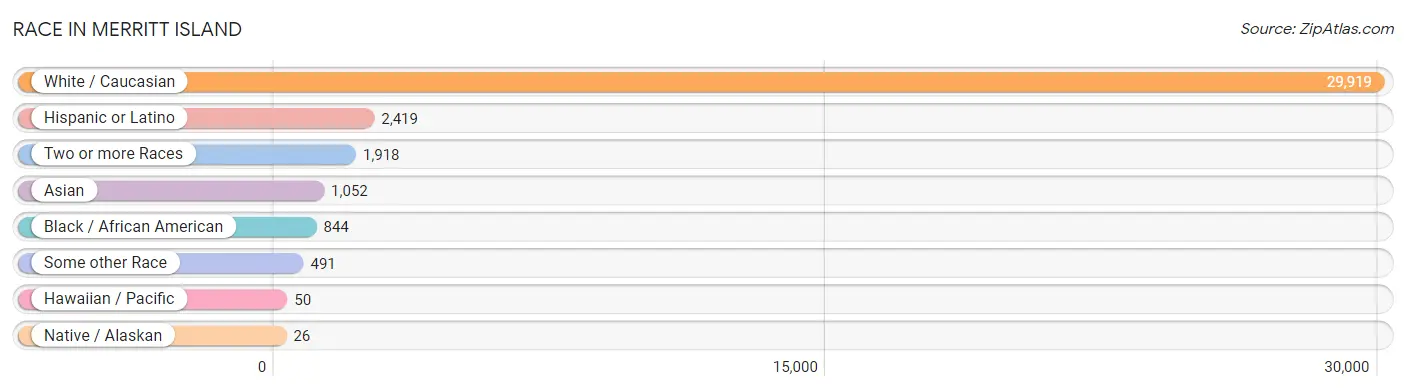
| Race | # Population | % Population |
| Asian | 1,052 | 3.1% |
| Black / African American | 844 | 2.5% |
| Hawaiian / Pacific | 50 | 0.2% |
| Hispanic or Latino | 2,419 | 7.0% |
| Native / Alaskan | 26 | 0.1% |
| White / Caucasian | 29,919 | 87.2% |
| Two or more Races | 1,918 | 5.6% |
| Some other Race | 491 | 1.4% |
| Total | 34,300 | 100.0% |
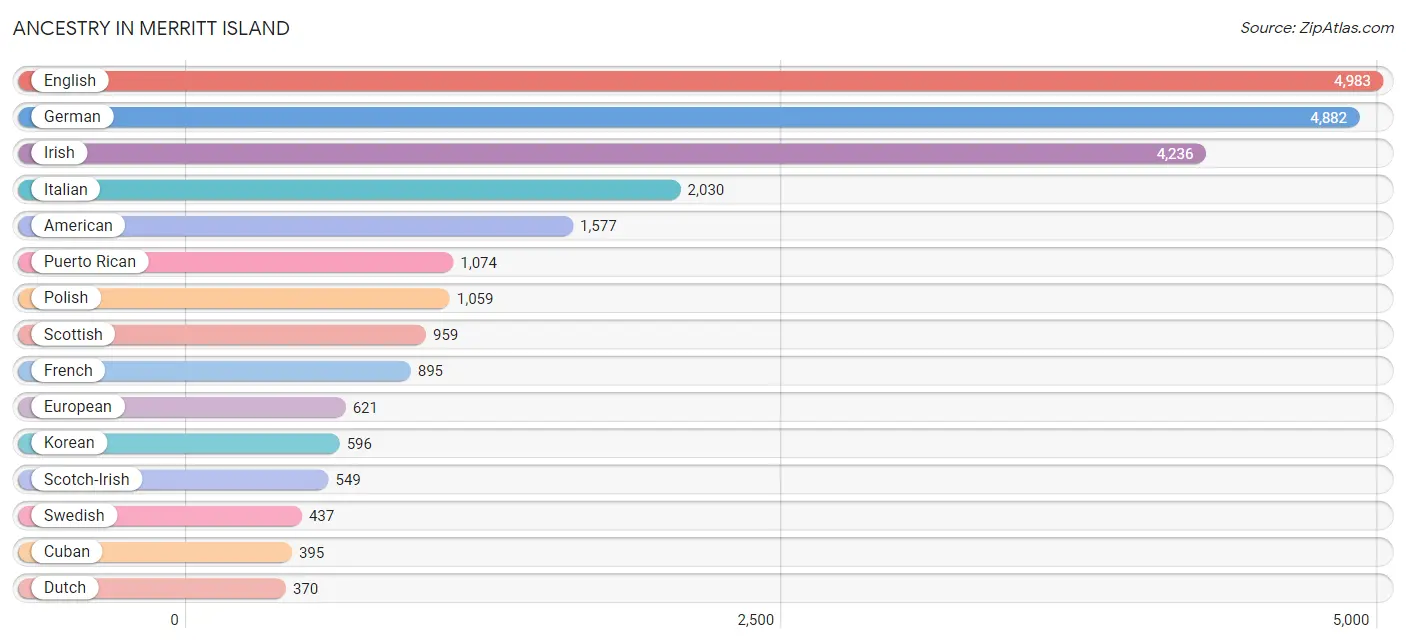
Ancestry in Merritt Island
The most populous ancestries reported in Merritt Island are English (4,983 | 14.5%), German (4,882 | 14.2%), Irish (4,236 | 12.3%), Italian (2,030 | 5.9%), and American (1,577 | 4.6%), together accounting for 51.6% of all Merritt Island residents.
| Ancestry | # Population | % Population |
| African | 18 | 0.1% |
| American | 1,577 | 4.6% |
| Apache | 22 | 0.1% |
| Arab | 33 | 0.1% |
| Argentinean | 69 | 0.2% |
| Armenian | 21 | 0.1% |
| Australian | 14 | 0.0% |
| Austrian | 145 | 0.4% |
| Bahamian | 11 | 0.0% |
| Basque | 22 | 0.1% |
| Belgian | 9 | 0.0% |
| Bhutanese | 56 | 0.2% |
| Blackfeet | 15 | 0.0% |
| Brazilian | 131 | 0.4% |
| British | 254 | 0.7% |
| British West Indian | 12 | 0.0% |
| Bulgarian | 7 | 0.0% |
| Burmese | 149 | 0.4% |
| Canadian | 134 | 0.4% |
| Celtic | 6 | 0.0% |
| Central American | 115 | 0.3% |
| Cherokee | 129 | 0.4% |
| Chilean | 30 | 0.1% |
| Colombian | 93 | 0.3% |
| Crow | 15 | 0.0% |
| Cuban | 395 | 1.1% |
| Czech | 15 | 0.0% |
| Czechoslovakian | 35 | 0.1% |
| Danish | 54 | 0.2% |
| Dominican | 73 | 0.2% |
| Dutch | 370 | 1.1% |
| Eastern European | 200 | 0.6% |
| English | 4,983 | 14.5% |
| Estonian | 21 | 0.1% |
| European | 621 | 1.8% |
| Finnish | 51 | 0.2% |
| French | 895 | 2.6% |
| French Canadian | 187 | 0.5% |
| German | 4,882 | 14.2% |
| Greek | 205 | 0.6% |
| Guatemalan | 59 | 0.2% |
| Haitian | 50 | 0.2% |
| Honduran | 16 | 0.1% |
| Hungarian | 227 | 0.7% |
| Icelander | 13 | 0.0% |
| Indian (Asian) | 326 | 0.9% |
| Iranian | 9 | 0.0% |
| Irish | 4,236 | 12.3% |
| Iroquois | 3 | 0.0% |
| Israeli | 1 | 0.0% |
| Italian | 2,030 | 5.9% |
| Jamaican | 35 | 0.1% |
| Korean | 596 | 1.7% |
| Laotian | 20 | 0.1% |
| Lebanese | 24 | 0.1% |
| Lithuanian | 108 | 0.3% |
| Luxembourger | 11 | 0.0% |
| Maltese | 15 | 0.0% |
| Mexican | 322 | 0.9% |
| Mexican American Indian | 26 | 0.1% |
| Native Hawaiian | 32 | 0.1% |
| Navajo | 4 | 0.0% |
| Nicaraguan | 14 | 0.0% |
| Northern European | 12 | 0.0% |
| Norwegian | 262 | 0.8% |
| Pakistani | 47 | 0.1% |
| Pennsylvania German | 53 | 0.2% |
| Peruvian | 8 | 0.0% |
| Polish | 1,059 | 3.1% |
| Portuguese | 91 | 0.3% |
| Puerto Rican | 1,074 | 3.1% |
| Romanian | 150 | 0.4% |
| Russian | 307 | 0.9% |
| Salvadoran | 26 | 0.1% |
| Scandinavian | 176 | 0.5% |
| Scotch-Irish | 549 | 1.6% |
| Scottish | 959 | 2.8% |
| Serbian | 16 | 0.1% |
| Slovak | 30 | 0.1% |
| Slovene | 62 | 0.2% |
| South African | 16 | 0.1% |
| South American | 249 | 0.7% |
| Spaniard | 28 | 0.1% |
| Spanish | 24 | 0.1% |
| Sri Lankan | 246 | 0.7% |
| Subsaharan African | 63 | 0.2% |
| Swedish | 437 | 1.3% |
| Swiss | 195 | 0.6% |
| Syrian | 9 | 0.0% |
| Thai | 66 | 0.2% |
| Tohono O'Odham | 4 | 0.0% |
| Trinidadian and Tobagonian | 63 | 0.2% |
| Ugandan | 29 | 0.1% |
| Ukrainian | 74 | 0.2% |
| Venezuelan | 49 | 0.1% |
| Welsh | 244 | 0.7% |
| West Indian | 30 | 0.1% | View All 97 Rows |
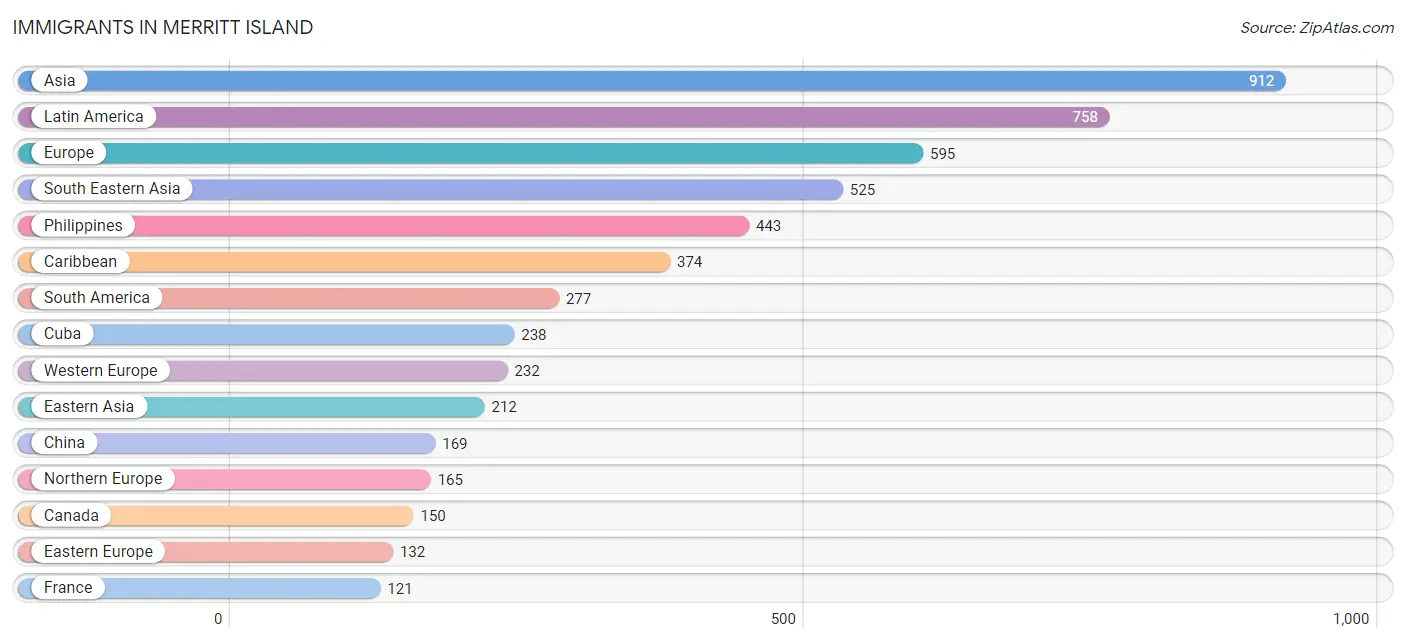
Immigrants in Merritt Island
The most numerous immigrant groups reported in Merritt Island came from Asia (912 | 2.7%), Latin America (758 | 2.2%), Europe (595 | 1.7%), South Eastern Asia (525 | 1.5%), and Philippines (443 | 1.3%), together accounting for 9.4% of all Merritt Island residents.
| Immigration Origin | # Population | % Population |
| Africa | 28 | 0.1% |
| Argentina | 16 | 0.1% |
| Asia | 912 | 2.7% |
| Austria | 6 | 0.0% |
| Bahamas | 5 | 0.0% |
| Bolivia | 8 | 0.0% |
| Brazil | 35 | 0.1% |
| Canada | 150 | 0.4% |
| Caribbean | 374 | 1.1% |
| Central America | 107 | 0.3% |
| Chile | 36 | 0.1% |
| China | 169 | 0.5% |
| Colombia | 92 | 0.3% |
| Cuba | 238 | 0.7% |
| Czechoslovakia | 13 | 0.0% |
| Dominican Republic | 14 | 0.0% |
| Eastern Africa | 12 | 0.0% |
| Eastern Asia | 212 | 0.6% |
| Eastern Europe | 132 | 0.4% |
| El Salvador | 12 | 0.0% |
| England | 32 | 0.1% |
| Europe | 595 | 1.7% |
| France | 121 | 0.4% |
| Germany | 51 | 0.2% |
| Grenada | 12 | 0.0% |
| Guatemala | 39 | 0.1% |
| Haiti | 50 | 0.2% |
| Honduras | 9 | 0.0% |
| Hong Kong | 11 | 0.0% |
| India | 45 | 0.1% |
| Iran | 9 | 0.0% |
| Ireland | 30 | 0.1% |
| Israel | 1 | 0.0% |
| Italy | 51 | 0.2% |
| Jamaica | 2 | 0.0% |
| Japan | 16 | 0.1% |
| Jordan | 26 | 0.1% |
| Korea | 27 | 0.1% |
| Latin America | 758 | 2.2% |
| Lithuania | 13 | 0.0% |
| Malaysia | 5 | 0.0% |
| Mexico | 40 | 0.1% |
| Netherlands | 22 | 0.1% |
| Northern Europe | 165 | 0.5% |
| Norway | 20 | 0.1% |
| Panama | 7 | 0.0% |
| Peru | 8 | 0.0% |
| Philippines | 443 | 1.3% |
| Poland | 24 | 0.1% |
| Romania | 67 | 0.2% |
| Russia | 15 | 0.0% |
| Scotland | 7 | 0.0% |
| South Africa | 16 | 0.1% |
| South America | 277 | 0.8% |
| South Central Asia | 54 | 0.2% |
| South Eastern Asia | 525 | 1.5% |
| Southern Europe | 66 | 0.2% |
| Spain | 15 | 0.0% |
| Switzerland | 32 | 0.1% |
| Taiwan | 17 | 0.1% |
| Trinidad and Tobago | 48 | 0.1% |
| Venezuela | 82 | 0.2% |
| Vietnam | 77 | 0.2% |
| Western Asia | 121 | 0.4% |
| Western Europe | 232 | 0.7% | View All 65 Rows |
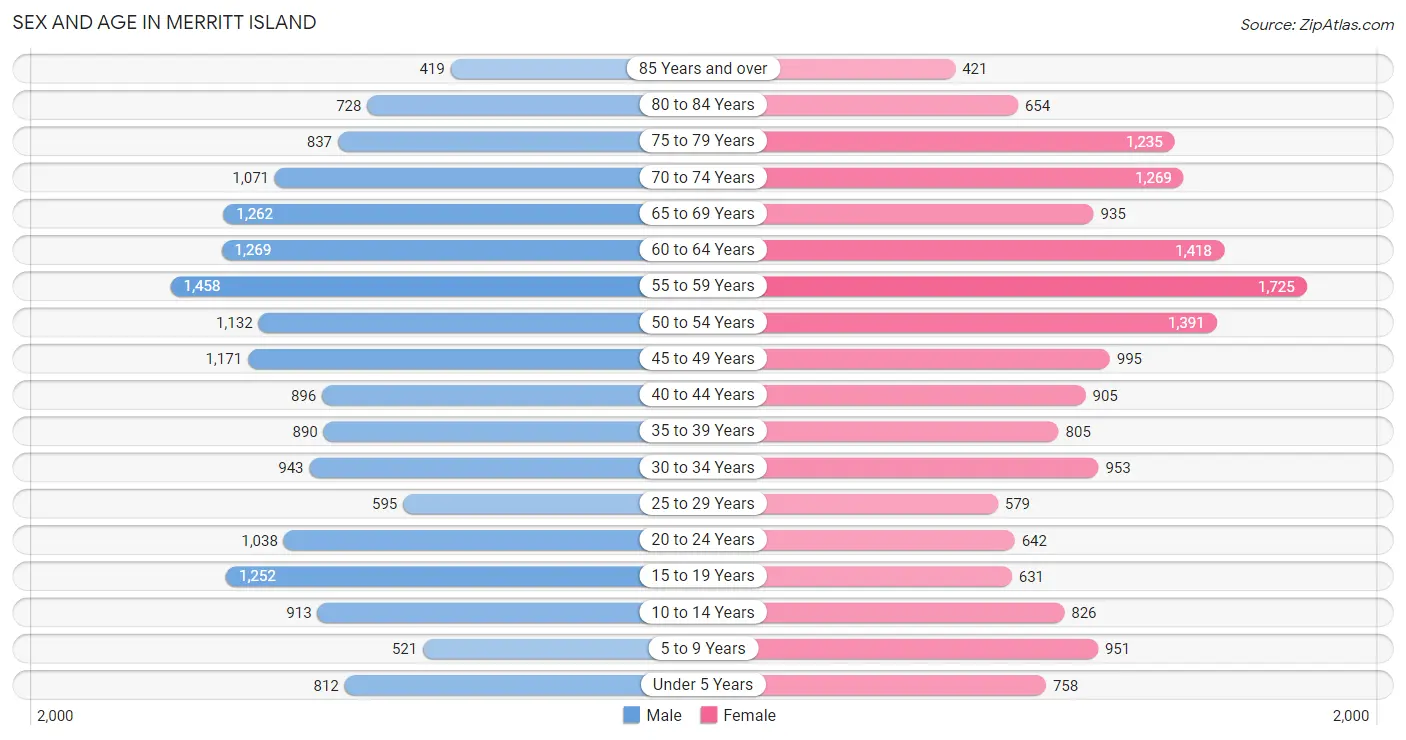
Sex and Age in Merritt Island
Sex and Age in Merritt Island
The most populous age groups in Merritt Island are 55 to 59 Years (1,458 | 8.5%) for men and 55 to 59 Years (1,725 | 10.1%) for women.
| Age Bracket | Male | Female |
| Under 5 Years | 812 (4.7%) | 758 (4.4%) |
| 5 to 9 Years | 521 (3.0%) | 951 (5.6%) |
| 10 to 14 Years | 913 (5.3%) | 826 (4.8%) |
| 15 to 19 Years | 1,252 (7.3%) | 631 (3.7%) |
| 20 to 24 Years | 1,038 (6.0%) | 642 (3.8%) |
| 25 to 29 Years | 595 (3.5%) | 579 (3.4%) |
| 30 to 34 Years | 943 (5.5%) | 953 (5.6%) |
| 35 to 39 Years | 890 (5.2%) | 805 (4.7%) |
| 40 to 44 Years | 896 (5.2%) | 905 (5.3%) |
| 45 to 49 Years | 1,171 (6.8%) | 995 (5.8%) |
| 50 to 54 Years | 1,132 (6.6%) | 1,391 (8.1%) |
| 55 to 59 Years | 1,458 (8.5%) | 1,725 (10.1%) |
| 60 to 64 Years | 1,269 (7.4%) | 1,418 (8.3%) |
| 65 to 69 Years | 1,262 (7.3%) | 935 (5.5%) |
| 70 to 74 Years | 1,071 (6.2%) | 1,269 (7.4%) |
| 75 to 79 Years | 837 (4.9%) | 1,235 (7.2%) |
| 80 to 84 Years | 728 (4.2%) | 654 (3.8%) |
| 85 Years and over | 419 (2.4%) | 421 (2.5%) |
| Total | 17,207 (100.0%) | 17,093 (100.0%) |
Families and Households in Merritt Island
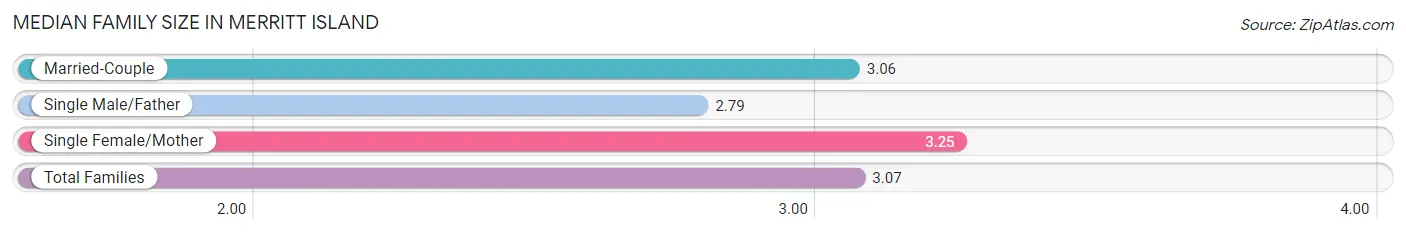
Median Family Size in Merritt Island
The median family size in Merritt Island is 3.07 persons per family, with single female/mother families (978 | 11.0%) accounting for the largest median family size of 3.25 persons per family. On the other hand, single male/father families (426 | 4.8%) represent the smallest median family size with 2.79 persons per family.
| Family Type | # Families | Family Size |
| Married-Couple | 7,495 (84.2%) | 3.06 |
| Single Male/Father | 426 (4.8%) | 2.79 |
| Single Female/Mother | 978 (11.0%) | 3.25 |
| Total Families | 8,899 (100.0%) | 3.07 |
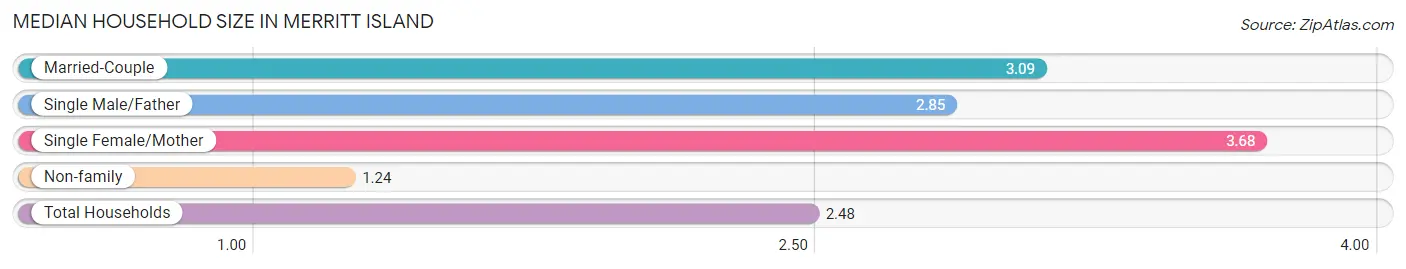
Median Household Size in Merritt Island
The median household size in Merritt Island is 2.48 persons per household, with single female/mother households (978 | 7.1%) accounting for the largest median household size of 3.68 persons per household. non-family households (4,788 | 35.0%) represent the smallest median household size with 1.24 persons per household.
| Household Type | # Households | Household Size |
| Married-Couple | 7,495 (54.8%) | 3.09 |
| Single Male/Father | 426 (3.1%) | 2.85 |
| Single Female/Mother | 978 (7.1%) | 3.68 |
| Non-family | 4,788 (35.0%) | 1.24 |
| Total Households | 13,687 (100.0%) | 2.48 |
Household Size by Marriage Status in Merritt Island
Out of a total of 13,687 households in Merritt Island, 8,899 (65.0%) are family households, while 4,788 (35.0%) are nonfamily households. The most numerous type of family households are 2-person households, comprising 5,047, and the most common type of nonfamily households are 1-person households, comprising 3,922.
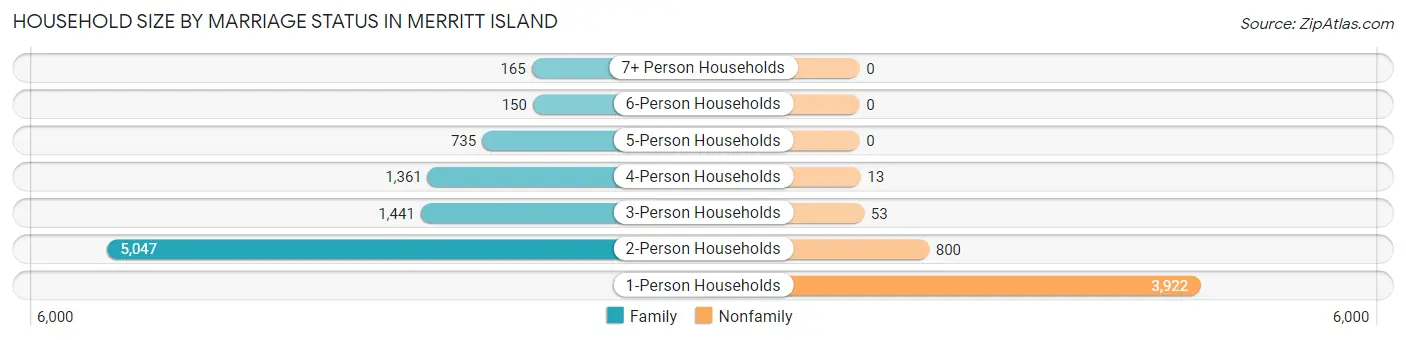
| Household Size | Family Households | Nonfamily Households |
| 1-Person Households | - | 3,922 (28.6%) |
| 2-Person Households | 5,047 (36.9%) | 800 (5.8%) |
| 3-Person Households | 1,441 (10.5%) | 53 (0.4%) |
| 4-Person Households | 1,361 (9.9%) | 13 (0.1%) |
| 5-Person Households | 735 (5.4%) | 0 (0.0%) |
| 6-Person Households | 150 (1.1%) | 0 (0.0%) |
| 7+ Person Households | 165 (1.2%) | 0 (0.0%) |
| Total | 8,899 (65.0%) | 4,788 (35.0%) |
Female Fertility in Merritt Island
Fertility by Age in Merritt Island
Average fertility rate in Merritt Island is 74.0 births per 1,000 women. Women in the age bracket of 20 to 34 years have the highest fertility rate with 162.0 births per 1,000 women. Women in the age bracket of 20 to 34 years acount for 81.5% of all women with births.
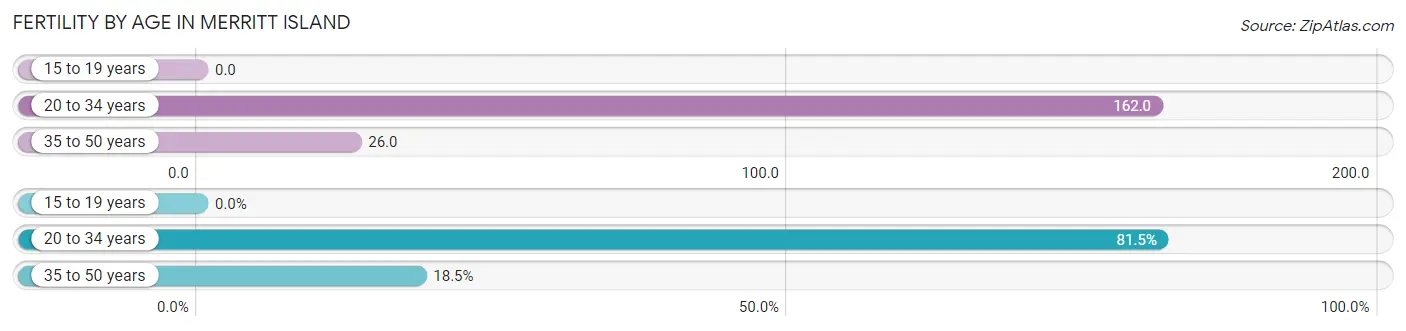
| Age Bracket | Women with Births | Births / 1,000 Women |
| 15 to 19 years | 0 (0.0%) | 0.0 |
| 20 to 34 years | 352 (81.5%) | 162.0 |
| 35 to 50 years | 80 (18.5%) | 26.0 |
| Total | 432 (100.0%) | 74.0 |
Fertility by Age by Marriage Status in Merritt Island
80.8% of women with births (432) in Merritt Island are married. The highest percentage of unmarried women with births falls into 20 to 34 years age bracket with 23.6% of them unmarried at the time of birth, while the lowest percentage of unmarried women with births belong to 35 to 50 years age bracket with 0.0% of them unmarried.
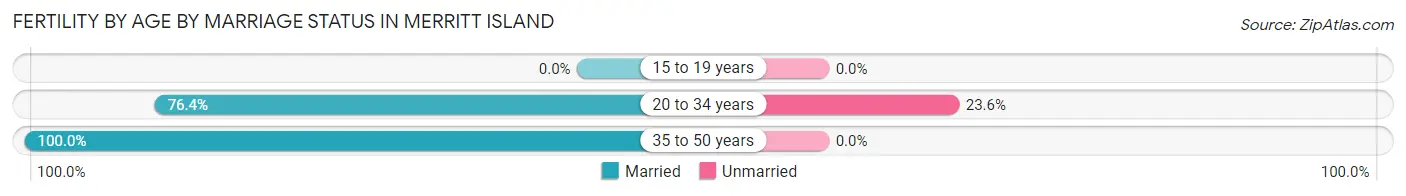
| Age Bracket | Married | Unmarried |
| 15 to 19 years | 0 (0.0%) | 0 (0.0%) |
| 20 to 34 years | 269 (76.4%) | 83 (23.6%) |
| 35 to 50 years | 80 (100.0%) | 0 (0.0%) |
| Total | 349 (80.8%) | 83 (19.2%) |
Fertility by Education in Merritt Island
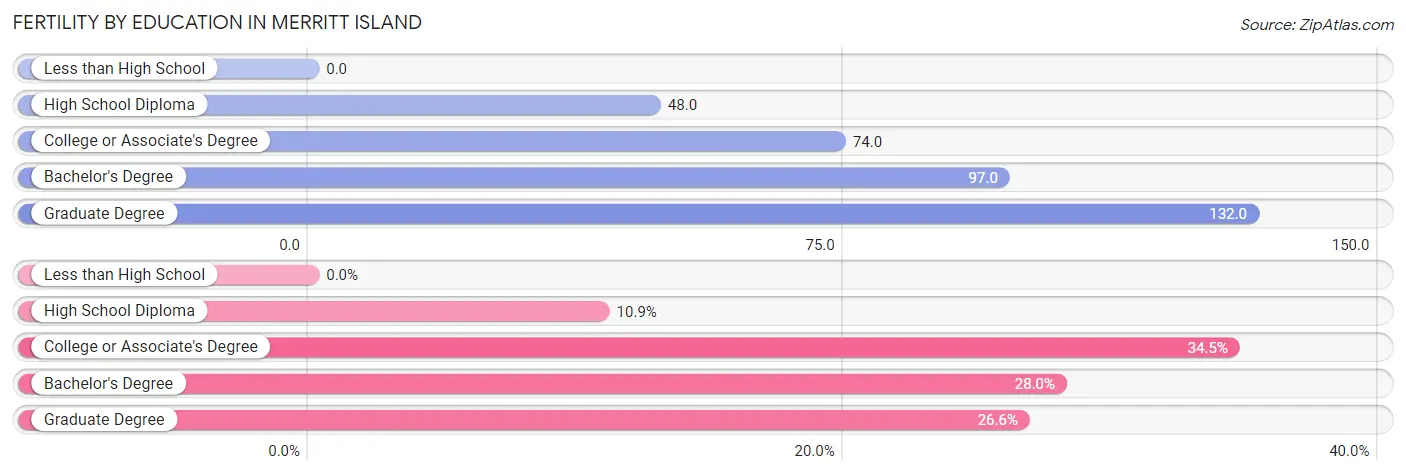
| Educational Attainment | Women with Births | Births / 1,000 Women |
| Less than High School | 0 (0.0%) | 0.0 |
| High School Diploma | 47 (10.9%) | 48.0 |
| College or Associate's Degree | 149 (34.5%) | 74.0 |
| Bachelor's Degree | 121 (28.0%) | 97.0 |
| Graduate Degree | 115 (26.6%) | 132.0 |
| Total | 432 (100.0%) | 74.0 |
Fertility by Education by Marriage Status in Merritt Island
19.2% of women with births in Merritt Island are unmarried. Women with the educational attainment of high school diploma are most likely to be married with 100.0% of them married at childbirth, while women with the educational attainment of college or associate's degree are least likely to be married with 55.7% of them unmarried at childbirth.
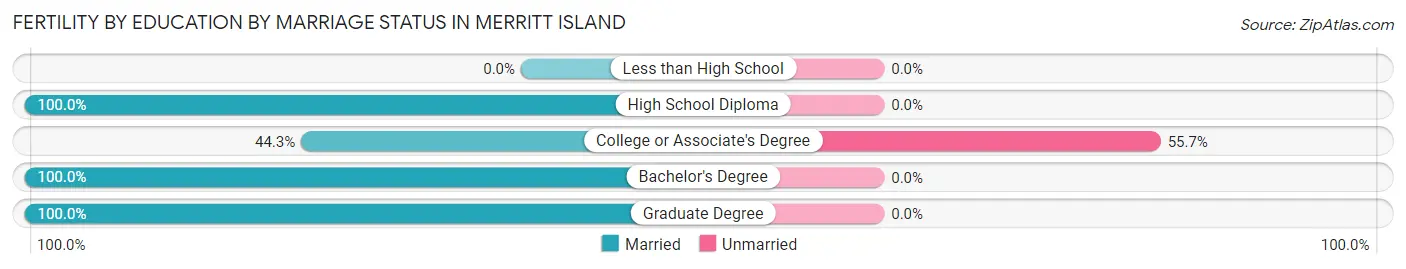
| Educational Attainment | Married | Unmarried |
| Less than High School | 0 (0.0%) | 0 (0.0%) |
| High School Diploma | 47 (100.0%) | 0 (0.0%) |
| College or Associate's Degree | 66 (44.3%) | 83 (55.7%) |
| Bachelor's Degree | 121 (100.0%) | 0 (0.0%) |
| Graduate Degree | 115 (100.0%) | 0 (0.0%) |
| Total | 349 (80.8%) | 83 (19.2%) |
Employment Characteristics in Merritt Island
Employment by Class of Employer in Merritt Island
Among the 15,482 employed individuals in Merritt Island, private company employees (10,010 | 64.7%), local government employees (1,356 | 8.8%), and not-for-profit organizations (1,265 | 8.2%) make up the most common classes of employment.
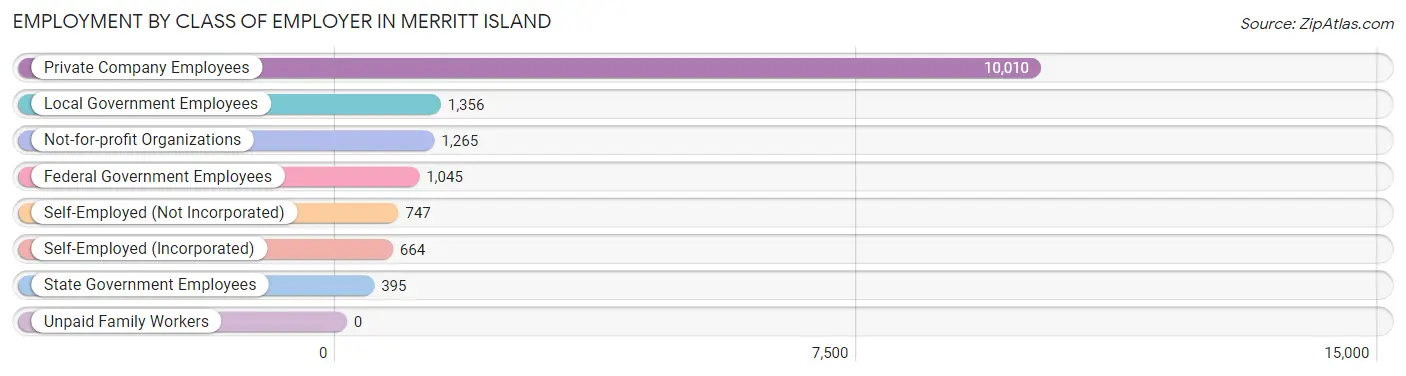
| Employer Class | # Employees | % Employees |
| Private Company Employees | 10,010 | 64.7% |
| Self-Employed (Incorporated) | 664 | 4.3% |
| Self-Employed (Not Incorporated) | 747 | 4.8% |
| Not-for-profit Organizations | 1,265 | 8.2% |
| Local Government Employees | 1,356 | 8.8% |
| State Government Employees | 395 | 2.5% |
| Federal Government Employees | 1,045 | 6.8% |
| Unpaid Family Workers | 0 | 0.0% |
| Total | 15,482 | 100.0% |
Employment Status by Age in Merritt Island
According to the labor force statistics for Merritt Island, out of the total population over 16 years of age (29,148), 56.2% or 16,381 individuals are in the labor force, with 4.2% or 688 of them unemployed. The age group with the highest labor force participation rate is 25 to 29 years, with 87.2% or 1,024 individuals in the labor force. Within the labor force, the 16 to 19 years age range has the highest percentage of unemployed individuals, with 13.8% or 70 of them being unemployed.
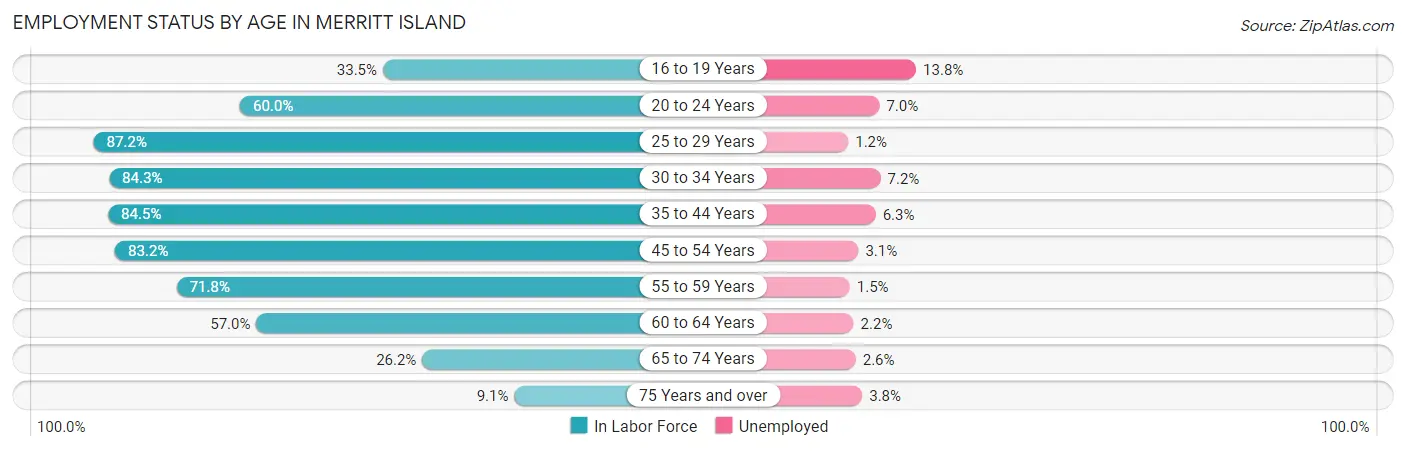
| Age Bracket | In Labor Force | Unemployed |
| 16 to 19 Years | 507 (33.5%) | 70 (13.8%) |
| 20 to 24 Years | 1,008 (60.0%) | 71 (7.0%) |
| 25 to 29 Years | 1,024 (87.2%) | 12 (1.2%) |
| 30 to 34 Years | 1,598 (84.3%) | 115 (7.2%) |
| 35 to 44 Years | 2,954 (84.5%) | 186 (6.3%) |
| 45 to 54 Years | 3,901 (83.2%) | 121 (3.1%) |
| 55 to 59 Years | 2,285 (71.8%) | 34 (1.5%) |
| 60 to 64 Years | 1,532 (57.0%) | 34 (2.2%) |
| 65 to 74 Years | 1,189 (26.2%) | 31 (2.6%) |
| 75 Years and over | 391 (9.1%) | 15 (3.8%) |
| Total | 16,381 (56.2%) | 688 (4.2%) |
Employment Status by Educational Attainment in Merritt Island
According to labor force statistics for Merritt Island, 77.6% of individuals (13,289) out of the total population between 25 and 64 years of age (17,125) are in the labor force, with 3.8% or 505 of them being unemployed. The group with the highest labor force participation rate are those with the educational attainment of bachelor's degree or higher, with 81.3% or 5,858 individuals in the labor force. Within the labor force, individuals with less than high school education have the highest percentage of unemployment, with 8.3% or 44 of them being unemployed.
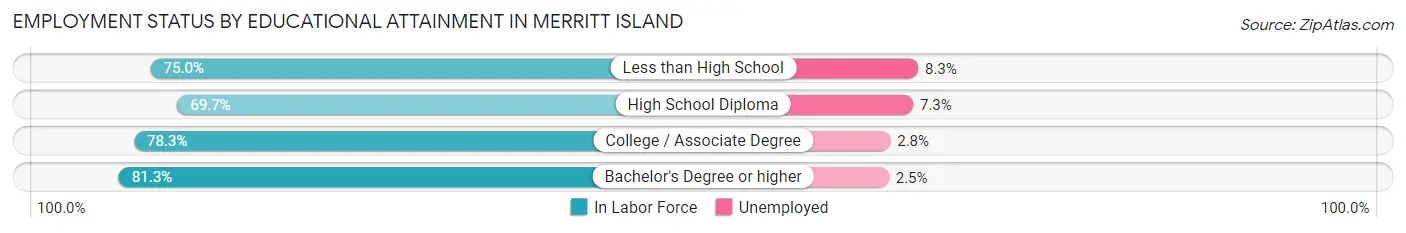
| Educational Attainment | In Labor Force | Unemployed |
| Less than High School | 533 (75.0%) | 59 (8.3%) |
| High School Diploma | 2,520 (69.7%) | 264 (7.3%) |
| College / Associate Degree | 4,379 (78.3%) | 157 (2.8%) |
| Bachelor's Degree or higher | 5,858 (81.3%) | 180 (2.5%) |
| Total | 13,289 (77.6%) | 651 (3.8%) |
Employment Occupations by Sex in Merritt Island
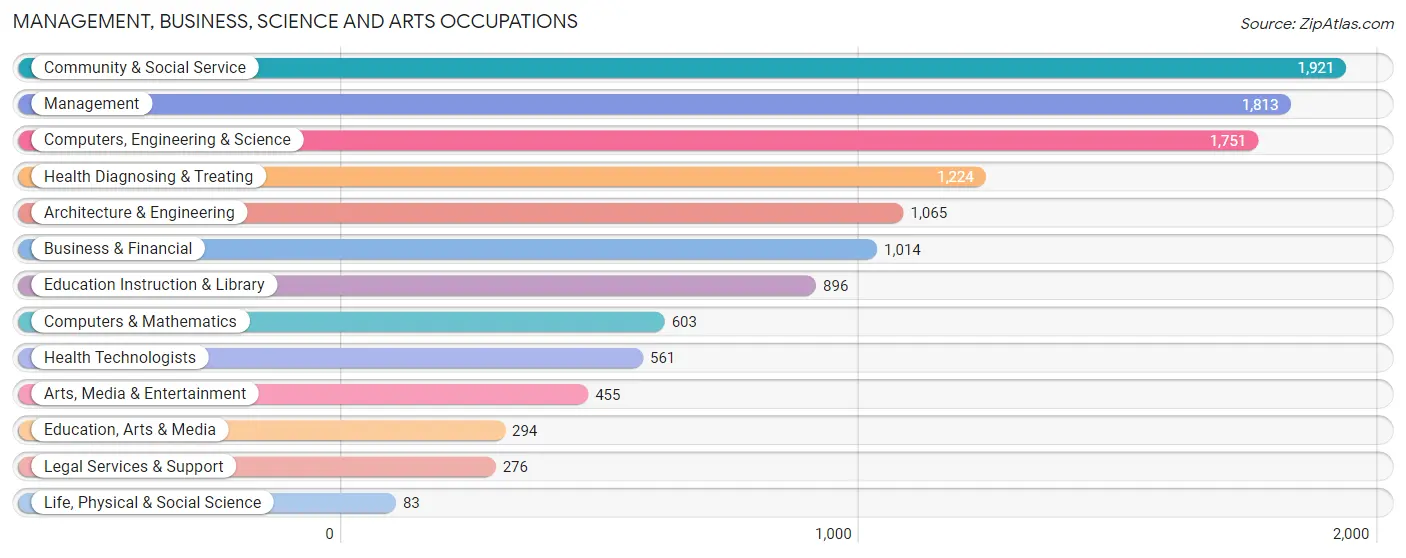
Management, Business, Science and Arts Occupations
The most common Management, Business, Science and Arts occupations in Merritt Island are Community & Social Service (1,921 | 12.3%), Management (1,813 | 11.7%), Computers, Engineering & Science (1,751 | 11.3%), Health Diagnosing & Treating (1,224 | 7.9%), and Architecture & Engineering (1,065 | 6.8%).
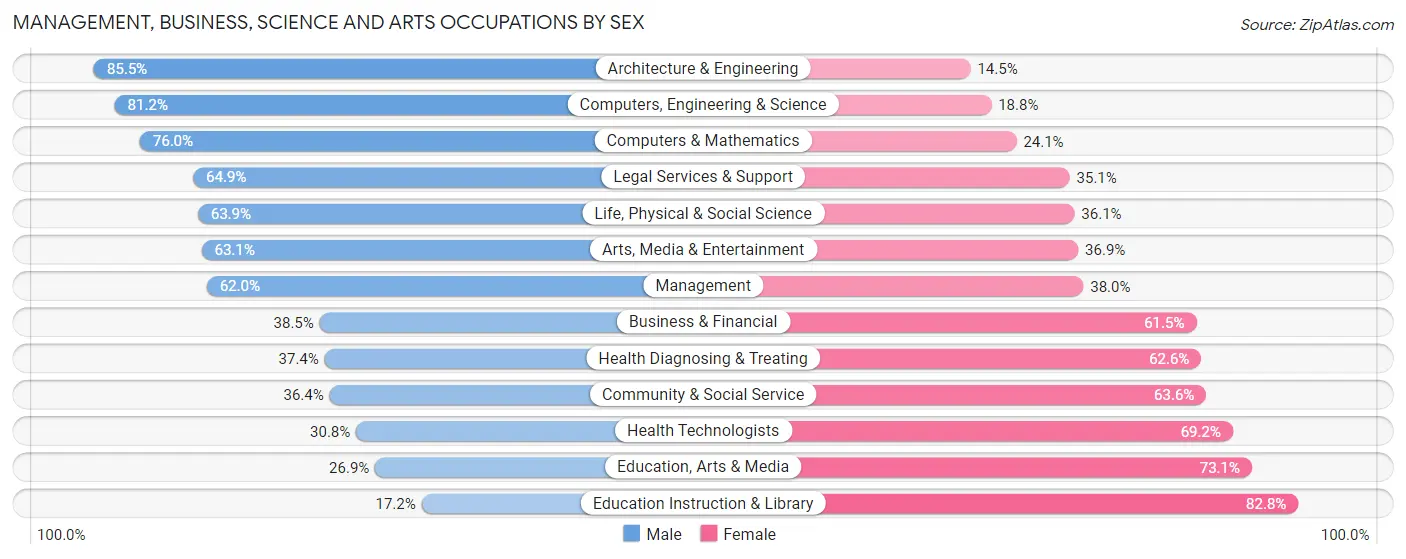
Management, Business, Science and Arts Occupations by Sex
Within the Management, Business, Science and Arts occupations in Merritt Island, the most male-oriented occupations are Architecture & Engineering (85.5%), Computers, Engineering & Science (81.2%), and Computers & Mathematics (75.9%), while the most female-oriented occupations are Education Instruction & Library (82.8%), Education, Arts & Media (73.1%), and Health Technologists (69.2%).
| Occupation | Male | Female |
| Management | 1,124 (62.0%) | 689 (38.0%) |
| Business & Financial | 390 (38.5%) | 624 (61.5%) |
| Computers, Engineering & Science | 1,422 (81.2%) | 329 (18.8%) |
| Computers & Mathematics | 458 (75.9%) | 145 (24.0%) |
| Architecture & Engineering | 911 (85.5%) | 154 (14.5%) |
| Life, Physical & Social Science | 53 (63.9%) | 30 (36.1%) |
| Community & Social Service | 699 (36.4%) | 1,222 (63.6%) |
| Education, Arts & Media | 79 (26.9%) | 215 (73.1%) |
| Legal Services & Support | 179 (64.9%) | 97 (35.1%) |
| Education Instruction & Library | 154 (17.2%) | 742 (82.8%) |
| Arts, Media & Entertainment | 287 (63.1%) | 168 (36.9%) |
| Health Diagnosing & Treating | 458 (37.4%) | 766 (62.6%) |
| Health Technologists | 173 (30.8%) | 388 (69.2%) |
| Total (Category) | 4,093 (53.0%) | 3,630 (47.0%) |
| Total (Overall) | 8,610 (55.3%) | 6,953 (44.7%) |
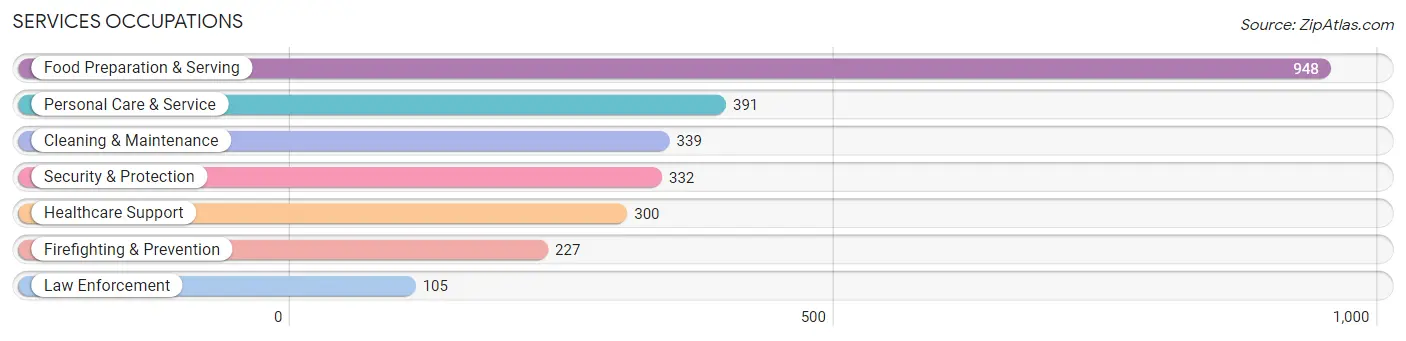
Services Occupations
The most common Services occupations in Merritt Island are Food Preparation & Serving (948 | 6.1%), Personal Care & Service (391 | 2.5%), Cleaning & Maintenance (339 | 2.2%), Security & Protection (332 | 2.1%), and Healthcare Support (300 | 1.9%).
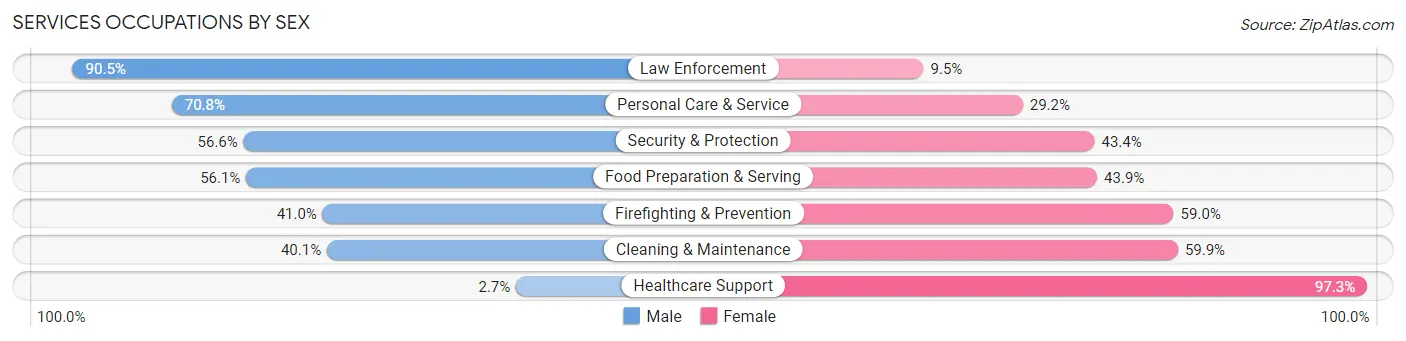
Services Occupations by Sex
Within the Services occupations in Merritt Island, the most male-oriented occupations are Law Enforcement (90.5%), Personal Care & Service (70.8%), and Security & Protection (56.6%), while the most female-oriented occupations are Healthcare Support (97.3%), Cleaning & Maintenance (59.9%), and Firefighting & Prevention (59.0%).
| Occupation | Male | Female |
| Healthcare Support | 8 (2.7%) | 292 (97.3%) |
| Security & Protection | 188 (56.6%) | 144 (43.4%) |
| Firefighting & Prevention | 93 (41.0%) | 134 (59.0%) |
| Law Enforcement | 95 (90.5%) | 10 (9.5%) |
| Food Preparation & Serving | 532 (56.1%) | 416 (43.9%) |
| Cleaning & Maintenance | 136 (40.1%) | 203 (59.9%) |
| Personal Care & Service | 277 (70.8%) | 114 (29.2%) |
| Total (Category) | 1,141 (49.4%) | 1,169 (50.6%) |
| Total (Overall) | 8,610 (55.3%) | 6,953 (44.7%) |
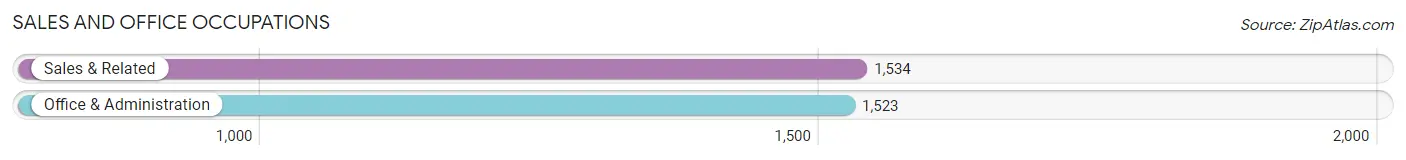
Sales and Office Occupations
The most common Sales and Office occupations in Merritt Island are Sales & Related (1,534 | 9.9%), and Office & Administration (1,523 | 9.8%).
Sales and Office Occupations by Sex
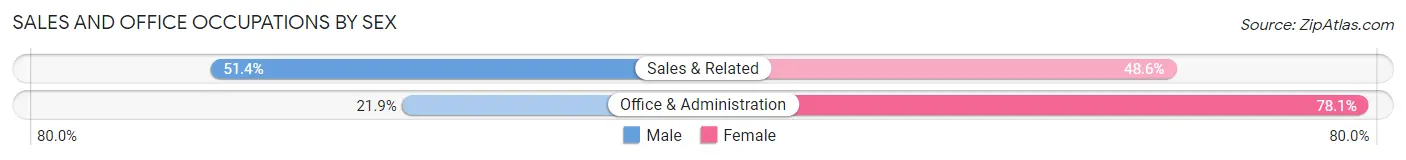
| Occupation | Male | Female |
| Sales & Related | 789 (51.4%) | 745 (48.6%) |
| Office & Administration | 333 (21.9%) | 1,190 (78.1%) |
| Total (Category) | 1,122 (36.7%) | 1,935 (63.3%) |
| Total (Overall) | 8,610 (55.3%) | 6,953 (44.7%) |
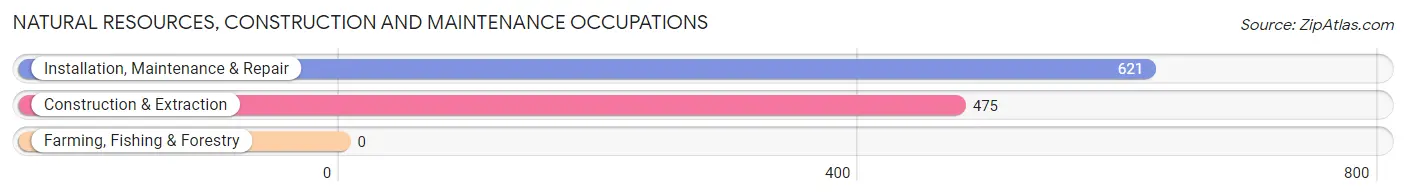
Natural Resources, Construction and Maintenance Occupations
The most common Natural Resources, Construction and Maintenance occupations in Merritt Island are Installation, Maintenance & Repair (621 | 4.0%), and Construction & Extraction (475 | 3.0%).
Natural Resources, Construction and Maintenance Occupations by Sex
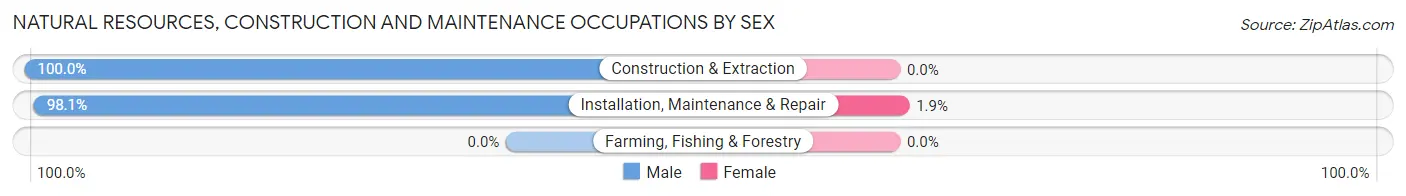
| Occupation | Male | Female |
| Farming, Fishing & Forestry | 0 (0.0%) | 0 (0.0%) |
| Construction & Extraction | 475 (100.0%) | 0 (0.0%) |
| Installation, Maintenance & Repair | 609 (98.1%) | 12 (1.9%) |
| Total (Category) | 1,084 (98.9%) | 12 (1.1%) |
| Total (Overall) | 8,610 (55.3%) | 6,953 (44.7%) |
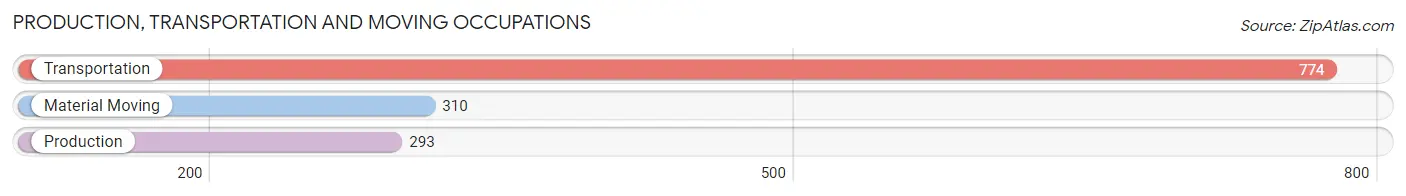
Production, Transportation and Moving Occupations
The most common Production, Transportation and Moving occupations in Merritt Island are Transportation (774 | 5.0%), Material Moving (310 | 2.0%), and Production (293 | 1.9%).
Production, Transportation and Moving Occupations by Sex
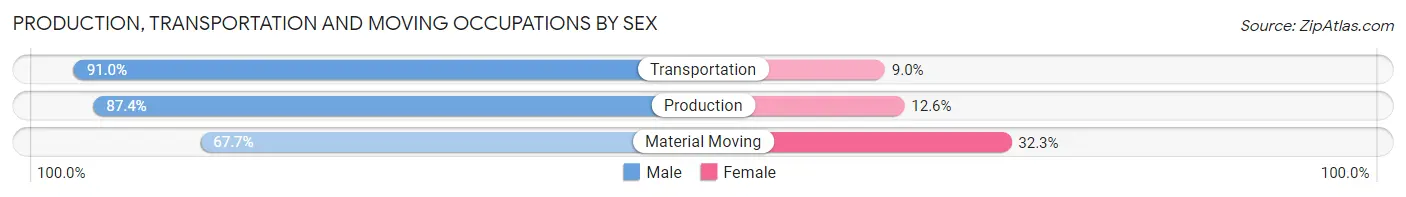
| Occupation | Male | Female |
| Production | 256 (87.4%) | 37 (12.6%) |
| Transportation | 704 (91.0%) | 70 (9.0%) |
| Material Moving | 210 (67.7%) | 100 (32.3%) |
| Total (Category) | 1,170 (85.0%) | 207 (15.0%) |
| Total (Overall) | 8,610 (55.3%) | 6,953 (44.7%) |
Employment Industries by Sex in Merritt Island
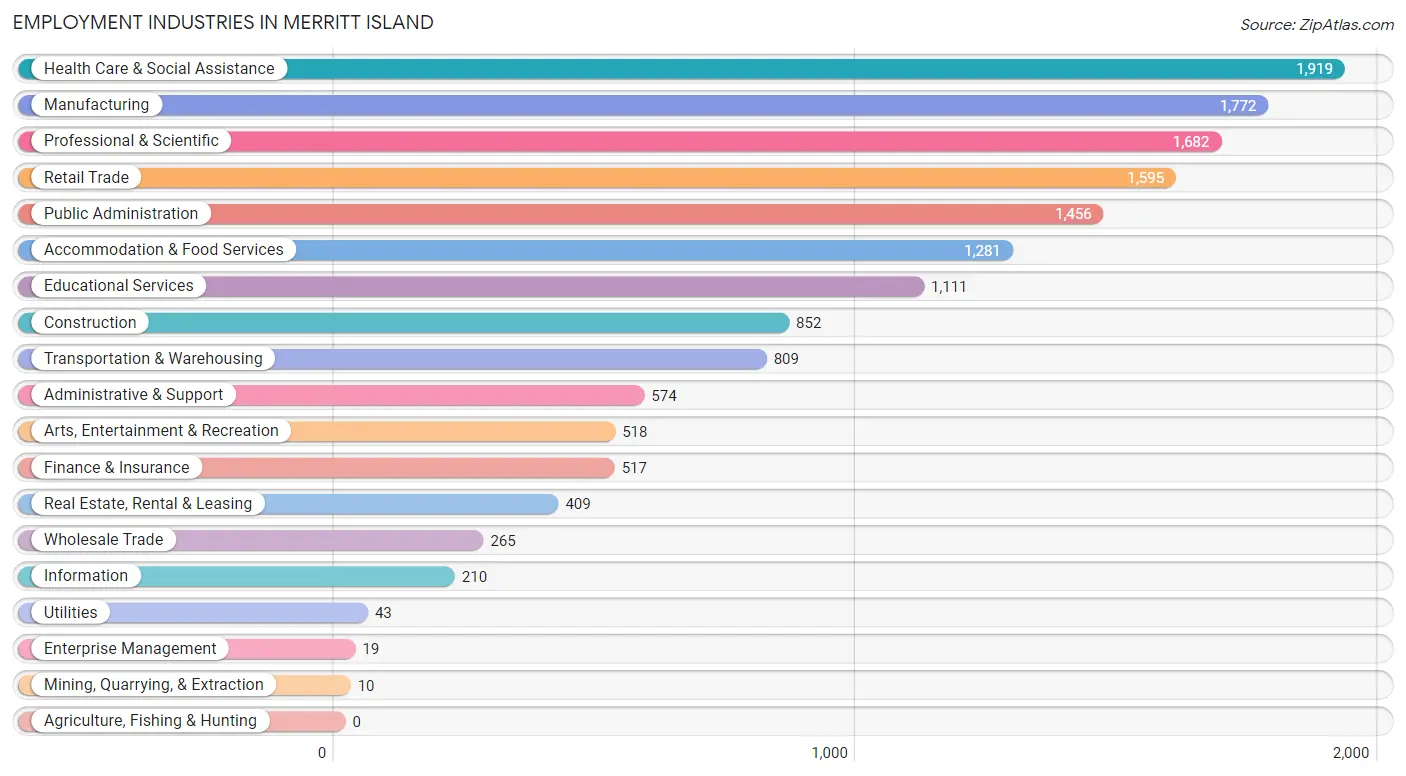
Employment Industries in Merritt Island
The major employment industries in Merritt Island include Health Care & Social Assistance (1,919 | 12.3%), Manufacturing (1,772 | 11.4%), Professional & Scientific (1,682 | 10.8%), Retail Trade (1,595 | 10.2%), and Public Administration (1,456 | 9.4%).
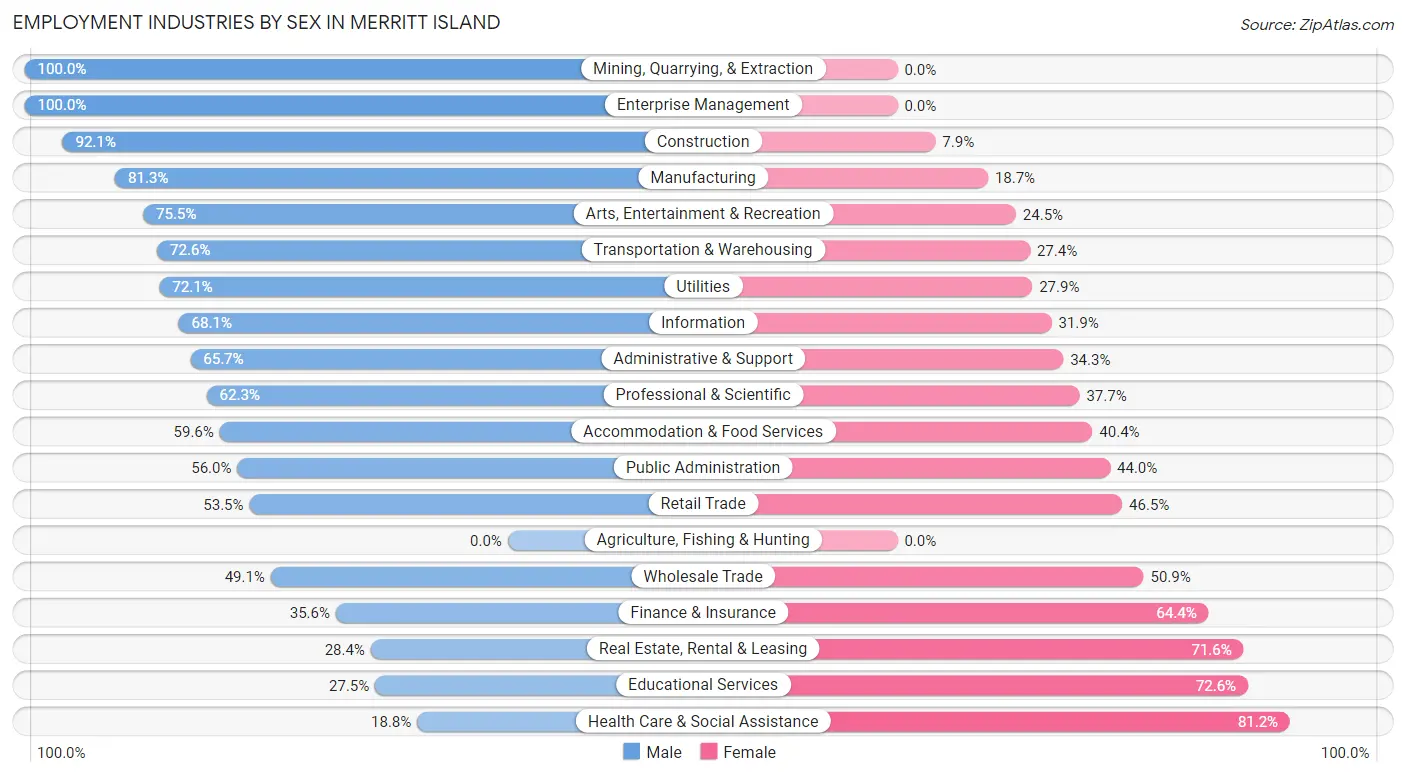
Employment Industries by Sex in Merritt Island
The Merritt Island industries that see more men than women are Mining, Quarrying, & Extraction (100.0%), Enterprise Management (100.0%), and Construction (92.1%), whereas the industries that tend to have a higher number of women are Health Care & Social Assistance (81.2%), Educational Services (72.6%), and Real Estate, Rental & Leasing (71.6%).
| Industry | Male | Female |
| Agriculture, Fishing & Hunting | 0 (0.0%) | 0 (0.0%) |
| Mining, Quarrying, & Extraction | 10 (100.0%) | 0 (0.0%) |
| Construction | 785 (92.1%) | 67 (7.9%) |
| Manufacturing | 1,440 (81.3%) | 332 (18.7%) |
| Wholesale Trade | 130 (49.1%) | 135 (50.9%) |
| Retail Trade | 853 (53.5%) | 742 (46.5%) |
| Transportation & Warehousing | 587 (72.6%) | 222 (27.4%) |
| Utilities | 31 (72.1%) | 12 (27.9%) |
| Information | 143 (68.1%) | 67 (31.9%) |
| Finance & Insurance | 184 (35.6%) | 333 (64.4%) |
| Real Estate, Rental & Leasing | 116 (28.4%) | 293 (71.6%) |
| Professional & Scientific | 1,048 (62.3%) | 634 (37.7%) |
| Enterprise Management | 19 (100.0%) | 0 (0.0%) |
| Administrative & Support | 377 (65.7%) | 197 (34.3%) |
| Educational Services | 305 (27.5%) | 806 (72.6%) |
| Health Care & Social Assistance | 360 (18.8%) | 1,559 (81.2%) |
| Arts, Entertainment & Recreation | 391 (75.5%) | 127 (24.5%) |
| Accommodation & Food Services | 764 (59.6%) | 517 (40.4%) |
| Public Administration | 815 (56.0%) | 641 (44.0%) |
| Total | 8,610 (55.3%) | 6,953 (44.7%) |
Education in Merritt Island
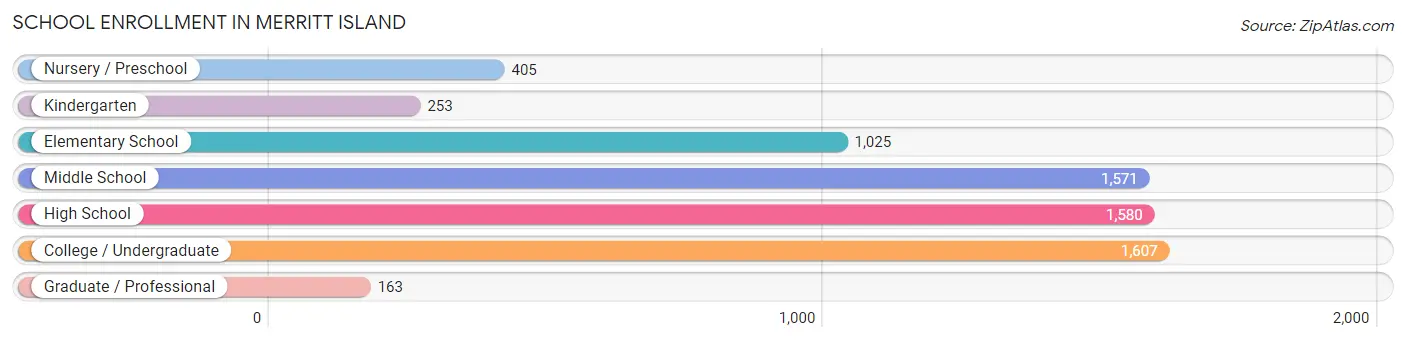
School Enrollment in Merritt Island
The most common levels of schooling among the 6,604 students in Merritt Island are college / undergraduate (1,607 | 24.3%), high school (1,580 | 23.9%), and middle school (1,571 | 23.8%).
| School Level | # Students | % Students |
| Nursery / Preschool | 405 | 6.1% |
| Kindergarten | 253 | 3.8% |
| Elementary School | 1,025 | 15.5% |
| Middle School | 1,571 | 23.8% |
| High School | 1,580 | 23.9% |
| College / Undergraduate | 1,607 | 24.3% |
| Graduate / Professional | 163 | 2.5% |
| Total | 6,604 | 100.0% |
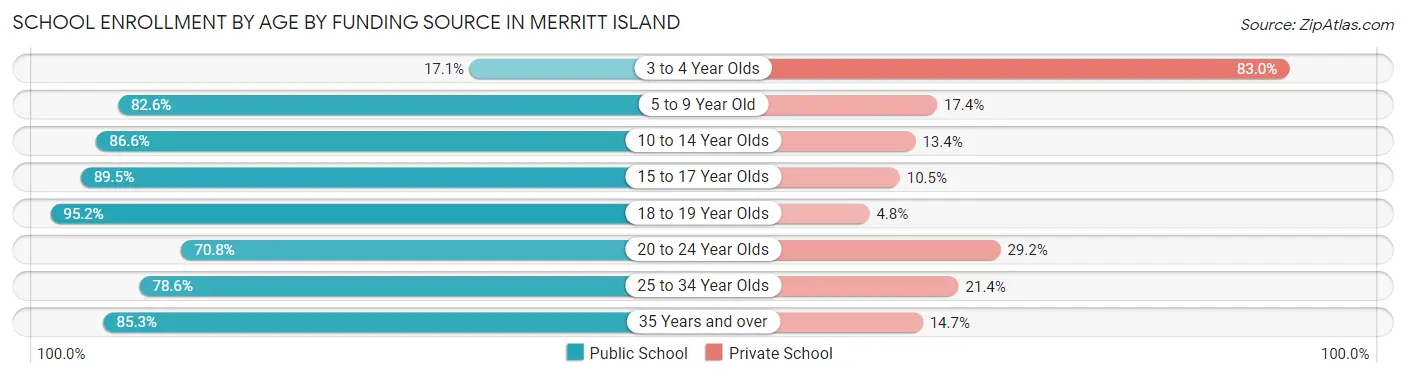
School Enrollment by Age by Funding Source in Merritt Island
Out of a total of 6,604 students who are enrolled in schools in Merritt Island, 1,195 (18.1%) attend a private institution, while the remaining 5,409 (81.9%) are enrolled in public schools. The age group of 3 to 4 year olds has the highest likelihood of being enrolled in private schools, with 219 (83.0% in the age bracket) enrolled. Conversely, the age group of 18 to 19 year olds has the lowest likelihood of being enrolled in a private school, with 535 (95.2% in the age bracket) attending a public institution.
| Age Bracket | Public School | Private School |
| 3 to 4 Year Olds | 45 (17.1%) | 219 (83.0%) |
| 5 to 9 Year Old | 1,097 (82.6%) | 231 (17.4%) |
| 10 to 14 Year Olds | 1,476 (86.6%) | 228 (13.4%) |
| 15 to 17 Year Olds | 1,044 (89.5%) | 122 (10.5%) |
| 18 to 19 Year Olds | 535 (95.2%) | 27 (4.8%) |
| 20 to 24 Year Olds | 550 (70.8%) | 227 (29.2%) |
| 25 to 34 Year Olds | 279 (78.6%) | 76 (21.4%) |
| 35 Years and over | 382 (85.3%) | 66 (14.7%) |
| Total | 5,409 (81.9%) | 1,195 (18.1%) |
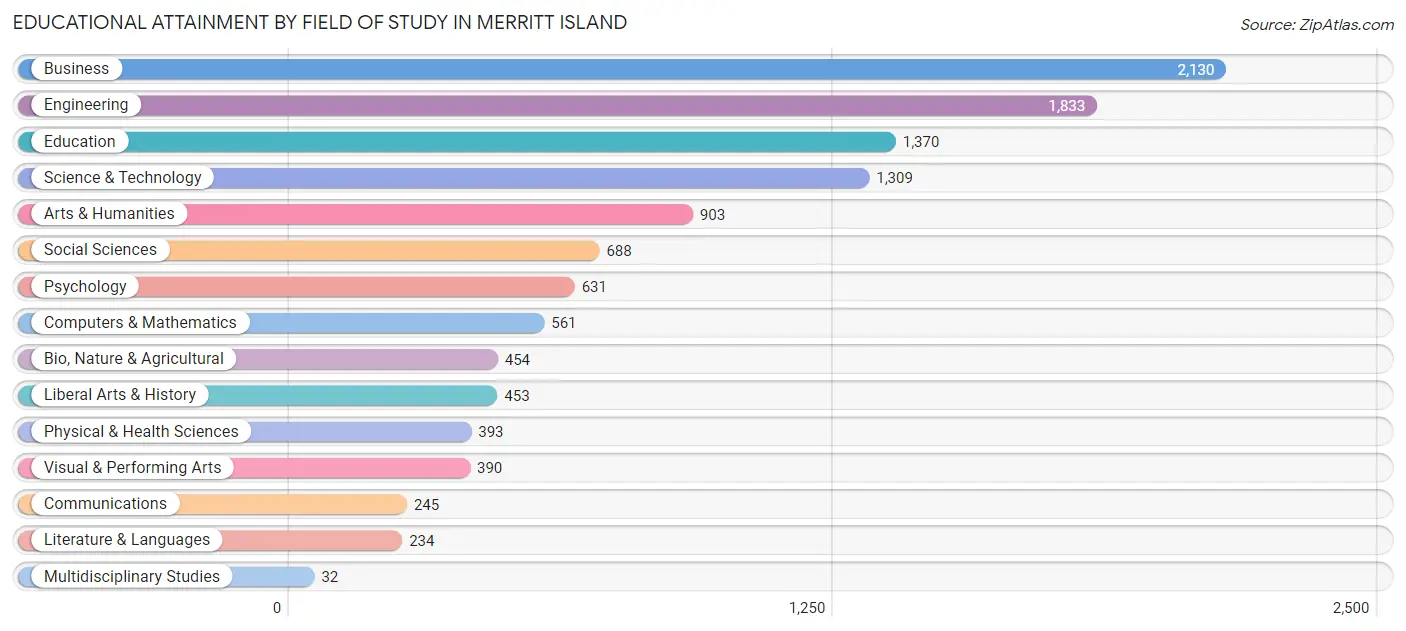
Educational Attainment by Field of Study in Merritt Island
Business (2,130 | 18.3%), engineering (1,833 | 15.8%), education (1,370 | 11.8%), science & technology (1,309 | 11.3%), and arts & humanities (903 | 7.8%) are the most common fields of study among 11,626 individuals in Merritt Island who have obtained a bachelor's degree or higher.
| Field of Study | # Graduates | % Graduates |
| Computers & Mathematics | 561 | 4.8% |
| Bio, Nature & Agricultural | 454 | 3.9% |
| Physical & Health Sciences | 393 | 3.4% |
| Psychology | 631 | 5.4% |
| Social Sciences | 688 | 5.9% |
| Engineering | 1,833 | 15.8% |
| Multidisciplinary Studies | 32 | 0.3% |
| Science & Technology | 1,309 | 11.3% |
| Business | 2,130 | 18.3% |
| Education | 1,370 | 11.8% |
| Literature & Languages | 234 | 2.0% |
| Liberal Arts & History | 453 | 3.9% |
| Visual & Performing Arts | 390 | 3.4% |
| Communications | 245 | 2.1% |
| Arts & Humanities | 903 | 7.8% |
| Total | 11,626 | 100.0% |
Transportation & Commute in Merritt Island
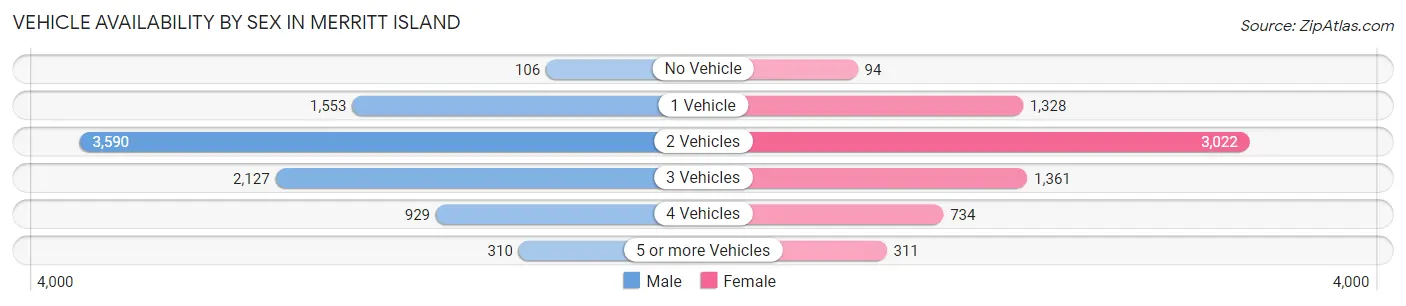
Vehicle Availability by Sex in Merritt Island
The most prevalent vehicle ownership categories in Merritt Island are males with 2 vehicles (3,590, accounting for 41.7%) and females with 2 vehicles (3,022, making up 52.4%).
| Vehicles Available | Male | Female |
| No Vehicle | 106 (1.2%) | 94 (1.4%) |
| 1 Vehicle | 1,553 (18.0%) | 1,328 (19.4%) |
| 2 Vehicles | 3,590 (41.7%) | 3,022 (44.1%) |
| 3 Vehicles | 2,127 (24.7%) | 1,361 (19.9%) |
| 4 Vehicles | 929 (10.8%) | 734 (10.7%) |
| 5 or more Vehicles | 310 (3.6%) | 311 (4.5%) |
| Total | 8,615 (100.0%) | 6,850 (100.0%) |
Commute Time in Merritt Island
The most frequently occuring commute durations in Merritt Island are 15 to 19 minutes (2,848 commuters, 21.5%), 10 to 14 minutes (2,129 commuters, 16.1%), and 20 to 24 minutes (1,848 commuters, 14.0%).
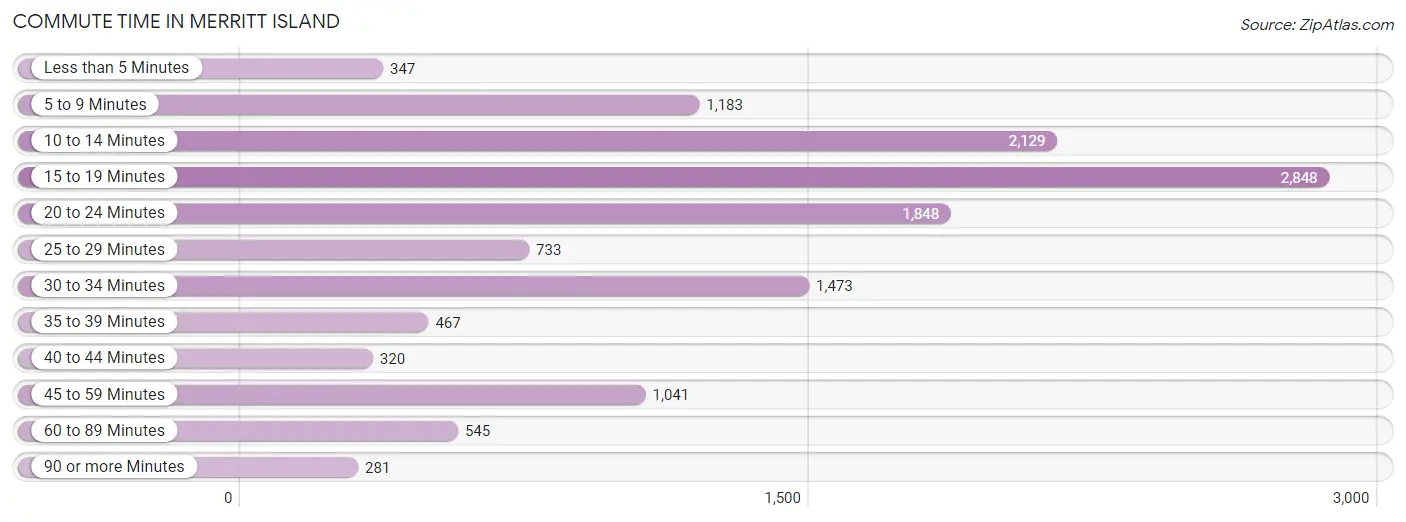
| Commute Time | # Commuters | % Commuters |
| Less than 5 Minutes | 347 | 2.6% |
| 5 to 9 Minutes | 1,183 | 8.9% |
| 10 to 14 Minutes | 2,129 | 16.1% |
| 15 to 19 Minutes | 2,848 | 21.5% |
| 20 to 24 Minutes | 1,848 | 14.0% |
| 25 to 29 Minutes | 733 | 5.6% |
| 30 to 34 Minutes | 1,473 | 11.2% |
| 35 to 39 Minutes | 467 | 3.5% |
| 40 to 44 Minutes | 320 | 2.4% |
| 45 to 59 Minutes | 1,041 | 7.9% |
| 60 to 89 Minutes | 545 | 4.1% |
| 90 or more Minutes | 281 | 2.1% |
Commute Time by Sex in Merritt Island
The most common commute times in Merritt Island are 15 to 19 minutes (1,649 commuters, 22.2%) for males and 15 to 19 minutes (1,199 commuters, 20.7%) for females.
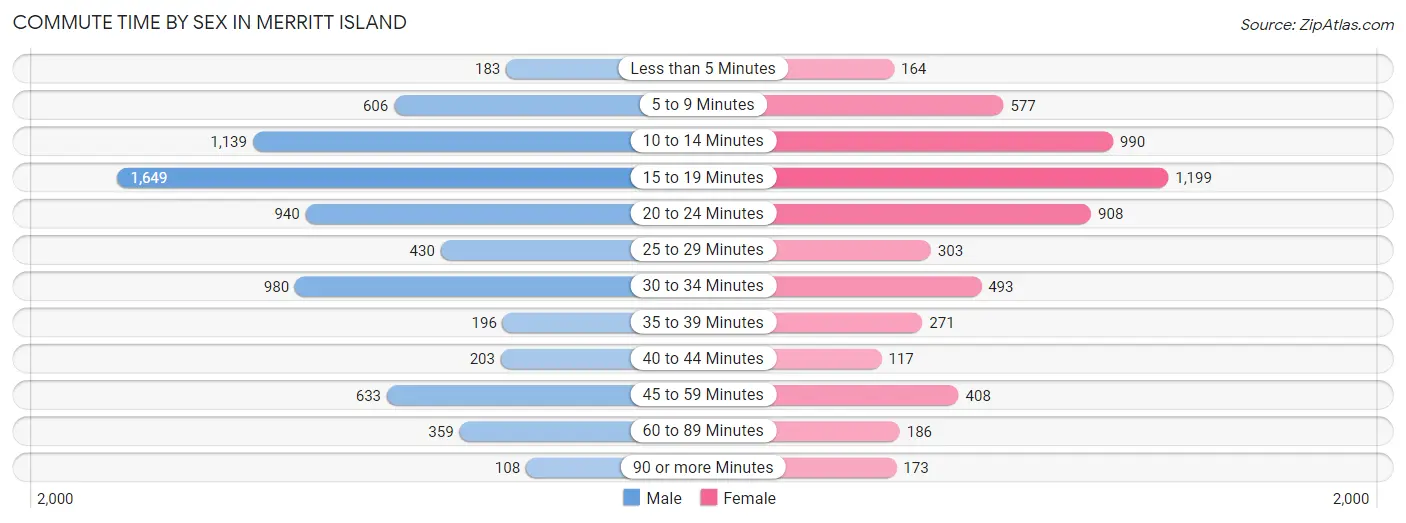
| Commute Time | Male | Female |
| Less than 5 Minutes | 183 (2.5%) | 164 (2.8%) |
| 5 to 9 Minutes | 606 (8.2%) | 577 (10.0%) |
| 10 to 14 Minutes | 1,139 (15.3%) | 990 (17.1%) |
| 15 to 19 Minutes | 1,649 (22.2%) | 1,199 (20.7%) |
| 20 to 24 Minutes | 940 (12.7%) | 908 (15.7%) |
| 25 to 29 Minutes | 430 (5.8%) | 303 (5.2%) |
| 30 to 34 Minutes | 980 (13.2%) | 493 (8.5%) |
| 35 to 39 Minutes | 196 (2.6%) | 271 (4.7%) |
| 40 to 44 Minutes | 203 (2.7%) | 117 (2.0%) |
| 45 to 59 Minutes | 633 (8.5%) | 408 (7.0%) |
| 60 to 89 Minutes | 359 (4.8%) | 186 (3.2%) |
| 90 or more Minutes | 108 (1.5%) | 173 (3.0%) |
Time of Departure to Work by Sex in Merritt Island
The most frequent times of departure to work in Merritt Island are 6:00 AM to 6:29 AM (1,117, 15.0%) for males and 7:30 AM to 7:59 AM (913, 15.8%) for females.
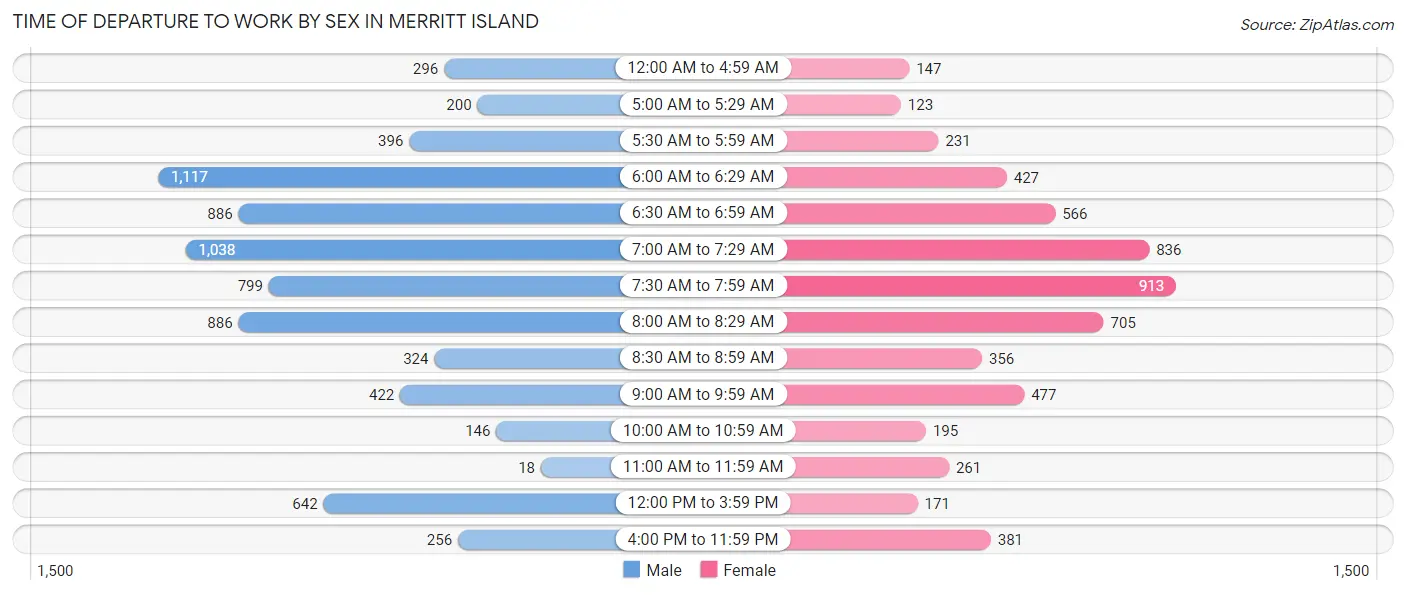
| Time of Departure | Male | Female |
| 12:00 AM to 4:59 AM | 296 (4.0%) | 147 (2.5%) |
| 5:00 AM to 5:29 AM | 200 (2.7%) | 123 (2.1%) |
| 5:30 AM to 5:59 AM | 396 (5.3%) | 231 (4.0%) |
| 6:00 AM to 6:29 AM | 1,117 (15.0%) | 427 (7.4%) |
| 6:30 AM to 6:59 AM | 886 (11.9%) | 566 (9.8%) |
| 7:00 AM to 7:29 AM | 1,038 (14.0%) | 836 (14.4%) |
| 7:30 AM to 7:59 AM | 799 (10.8%) | 913 (15.8%) |
| 8:00 AM to 8:29 AM | 886 (11.9%) | 705 (12.2%) |
| 8:30 AM to 8:59 AM | 324 (4.4%) | 356 (6.1%) |
| 9:00 AM to 9:59 AM | 422 (5.7%) | 477 (8.2%) |
| 10:00 AM to 10:59 AM | 146 (2.0%) | 195 (3.4%) |
| 11:00 AM to 11:59 AM | 18 (0.2%) | 261 (4.5%) |
| 12:00 PM to 3:59 PM | 642 (8.6%) | 171 (2.9%) |
| 4:00 PM to 11:59 PM | 256 (3.5%) | 381 (6.6%) |
| Total | 7,426 (100.0%) | 5,789 (100.0%) |
Housing Occupancy in Merritt Island
Occupancy by Ownership in Merritt Island
Of the total 13,687 dwellings in Merritt Island, owner-occupied units account for 11,124 (81.3%), while renter-occupied units make up 2,563 (18.7%).
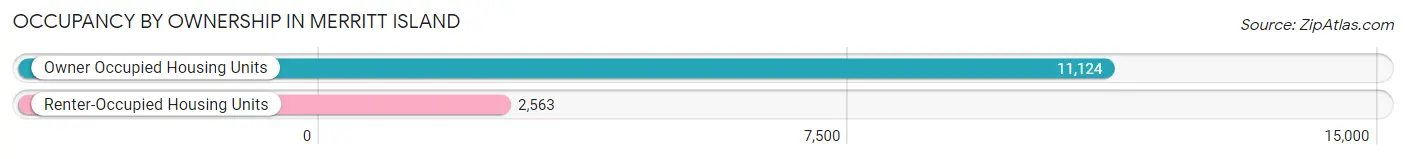
| Occupancy | # Housing Units | % Housing Units |
| Owner Occupied Housing Units | 11,124 | 81.3% |
| Renter-Occupied Housing Units | 2,563 | 18.7% |
| Total Occupied Housing Units | 13,687 | 100.0% |
Occupancy by Household Size in Merritt Island
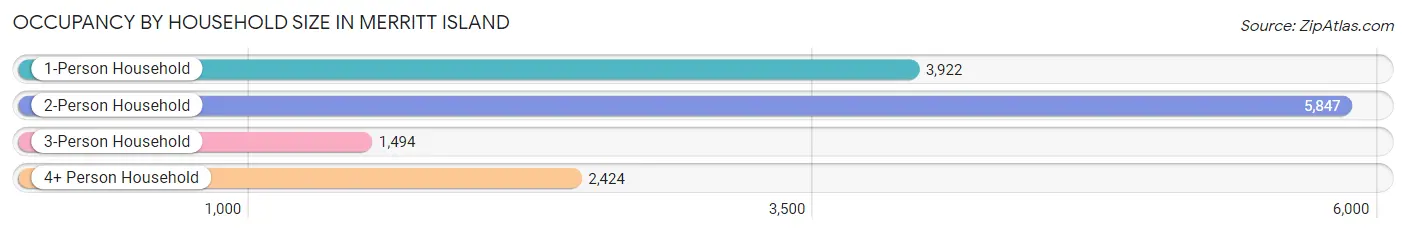
| Household Size | # Housing Units | % Housing Units |
| 1-Person Household | 3,922 | 28.6% |
| 2-Person Household | 5,847 | 42.7% |
| 3-Person Household | 1,494 | 10.9% |
| 4+ Person Household | 2,424 | 17.7% |
| Total Housing Units | 13,687 | 100.0% |
Occupancy by Ownership by Household Size in Merritt Island
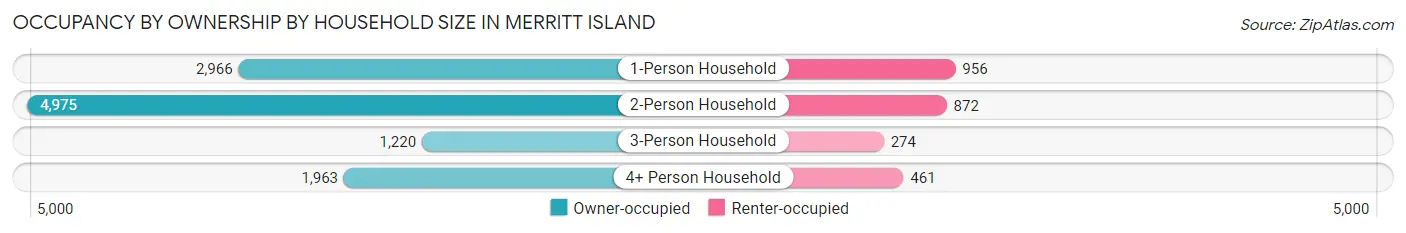
| Household Size | Owner-occupied | Renter-occupied |
| 1-Person Household | 2,966 (75.6%) | 956 (24.4%) |
| 2-Person Household | 4,975 (85.1%) | 872 (14.9%) |
| 3-Person Household | 1,220 (81.7%) | 274 (18.3%) |
| 4+ Person Household | 1,963 (81.0%) | 461 (19.0%) |
| Total Housing Units | 11,124 (81.3%) | 2,563 (18.7%) |
Occupancy by Educational Attainment in Merritt Island
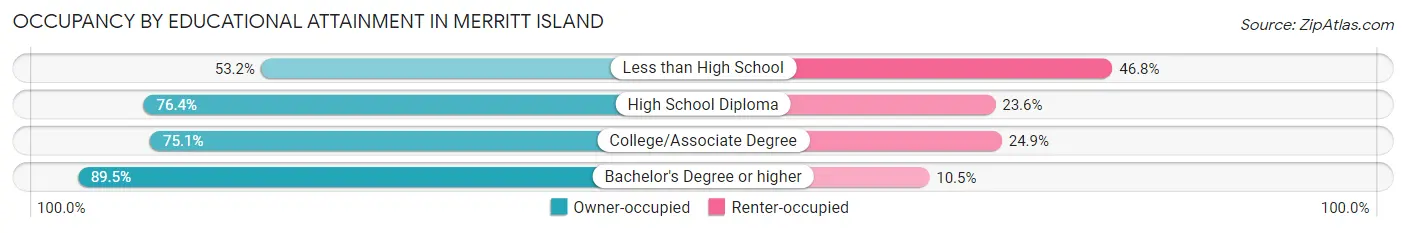
| Household Size | Owner-occupied | Renter-occupied |
| Less than High School | 235 (53.2%) | 207 (46.8%) |
| High School Diploma | 1,967 (76.4%) | 608 (23.6%) |
| College/Associate Degree | 3,261 (75.1%) | 1,081 (24.9%) |
| Bachelor's Degree or higher | 5,661 (89.5%) | 667 (10.5%) |
Occupancy by Age of Householder in Merritt Island
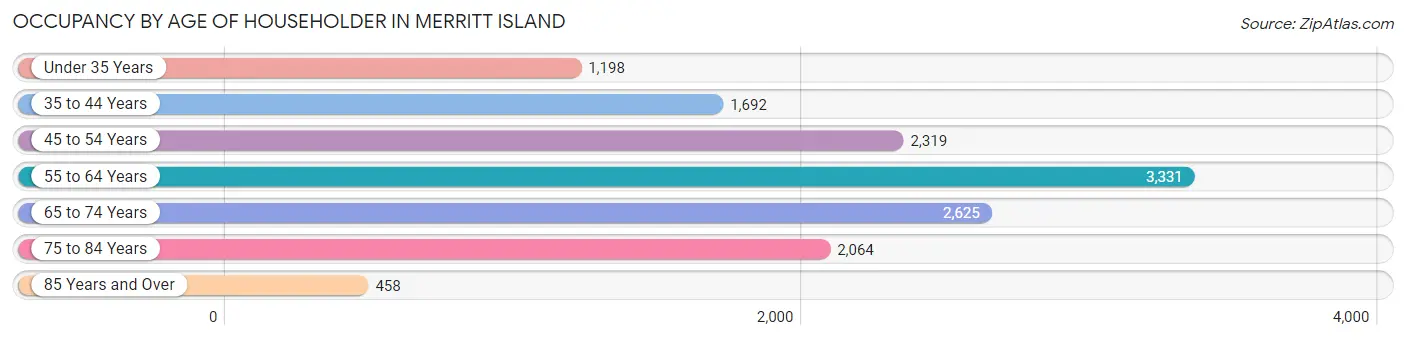
| Age Bracket | # Households | % Households |
| Under 35 Years | 1,198 | 8.7% |
| 35 to 44 Years | 1,692 | 12.4% |
| 45 to 54 Years | 2,319 | 16.9% |
| 55 to 64 Years | 3,331 | 24.3% |
| 65 to 74 Years | 2,625 | 19.2% |
| 75 to 84 Years | 2,064 | 15.1% |
| 85 Years and Over | 458 | 3.4% |
| Total | 13,687 | 100.0% |
Housing Finances in Merritt Island
Median Income by Occupancy in Merritt Island
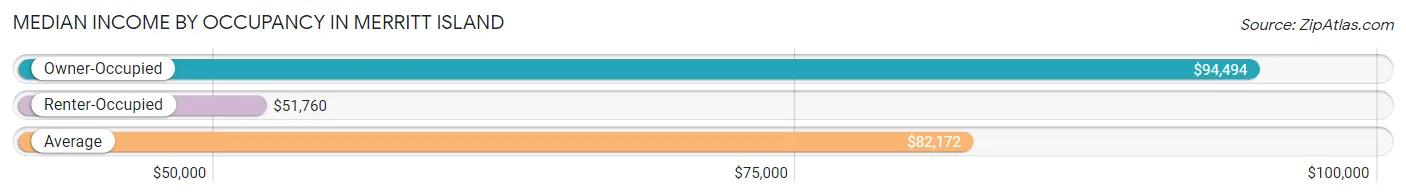
| Occupancy Type | # Households | Median Income |
| Owner-Occupied | 11,124 (81.3%) | $94,494 |
| Renter-Occupied | 2,563 (18.7%) | $51,760 |
| Average | 13,687 (100.0%) | $82,172 |
Occupancy by Householder Income Bracket in Merritt Island
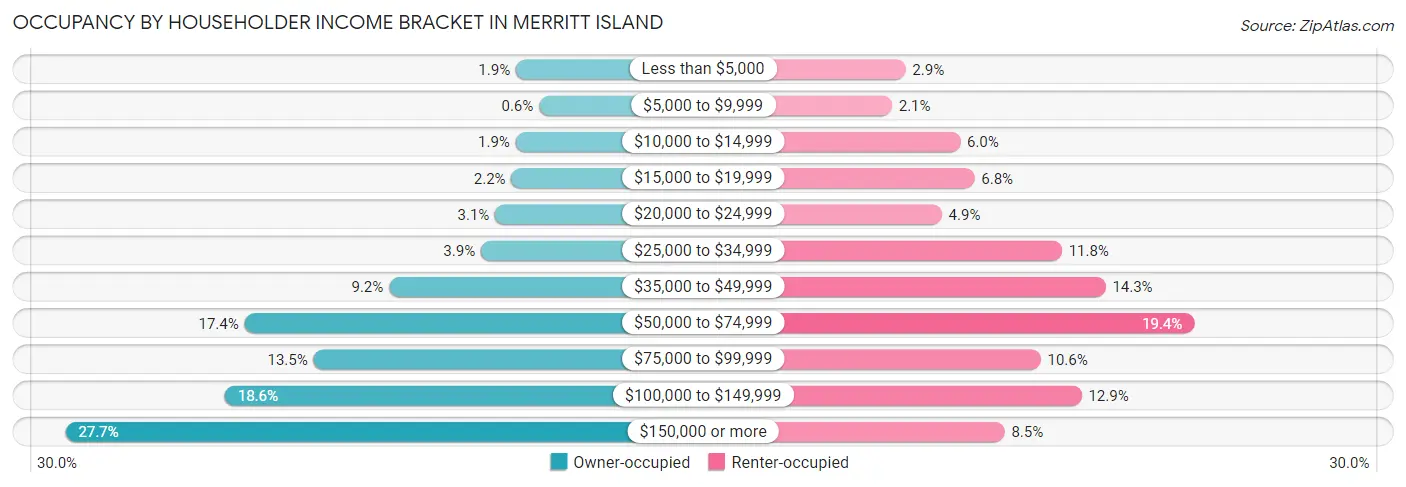
| Income Bracket | Owner-occupied | Renter-occupied |
| Less than $5,000 | 214 (1.9%) | 73 (2.9%) |
| $5,000 to $9,999 | 67 (0.6%) | 53 (2.1%) |
| $10,000 to $14,999 | 216 (1.9%) | 153 (6.0%) |
| $15,000 to $19,999 | 242 (2.2%) | 174 (6.8%) |
| $20,000 to $24,999 | 346 (3.1%) | 126 (4.9%) |
| $25,000 to $34,999 | 436 (3.9%) | 302 (11.8%) |
| $35,000 to $49,999 | 1,020 (9.2%) | 366 (14.3%) |
| $50,000 to $74,999 | 1,939 (17.4%) | 496 (19.4%) |
| $75,000 to $99,999 | 1,501 (13.5%) | 271 (10.6%) |
| $100,000 to $149,999 | 2,065 (18.6%) | 331 (12.9%) |
| $150,000 or more | 3,078 (27.7%) | 218 (8.5%) |
| Total | 11,124 (100.0%) | 2,563 (100.0%) |
Monthly Housing Cost Tiers in Merritt Island
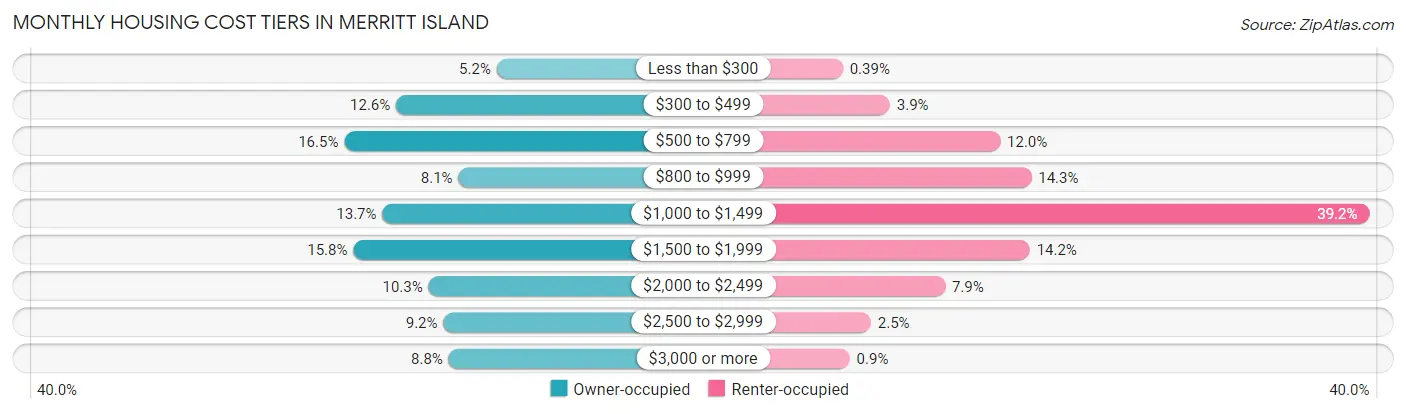
| Monthly Cost | Owner-occupied | Renter-occupied |
| Less than $300 | 582 (5.2%) | 10 (0.4%) |
| $300 to $499 | 1,406 (12.6%) | 99 (3.9%) |
| $500 to $799 | 1,831 (16.5%) | 307 (12.0%) |
| $800 to $999 | 895 (8.1%) | 366 (14.3%) |
| $1,000 to $1,499 | 1,518 (13.7%) | 1,004 (39.2%) |
| $1,500 to $1,999 | 1,757 (15.8%) | 363 (14.2%) |
| $2,000 to $2,499 | 1,140 (10.2%) | 203 (7.9%) |
| $2,500 to $2,999 | 1,019 (9.2%) | 63 (2.5%) |
| $3,000 or more | 976 (8.8%) | 23 (0.9%) |
| Total | 11,124 (100.0%) | 2,563 (100.0%) |
Physical Housing Characteristics in Merritt Island
Housing Structures in Merritt Island
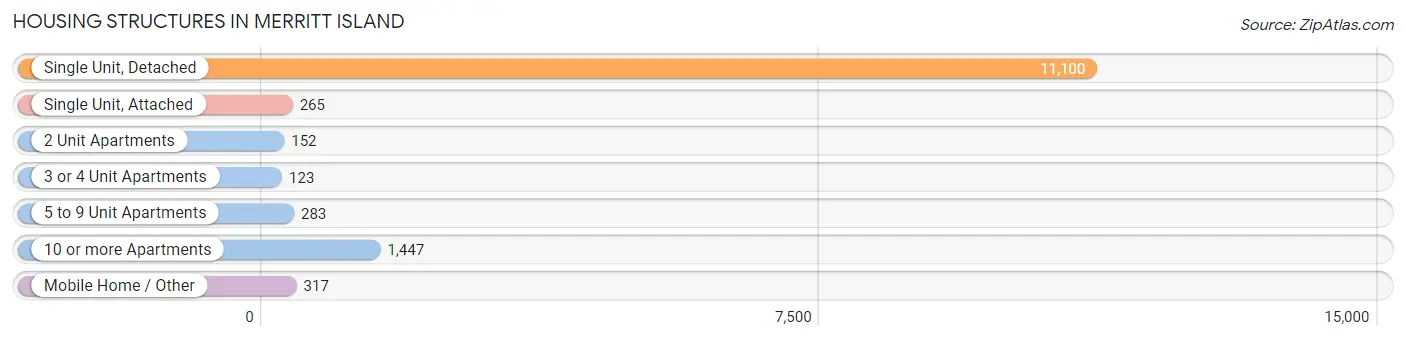
| Structure Type | # Housing Units | % Housing Units |
| Single Unit, Detached | 11,100 | 81.1% |
| Single Unit, Attached | 265 | 1.9% |
| 2 Unit Apartments | 152 | 1.1% |
| 3 or 4 Unit Apartments | 123 | 0.9% |
| 5 to 9 Unit Apartments | 283 | 2.1% |
| 10 or more Apartments | 1,447 | 10.6% |
| Mobile Home / Other | 317 | 2.3% |
| Total | 13,687 | 100.0% |
Housing Structures by Occupancy in Merritt Island
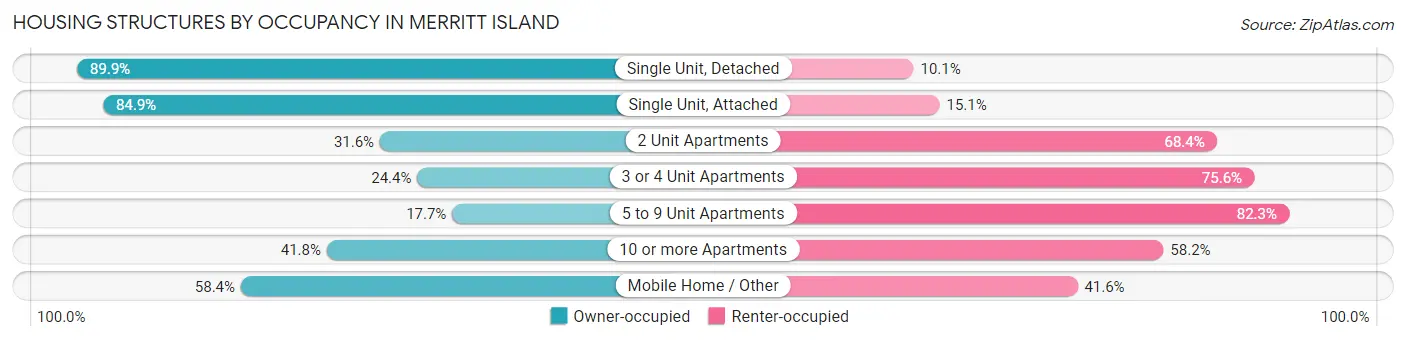
| Structure Type | Owner-occupied | Renter-occupied |
| Single Unit, Detached | 9,981 (89.9%) | 1,119 (10.1%) |
| Single Unit, Attached | 225 (84.9%) | 40 (15.1%) |
| 2 Unit Apartments | 48 (31.6%) | 104 (68.4%) |
| 3 or 4 Unit Apartments | 30 (24.4%) | 93 (75.6%) |
| 5 to 9 Unit Apartments | 50 (17.7%) | 233 (82.3%) |
| 10 or more Apartments | 605 (41.8%) | 842 (58.2%) |
| Mobile Home / Other | 185 (58.4%) | 132 (41.6%) |
| Total | 11,124 (81.3%) | 2,563 (18.7%) |
Housing Structures by Number of Rooms in Merritt Island
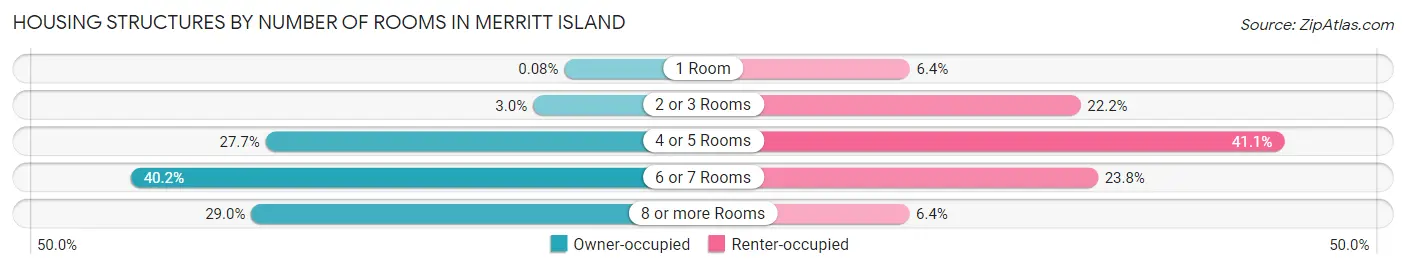
| Number of Rooms | Owner-occupied | Renter-occupied |
| 1 Room | 9 (0.1%) | 165 (6.4%) |
| 2 or 3 Rooms | 331 (3.0%) | 570 (22.2%) |
| 4 or 5 Rooms | 3,084 (27.7%) | 1,053 (41.1%) |
| 6 or 7 Rooms | 4,470 (40.2%) | 611 (23.8%) |
| 8 or more Rooms | 3,230 (29.0%) | 164 (6.4%) |
| Total | 11,124 (100.0%) | 2,563 (100.0%) |
Housing Structure by Heating Type in Merritt Island
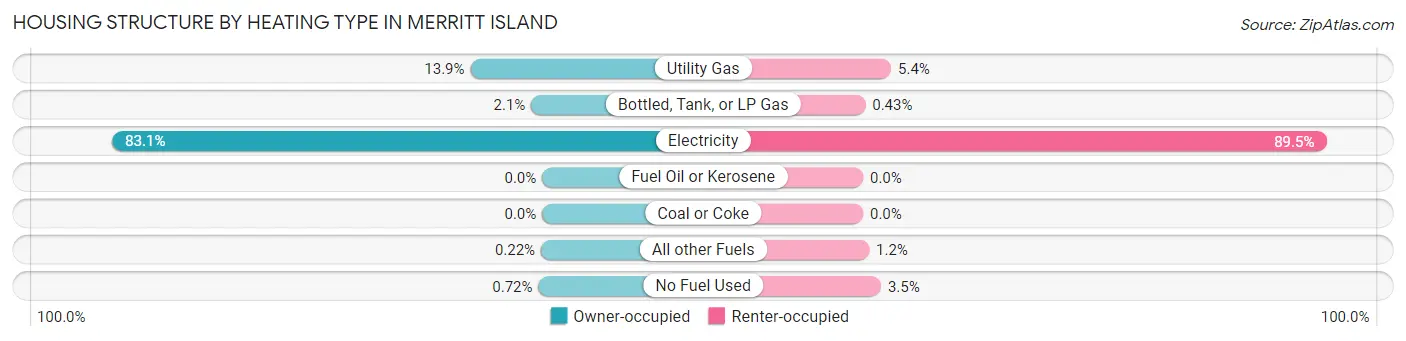
| Heating Type | Owner-occupied | Renter-occupied |
| Utility Gas | 1,542 (13.9%) | 139 (5.4%) |
| Bottled, Tank, or LP Gas | 235 (2.1%) | 11 (0.4%) |
| Electricity | 9,242 (83.1%) | 2,294 (89.5%) |
| Fuel Oil or Kerosene | 0 (0.0%) | 0 (0.0%) |
| Coal or Coke | 0 (0.0%) | 0 (0.0%) |
| All other Fuels | 25 (0.2%) | 30 (1.2%) |
| No Fuel Used | 80 (0.7%) | 89 (3.5%) |
| Total | 11,124 (100.0%) | 2,563 (100.0%) |
Household Vehicle Usage in Merritt Island
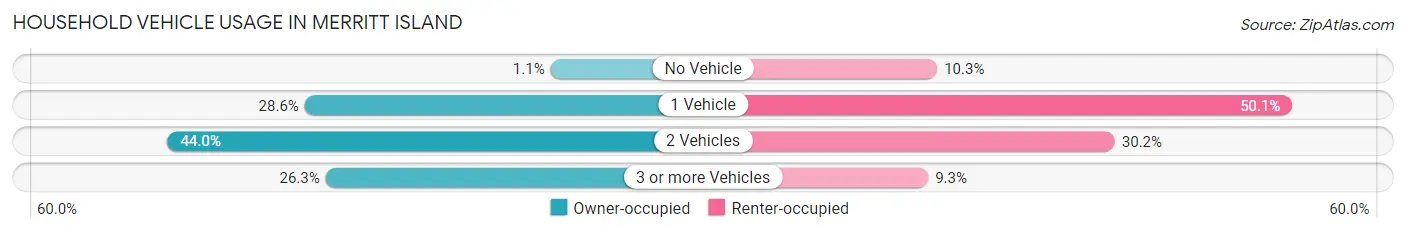
| Vehicles per Household | Owner-occupied | Renter-occupied |
| No Vehicle | 121 (1.1%) | 265 (10.3%) |
| 1 Vehicle | 3,185 (28.6%) | 1,284 (50.1%) |
| 2 Vehicles | 4,894 (44.0%) | 775 (30.2%) |
| 3 or more Vehicles | 2,924 (26.3%) | 239 (9.3%) |
| Total | 11,124 (100.0%) | 2,563 (100.0%) |
Real Estate & Mortgages in Merritt Island
Real Estate and Mortgage Overview in Merritt Island
| Characteristic | Without Mortgage | With Mortgage |
| Housing Units | 5,061 | 6,063 |
| Median Property Value | $322,600 | $372,800 |
| Median Household Income | $74,411 | $2,005 |
| Monthly Housing Costs | $610 | $976 |
| Real Estate Taxes | $2,234 | $127 |
Property Value by Mortgage Status in Merritt Island
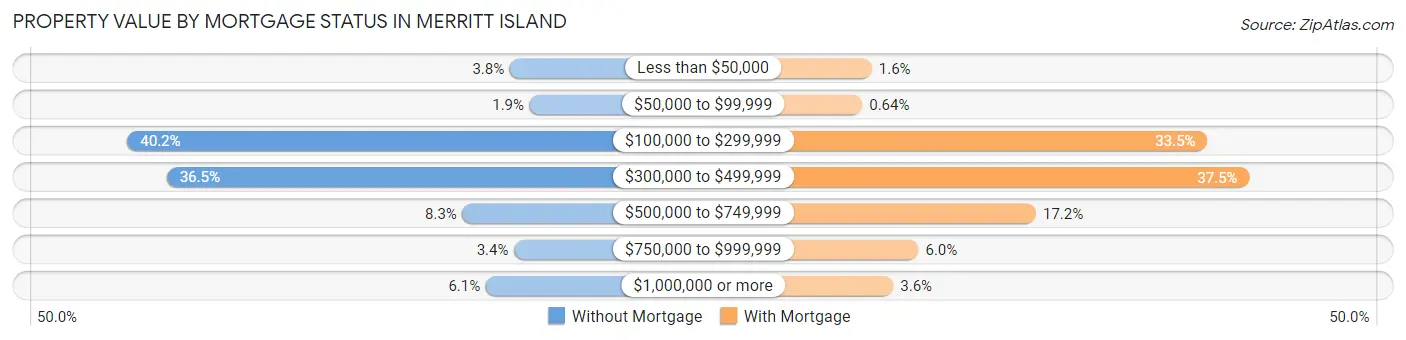
| Property Value | Without Mortgage | With Mortgage |
| Less than $50,000 | 191 (3.8%) | 94 (1.5%) |
| $50,000 to $99,999 | 95 (1.9%) | 39 (0.6%) |
| $100,000 to $299,999 | 2,035 (40.2%) | 2,032 (33.5%) |
| $300,000 to $499,999 | 1,845 (36.5%) | 2,274 (37.5%) |
| $500,000 to $749,999 | 419 (8.3%) | 1,042 (17.2%) |
| $750,000 to $999,999 | 170 (3.4%) | 364 (6.0%) |
| $1,000,000 or more | 306 (6.0%) | 218 (3.6%) |
| Total | 5,061 (100.0%) | 6,063 (100.0%) |
Household Income by Mortgage Status in Merritt Island
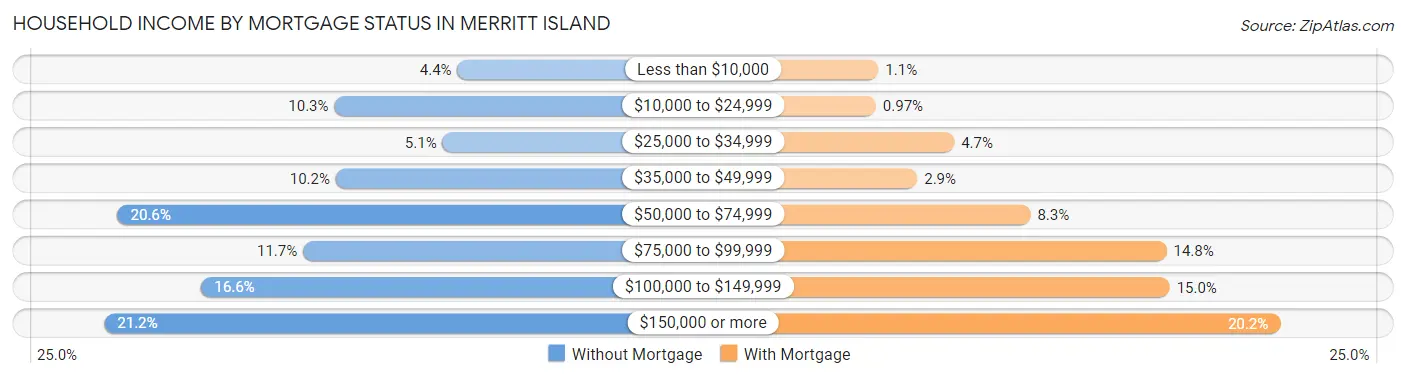
| Household Income | Without Mortgage | With Mortgage |
| Less than $10,000 | 222 (4.4%) | 66 (1.1%) |
| $10,000 to $24,999 | 519 (10.2%) | 59 (1.0%) |
| $25,000 to $34,999 | 258 (5.1%) | 285 (4.7%) |
| $35,000 to $49,999 | 515 (10.2%) | 178 (2.9%) |
| $50,000 to $74,999 | 1,041 (20.6%) | 505 (8.3%) |
| $75,000 to $99,999 | 594 (11.7%) | 898 (14.8%) |
| $100,000 to $149,999 | 839 (16.6%) | 907 (15.0%) |
| $150,000 or more | 1,073 (21.2%) | 1,226 (20.2%) |
| Total | 5,061 (100.0%) | 6,063 (100.0%) |
Property Value to Household Income Ratio in Merritt Island
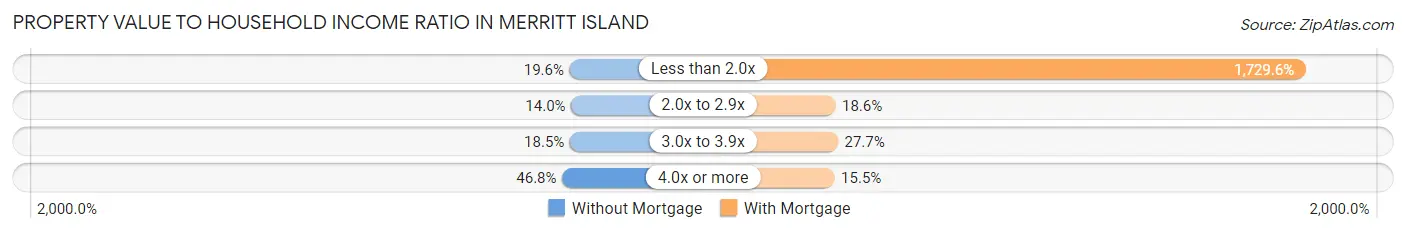
| Value-to-Income Ratio | Without Mortgage | With Mortgage |
| Less than 2.0x | 994 (19.6%) | 104,866 (1,729.6%) |
| 2.0x to 2.9x | 707 (14.0%) | 1,130 (18.6%) |
| 3.0x to 3.9x | 936 (18.5%) | 1,681 (27.7%) |
| 4.0x or more | 2,367 (46.8%) | 937 (15.4%) |
| Total | 5,061 (100.0%) | 6,063 (100.0%) |
Real Estate Taxes by Mortgage Status in Merritt Island
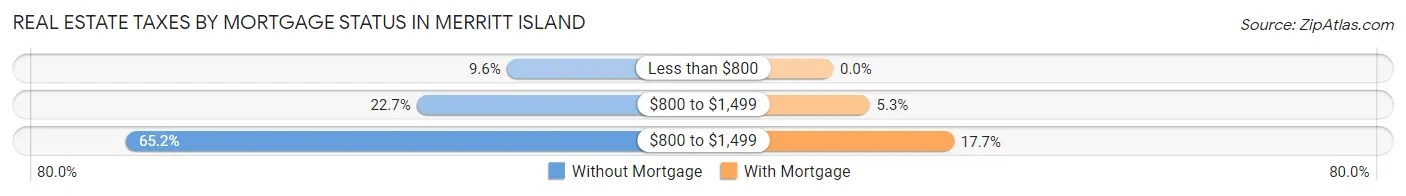
| Property Taxes | Without Mortgage | With Mortgage |
| Less than $800 | 485 (9.6%) | 0 (0.0%) |
| $800 to $1,499 | 1,151 (22.7%) | 324 (5.3%) |
| $800 to $1,499 | 3,299 (65.2%) | 1,070 (17.6%) |
| Total | 5,061 (100.0%) | 6,063 (100.0%) |
Health & Disability in Merritt Island
Health Insurance Coverage by Age in Merritt Island
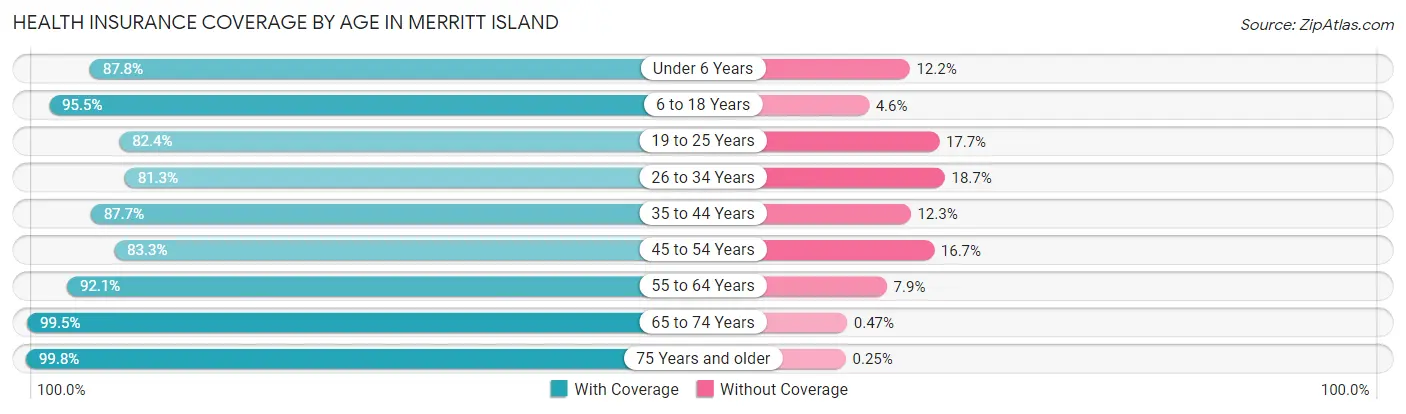
| Age Bracket | With Coverage | Without Coverage |
| Under 6 Years | 1,741 (87.8%) | 241 (12.2%) |
| 6 to 18 Years | 4,198 (95.5%) | 200 (4.5%) |
| 19 to 25 Years | 1,880 (82.4%) | 403 (17.6%) |
| 26 to 34 Years | 2,193 (81.3%) | 504 (18.7%) |
| 35 to 44 Years | 3,004 (87.7%) | 423 (12.3%) |
| 45 to 54 Years | 3,867 (83.3%) | 775 (16.7%) |
| 55 to 64 Years | 5,364 (92.1%) | 460 (7.9%) |
| 65 to 74 Years | 4,464 (99.5%) | 21 (0.5%) |
| 75 Years and older | 4,068 (99.8%) | 10 (0.3%) |
| Total | 30,779 (91.0%) | 3,037 (9.0%) |
Health Insurance Coverage by Citizenship Status in Merritt Island
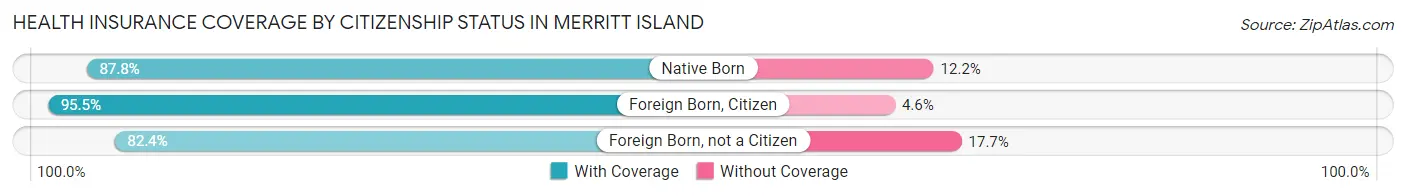
| Citizenship Status | With Coverage | Without Coverage |
| Native Born | 1,741 (87.8%) | 241 (12.2%) |
| Foreign Born, Citizen | 4,198 (95.5%) | 200 (4.5%) |
| Foreign Born, not a Citizen | 1,880 (82.4%) | 403 (17.6%) |
Health Insurance Coverage by Household Income in Merritt Island
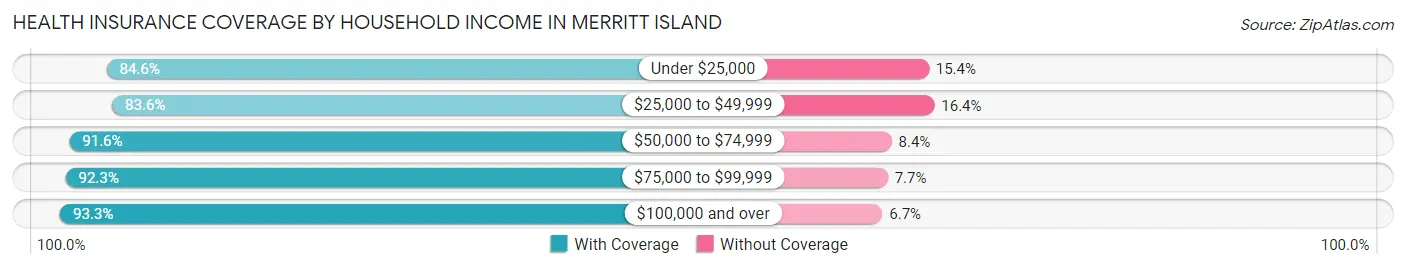
| Household Income | With Coverage | Without Coverage |
| Under $25,000 | 2,133 (84.6%) | 387 (15.4%) |
| $25,000 to $49,999 | 3,723 (83.6%) | 731 (16.4%) |
| $50,000 to $74,999 | 4,607 (91.6%) | 422 (8.4%) |
| $75,000 to $99,999 | 4,106 (92.3%) | 341 (7.7%) |
| $100,000 and over | 16,146 (93.3%) | 1,152 (6.7%) |
Public vs Private Health Insurance Coverage by Age in Merritt Island
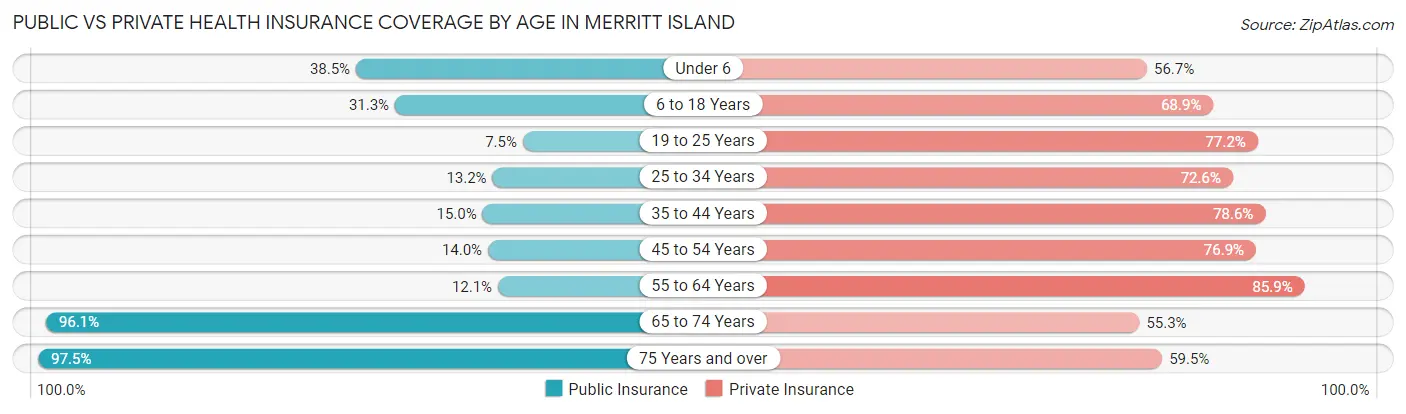
| Age Bracket | Public Insurance | Private Insurance |
| Under 6 | 763 (38.5%) | 1,123 (56.7%) |
| 6 to 18 Years | 1,375 (31.3%) | 3,032 (68.9%) |
| 19 to 25 Years | 172 (7.5%) | 1,762 (77.2%) |
| 25 to 34 Years | 355 (13.2%) | 1,957 (72.6%) |
| 35 to 44 Years | 514 (15.0%) | 2,693 (78.6%) |
| 45 to 54 Years | 650 (14.0%) | 3,568 (76.9%) |
| 55 to 64 Years | 707 (12.1%) | 5,002 (85.9%) |
| 65 to 74 Years | 4,308 (96.1%) | 2,478 (55.2%) |
| 75 Years and over | 3,976 (97.5%) | 2,425 (59.5%) |
| Total | 12,820 (37.9%) | 24,040 (71.1%) |
Disability Status by Sex by Age in Merritt Island
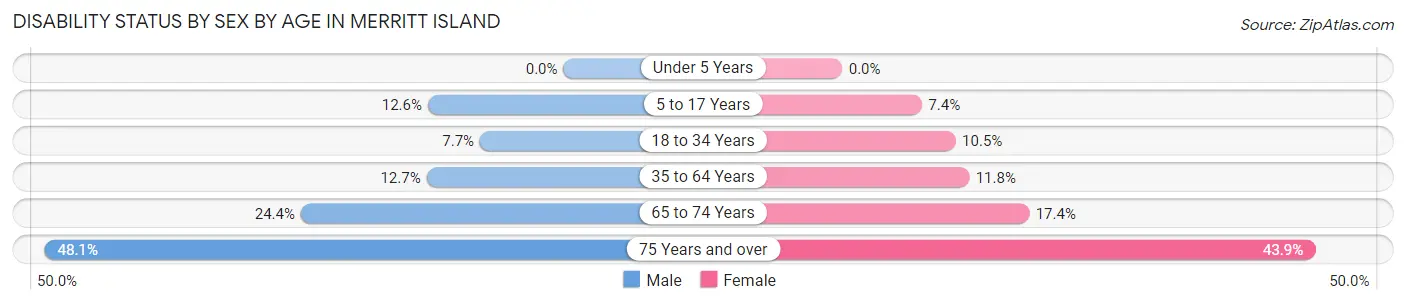
| Age Bracket | Male | Female |
| Under 5 Years | 0 (0.0%) | 0 (0.0%) |
| 5 to 17 Years | 281 (12.6%) | 162 (7.4%) |
| 18 to 34 Years | 232 (7.7%) | 249 (10.5%) |
| 35 to 64 Years | 848 (12.7%) | 850 (11.8%) |
| 65 to 74 Years | 562 (24.4%) | 378 (17.3%) |
| 75 Years and over | 934 (48.1%) | 939 (43.9%) |
Disability Class by Sex by Age in Merritt Island
Disability Class: Hearing Difficulty
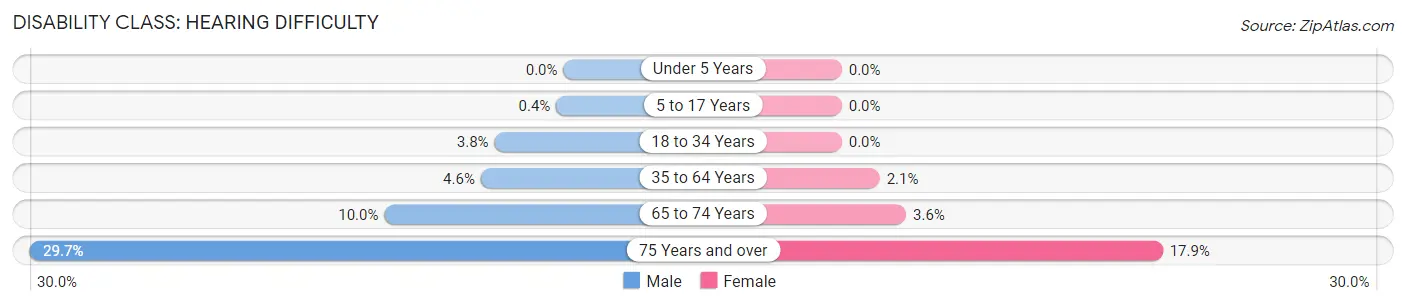
| Age Bracket | Male | Female |
| Under 5 Years | 0 (0.0%) | 0 (0.0%) |
| 5 to 17 Years | 9 (0.4%) | 0 (0.0%) |
| 18 to 34 Years | 115 (3.8%) | 0 (0.0%) |
| 35 to 64 Years | 307 (4.6%) | 152 (2.1%) |
| 65 to 74 Years | 230 (10.0%) | 78 (3.6%) |
| 75 Years and over | 576 (29.7%) | 382 (17.9%) |
Disability Class: Vision Difficulty
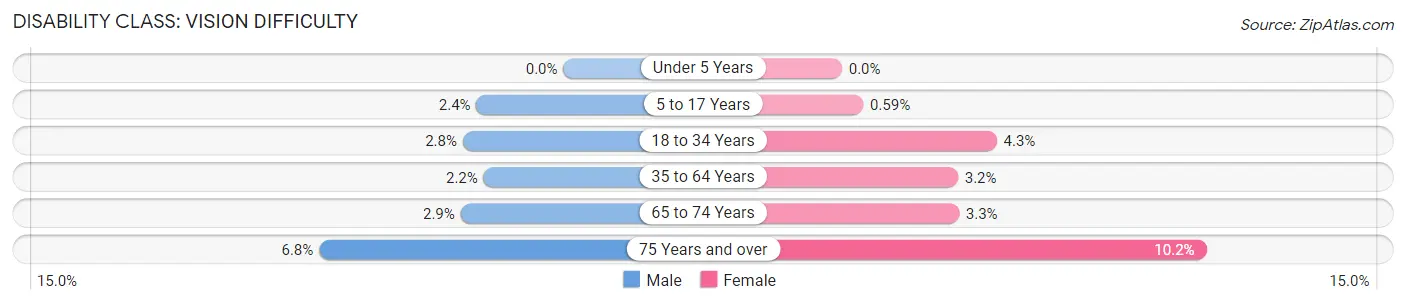
| Age Bracket | Male | Female |
| Under 5 Years | 0 (0.0%) | 0 (0.0%) |
| 5 to 17 Years | 54 (2.4%) | 13 (0.6%) |
| 18 to 34 Years | 84 (2.8%) | 102 (4.3%) |
| 35 to 64 Years | 148 (2.2%) | 233 (3.2%) |
| 65 to 74 Years | 66 (2.9%) | 71 (3.3%) |
| 75 Years and over | 132 (6.8%) | 217 (10.2%) |
Disability Class: Cognitive Difficulty
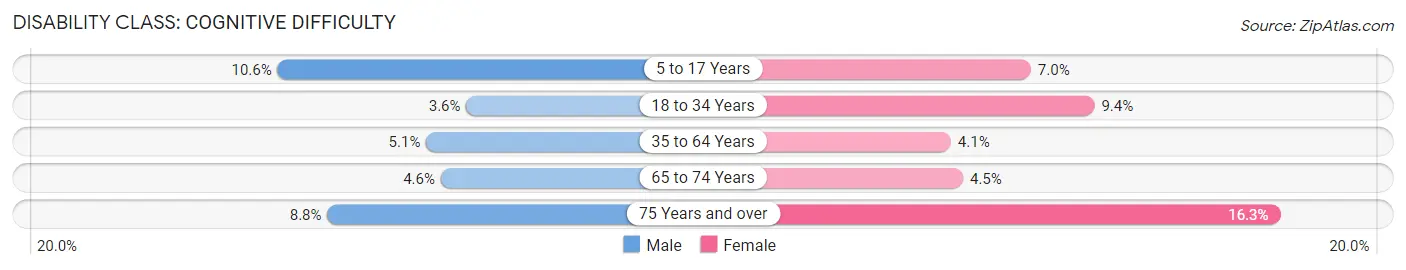
| Age Bracket | Male | Female |
| 5 to 17 Years | 237 (10.6%) | 154 (7.0%) |
| 18 to 34 Years | 108 (3.6%) | 222 (9.4%) |
| 35 to 64 Years | 340 (5.1%) | 292 (4.1%) |
| 65 to 74 Years | 105 (4.5%) | 98 (4.5%) |
| 75 Years and over | 170 (8.8%) | 348 (16.3%) |
Disability Class: Ambulatory Difficulty
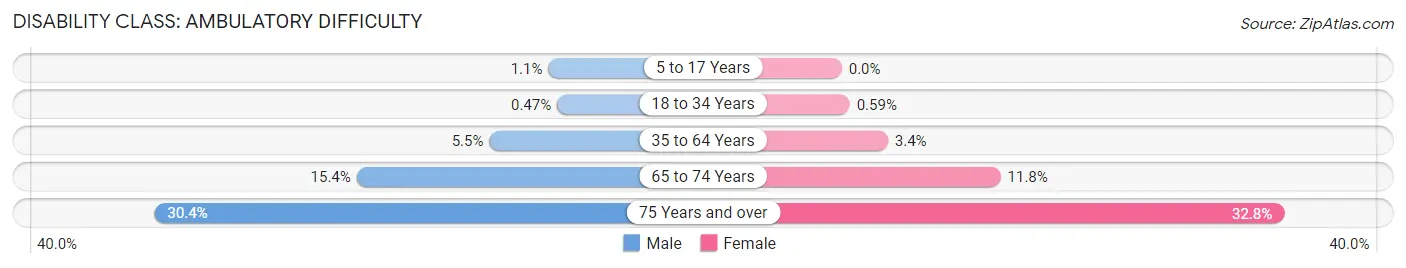
| Age Bracket | Male | Female |
| 5 to 17 Years | 25 (1.1%) | 0 (0.0%) |
| 18 to 34 Years | 14 (0.5%) | 14 (0.6%) |
| 35 to 64 Years | 367 (5.5%) | 247 (3.4%) |
| 65 to 74 Years | 354 (15.3%) | 257 (11.8%) |
| 75 Years and over | 589 (30.4%) | 702 (32.8%) |
Disability Class: Self-Care Difficulty
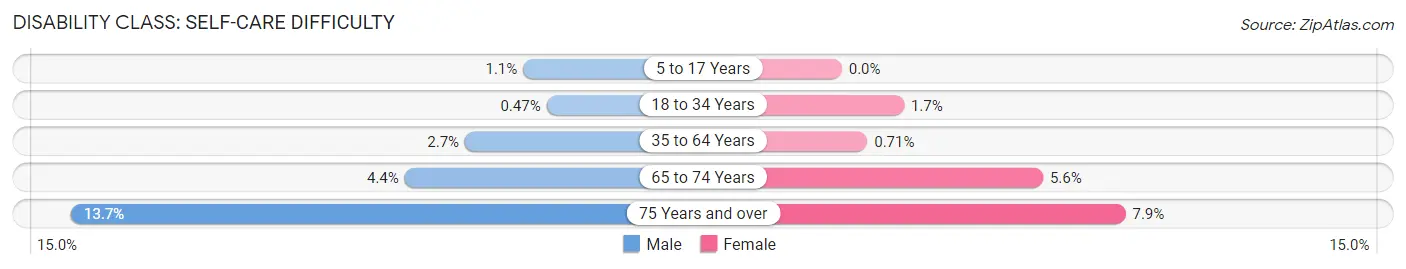
| Age Bracket | Male | Female |
| 5 to 17 Years | 25 (1.1%) | 0 (0.0%) |
| 18 to 34 Years | 14 (0.5%) | 41 (1.7%) |
| 35 to 64 Years | 183 (2.7%) | 51 (0.7%) |
| 65 to 74 Years | 102 (4.4%) | 122 (5.6%) |
| 75 Years and over | 266 (13.7%) | 169 (7.9%) |
Technology Access in Merritt Island
Computing Device Access in Merritt Island
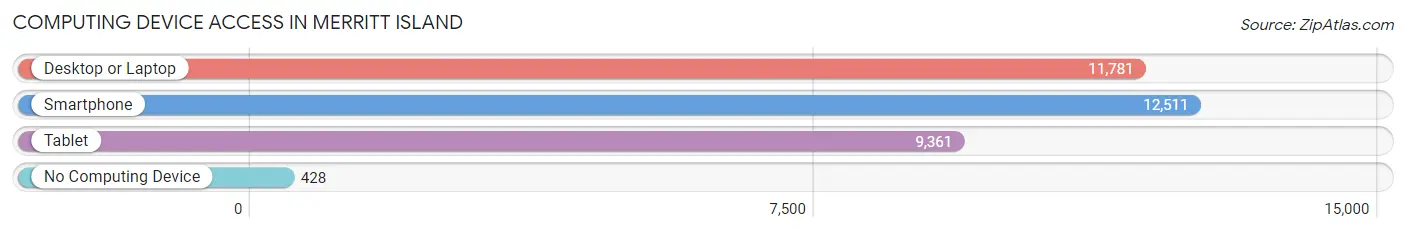
| Device Type | # Households | % Households |
| Desktop or Laptop | 11,781 | 86.1% |
| Smartphone | 12,511 | 91.4% |
| Tablet | 9,361 | 68.4% |
| No Computing Device | 428 | 3.1% |
| Total | 13,687 | 100.0% |
Internet Access in Merritt Island
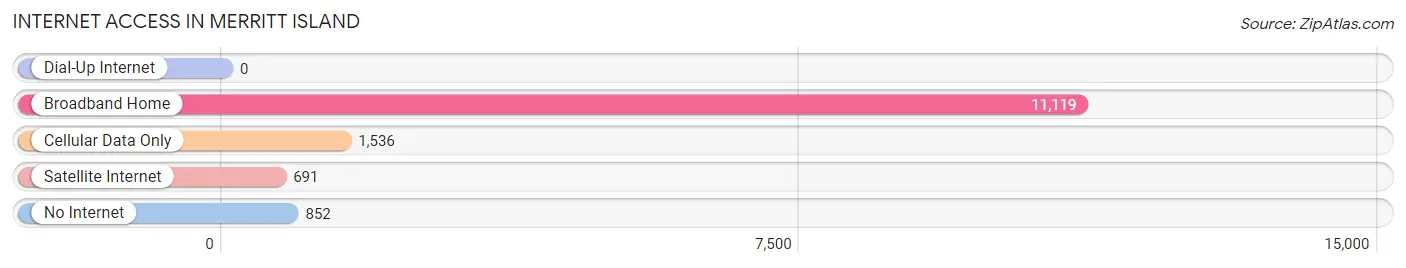
| Internet Type | # Households | % Households |
| Dial-Up Internet | 0 | 0.0% |
| Broadband Home | 11,119 | 81.2% |
| Cellular Data Only | 1,536 | 11.2% |
| Satellite Internet | 691 | 5.1% |
| No Internet | 852 | 6.2% |
| Total | 13,687 | 100.0% |
Merritt Island Summary
Merritt Island is a census-designated place located in Brevard County, Florida, United States. It is situated on the eastern Florida coast, approximately 35 miles east of Orlando. The population of Merritt Island was 34,743 at the 2010 census.
History
Merritt Island was originally inhabited by the Ais Indians, who were part of the Timucua tribe. The Ais were known for their fishing and hunting skills, and they lived in the area for thousands of years before the arrival of Europeans. The first Europeans to settle in the area were the Spanish, who established a mission in the area in 1567. The mission was abandoned in 1572, but the Spanish continued to explore the area and establish settlements.
In the late 1700s, the British began to settle in the area, and the town of Merritt Island was established in 1845. The town was named after the Merritt family, who were among the first settlers in the area. The town grew slowly, but by the early 1900s, it had become a popular tourist destination.
In the 1950s, the United States government began to develop the area for the space program. The Kennedy Space Center was established in 1962, and the area around Merritt Island was transformed into a major aerospace center. The population of Merritt Island increased rapidly during this time, and the town was incorporated in 1966.
Geography
Merritt Island is located in Brevard County, Florida, on the eastern coast of the state. It is situated on a barrier island, which is separated from the mainland by the Indian River Lagoon. The island is approximately 35 miles east of Orlando and is bordered by the Banana River to the south and the Indian River to the north.
The island is approximately 15 miles long and 5 miles wide, and it is divided into two sections by the Banana River. The northern section is known as North Merritt Island, and the southern section is known as South Merritt Island. The island is home to several parks, including the Merritt Island National Wildlife Refuge, which is a popular destination for birdwatchers.
Economy
Merritt Island is home to a diverse economy, with a variety of industries providing employment opportunities. The largest employer in the area is the Kennedy Space Center, which employs over 10,000 people. Other major employers include the Brevard County School District, the Brevard County Sheriff's Office, and the Brevard County Health Department.
The area is also home to a number of small businesses, including restaurants, retail stores, and service providers. Tourism is also an important part of the local economy, with visitors coming to the area to enjoy the beaches, parks, and other attractions.
Demographics
As of the 2010 census, the population of Merritt Island was 34,743. The population is predominantly white (83.3%), with smaller percentages of African Americans (7.3%), Hispanics (4.7%), and Asians (2.2%). The median household income is $50,945, and the median home value is $179,000.
Merritt Island is a diverse community, with a variety of religious denominations represented. The largest religious group is the Catholic Church, followed by the Southern Baptist Convention, the United Methodist Church, and the Church of Jesus Christ of Latter-day Saints.
Conclusion
Merritt Island is a census-designated place located in Brevard County, Florida, United States. It is situated on the eastern Florida coast, approximately 35 miles east of Orlando. The population of Merritt Island was 34,743 at the 2010 census. The town was originally inhabited by the Ais Indians, and it was later settled by the Spanish and the British. In the 1950s, the United States government began to develop the area for the space program, and the Kennedy Space Center was established in 1962. Merritt Island is home to a diverse economy, with a variety of industries providing employment opportunities. The population is predominantly white, with smaller percentages of African Americans, Hispanics, and Asians. The median household income is $50,945, and the median home value is $179,000.
Common Questions
What is Per Capita Income in Merritt Island?
Per Capita income in Merritt Island is $48,751.
What is the Median Family Income in Merritt Island?
Median Family Income in Merritt Island is $108,161.
What is the Median Household income in Merritt Island?
Median Household Income in Merritt Island is $82,172.
What is Income or Wage Gap in Merritt Island?
Income or Wage Gap in Merritt Island is 24.7%.
Women in Merritt Island earn 75.3 cents for every dollar earned by a man.
What is Family Income Deficit in Merritt Island?
Family Income Deficit in Merritt Island is $6,917.
Families that are below poverty line in Merritt Island earn $6,917 less on average than the poverty threshold level.
What is Inequality or Gini Index in Merritt Island?
Inequality or Gini Index in Merritt Island is 0.46.
What is the Total Population of Merritt Island?
Total Population of Merritt Island is 34,300.
What is the Total Male Population of Merritt Island?
Total Male Population of Merritt Island is 17,207.
What is the Total Female Population of Merritt Island?
Total Female Population of Merritt Island is 17,093.
What is the Ratio of Males per 100 Females in Merritt Island?
There are 100.67 Males per 100 Females in Merritt Island.
What is the Ratio of Females per 100 Males in Merritt Island?
There are 99.34 Females per 100 Males in Merritt Island.
What is the Median Population Age in Merritt Island?
Median Population Age in Merritt Island is 50.2 Years.
What is the Average Family Size in Merritt Island
Average Family Size in Merritt Island is 3.1 People.
What is the Average Household Size in Merritt Island
Average Household Size in Merritt Island is 2.5 People.
How Large is the Labor Force in Merritt Island?
There are 16,381 People in the Labor Forcein in Merritt Island.
What is the Percentage of People in the Labor Force in Merritt Island?
56.2% of People are in the Labor Force in Merritt Island.
What is the Unemployment Rate in Merritt Island?
Unemployment Rate in Merritt Island is 4.2%.