Melbourne Beach, FL Map & Demographics
Melbourne Beach Map
Melbourne Beach Overview
$54,614
PER CAPITA INCOME
$127,250
AVG FAMILY INCOME
$80,795
AVG HOUSEHOLD INCOME
37.4%
WAGE / INCOME GAP [ % ]
62.6¢/ $1
WAGE / INCOME GAP [ $ ]
$2,233
FAMILY INCOME DEFICIT
0.52
INEQUALITY / GINI INDEX
3,214
TOTAL POPULATION
1,643
MALE POPULATION
1,571
FEMALE POPULATION
104.58
MALES / 100 FEMALES
95.62
FEMALES / 100 MALES
53.5
MEDIAN AGE
3.0
AVG FAMILY SIZE
2.3
AVG HOUSEHOLD SIZE
1,319
LABOR FORCE [ PEOPLE ]
49.0%
PERCENT IN LABOR FORCE
1.3%
UNEMPLOYMENT RATE
Melbourne Beach Zip Codes
Income in Melbourne Beach
Income Overview in Melbourne Beach
Per Capita Income in Melbourne Beach is $54,614, while median incomes of families and households are $127,250 and $80,795 respectively.
| Characteristic | Number | Measure |
| Per Capita Income | 3,214 | $54,614 |
| Median Family Income | 861 | $127,250 |
| Mean Family Income | 861 | $171,589 |
| Median Household Income | 1,425 | $80,795 |
| Mean Household Income | 1,425 | $121,444 |
| Income Deficit | 861 | $2,233 |
| Wage / Income Gap (%) | 3,214 | 37.36% |
| Wage / Income Gap ($) | 3,214 | 62.64¢ per $1 |
| Gini / Inequality Index | 3,214 | 0.52 |
Earnings by Sex in Melbourne Beach
Average Earnings in Melbourne Beach are $49,583, $55,764 for men and $34,931 for women, a difference of 37.4%.
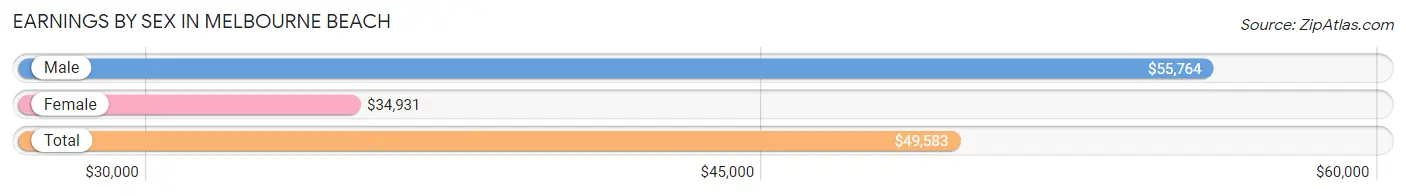
| Sex | Number | Average Earnings |
| Male | 797 (56.8%) | $55,764 |
| Female | 606 (43.2%) | $34,931 |
| Total | 1,403 (100.0%) | $49,583 |
Earnings by Sex by Income Bracket in Melbourne Beach
The most common earnings brackets in Melbourne Beach are $100,000+ for men (316 | 39.7%) and $75,000 to $99,999 for women (100 | 16.5%).
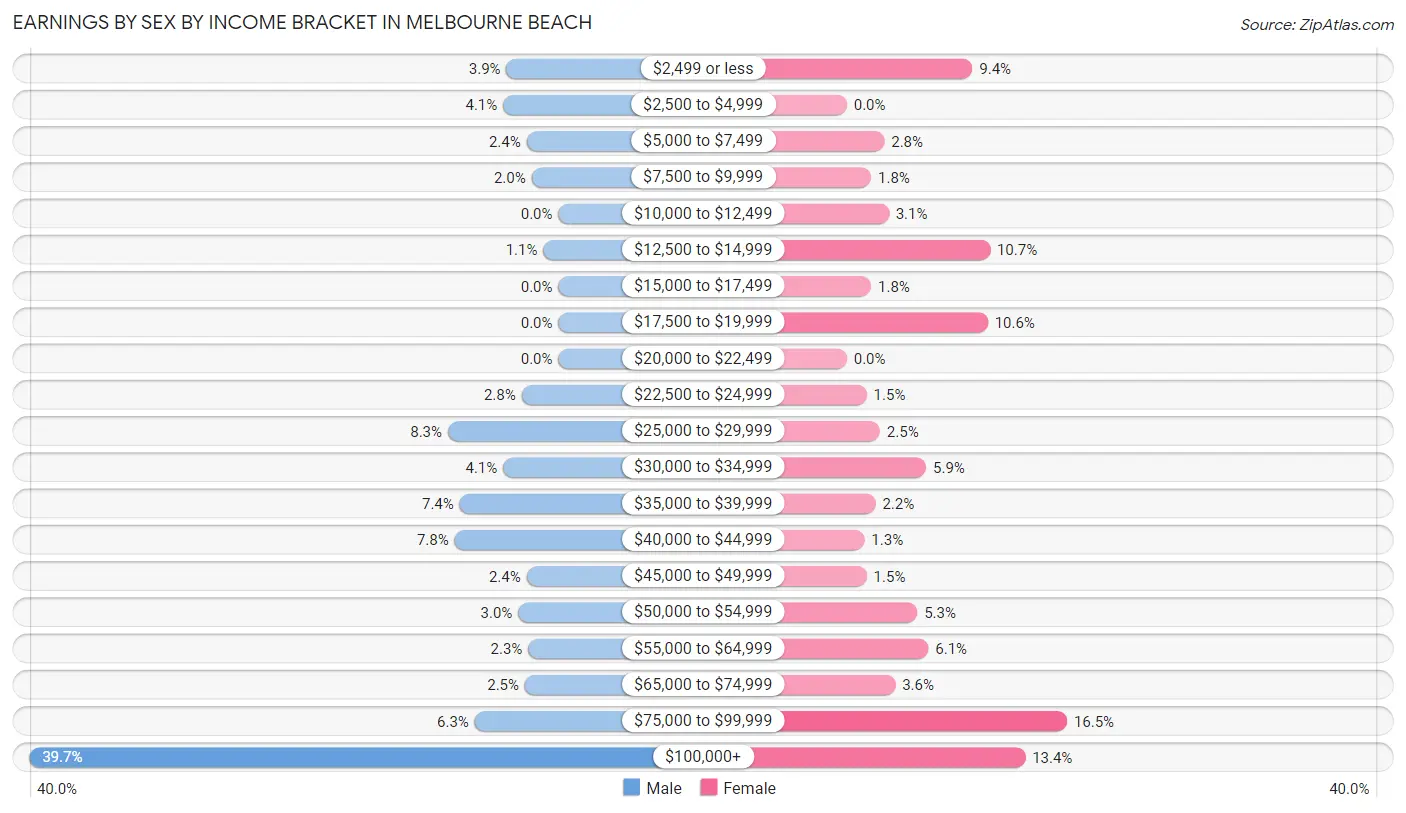
| Income | Male | Female |
| $2,499 or less | 31 (3.9%) | 57 (9.4%) |
| $2,500 to $4,999 | 33 (4.1%) | 0 (0.0%) |
| $5,000 to $7,499 | 19 (2.4%) | 17 (2.8%) |
| $7,500 to $9,999 | 16 (2.0%) | 11 (1.8%) |
| $10,000 to $12,499 | 0 (0.0%) | 19 (3.1%) |
| $12,500 to $14,999 | 9 (1.1%) | 65 (10.7%) |
| $15,000 to $17,499 | 0 (0.0%) | 11 (1.8%) |
| $17,500 to $19,999 | 0 (0.0%) | 64 (10.6%) |
| $20,000 to $22,499 | 0 (0.0%) | 0 (0.0%) |
| $22,500 to $24,999 | 22 (2.8%) | 9 (1.5%) |
| $25,000 to $29,999 | 66 (8.3%) | 15 (2.5%) |
| $30,000 to $34,999 | 33 (4.1%) | 36 (5.9%) |
| $35,000 to $39,999 | 59 (7.4%) | 13 (2.1%) |
| $40,000 to $44,999 | 62 (7.8%) | 8 (1.3%) |
| $45,000 to $49,999 | 19 (2.4%) | 9 (1.5%) |
| $50,000 to $54,999 | 24 (3.0%) | 32 (5.3%) |
| $55,000 to $64,999 | 18 (2.3%) | 37 (6.1%) |
| $65,000 to $74,999 | 20 (2.5%) | 22 (3.6%) |
| $75,000 to $99,999 | 50 (6.3%) | 100 (16.5%) |
| $100,000+ | 316 (39.7%) | 81 (13.4%) |
| Total | 797 (100.0%) | 606 (100.0%) |
Earnings by Sex by Educational Attainment in Melbourne Beach
Average earnings in Melbourne Beach are $80,625 for men and $36,538 for women, a difference of 54.7%. Men with an educational attainment of graduate degree enjoy the highest average annual earnings of $122,589, while those with high school diploma education earn the least with $28,309. Women with an educational attainment of bachelor's degree earn the most with the average annual earnings of $48,889, while those with bachelor's degree education have the smallest earnings of $48,889.
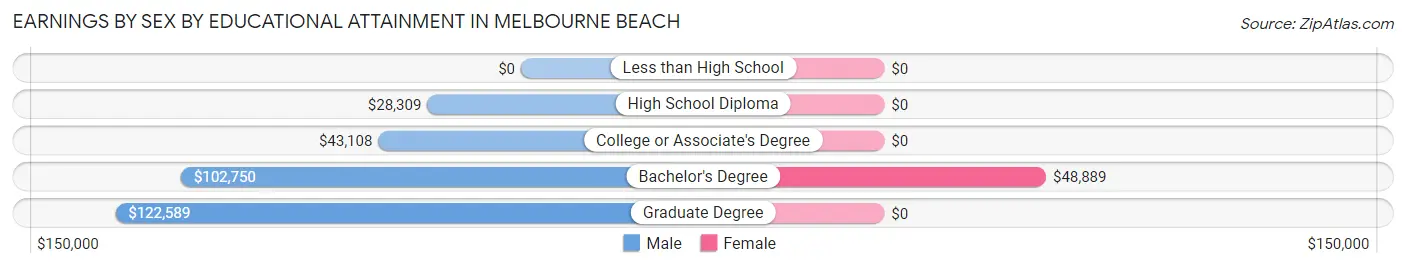
| Educational Attainment | Male Income | Female Income |
| Less than High School | - | - |
| High School Diploma | $28,309 | $0 |
| College or Associate's Degree | $43,108 | $0 |
| Bachelor's Degree | $102,750 | $48,889 |
| Graduate Degree | $122,589 | $0 |
| Total | $80,625 | $36,538 |
Family Income in Melbourne Beach
Family Income Brackets in Melbourne Beach
According to the Melbourne Beach family income data, there are 192 families falling into the $150,000 to $199,999 income range, which is the most common income bracket and makes up 22.3% of all families.
| Income Bracket | # Families | % Families |
| Less than $10,000 | 0 | 0.0% |
| $10,000 to $14,999 | 0 | 0.0% |
| $15,000 to $24,999 | 8 | 0.9% |
| $25,000 to $34,999 | 31 | 3.6% |
| $35,000 to $49,999 | 75 | 8.7% |
| $50,000 to $74,999 | 74 | 8.6% |
| $75,000 to $99,999 | 126 | 14.6% |
| $100,000 to $149,999 | 180 | 20.9% |
| $150,000 to $199,999 | 192 | 22.3% |
| $200,000+ | 175 | 20.3% |
Family Income by Famaliy Size in Melbourne Beach
3-person families (106 | 12.3%) account for the highest median family income in Melbourne Beach with $154,250 per family, while 2-person families (501 | 58.2%) have the highest median income of $63,177 per family member.
| Income Bracket | # Families | Median Income |
| 2-Person Families | 501 (58.2%) | $126,354 |
| 3-Person Families | 106 (12.3%) | $154,250 |
| 4-Person Families | 158 (18.3%) | $117,292 |
| 5-Person Families | 85 (9.9%) | $151,827 |
| 6-Person Families | 11 (1.3%) | $0 |
| 7+ Person Families | 0 (0.0%) | $0 |
| Total | 861 (100.0%) | $127,250 |
Family Income by Number of Earners in Melbourne Beach
The median family income in Melbourne Beach is $127,250, with families comprising 2 earners (298) having the highest median family income of $189,000, while families with 1 earner (255) have the lowest median family income of $91,343, accounting for 34.6% and 29.6% of families, respectively.
| Number of Earners | # Families | Median Income |
| No Earners | 250 (29.0%) | $102,596 |
| 1 Earner | 255 (29.6%) | $91,343 |
| 2 Earners | 298 (34.6%) | $189,000 |
| 3+ Earners | 58 (6.7%) | $154,000 |
| Total | 861 (100.0%) | $127,250 |
Household Income in Melbourne Beach
Household Income Brackets in Melbourne Beach
With 259 households falling in the category, the $100,000 to $149,999 income range is the most frequent in Melbourne Beach, accounting for 18.2% of all households. In contrast, only 58 households (4.1%) fall into the less than $10,000 income bracket, making it the least populous group.
| Income Bracket | # Households | % Households |
| Less than $10,000 | 58 | 4.1% |
| $10,000 to $14,999 | 73 | 5.1% |
| $15,000 to $24,999 | 130 | 9.1% |
| $25,000 to $34,999 | 101 | 7.1% |
| $35,000 to $49,999 | 135 | 9.5% |
| $50,000 to $74,999 | 155 | 10.9% |
| $75,000 to $99,999 | 145 | 10.2% |
| $100,000 to $149,999 | 259 | 18.2% |
| $150,000 to $199,999 | 192 | 13.5% |
| $200,000+ | 175 | 12.3% |
Household Income by Householder Age in Melbourne Beach
The median household income in Melbourne Beach is $80,795, with the highest median household income of $88,875 found in the 45 to 64 years age bracket for the primary householder. A total of 607 households (42.6%) fall into this category.
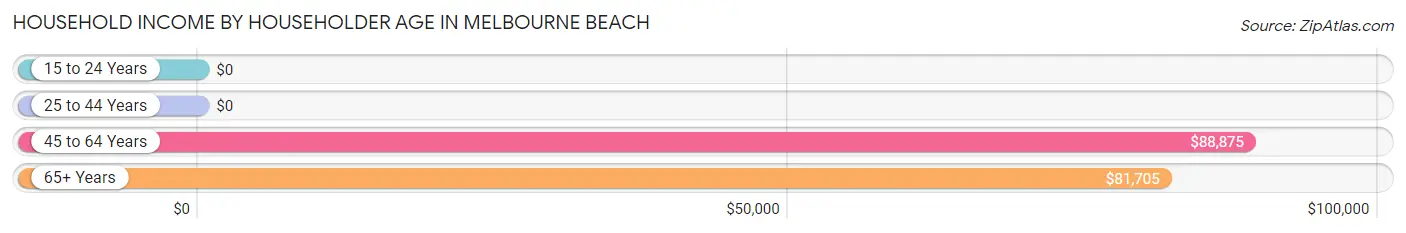
| Income Bracket | # Households | Median Income |
| 15 to 24 Years | 0 (0.0%) | $0 |
| 25 to 44 Years | 265 (18.6%) | $0 |
| 45 to 64 Years | 607 (42.6%) | $88,875 |
| 65+ Years | 553 (38.8%) | $81,705 |
| Total | 1,425 (100.0%) | $80,795 |
Poverty in Melbourne Beach
Income Below Poverty by Sex and Age in Melbourne Beach
With 10.9% poverty level for males and 12.5% for females among the residents of Melbourne Beach, 5 year old males and 25 to 34 year old females are the most vulnerable to poverty, with 11 males (100.0%) and 28 females (34.2%) in their respective age groups living below the poverty level.
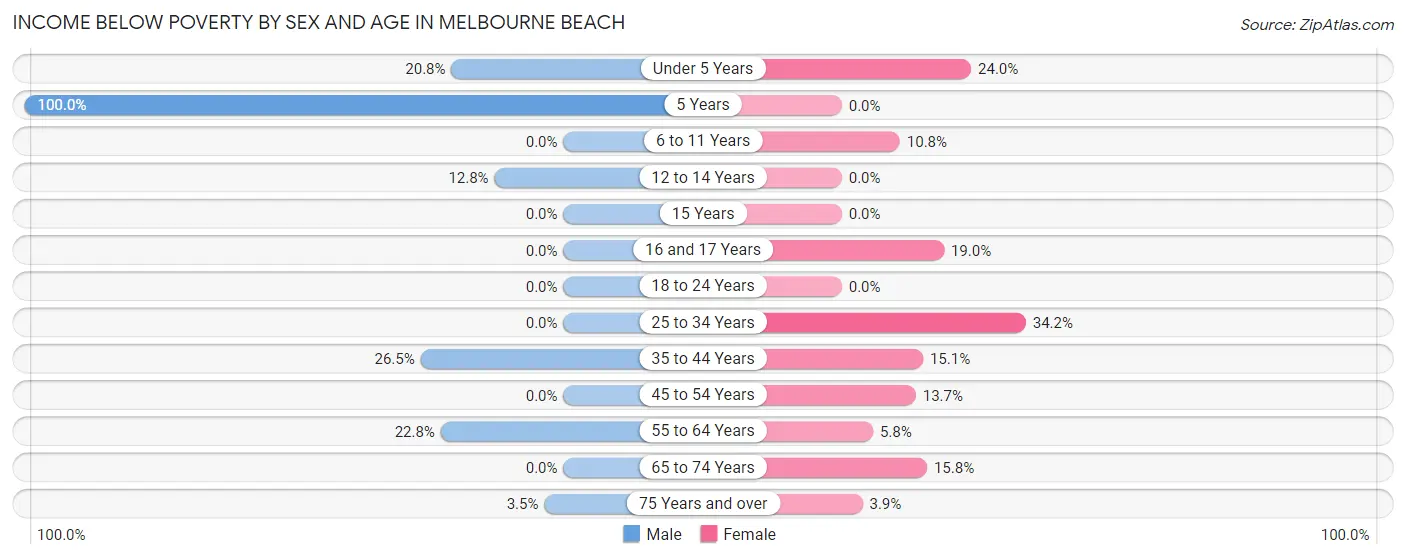
| Age Bracket | Male | Female |
| Under 5 Years | 21 (20.8%) | 30 (24.0%) |
| 5 Years | 11 (100.0%) | 0 (0.0%) |
| 6 to 11 Years | 0 (0.0%) | 11 (10.8%) |
| 12 to 14 Years | 11 (12.8%) | 0 (0.0%) |
| 15 Years | 0 (0.0%) | 0 (0.0%) |
| 16 and 17 Years | 0 (0.0%) | 11 (19.0%) |
| 18 to 24 Years | 0 (0.0%) | 0 (0.0%) |
| 25 to 34 Years | 0 (0.0%) | 28 (34.2%) |
| 35 to 44 Years | 57 (26.5%) | 22 (15.1%) |
| 45 to 54 Years | 0 (0.0%) | 25 (13.7%) |
| 55 to 64 Years | 69 (22.8%) | 18 (5.8%) |
| 65 to 74 Years | 0 (0.0%) | 43 (15.8%) |
| 75 Years and over | 10 (3.5%) | 9 (3.8%) |
| Total | 179 (10.9%) | 197 (12.5%) |
Income Above Poverty by Sex and Age in Melbourne Beach
According to the poverty statistics in Melbourne Beach, males aged 6 to 11 years and females aged 5 years are the age groups that are most secure financially, with 100.0% of males and 100.0% of females in these age groups living above the poverty line.
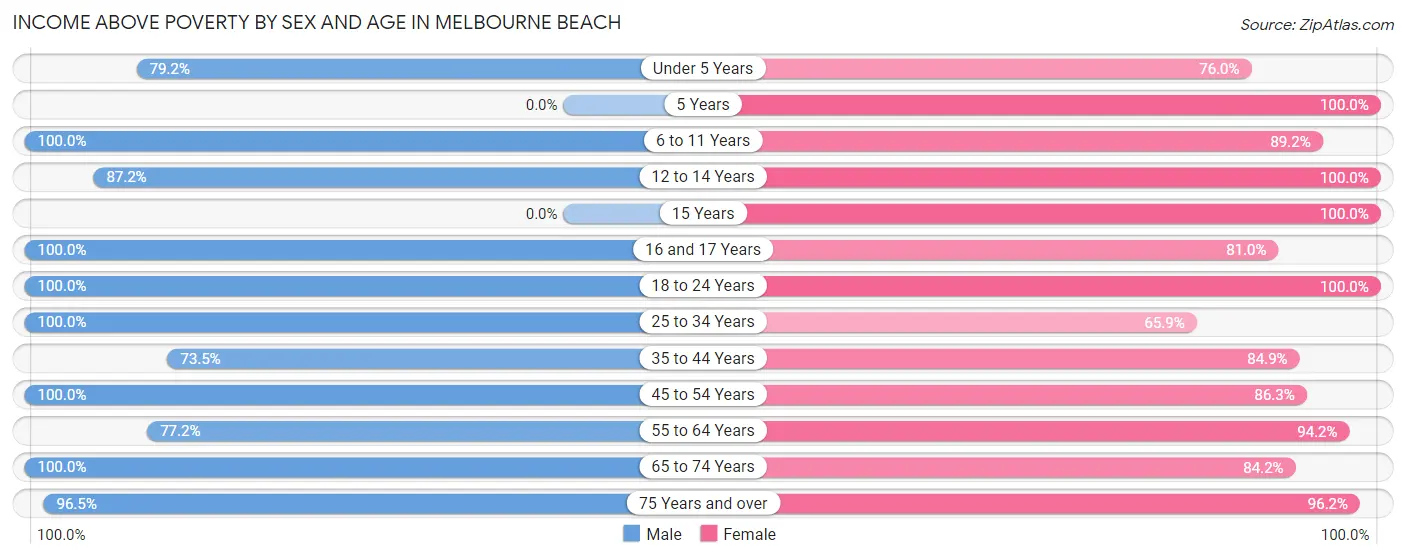
| Age Bracket | Male | Female |
| Under 5 Years | 80 (79.2%) | 95 (76.0%) |
| 5 Years | 0 (0.0%) | 12 (100.0%) |
| 6 to 11 Years | 57 (100.0%) | 91 (89.2%) |
| 12 to 14 Years | 75 (87.2%) | 13 (100.0%) |
| 15 Years | 0 (0.0%) | 16 (100.0%) |
| 16 and 17 Years | 14 (100.0%) | 47 (81.0%) |
| 18 to 24 Years | 112 (100.0%) | 18 (100.0%) |
| 25 to 34 Years | 150 (100.0%) | 54 (65.8%) |
| 35 to 44 Years | 158 (73.5%) | 124 (84.9%) |
| 45 to 54 Years | 153 (100.0%) | 157 (86.3%) |
| 55 to 64 Years | 234 (77.2%) | 293 (94.2%) |
| 65 to 74 Years | 158 (100.0%) | 229 (84.2%) |
| 75 Years and over | 273 (96.5%) | 225 (96.2%) |
| Total | 1,464 (89.1%) | 1,374 (87.5%) |
Income Below Poverty Among Married-Couple Families in Melbourne Beach
The poverty statistics for married-couple families in Melbourne Beach show that 6.5% or 52 of the total 801 families live below the poverty line. Families with 3 or 4 children have the highest poverty rate of 28.2%, comprising of 11 families. On the other hand, families with no children have the lowest poverty rate of 1.5%, which includes 8 families.
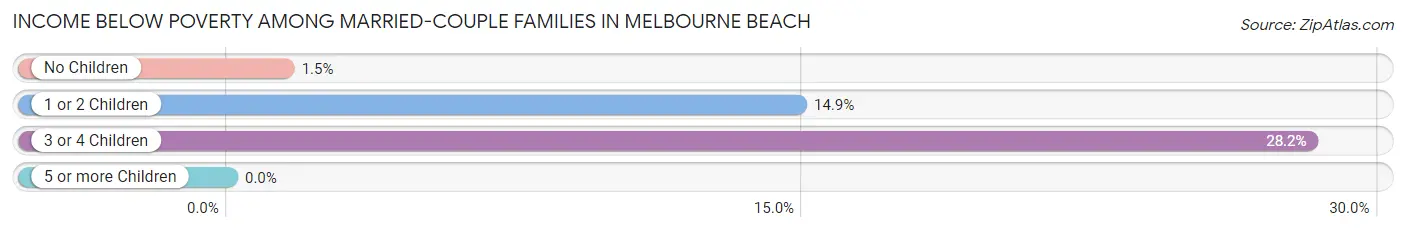
| Children | Above Poverty | Below Poverty |
| No Children | 532 (98.5%) | 8 (1.5%) |
| 1 or 2 Children | 189 (85.1%) | 33 (14.9%) |
| 3 or 4 Children | 28 (71.8%) | 11 (28.2%) |
| 5 or more Children | 0 (0.0%) | 0 (0.0%) |
| Total | 749 (93.5%) | 52 (6.5%) |
Income Below Poverty Among Single-Parent Households in Melbourne Beach
| Children | Single Father | Single Mother |
| No Children | 0 (0.0%) | 0 (0.0%) |
| 1 or 2 Children | 0 (0.0%) | 0 (0.0%) |
| 3 or 4 Children | 0 (0.0%) | 0 (0.0%) |
| 5 or more Children | 0 (0.0%) | 0 (0.0%) |
| Total | 0 (0.0%) | 0 (0.0%) |
Income Below Poverty Among Married-Couple vs Single-Parent Households in Melbourne Beach
| Children | Married-Couple Families | Single-Parent Households |
| No Children | 8 (1.5%) | 0 (0.0%) |
| 1 or 2 Children | 33 (14.9%) | 0 (0.0%) |
| 3 or 4 Children | 11 (28.2%) | 0 (0.0%) |
| 5 or more Children | 0 (0.0%) | 0 (0.0%) |
| Total | 52 (6.5%) | 0 (0.0%) |
Race in Melbourne Beach
The most populous races in Melbourne Beach are White / Caucasian (3,035 | 94.4%), Hispanic or Latino (286 | 8.9%), and Two or more Races (137 | 4.3%).
| Race | # Population | % Population |
| Asian | 42 | 1.3% |
| Black / African American | 0 | 0.0% |
| Hawaiian / Pacific | 0 | 0.0% |
| Hispanic or Latino | 286 | 8.9% |
| Native / Alaskan | 0 | 0.0% |
| White / Caucasian | 3,035 | 94.4% |
| Two or more Races | 137 | 4.3% |
| Some other Race | 0 | 0.0% |
| Total | 3,214 | 100.0% |
Ancestry in Melbourne Beach
The most populous ancestries reported in Melbourne Beach are Irish (690 | 21.5%), English (623 | 19.4%), German (598 | 18.6%), American (325 | 10.1%), and Italian (253 | 7.9%), together accounting for 77.4% of all Melbourne Beach residents.
| Ancestry | # Population | % Population |
| American | 325 | 10.1% |
| Arab | 28 | 0.9% |
| Armenian | 12 | 0.4% |
| Austrian | 8 | 0.3% |
| Bolivian | 45 | 1.4% |
| British | 42 | 1.3% |
| Burmese | 25 | 0.8% |
| Canadian | 33 | 1.0% |
| Colombian | 18 | 0.6% |
| Czechoslovakian | 22 | 0.7% |
| Danish | 28 | 0.9% |
| Dutch | 13 | 0.4% |
| Eastern European | 13 | 0.4% |
| English | 623 | 19.4% |
| European | 49 | 1.5% |
| Finnish | 33 | 1.0% |
| French | 112 | 3.5% |
| German | 598 | 18.6% |
| Hungarian | 9 | 0.3% |
| Irish | 690 | 21.5% |
| Italian | 253 | 7.9% |
| Korean | 32 | 1.0% |
| Lithuanian | 38 | 1.2% |
| Mexican | 119 | 3.7% |
| Northern European | 13 | 0.4% |
| Norwegian | 20 | 0.6% |
| Palestinian | 28 | 0.9% |
| Pennsylvania German | 17 | 0.5% |
| Polish | 192 | 6.0% |
| Puerto Rican | 79 | 2.5% |
| Romanian | 8 | 0.3% |
| Russian | 9 | 0.3% |
| Scotch-Irish | 15 | 0.5% |
| Scottish | 178 | 5.5% |
| Slavic | 9 | 0.3% |
| South American | 63 | 2.0% |
| Spaniard | 25 | 0.8% |
| Sri Lankan | 10 | 0.3% |
| Swedish | 57 | 1.8% |
| Swiss | 17 | 0.5% |
| Ukrainian | 13 | 0.4% |
| Welsh | 79 | 2.5% | View All 42 Rows |
Immigrants in Melbourne Beach
The most numerous immigrant groups reported in Melbourne Beach came from Europe (80 | 2.5%), Germany (71 | 2.2%), Western Europe (71 | 2.2%), Canada (45 | 1.4%), and Asia (38 | 1.2%), together accounting for 9.5% of all Melbourne Beach residents.
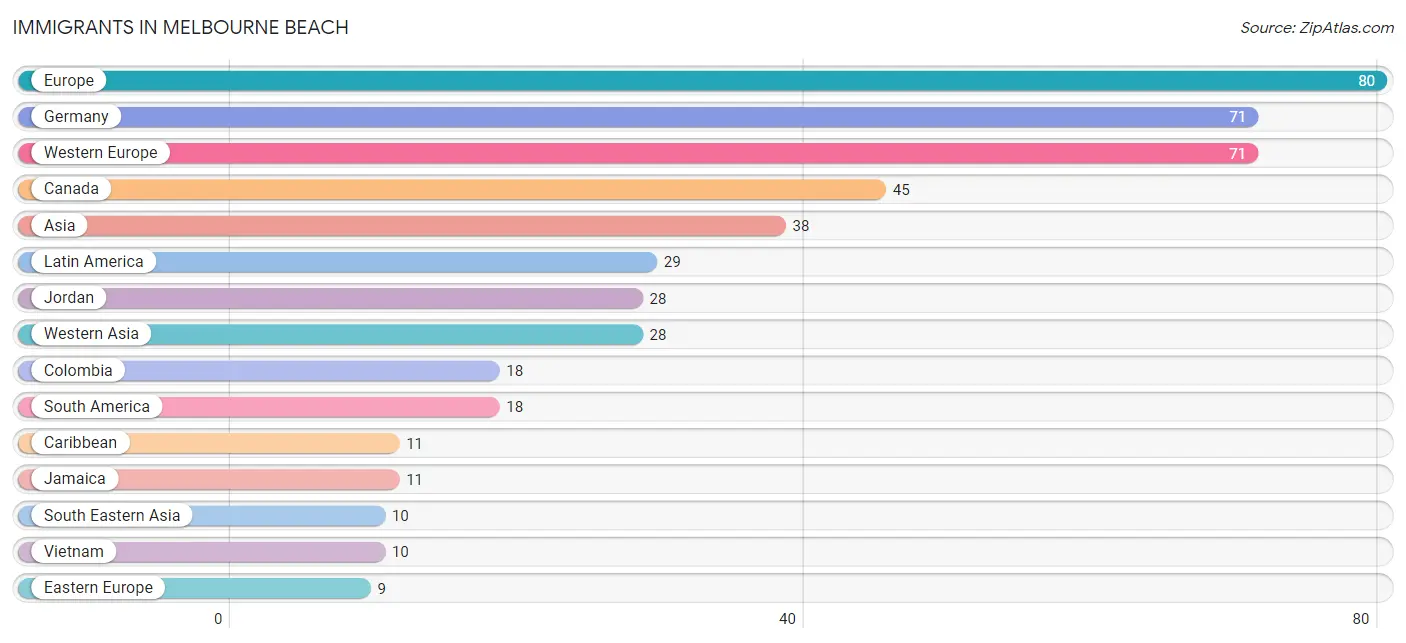
| Immigration Origin | # Population | % Population |
| Asia | 38 | 1.2% |
| Canada | 45 | 1.4% |
| Caribbean | 11 | 0.3% |
| Colombia | 18 | 0.6% |
| Eastern Europe | 9 | 0.3% |
| Europe | 80 | 2.5% |
| Germany | 71 | 2.2% |
| Jamaica | 11 | 0.3% |
| Jordan | 28 | 0.9% |
| Latin America | 29 | 0.9% |
| South America | 18 | 0.6% |
| South Eastern Asia | 10 | 0.3% |
| Vietnam | 10 | 0.3% |
| Western Asia | 28 | 0.9% |
| Western Europe | 71 | 2.2% | View All 15 Rows |
Sex and Age in Melbourne Beach
Sex and Age in Melbourne Beach
The most populous age groups in Melbourne Beach are 60 to 64 Years (163 | 9.9%) for men and 55 to 59 Years (197 | 12.5%) for women.
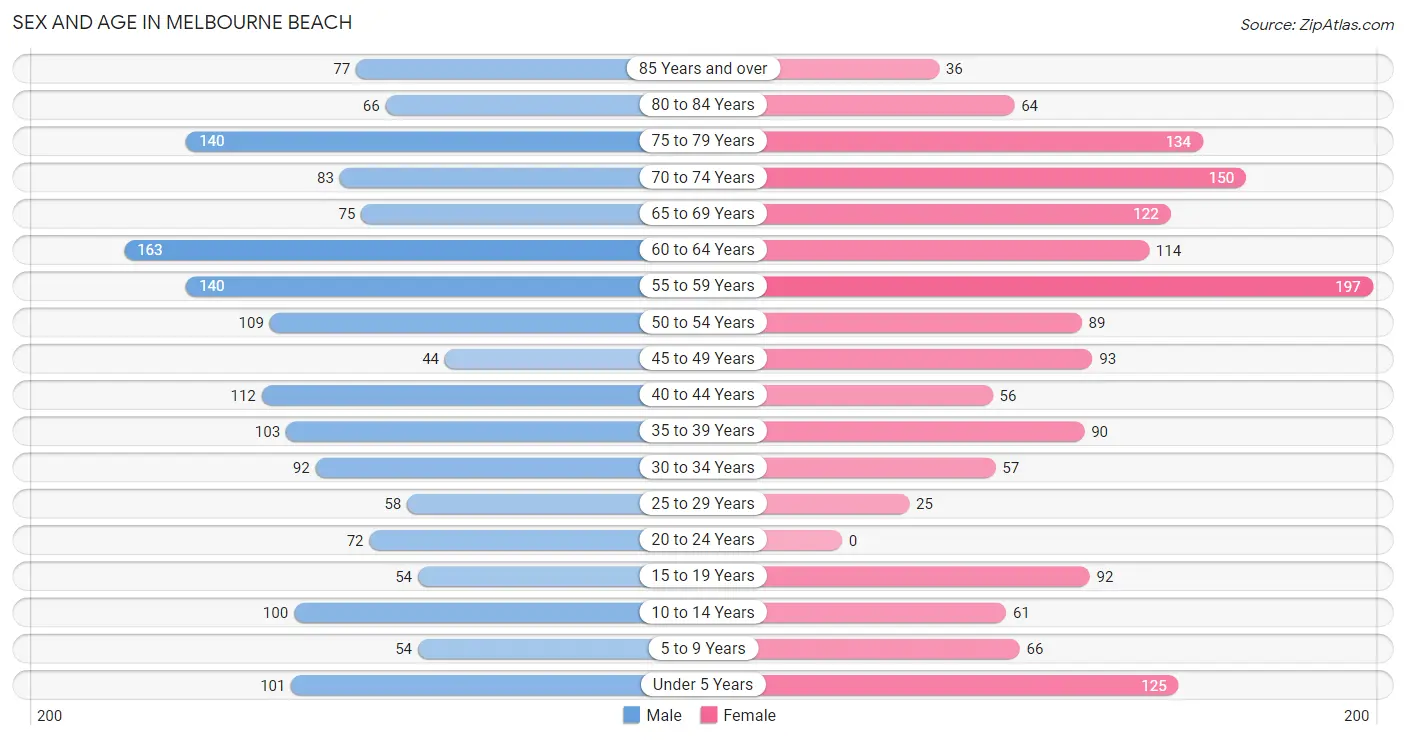
| Age Bracket | Male | Female |
| Under 5 Years | 101 (6.1%) | 125 (8.0%) |
| 5 to 9 Years | 54 (3.3%) | 66 (4.2%) |
| 10 to 14 Years | 100 (6.1%) | 61 (3.9%) |
| 15 to 19 Years | 54 (3.3%) | 92 (5.9%) |
| 20 to 24 Years | 72 (4.4%) | 0 (0.0%) |
| 25 to 29 Years | 58 (3.5%) | 25 (1.6%) |
| 30 to 34 Years | 92 (5.6%) | 57 (3.6%) |
| 35 to 39 Years | 103 (6.3%) | 90 (5.7%) |
| 40 to 44 Years | 112 (6.8%) | 56 (3.6%) |
| 45 to 49 Years | 44 (2.7%) | 93 (5.9%) |
| 50 to 54 Years | 109 (6.6%) | 89 (5.7%) |
| 55 to 59 Years | 140 (8.5%) | 197 (12.5%) |
| 60 to 64 Years | 163 (9.9%) | 114 (7.3%) |
| 65 to 69 Years | 75 (4.6%) | 122 (7.8%) |
| 70 to 74 Years | 83 (5.1%) | 150 (9.6%) |
| 75 to 79 Years | 140 (8.5%) | 134 (8.5%) |
| 80 to 84 Years | 66 (4.0%) | 64 (4.1%) |
| 85 Years and over | 77 (4.7%) | 36 (2.3%) |
| Total | 1,643 (100.0%) | 1,571 (100.0%) |
Families and Households in Melbourne Beach
Median Family Size in Melbourne Beach
The median family size in Melbourne Beach is 3.01 persons per family, with single male/father families (19 | 2.2%) accounting for the largest median family size of 4.11 persons per family. On the other hand, single female/mother families (41 | 4.8%) represent the smallest median family size with 2.83 persons per family.
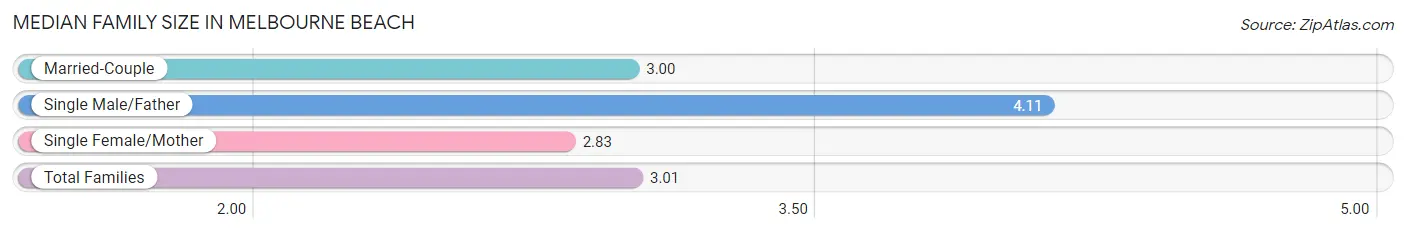
| Family Type | # Families | Family Size |
| Married-Couple | 801 (93.0%) | 3.00 |
| Single Male/Father | 19 (2.2%) | 4.11 |
| Single Female/Mother | 41 (4.8%) | 2.83 |
| Total Families | 861 (100.0%) | 3.01 |
Median Household Size in Melbourne Beach
The median household size in Melbourne Beach is 2.26 persons per household, with single male/father households (19 | 1.3%) accounting for the largest median household size of 4.63 persons per household. non-family households (564 | 39.6%) represent the smallest median household size with 1.08 persons per household.
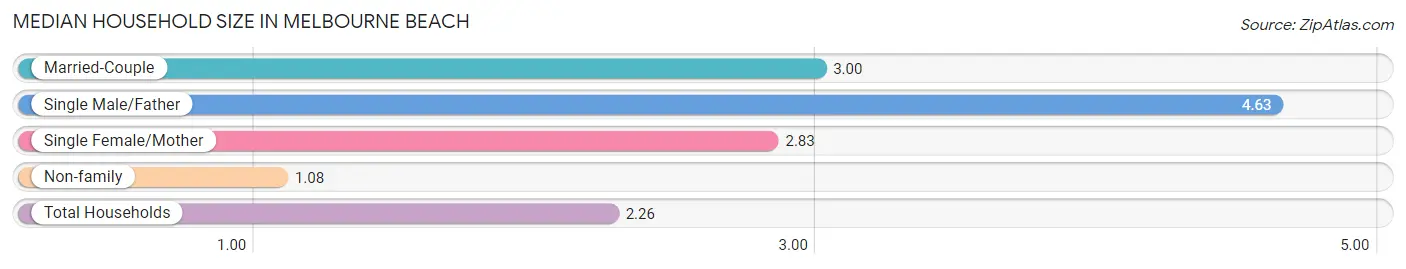
| Household Type | # Households | Household Size |
| Married-Couple | 801 (56.2%) | 3.00 |
| Single Male/Father | 19 (1.3%) | 4.63 |
| Single Female/Mother | 41 (2.9%) | 2.83 |
| Non-family | 564 (39.6%) | 1.08 |
| Total Households | 1,425 (100.0%) | 2.26 |
Household Size by Marriage Status in Melbourne Beach
Out of a total of 1,425 households in Melbourne Beach, 861 (60.4%) are family households, while 564 (39.6%) are nonfamily households. The most numerous type of family households are 2-person households, comprising 501, and the most common type of nonfamily households are 1-person households, comprising 522.
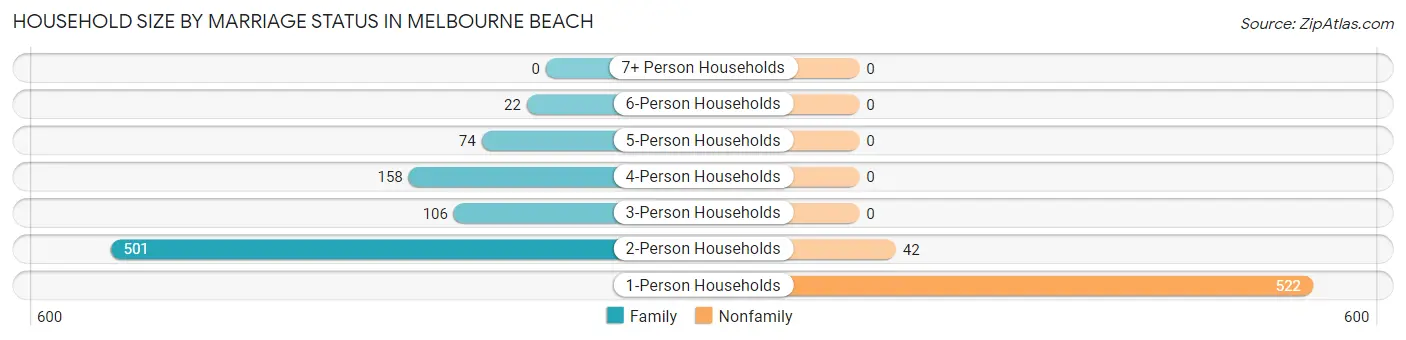
| Household Size | Family Households | Nonfamily Households |
| 1-Person Households | - | 522 (36.6%) |
| 2-Person Households | 501 (35.2%) | 42 (2.9%) |
| 3-Person Households | 106 (7.4%) | 0 (0.0%) |
| 4-Person Households | 158 (11.1%) | 0 (0.0%) |
| 5-Person Households | 74 (5.2%) | 0 (0.0%) |
| 6-Person Households | 22 (1.5%) | 0 (0.0%) |
| 7+ Person Households | 0 (0.0%) | 0 (0.0%) |
| Total | 861 (60.4%) | 564 (39.6%) |
Female Fertility in Melbourne Beach
Fertility by Age in Melbourne Beach
Average fertility rate in Melbourne Beach is 213.0 births per 1,000 women. Women in the age bracket of 20 to 34 years have the highest fertility rate with 439.0 births per 1,000 women. Women in the age bracket of 35 to 50 years acount for 60.0% of all women with births.
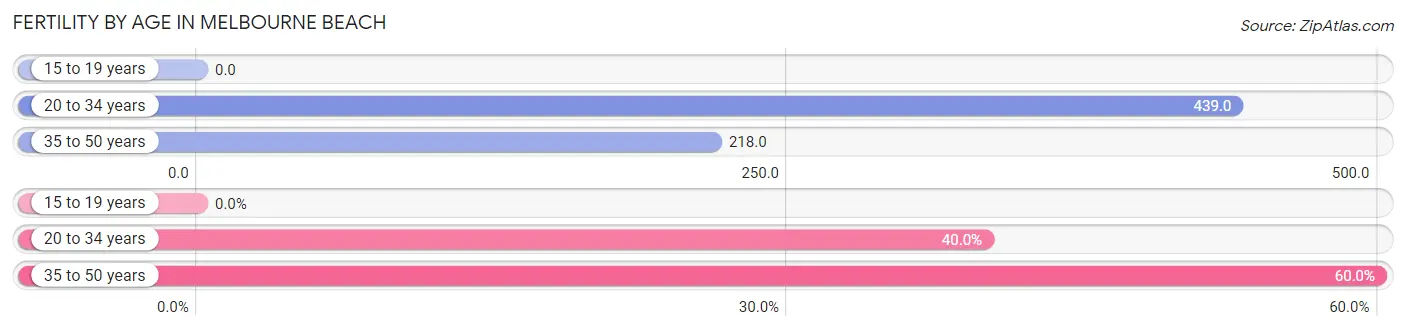
| Age Bracket | Women with Births | Births / 1,000 Women |
| 15 to 19 years | 0 (0.0%) | 0.0 |
| 20 to 34 years | 36 (40.0%) | 439.0 |
| 35 to 50 years | 54 (60.0%) | 218.0 |
| Total | 90 (100.0%) | 213.0 |
Fertility by Age by Marriage Status in Melbourne Beach
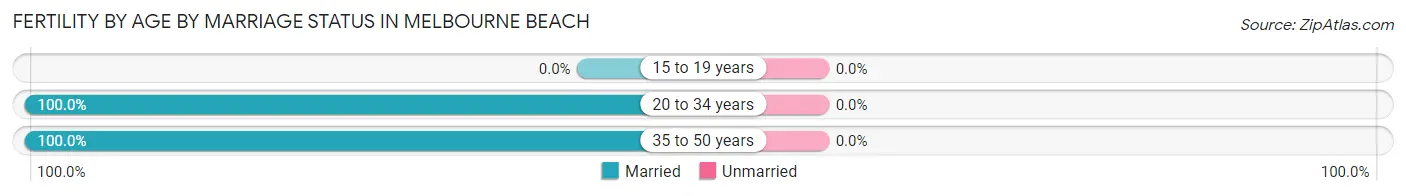
| Age Bracket | Married | Unmarried |
| 15 to 19 years | 0 (0.0%) | 0 (0.0%) |
| 20 to 34 years | 36 (100.0%) | 0 (0.0%) |
| 35 to 50 years | 54 (100.0%) | 0 (0.0%) |
| Total | 90 (100.0%) | 0 (0.0%) |
Fertility by Education in Melbourne Beach
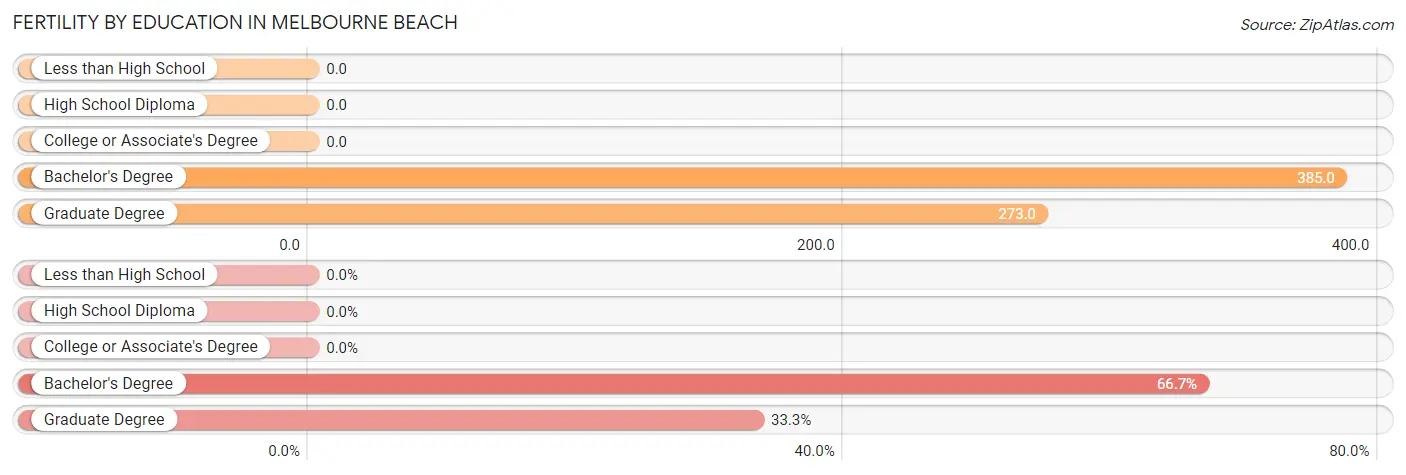
| Educational Attainment | Women with Births | Births / 1,000 Women |
| Less than High School | 0 (0.0%) | 0.0 |
| High School Diploma | 0 (0.0%) | 0.0 |
| College or Associate's Degree | 0 (0.0%) | 0.0 |
| Bachelor's Degree | 60 (66.7%) | 385.0 |
| Graduate Degree | 30 (33.3%) | 273.0 |
| Total | 90 (100.0%) | 213.0 |
Fertility by Education by Marriage Status in Melbourne Beach
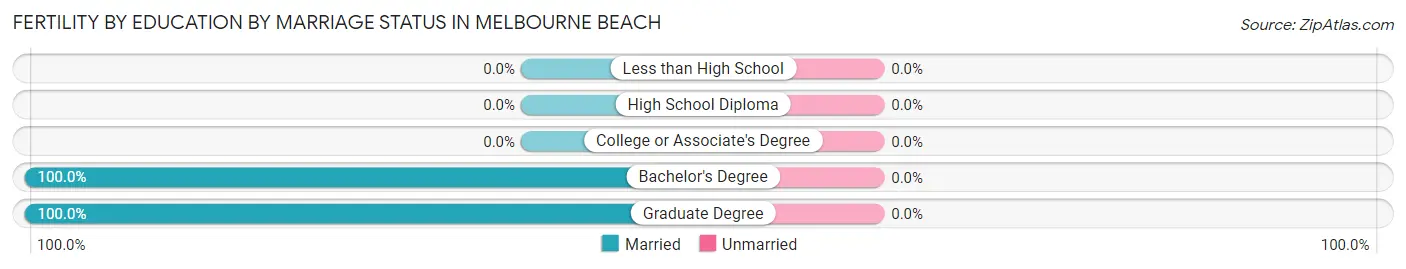
| Educational Attainment | Married | Unmarried |
| Less than High School | 0 (0.0%) | 0 (0.0%) |
| High School Diploma | 0 (0.0%) | 0 (0.0%) |
| College or Associate's Degree | 0 (0.0%) | 0 (0.0%) |
| Bachelor's Degree | 60 (100.0%) | 0 (0.0%) |
| Graduate Degree | 30 (100.0%) | 0 (0.0%) |
| Total | 90 (100.0%) | 0 (0.0%) |
Employment Characteristics in Melbourne Beach
Employment by Class of Employer in Melbourne Beach
Among the 1,273 employed individuals in Melbourne Beach, private company employees (695 | 54.6%), self-employed (not incorporated) (164 | 12.9%), and self-employed (incorporated) (152 | 11.9%) make up the most common classes of employment.
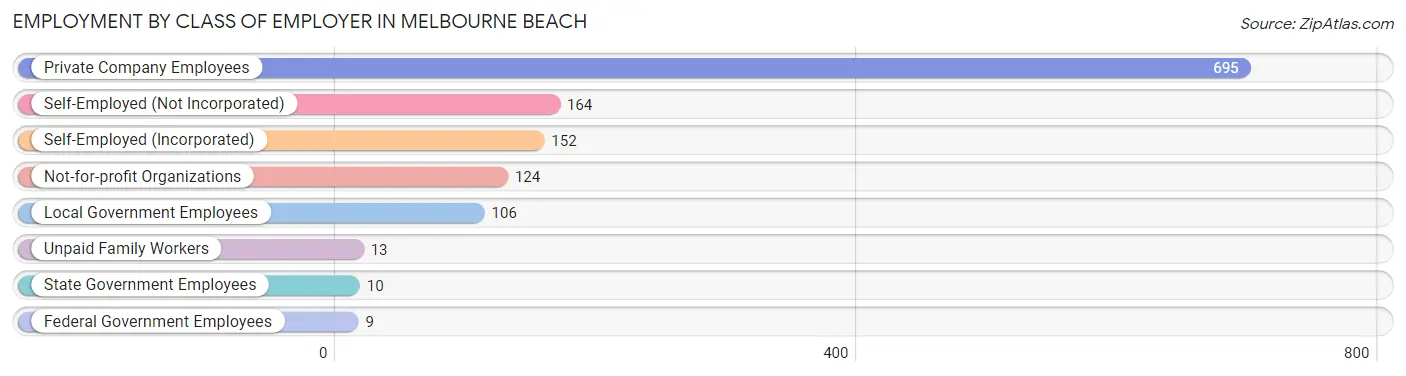
| Employer Class | # Employees | % Employees |
| Private Company Employees | 695 | 54.6% |
| Self-Employed (Incorporated) | 152 | 11.9% |
| Self-Employed (Not Incorporated) | 164 | 12.9% |
| Not-for-profit Organizations | 124 | 9.7% |
| Local Government Employees | 106 | 8.3% |
| State Government Employees | 10 | 0.8% |
| Federal Government Employees | 9 | 0.7% |
| Unpaid Family Workers | 13 | 1.0% |
| Total | 1,273 | 100.0% |
Employment Status by Age in Melbourne Beach
According to the labor force statistics for Melbourne Beach, out of the total population over 16 years of age (2,691), 49.0% or 1,319 individuals are in the labor force, with 1.3% or 17 of them unemployed. The age group with the highest labor force participation rate is 25 to 29 years, with 100.0% or 83 individuals in the labor force. Within the labor force, the 45 to 54 years age range has the highest percentage of unemployed individuals, with 7.0% or 17 of them being unemployed.
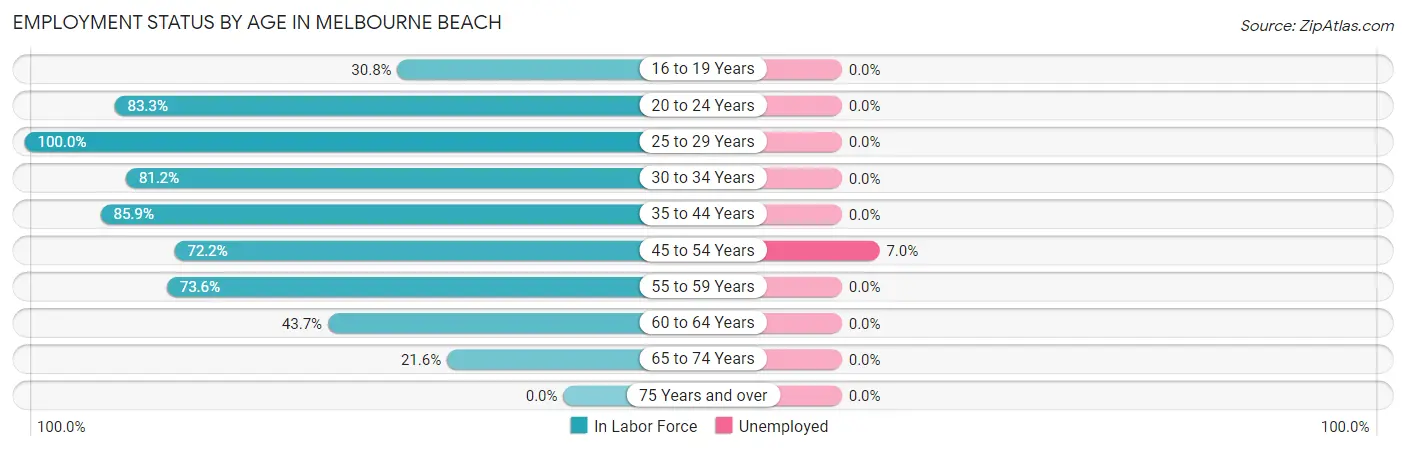
| Age Bracket | In Labor Force | Unemployed |
| 16 to 19 Years | 40 (30.8%) | 0 (0.0%) |
| 20 to 24 Years | 60 (83.3%) | 0 (0.0%) |
| 25 to 29 Years | 83 (100.0%) | 0 (0.0%) |
| 30 to 34 Years | 121 (81.2%) | 0 (0.0%) |
| 35 to 44 Years | 310 (85.9%) | 0 (0.0%) |
| 45 to 54 Years | 242 (72.2%) | 17 (7.0%) |
| 55 to 59 Years | 248 (73.6%) | 0 (0.0%) |
| 60 to 64 Years | 121 (43.7%) | 0 (0.0%) |
| 65 to 74 Years | 93 (21.6%) | 0 (0.0%) |
| 75 Years and over | 0 (0.0%) | 0 (0.0%) |
| Total | 1,319 (49.0%) | 17 (1.3%) |
Employment Status by Educational Attainment in Melbourne Beach
According to labor force statistics for Melbourne Beach, 73.0% of individuals (1,126) out of the total population between 25 and 64 years of age (1,542) are in the labor force, with 1.5% or 17 of them being unemployed. The group with the highest labor force participation rate are those with the educational attainment of college / associate degree, with 85.4% or 263 individuals in the labor force. Within the labor force, individuals with college / associate degree education have the highest percentage of unemployment, with 6.5% or 17 of them being unemployed.
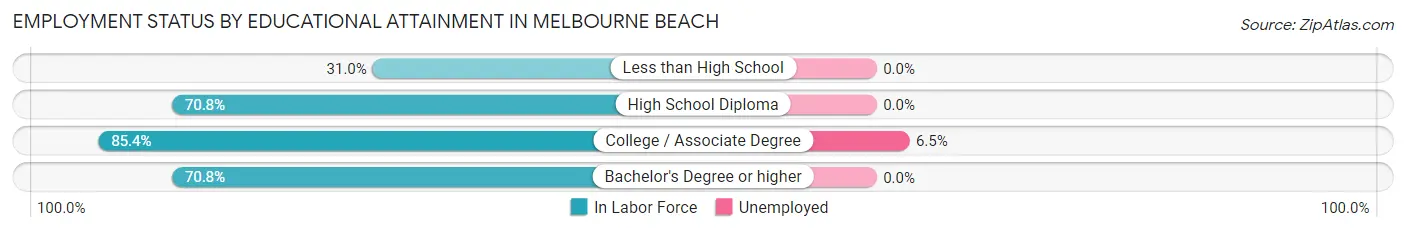
| Educational Attainment | In Labor Force | Unemployed |
| Less than High School | 9 (31.0%) | 0 (0.0%) |
| High School Diploma | 126 (70.8%) | 0 (0.0%) |
| College / Associate Degree | 263 (85.4%) | 20 (6.5%) |
| Bachelor's Degree or higher | 727 (70.8%) | 0 (0.0%) |
| Total | 1,126 (73.0%) | 23 (1.5%) |
Employment Occupations by Sex in Melbourne Beach
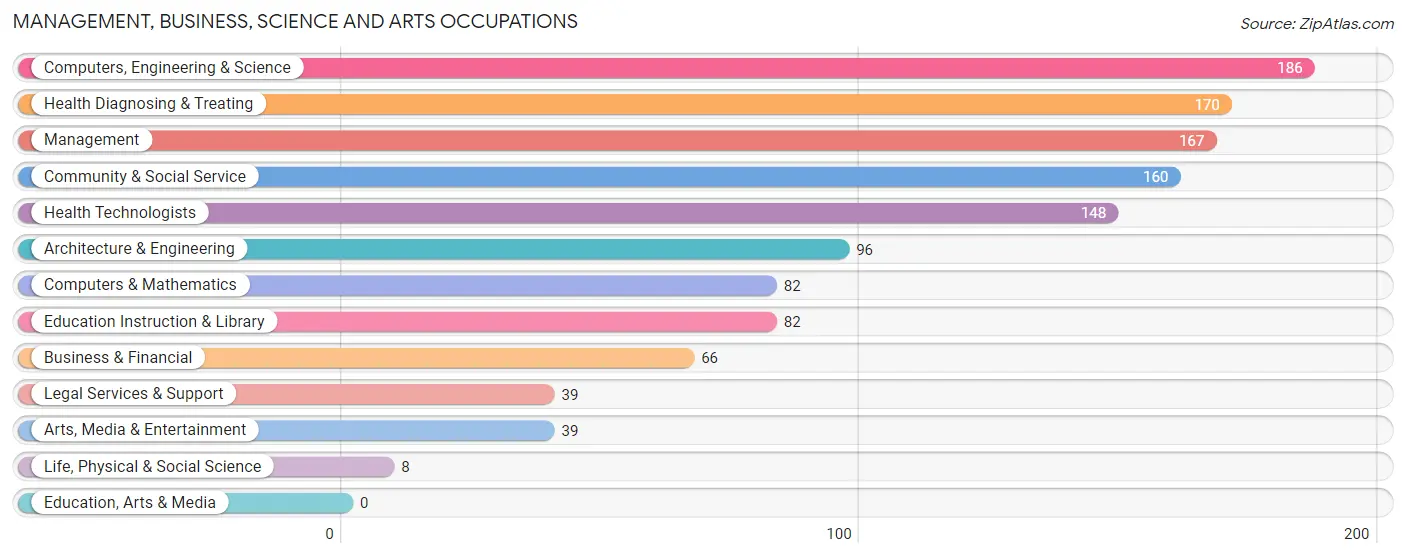
Management, Business, Science and Arts Occupations
The most common Management, Business, Science and Arts occupations in Melbourne Beach are Computers, Engineering & Science (186 | 14.3%), Health Diagnosing & Treating (170 | 13.1%), Management (167 | 12.8%), Community & Social Service (160 | 12.3%), and Health Technologists (148 | 11.4%).
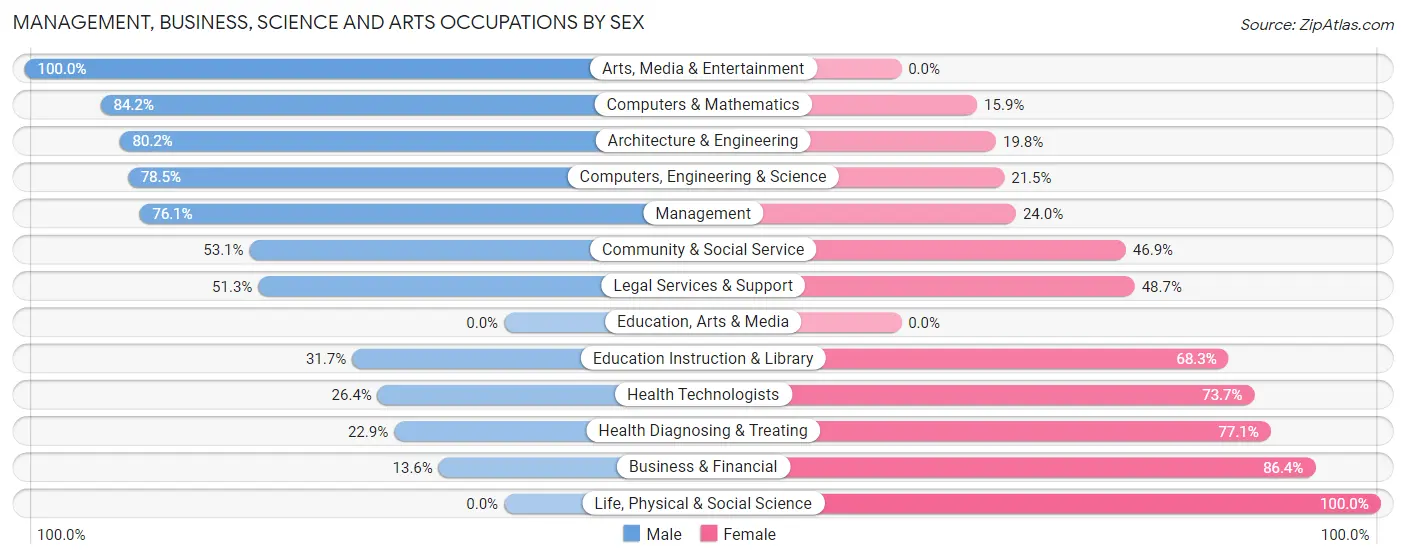
Management, Business, Science and Arts Occupations by Sex
Within the Management, Business, Science and Arts occupations in Melbourne Beach, the most male-oriented occupations are Arts, Media & Entertainment (100.0%), Computers & Mathematics (84.2%), and Architecture & Engineering (80.2%), while the most female-oriented occupations are Life, Physical & Social Science (100.0%), Business & Financial (86.4%), and Health Diagnosing & Treating (77.1%).
| Occupation | Male | Female |
| Management | 127 (76.0%) | 40 (23.9%) |
| Business & Financial | 9 (13.6%) | 57 (86.4%) |
| Computers, Engineering & Science | 146 (78.5%) | 40 (21.5%) |
| Computers & Mathematics | 69 (84.2%) | 13 (15.9%) |
| Architecture & Engineering | 77 (80.2%) | 19 (19.8%) |
| Life, Physical & Social Science | 0 (0.0%) | 8 (100.0%) |
| Community & Social Service | 85 (53.1%) | 75 (46.9%) |
| Education, Arts & Media | 0 (0.0%) | 0 (0.0%) |
| Legal Services & Support | 20 (51.3%) | 19 (48.7%) |
| Education Instruction & Library | 26 (31.7%) | 56 (68.3%) |
| Arts, Media & Entertainment | 39 (100.0%) | 0 (0.0%) |
| Health Diagnosing & Treating | 39 (22.9%) | 131 (77.1%) |
| Health Technologists | 39 (26.4%) | 109 (73.7%) |
| Total (Category) | 406 (54.2%) | 343 (45.8%) |
| Total (Overall) | 758 (58.3%) | 543 (41.7%) |
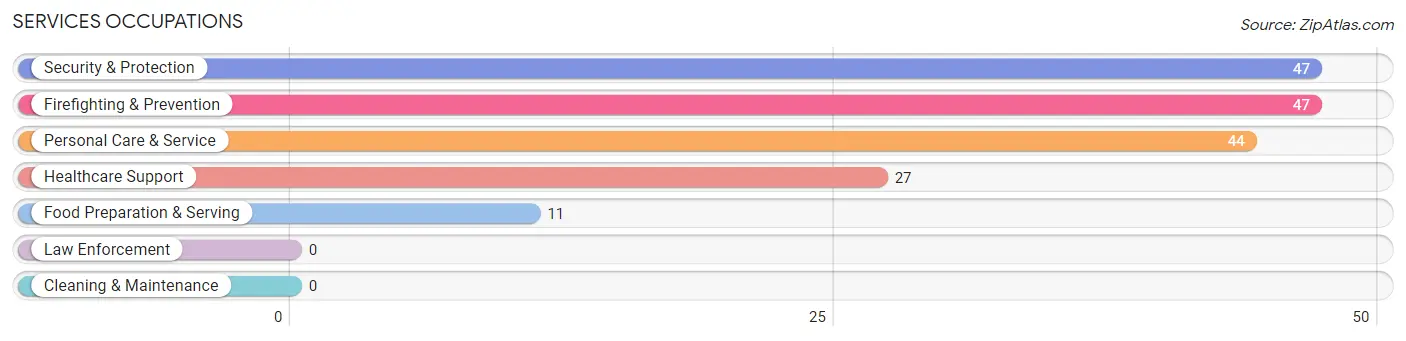
Services Occupations
The most common Services occupations in Melbourne Beach are Security & Protection (47 | 3.6%), Firefighting & Prevention (47 | 3.6%), Personal Care & Service (44 | 3.4%), Healthcare Support (27 | 2.1%), and Food Preparation & Serving (11 | 0.9%).
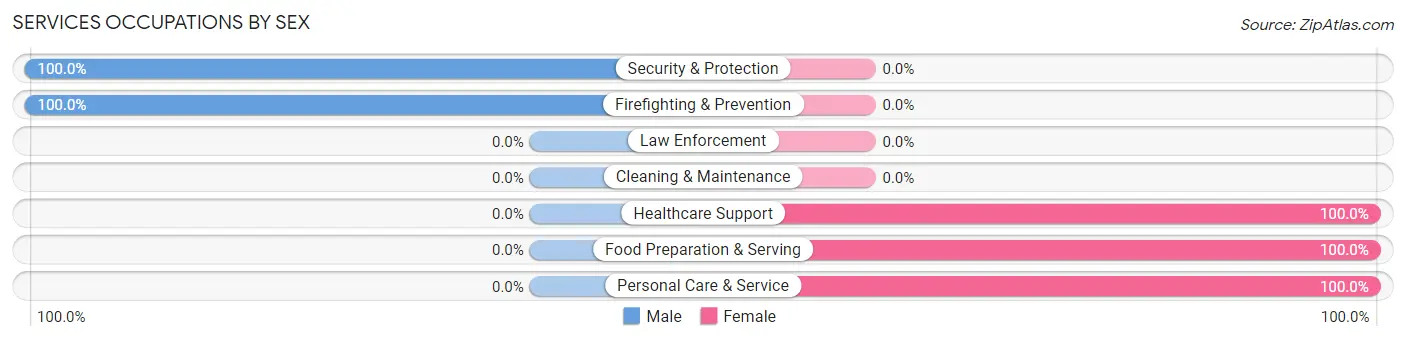
Services Occupations by Sex
Within the Services occupations in Melbourne Beach, the most male-oriented occupations are Security & Protection (100.0%), and Firefighting & Prevention (100.0%), while the most female-oriented occupations are Healthcare Support (100.0%), Food Preparation & Serving (100.0%), and Personal Care & Service (100.0%).
| Occupation | Male | Female |
| Healthcare Support | 0 (0.0%) | 27 (100.0%) |
| Security & Protection | 47 (100.0%) | 0 (0.0%) |
| Firefighting & Prevention | 47 (100.0%) | 0 (0.0%) |
| Law Enforcement | 0 (0.0%) | 0 (0.0%) |
| Food Preparation & Serving | 0 (0.0%) | 11 (100.0%) |
| Cleaning & Maintenance | 0 (0.0%) | 0 (0.0%) |
| Personal Care & Service | 0 (0.0%) | 44 (100.0%) |
| Total (Category) | 47 (36.4%) | 82 (63.6%) |
| Total (Overall) | 758 (58.3%) | 543 (41.7%) |
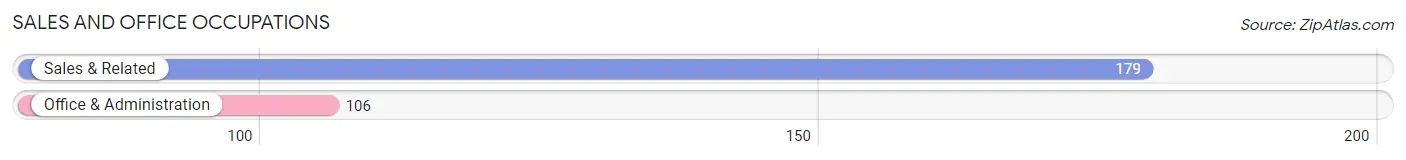
Sales and Office Occupations
The most common Sales and Office occupations in Melbourne Beach are Sales & Related (179 | 13.8%), and Office & Administration (106 | 8.2%).
Sales and Office Occupations by Sex
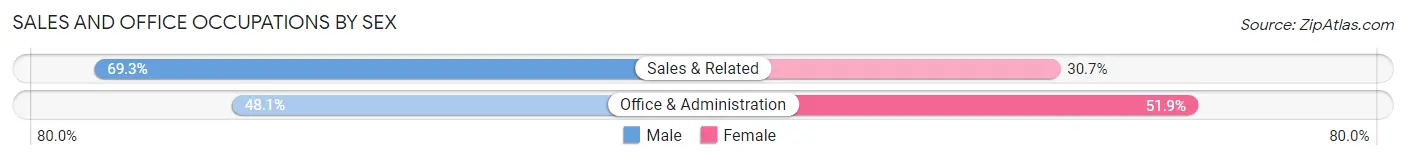
| Occupation | Male | Female |
| Sales & Related | 124 (69.3%) | 55 (30.7%) |
| Office & Administration | 51 (48.1%) | 55 (51.9%) |
| Total (Category) | 175 (61.4%) | 110 (38.6%) |
| Total (Overall) | 758 (58.3%) | 543 (41.7%) |
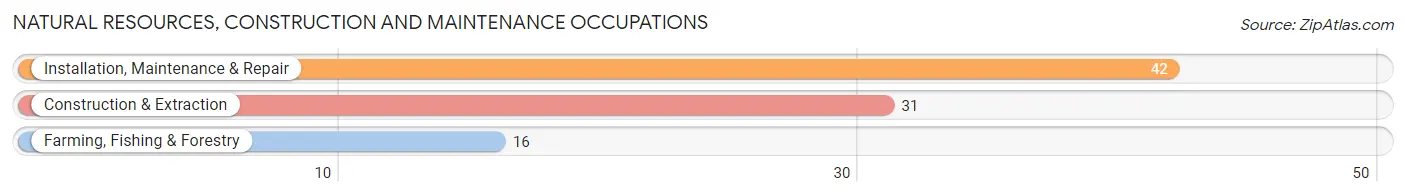
Natural Resources, Construction and Maintenance Occupations
The most common Natural Resources, Construction and Maintenance occupations in Melbourne Beach are Installation, Maintenance & Repair (42 | 3.2%), Construction & Extraction (31 | 2.4%), and Farming, Fishing & Forestry (16 | 1.2%).
Natural Resources, Construction and Maintenance Occupations by Sex
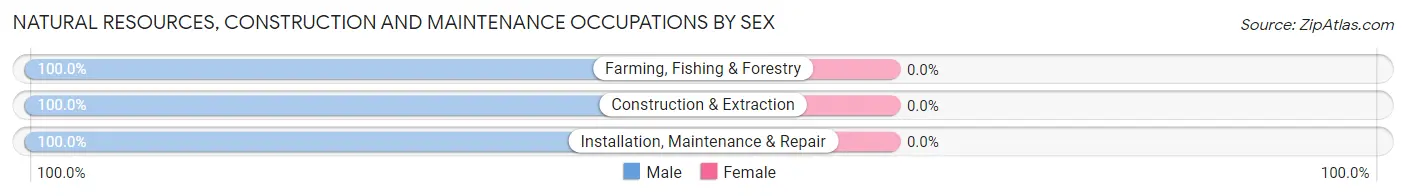
| Occupation | Male | Female |
| Farming, Fishing & Forestry | 16 (100.0%) | 0 (0.0%) |
| Construction & Extraction | 31 (100.0%) | 0 (0.0%) |
| Installation, Maintenance & Repair | 42 (100.0%) | 0 (0.0%) |
| Total (Category) | 89 (100.0%) | 0 (0.0%) |
| Total (Overall) | 758 (58.3%) | 543 (41.7%) |
Production, Transportation and Moving Occupations
The most common Production, Transportation and Moving occupations in Melbourne Beach are Production (25 | 1.9%), Material Moving (14 | 1.1%), and Transportation (10 | 0.8%).
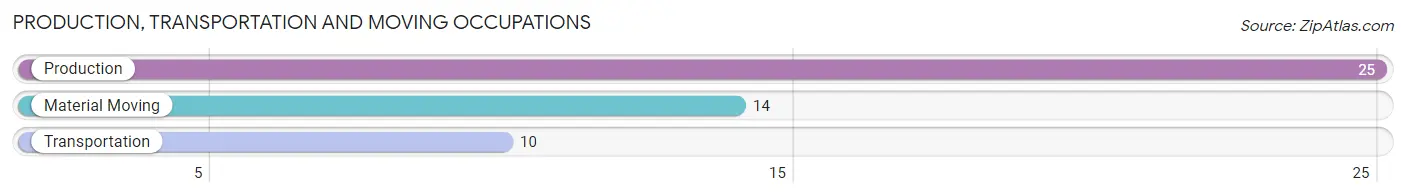
Production, Transportation and Moving Occupations by Sex
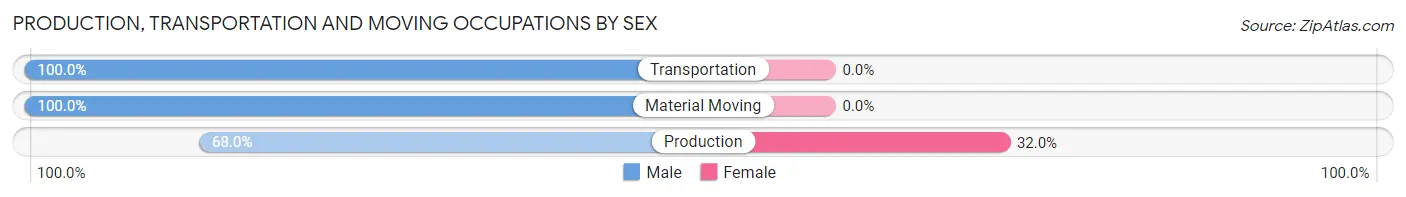
| Occupation | Male | Female |
| Production | 17 (68.0%) | 8 (32.0%) |
| Transportation | 10 (100.0%) | 0 (0.0%) |
| Material Moving | 14 (100.0%) | 0 (0.0%) |
| Total (Category) | 41 (83.7%) | 8 (16.3%) |
| Total (Overall) | 758 (58.3%) | 543 (41.7%) |
Employment Industries by Sex in Melbourne Beach
Employment Industries in Melbourne Beach
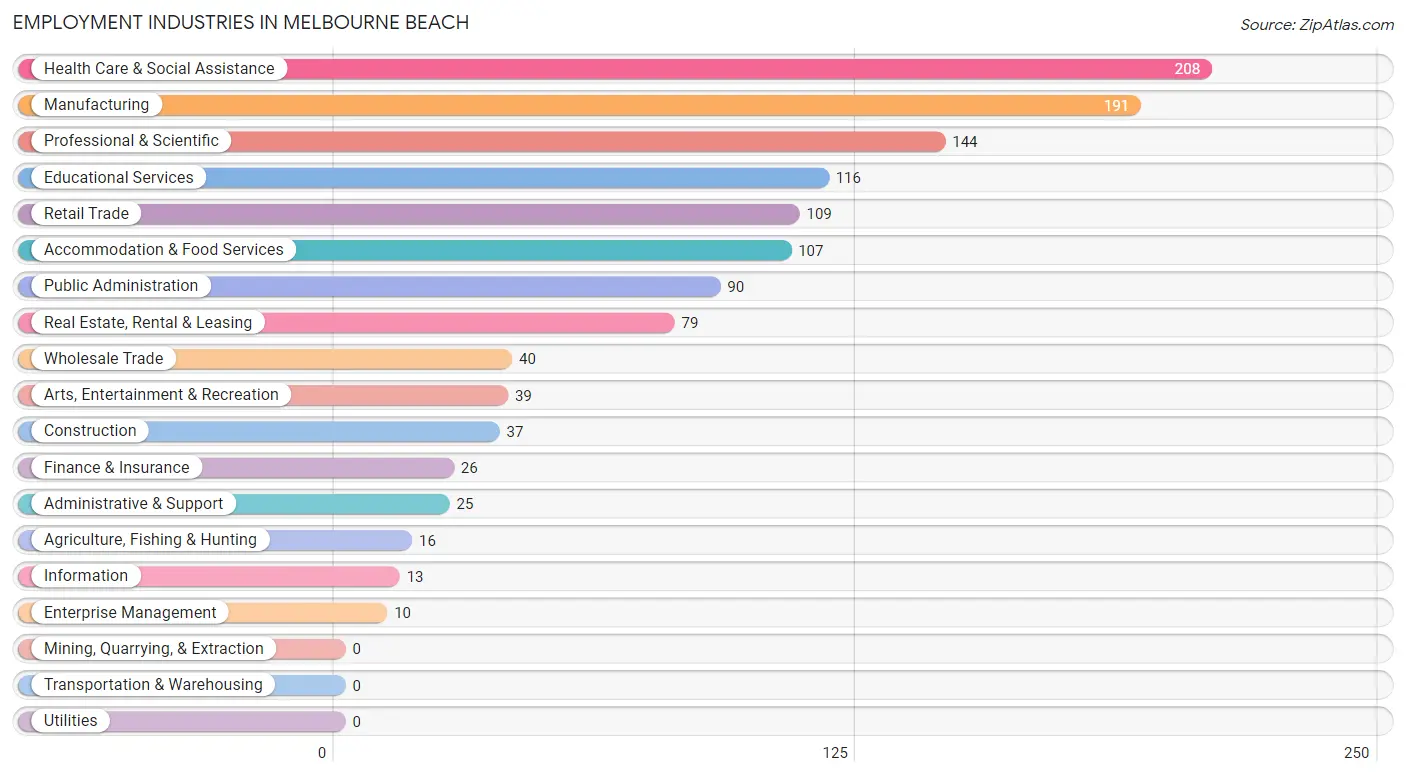
The major employment industries in Melbourne Beach include Health Care & Social Assistance (208 | 16.0%), Manufacturing (191 | 14.7%), Professional & Scientific (144 | 11.1%), Educational Services (116 | 8.9%), and Retail Trade (109 | 8.4%).
Employment Industries by Sex in Melbourne Beach
The Melbourne Beach industries that see more men than women are Agriculture, Fishing & Hunting (100.0%), Construction (100.0%), and Wholesale Trade (100.0%), whereas the industries that tend to have a higher number of women are Information (100.0%), Enterprise Management (100.0%), and Health Care & Social Assistance (81.2%).
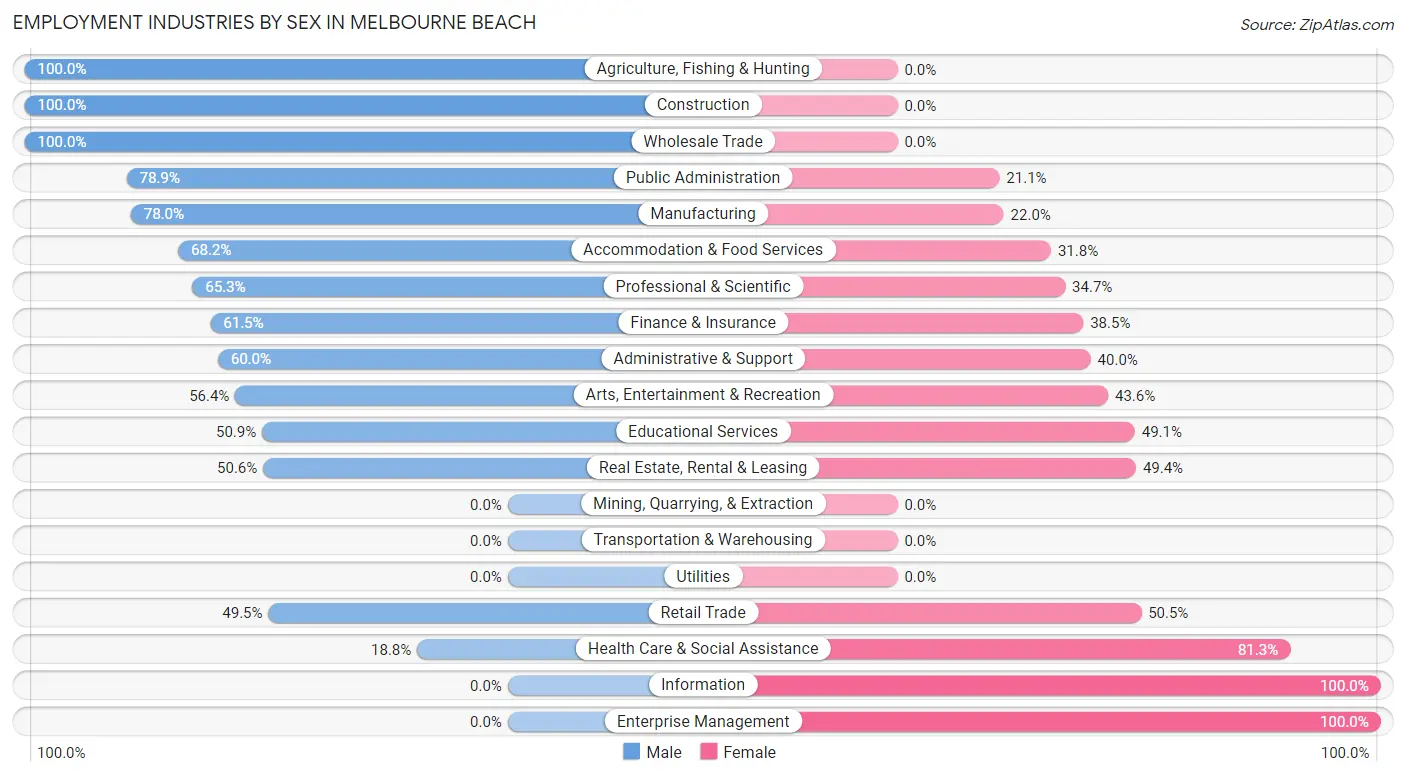
| Industry | Male | Female |
| Agriculture, Fishing & Hunting | 16 (100.0%) | 0 (0.0%) |
| Mining, Quarrying, & Extraction | 0 (0.0%) | 0 (0.0%) |
| Construction | 37 (100.0%) | 0 (0.0%) |
| Manufacturing | 149 (78.0%) | 42 (22.0%) |
| Wholesale Trade | 40 (100.0%) | 0 (0.0%) |
| Retail Trade | 54 (49.5%) | 55 (50.5%) |
| Transportation & Warehousing | 0 (0.0%) | 0 (0.0%) |
| Utilities | 0 (0.0%) | 0 (0.0%) |
| Information | 0 (0.0%) | 13 (100.0%) |
| Finance & Insurance | 16 (61.5%) | 10 (38.5%) |
| Real Estate, Rental & Leasing | 40 (50.6%) | 39 (49.4%) |
| Professional & Scientific | 94 (65.3%) | 50 (34.7%) |
| Enterprise Management | 0 (0.0%) | 10 (100.0%) |
| Administrative & Support | 15 (60.0%) | 10 (40.0%) |
| Educational Services | 59 (50.9%) | 57 (49.1%) |
| Health Care & Social Assistance | 39 (18.8%) | 169 (81.2%) |
| Arts, Entertainment & Recreation | 22 (56.4%) | 17 (43.6%) |
| Accommodation & Food Services | 73 (68.2%) | 34 (31.8%) |
| Public Administration | 71 (78.9%) | 19 (21.1%) |
| Total | 758 (58.3%) | 543 (41.7%) |
Education in Melbourne Beach
School Enrollment in Melbourne Beach
The most common levels of schooling among the 584 students in Melbourne Beach are middle school (140 | 24.0%), high school (140 | 24.0%), and elementary school (111 | 19.0%).
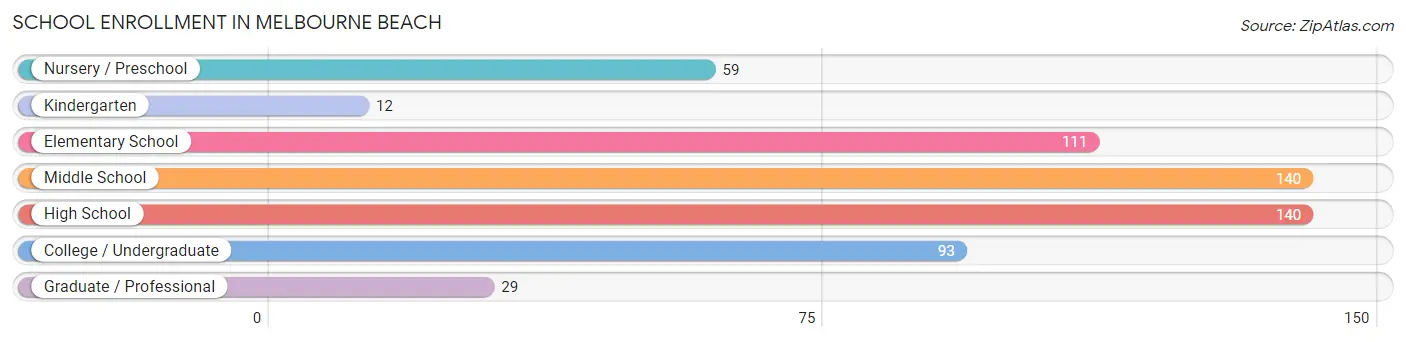
| School Level | # Students | % Students |
| Nursery / Preschool | 59 | 10.1% |
| Kindergarten | 12 | 2.1% |
| Elementary School | 111 | 19.0% |
| Middle School | 140 | 24.0% |
| High School | 140 | 24.0% |
| College / Undergraduate | 93 | 15.9% |
| Graduate / Professional | 29 | 5.0% |
| Total | 584 | 100.0% |
School Enrollment by Age by Funding Source in Melbourne Beach
Out of a total of 584 students who are enrolled in schools in Melbourne Beach, 166 (28.4%) attend a private institution, while the remaining 418 (71.6%) are enrolled in public schools. The age group of 3 to 4 year olds has the highest likelihood of being enrolled in private schools, with 37 (77.1% in the age bracket) enrolled. Conversely, the age group of 18 to 19 year olds has the lowest likelihood of being enrolled in a private school, with 58 (100.0% in the age bracket) attending a public institution.
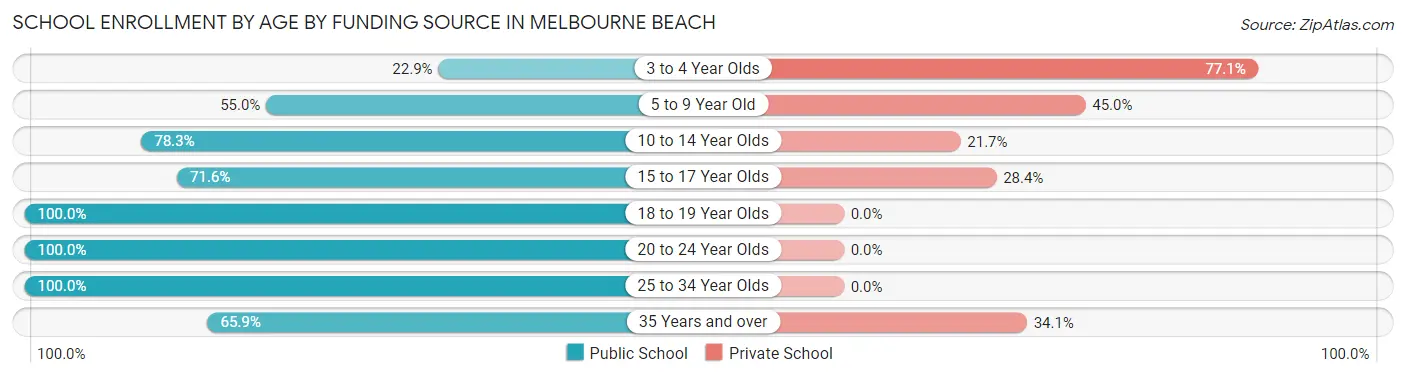
| Age Bracket | Public School | Private School |
| 3 to 4 Year Olds | 11 (22.9%) | 37 (77.1%) |
| 5 to 9 Year Old | 66 (55.0%) | 54 (45.0%) |
| 10 to 14 Year Olds | 126 (78.3%) | 35 (21.7%) |
| 15 to 17 Year Olds | 63 (71.6%) | 25 (28.4%) |
| 18 to 19 Year Olds | 58 (100.0%) | 0 (0.0%) |
| 20 to 24 Year Olds | 28 (100.0%) | 0 (0.0%) |
| 25 to 34 Year Olds | 37 (100.0%) | 0 (0.0%) |
| 35 Years and over | 29 (65.9%) | 15 (34.1%) |
| Total | 418 (71.6%) | 166 (28.4%) |
Educational Attainment by Field of Study in Melbourne Beach
Engineering (438 | 25.5%), business (259 | 15.1%), education (160 | 9.3%), bio, nature & agricultural (133 | 7.7%), and psychology (126 | 7.3%) are the most common fields of study among 1,720 individuals in Melbourne Beach who have obtained a bachelor's degree or higher.
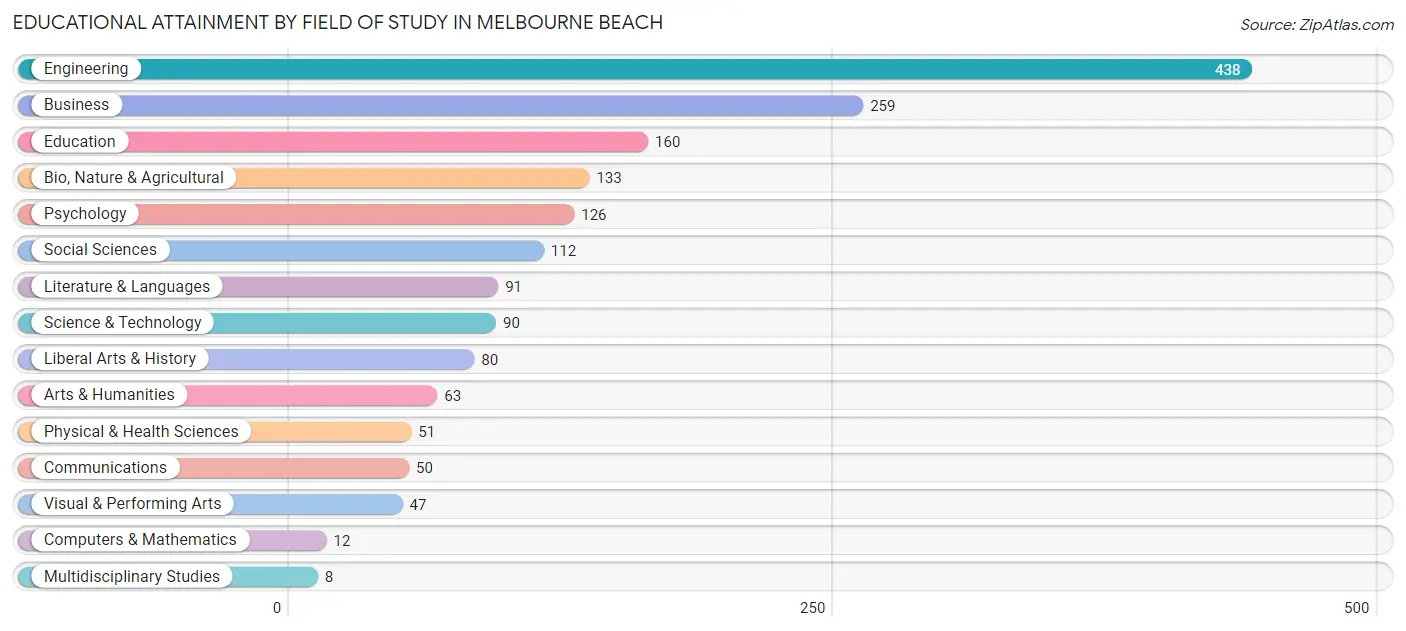
| Field of Study | # Graduates | % Graduates |
| Computers & Mathematics | 12 | 0.7% |
| Bio, Nature & Agricultural | 133 | 7.7% |
| Physical & Health Sciences | 51 | 3.0% |
| Psychology | 126 | 7.3% |
| Social Sciences | 112 | 6.5% |
| Engineering | 438 | 25.5% |
| Multidisciplinary Studies | 8 | 0.5% |
| Science & Technology | 90 | 5.2% |
| Business | 259 | 15.1% |
| Education | 160 | 9.3% |
| Literature & Languages | 91 | 5.3% |
| Liberal Arts & History | 80 | 4.6% |
| Visual & Performing Arts | 47 | 2.7% |
| Communications | 50 | 2.9% |
| Arts & Humanities | 63 | 3.7% |
| Total | 1,720 | 100.0% |
Transportation & Commute in Melbourne Beach
Vehicle Availability by Sex in Melbourne Beach
The most prevalent vehicle ownership categories in Melbourne Beach are males with 2 vehicles (374, accounting for 50.3%) and females with 2 vehicles (265, making up 70.6%).
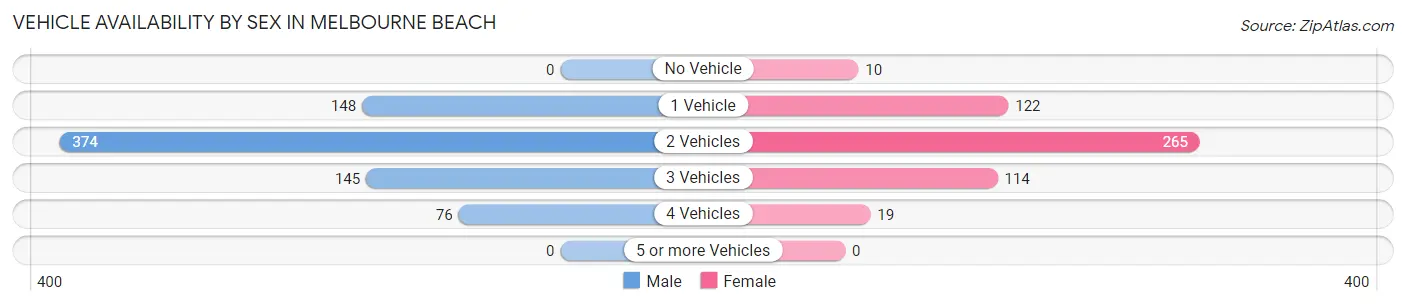
| Vehicles Available | Male | Female |
| No Vehicle | 0 (0.0%) | 10 (1.9%) |
| 1 Vehicle | 148 (19.9%) | 122 (23.0%) |
| 2 Vehicles | 374 (50.3%) | 265 (50.0%) |
| 3 Vehicles | 145 (19.5%) | 114 (21.5%) |
| 4 Vehicles | 76 (10.2%) | 19 (3.6%) |
| 5 or more Vehicles | 0 (0.0%) | 0 (0.0%) |
| Total | 743 (100.0%) | 530 (100.0%) |
Commute Time in Melbourne Beach
The most frequently occuring commute durations in Melbourne Beach are 20 to 24 minutes (224 commuters, 24.2%), 15 to 19 minutes (200 commuters, 21.6%), and 10 to 14 minutes (155 commuters, 16.7%).
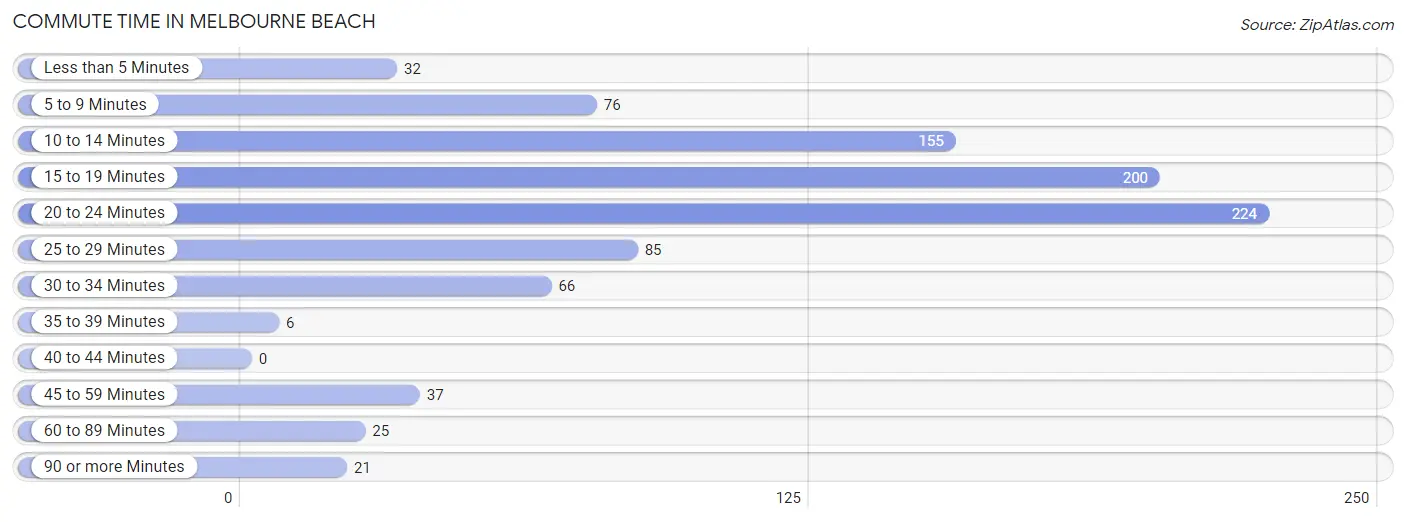
| Commute Time | # Commuters | % Commuters |
| Less than 5 Minutes | 32 | 3.5% |
| 5 to 9 Minutes | 76 | 8.2% |
| 10 to 14 Minutes | 155 | 16.7% |
| 15 to 19 Minutes | 200 | 21.6% |
| 20 to 24 Minutes | 224 | 24.2% |
| 25 to 29 Minutes | 85 | 9.2% |
| 30 to 34 Minutes | 66 | 7.1% |
| 35 to 39 Minutes | 6 | 0.6% |
| 40 to 44 Minutes | 0 | 0.0% |
| 45 to 59 Minutes | 37 | 4.0% |
| 60 to 89 Minutes | 25 | 2.7% |
| 90 or more Minutes | 21 | 2.3% |
Commute Time by Sex in Melbourne Beach
The most common commute times in Melbourne Beach are 10 to 14 minutes (135 commuters, 21.7%) for males and 20 to 24 minutes (102 commuters, 33.4%) for females.
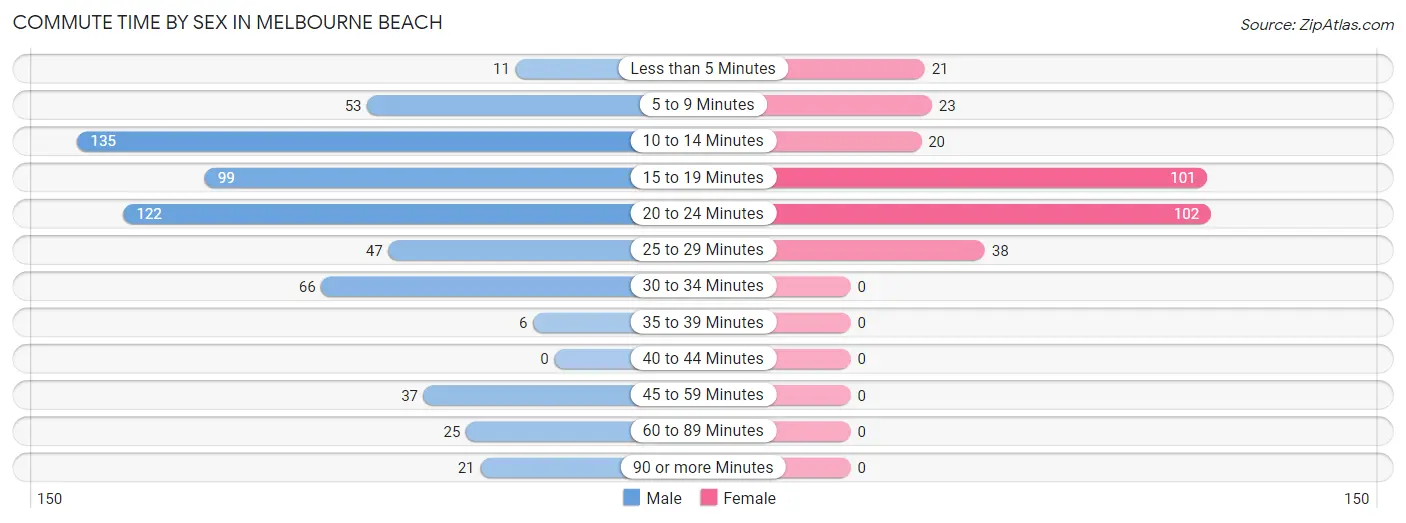
| Commute Time | Male | Female |
| Less than 5 Minutes | 11 (1.8%) | 21 (6.9%) |
| 5 to 9 Minutes | 53 (8.5%) | 23 (7.5%) |
| 10 to 14 Minutes | 135 (21.7%) | 20 (6.6%) |
| 15 to 19 Minutes | 99 (15.9%) | 101 (33.1%) |
| 20 to 24 Minutes | 122 (19.6%) | 102 (33.4%) |
| 25 to 29 Minutes | 47 (7.6%) | 38 (12.5%) |
| 30 to 34 Minutes | 66 (10.6%) | 0 (0.0%) |
| 35 to 39 Minutes | 6 (1.0%) | 0 (0.0%) |
| 40 to 44 Minutes | 0 (0.0%) | 0 (0.0%) |
| 45 to 59 Minutes | 37 (5.9%) | 0 (0.0%) |
| 60 to 89 Minutes | 25 (4.0%) | 0 (0.0%) |
| 90 or more Minutes | 21 (3.4%) | 0 (0.0%) |
Time of Departure to Work by Sex in Melbourne Beach
The most frequent times of departure to work in Melbourne Beach are 12:00 PM to 3:59 PM (119, 19.1%) for males and 7:30 AM to 7:59 AM (78, 25.6%) for females.
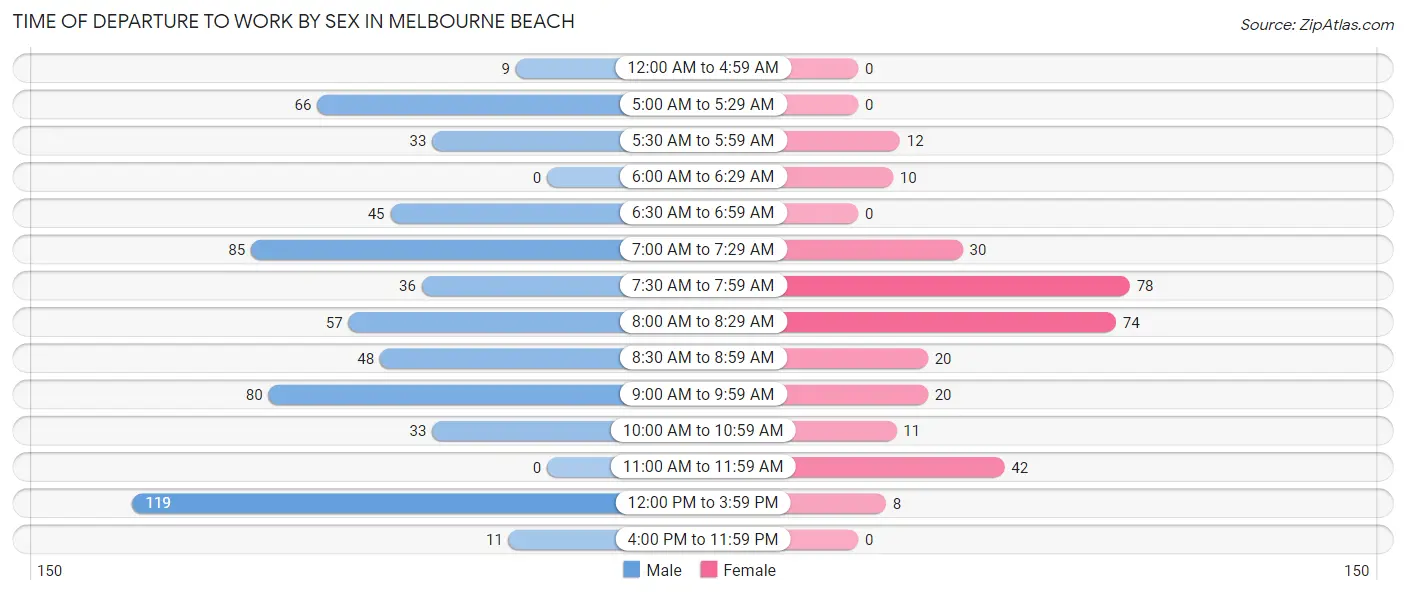
| Time of Departure | Male | Female |
| 12:00 AM to 4:59 AM | 9 (1.5%) | 0 (0.0%) |
| 5:00 AM to 5:29 AM | 66 (10.6%) | 0 (0.0%) |
| 5:30 AM to 5:59 AM | 33 (5.3%) | 12 (3.9%) |
| 6:00 AM to 6:29 AM | 0 (0.0%) | 10 (3.3%) |
| 6:30 AM to 6:59 AM | 45 (7.2%) | 0 (0.0%) |
| 7:00 AM to 7:29 AM | 85 (13.7%) | 30 (9.8%) |
| 7:30 AM to 7:59 AM | 36 (5.8%) | 78 (25.6%) |
| 8:00 AM to 8:29 AM | 57 (9.2%) | 74 (24.3%) |
| 8:30 AM to 8:59 AM | 48 (7.7%) | 20 (6.6%) |
| 9:00 AM to 9:59 AM | 80 (12.9%) | 20 (6.6%) |
| 10:00 AM to 10:59 AM | 33 (5.3%) | 11 (3.6%) |
| 11:00 AM to 11:59 AM | 0 (0.0%) | 42 (13.8%) |
| 12:00 PM to 3:59 PM | 119 (19.1%) | 8 (2.6%) |
| 4:00 PM to 11:59 PM | 11 (1.8%) | 0 (0.0%) |
| Total | 622 (100.0%) | 305 (100.0%) |
Housing Occupancy in Melbourne Beach
Occupancy by Ownership in Melbourne Beach
Of the total 1,425 dwellings in Melbourne Beach, owner-occupied units account for 1,132 (79.4%), while renter-occupied units make up 293 (20.6%).
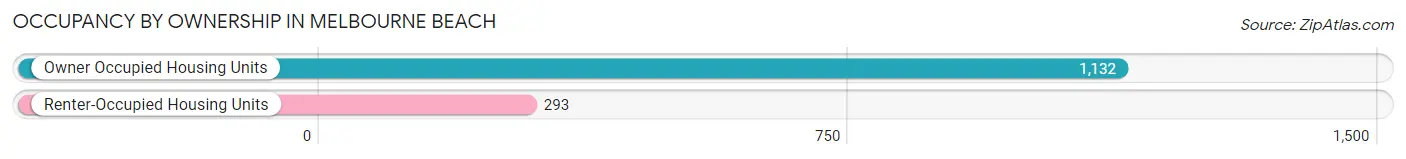
| Occupancy | # Housing Units | % Housing Units |
| Owner Occupied Housing Units | 1,132 | 79.4% |
| Renter-Occupied Housing Units | 293 | 20.6% |
| Total Occupied Housing Units | 1,425 | 100.0% |
Occupancy by Household Size in Melbourne Beach
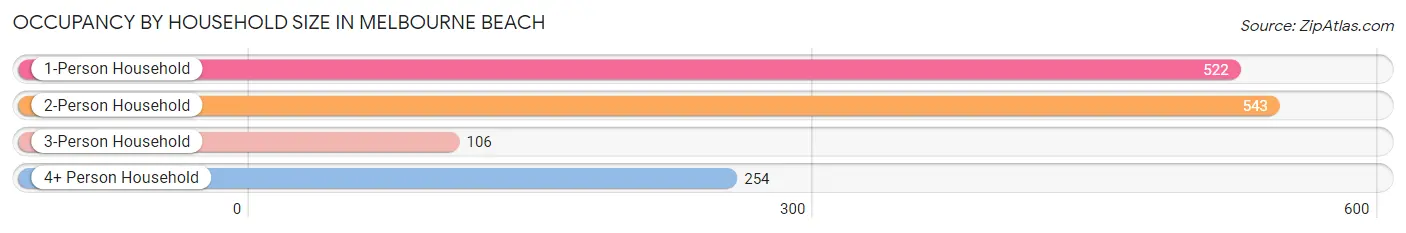
| Household Size | # Housing Units | % Housing Units |
| 1-Person Household | 522 | 36.6% |
| 2-Person Household | 543 | 38.1% |
| 3-Person Household | 106 | 7.4% |
| 4+ Person Household | 254 | 17.8% |
| Total Housing Units | 1,425 | 100.0% |
Occupancy by Ownership by Household Size in Melbourne Beach
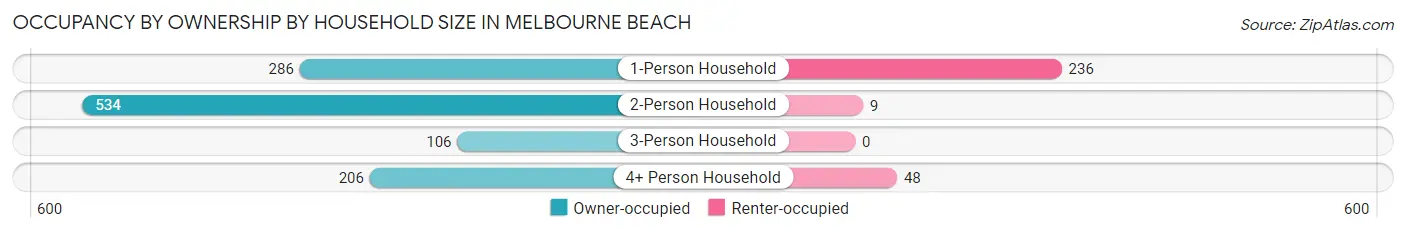
| Household Size | Owner-occupied | Renter-occupied |
| 1-Person Household | 286 (54.8%) | 236 (45.2%) |
| 2-Person Household | 534 (98.3%) | 9 (1.7%) |
| 3-Person Household | 106 (100.0%) | 0 (0.0%) |
| 4+ Person Household | 206 (81.1%) | 48 (18.9%) |
| Total Housing Units | 1,132 (79.4%) | 293 (20.6%) |
Occupancy by Educational Attainment in Melbourne Beach
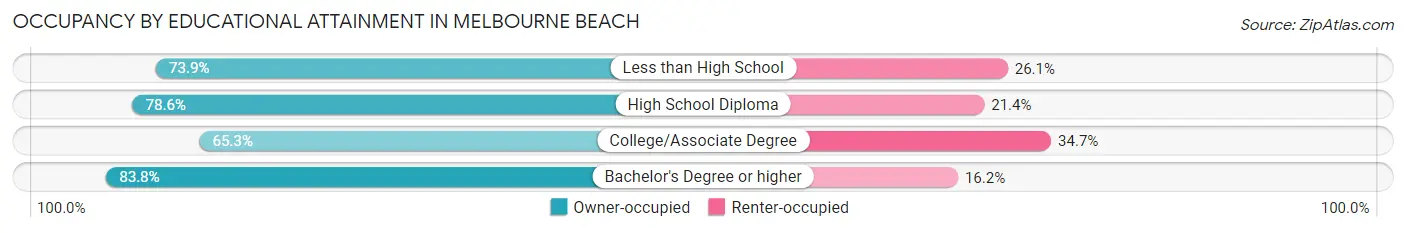
| Household Size | Owner-occupied | Renter-occupied |
| Less than High School | 34 (73.9%) | 12 (26.1%) |
| High School Diploma | 110 (78.6%) | 30 (21.4%) |
| College/Associate Degree | 177 (65.3%) | 94 (34.7%) |
| Bachelor's Degree or higher | 811 (83.8%) | 157 (16.2%) |
Occupancy by Age of Householder in Melbourne Beach
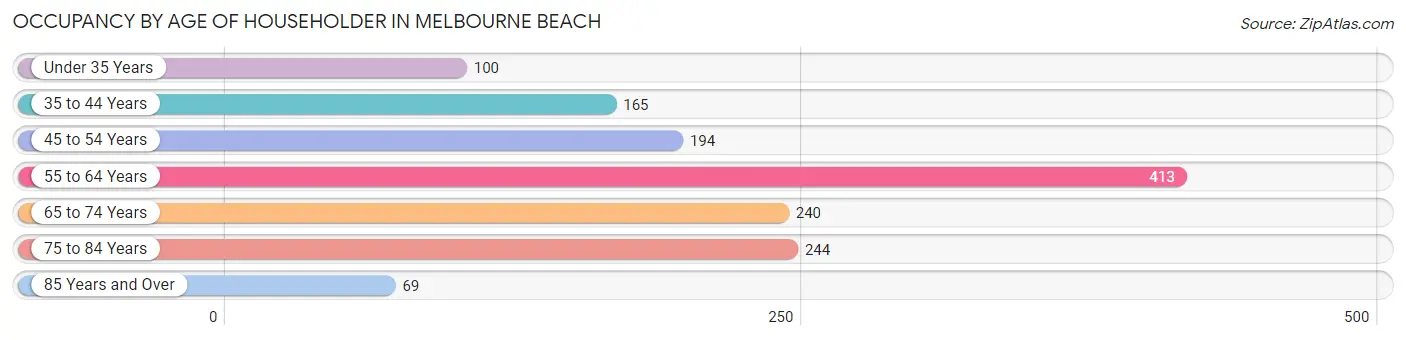
| Age Bracket | # Households | % Households |
| Under 35 Years | 100 | 7.0% |
| 35 to 44 Years | 165 | 11.6% |
| 45 to 54 Years | 194 | 13.6% |
| 55 to 64 Years | 413 | 29.0% |
| 65 to 74 Years | 240 | 16.8% |
| 75 to 84 Years | 244 | 17.1% |
| 85 Years and Over | 69 | 4.8% |
| Total | 1,425 | 100.0% |
Housing Finances in Melbourne Beach
Median Income by Occupancy in Melbourne Beach
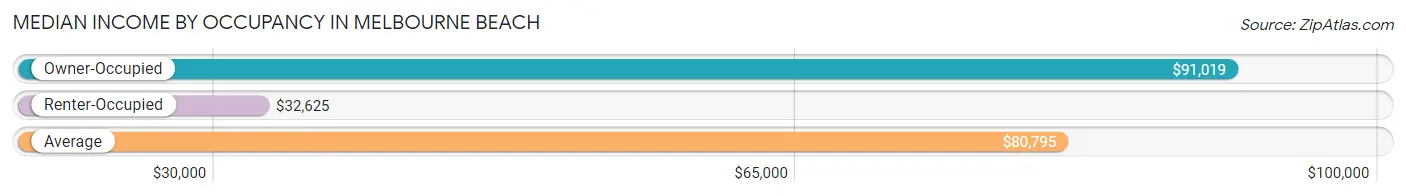
| Occupancy Type | # Households | Median Income |
| Owner-Occupied | 1,132 (79.4%) | $91,019 |
| Renter-Occupied | 293 (20.6%) | $32,625 |
| Average | 1,425 (100.0%) | $80,795 |
Occupancy by Householder Income Bracket in Melbourne Beach
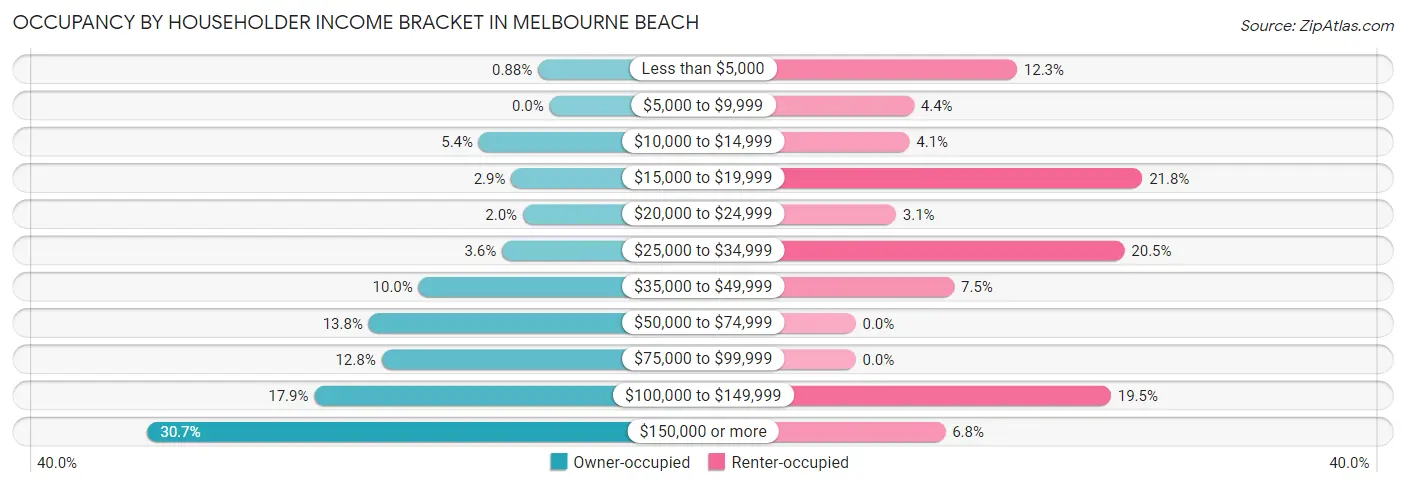
| Income Bracket | Owner-occupied | Renter-occupied |
| Less than $5,000 | 10 (0.9%) | 36 (12.3%) |
| $5,000 to $9,999 | 0 (0.0%) | 13 (4.4%) |
| $10,000 to $14,999 | 61 (5.4%) | 12 (4.1%) |
| $15,000 to $19,999 | 33 (2.9%) | 64 (21.8%) |
| $20,000 to $24,999 | 23 (2.0%) | 9 (3.1%) |
| $25,000 to $34,999 | 41 (3.6%) | 60 (20.5%) |
| $35,000 to $49,999 | 113 (10.0%) | 22 (7.5%) |
| $50,000 to $74,999 | 156 (13.8%) | 0 (0.0%) |
| $75,000 to $99,999 | 145 (12.8%) | 0 (0.0%) |
| $100,000 to $149,999 | 203 (17.9%) | 57 (19.5%) |
| $150,000 or more | 347 (30.6%) | 20 (6.8%) |
| Total | 1,132 (100.0%) | 293 (100.0%) |
Monthly Housing Cost Tiers in Melbourne Beach
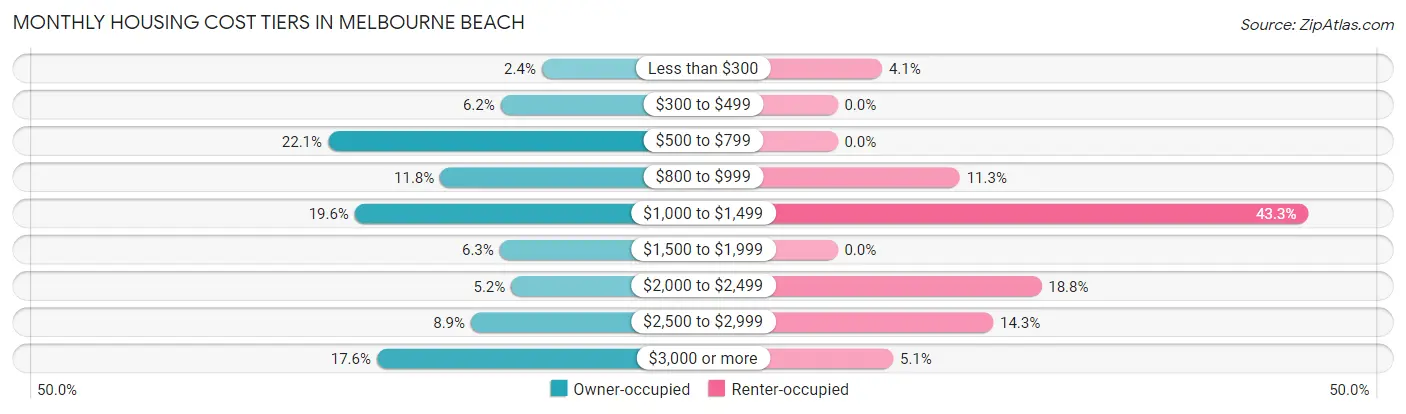
| Monthly Cost | Owner-occupied | Renter-occupied |
| Less than $300 | 27 (2.4%) | 12 (4.1%) |
| $300 to $499 | 70 (6.2%) | 0 (0.0%) |
| $500 to $799 | 250 (22.1%) | 0 (0.0%) |
| $800 to $999 | 133 (11.7%) | 33 (11.3%) |
| $1,000 to $1,499 | 222 (19.6%) | 127 (43.3%) |
| $1,500 to $1,999 | 71 (6.3%) | 0 (0.0%) |
| $2,000 to $2,499 | 59 (5.2%) | 55 (18.8%) |
| $2,500 to $2,999 | 101 (8.9%) | 42 (14.3%) |
| $3,000 or more | 199 (17.6%) | 15 (5.1%) |
| Total | 1,132 (100.0%) | 293 (100.0%) |
Physical Housing Characteristics in Melbourne Beach
Housing Structures in Melbourne Beach
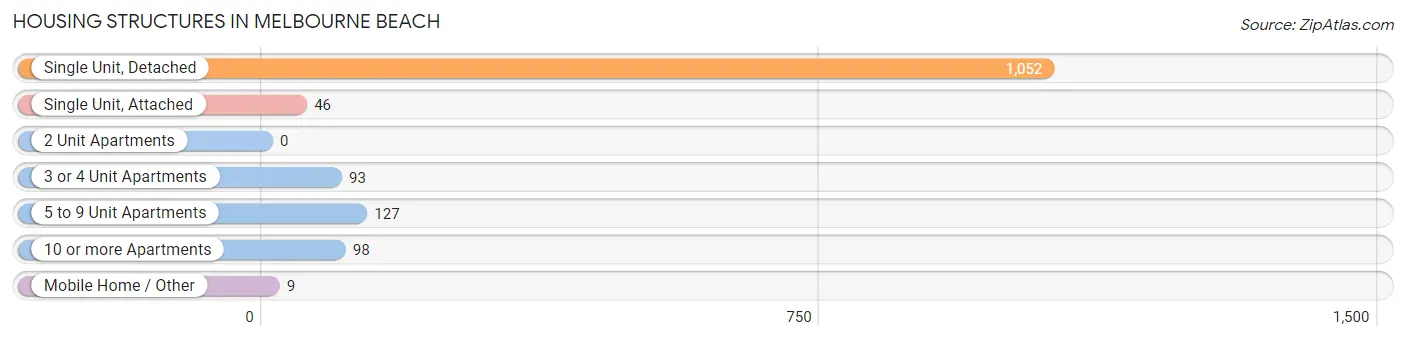
| Structure Type | # Housing Units | % Housing Units |
| Single Unit, Detached | 1,052 | 73.8% |
| Single Unit, Attached | 46 | 3.2% |
| 2 Unit Apartments | 0 | 0.0% |
| 3 or 4 Unit Apartments | 93 | 6.5% |
| 5 to 9 Unit Apartments | 127 | 8.9% |
| 10 or more Apartments | 98 | 6.9% |
| Mobile Home / Other | 9 | 0.6% |
| Total | 1,425 | 100.0% |
Housing Structures by Occupancy in Melbourne Beach
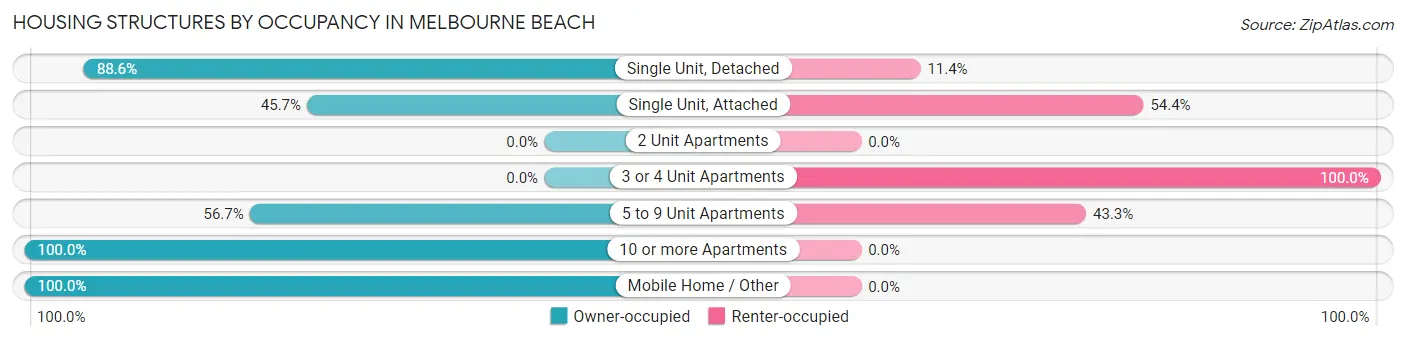
| Structure Type | Owner-occupied | Renter-occupied |
| Single Unit, Detached | 932 (88.6%) | 120 (11.4%) |
| Single Unit, Attached | 21 (45.7%) | 25 (54.3%) |
| 2 Unit Apartments | 0 (0.0%) | 0 (0.0%) |
| 3 or 4 Unit Apartments | 0 (0.0%) | 93 (100.0%) |
| 5 to 9 Unit Apartments | 72 (56.7%) | 55 (43.3%) |
| 10 or more Apartments | 98 (100.0%) | 0 (0.0%) |
| Mobile Home / Other | 9 (100.0%) | 0 (0.0%) |
| Total | 1,132 (79.4%) | 293 (20.6%) |
Housing Structures by Number of Rooms in Melbourne Beach
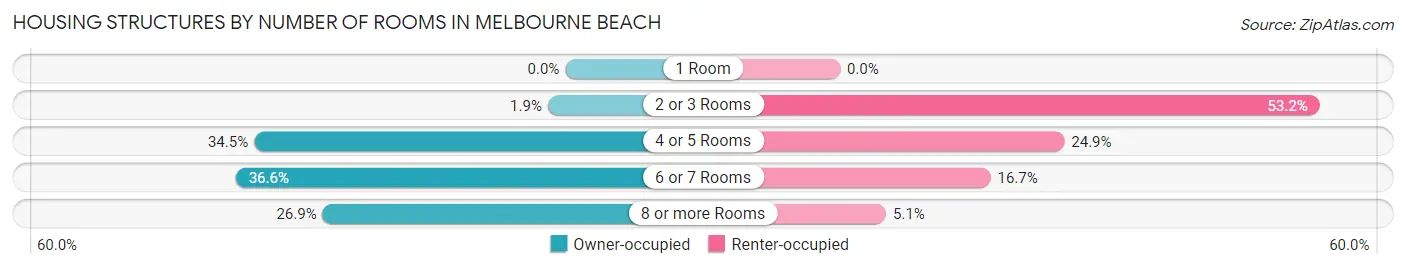
| Number of Rooms | Owner-occupied | Renter-occupied |
| 1 Room | 0 (0.0%) | 0 (0.0%) |
| 2 or 3 Rooms | 22 (1.9%) | 156 (53.2%) |
| 4 or 5 Rooms | 391 (34.5%) | 73 (24.9%) |
| 6 or 7 Rooms | 414 (36.6%) | 49 (16.7%) |
| 8 or more Rooms | 305 (26.9%) | 15 (5.1%) |
| Total | 1,132 (100.0%) | 293 (100.0%) |
Housing Structure by Heating Type in Melbourne Beach
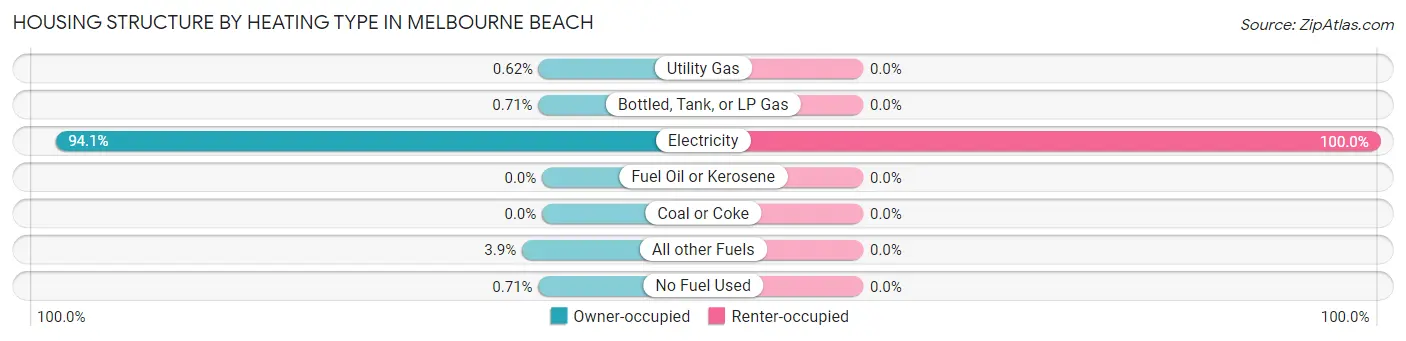
| Heating Type | Owner-occupied | Renter-occupied |
| Utility Gas | 7 (0.6%) | 0 (0.0%) |
| Bottled, Tank, or LP Gas | 8 (0.7%) | 0 (0.0%) |
| Electricity | 1,065 (94.1%) | 293 (100.0%) |
| Fuel Oil or Kerosene | 0 (0.0%) | 0 (0.0%) |
| Coal or Coke | 0 (0.0%) | 0 (0.0%) |
| All other Fuels | 44 (3.9%) | 0 (0.0%) |
| No Fuel Used | 8 (0.7%) | 0 (0.0%) |
| Total | 1,132 (100.0%) | 293 (100.0%) |
Household Vehicle Usage in Melbourne Beach
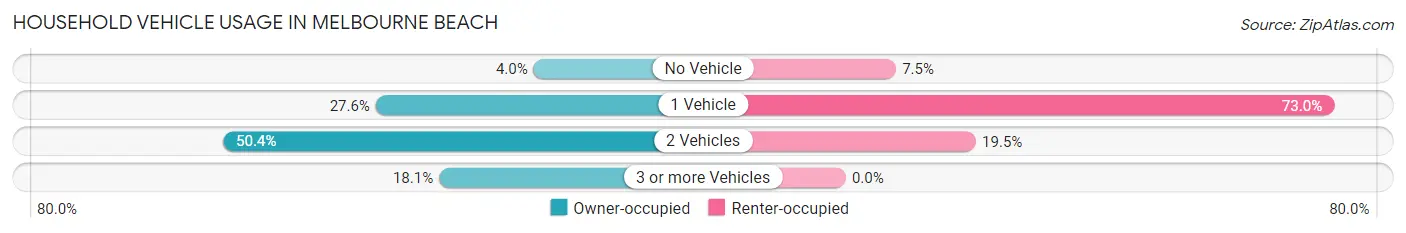
| Vehicles per Household | Owner-occupied | Renter-occupied |
| No Vehicle | 45 (4.0%) | 22 (7.5%) |
| 1 Vehicle | 312 (27.6%) | 214 (73.0%) |
| 2 Vehicles | 570 (50.3%) | 57 (19.5%) |
| 3 or more Vehicles | 205 (18.1%) | 0 (0.0%) |
| Total | 1,132 (100.0%) | 293 (100.0%) |
Real Estate & Mortgages in Melbourne Beach
Real Estate and Mortgage Overview in Melbourne Beach
| Characteristic | Without Mortgage | With Mortgage |
| Housing Units | 679 | 453 |
| Median Property Value | $551,100 | $580,200 |
| Median Household Income | $75,987 | $207 |
| Monthly Housing Costs | $807 | $176 |
| Real Estate Taxes | $2,818 | $10 |
Property Value by Mortgage Status in Melbourne Beach
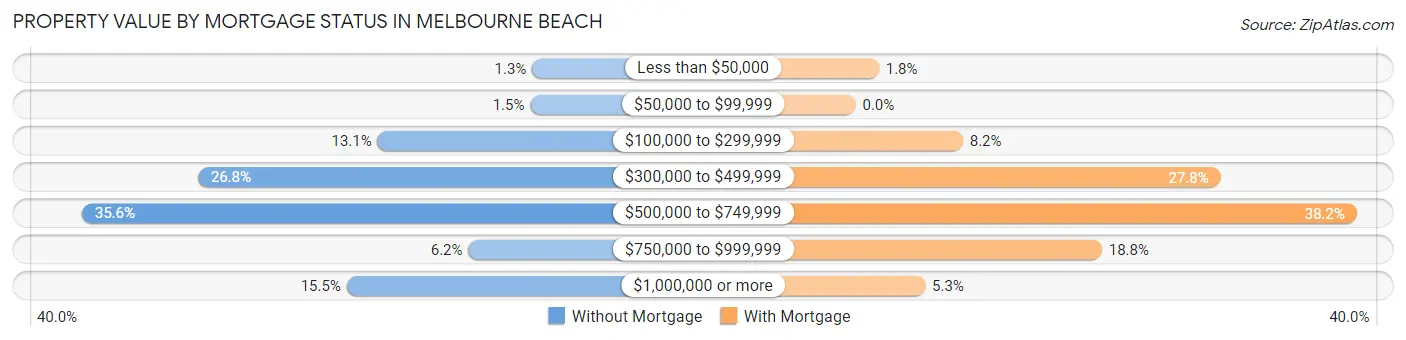
| Property Value | Without Mortgage | With Mortgage |
| Less than $50,000 | 9 (1.3%) | 8 (1.8%) |
| $50,000 to $99,999 | 10 (1.5%) | 0 (0.0%) |
| $100,000 to $299,999 | 89 (13.1%) | 37 (8.2%) |
| $300,000 to $499,999 | 182 (26.8%) | 126 (27.8%) |
| $500,000 to $749,999 | 242 (35.6%) | 173 (38.2%) |
| $750,000 to $999,999 | 42 (6.2%) | 85 (18.8%) |
| $1,000,000 or more | 105 (15.5%) | 24 (5.3%) |
| Total | 679 (100.0%) | 453 (100.0%) |
Household Income by Mortgage Status in Melbourne Beach
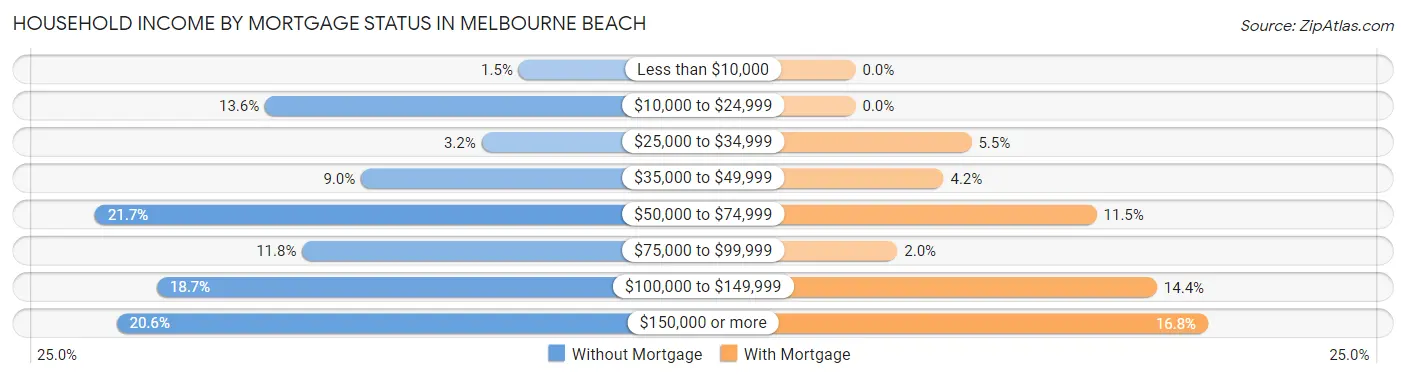
| Household Income | Without Mortgage | With Mortgage |
| Less than $10,000 | 10 (1.5%) | 0 (0.0%) |
| $10,000 to $24,999 | 92 (13.6%) | 0 (0.0%) |
| $25,000 to $34,999 | 22 (3.2%) | 25 (5.5%) |
| $35,000 to $49,999 | 61 (9.0%) | 19 (4.2%) |
| $50,000 to $74,999 | 147 (21.6%) | 52 (11.5%) |
| $75,000 to $99,999 | 80 (11.8%) | 9 (2.0%) |
| $100,000 to $149,999 | 127 (18.7%) | 65 (14.3%) |
| $150,000 or more | 140 (20.6%) | 76 (16.8%) |
| Total | 679 (100.0%) | 453 (100.0%) |
Property Value to Household Income Ratio in Melbourne Beach
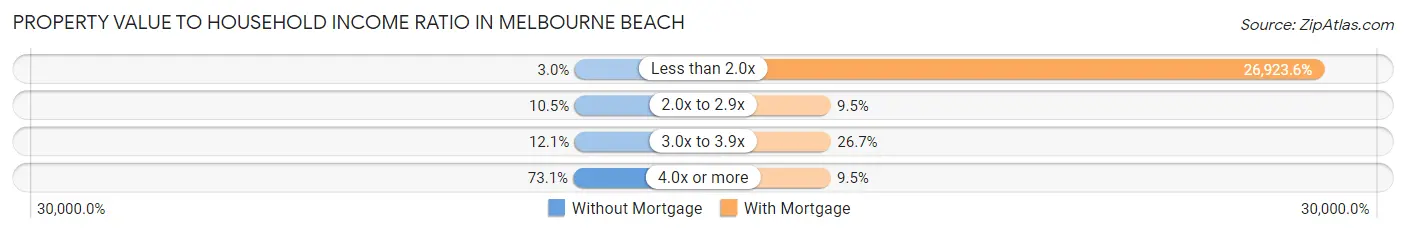
| Value-to-Income Ratio | Without Mortgage | With Mortgage |
| Less than 2.0x | 20 (2.9%) | 121,964 (26,923.6%) |
| 2.0x to 2.9x | 71 (10.5%) | 43 (9.5%) |
| 3.0x to 3.9x | 82 (12.1%) | 121 (26.7%) |
| 4.0x or more | 496 (73.1%) | 43 (9.5%) |
| Total | 679 (100.0%) | 453 (100.0%) |
Real Estate Taxes by Mortgage Status in Melbourne Beach
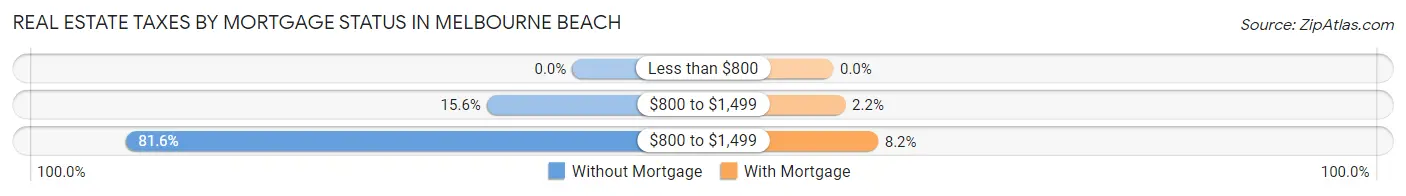
| Property Taxes | Without Mortgage | With Mortgage |
| Less than $800 | 0 (0.0%) | 0 (0.0%) |
| $800 to $1,499 | 106 (15.6%) | 10 (2.2%) |
| $800 to $1,499 | 554 (81.6%) | 37 (8.2%) |
| Total | 679 (100.0%) | 453 (100.0%) |
Health & Disability in Melbourne Beach
Health Insurance Coverage by Age in Melbourne Beach
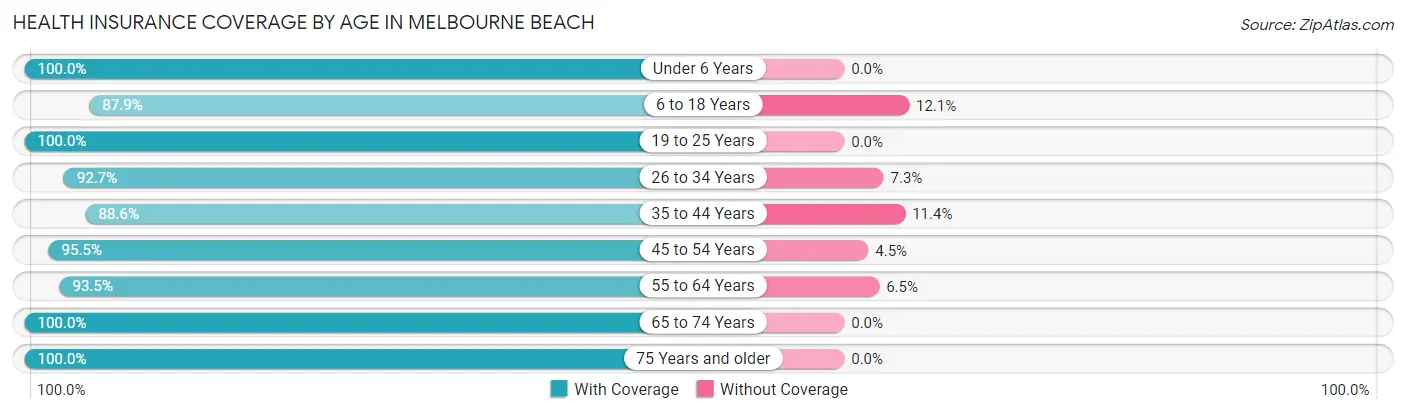
| Age Bracket | With Coverage | Without Coverage |
| Under 6 Years | 249 (100.0%) | 0 (0.0%) |
| 6 to 18 Years | 320 (87.9%) | 44 (12.1%) |
| 19 to 25 Years | 112 (100.0%) | 0 (0.0%) |
| 26 to 34 Years | 215 (92.7%) | 17 (7.3%) |
| 35 to 44 Years | 320 (88.6%) | 41 (11.4%) |
| 45 to 54 Years | 320 (95.5%) | 15 (4.5%) |
| 55 to 64 Years | 574 (93.5%) | 40 (6.5%) |
| 65 to 74 Years | 430 (100.0%) | 0 (0.0%) |
| 75 Years and older | 517 (100.0%) | 0 (0.0%) |
| Total | 3,057 (95.1%) | 157 (4.9%) |
Health Insurance Coverage by Citizenship Status in Melbourne Beach
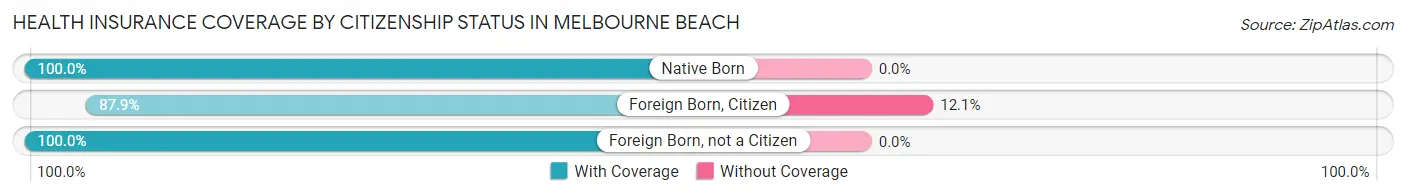
| Citizenship Status | With Coverage | Without Coverage |
| Native Born | 249 (100.0%) | 0 (0.0%) |
| Foreign Born, Citizen | 320 (87.9%) | 44 (12.1%) |
| Foreign Born, not a Citizen | 112 (100.0%) | 0 (0.0%) |
Health Insurance Coverage by Household Income in Melbourne Beach
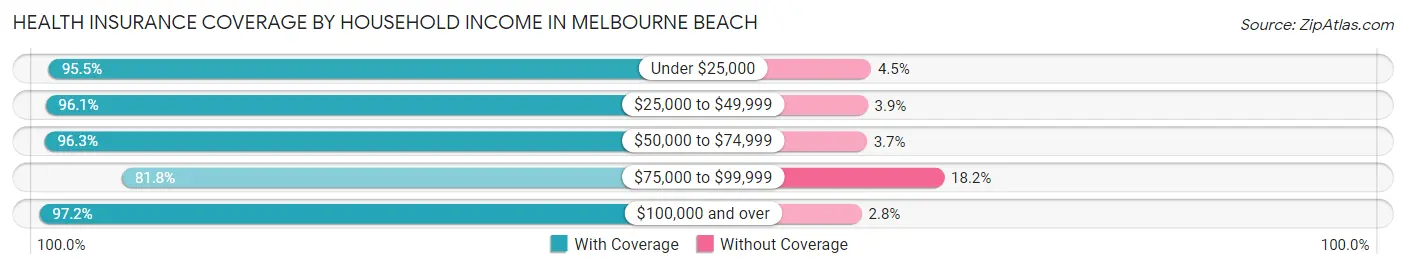
| Household Income | With Coverage | Without Coverage |
| Under $25,000 | 274 (95.5%) | 13 (4.5%) |
| $25,000 to $49,999 | 544 (96.1%) | 22 (3.9%) |
| $50,000 to $74,999 | 232 (96.3%) | 9 (3.7%) |
| $75,000 to $99,999 | 287 (81.8%) | 64 (18.2%) |
| $100,000 and over | 1,720 (97.2%) | 49 (2.8%) |
Public vs Private Health Insurance Coverage by Age in Melbourne Beach
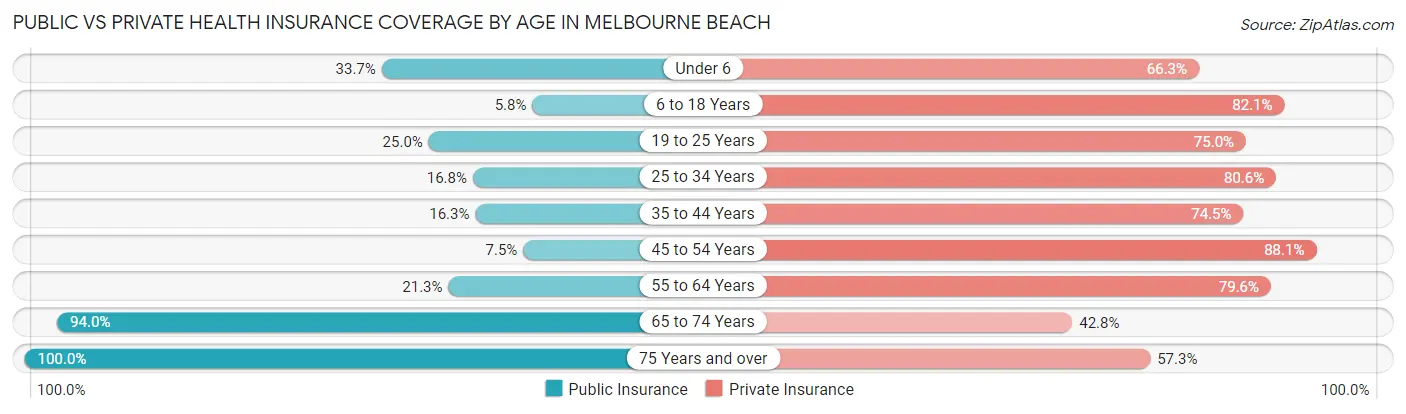
| Age Bracket | Public Insurance | Private Insurance |
| Under 6 | 84 (33.7%) | 165 (66.3%) |
| 6 to 18 Years | 21 (5.8%) | 299 (82.1%) |
| 19 to 25 Years | 28 (25.0%) | 84 (75.0%) |
| 25 to 34 Years | 39 (16.8%) | 187 (80.6%) |
| 35 to 44 Years | 59 (16.3%) | 269 (74.5%) |
| 45 to 54 Years | 25 (7.5%) | 295 (88.1%) |
| 55 to 64 Years | 131 (21.3%) | 489 (79.6%) |
| 65 to 74 Years | 404 (94.0%) | 184 (42.8%) |
| 75 Years and over | 517 (100.0%) | 296 (57.3%) |
| Total | 1,308 (40.7%) | 2,268 (70.6%) |
Disability Status by Sex by Age in Melbourne Beach
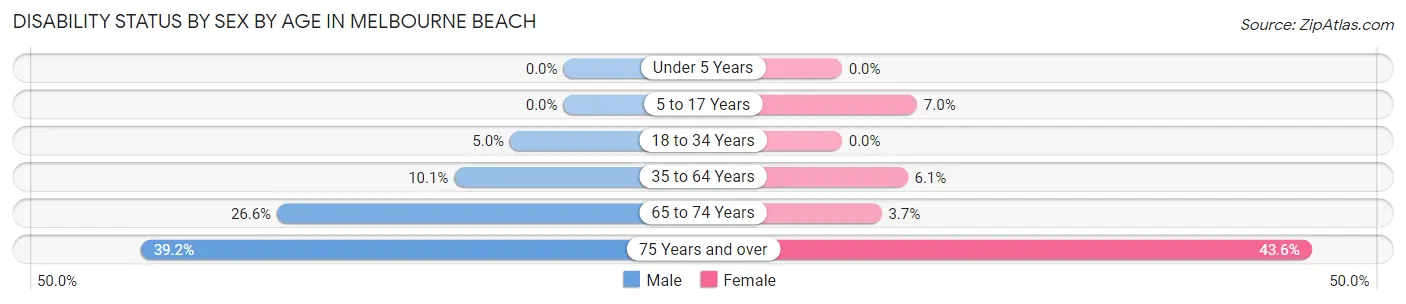
| Age Bracket | Male | Female |
| Under 5 Years | 0 (0.0%) | 0 (0.0%) |
| 5 to 17 Years | 0 (0.0%) | 14 (7.0%) |
| 18 to 34 Years | 13 (5.0%) | 0 (0.0%) |
| 35 to 64 Years | 68 (10.1%) | 39 (6.1%) |
| 65 to 74 Years | 42 (26.6%) | 10 (3.7%) |
| 75 Years and over | 111 (39.2%) | 102 (43.6%) |
Disability Class by Sex by Age in Melbourne Beach
Disability Class: Hearing Difficulty
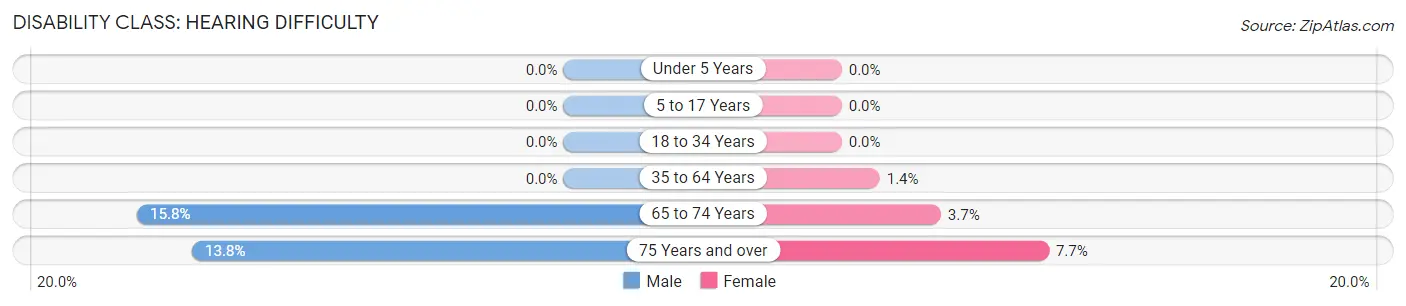
| Age Bracket | Male | Female |
| Under 5 Years | 0 (0.0%) | 0 (0.0%) |
| 5 to 17 Years | 0 (0.0%) | 0 (0.0%) |
| 18 to 34 Years | 0 (0.0%) | 0 (0.0%) |
| 35 to 64 Years | 0 (0.0%) | 9 (1.4%) |
| 65 to 74 Years | 25 (15.8%) | 10 (3.7%) |
| 75 Years and over | 39 (13.8%) | 18 (7.7%) |
Disability Class: Vision Difficulty
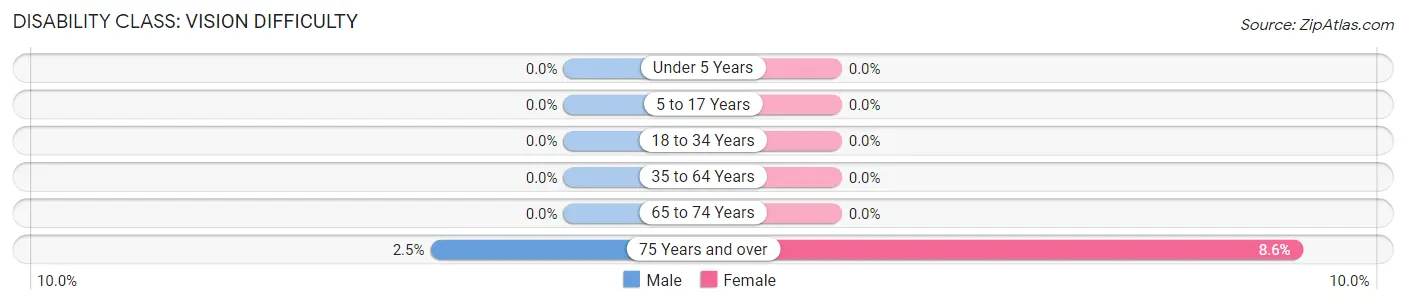
| Age Bracket | Male | Female |
| Under 5 Years | 0 (0.0%) | 0 (0.0%) |
| 5 to 17 Years | 0 (0.0%) | 0 (0.0%) |
| 18 to 34 Years | 0 (0.0%) | 0 (0.0%) |
| 35 to 64 Years | 0 (0.0%) | 0 (0.0%) |
| 65 to 74 Years | 0 (0.0%) | 0 (0.0%) |
| 75 Years and over | 7 (2.5%) | 20 (8.6%) |
Disability Class: Cognitive Difficulty
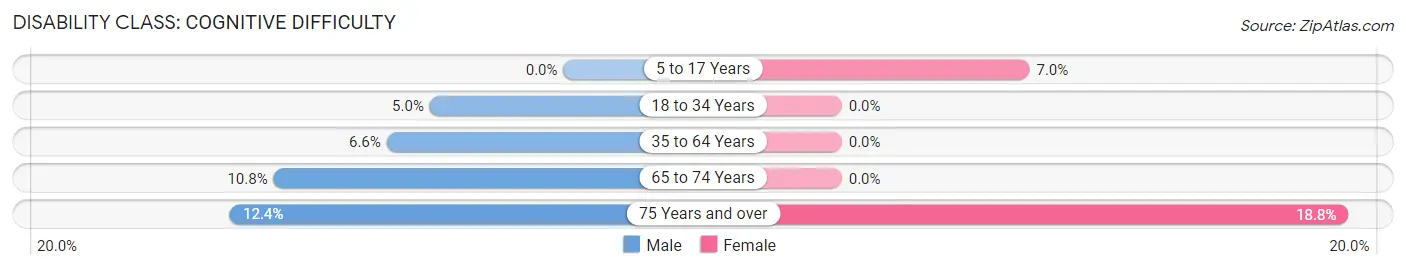
| Age Bracket | Male | Female |
| 5 to 17 Years | 0 (0.0%) | 14 (7.0%) |
| 18 to 34 Years | 13 (5.0%) | 0 (0.0%) |
| 35 to 64 Years | 44 (6.6%) | 0 (0.0%) |
| 65 to 74 Years | 17 (10.8%) | 0 (0.0%) |
| 75 Years and over | 35 (12.4%) | 44 (18.8%) |
Disability Class: Ambulatory Difficulty
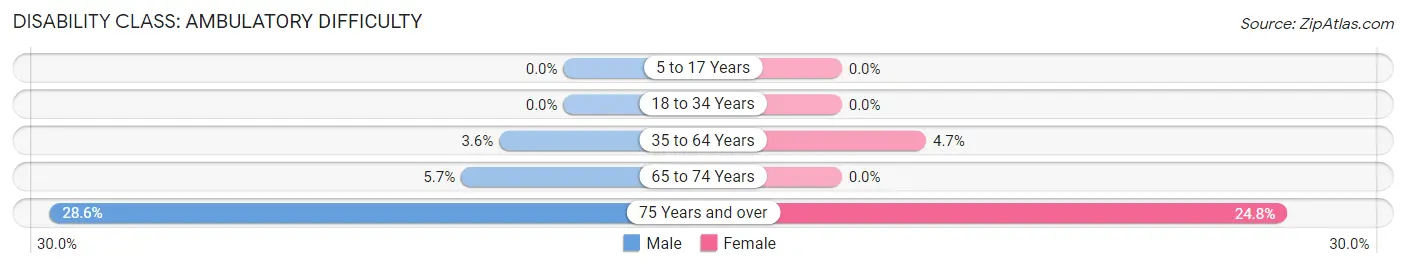
| Age Bracket | Male | Female |
| 5 to 17 Years | 0 (0.0%) | 0 (0.0%) |
| 18 to 34 Years | 0 (0.0%) | 0 (0.0%) |
| 35 to 64 Years | 24 (3.6%) | 30 (4.7%) |
| 65 to 74 Years | 9 (5.7%) | 0 (0.0%) |
| 75 Years and over | 81 (28.6%) | 58 (24.8%) |
Disability Class: Self-Care Difficulty
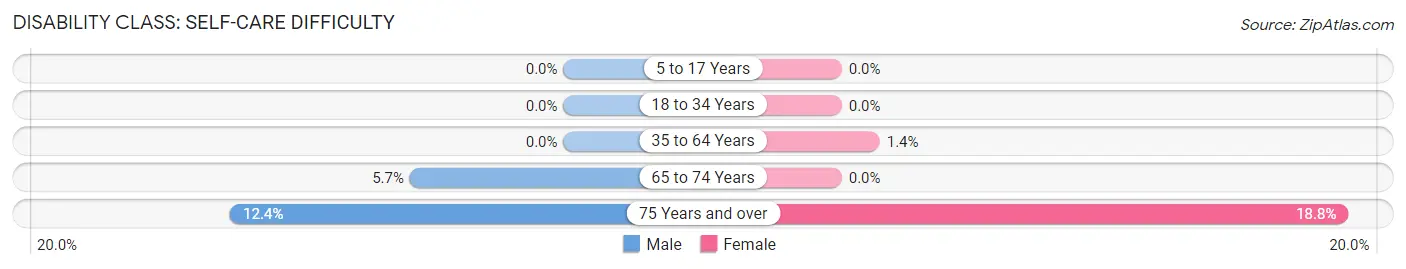
| Age Bracket | Male | Female |
| 5 to 17 Years | 0 (0.0%) | 0 (0.0%) |
| 18 to 34 Years | 0 (0.0%) | 0 (0.0%) |
| 35 to 64 Years | 0 (0.0%) | 9 (1.4%) |
| 65 to 74 Years | 9 (5.7%) | 0 (0.0%) |
| 75 Years and over | 35 (12.4%) | 44 (18.8%) |
Technology Access in Melbourne Beach
Computing Device Access in Melbourne Beach
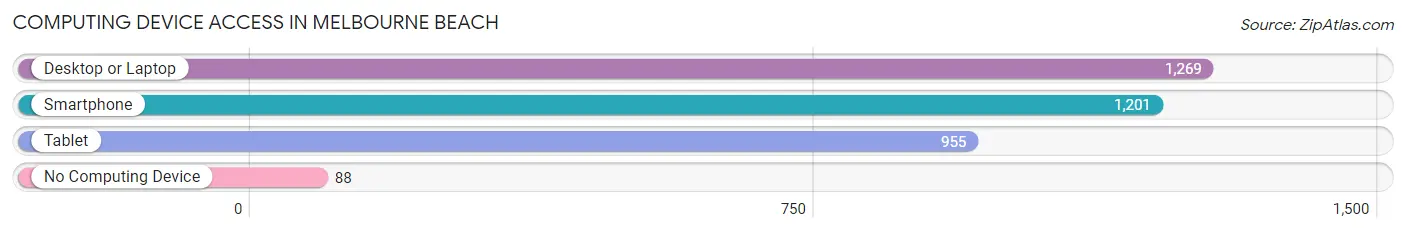
| Device Type | # Households | % Households |
| Desktop or Laptop | 1,269 | 89.0% |
| Smartphone | 1,201 | 84.3% |
| Tablet | 955 | 67.0% |
| No Computing Device | 88 | 6.2% |
| Total | 1,425 | 100.0% |
Internet Access in Melbourne Beach
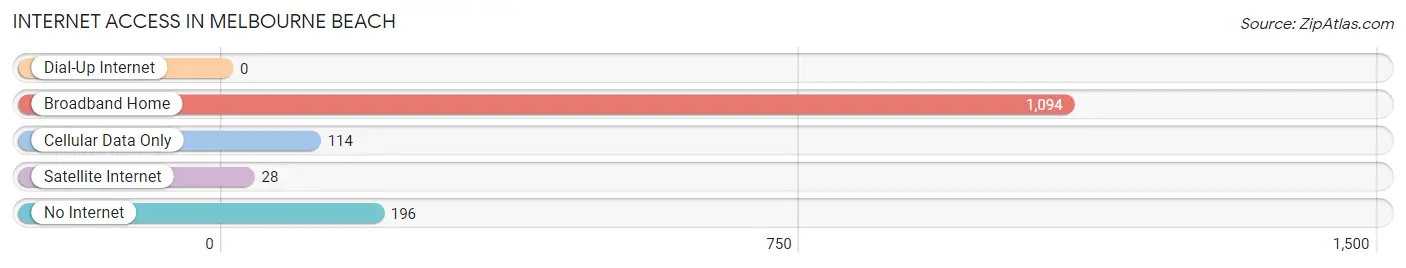
| Internet Type | # Households | % Households |
| Dial-Up Internet | 0 | 0.0% |
| Broadband Home | 1,094 | 76.8% |
| Cellular Data Only | 114 | 8.0% |
| Satellite Internet | 28 | 2.0% |
| No Internet | 196 | 13.8% |
| Total | 1,425 | 100.0% |
Melbourne Beach Summary
Melbourne Beach is a town located in Brevard County, Florida, United States. It is situated on a barrier island along the Atlantic Ocean, just south of the city of Melbourne. The town is known for its beautiful beaches, fishing, surfing, and other outdoor activities.
History
The area that is now Melbourne Beach was first inhabited by the Ais Indians, who were the original inhabitants of the area. The Ais were a hunter-gatherer tribe that lived in the area for thousands of years before the arrival of Europeans. The first Europeans to settle in the area were the Spanish, who arrived in the late 1500s. The Spanish established a mission in the area, which was later abandoned.
In the late 1700s, the area was settled by a group of English settlers, who established a small fishing village. The village was named Melbourne Beach after the nearby city of Melbourne. The town grew slowly over the next few decades, and by the mid-1800s, it had become a popular destination for tourists.
In the early 1900s, the town began to develop into a resort community. The first hotel was built in 1912, and the town soon became a popular destination for vacationers. The town was incorporated in 1925, and it has remained a popular tourist destination ever since.
Geography
Melbourne Beach is located on a barrier island along the Atlantic Ocean, just south of the city of Melbourne. The town is bordered by the Indian River Lagoon to the west and the Atlantic Ocean to the east. The town is situated on a narrow strip of land between the Indian River Lagoon and the Atlantic Ocean.
The town has a total area of 4.2 square miles, of which 0.2 square miles is land and 4.0 square miles is water. The town is located at an elevation of 10 feet above sea level.
Economy
The economy of Melbourne Beach is largely based on tourism. The town is a popular destination for vacationers, and it is home to several resorts and hotels. The town also has a number of restaurants, bars, and shops.
The town is also home to a number of businesses, including a marina, a boat repair shop, and a fishing charter service. The town is also home to a number of art galleries and other cultural attractions.
Demographics
As of the 2010 census, the population of Melbourne Beach was 3,101. The racial makeup of the town was 94.3% White, 2.2% African American, 0.3% Native American, 0.7% Asian, 0.1% Pacific Islander, 0.9% from other races, and 1.5% from two or more races. Hispanic or Latino of any race were 3.2% of the population.
The median income for a household in the town was $50,977, and the median income for a family was $60,977. The per capita income for the town was $30,977. About 5.3% of families and 7.2% of the population were below the poverty line, including 8.3% of those under age 18 and 4.2% of those age 65 or over.
Common Questions
What is Per Capita Income in Melbourne Beach?
Per Capita income in Melbourne Beach is $54,614.
What is the Median Family Income in Melbourne Beach?
Median Family Income in Melbourne Beach is $127,250.
What is the Median Household income in Melbourne Beach?
Median Household Income in Melbourne Beach is $80,795.
What is Income or Wage Gap in Melbourne Beach?
Income or Wage Gap in Melbourne Beach is 37.4%.
Women in Melbourne Beach earn 62.6 cents for every dollar earned by a man.
What is Family Income Deficit in Melbourne Beach?
Family Income Deficit in Melbourne Beach is $2,233.
Families that are below poverty line in Melbourne Beach earn $2,233 less on average than the poverty threshold level.
What is Inequality or Gini Index in Melbourne Beach?
Inequality or Gini Index in Melbourne Beach is 0.52.
What is the Total Population of Melbourne Beach?
Total Population of Melbourne Beach is 3,214.
What is the Total Male Population of Melbourne Beach?
Total Male Population of Melbourne Beach is 1,643.
What is the Total Female Population of Melbourne Beach?
Total Female Population of Melbourne Beach is 1,571.
What is the Ratio of Males per 100 Females in Melbourne Beach?
There are 104.58 Males per 100 Females in Melbourne Beach.
What is the Ratio of Females per 100 Males in Melbourne Beach?
There are 95.62 Females per 100 Males in Melbourne Beach.
What is the Median Population Age in Melbourne Beach?
Median Population Age in Melbourne Beach is 53.5 Years.
What is the Average Family Size in Melbourne Beach
Average Family Size in Melbourne Beach is 3.0 People.
What is the Average Household Size in Melbourne Beach
Average Household Size in Melbourne Beach is 2.3 People.
How Large is the Labor Force in Melbourne Beach?
There are 1,319 People in the Labor Forcein in Melbourne Beach.
What is the Percentage of People in the Labor Force in Melbourne Beach?
49.0% of People are in the Labor Force in Melbourne Beach.
What is the Unemployment Rate in Melbourne Beach?
Unemployment Rate in Melbourne Beach is 1.3%.