Medley, FL Map & Demographics
Medley Map
Medley Overview
$22,809
PER CAPITA INCOME
$51,065
AVG FAMILY INCOME
$38,583
AVG HOUSEHOLD INCOME
23.6%
WAGE / INCOME GAP [ % ]
76.4¢/ $1
WAGE / INCOME GAP [ $ ]
0.49
INEQUALITY / GINI INDEX
1,018
TOTAL POPULATION
519
MALE POPULATION
499
FEMALE POPULATION
104.01
MALES / 100 FEMALES
96.15
FEMALES / 100 MALES
58.9
MEDIAN AGE
3.0
AVG FAMILY SIZE
2.3
AVG HOUSEHOLD SIZE
509
LABOR FORCE [ PEOPLE ]
55.8%
PERCENT IN LABOR FORCE
2.0%
UNEMPLOYMENT RATE
Income in Medley
Income Overview in Medley
Per Capita Income in Medley is $22,809, while median incomes of families and households are $51,065 and $38,583 respectively.
| Characteristic | Number | Measure |
| Per Capita Income | 1,018 | $22,809 |
| Median Family Income | 255 | $51,065 |
| Mean Family Income | 255 | $69,207 |
| Median Household Income | 443 | $38,583 |
| Mean Household Income | 443 | $49,564 |
| Income Deficit | 255 | $0 |
| Wage / Income Gap (%) | 1,018 | 23.58% |
| Wage / Income Gap ($) | 1,018 | 76.42¢ per $1 |
| Gini / Inequality Index | 1,018 | 0.49 |
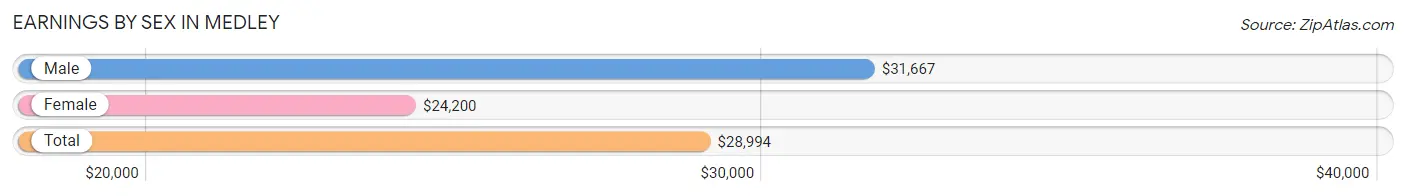
Earnings by Sex in Medley
Average Earnings in Medley are $28,994, $31,667 for men and $24,200 for women, a difference of 23.6%.
| Sex | Number | Average Earnings |
| Male | 320 (62.5%) | $31,667 |
| Female | 192 (37.5%) | $24,200 |
| Total | 512 (100.0%) | $28,994 |
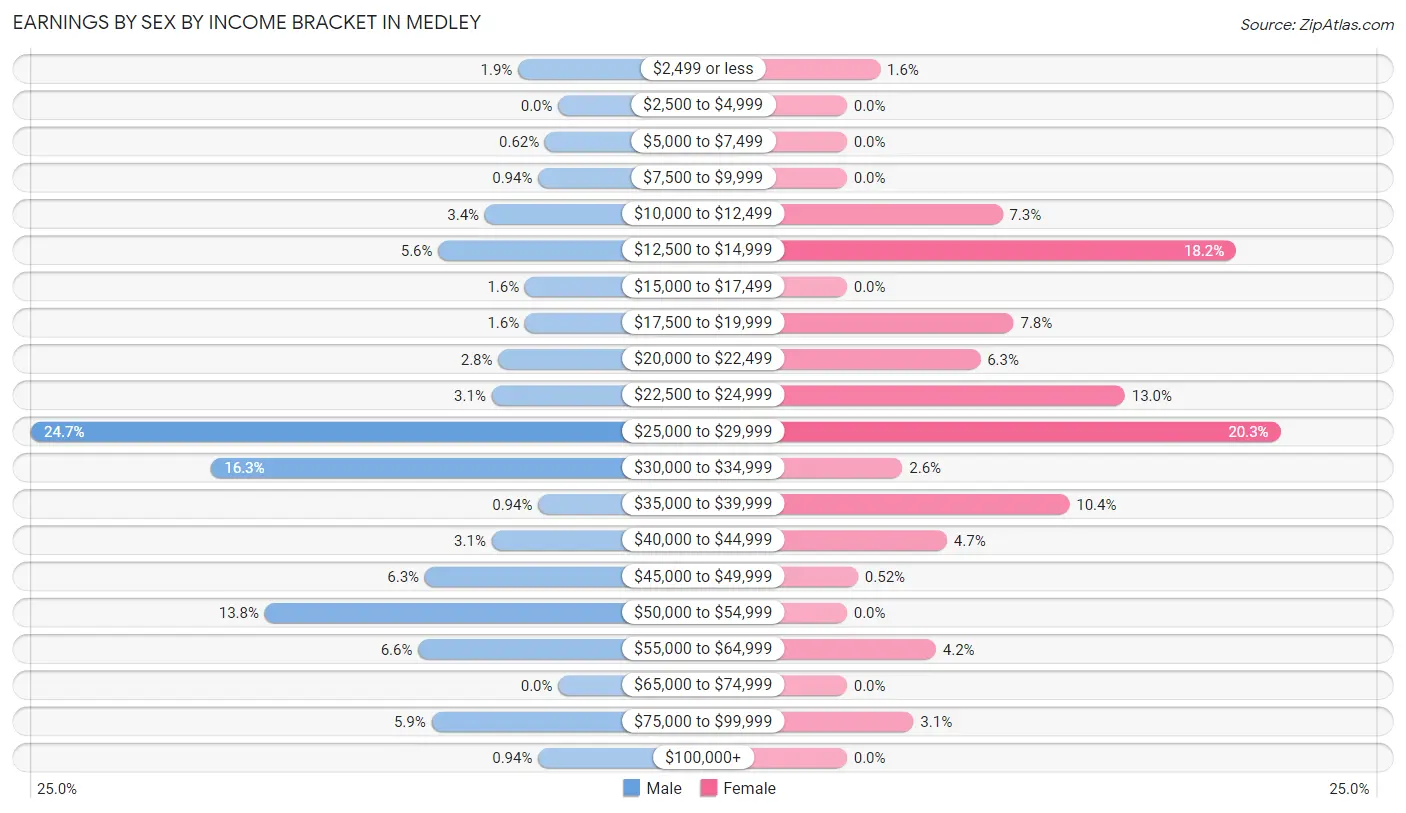
Earnings by Sex by Income Bracket in Medley
The most common earnings brackets in Medley are $25,000 to $29,999 for men (79 | 24.7%) and $25,000 to $29,999 for women (39 | 20.3%).
| Income | Male | Female |
| $2,499 or less | 6 (1.9%) | 3 (1.6%) |
| $2,500 to $4,999 | 0 (0.0%) | 0 (0.0%) |
| $5,000 to $7,499 | 2 (0.6%) | 0 (0.0%) |
| $7,500 to $9,999 | 3 (0.9%) | 0 (0.0%) |
| $10,000 to $12,499 | 11 (3.4%) | 14 (7.3%) |
| $12,500 to $14,999 | 18 (5.6%) | 35 (18.2%) |
| $15,000 to $17,499 | 5 (1.6%) | 0 (0.0%) |
| $17,500 to $19,999 | 5 (1.6%) | 15 (7.8%) |
| $20,000 to $22,499 | 9 (2.8%) | 12 (6.2%) |
| $22,500 to $24,999 | 10 (3.1%) | 25 (13.0%) |
| $25,000 to $29,999 | 79 (24.7%) | 39 (20.3%) |
| $30,000 to $34,999 | 52 (16.3%) | 5 (2.6%) |
| $35,000 to $39,999 | 3 (0.9%) | 20 (10.4%) |
| $40,000 to $44,999 | 10 (3.1%) | 9 (4.7%) |
| $45,000 to $49,999 | 20 (6.2%) | 1 (0.5%) |
| $50,000 to $54,999 | 44 (13.8%) | 0 (0.0%) |
| $55,000 to $64,999 | 21 (6.6%) | 8 (4.2%) |
| $65,000 to $74,999 | 0 (0.0%) | 0 (0.0%) |
| $75,000 to $99,999 | 19 (5.9%) | 6 (3.1%) |
| $100,000+ | 3 (0.9%) | 0 (0.0%) |
| Total | 320 (100.0%) | 192 (100.0%) |
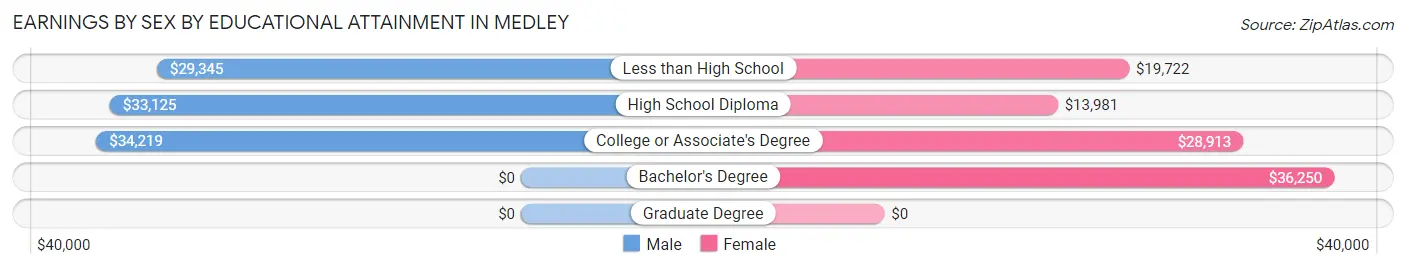
Earnings by Sex by Educational Attainment in Medley
Average earnings in Medley are $32,941 for men and $23,950 for women, a difference of 27.3%. Men with an educational attainment of college or associate's degree enjoy the highest average annual earnings of $34,219, while those with less than high school education earn the least with $29,345. Women with an educational attainment of bachelor's degree earn the most with the average annual earnings of $36,250, while those with high school diploma education have the smallest earnings of $13,981.
| Educational Attainment | Male Income | Female Income |
| Less than High School | $29,345 | $19,722 |
| High School Diploma | $33,125 | $13,981 |
| College or Associate's Degree | $34,219 | $28,913 |
| Bachelor's Degree | - | - |
| Graduate Degree | - | - |
| Total | $32,941 | $23,950 |
Family Income in Medley
Family Income Brackets in Medley
According to the Medley family income data, there are 59 families falling into the $35,000 to $49,999 income range, which is the most common income bracket and makes up 23.1% of all families.
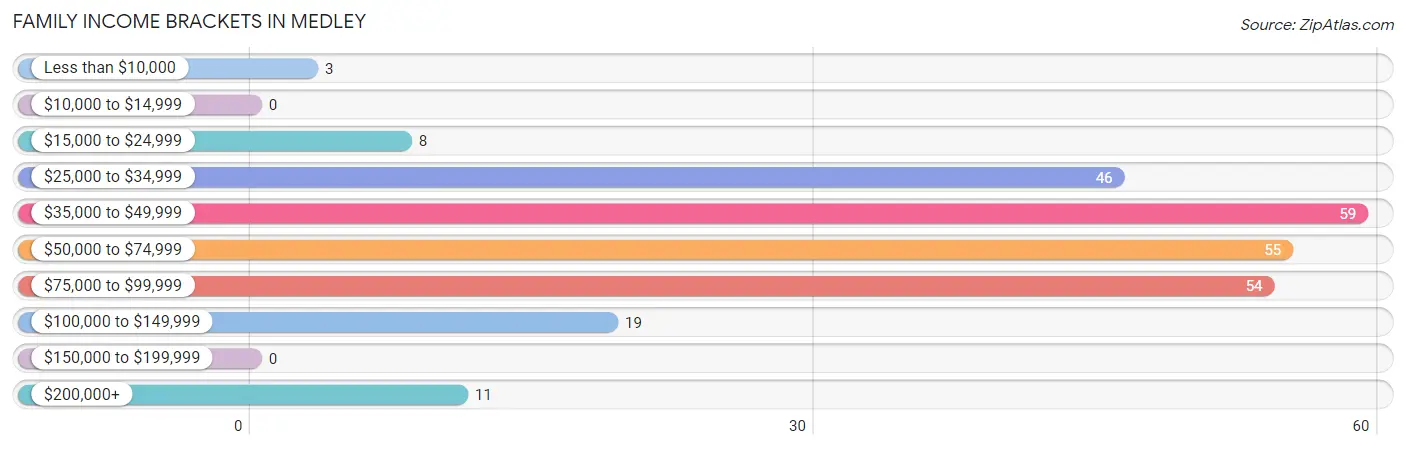
| Income Bracket | # Families | % Families |
| Less than $10,000 | 3 | 1.2% |
| $10,000 to $14,999 | 0 | 0.0% |
| $15,000 to $24,999 | 8 | 3.1% |
| $25,000 to $34,999 | 46 | 18.0% |
| $35,000 to $49,999 | 59 | 23.1% |
| $50,000 to $74,999 | 55 | 21.6% |
| $75,000 to $99,999 | 54 | 21.2% |
| $100,000 to $149,999 | 19 | 7.5% |
| $150,000 to $199,999 | 0 | 0.0% |
| $200,000+ | 11 | 4.3% |
Family Income by Famaliy Size in Medley
3-person families (77 | 30.2%) account for the highest median family income in Medley with $83,281 per family, while 3-person families (77 | 30.2%) have the highest median income of $27,760 per family member.
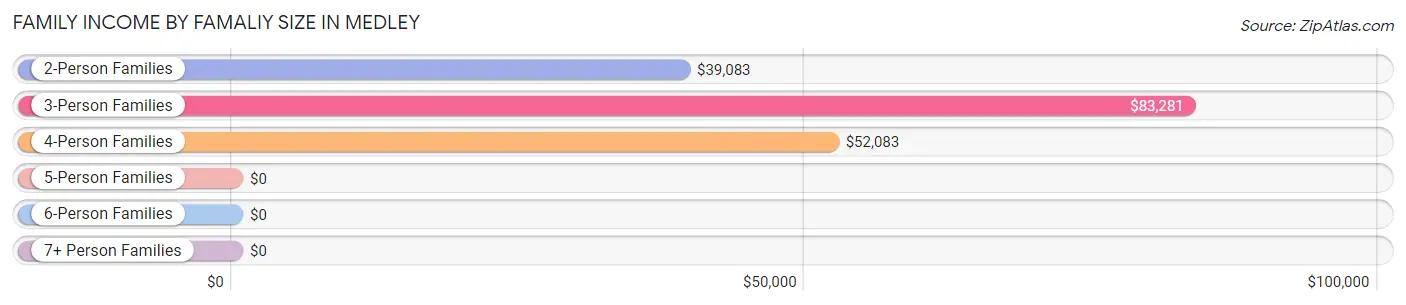
| Income Bracket | # Families | Median Income |
| 2-Person Families | 113 (44.3%) | $39,083 |
| 3-Person Families | 77 (30.2%) | $83,281 |
| 4-Person Families | 50 (19.6%) | $52,083 |
| 5-Person Families | 15 (5.9%) | $0 |
| 6-Person Families | 0 (0.0%) | $0 |
| 7+ Person Families | 0 (0.0%) | $0 |
| Total | 255 (100.0%) | $51,065 |
Family Income by Number of Earners in Medley
The median family income in Medley is $51,065, with families comprising 3+ earners (28) having the highest median family income of $101,250, while families with no earners (47) have the lowest median family income of $28,533, accounting for 11.0% and 18.4% of families, respectively.
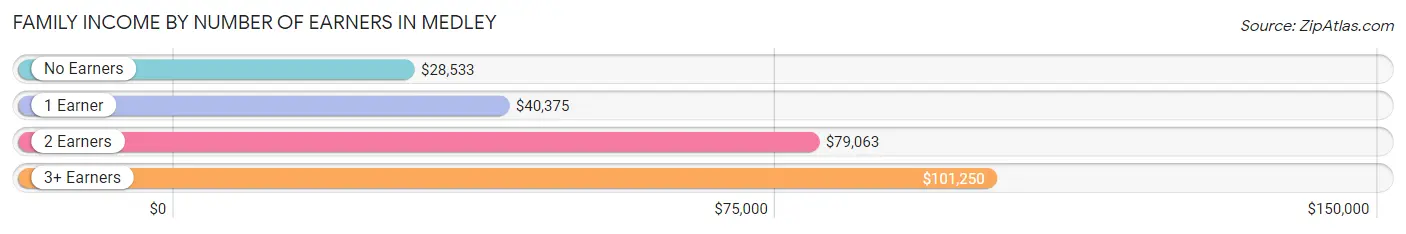
| Number of Earners | # Families | Median Income |
| No Earners | 47 (18.4%) | $28,533 |
| 1 Earner | 67 (26.3%) | $40,375 |
| 2 Earners | 113 (44.3%) | $79,063 |
| 3+ Earners | 28 (11.0%) | $101,250 |
| Total | 255 (100.0%) | $51,065 |
Household Income in Medley
Household Income Brackets in Medley
With 82 households falling in the category, the $35,000 to $49,999 income range is the most frequent in Medley, accounting for 18.5% of all households.
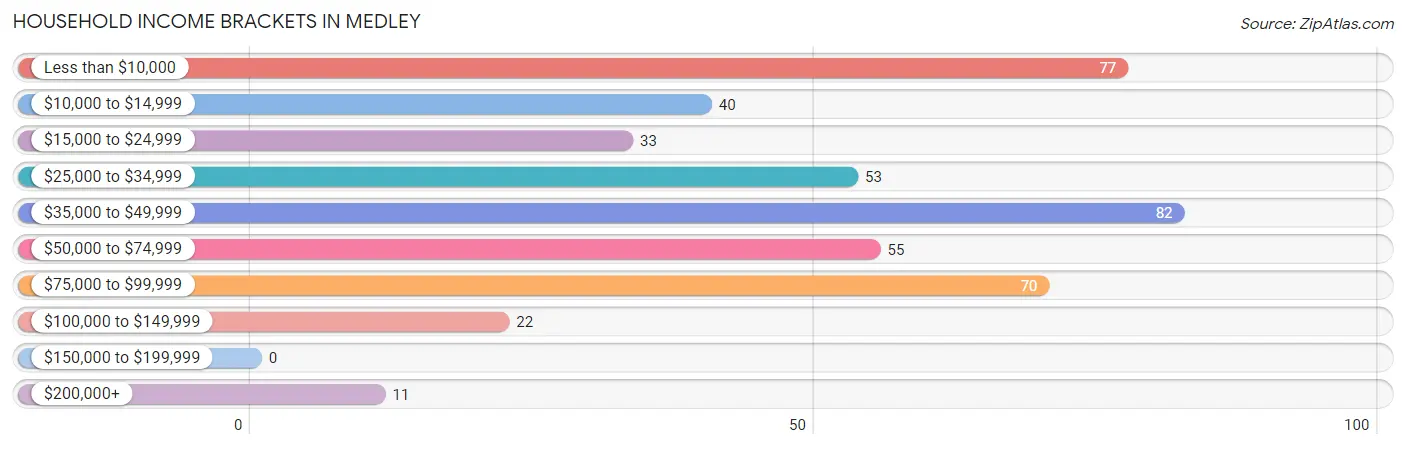
| Income Bracket | # Households | % Households |
| Less than $10,000 | 77 | 17.4% |
| $10,000 to $14,999 | 40 | 9.0% |
| $15,000 to $24,999 | 33 | 7.4% |
| $25,000 to $34,999 | 53 | 12.0% |
| $35,000 to $49,999 | 82 | 18.5% |
| $50,000 to $74,999 | 55 | 12.4% |
| $75,000 to $99,999 | 70 | 15.8% |
| $100,000 to $149,999 | 22 | 5.0% |
| $150,000 to $199,999 | 0 | 0.0% |
| $200,000+ | 11 | 2.5% |
Household Income by Householder Age in Medley
The median household income in Medley is $38,583, with the highest median household income of $78,542 found in the 25 to 44 years age bracket for the primary householder. A total of 51 households (11.5%) fall into this category.
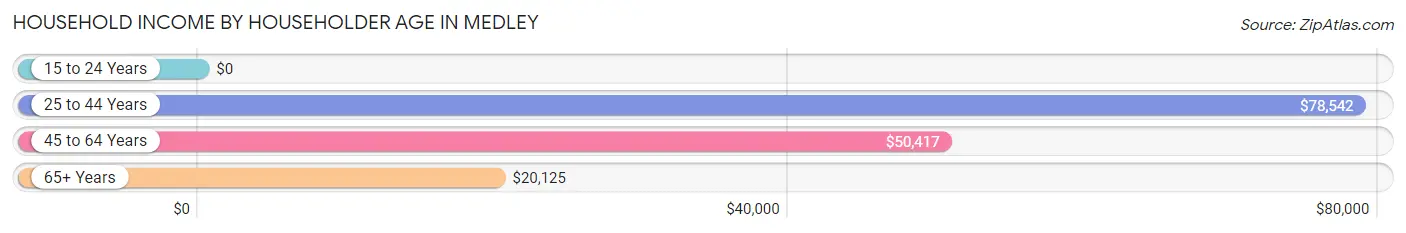
| Income Bracket | # Households | Median Income |
| 15 to 24 Years | 0 (0.0%) | $0 |
| 25 to 44 Years | 51 (11.5%) | $78,542 |
| 45 to 64 Years | 155 (35.0%) | $50,417 |
| 65+ Years | 237 (53.5%) | $20,125 |
| Total | 443 (100.0%) | $38,583 |
Poverty in Medley
Income Below Poverty by Sex and Age in Medley
With 20.4% poverty level for males and 22.7% for females among the residents of Medley, 16 and 17 year old males and 75 year old and over females are the most vulnerable to poverty, with 7 males (58.3%) and 57 females (43.2%) in their respective age groups living below the poverty level.
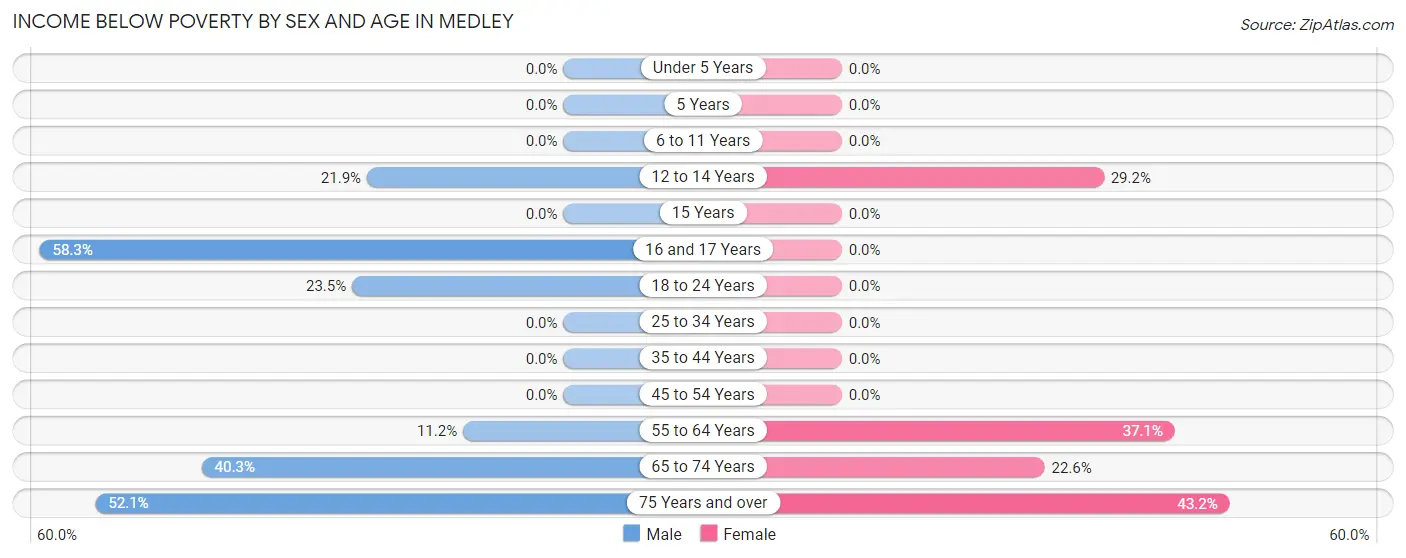
| Age Bracket | Male | Female |
| Under 5 Years | 0 (0.0%) | 0 (0.0%) |
| 5 Years | 0 (0.0%) | 0 (0.0%) |
| 6 to 11 Years | 0 (0.0%) | 0 (0.0%) |
| 12 to 14 Years | 7 (21.9%) | 7 (29.2%) |
| 15 Years | 0 (0.0%) | 0 (0.0%) |
| 16 and 17 Years | 7 (58.3%) | 0 (0.0%) |
| 18 to 24 Years | 8 (23.5%) | 0 (0.0%) |
| 25 to 34 Years | 0 (0.0%) | 0 (0.0%) |
| 35 to 44 Years | 0 (0.0%) | 0 (0.0%) |
| 45 to 54 Years | 0 (0.0%) | 0 (0.0%) |
| 55 to 64 Years | 18 (11.2%) | 33 (37.1%) |
| 65 to 74 Years | 29 (40.3%) | 14 (22.6%) |
| 75 Years and over | 37 (52.1%) | 57 (43.2%) |
| Total | 106 (20.4%) | 111 (22.7%) |
Income Above Poverty by Sex and Age in Medley
According to the poverty statistics in Medley, males aged 6 to 11 years and females aged under 5 years are the age groups that are most secure financially, with 100.0% of males and 100.0% of females in these age groups living above the poverty line.
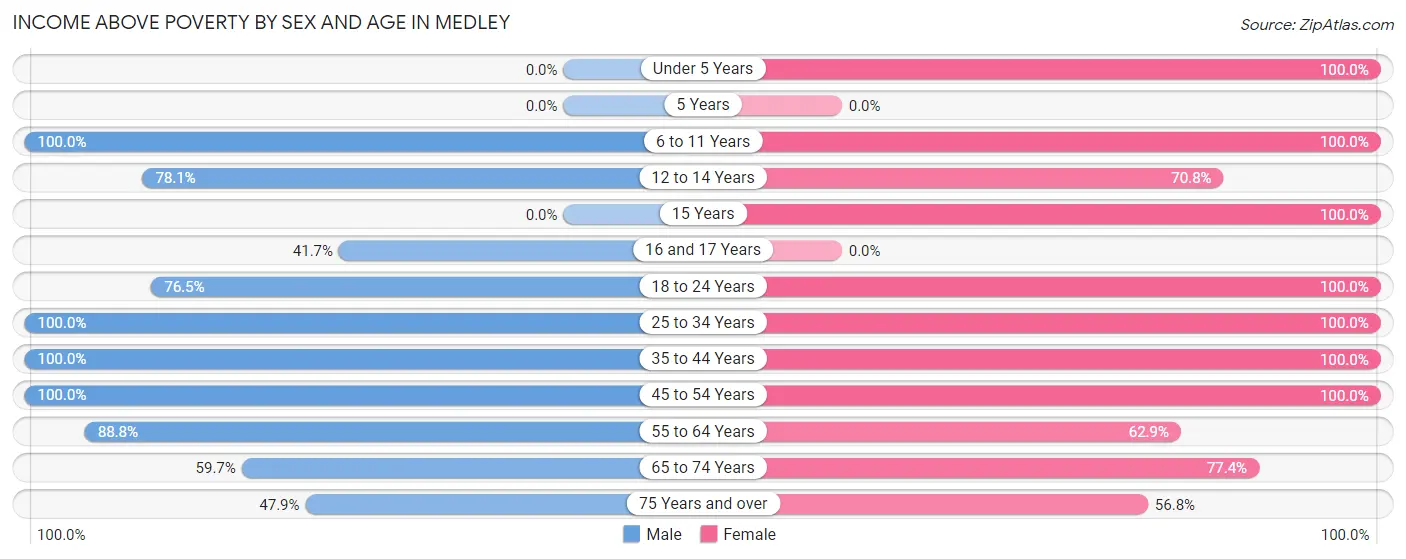
| Age Bracket | Male | Female |
| Under 5 Years | 0 (0.0%) | 23 (100.0%) |
| 5 Years | 0 (0.0%) | 0 (0.0%) |
| 6 to 11 Years | 6 (100.0%) | 4 (100.0%) |
| 12 to 14 Years | 25 (78.1%) | 17 (70.8%) |
| 15 Years | 0 (0.0%) | 6 (100.0%) |
| 16 and 17 Years | 5 (41.7%) | 0 (0.0%) |
| 18 to 24 Years | 26 (76.5%) | 37 (100.0%) |
| 25 to 34 Years | 44 (100.0%) | 40 (100.0%) |
| 35 to 44 Years | 43 (100.0%) | 33 (100.0%) |
| 45 to 54 Years | 44 (100.0%) | 39 (100.0%) |
| 55 to 64 Years | 143 (88.8%) | 56 (62.9%) |
| 65 to 74 Years | 43 (59.7%) | 48 (77.4%) |
| 75 Years and over | 34 (47.9%) | 75 (56.8%) |
| Total | 413 (79.6%) | 378 (77.3%) |
Income Below Poverty Among Married-Couple Families in Medley
The poverty statistics for married-couple families in Medley show that 3.6% or 6 of the total 166 families live below the poverty line. Families with no children have the highest poverty rate of 4.7%, comprising of 6 families. On the other hand, families with 1 or 2 children have the lowest poverty rate of 0.0%, which includes 0 families.
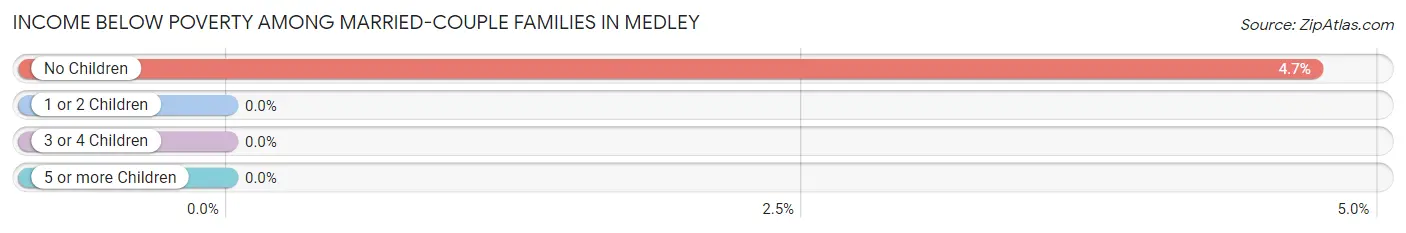
| Children | Above Poverty | Below Poverty |
| No Children | 121 (95.3%) | 6 (4.7%) |
| 1 or 2 Children | 39 (100.0%) | 0 (0.0%) |
| 3 or 4 Children | 0 (0.0%) | 0 (0.0%) |
| 5 or more Children | 0 (0.0%) | 0 (0.0%) |
| Total | 160 (96.4%) | 6 (3.6%) |
Income Below Poverty Among Single-Parent Households in Medley
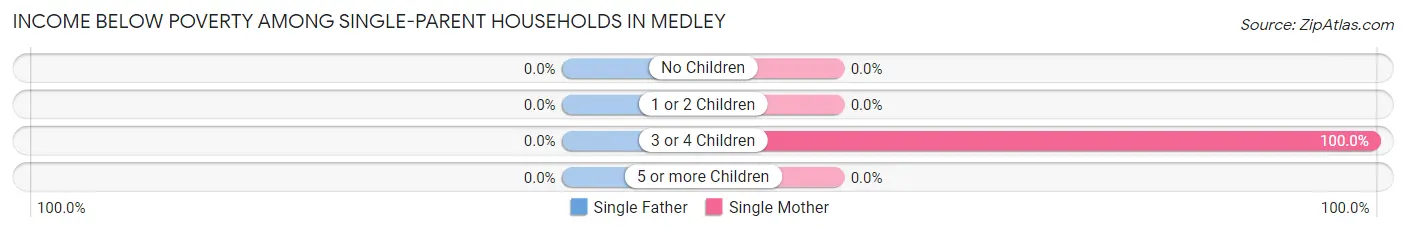
| Children | Single Father | Single Mother |
| No Children | 0 (0.0%) | 0 (0.0%) |
| 1 or 2 Children | 0 (0.0%) | 0 (0.0%) |
| 3 or 4 Children | 0 (0.0%) | 8 (100.0%) |
| 5 or more Children | 0 (0.0%) | 0 (0.0%) |
| Total | 0 (0.0%) | 8 (10.5%) |
Income Below Poverty Among Married-Couple vs Single-Parent Households in Medley
The poverty data for Medley shows that 6 of the married-couple family households (3.6%) and 8 of the single-parent households (9.0%) are living below the poverty level. Within the married-couple family households, those with no children have the highest poverty rate, with 6 households (4.7%) falling below the poverty line. Among the single-parent households, those with 3 or 4 children have the highest poverty rate, with 8 household (100.0%) living below poverty.
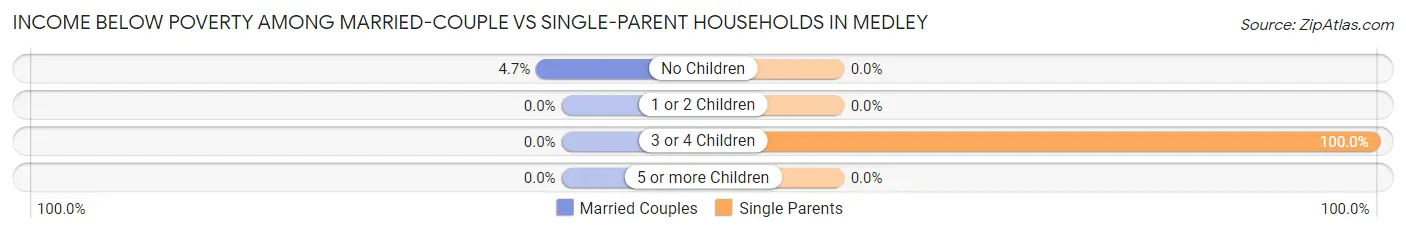
| Children | Married-Couple Families | Single-Parent Households |
| No Children | 6 (4.7%) | 0 (0.0%) |
| 1 or 2 Children | 0 (0.0%) | 0 (0.0%) |
| 3 or 4 Children | 0 (0.0%) | 8 (100.0%) |
| 5 or more Children | 0 (0.0%) | 0 (0.0%) |
| Total | 6 (3.6%) | 8 (9.0%) |
Race in Medley
The most populous races in Medley are Hispanic or Latino (988 | 97.1%), White / Caucasian (683 | 67.1%), and Two or more Races (320 | 31.4%).
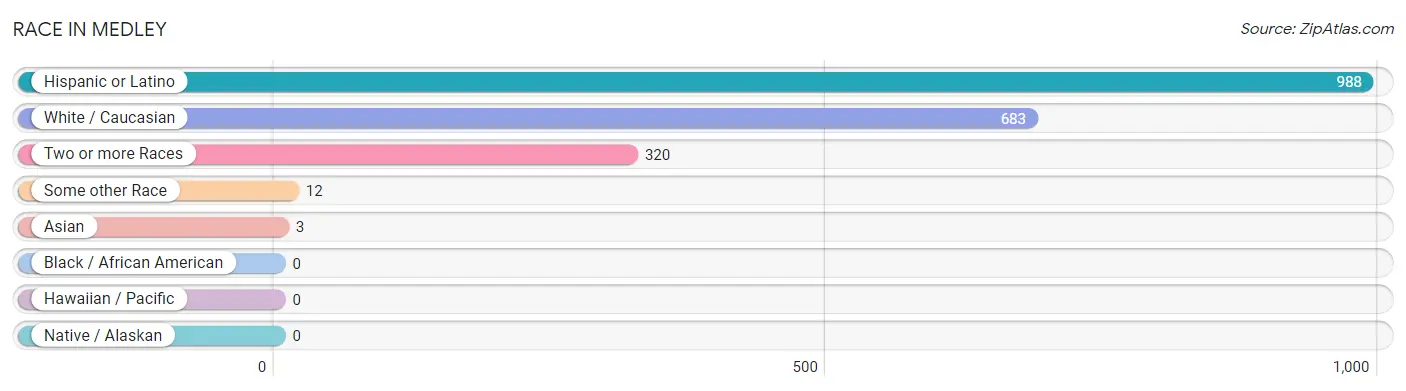
| Race | # Population | % Population |
| Asian | 3 | 0.3% |
| Black / African American | 0 | 0.0% |
| Hawaiian / Pacific | 0 | 0.0% |
| Hispanic or Latino | 988 | 97.1% |
| Native / Alaskan | 0 | 0.0% |
| White / Caucasian | 683 | 67.1% |
| Two or more Races | 320 | 31.4% |
| Some other Race | 12 | 1.2% |
| Total | 1,018 | 100.0% |
Ancestry in Medley
The most populous ancestries reported in Medley are Cuban (713 | 70.0%), Central American (104 | 10.2%), South American (100 | 9.8%), Nicaraguan (70 | 6.9%), and Colombian (49 | 4.8%), together accounting for 101.8% of all Medley residents.
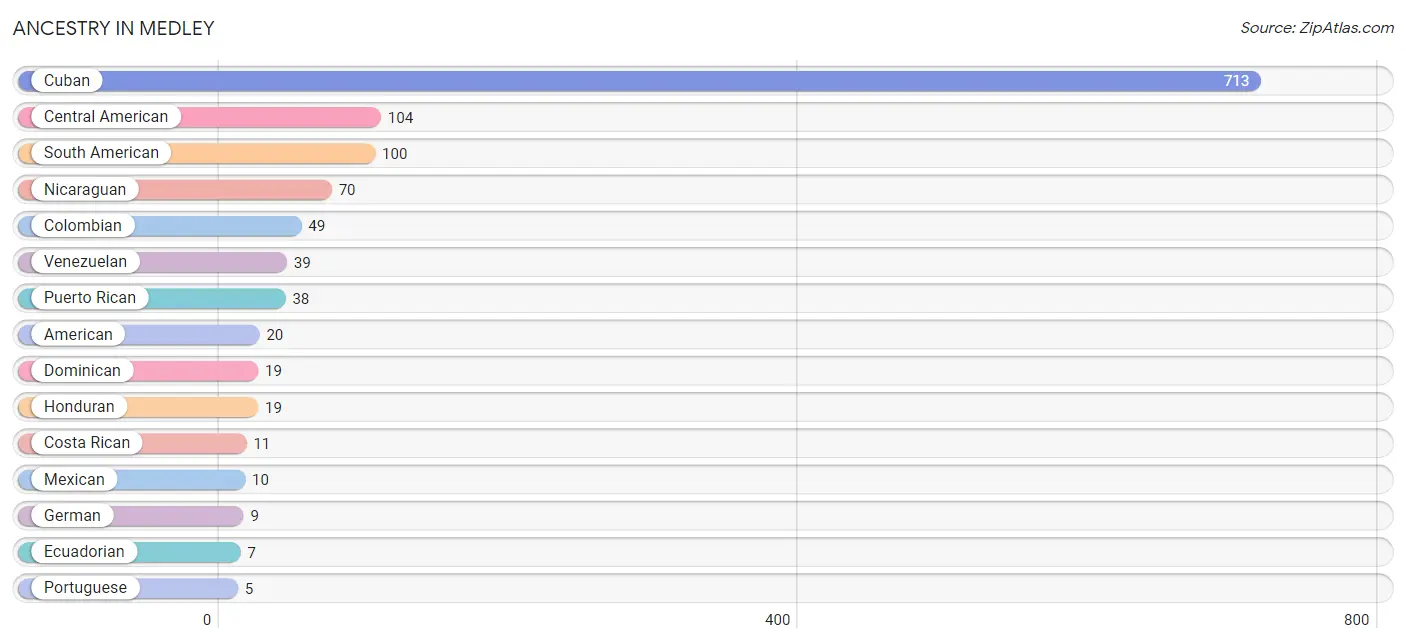
| Ancestry | # Population | % Population |
| African | 3 | 0.3% |
| American | 20 | 2.0% |
| Argentinean | 3 | 0.3% |
| Burmese | 3 | 0.3% |
| Central American | 104 | 10.2% |
| Chilean | 2 | 0.2% |
| Colombian | 49 | 4.8% |
| Costa Rican | 11 | 1.1% |
| Cuban | 713 | 70.0% |
| Dominican | 19 | 1.9% |
| Ecuadorian | 7 | 0.7% |
| English | 2 | 0.2% |
| German | 9 | 0.9% |
| Honduran | 19 | 1.9% |
| Hungarian | 2 | 0.2% |
| Indian (Asian) | 3 | 0.3% |
| Mexican | 10 | 1.0% |
| Nicaraguan | 70 | 6.9% |
| Panamanian | 4 | 0.4% |
| Portuguese | 5 | 0.5% |
| Puerto Rican | 38 | 3.7% |
| Scottish | 2 | 0.2% |
| South American | 100 | 9.8% |
| Spaniard | 1 | 0.1% |
| Subsaharan African | 3 | 0.3% |
| Trinidadian and Tobagonian | 3 | 0.3% |
| Venezuelan | 39 | 3.8% | View All 27 Rows |
Immigrants in Medley
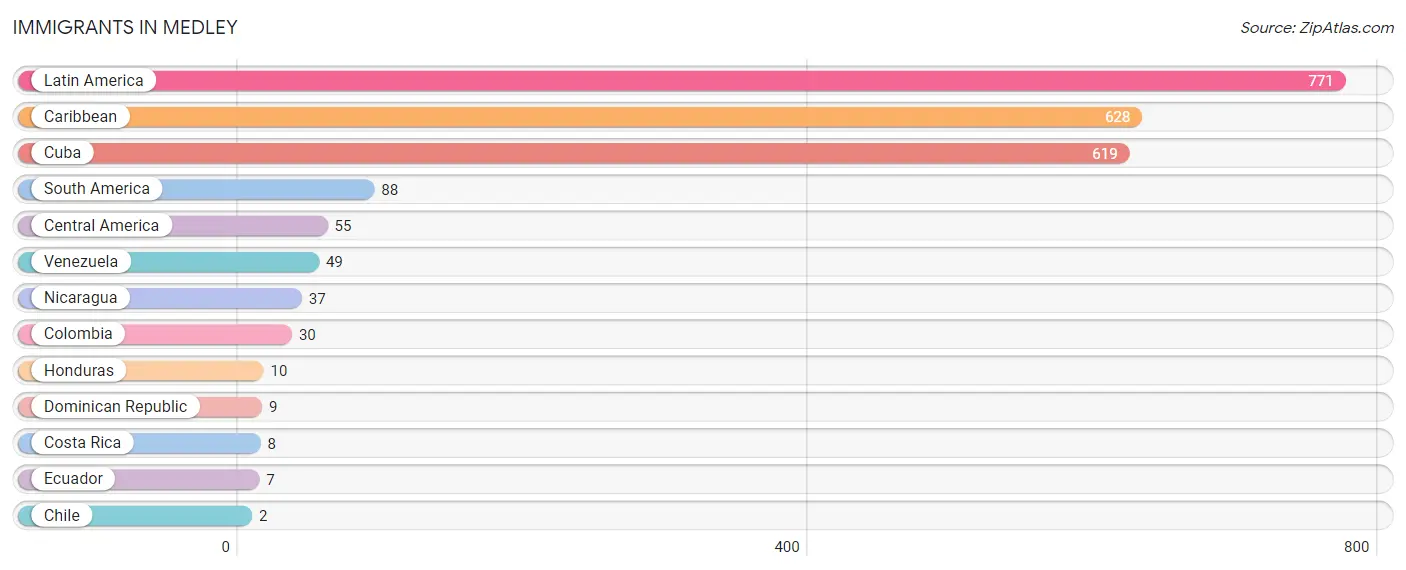
The most numerous immigrant groups reported in Medley came from Latin America (771 | 75.7%), Caribbean (628 | 61.7%), Cuba (619 | 60.8%), South America (88 | 8.6%), and Central America (55 | 5.4%), together accounting for 212.3% of all Medley residents.
| Immigration Origin | # Population | % Population |
| Caribbean | 628 | 61.7% |
| Central America | 55 | 5.4% |
| Chile | 2 | 0.2% |
| Colombia | 30 | 2.9% |
| Costa Rica | 8 | 0.8% |
| Cuba | 619 | 60.8% |
| Dominican Republic | 9 | 0.9% |
| Ecuador | 7 | 0.7% |
| Honduras | 10 | 1.0% |
| Latin America | 771 | 75.7% |
| Nicaragua | 37 | 3.6% |
| South America | 88 | 8.6% |
| Venezuela | 49 | 4.8% | View All 13 Rows |
Sex and Age in Medley
Sex and Age in Medley
The most populous age groups in Medley are 60 to 64 Years (111 | 21.4%) for men and 85 Years and over (67 | 13.4%) for women.
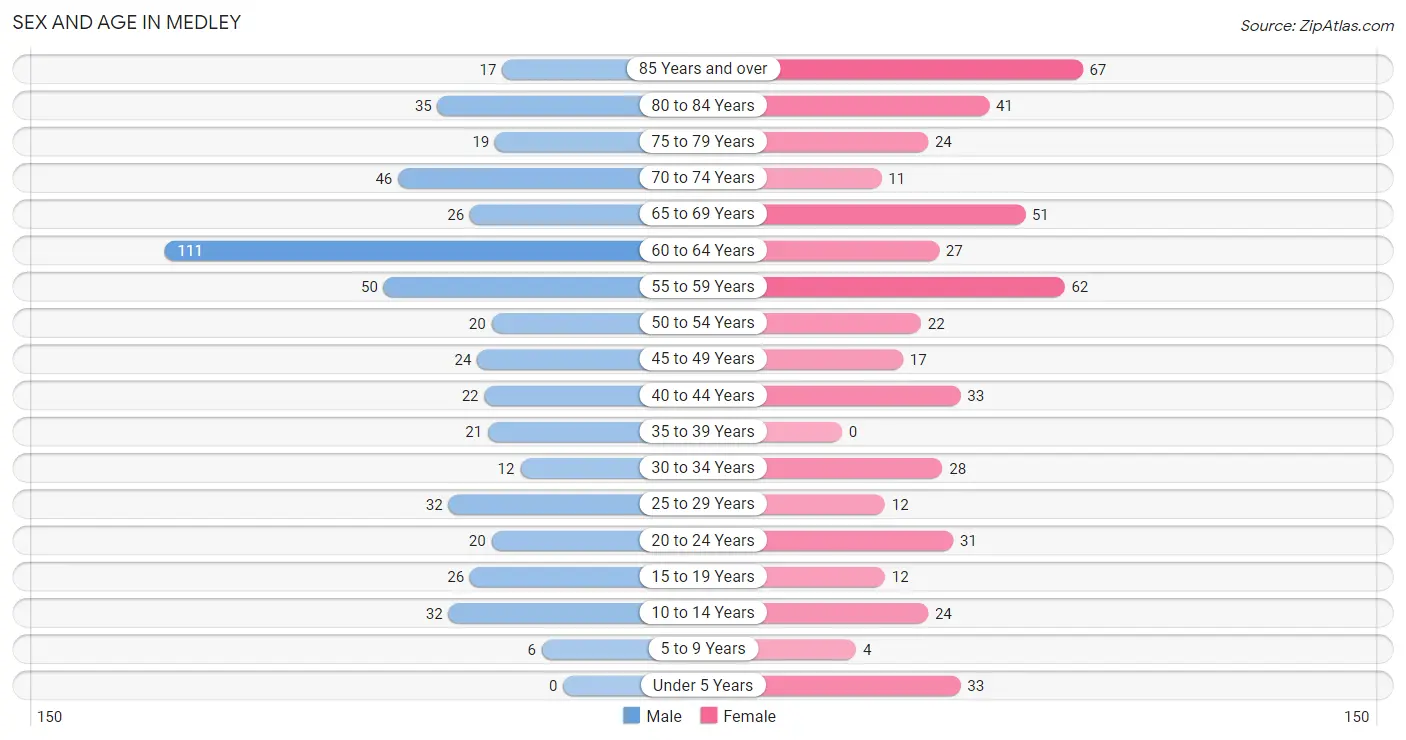
| Age Bracket | Male | Female |
| Under 5 Years | 0 (0.0%) | 33 (6.6%) |
| 5 to 9 Years | 6 (1.2%) | 4 (0.8%) |
| 10 to 14 Years | 32 (6.2%) | 24 (4.8%) |
| 15 to 19 Years | 26 (5.0%) | 12 (2.4%) |
| 20 to 24 Years | 20 (3.8%) | 31 (6.2%) |
| 25 to 29 Years | 32 (6.2%) | 12 (2.4%) |
| 30 to 34 Years | 12 (2.3%) | 28 (5.6%) |
| 35 to 39 Years | 21 (4.1%) | 0 (0.0%) |
| 40 to 44 Years | 22 (4.2%) | 33 (6.6%) |
| 45 to 49 Years | 24 (4.6%) | 17 (3.4%) |
| 50 to 54 Years | 20 (3.8%) | 22 (4.4%) |
| 55 to 59 Years | 50 (9.6%) | 62 (12.4%) |
| 60 to 64 Years | 111 (21.4%) | 27 (5.4%) |
| 65 to 69 Years | 26 (5.0%) | 51 (10.2%) |
| 70 to 74 Years | 46 (8.9%) | 11 (2.2%) |
| 75 to 79 Years | 19 (3.7%) | 24 (4.8%) |
| 80 to 84 Years | 35 (6.7%) | 41 (8.2%) |
| 85 Years and over | 17 (3.3%) | 67 (13.4%) |
| Total | 519 (100.0%) | 499 (100.0%) |
Families and Households in Medley
Median Family Size in Medley
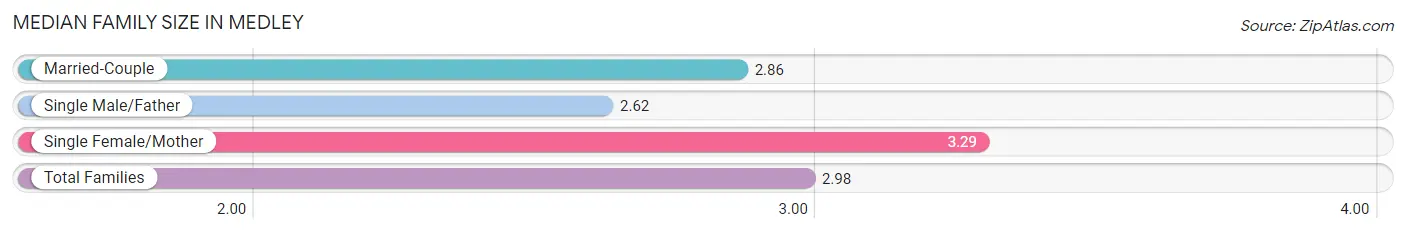
The median family size in Medley is 2.98 persons per family, with single female/mother families (76 | 29.8%) accounting for the largest median family size of 3.29 persons per family. On the other hand, single male/father families (13 | 5.1%) represent the smallest median family size with 2.62 persons per family.
| Family Type | # Families | Family Size |
| Married-Couple | 166 (65.1%) | 2.86 |
| Single Male/Father | 13 (5.1%) | 2.62 |
| Single Female/Mother | 76 (29.8%) | 3.29 |
| Total Families | 255 (100.0%) | 2.98 |
Median Household Size in Medley
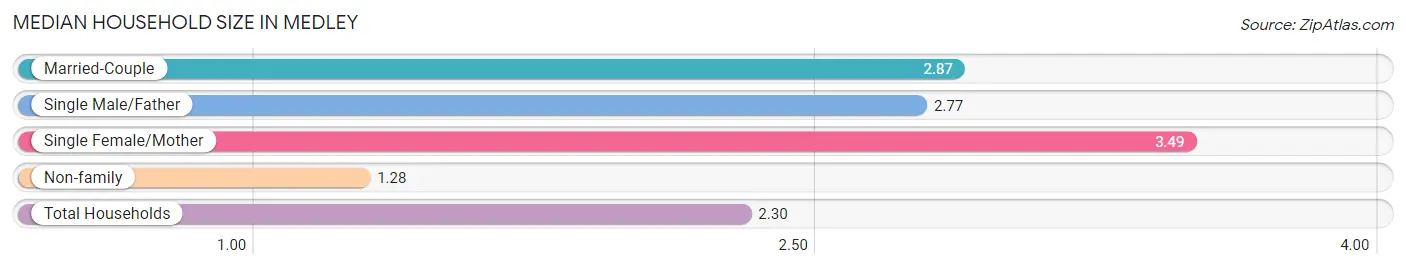
The median household size in Medley is 2.30 persons per household, with single female/mother households (76 | 17.2%) accounting for the largest median household size of 3.49 persons per household. non-family households (188 | 42.4%) represent the smallest median household size with 1.28 persons per household.
| Household Type | # Households | Household Size |
| Married-Couple | 166 (37.5%) | 2.87 |
| Single Male/Father | 13 (2.9%) | 2.77 |
| Single Female/Mother | 76 (17.2%) | 3.49 |
| Non-family | 188 (42.4%) | 1.28 |
| Total Households | 443 (100.0%) | 2.30 |
Household Size by Marriage Status in Medley
Out of a total of 443 households in Medley, 255 (57.6%) are family households, while 188 (42.4%) are nonfamily households. The most numerous type of family households are 2-person households, comprising 113, and the most common type of nonfamily households are 1-person households, comprising 130.
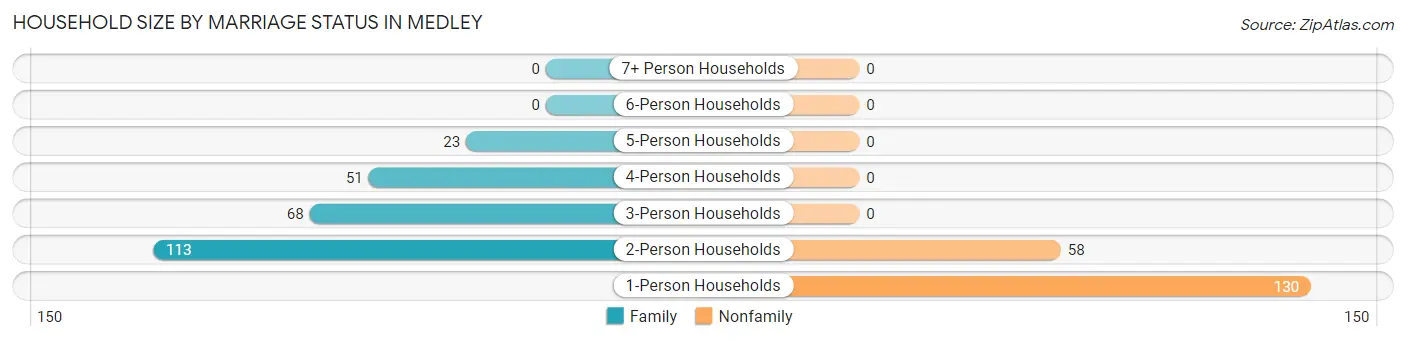
| Household Size | Family Households | Nonfamily Households |
| 1-Person Households | - | 130 (29.3%) |
| 2-Person Households | 113 (25.5%) | 58 (13.1%) |
| 3-Person Households | 68 (15.3%) | 0 (0.0%) |
| 4-Person Households | 51 (11.5%) | 0 (0.0%) |
| 5-Person Households | 23 (5.2%) | 0 (0.0%) |
| 6-Person Households | 0 (0.0%) | 0 (0.0%) |
| 7+ Person Households | 0 (0.0%) | 0 (0.0%) |
| Total | 255 (57.6%) | 188 (42.4%) |
Female Fertility in Medley
Fertility by Age in Medley
Average fertility rate in Medley is 101.0 births per 1,000 women. Women in the age bracket of 35 to 50 years have the highest fertility rate with 250.0 births per 1,000 women. Women in the age bracket of 35 to 50 years acount for 100.0% of all women with births.
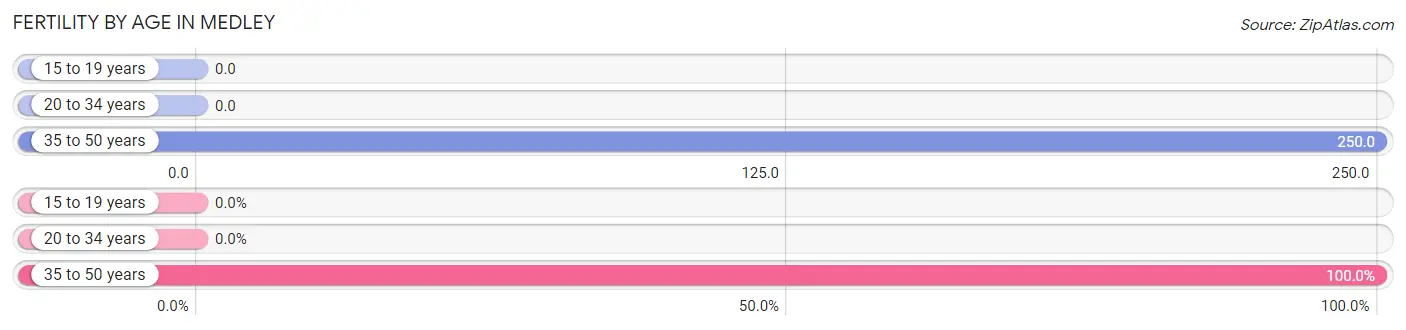
| Age Bracket | Women with Births | Births / 1,000 Women |
| 15 to 19 years | 0 (0.0%) | 0.0 |
| 20 to 34 years | 0 (0.0%) | 0.0 |
| 35 to 50 years | 14 (100.0%) | 250.0 |
| Total | 14 (100.0%) | 101.0 |
Fertility by Age by Marriage Status in Medley
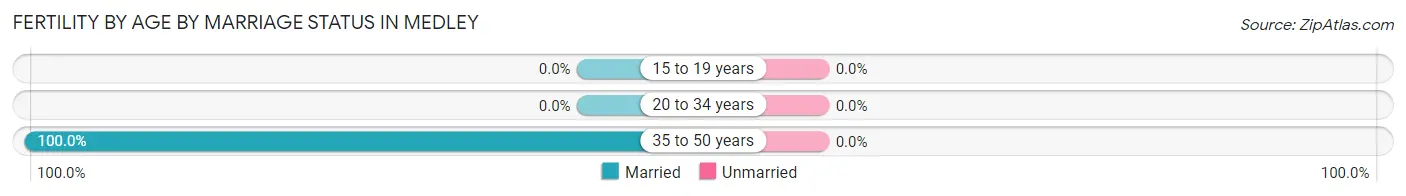
| Age Bracket | Married | Unmarried |
| 15 to 19 years | 0 (0.0%) | 0 (0.0%) |
| 20 to 34 years | 0 (0.0%) | 0 (0.0%) |
| 35 to 50 years | 14 (100.0%) | 0 (0.0%) |
| Total | 14 (100.0%) | 0 (0.0%) |
Fertility by Education in Medley
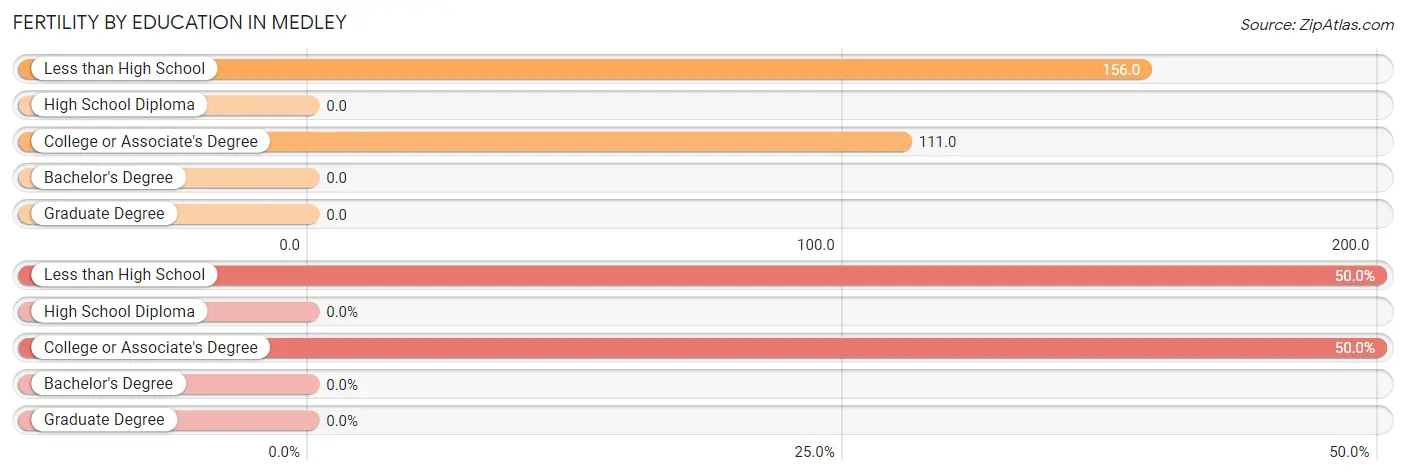
| Educational Attainment | Women with Births | Births / 1,000 Women |
| Less than High School | 7 (50.0%) | 156.0 |
| High School Diploma | 0 (0.0%) | 0.0 |
| College or Associate's Degree | 7 (50.0%) | 111.0 |
| Bachelor's Degree | 0 (0.0%) | 0.0 |
| Graduate Degree | 0 (0.0%) | 0.0 |
| Total | 14 (100.0%) | 101.0 |
Fertility by Education by Marriage Status in Medley
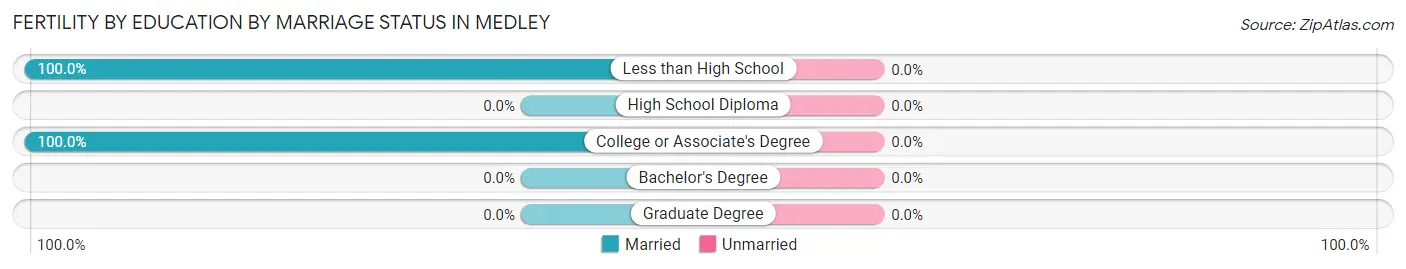
| Educational Attainment | Married | Unmarried |
| Less than High School | 7 (100.0%) | 0 (0.0%) |
| High School Diploma | 0 (0.0%) | 0 (0.0%) |
| College or Associate's Degree | 7 (100.0%) | 0 (0.0%) |
| Bachelor's Degree | 0 (0.0%) | 0 (0.0%) |
| Graduate Degree | 0 (0.0%) | 0 (0.0%) |
| Total | 14 (100.0%) | 0 (0.0%) |
Employment Characteristics in Medley
Employment by Class of Employer in Medley
Among the 499 employed individuals in Medley, private company employees (369 | 74.0%), self-employed (not incorporated) (77 | 15.4%), and local government employees (42 | 8.4%) make up the most common classes of employment.
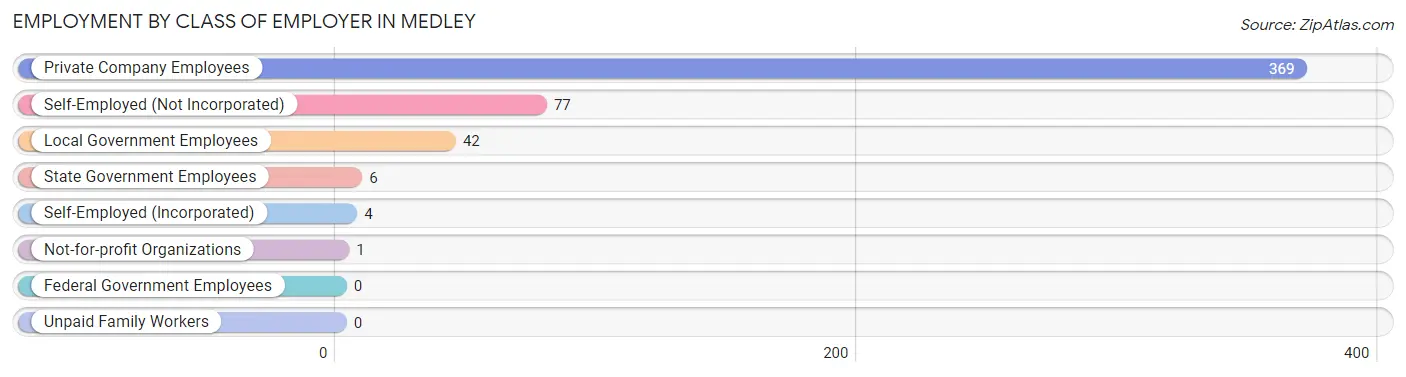
| Employer Class | # Employees | % Employees |
| Private Company Employees | 369 | 74.0% |
| Self-Employed (Incorporated) | 4 | 0.8% |
| Self-Employed (Not Incorporated) | 77 | 15.4% |
| Not-for-profit Organizations | 1 | 0.2% |
| Local Government Employees | 42 | 8.4% |
| State Government Employees | 6 | 1.2% |
| Federal Government Employees | 0 | 0.0% |
| Unpaid Family Workers | 0 | 0.0% |
| Total | 499 | 100.0% |
Employment Status by Age in Medley
According to the labor force statistics for Medley, out of the total population over 16 years of age (913), 55.8% or 509 individuals are in the labor force, with 2.0% or 10 of them unemployed. The age group with the highest labor force participation rate is 25 to 29 years, with 93.2% or 41 individuals in the labor force. Within the labor force, the 20 to 24 years age range has the highest percentage of unemployed individuals, with 10.0% or 3 of them being unemployed.
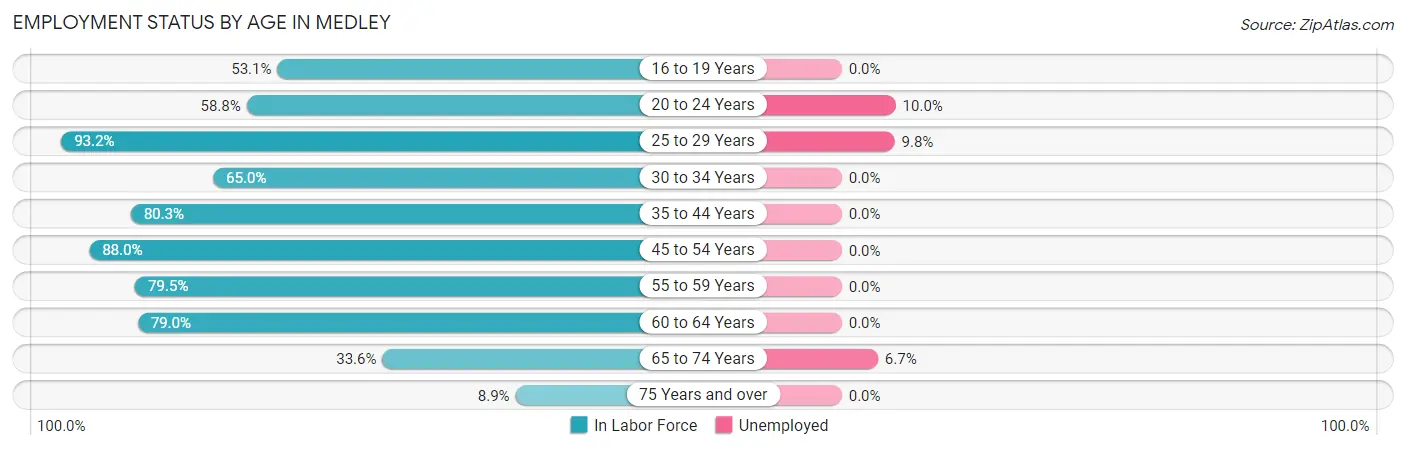
| Age Bracket | In Labor Force | Unemployed |
| 16 to 19 Years | 17 (53.1%) | 0 (0.0%) |
| 20 to 24 Years | 30 (58.8%) | 3 (10.0%) |
| 25 to 29 Years | 41 (93.2%) | 4 (9.8%) |
| 30 to 34 Years | 26 (65.0%) | 0 (0.0%) |
| 35 to 44 Years | 61 (80.3%) | 0 (0.0%) |
| 45 to 54 Years | 73 (88.0%) | 0 (0.0%) |
| 55 to 59 Years | 89 (79.5%) | 0 (0.0%) |
| 60 to 64 Years | 109 (79.0%) | 0 (0.0%) |
| 65 to 74 Years | 45 (33.6%) | 3 (6.7%) |
| 75 Years and over | 18 (8.9%) | 0 (0.0%) |
| Total | 509 (55.8%) | 10 (2.0%) |
Employment Status by Educational Attainment in Medley
According to labor force statistics for Medley, 80.9% of individuals (399) out of the total population between 25 and 64 years of age (493) are in the labor force, with 1.0% or 4 of them being unemployed. The group with the highest labor force participation rate are those with the educational attainment of college / associate degree, with 87.3% or 145 individuals in the labor force. Within the labor force, individuals with less than high school education have the highest percentage of unemployment, with 2.9% or 4 of them being unemployed.
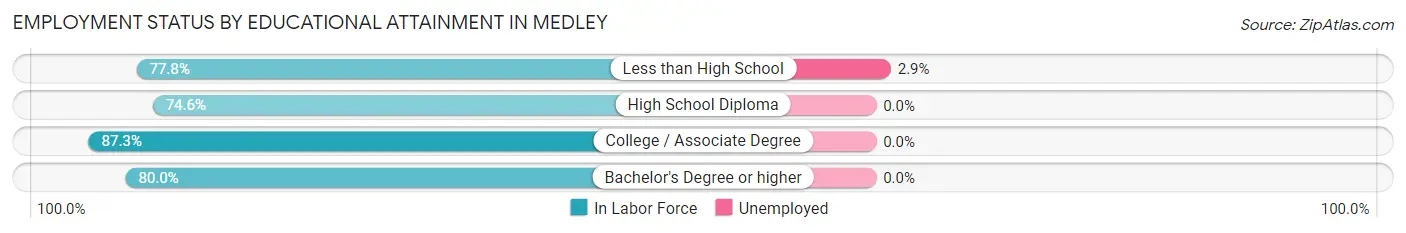
| Educational Attainment | In Labor Force | Unemployed |
| Less than High School | 137 (77.8%) | 5 (2.9%) |
| High School Diploma | 53 (74.6%) | 0 (0.0%) |
| College / Associate Degree | 145 (87.3%) | 0 (0.0%) |
| Bachelor's Degree or higher | 64 (80.0%) | 0 (0.0%) |
| Total | 399 (80.9%) | 5 (1.0%) |
Employment Occupations by Sex in Medley
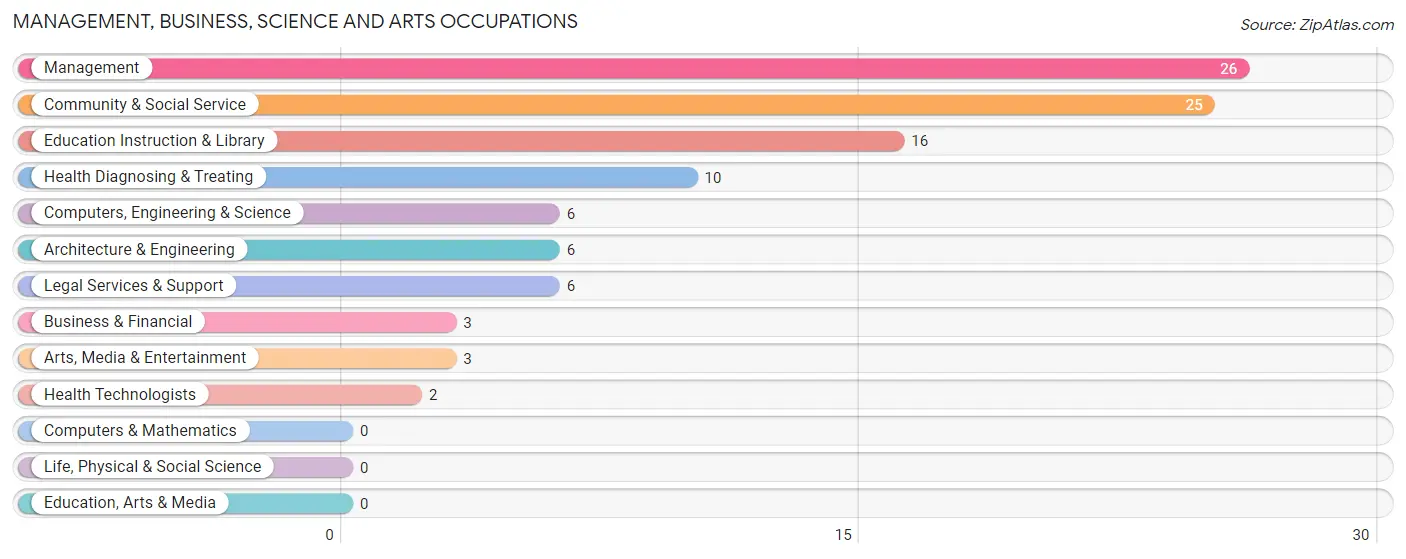
Management, Business, Science and Arts Occupations
The most common Management, Business, Science and Arts occupations in Medley are Management (26 | 5.2%), Community & Social Service (25 | 5.0%), Education Instruction & Library (16 | 3.2%), Health Diagnosing & Treating (10 | 2.0%), and Computers, Engineering & Science (6 | 1.2%).
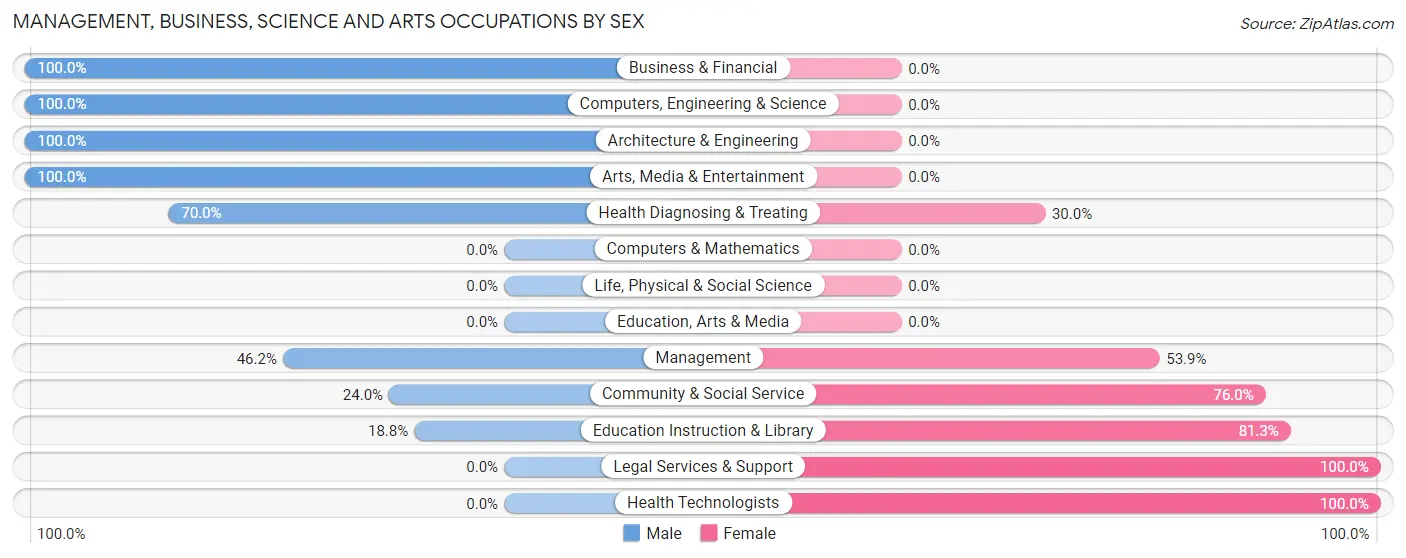
Management, Business, Science and Arts Occupations by Sex
Within the Management, Business, Science and Arts occupations in Medley, the most male-oriented occupations are Business & Financial (100.0%), Computers, Engineering & Science (100.0%), and Architecture & Engineering (100.0%), while the most female-oriented occupations are Legal Services & Support (100.0%), Health Technologists (100.0%), and Education Instruction & Library (81.2%).
| Occupation | Male | Female |
| Management | 12 (46.2%) | 14 (53.8%) |
| Business & Financial | 3 (100.0%) | 0 (0.0%) |
| Computers, Engineering & Science | 6 (100.0%) | 0 (0.0%) |
| Computers & Mathematics | 0 (0.0%) | 0 (0.0%) |
| Architecture & Engineering | 6 (100.0%) | 0 (0.0%) |
| Life, Physical & Social Science | 0 (0.0%) | 0 (0.0%) |
| Community & Social Service | 6 (24.0%) | 19 (76.0%) |
| Education, Arts & Media | 0 (0.0%) | 0 (0.0%) |
| Legal Services & Support | 0 (0.0%) | 6 (100.0%) |
| Education Instruction & Library | 3 (18.8%) | 13 (81.2%) |
| Arts, Media & Entertainment | 3 (100.0%) | 0 (0.0%) |
| Health Diagnosing & Treating | 7 (70.0%) | 3 (30.0%) |
| Health Technologists | 0 (0.0%) | 2 (100.0%) |
| Total (Category) | 34 (48.6%) | 36 (51.4%) |
| Total (Overall) | 313 (62.7%) | 186 (37.3%) |
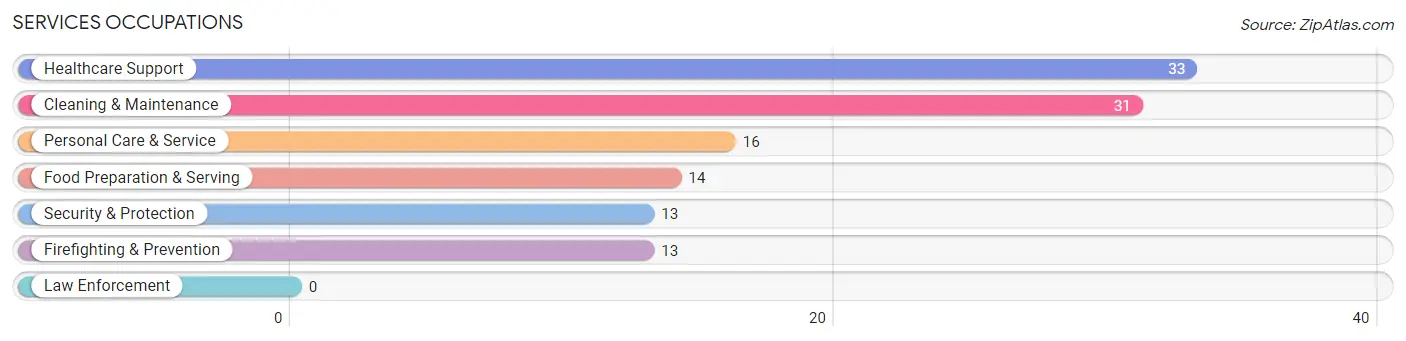
Services Occupations
The most common Services occupations in Medley are Healthcare Support (33 | 6.6%), Cleaning & Maintenance (31 | 6.2%), Personal Care & Service (16 | 3.2%), Food Preparation & Serving (14 | 2.8%), and Security & Protection (13 | 2.6%).
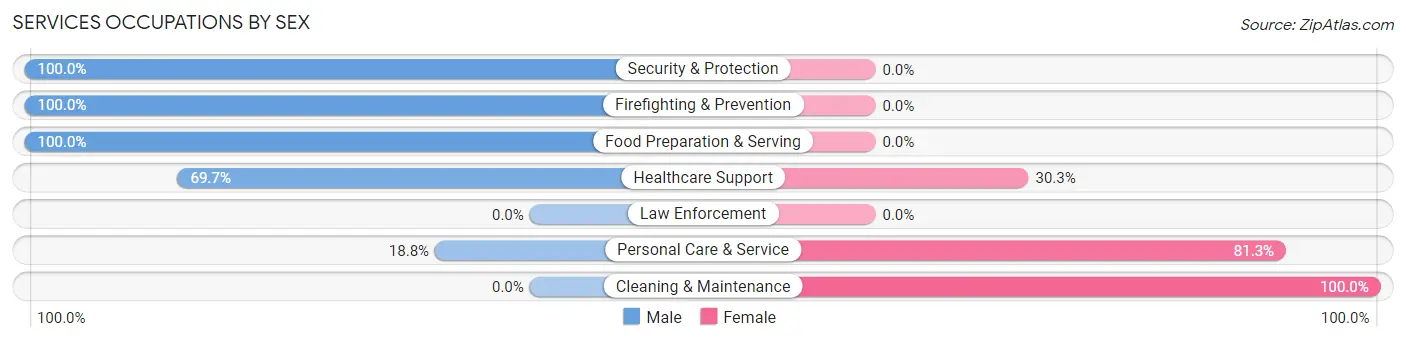
Services Occupations by Sex
Within the Services occupations in Medley, the most male-oriented occupations are Security & Protection (100.0%), Firefighting & Prevention (100.0%), and Food Preparation & Serving (100.0%), while the most female-oriented occupations are Cleaning & Maintenance (100.0%), Personal Care & Service (81.2%), and Healthcare Support (30.3%).
| Occupation | Male | Female |
| Healthcare Support | 23 (69.7%) | 10 (30.3%) |
| Security & Protection | 13 (100.0%) | 0 (0.0%) |
| Firefighting & Prevention | 13 (100.0%) | 0 (0.0%) |
| Law Enforcement | 0 (0.0%) | 0 (0.0%) |
| Food Preparation & Serving | 14 (100.0%) | 0 (0.0%) |
| Cleaning & Maintenance | 0 (0.0%) | 31 (100.0%) |
| Personal Care & Service | 3 (18.8%) | 13 (81.2%) |
| Total (Category) | 53 (49.5%) | 54 (50.5%) |
| Total (Overall) | 313 (62.7%) | 186 (37.3%) |
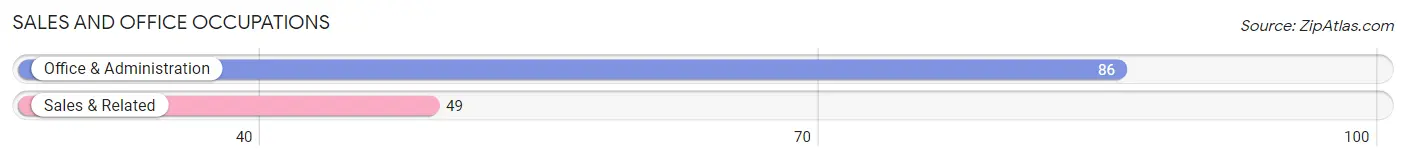
Sales and Office Occupations
The most common Sales and Office occupations in Medley are Office & Administration (86 | 17.2%), and Sales & Related (49 | 9.8%).
Sales and Office Occupations by Sex
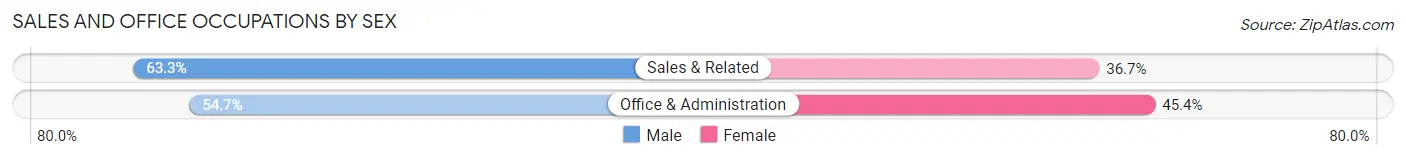
| Occupation | Male | Female |
| Sales & Related | 31 (63.3%) | 18 (36.7%) |
| Office & Administration | 47 (54.6%) | 39 (45.4%) |
| Total (Category) | 78 (57.8%) | 57 (42.2%) |
| Total (Overall) | 313 (62.7%) | 186 (37.3%) |
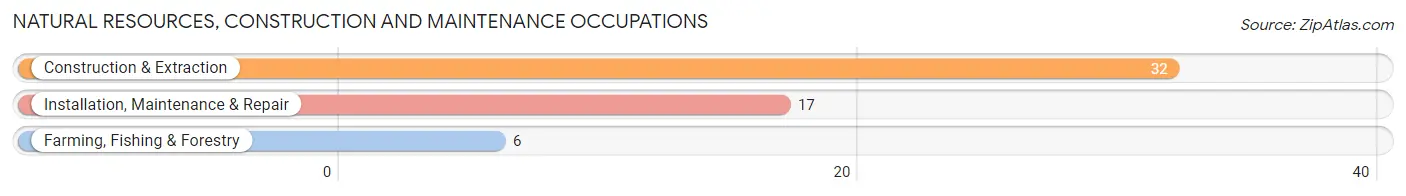
Natural Resources, Construction and Maintenance Occupations
The most common Natural Resources, Construction and Maintenance occupations in Medley are Construction & Extraction (32 | 6.4%), Installation, Maintenance & Repair (17 | 3.4%), and Farming, Fishing & Forestry (6 | 1.2%).
Natural Resources, Construction and Maintenance Occupations by Sex
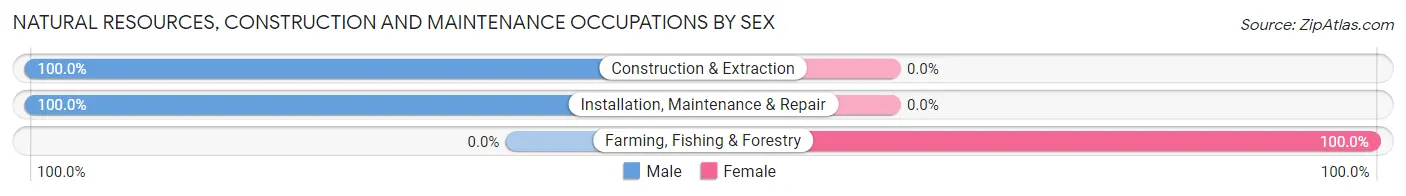
| Occupation | Male | Female |
| Farming, Fishing & Forestry | 0 (0.0%) | 6 (100.0%) |
| Construction & Extraction | 32 (100.0%) | 0 (0.0%) |
| Installation, Maintenance & Repair | 17 (100.0%) | 0 (0.0%) |
| Total (Category) | 49 (89.1%) | 6 (10.9%) |
| Total (Overall) | 313 (62.7%) | 186 (37.3%) |
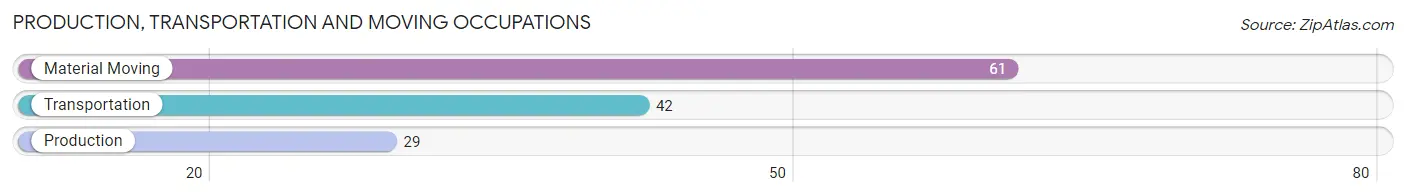
Production, Transportation and Moving Occupations
The most common Production, Transportation and Moving occupations in Medley are Material Moving (61 | 12.2%), Transportation (42 | 8.4%), and Production (29 | 5.8%).
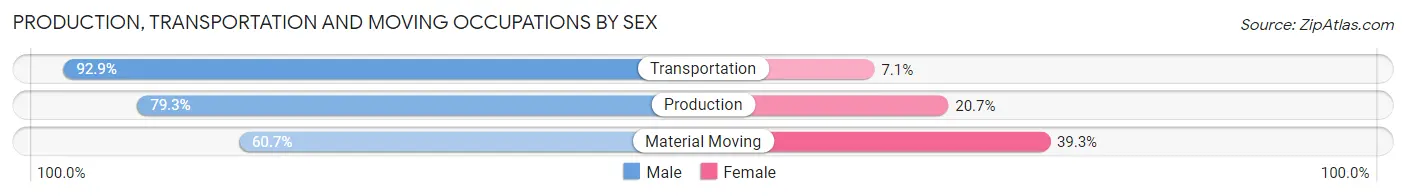
Production, Transportation and Moving Occupations by Sex
| Occupation | Male | Female |
| Production | 23 (79.3%) | 6 (20.7%) |
| Transportation | 39 (92.9%) | 3 (7.1%) |
| Material Moving | 37 (60.7%) | 24 (39.3%) |
| Total (Category) | 99 (75.0%) | 33 (25.0%) |
| Total (Overall) | 313 (62.7%) | 186 (37.3%) |
Employment Industries by Sex in Medley
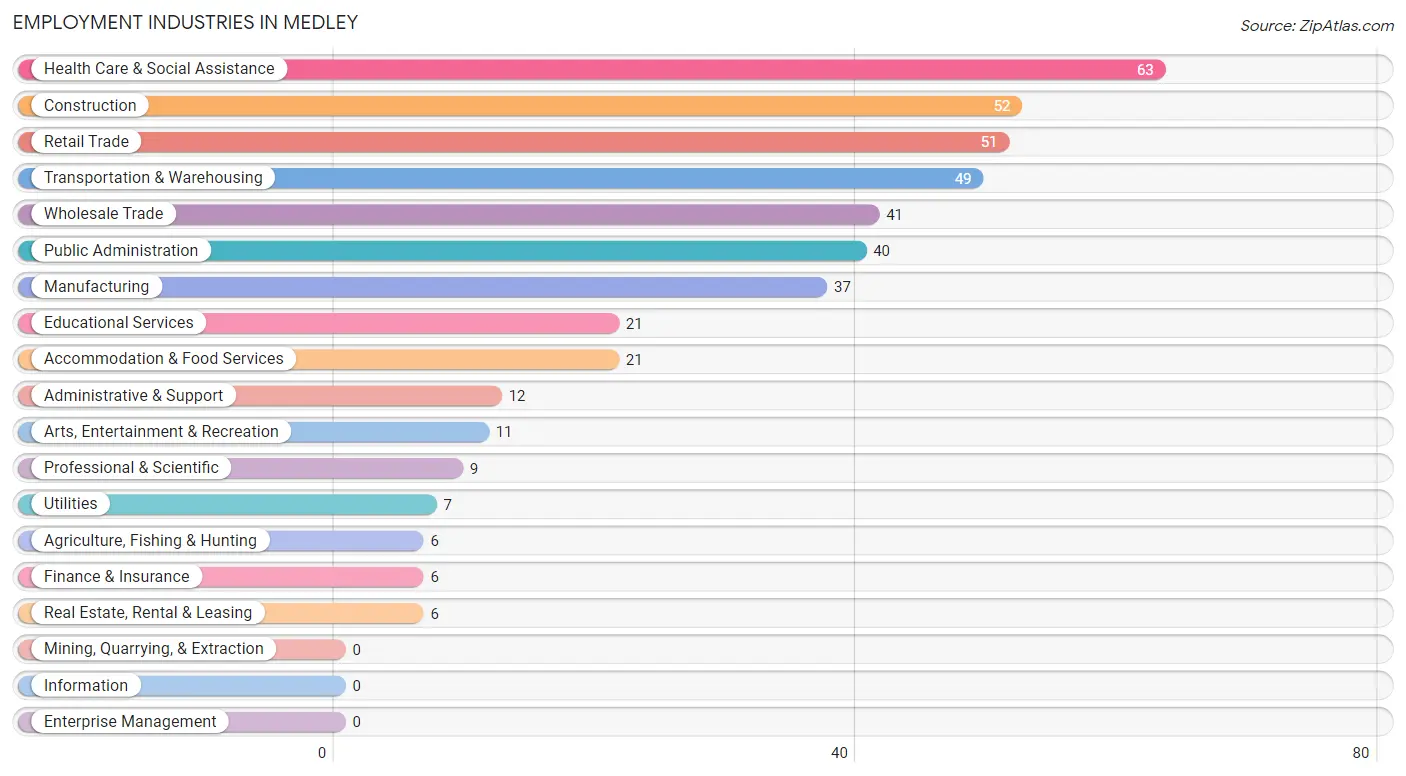
Employment Industries in Medley
The major employment industries in Medley include Health Care & Social Assistance (63 | 12.6%), Construction (52 | 10.4%), Retail Trade (51 | 10.2%), Transportation & Warehousing (49 | 9.8%), and Wholesale Trade (41 | 8.2%).
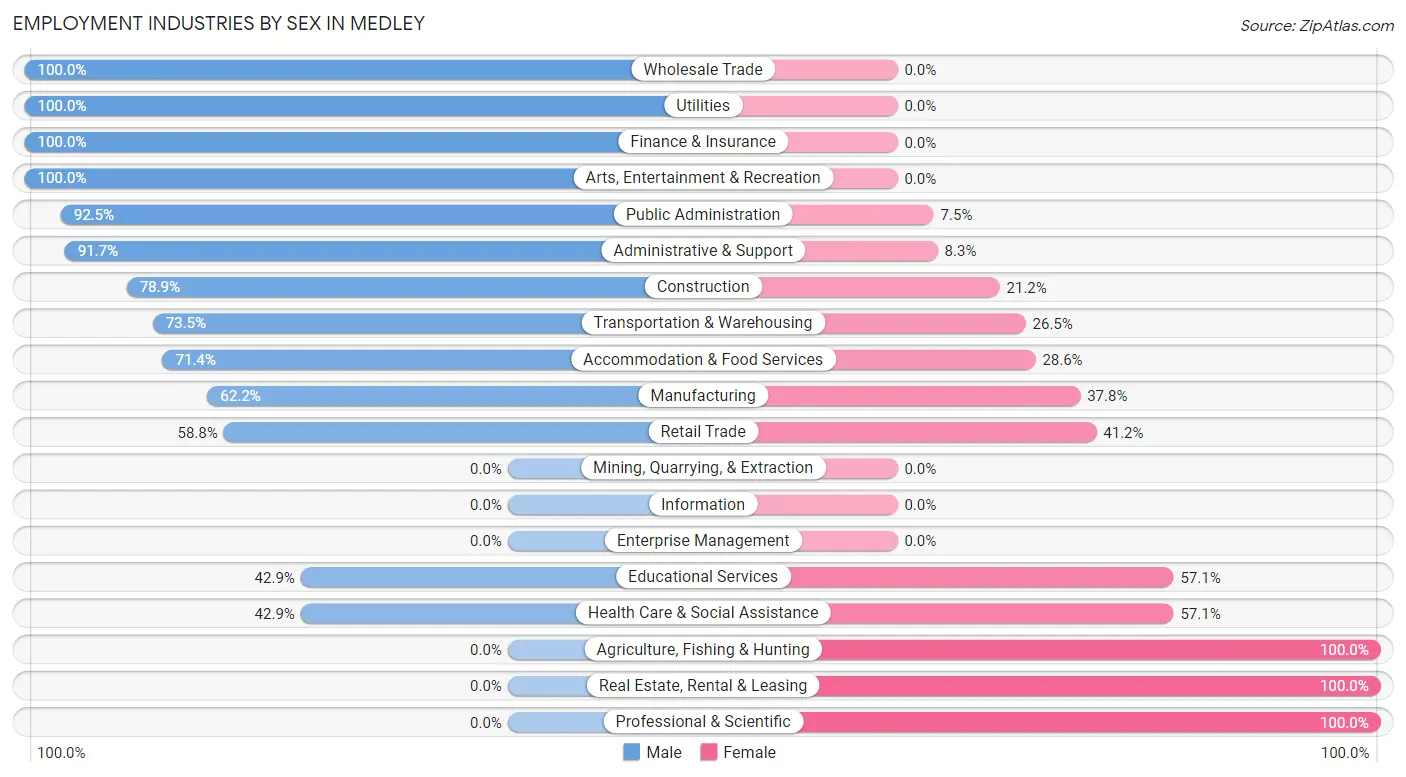
Employment Industries by Sex in Medley
The Medley industries that see more men than women are Wholesale Trade (100.0%), Utilities (100.0%), and Finance & Insurance (100.0%), whereas the industries that tend to have a higher number of women are Agriculture, Fishing & Hunting (100.0%), Real Estate, Rental & Leasing (100.0%), and Professional & Scientific (100.0%).
| Industry | Male | Female |
| Agriculture, Fishing & Hunting | 0 (0.0%) | 6 (100.0%) |
| Mining, Quarrying, & Extraction | 0 (0.0%) | 0 (0.0%) |
| Construction | 41 (78.8%) | 11 (21.1%) |
| Manufacturing | 23 (62.2%) | 14 (37.8%) |
| Wholesale Trade | 41 (100.0%) | 0 (0.0%) |
| Retail Trade | 30 (58.8%) | 21 (41.2%) |
| Transportation & Warehousing | 36 (73.5%) | 13 (26.5%) |
| Utilities | 7 (100.0%) | 0 (0.0%) |
| Information | 0 (0.0%) | 0 (0.0%) |
| Finance & Insurance | 6 (100.0%) | 0 (0.0%) |
| Real Estate, Rental & Leasing | 0 (0.0%) | 6 (100.0%) |
| Professional & Scientific | 0 (0.0%) | 9 (100.0%) |
| Enterprise Management | 0 (0.0%) | 0 (0.0%) |
| Administrative & Support | 11 (91.7%) | 1 (8.3%) |
| Educational Services | 9 (42.9%) | 12 (57.1%) |
| Health Care & Social Assistance | 27 (42.9%) | 36 (57.1%) |
| Arts, Entertainment & Recreation | 11 (100.0%) | 0 (0.0%) |
| Accommodation & Food Services | 15 (71.4%) | 6 (28.6%) |
| Public Administration | 37 (92.5%) | 3 (7.5%) |
| Total | 313 (62.7%) | 186 (37.3%) |
Education in Medley
School Enrollment in Medley
The most common levels of schooling among the 148 students in Medley are middle school (46 | 31.1%), college / undergraduate (46 | 31.1%), and high school (34 | 23.0%).
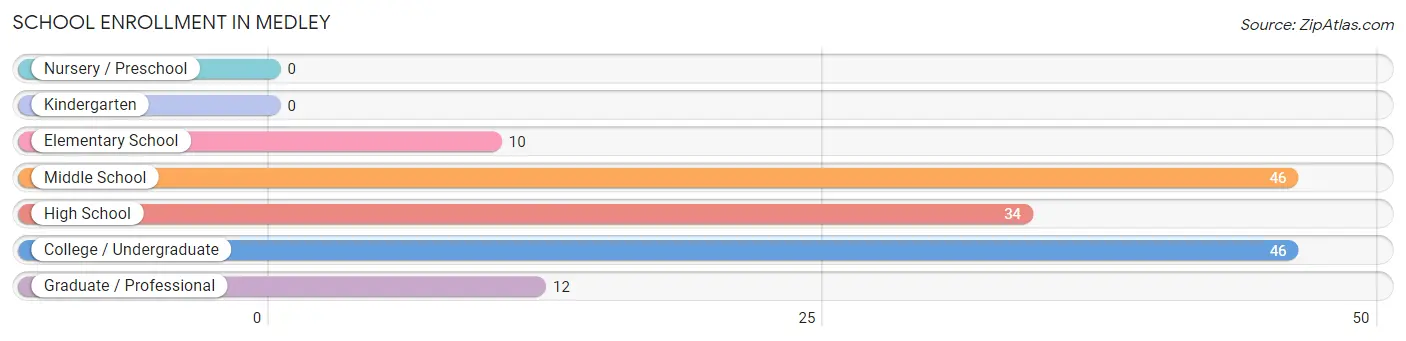
| School Level | # Students | % Students |
| Nursery / Preschool | 0 | 0.0% |
| Kindergarten | 0 | 0.0% |
| Elementary School | 10 | 6.8% |
| Middle School | 46 | 31.1% |
| High School | 34 | 23.0% |
| College / Undergraduate | 46 | 31.1% |
| Graduate / Professional | 12 | 8.1% |
| Total | 148 | 100.0% |
School Enrollment by Age by Funding Source in Medley
Out of a total of 148 students who are enrolled in schools in Medley, 23 (15.5%) attend a private institution, while the remaining 125 (84.5%) are enrolled in public schools. The age group of 25 to 34 year olds has the highest likelihood of being enrolled in private schools, with 7 (100.0% in the age bracket) enrolled. Conversely, the age group of 5 to 9 year old has the lowest likelihood of being enrolled in a private school, with 10 (100.0% in the age bracket) attending a public institution.
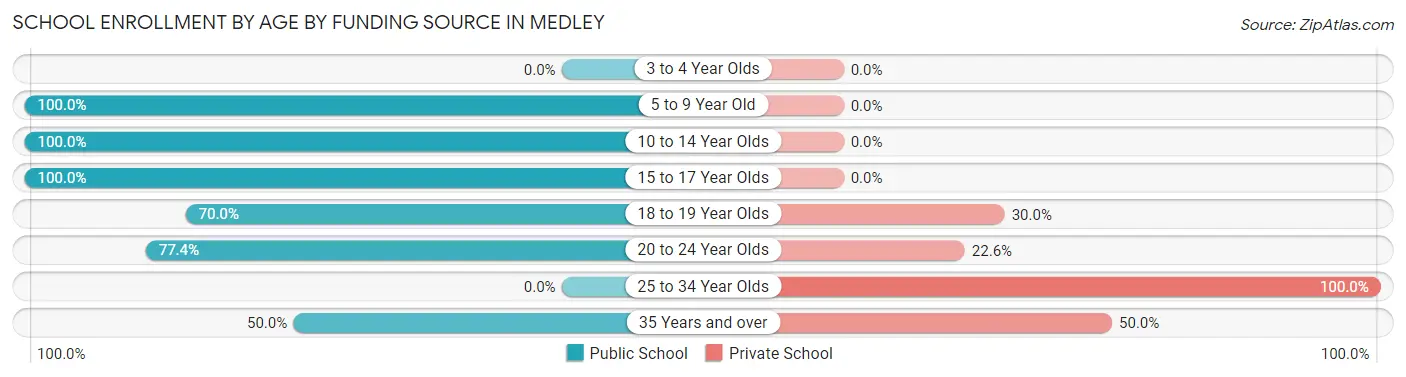
| Age Bracket | Public School | Private School |
| 3 to 4 Year Olds | 0 (0.0%) | 0 (0.0%) |
| 5 to 9 Year Old | 10 (100.0%) | 0 (0.0%) |
| 10 to 14 Year Olds | 56 (100.0%) | 0 (0.0%) |
| 15 to 17 Year Olds | 18 (100.0%) | 0 (0.0%) |
| 18 to 19 Year Olds | 14 (70.0%) | 6 (30.0%) |
| 20 to 24 Year Olds | 24 (77.4%) | 7 (22.6%) |
| 25 to 34 Year Olds | 0 (0.0%) | 7 (100.0%) |
| 35 Years and over | 3 (50.0%) | 3 (50.0%) |
| Total | 125 (84.5%) | 23 (15.5%) |
Educational Attainment by Field of Study in Medley
Business (30 | 29.1%), engineering (29 | 28.2%), education (16 | 15.5%), communications (10 | 9.7%), and science & technology (9 | 8.7%) are the most common fields of study among 103 individuals in Medley who have obtained a bachelor's degree or higher.
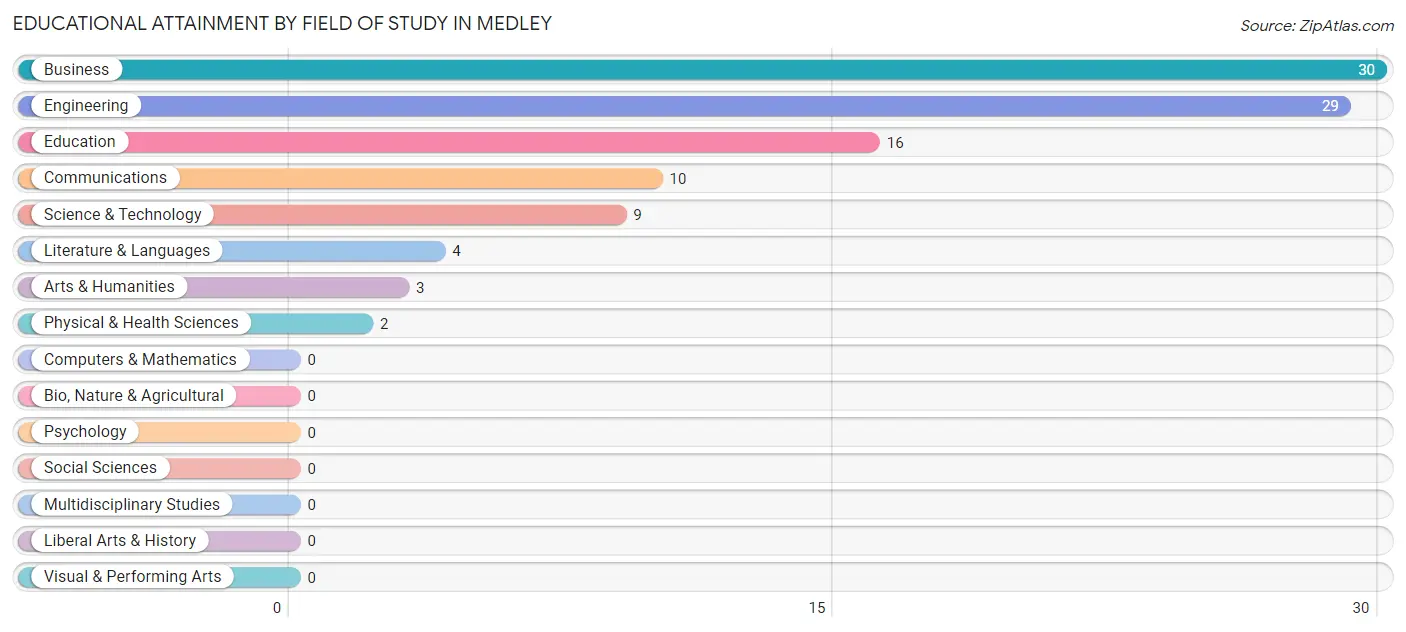
| Field of Study | # Graduates | % Graduates |
| Computers & Mathematics | 0 | 0.0% |
| Bio, Nature & Agricultural | 0 | 0.0% |
| Physical & Health Sciences | 2 | 1.9% |
| Psychology | 0 | 0.0% |
| Social Sciences | 0 | 0.0% |
| Engineering | 29 | 28.2% |
| Multidisciplinary Studies | 0 | 0.0% |
| Science & Technology | 9 | 8.7% |
| Business | 30 | 29.1% |
| Education | 16 | 15.5% |
| Literature & Languages | 4 | 3.9% |
| Liberal Arts & History | 0 | 0.0% |
| Visual & Performing Arts | 0 | 0.0% |
| Communications | 10 | 9.7% |
| Arts & Humanities | 3 | 2.9% |
| Total | 103 | 100.0% |
Transportation & Commute in Medley
Vehicle Availability by Sex in Medley
The most prevalent vehicle ownership categories in Medley are males with 2 vehicles (163, accounting for 52.1%) and females with 2 vehicles (114, making up 87.6%).
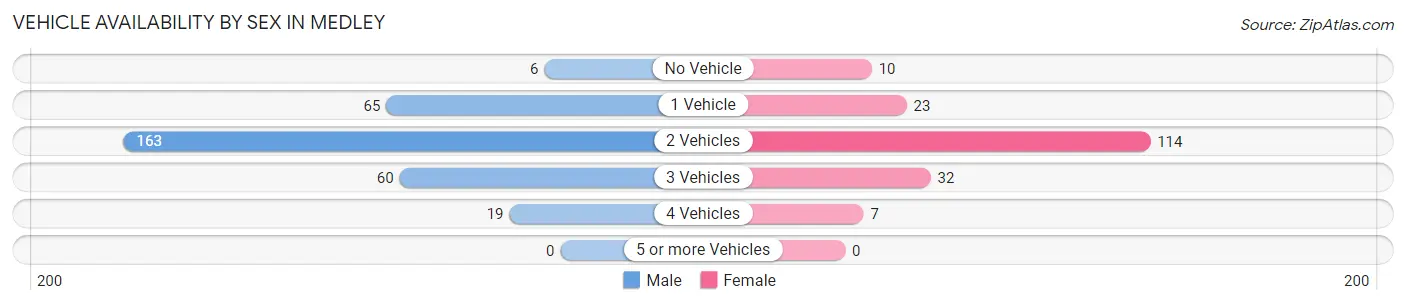
| Vehicles Available | Male | Female |
| No Vehicle | 6 (1.9%) | 10 (5.4%) |
| 1 Vehicle | 65 (20.8%) | 23 (12.4%) |
| 2 Vehicles | 163 (52.1%) | 114 (61.3%) |
| 3 Vehicles | 60 (19.2%) | 32 (17.2%) |
| 4 Vehicles | 19 (6.1%) | 7 (3.8%) |
| 5 or more Vehicles | 0 (0.0%) | 0 (0.0%) |
| Total | 313 (100.0%) | 186 (100.0%) |
Commute Time in Medley
The most frequently occuring commute durations in Medley are 15 to 19 minutes (107 commuters, 23.0%), 20 to 24 minutes (77 commuters, 16.6%), and 30 to 34 minutes (76 commuters, 16.3%).
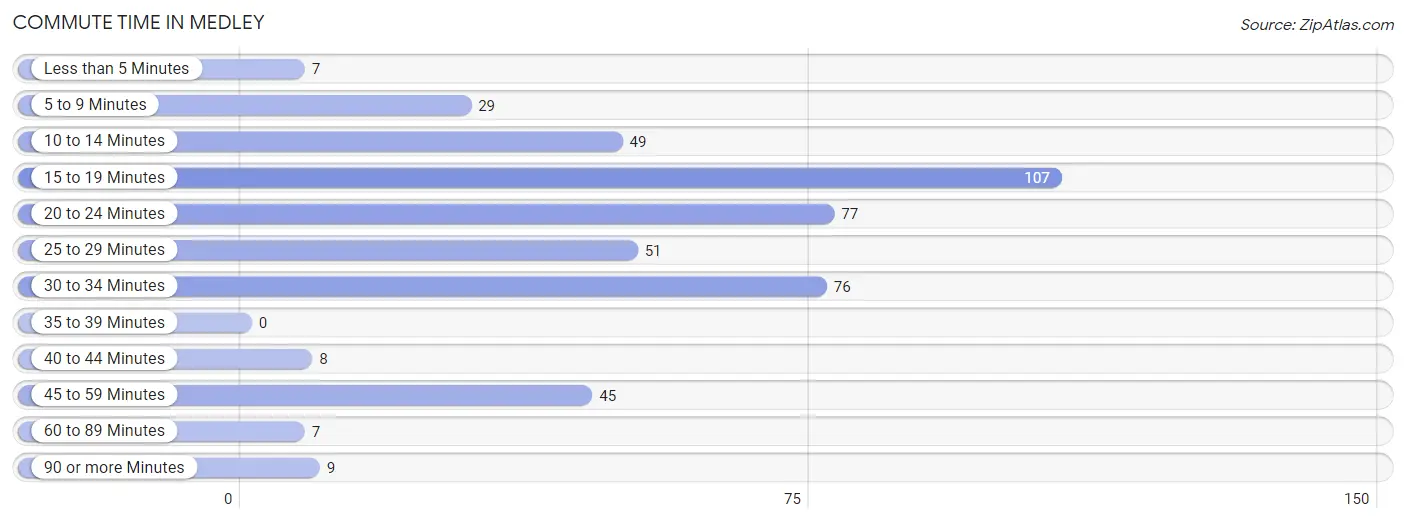
| Commute Time | # Commuters | % Commuters |
| Less than 5 Minutes | 7 | 1.5% |
| 5 to 9 Minutes | 29 | 6.2% |
| 10 to 14 Minutes | 49 | 10.5% |
| 15 to 19 Minutes | 107 | 23.0% |
| 20 to 24 Minutes | 77 | 16.6% |
| 25 to 29 Minutes | 51 | 11.0% |
| 30 to 34 Minutes | 76 | 16.3% |
| 35 to 39 Minutes | 0 | 0.0% |
| 40 to 44 Minutes | 8 | 1.7% |
| 45 to 59 Minutes | 45 | 9.7% |
| 60 to 89 Minutes | 7 | 1.5% |
| 90 or more Minutes | 9 | 1.9% |
Commute Time by Sex in Medley
The most common commute times in Medley are 30 to 34 minutes (52 commuters, 18.1%) for males and 15 to 19 minutes (73 commuters, 41.0%) for females.
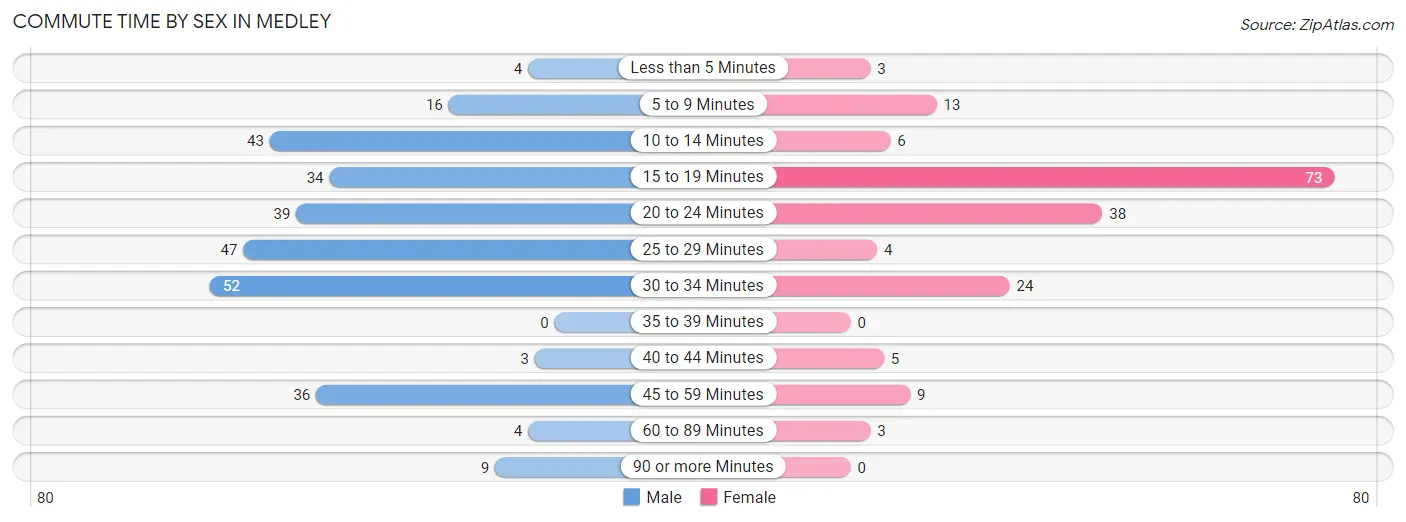
| Commute Time | Male | Female |
| Less than 5 Minutes | 4 (1.4%) | 3 (1.7%) |
| 5 to 9 Minutes | 16 (5.6%) | 13 (7.3%) |
| 10 to 14 Minutes | 43 (15.0%) | 6 (3.4%) |
| 15 to 19 Minutes | 34 (11.8%) | 73 (41.0%) |
| 20 to 24 Minutes | 39 (13.6%) | 38 (21.3%) |
| 25 to 29 Minutes | 47 (16.4%) | 4 (2.2%) |
| 30 to 34 Minutes | 52 (18.1%) | 24 (13.5%) |
| 35 to 39 Minutes | 0 (0.0%) | 0 (0.0%) |
| 40 to 44 Minutes | 3 (1.1%) | 5 (2.8%) |
| 45 to 59 Minutes | 36 (12.5%) | 9 (5.1%) |
| 60 to 89 Minutes | 4 (1.4%) | 3 (1.7%) |
| 90 or more Minutes | 9 (3.1%) | 0 (0.0%) |
Time of Departure to Work by Sex in Medley
The most frequent times of departure to work in Medley are 6:30 AM to 6:59 AM (58, 20.2%) for males and 8:00 AM to 8:29 AM (27, 15.2%) for females.
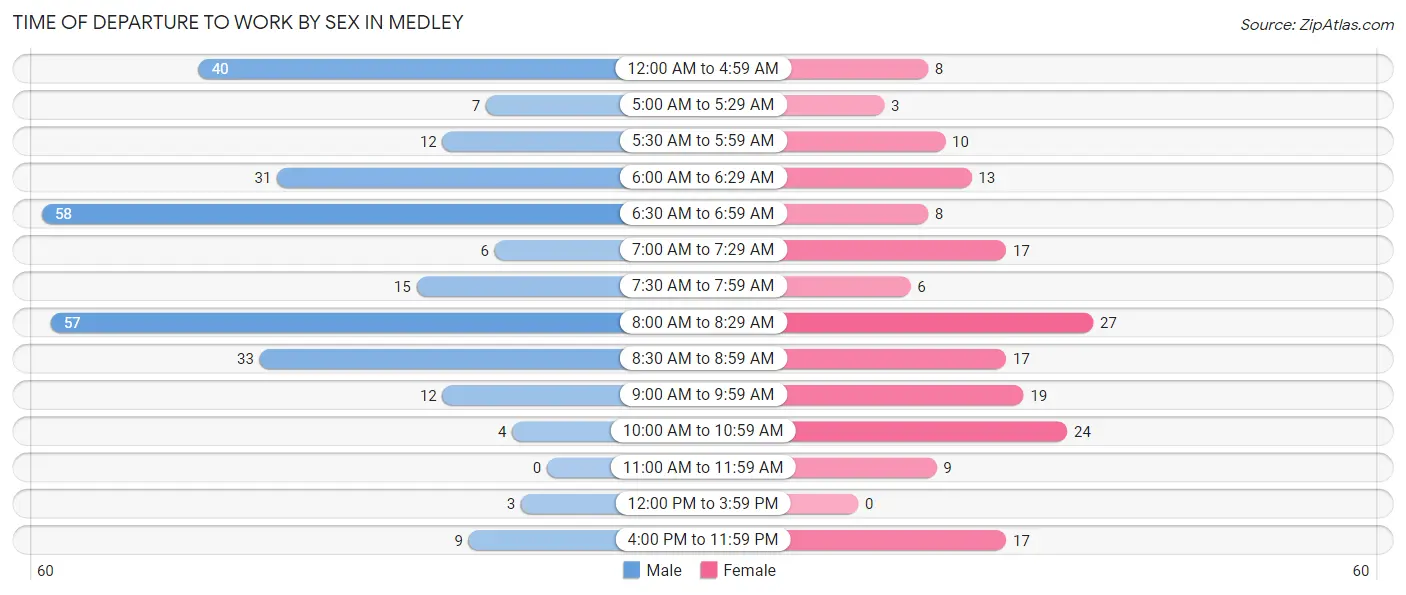
| Time of Departure | Male | Female |
| 12:00 AM to 4:59 AM | 40 (13.9%) | 8 (4.5%) |
| 5:00 AM to 5:29 AM | 7 (2.4%) | 3 (1.7%) |
| 5:30 AM to 5:59 AM | 12 (4.2%) | 10 (5.6%) |
| 6:00 AM to 6:29 AM | 31 (10.8%) | 13 (7.3%) |
| 6:30 AM to 6:59 AM | 58 (20.2%) | 8 (4.5%) |
| 7:00 AM to 7:29 AM | 6 (2.1%) | 17 (9.6%) |
| 7:30 AM to 7:59 AM | 15 (5.2%) | 6 (3.4%) |
| 8:00 AM to 8:29 AM | 57 (19.9%) | 27 (15.2%) |
| 8:30 AM to 8:59 AM | 33 (11.5%) | 17 (9.6%) |
| 9:00 AM to 9:59 AM | 12 (4.2%) | 19 (10.7%) |
| 10:00 AM to 10:59 AM | 4 (1.4%) | 24 (13.5%) |
| 11:00 AM to 11:59 AM | 0 (0.0%) | 9 (5.1%) |
| 12:00 PM to 3:59 PM | 3 (1.1%) | 0 (0.0%) |
| 4:00 PM to 11:59 PM | 9 (3.1%) | 17 (9.6%) |
| Total | 287 (100.0%) | 178 (100.0%) |
Housing Occupancy in Medley
Occupancy by Ownership in Medley
Of the total 443 dwellings in Medley, owner-occupied units account for 294 (66.4%), while renter-occupied units make up 149 (33.6%).
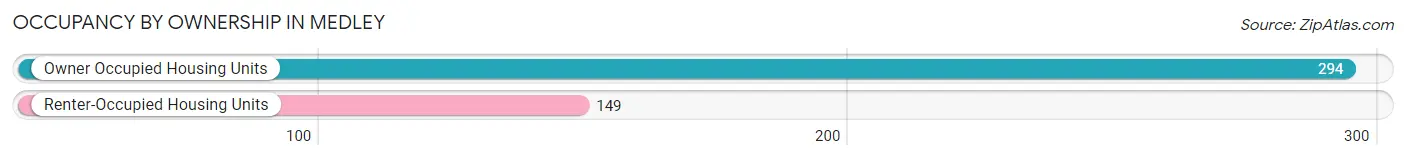
| Occupancy | # Housing Units | % Housing Units |
| Owner Occupied Housing Units | 294 | 66.4% |
| Renter-Occupied Housing Units | 149 | 33.6% |
| Total Occupied Housing Units | 443 | 100.0% |
Occupancy by Household Size in Medley
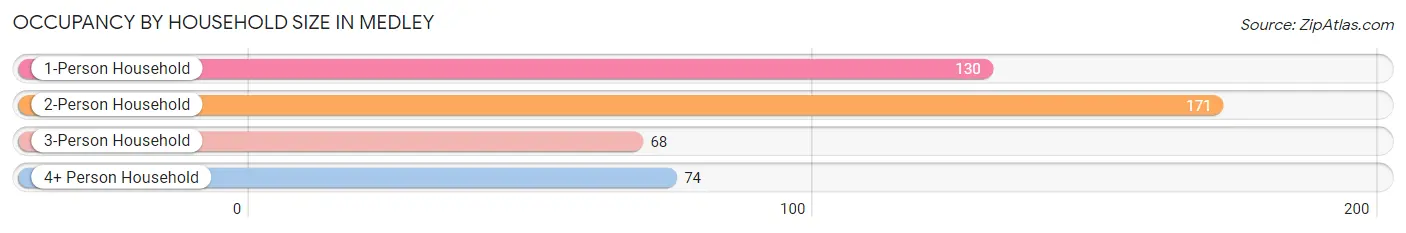
| Household Size | # Housing Units | % Housing Units |
| 1-Person Household | 130 | 29.3% |
| 2-Person Household | 171 | 38.6% |
| 3-Person Household | 68 | 15.3% |
| 4+ Person Household | 74 | 16.7% |
| Total Housing Units | 443 | 100.0% |
Occupancy by Ownership by Household Size in Medley
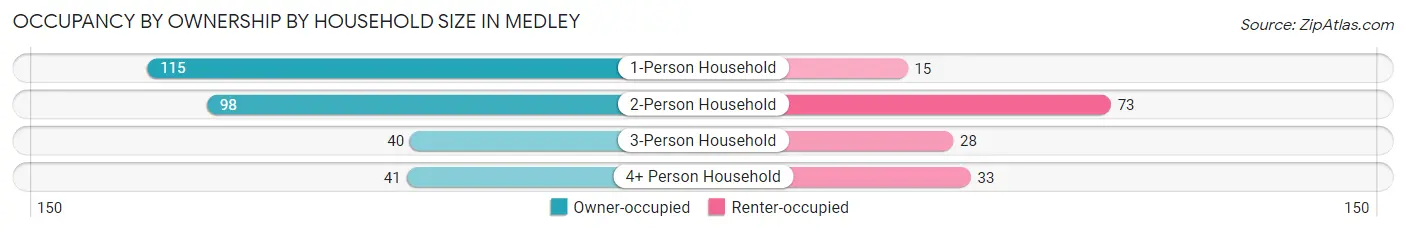
| Household Size | Owner-occupied | Renter-occupied |
| 1-Person Household | 115 (88.5%) | 15 (11.5%) |
| 2-Person Household | 98 (57.3%) | 73 (42.7%) |
| 3-Person Household | 40 (58.8%) | 28 (41.2%) |
| 4+ Person Household | 41 (55.4%) | 33 (44.6%) |
| Total Housing Units | 294 (66.4%) | 149 (33.6%) |
Occupancy by Educational Attainment in Medley
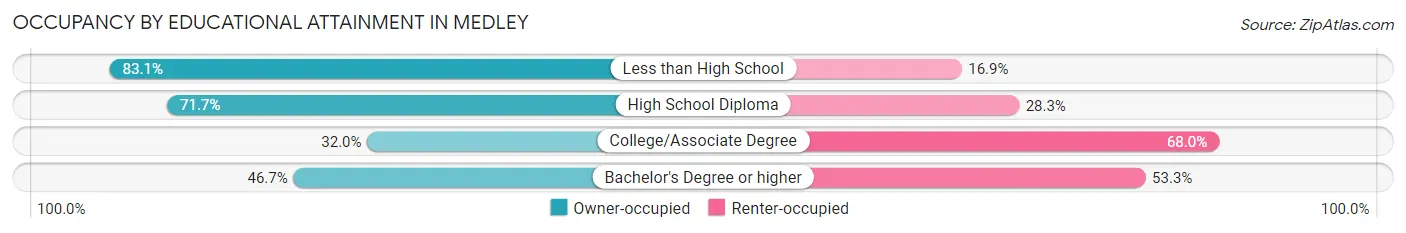
| Household Size | Owner-occupied | Renter-occupied |
| Less than High School | 207 (83.1%) | 42 (16.9%) |
| High School Diploma | 33 (71.7%) | 13 (28.3%) |
| College/Associate Degree | 33 (32.0%) | 70 (68.0%) |
| Bachelor's Degree or higher | 21 (46.7%) | 24 (53.3%) |
Occupancy by Age of Householder in Medley
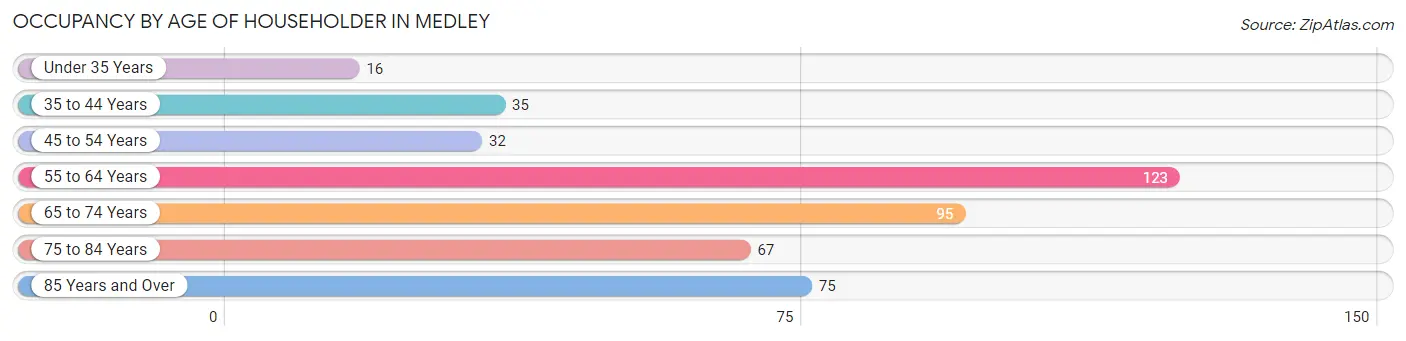
| Age Bracket | # Households | % Households |
| Under 35 Years | 16 | 3.6% |
| 35 to 44 Years | 35 | 7.9% |
| 45 to 54 Years | 32 | 7.2% |
| 55 to 64 Years | 123 | 27.8% |
| 65 to 74 Years | 95 | 21.4% |
| 75 to 84 Years | 67 | 15.1% |
| 85 Years and Over | 75 | 16.9% |
| Total | 443 | 100.0% |
Housing Finances in Medley
Median Income by Occupancy in Medley
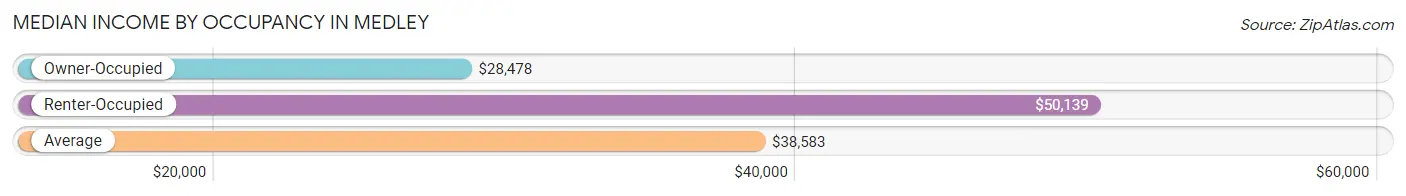
| Occupancy Type | # Households | Median Income |
| Owner-Occupied | 294 (66.4%) | $28,478 |
| Renter-Occupied | 149 (33.6%) | $50,139 |
| Average | 443 (100.0%) | $38,583 |
Occupancy by Householder Income Bracket in Medley
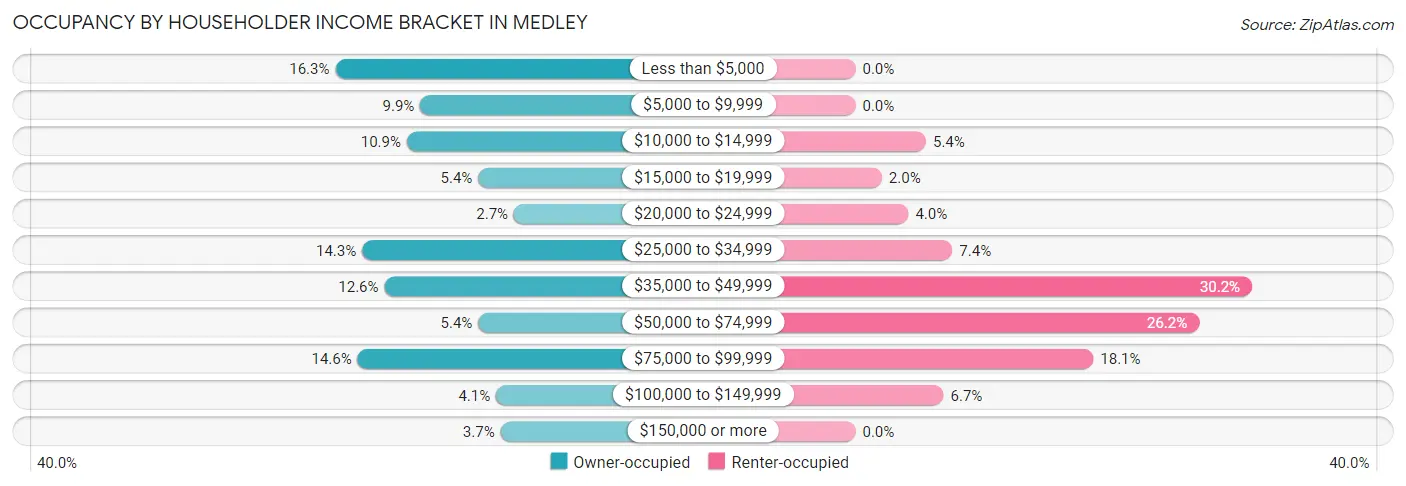
| Income Bracket | Owner-occupied | Renter-occupied |
| Less than $5,000 | 48 (16.3%) | 0 (0.0%) |
| $5,000 to $9,999 | 29 (9.9%) | 0 (0.0%) |
| $10,000 to $14,999 | 32 (10.9%) | 8 (5.4%) |
| $15,000 to $19,999 | 16 (5.4%) | 3 (2.0%) |
| $20,000 to $24,999 | 8 (2.7%) | 6 (4.0%) |
| $25,000 to $34,999 | 42 (14.3%) | 11 (7.4%) |
| $35,000 to $49,999 | 37 (12.6%) | 45 (30.2%) |
| $50,000 to $74,999 | 16 (5.4%) | 39 (26.2%) |
| $75,000 to $99,999 | 43 (14.6%) | 27 (18.1%) |
| $100,000 to $149,999 | 12 (4.1%) | 10 (6.7%) |
| $150,000 or more | 11 (3.7%) | 0 (0.0%) |
| Total | 294 (100.0%) | 149 (100.0%) |
Monthly Housing Cost Tiers in Medley
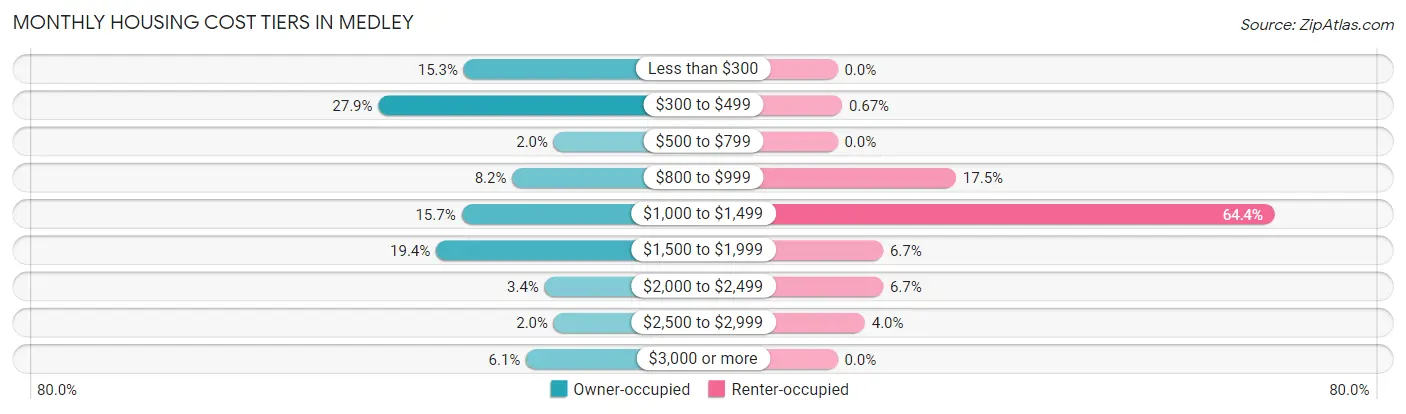
| Monthly Cost | Owner-occupied | Renter-occupied |
| Less than $300 | 45 (15.3%) | 0 (0.0%) |
| $300 to $499 | 82 (27.9%) | 1 (0.7%) |
| $500 to $799 | 6 (2.0%) | 0 (0.0%) |
| $800 to $999 | 24 (8.2%) | 26 (17.4%) |
| $1,000 to $1,499 | 46 (15.7%) | 96 (64.4%) |
| $1,500 to $1,999 | 57 (19.4%) | 10 (6.7%) |
| $2,000 to $2,499 | 10 (3.4%) | 10 (6.7%) |
| $2,500 to $2,999 | 6 (2.0%) | 6 (4.0%) |
| $3,000 or more | 18 (6.1%) | 0 (0.0%) |
| Total | 294 (100.0%) | 149 (100.0%) |
Physical Housing Characteristics in Medley
Housing Structures in Medley
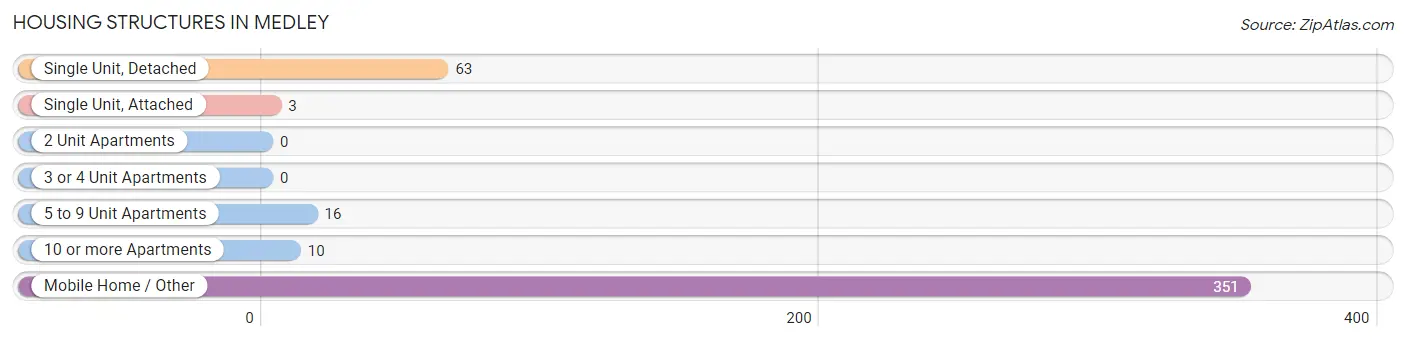
| Structure Type | # Housing Units | % Housing Units |
| Single Unit, Detached | 63 | 14.2% |
| Single Unit, Attached | 3 | 0.7% |
| 2 Unit Apartments | 0 | 0.0% |
| 3 or 4 Unit Apartments | 0 | 0.0% |
| 5 to 9 Unit Apartments | 16 | 3.6% |
| 10 or more Apartments | 10 | 2.3% |
| Mobile Home / Other | 351 | 79.2% |
| Total | 443 | 100.0% |
Housing Structures by Occupancy in Medley
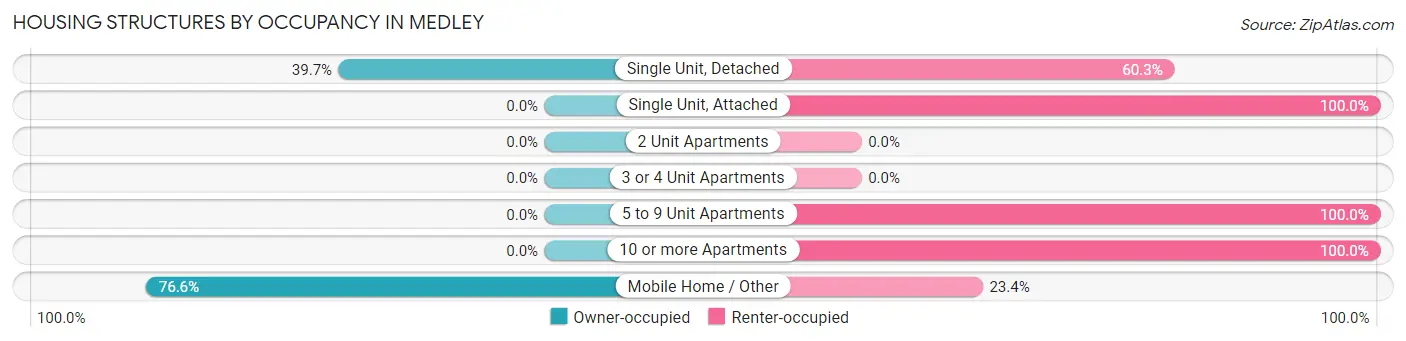
| Structure Type | Owner-occupied | Renter-occupied |
| Single Unit, Detached | 25 (39.7%) | 38 (60.3%) |
| Single Unit, Attached | 0 (0.0%) | 3 (100.0%) |
| 2 Unit Apartments | 0 (0.0%) | 0 (0.0%) |
| 3 or 4 Unit Apartments | 0 (0.0%) | 0 (0.0%) |
| 5 to 9 Unit Apartments | 0 (0.0%) | 16 (100.0%) |
| 10 or more Apartments | 0 (0.0%) | 10 (100.0%) |
| Mobile Home / Other | 269 (76.6%) | 82 (23.4%) |
| Total | 294 (66.4%) | 149 (33.6%) |
Housing Structures by Number of Rooms in Medley
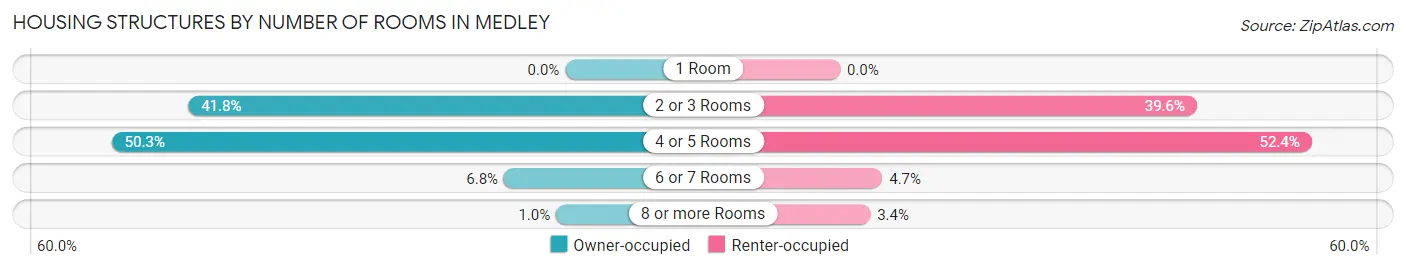
| Number of Rooms | Owner-occupied | Renter-occupied |
| 1 Room | 0 (0.0%) | 0 (0.0%) |
| 2 or 3 Rooms | 123 (41.8%) | 59 (39.6%) |
| 4 or 5 Rooms | 148 (50.3%) | 78 (52.3%) |
| 6 or 7 Rooms | 20 (6.8%) | 7 (4.7%) |
| 8 or more Rooms | 3 (1.0%) | 5 (3.4%) |
| Total | 294 (100.0%) | 149 (100.0%) |
Housing Structure by Heating Type in Medley
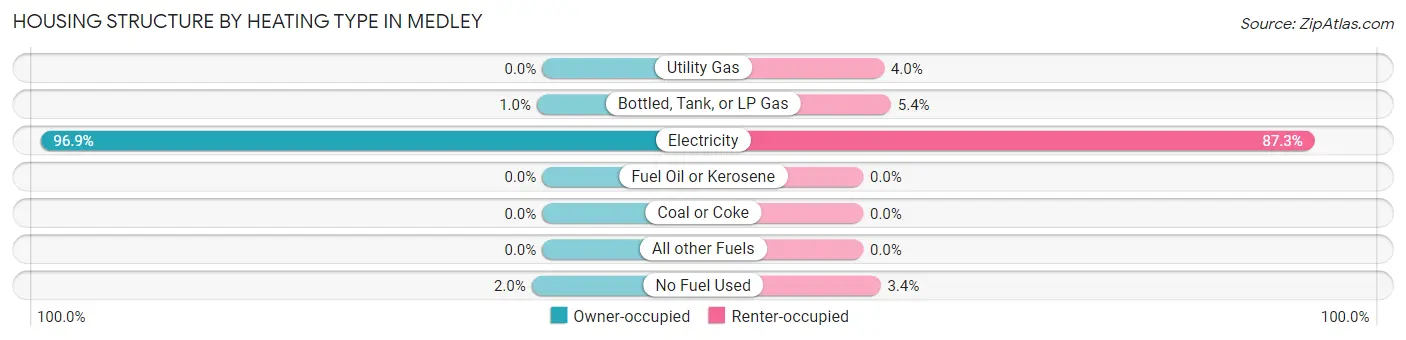
| Heating Type | Owner-occupied | Renter-occupied |
| Utility Gas | 0 (0.0%) | 6 (4.0%) |
| Bottled, Tank, or LP Gas | 3 (1.0%) | 8 (5.4%) |
| Electricity | 285 (96.9%) | 130 (87.3%) |
| Fuel Oil or Kerosene | 0 (0.0%) | 0 (0.0%) |
| Coal or Coke | 0 (0.0%) | 0 (0.0%) |
| All other Fuels | 0 (0.0%) | 0 (0.0%) |
| No Fuel Used | 6 (2.0%) | 5 (3.4%) |
| Total | 294 (100.0%) | 149 (100.0%) |
Household Vehicle Usage in Medley
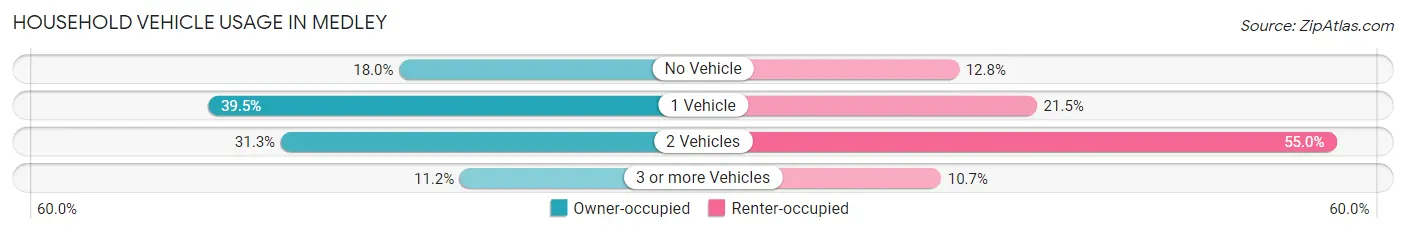
| Vehicles per Household | Owner-occupied | Renter-occupied |
| No Vehicle | 53 (18.0%) | 19 (12.8%) |
| 1 Vehicle | 116 (39.5%) | 32 (21.5%) |
| 2 Vehicles | 92 (31.3%) | 82 (55.0%) |
| 3 or more Vehicles | 33 (11.2%) | 16 (10.7%) |
| Total | 294 (100.0%) | 149 (100.0%) |
Real Estate & Mortgages in Medley
Real Estate and Mortgage Overview in Medley
| Characteristic | Without Mortgage | With Mortgage |
| Housing Units | 285 | 9 |
| Median Property Value | $57,400 | $450,000 |
| Median Household Income | $27,989 | $3 |
| Monthly Housing Costs | $895 | $0 |
| Real Estate Taxes | $199 | $0 |
Property Value by Mortgage Status in Medley
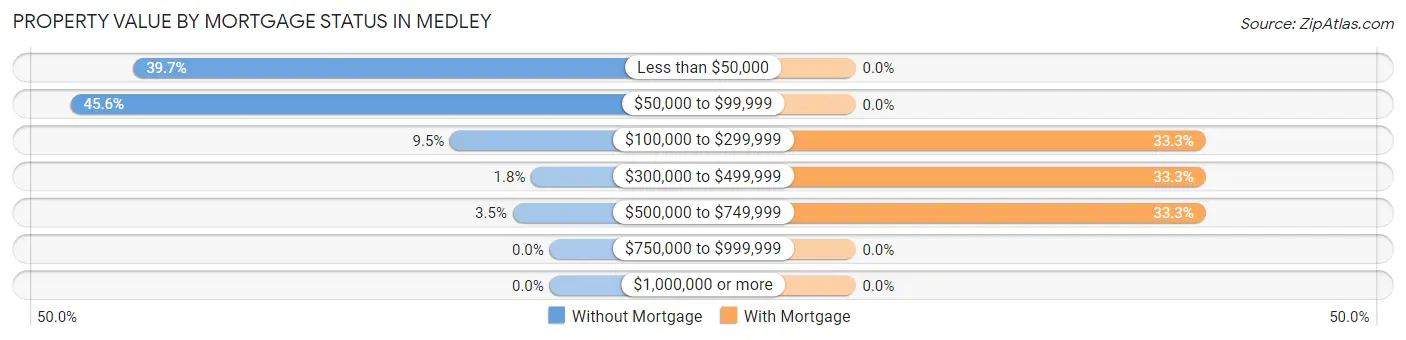
| Property Value | Without Mortgage | With Mortgage |
| Less than $50,000 | 113 (39.7%) | 0 (0.0%) |
| $50,000 to $99,999 | 130 (45.6%) | 0 (0.0%) |
| $100,000 to $299,999 | 27 (9.5%) | 3 (33.3%) |
| $300,000 to $499,999 | 5 (1.8%) | 3 (33.3%) |
| $500,000 to $749,999 | 10 (3.5%) | 3 (33.3%) |
| $750,000 to $999,999 | 0 (0.0%) | 0 (0.0%) |
| $1,000,000 or more | 0 (0.0%) | 0 (0.0%) |
| Total | 285 (100.0%) | 9 (100.0%) |
Household Income by Mortgage Status in Medley
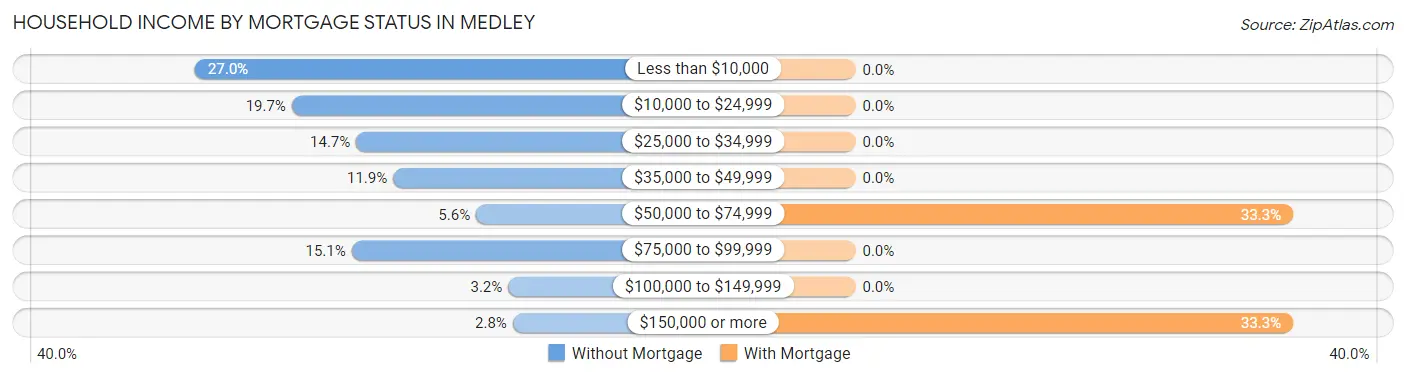
| Household Income | Without Mortgage | With Mortgage |
| Less than $10,000 | 77 (27.0%) | 0 (0.0%) |
| $10,000 to $24,999 | 56 (19.7%) | 0 (0.0%) |
| $25,000 to $34,999 | 42 (14.7%) | 0 (0.0%) |
| $35,000 to $49,999 | 34 (11.9%) | 0 (0.0%) |
| $50,000 to $74,999 | 16 (5.6%) | 3 (33.3%) |
| $75,000 to $99,999 | 43 (15.1%) | 0 (0.0%) |
| $100,000 to $149,999 | 9 (3.2%) | 0 (0.0%) |
| $150,000 or more | 8 (2.8%) | 3 (33.3%) |
| Total | 285 (100.0%) | 9 (100.0%) |
Property Value to Household Income Ratio in Medley
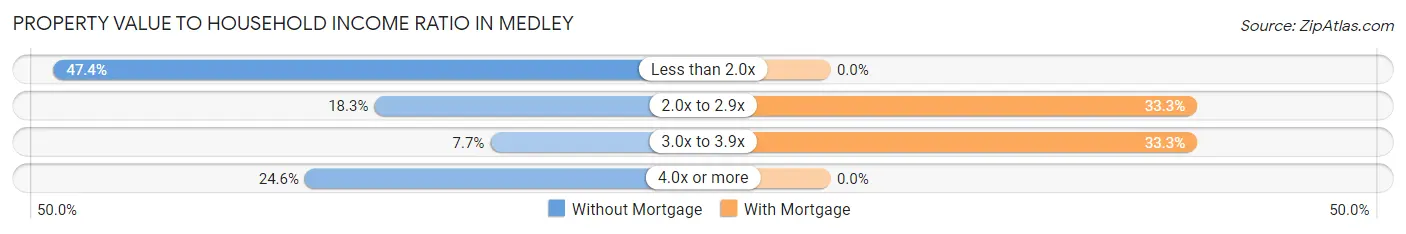
| Value-to-Income Ratio | Without Mortgage | With Mortgage |
| Less than 2.0x | 135 (47.4%) | 0 (0.0%) |
| 2.0x to 2.9x | 52 (18.2%) | 3 (33.3%) |
| 3.0x to 3.9x | 22 (7.7%) | 3 (33.3%) |
| 4.0x or more | 70 (24.6%) | 0 (0.0%) |
| Total | 285 (100.0%) | 9 (100.0%) |
Real Estate Taxes by Mortgage Status in Medley
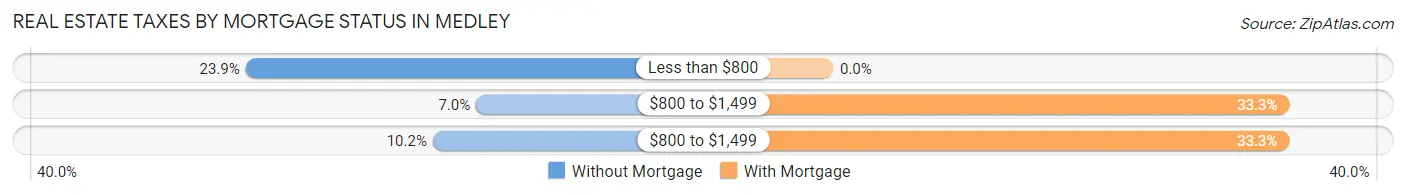
| Property Taxes | Without Mortgage | With Mortgage |
| Less than $800 | 68 (23.9%) | 0 (0.0%) |
| $800 to $1,499 | 20 (7.0%) | 3 (33.3%) |
| $800 to $1,499 | 29 (10.2%) | 3 (33.3%) |
| Total | 285 (100.0%) | 9 (100.0%) |
Health & Disability in Medley
Health Insurance Coverage by Age in Medley
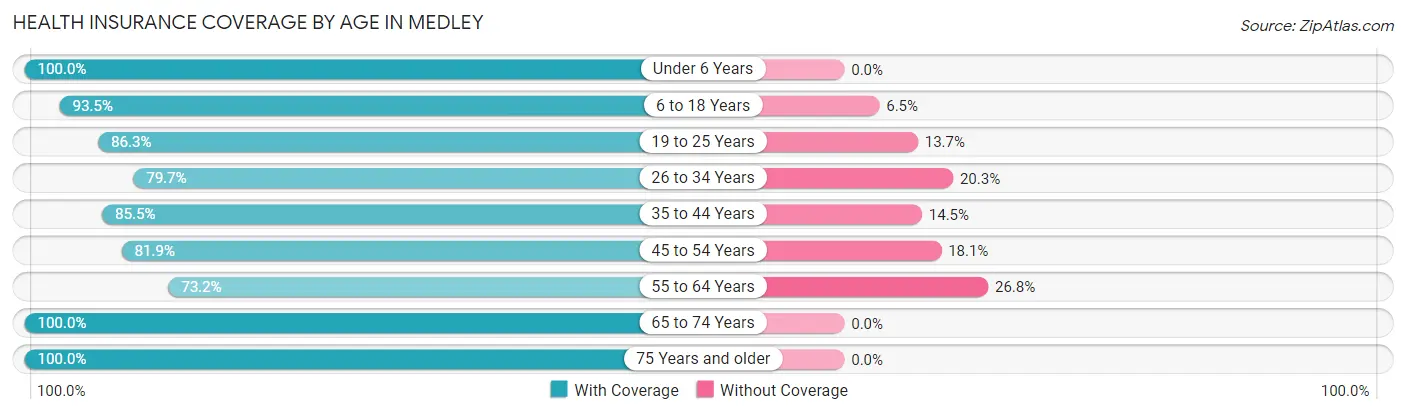
| Age Bracket | With Coverage | Without Coverage |
| Under 6 Years | 33 (100.0%) | 0 (0.0%) |
| 6 to 18 Years | 86 (93.5%) | 6 (6.5%) |
| 19 to 25 Years | 63 (86.3%) | 10 (13.7%) |
| 26 to 34 Years | 59 (79.7%) | 15 (20.3%) |
| 35 to 44 Years | 65 (85.5%) | 11 (14.5%) |
| 45 to 54 Years | 68 (81.9%) | 15 (18.1%) |
| 55 to 64 Years | 183 (73.2%) | 67 (26.8%) |
| 65 to 74 Years | 134 (100.0%) | 0 (0.0%) |
| 75 Years and older | 203 (100.0%) | 0 (0.0%) |
| Total | 894 (87.8%) | 124 (12.2%) |
Health Insurance Coverage by Citizenship Status in Medley
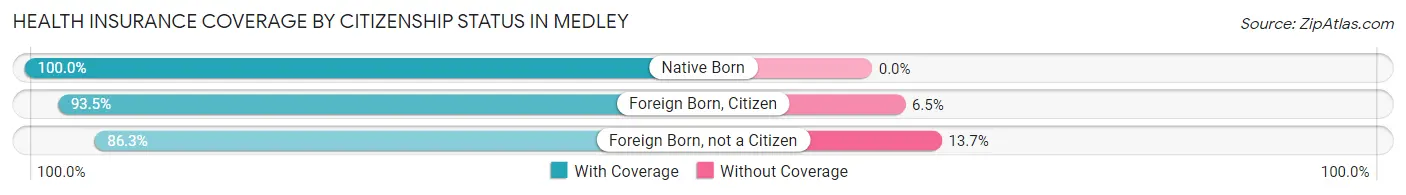
| Citizenship Status | With Coverage | Without Coverage |
| Native Born | 33 (100.0%) | 0 (0.0%) |
| Foreign Born, Citizen | 86 (93.5%) | 6 (6.5%) |
| Foreign Born, not a Citizen | 63 (86.3%) | 10 (13.7%) |
Health Insurance Coverage by Household Income in Medley
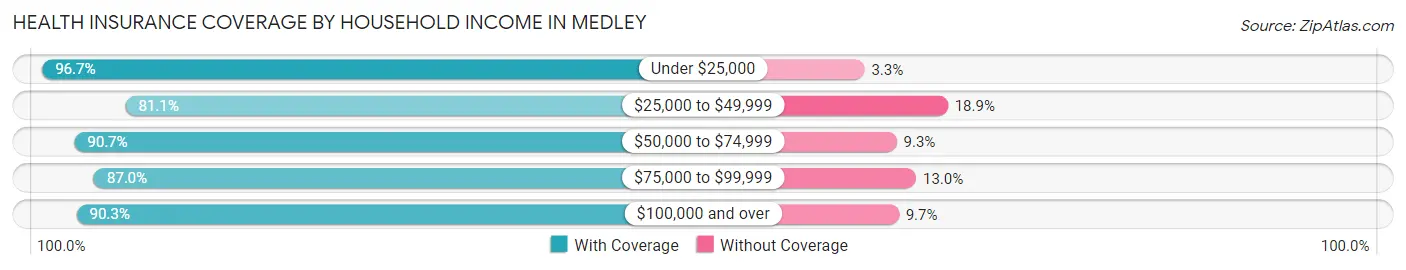
| Household Income | With Coverage | Without Coverage |
| Under $25,000 | 175 (96.7%) | 6 (3.3%) |
| $25,000 to $49,999 | 253 (81.1%) | 59 (18.9%) |
| $50,000 to $74,999 | 136 (90.7%) | 14 (9.3%) |
| $75,000 to $99,999 | 228 (87.0%) | 34 (13.0%) |
| $100,000 and over | 102 (90.3%) | 11 (9.7%) |
Public vs Private Health Insurance Coverage by Age in Medley
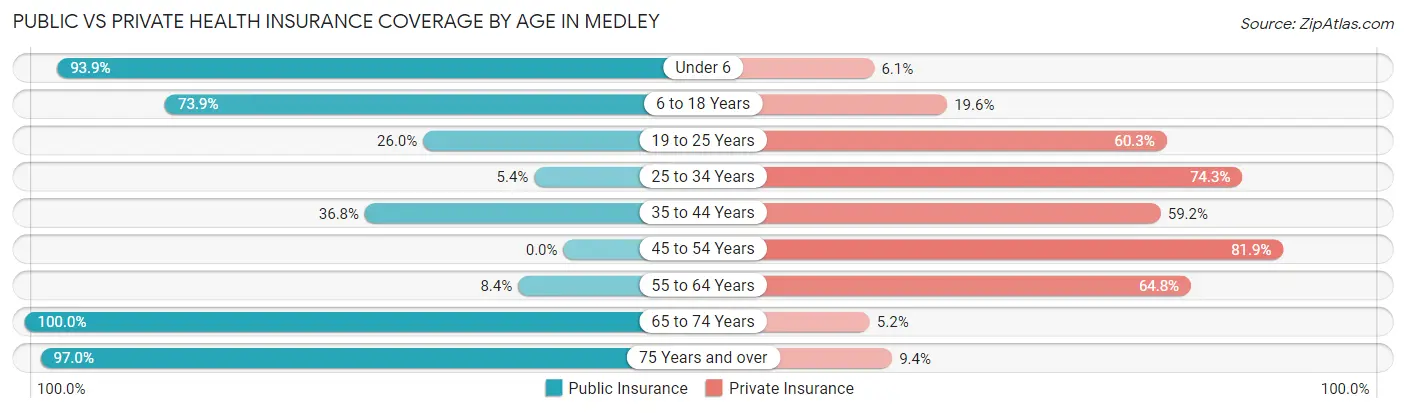
| Age Bracket | Public Insurance | Private Insurance |
| Under 6 | 31 (93.9%) | 2 (6.1%) |
| 6 to 18 Years | 68 (73.9%) | 18 (19.6%) |
| 19 to 25 Years | 19 (26.0%) | 44 (60.3%) |
| 25 to 34 Years | 4 (5.4%) | 55 (74.3%) |
| 35 to 44 Years | 28 (36.8%) | 45 (59.2%) |
| 45 to 54 Years | 0 (0.0%) | 68 (81.9%) |
| 55 to 64 Years | 21 (8.4%) | 162 (64.8%) |
| 65 to 74 Years | 134 (100.0%) | 7 (5.2%) |
| 75 Years and over | 197 (97.0%) | 19 (9.4%) |
| Total | 502 (49.3%) | 420 (41.3%) |
Disability Status by Sex by Age in Medley
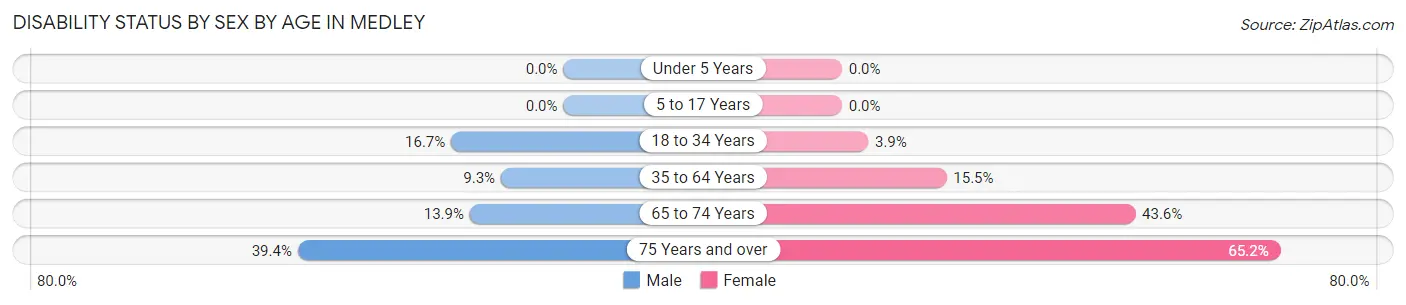
| Age Bracket | Male | Female |
| Under 5 Years | 0 (0.0%) | 0 (0.0%) |
| 5 to 17 Years | 0 (0.0%) | 0 (0.0%) |
| 18 to 34 Years | 13 (16.7%) | 3 (3.9%) |
| 35 to 64 Years | 23 (9.3%) | 25 (15.5%) |
| 65 to 74 Years | 10 (13.9%) | 27 (43.5%) |
| 75 Years and over | 28 (39.4%) | 86 (65.1%) |
Disability Class by Sex by Age in Medley
Disability Class: Hearing Difficulty
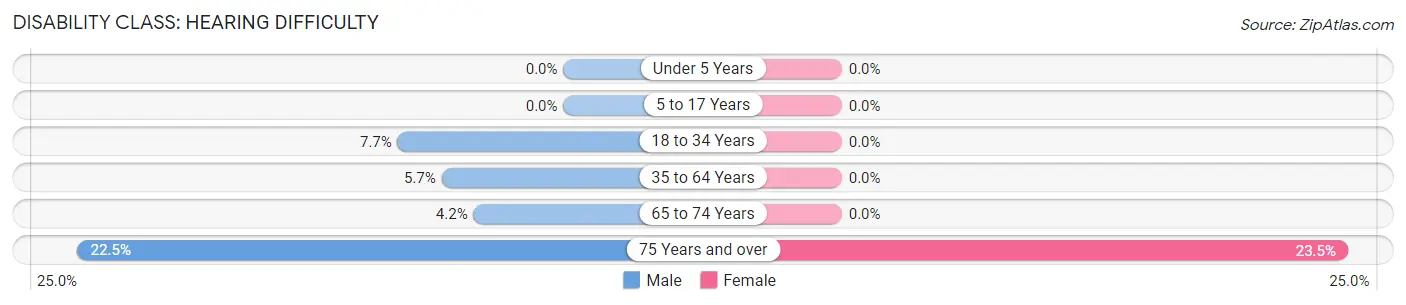
| Age Bracket | Male | Female |
| Under 5 Years | 0 (0.0%) | 0 (0.0%) |
| 5 to 17 Years | 0 (0.0%) | 0 (0.0%) |
| 18 to 34 Years | 6 (7.7%) | 0 (0.0%) |
| 35 to 64 Years | 14 (5.7%) | 0 (0.0%) |
| 65 to 74 Years | 3 (4.2%) | 0 (0.0%) |
| 75 Years and over | 16 (22.5%) | 31 (23.5%) |
Disability Class: Vision Difficulty
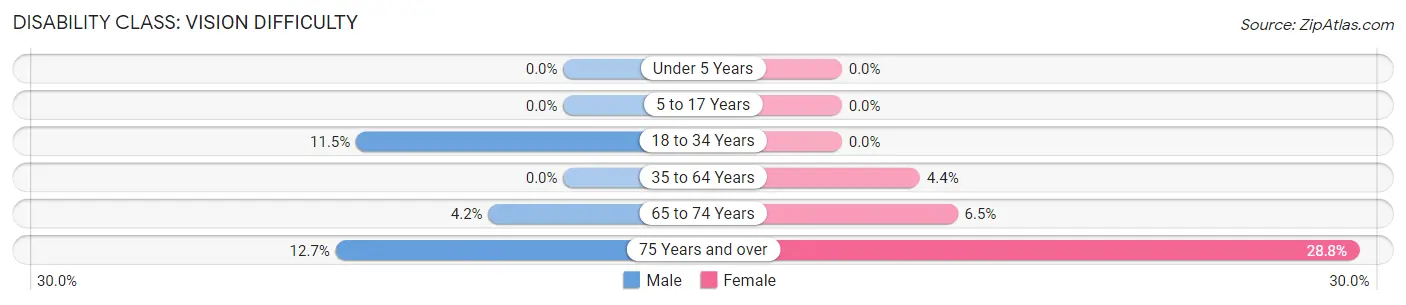
| Age Bracket | Male | Female |
| Under 5 Years | 0 (0.0%) | 0 (0.0%) |
| 5 to 17 Years | 0 (0.0%) | 0 (0.0%) |
| 18 to 34 Years | 9 (11.5%) | 0 (0.0%) |
| 35 to 64 Years | 0 (0.0%) | 7 (4.3%) |
| 65 to 74 Years | 3 (4.2%) | 4 (6.5%) |
| 75 Years and over | 9 (12.7%) | 38 (28.8%) |
Disability Class: Cognitive Difficulty
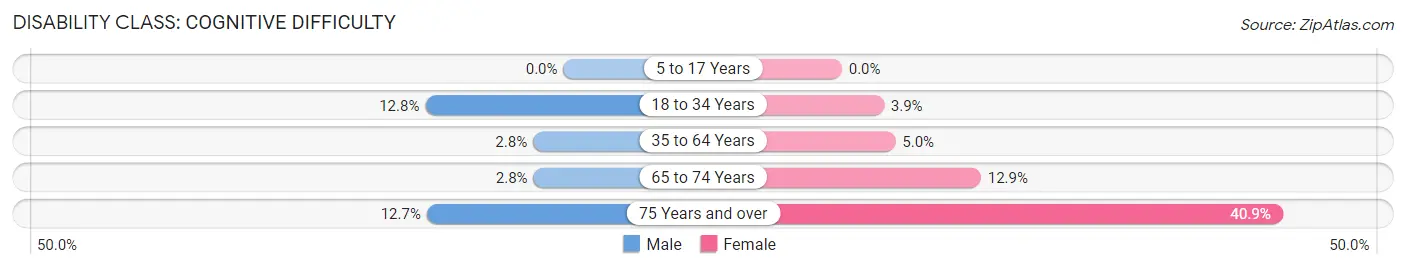
| Age Bracket | Male | Female |
| 5 to 17 Years | 0 (0.0%) | 0 (0.0%) |
| 18 to 34 Years | 10 (12.8%) | 3 (3.9%) |
| 35 to 64 Years | 7 (2.8%) | 8 (5.0%) |
| 65 to 74 Years | 2 (2.8%) | 8 (12.9%) |
| 75 Years and over | 9 (12.7%) | 54 (40.9%) |
Disability Class: Ambulatory Difficulty
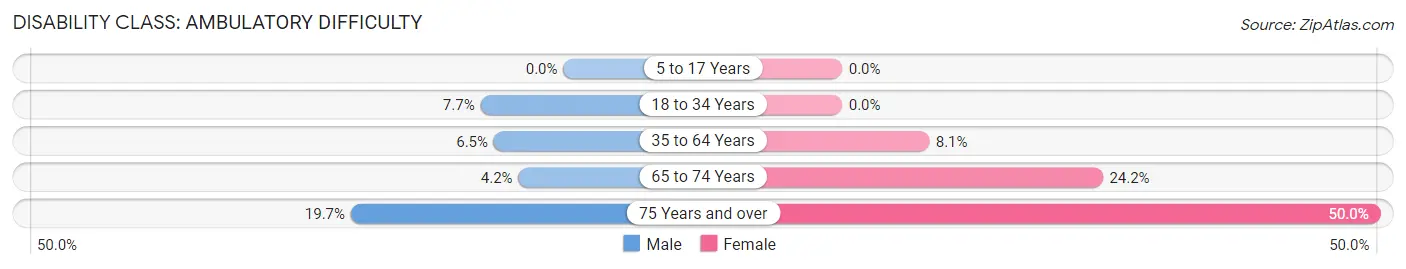
| Age Bracket | Male | Female |
| 5 to 17 Years | 0 (0.0%) | 0 (0.0%) |
| 18 to 34 Years | 6 (7.7%) | 0 (0.0%) |
| 35 to 64 Years | 16 (6.5%) | 13 (8.1%) |
| 65 to 74 Years | 3 (4.2%) | 15 (24.2%) |
| 75 Years and over | 14 (19.7%) | 66 (50.0%) |
Disability Class: Self-Care Difficulty
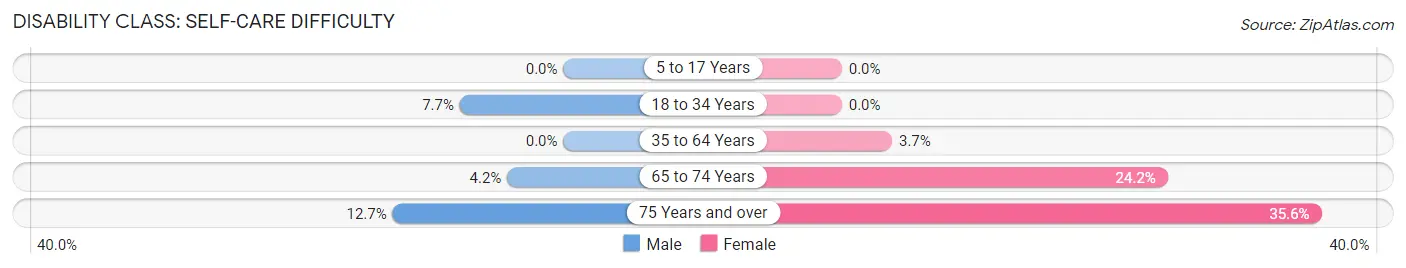
| Age Bracket | Male | Female |
| 5 to 17 Years | 0 (0.0%) | 0 (0.0%) |
| 18 to 34 Years | 6 (7.7%) | 0 (0.0%) |
| 35 to 64 Years | 0 (0.0%) | 6 (3.7%) |
| 65 to 74 Years | 3 (4.2%) | 15 (24.2%) |
| 75 Years and over | 9 (12.7%) | 47 (35.6%) |
Technology Access in Medley
Computing Device Access in Medley
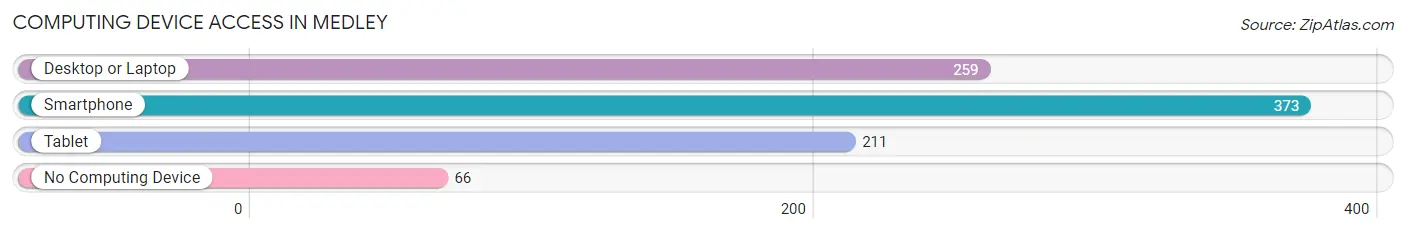
| Device Type | # Households | % Households |
| Desktop or Laptop | 259 | 58.5% |
| Smartphone | 373 | 84.2% |
| Tablet | 211 | 47.6% |
| No Computing Device | 66 | 14.9% |
| Total | 443 | 100.0% |
Internet Access in Medley
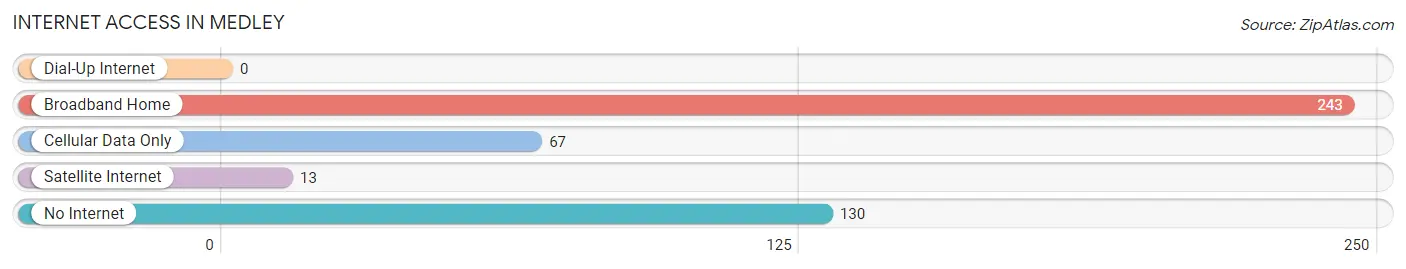
| Internet Type | # Households | % Households |
| Dial-Up Internet | 0 | 0.0% |
| Broadband Home | 243 | 54.8% |
| Cellular Data Only | 67 | 15.1% |
| Satellite Internet | 13 | 2.9% |
| No Internet | 130 | 29.3% |
| Total | 443 | 100.0% |
Medley Summary
Medley is a town located in Miami-Dade County, Florida. It is situated in the northwestern part of the county, just west of Miami International Airport. The town was incorporated in 1926 and has a population of approximately 5,000 people.
History
The area that is now Medley was originally inhabited by the Tequesta Indians. The first European settlers arrived in the area in the late 1800s and began to develop the land for farming. The town was originally known as Medley Station, named after the railroad station that was built in the area in the early 1900s. The town was officially incorporated in 1926 and was named after the Medley family, who were some of the first settlers in the area.
Geography
Medley is located in the northwestern part of Miami-Dade County, just west of Miami International Airport. The town is situated on the Miami River and is bordered by the cities of Miami Springs, Hialeah, and Doral. The town covers an area of approximately 1.2 square miles and has a population density of 4,000 people per square mile.
Economy
Medley’s economy is largely based on the service industry. The town is home to several large companies, including the Miami International Airport, which is the largest employer in the area. Other major employers include the Miami-Dade County Public Schools, the University of Miami, and the Miami-Dade County government. The town also has a number of small businesses, including restaurants, retail stores, and professional services.
Demographics
As of the 2010 census, the population of Medley was 5,000 people. The racial makeup of the town was 65.3% White, 22.2% Hispanic or Latino, 8.2% African American, and 4.3% other. The median household income was $41,000, and the median age was 37 years.
Medley is a small town with a rich history and a diverse population. The town is home to a number of large employers and small businesses, and is a great place to live and work. With its close proximity to Miami International Airport, Medley is a great place to visit and explore.
Common Questions
What is Per Capita Income in Medley?
Per Capita income in Medley is $22,809.
What is the Median Family Income in Medley?
Median Family Income in Medley is $51,065.
What is the Median Household income in Medley?
Median Household Income in Medley is $38,583.
What is Income or Wage Gap in Medley?
Income or Wage Gap in Medley is 23.6%.
Women in Medley earn 76.4 cents for every dollar earned by a man.
What is Inequality or Gini Index in Medley?
Inequality or Gini Index in Medley is 0.49.
What is the Total Population of Medley?
Total Population of Medley is 1,018.
What is the Total Male Population of Medley?
Total Male Population of Medley is 519.
What is the Total Female Population of Medley?
Total Female Population of Medley is 499.
What is the Ratio of Males per 100 Females in Medley?
There are 104.01 Males per 100 Females in Medley.
What is the Ratio of Females per 100 Males in Medley?
There are 96.15 Females per 100 Males in Medley.
What is the Median Population Age in Medley?
Median Population Age in Medley is 58.9 Years.
What is the Average Family Size in Medley
Average Family Size in Medley is 3.0 People.
What is the Average Household Size in Medley
Average Household Size in Medley is 2.3 People.
How Large is the Labor Force in Medley?
There are 509 People in the Labor Forcein in Medley.
What is the Percentage of People in the Labor Force in Medley?
55.8% of People are in the Labor Force in Medley.
What is the Unemployment Rate in Medley?
Unemployment Rate in Medley is 2.0%.