Mary Esther, FL Map & Demographics
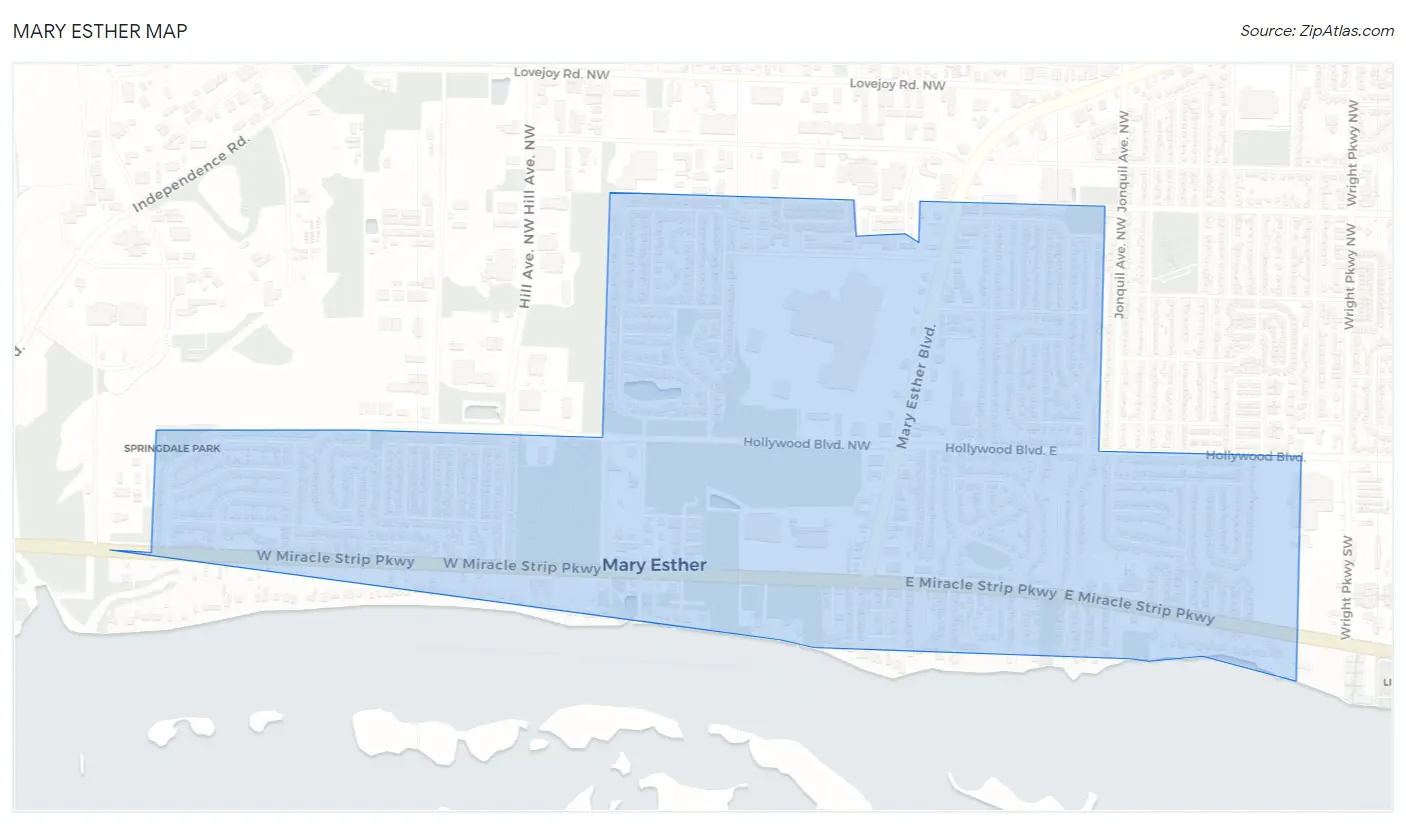
Mary Esther Map
Mary Esther Overview
$48,280
PER CAPITA INCOME
$74,508
AVG FAMILY INCOME
$75,167
AVG HOUSEHOLD INCOME
18.0%
WAGE / INCOME GAP [ % ]
82.0¢/ $1
WAGE / INCOME GAP [ $ ]
0.48
INEQUALITY / GINI INDEX
4,018
TOTAL POPULATION
1,890
MALE POPULATION
2,128
FEMALE POPULATION
88.82
MALES / 100 FEMALES
112.59
FEMALES / 100 MALES
38.6
MEDIAN AGE
3.1
AVG FAMILY SIZE
2.7
AVG HOUSEHOLD SIZE
2,129
LABOR FORCE [ PEOPLE ]
65.0%
PERCENT IN LABOR FORCE
6.4%
UNEMPLOYMENT RATE
Mary Esther Zip Codes
Mary Esther Area Codes
Income in Mary Esther
Income Overview in Mary Esther
Per Capita Income in Mary Esther is $48,280, while median incomes of families and households are $74,508 and $75,167 respectively.
| Characteristic | Number | Measure |
| Per Capita Income | 4,018 | $48,280 |
| Median Family Income | 1,041 | $74,508 |
| Mean Family Income | 1,041 | $132,089 |
| Median Household Income | 1,504 | $75,167 |
| Mean Household Income | 1,504 | $122,660 |
| Income Deficit | 1,041 | $0 |
| Wage / Income Gap (%) | 4,018 | 18.00% |
| Wage / Income Gap ($) | 4,018 | 82.00¢ per $1 |
| Gini / Inequality Index | 4,018 | 0.48 |
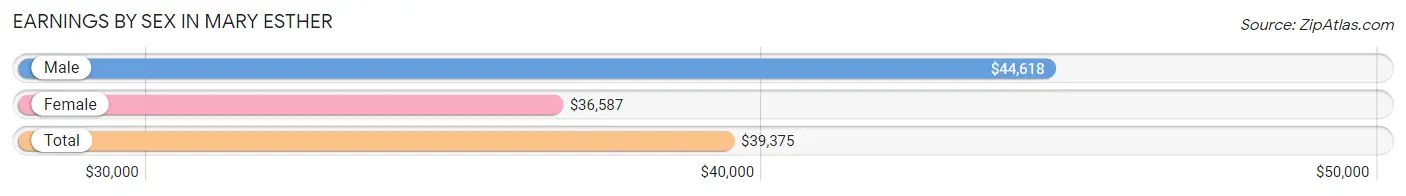
Earnings by Sex in Mary Esther
Average Earnings in Mary Esther are $39,375, $44,618 for men and $36,587 for women, a difference of 18.0%.
| Sex | Number | Average Earnings |
| Male | 1,075 (49.8%) | $44,618 |
| Female | 1,084 (50.2%) | $36,587 |
| Total | 2,159 (100.0%) | $39,375 |
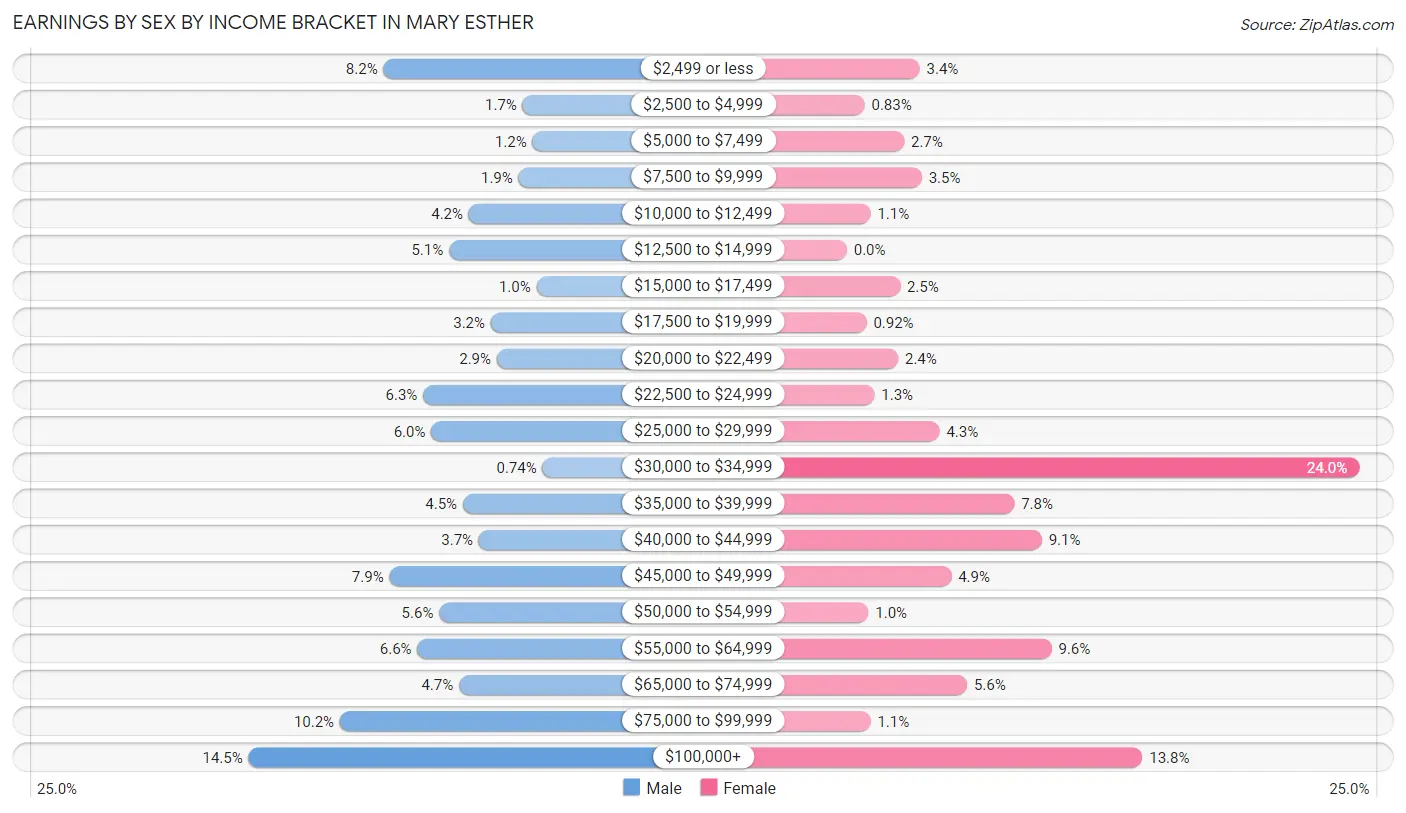
Earnings by Sex by Income Bracket in Mary Esther
The most common earnings brackets in Mary Esther are $100,000+ for men (156 | 14.5%) and $30,000 to $34,999 for women (260 | 24.0%).
| Income | Male | Female |
| $2,499 or less | 88 (8.2%) | 37 (3.4%) |
| $2,500 to $4,999 | 18 (1.7%) | 9 (0.8%) |
| $5,000 to $7,499 | 13 (1.2%) | 29 (2.7%) |
| $7,500 to $9,999 | 20 (1.9%) | 38 (3.5%) |
| $10,000 to $12,499 | 45 (4.2%) | 12 (1.1%) |
| $12,500 to $14,999 | 55 (5.1%) | 0 (0.0%) |
| $15,000 to $17,499 | 11 (1.0%) | 27 (2.5%) |
| $17,500 to $19,999 | 34 (3.2%) | 10 (0.9%) |
| $20,000 to $22,499 | 31 (2.9%) | 26 (2.4%) |
| $22,500 to $24,999 | 68 (6.3%) | 14 (1.3%) |
| $25,000 to $29,999 | 64 (5.9%) | 47 (4.3%) |
| $30,000 to $34,999 | 8 (0.7%) | 260 (24.0%) |
| $35,000 to $39,999 | 48 (4.5%) | 85 (7.8%) |
| $40,000 to $44,999 | 40 (3.7%) | 99 (9.1%) |
| $45,000 to $49,999 | 85 (7.9%) | 53 (4.9%) |
| $50,000 to $54,999 | 60 (5.6%) | 11 (1.0%) |
| $55,000 to $64,999 | 71 (6.6%) | 104 (9.6%) |
| $65,000 to $74,999 | 50 (4.6%) | 61 (5.6%) |
| $75,000 to $99,999 | 110 (10.2%) | 12 (1.1%) |
| $100,000+ | 156 (14.5%) | 150 (13.8%) |
| Total | 1,075 (100.0%) | 1,084 (100.0%) |
Earnings by Sex by Educational Attainment in Mary Esther
Average earnings in Mary Esther are $45,571 for men and $38,712 for women, a difference of 15.0%. Men with an educational attainment of graduate degree enjoy the highest average annual earnings of $107,961, while those with high school diploma education earn the least with $17,188. Women with an educational attainment of bachelor's degree earn the most with the average annual earnings of $55,938, while those with high school diploma education have the smallest earnings of $33,105.

| Educational Attainment | Male Income | Female Income |
| Less than High School | $18,929 | $0 |
| High School Diploma | $17,188 | $33,105 |
| College or Associate's Degree | $47,065 | $35,707 |
| Bachelor's Degree | $85,000 | $55,938 |
| Graduate Degree | $107,961 | $0 |
| Total | $45,571 | $38,712 |
Family Income in Mary Esther
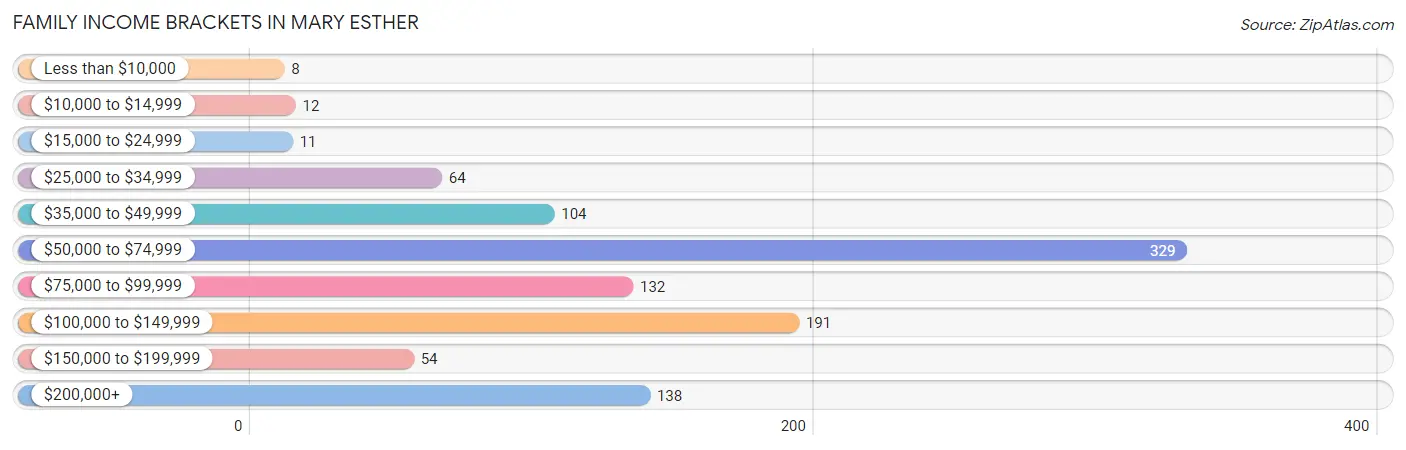
Family Income Brackets in Mary Esther
According to the Mary Esther family income data, there are 329 families falling into the $50,000 to $74,999 income range, which is the most common income bracket and makes up 31.6% of all families. Conversely, the less than $10,000 income bracket is the least frequent group with only 8 families (0.8%) belonging to this category.
| Income Bracket | # Families | % Families |
| Less than $10,000 | 8 | 0.8% |
| $10,000 to $14,999 | 12 | 1.2% |
| $15,000 to $24,999 | 11 | 1.1% |
| $25,000 to $34,999 | 64 | 6.1% |
| $35,000 to $49,999 | 104 | 10.0% |
| $50,000 to $74,999 | 329 | 31.6% |
| $75,000 to $99,999 | 132 | 12.7% |
| $100,000 to $149,999 | 191 | 18.3% |
| $150,000 to $199,999 | 54 | 5.2% |
| $200,000+ | 138 | 13.3% |
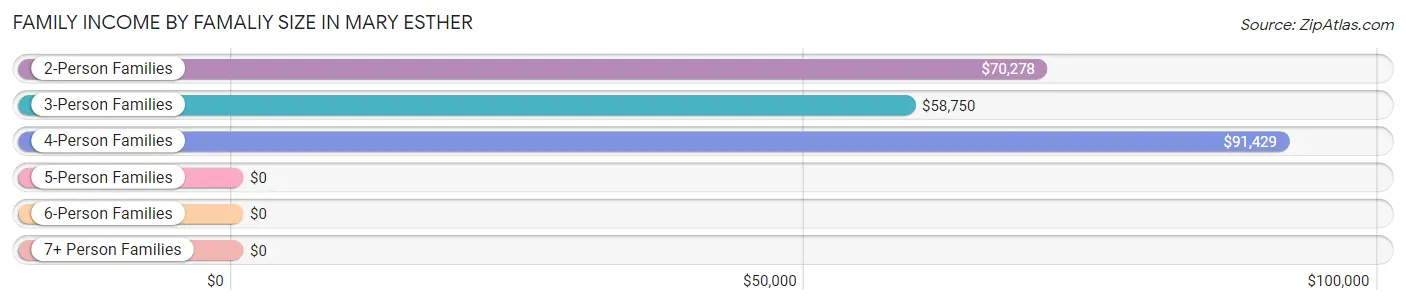
Family Income by Famaliy Size in Mary Esther
4-person families (114 | 11.0%) account for the highest median family income in Mary Esther with $91,429 per family, while 2-person families (590 | 56.7%) have the highest median income of $35,139 per family member.
| Income Bracket | # Families | Median Income |
| 2-Person Families | 590 (56.7%) | $70,278 |
| 3-Person Families | 225 (21.6%) | $58,750 |
| 4-Person Families | 114 (11.0%) | $91,429 |
| 5-Person Families | 97 (9.3%) | $0 |
| 6-Person Families | 4 (0.4%) | $0 |
| 7+ Person Families | 11 (1.1%) | $0 |
| Total | 1,041 (100.0%) | $74,508 |
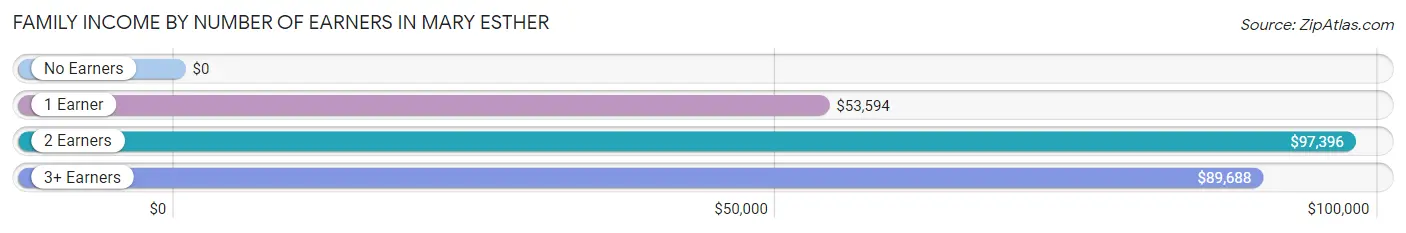
Family Income by Number of Earners in Mary Esther
| Number of Earners | # Families | Median Income |
| No Earners | 192 (18.4%) | $0 |
| 1 Earner | 359 (34.5%) | $53,594 |
| 2 Earners | 469 (45.1%) | $97,396 |
| 3+ Earners | 21 (2.0%) | $89,688 |
| Total | 1,041 (100.0%) | $74,508 |
Household Income in Mary Esther
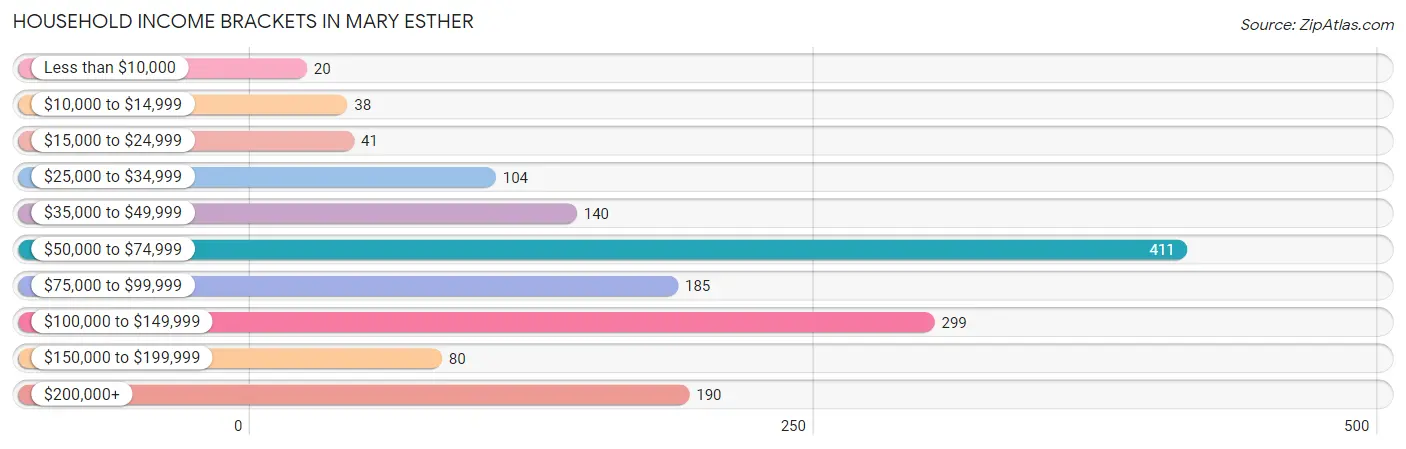
Household Income Brackets in Mary Esther
With 411 households falling in the category, the $50,000 to $74,999 income range is the most frequent in Mary Esther, accounting for 27.3% of all households. In contrast, only 20 households (1.3%) fall into the less than $10,000 income bracket, making it the least populous group.
| Income Bracket | # Households | % Households |
| Less than $10,000 | 20 | 1.3% |
| $10,000 to $14,999 | 38 | 2.5% |
| $15,000 to $24,999 | 41 | 2.7% |
| $25,000 to $34,999 | 104 | 6.9% |
| $35,000 to $49,999 | 140 | 9.3% |
| $50,000 to $74,999 | 411 | 27.3% |
| $75,000 to $99,999 | 185 | 12.3% |
| $100,000 to $149,999 | 299 | 19.9% |
| $150,000 to $199,999 | 80 | 5.3% |
| $200,000+ | 190 | 12.6% |
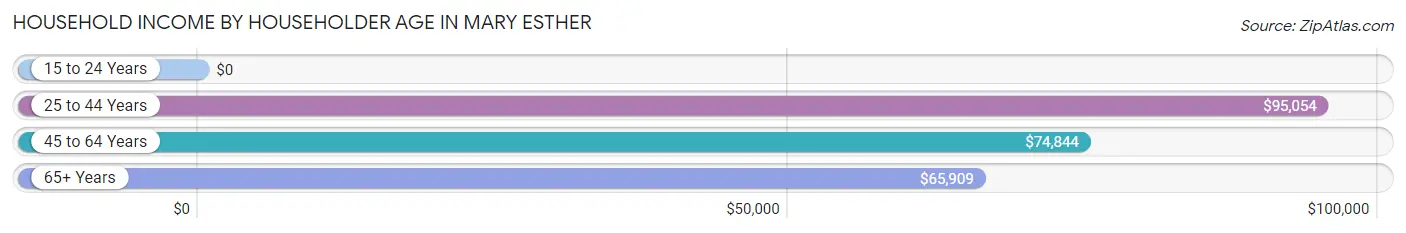
Household Income by Householder Age in Mary Esther
The median household income in Mary Esther is $75,167, with the highest median household income of $95,054 found in the 25 to 44 years age bracket for the primary householder. A total of 485 households (32.3%) fall into this category. Meanwhile, the 15 to 24 years age bracket for the primary householder has the lowest median household income of $0, with 33 households (2.2%) in this group.
| Income Bracket | # Households | Median Income |
| 15 to 24 Years | 33 (2.2%) | $0 |
| 25 to 44 Years | 485 (32.3%) | $95,054 |
| 45 to 64 Years | 524 (34.8%) | $74,844 |
| 65+ Years | 462 (30.7%) | $65,909 |
| Total | 1,504 (100.0%) | $75,167 |
Poverty in Mary Esther
Income Below Poverty by Sex and Age in Mary Esther
With 4.9% poverty level for males and 3.0% for females among the residents of Mary Esther, 25 to 34 year old males and 16 and 17 year old females are the most vulnerable to poverty, with 50 males (12.0%) and 13 females (43.3%) in their respective age groups living below the poverty level.
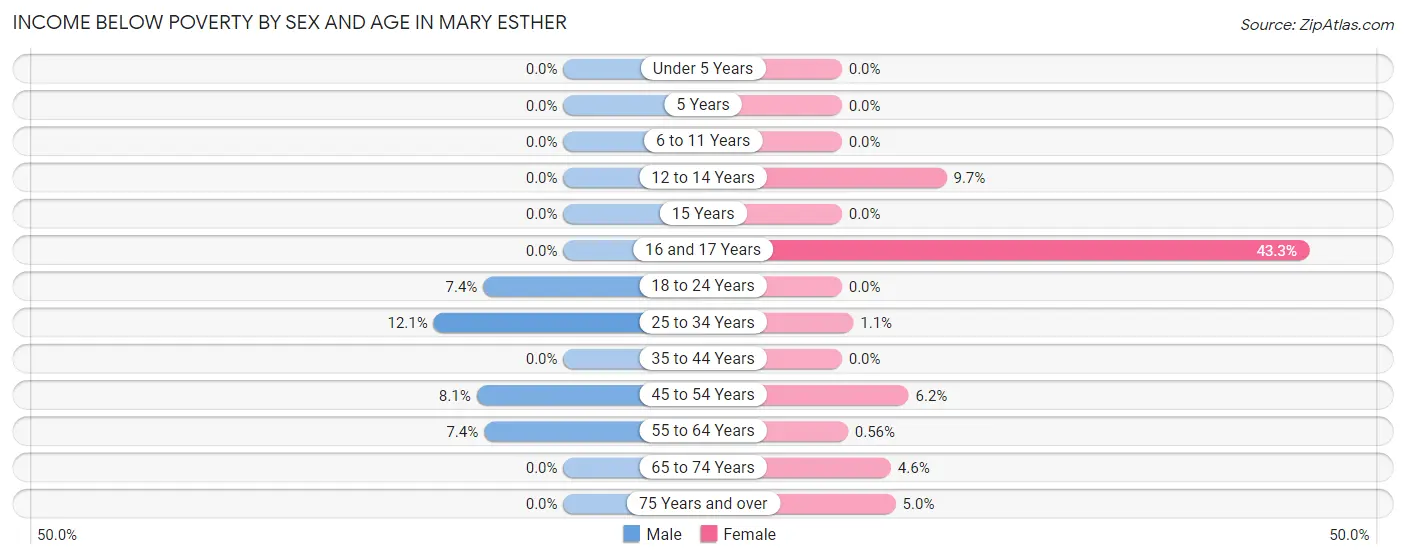
| Age Bracket | Male | Female |
| Under 5 Years | 0 (0.0%) | 0 (0.0%) |
| 5 Years | 0 (0.0%) | 0 (0.0%) |
| 6 to 11 Years | 0 (0.0%) | 0 (0.0%) |
| 12 to 14 Years | 0 (0.0%) | 14 (9.7%) |
| 15 Years | 0 (0.0%) | 0 (0.0%) |
| 16 and 17 Years | 0 (0.0%) | 13 (43.3%) |
| 18 to 24 Years | 9 (7.4%) | 0 (0.0%) |
| 25 to 34 Years | 50 (12.0%) | 4 (1.1%) |
| 35 to 44 Years | 0 (0.0%) | 0 (0.0%) |
| 45 to 54 Years | 10 (8.1%) | 8 (6.2%) |
| 55 to 64 Years | 24 (7.4%) | 2 (0.6%) |
| 65 to 74 Years | 0 (0.0%) | 12 (4.6%) |
| 75 Years and over | 0 (0.0%) | 10 (5.0%) |
| Total | 93 (4.9%) | 63 (3.0%) |
Income Above Poverty by Sex and Age in Mary Esther
According to the poverty statistics in Mary Esther, males aged under 5 years and females aged under 5 years are the age groups that are most secure financially, with 100.0% of males and 100.0% of females in these age groups living above the poverty line.
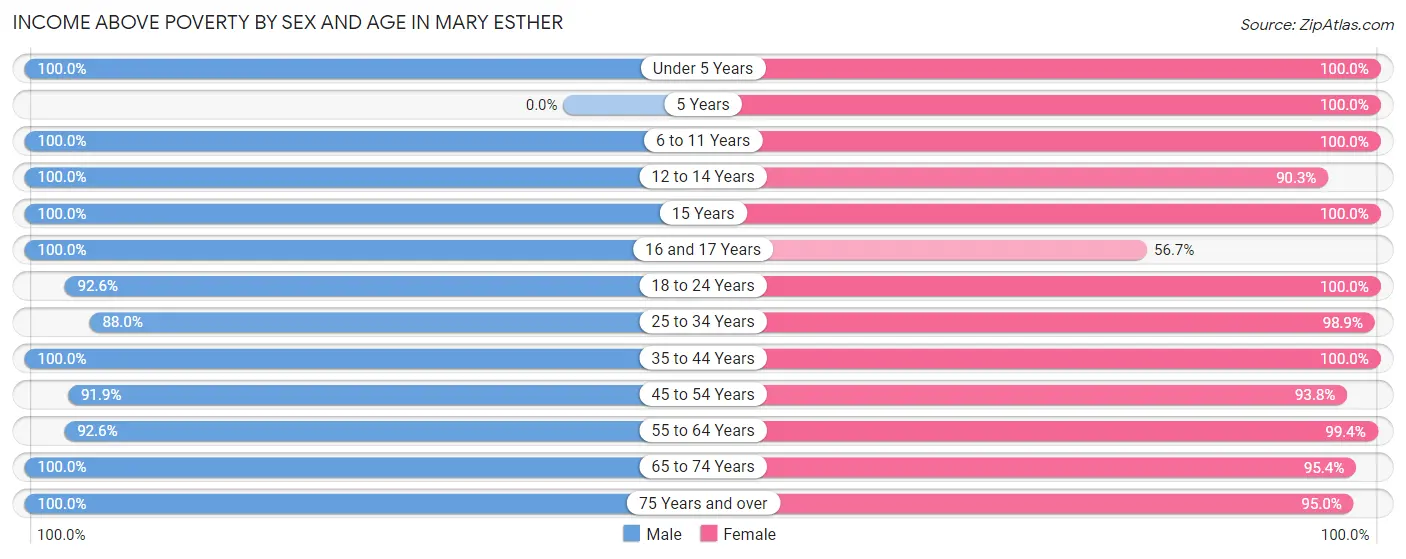
| Age Bracket | Male | Female |
| Under 5 Years | 82 (100.0%) | 137 (100.0%) |
| 5 Years | 0 (0.0%) | 7 (100.0%) |
| 6 to 11 Years | 132 (100.0%) | 127 (100.0%) |
| 12 to 14 Years | 43 (100.0%) | 130 (90.3%) |
| 15 Years | 10 (100.0%) | 42 (100.0%) |
| 16 and 17 Years | 12 (100.0%) | 17 (56.7%) |
| 18 to 24 Years | 112 (92.6%) | 116 (100.0%) |
| 25 to 34 Years | 365 (87.9%) | 371 (98.9%) |
| 35 to 44 Years | 291 (100.0%) | 191 (100.0%) |
| 45 to 54 Years | 114 (91.9%) | 121 (93.8%) |
| 55 to 64 Years | 302 (92.6%) | 355 (99.4%) |
| 65 to 74 Years | 190 (100.0%) | 251 (95.4%) |
| 75 Years and over | 135 (100.0%) | 190 (95.0%) |
| Total | 1,788 (95.1%) | 2,055 (97.0%) |
Income Below Poverty Among Married-Couple Families in Mary Esther
The poverty statistics for married-couple families in Mary Esther show that 1.5% or 12 of the total 810 families live below the poverty line. Families with no children have the highest poverty rate of 2.1%, comprising of 12 families. On the other hand, families with 1 or 2 children have the lowest poverty rate of 0.0%, which includes 0 families.
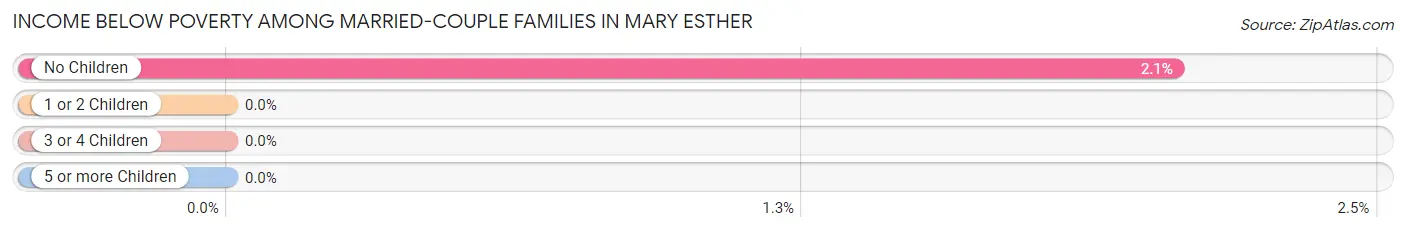
| Children | Above Poverty | Below Poverty |
| No Children | 571 (97.9%) | 12 (2.1%) |
| 1 or 2 Children | 166 (100.0%) | 0 (0.0%) |
| 3 or 4 Children | 61 (100.0%) | 0 (0.0%) |
| 5 or more Children | 0 (0.0%) | 0 (0.0%) |
| Total | 798 (98.5%) | 12 (1.5%) |
Income Below Poverty Among Single-Parent Households in Mary Esther
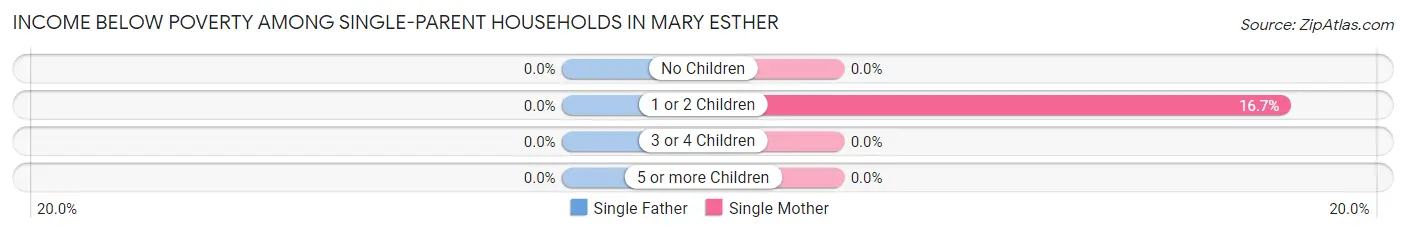
| Children | Single Father | Single Mother |
| No Children | 0 (0.0%) | 0 (0.0%) |
| 1 or 2 Children | 0 (0.0%) | 8 (16.7%) |
| 3 or 4 Children | 0 (0.0%) | 0 (0.0%) |
| 5 or more Children | 0 (0.0%) | 0 (0.0%) |
| Total | 0 (0.0%) | 8 (5.1%) |
Income Below Poverty Among Married-Couple vs Single-Parent Households in Mary Esther
The poverty data for Mary Esther shows that 12 of the married-couple family households (1.5%) and 8 of the single-parent households (3.5%) are living below the poverty level. Within the married-couple family households, those with no children have the highest poverty rate, with 12 households (2.1%) falling below the poverty line. Among the single-parent households, those with 1 or 2 children have the highest poverty rate, with 8 household (7.8%) living below poverty.
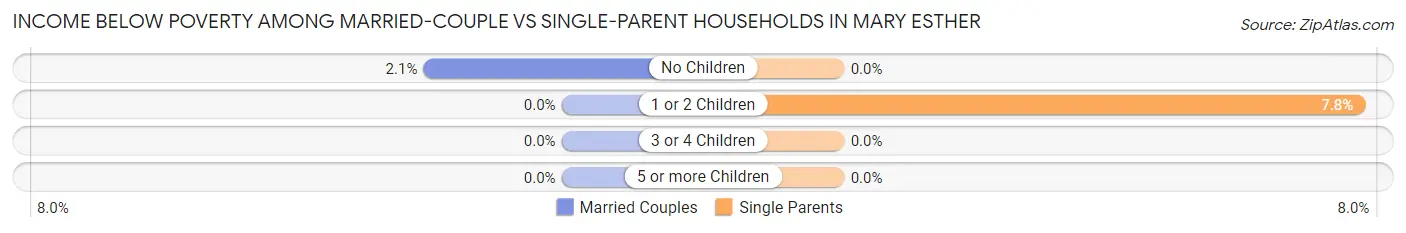
| Children | Married-Couple Families | Single-Parent Households |
| No Children | 12 (2.1%) | 0 (0.0%) |
| 1 or 2 Children | 0 (0.0%) | 8 (7.8%) |
| 3 or 4 Children | 0 (0.0%) | 0 (0.0%) |
| 5 or more Children | 0 (0.0%) | 0 (0.0%) |
| Total | 12 (1.5%) | 8 (3.5%) |
Race in Mary Esther
The most populous races in Mary Esther are White / Caucasian (2,973 | 74.0%), Two or more Races (394 | 9.8%), and Hispanic or Latino (390 | 9.7%).
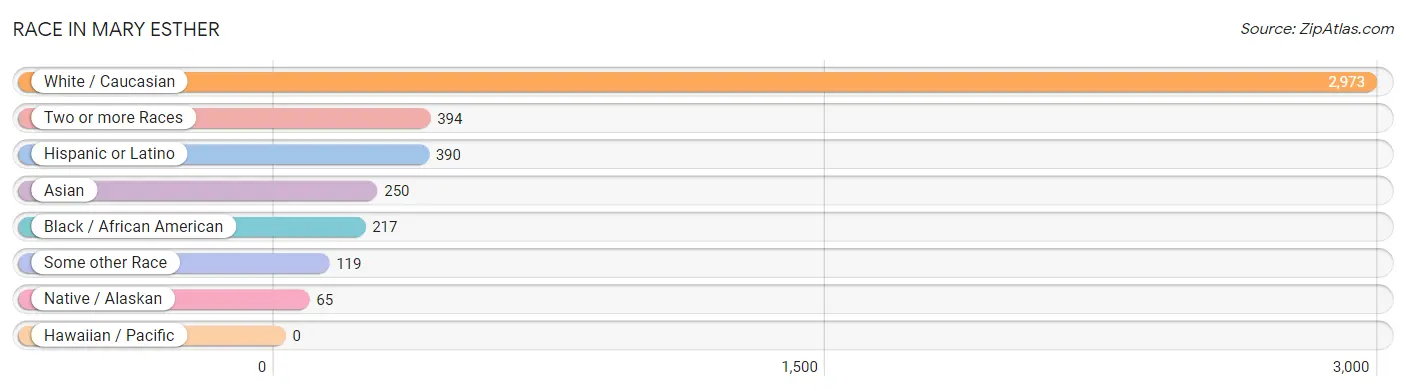
| Race | # Population | % Population |
| Asian | 250 | 6.2% |
| Black / African American | 217 | 5.4% |
| Hawaiian / Pacific | 0 | 0.0% |
| Hispanic or Latino | 390 | 9.7% |
| Native / Alaskan | 65 | 1.6% |
| White / Caucasian | 2,973 | 74.0% |
| Two or more Races | 394 | 9.8% |
| Some other Race | 119 | 3.0% |
| Total | 4,018 | 100.0% |
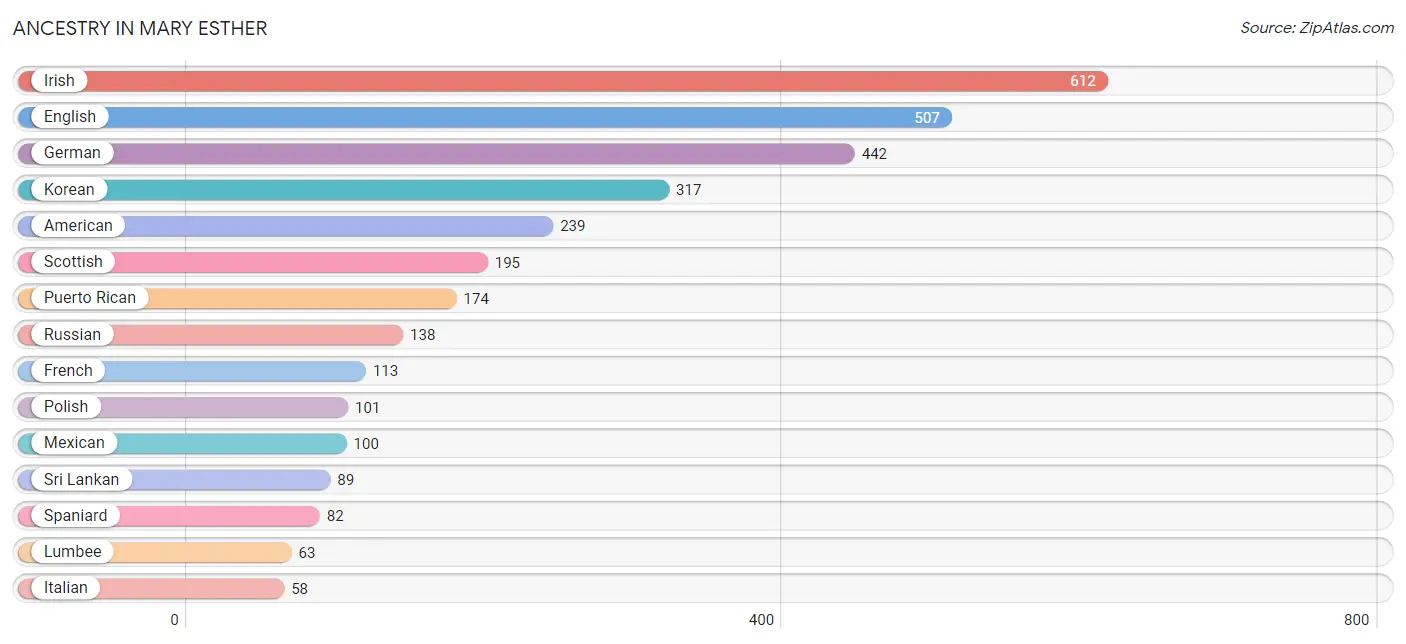
Ancestry in Mary Esther
The most populous ancestries reported in Mary Esther are Irish (612 | 15.2%), English (507 | 12.6%), German (442 | 11.0%), Korean (317 | 7.9%), and American (239 | 5.9%), together accounting for 52.7% of all Mary Esther residents.
| Ancestry | # Population | % Population |
| American | 239 | 5.9% |
| Arab | 12 | 0.3% |
| Belgian | 6 | 0.2% |
| Bhutanese | 7 | 0.2% |
| British | 47 | 1.2% |
| Cajun | 6 | 0.2% |
| Canadian | 10 | 0.3% |
| Cuban | 2 | 0.1% |
| Czech | 10 | 0.3% |
| Danish | 7 | 0.2% |
| Dutch | 42 | 1.1% |
| Ecuadorian | 10 | 0.3% |
| English | 507 | 12.6% |
| European | 19 | 0.5% |
| Filipino | 9 | 0.2% |
| French | 113 | 2.8% |
| French Canadian | 23 | 0.6% |
| German | 442 | 11.0% |
| Greek | 27 | 0.7% |
| Hungarian | 10 | 0.3% |
| Indian (Asian) | 45 | 1.1% |
| Irish | 612 | 15.2% |
| Italian | 58 | 1.4% |
| Korean | 317 | 7.9% |
| Lebanese | 12 | 0.3% |
| Lithuanian | 7 | 0.2% |
| Lumbee | 63 | 1.6% |
| Mexican | 100 | 2.5% |
| Native Hawaiian | 21 | 0.5% |
| Norwegian | 54 | 1.3% |
| Pakistani | 14 | 0.4% |
| Polish | 101 | 2.5% |
| Puerto Rican | 174 | 4.3% |
| Russian | 138 | 3.4% |
| Scandinavian | 22 | 0.5% |
| Scottish | 195 | 4.9% |
| Sioux | 2 | 0.1% |
| South African | 18 | 0.4% |
| South American | 10 | 0.3% |
| Spaniard | 82 | 2.0% |
| Spanish | 22 | 0.5% |
| Spanish American Indian | 5 | 0.1% |
| Sri Lankan | 89 | 2.2% |
| Subsaharan African | 18 | 0.4% |
| Swedish | 20 | 0.5% |
| Welsh | 28 | 0.7% | View All 46 Rows |
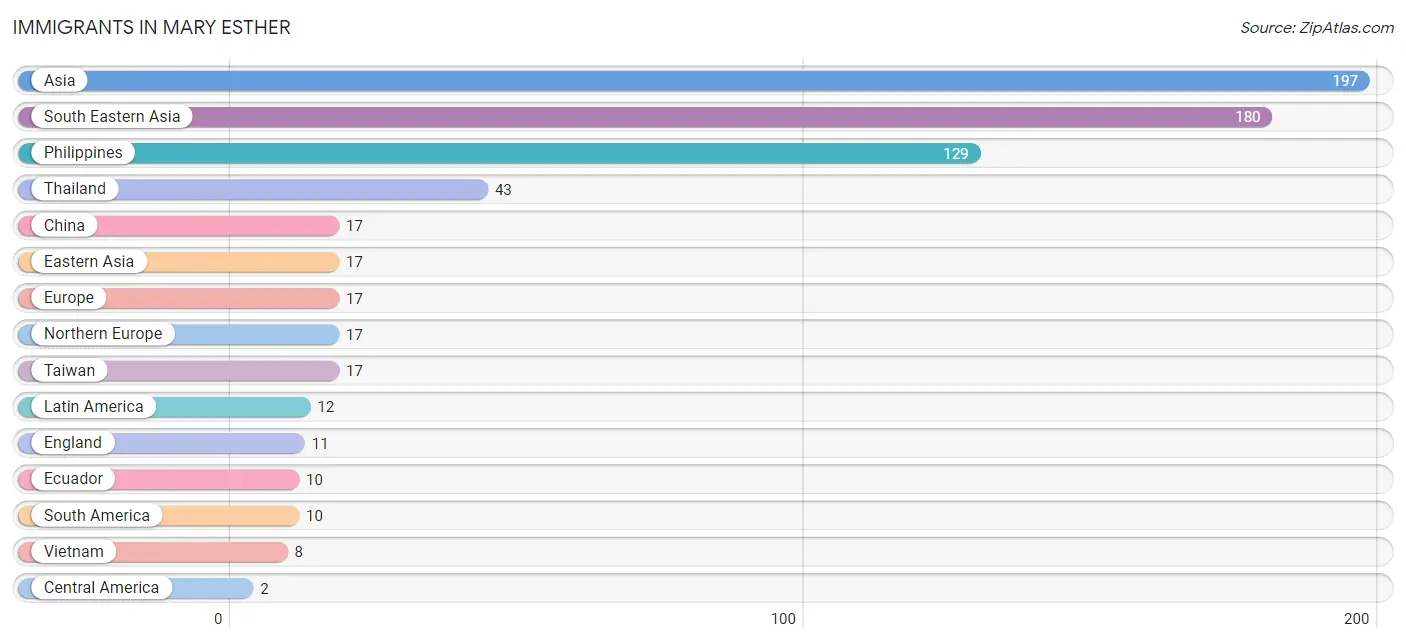
Immigrants in Mary Esther
The most numerous immigrant groups reported in Mary Esther came from Asia (197 | 4.9%), South Eastern Asia (180 | 4.5%), Philippines (129 | 3.2%), Thailand (43 | 1.1%), and China (17 | 0.4%), together accounting for 14.1% of all Mary Esther residents.
| Immigration Origin | # Population | % Population |
| Asia | 197 | 4.9% |
| Central America | 2 | 0.1% |
| China | 17 | 0.4% |
| Eastern Asia | 17 | 0.4% |
| Ecuador | 10 | 0.3% |
| England | 11 | 0.3% |
| Europe | 17 | 0.4% |
| Latin America | 12 | 0.3% |
| Mexico | 2 | 0.1% |
| Northern Europe | 17 | 0.4% |
| Philippines | 129 | 3.2% |
| South America | 10 | 0.3% |
| South Eastern Asia | 180 | 4.5% |
| Taiwan | 17 | 0.4% |
| Thailand | 43 | 1.1% |
| Vietnam | 8 | 0.2% | View All 16 Rows |
Sex and Age in Mary Esther
Sex and Age in Mary Esther
The most populous age groups in Mary Esther are 25 to 29 Years (234 | 12.4%) for men and 30 to 34 Years (205 | 9.6%) for women.
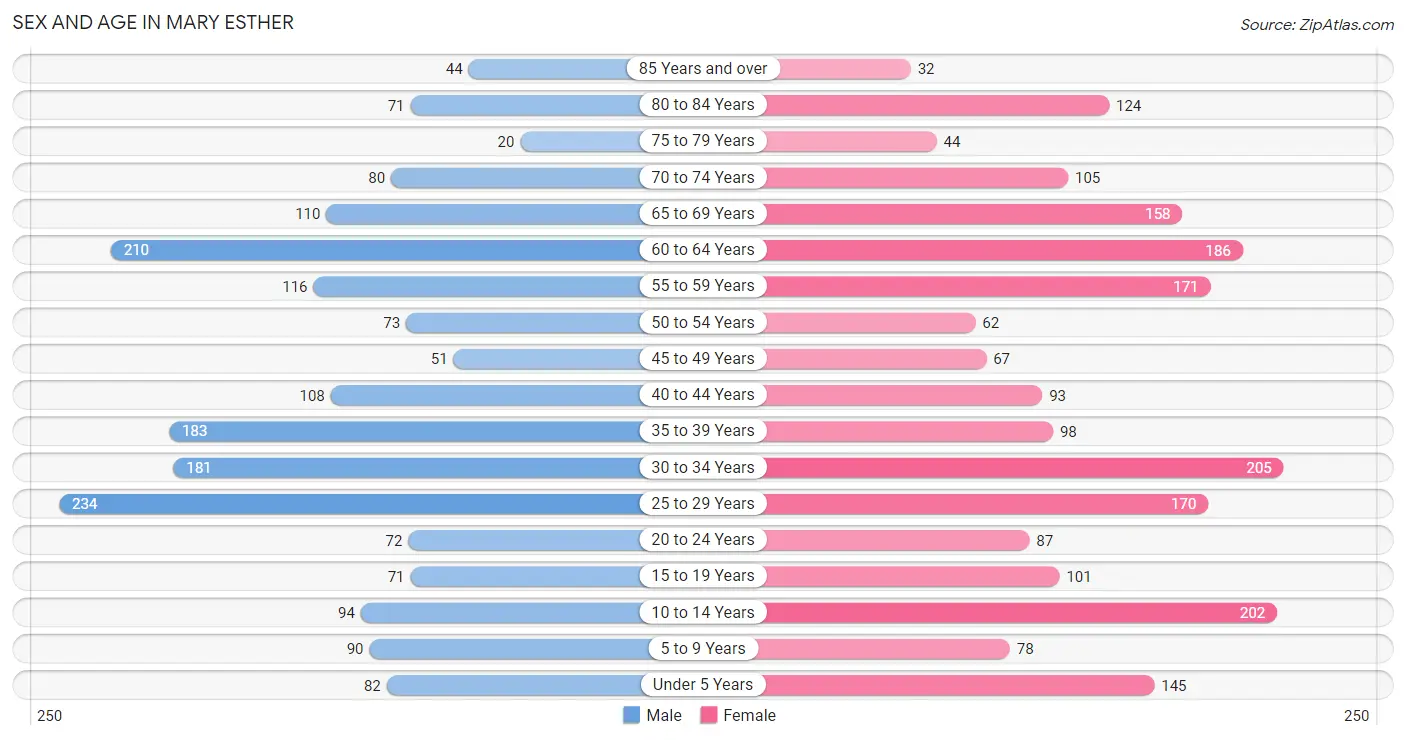
| Age Bracket | Male | Female |
| Under 5 Years | 82 (4.3%) | 145 (6.8%) |
| 5 to 9 Years | 90 (4.8%) | 78 (3.7%) |
| 10 to 14 Years | 94 (5.0%) | 202 (9.5%) |
| 15 to 19 Years | 71 (3.8%) | 101 (4.8%) |
| 20 to 24 Years | 72 (3.8%) | 87 (4.1%) |
| 25 to 29 Years | 234 (12.4%) | 170 (8.0%) |
| 30 to 34 Years | 181 (9.6%) | 205 (9.6%) |
| 35 to 39 Years | 183 (9.7%) | 98 (4.6%) |
| 40 to 44 Years | 108 (5.7%) | 93 (4.4%) |
| 45 to 49 Years | 51 (2.7%) | 67 (3.2%) |
| 50 to 54 Years | 73 (3.9%) | 62 (2.9%) |
| 55 to 59 Years | 116 (6.1%) | 171 (8.0%) |
| 60 to 64 Years | 210 (11.1%) | 186 (8.7%) |
| 65 to 69 Years | 110 (5.8%) | 158 (7.4%) |
| 70 to 74 Years | 80 (4.2%) | 105 (4.9%) |
| 75 to 79 Years | 20 (1.1%) | 44 (2.1%) |
| 80 to 84 Years | 71 (3.8%) | 124 (5.8%) |
| 85 Years and over | 44 (2.3%) | 32 (1.5%) |
| Total | 1,890 (100.0%) | 2,128 (100.0%) |
Families and Households in Mary Esther
Median Family Size in Mary Esther
The median family size in Mary Esther is 3.09 persons per family, with single male/father families (73 | 7.0%) accounting for the largest median family size of 3.56 persons per family. On the other hand, married-couple families (810 | 77.8%) represent the smallest median family size with 2.95 persons per family.
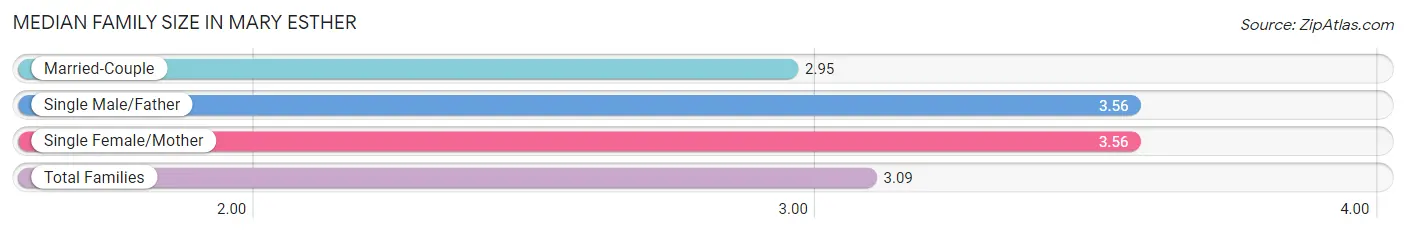
| Family Type | # Families | Family Size |
| Married-Couple | 810 (77.8%) | 2.95 |
| Single Male/Father | 73 (7.0%) | 3.56 |
| Single Female/Mother | 158 (15.2%) | 3.56 |
| Total Families | 1,041 (100.0%) | 3.09 |
Median Household Size in Mary Esther
The median household size in Mary Esther is 2.66 persons per household, with single male/father households (73 | 4.9%) accounting for the largest median household size of 5.27 persons per household. non-family households (463 | 30.8%) represent the smallest median household size with 1.30 persons per household.
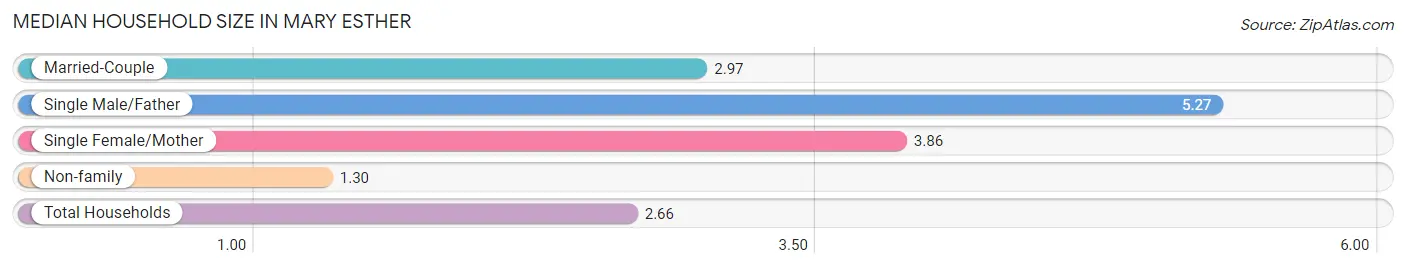
| Household Type | # Households | Household Size |
| Married-Couple | 810 (53.9%) | 2.97 |
| Single Male/Father | 73 (4.9%) | 5.27 |
| Single Female/Mother | 158 (10.5%) | 3.86 |
| Non-family | 463 (30.8%) | 1.30 |
| Total Households | 1,504 (100.0%) | 2.66 |
Household Size by Marriage Status in Mary Esther
Out of a total of 1,504 households in Mary Esther, 1,041 (69.2%) are family households, while 463 (30.8%) are nonfamily households. The most numerous type of family households are 2-person households, comprising 547, and the most common type of nonfamily households are 1-person households, comprising 354.
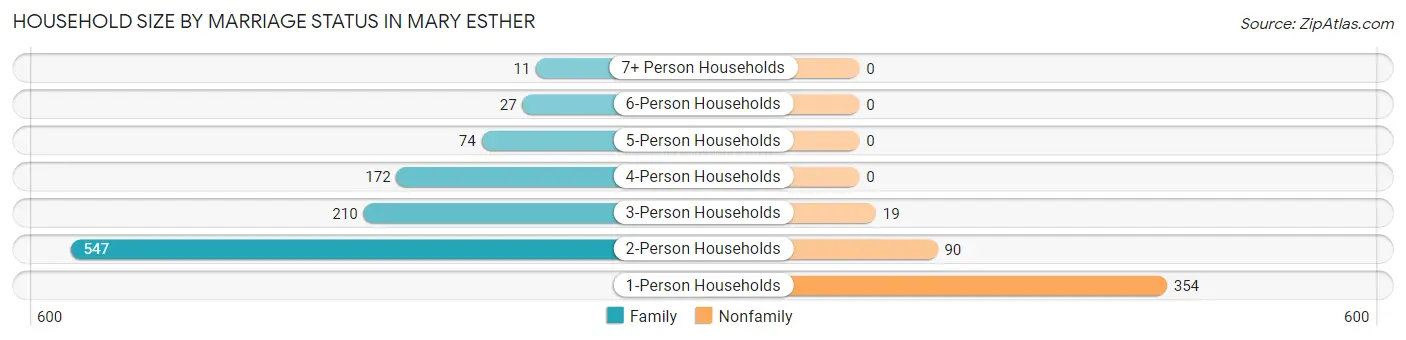
| Household Size | Family Households | Nonfamily Households |
| 1-Person Households | - | 354 (23.5%) |
| 2-Person Households | 547 (36.4%) | 90 (6.0%) |
| 3-Person Households | 210 (14.0%) | 19 (1.3%) |
| 4-Person Households | 172 (11.4%) | 0 (0.0%) |
| 5-Person Households | 74 (4.9%) | 0 (0.0%) |
| 6-Person Households | 27 (1.8%) | 0 (0.0%) |
| 7+ Person Households | 11 (0.7%) | 0 (0.0%) |
| Total | 1,041 (69.2%) | 463 (30.8%) |
Female Fertility in Mary Esther
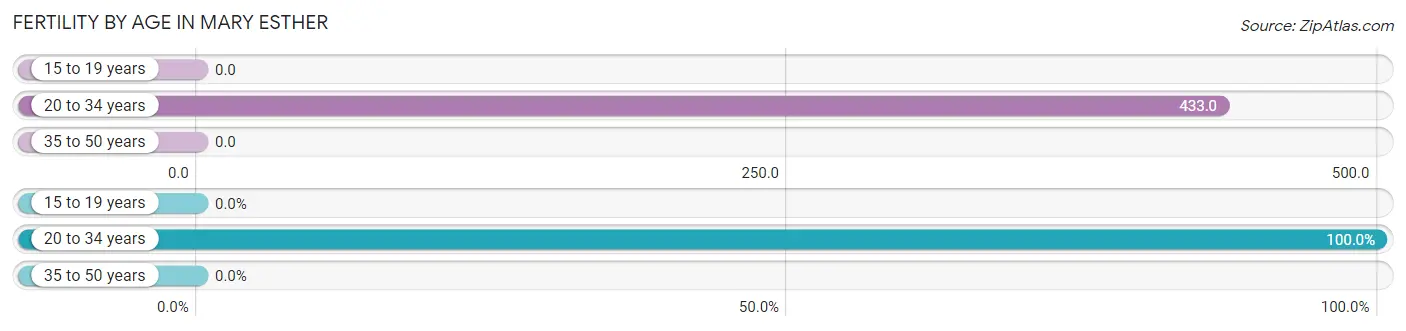
Fertility by Age in Mary Esther
Average fertility rate in Mary Esther is 237.0 births per 1,000 women. Women in the age bracket of 20 to 34 years have the highest fertility rate with 433.0 births per 1,000 women. Women in the age bracket of 20 to 34 years acount for 100.0% of all women with births.
| Age Bracket | Women with Births | Births / 1,000 Women |
| 15 to 19 years | 0 (0.0%) | 0.0 |
| 20 to 34 years | 200 (100.0%) | 433.0 |
| 35 to 50 years | 0 (0.0%) | 0.0 |
| Total | 200 (100.0%) | 237.0 |
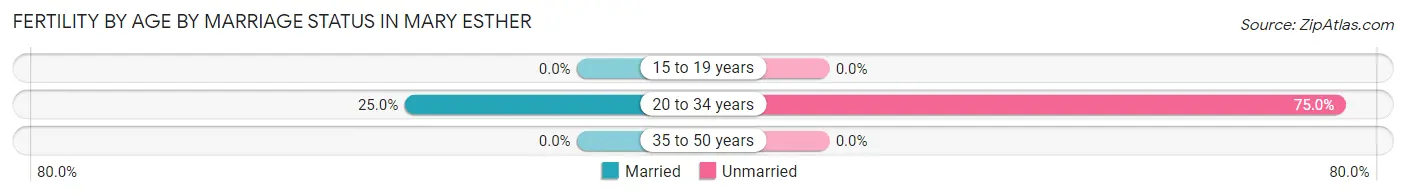
Fertility by Age by Marriage Status in Mary Esther
25.0% of women with births (200) in Mary Esther are married. The highest percentage of unmarried women with births falls into 20 to 34 years age bracket with 75.0% of them unmarried at the time of birth, while the lowest percentage of unmarried women with births belong to 20 to 34 years age bracket with 75.0% of them unmarried.
| Age Bracket | Married | Unmarried |
| 15 to 19 years | 0 (0.0%) | 0 (0.0%) |
| 20 to 34 years | 50 (25.0%) | 150 (75.0%) |
| 35 to 50 years | 0 (0.0%) | 0 (0.0%) |
| Total | 50 (25.0%) | 150 (75.0%) |
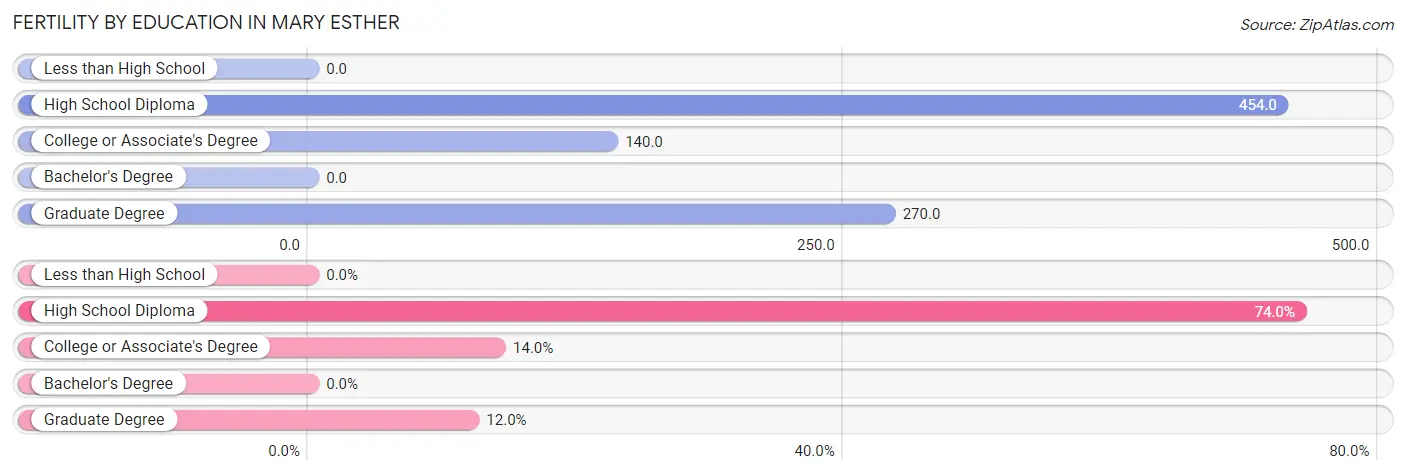
Fertility by Education in Mary Esther
| Educational Attainment | Women with Births | Births / 1,000 Women |
| Less than High School | 0 (0.0%) | 0.0 |
| High School Diploma | 148 (74.0%) | 454.0 |
| College or Associate's Degree | 28 (14.0%) | 140.0 |
| Bachelor's Degree | 0 (0.0%) | 0.0 |
| Graduate Degree | 24 (12.0%) | 270.0 |
| Total | 200 (100.0%) | 237.0 |
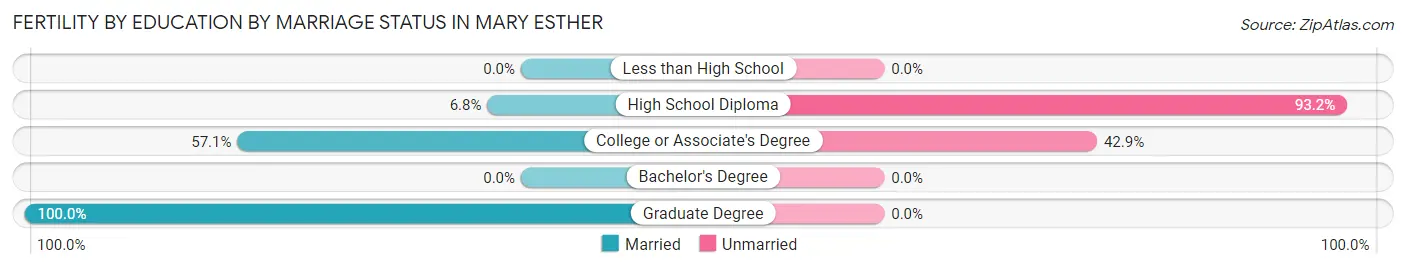
Fertility by Education by Marriage Status in Mary Esther
75.0% of women with births in Mary Esther are unmarried. Women with the educational attainment of graduate degree are most likely to be married with 100.0% of them married at childbirth, while women with the educational attainment of high school diploma are least likely to be married with 93.2% of them unmarried at childbirth.
| Educational Attainment | Married | Unmarried |
| Less than High School | 0 (0.0%) | 0 (0.0%) |
| High School Diploma | 10 (6.8%) | 138 (93.2%) |
| College or Associate's Degree | 16 (57.1%) | 12 (42.9%) |
| Bachelor's Degree | 0 (0.0%) | 0 (0.0%) |
| Graduate Degree | 24 (100.0%) | 0 (0.0%) |
| Total | 50 (25.0%) | 150 (75.0%) |
Employment Characteristics in Mary Esther
Employment by Class of Employer in Mary Esther
Among the 1,951 employed individuals in Mary Esther, private company employees (1,237 | 63.4%), federal government employees (308 | 15.8%), and self-employed (not incorporated) (119 | 6.1%) make up the most common classes of employment.
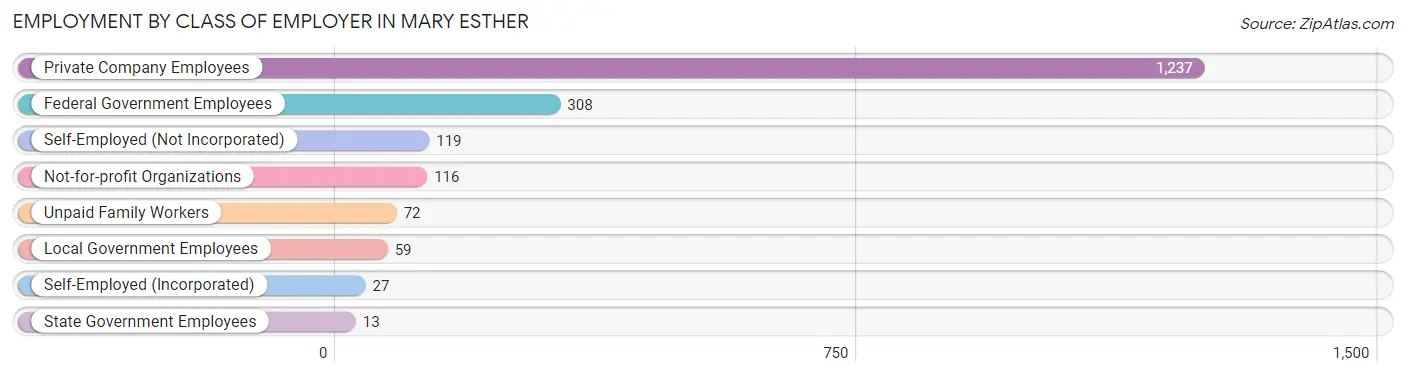
| Employer Class | # Employees | % Employees |
| Private Company Employees | 1,237 | 63.4% |
| Self-Employed (Incorporated) | 27 | 1.4% |
| Self-Employed (Not Incorporated) | 119 | 6.1% |
| Not-for-profit Organizations | 116 | 5.9% |
| Local Government Employees | 59 | 3.0% |
| State Government Employees | 13 | 0.7% |
| Federal Government Employees | 308 | 15.8% |
| Unpaid Family Workers | 72 | 3.7% |
| Total | 1,951 | 100.0% |
Employment Status by Age in Mary Esther
According to the labor force statistics for Mary Esther, out of the total population over 16 years of age (3,275), 65.0% or 2,129 individuals are in the labor force, with 6.4% or 136 of them unemployed. The age group with the highest labor force participation rate is 45 to 54 years, with 94.1% or 238 individuals in the labor force. Within the labor force, the 35 to 44 years age range has the highest percentage of unemployed individuals, with 23.0% or 95 of them being unemployed.
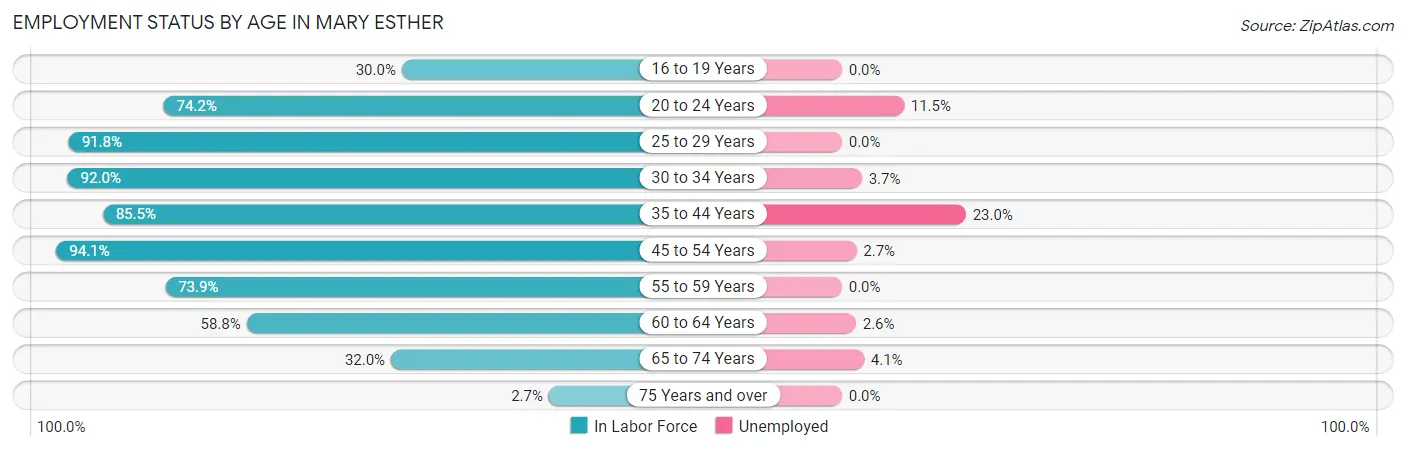
| Age Bracket | In Labor Force | Unemployed |
| 16 to 19 Years | 36 (30.0%) | 0 (0.0%) |
| 20 to 24 Years | 118 (74.2%) | 14 (11.5%) |
| 25 to 29 Years | 371 (91.8%) | 0 (0.0%) |
| 30 to 34 Years | 355 (92.0%) | 13 (3.7%) |
| 35 to 44 Years | 412 (85.5%) | 95 (23.0%) |
| 45 to 54 Years | 238 (94.1%) | 6 (2.7%) |
| 55 to 59 Years | 212 (73.9%) | 0 (0.0%) |
| 60 to 64 Years | 233 (58.8%) | 6 (2.6%) |
| 65 to 74 Years | 145 (32.0%) | 6 (4.1%) |
| 75 Years and over | 9 (2.7%) | 0 (0.0%) |
| Total | 2,129 (65.0%) | 136 (6.4%) |
Employment Status by Educational Attainment in Mary Esther
According to labor force statistics for Mary Esther, 82.5% of individuals (1,822) out of the total population between 25 and 64 years of age (2,208) are in the labor force, with 6.4% or 117 of them being unemployed. The group with the highest labor force participation rate are those with the educational attainment of bachelor's degree or higher, with 96.6% or 649 individuals in the labor force. Within the labor force, individuals with high school diploma education have the highest percentage of unemployment, with 12.6% or 84 of them being unemployed.
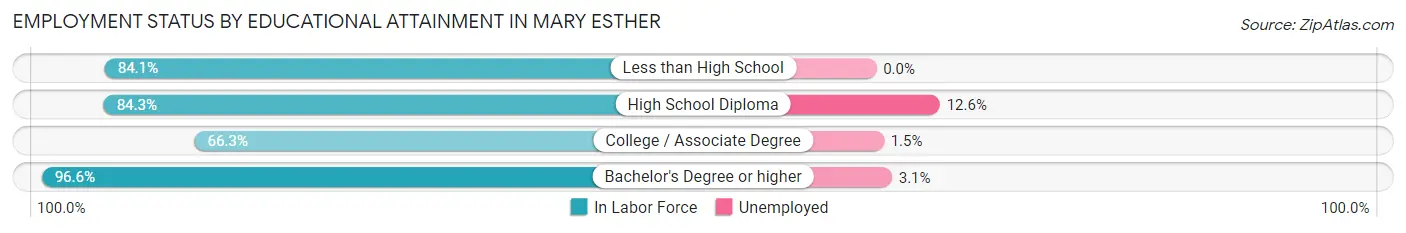
| Educational Attainment | In Labor Force | Unemployed |
| Less than High School | 53 (84.1%) | 0 (0.0%) |
| High School Diploma | 666 (84.3%) | 100 (12.6%) |
| College / Associate Degree | 453 (66.3%) | 10 (1.5%) |
| Bachelor's Degree or higher | 649 (96.6%) | 21 (3.1%) |
| Total | 1,822 (82.5%) | 141 (6.4%) |
Employment Occupations by Sex in Mary Esther
Management, Business, Science and Arts Occupations
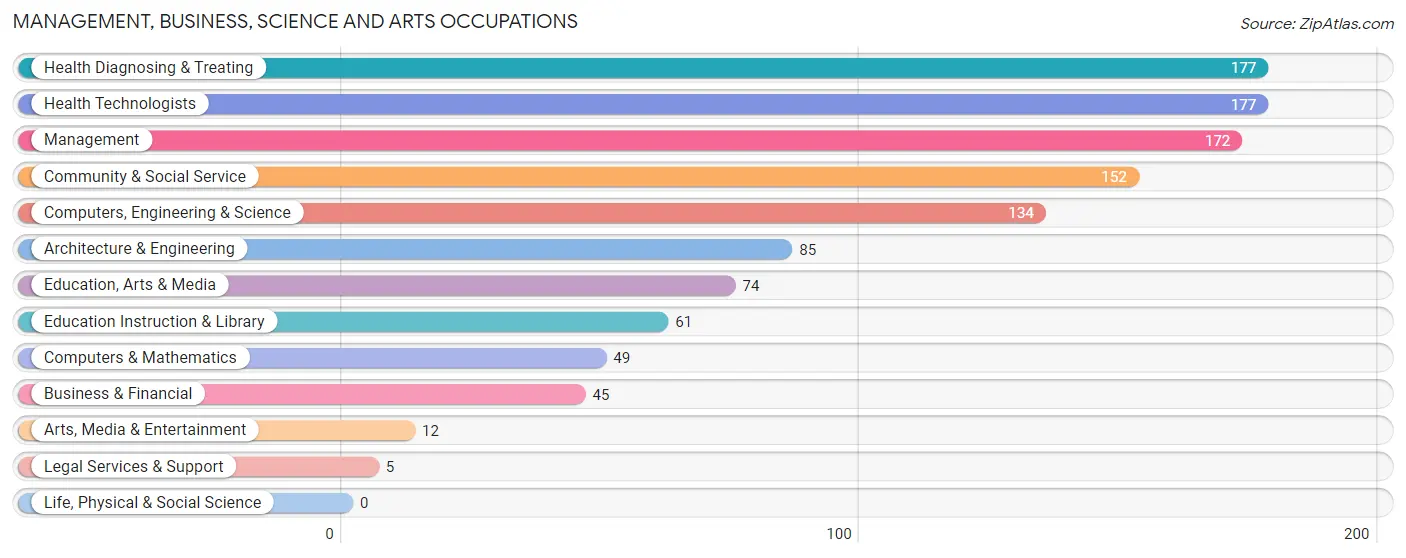
The most common Management, Business, Science and Arts occupations in Mary Esther are Health Diagnosing & Treating (177 | 9.8%), Health Technologists (177 | 9.8%), Management (172 | 9.5%), Community & Social Service (152 | 8.4%), and Computers, Engineering & Science (134 | 7.4%).
Management, Business, Science and Arts Occupations by Sex
Within the Management, Business, Science and Arts occupations in Mary Esther, the most male-oriented occupations are Management (82.6%), Computers & Mathematics (75.5%), and Computers, Engineering & Science (74.6%), while the most female-oriented occupations are Legal Services & Support (100.0%), Arts, Media & Entertainment (100.0%), and Health Diagnosing & Treating (88.7%).
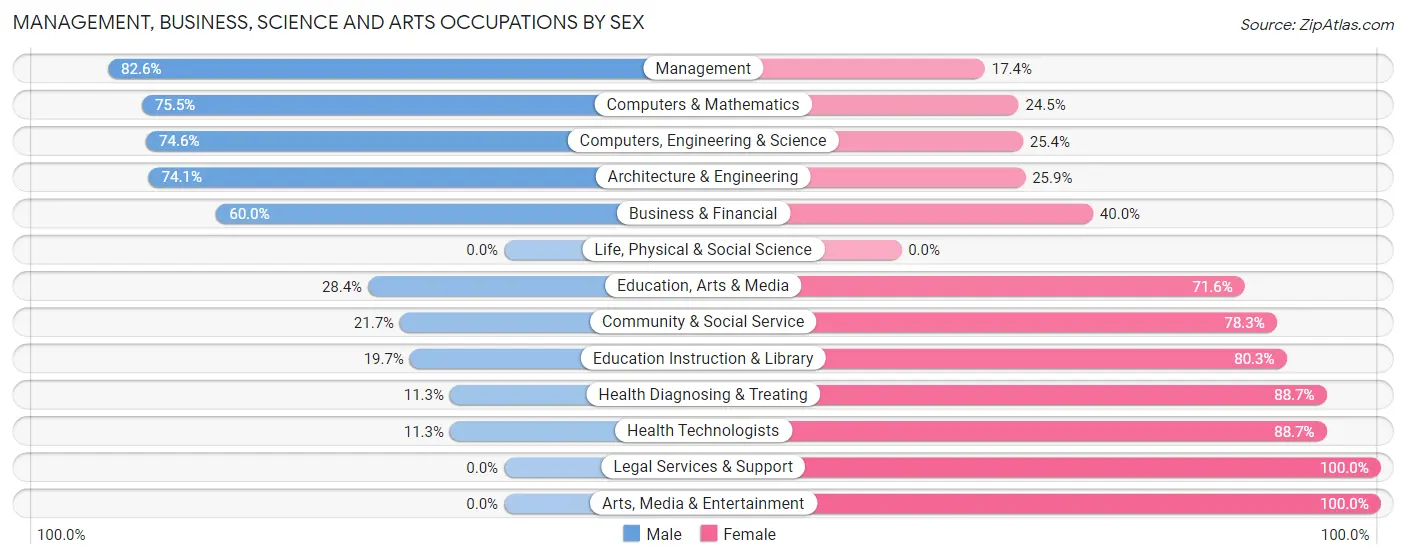
| Occupation | Male | Female |
| Management | 142 (82.6%) | 30 (17.4%) |
| Business & Financial | 27 (60.0%) | 18 (40.0%) |
| Computers, Engineering & Science | 100 (74.6%) | 34 (25.4%) |
| Computers & Mathematics | 37 (75.5%) | 12 (24.5%) |
| Architecture & Engineering | 63 (74.1%) | 22 (25.9%) |
| Life, Physical & Social Science | 0 (0.0%) | 0 (0.0%) |
| Community & Social Service | 33 (21.7%) | 119 (78.3%) |
| Education, Arts & Media | 21 (28.4%) | 53 (71.6%) |
| Legal Services & Support | 0 (0.0%) | 5 (100.0%) |
| Education Instruction & Library | 12 (19.7%) | 49 (80.3%) |
| Arts, Media & Entertainment | 0 (0.0%) | 12 (100.0%) |
| Health Diagnosing & Treating | 20 (11.3%) | 157 (88.7%) |
| Health Technologists | 20 (11.3%) | 157 (88.7%) |
| Total (Category) | 322 (47.3%) | 358 (52.6%) |
| Total (Overall) | 822 (45.3%) | 991 (54.7%) |
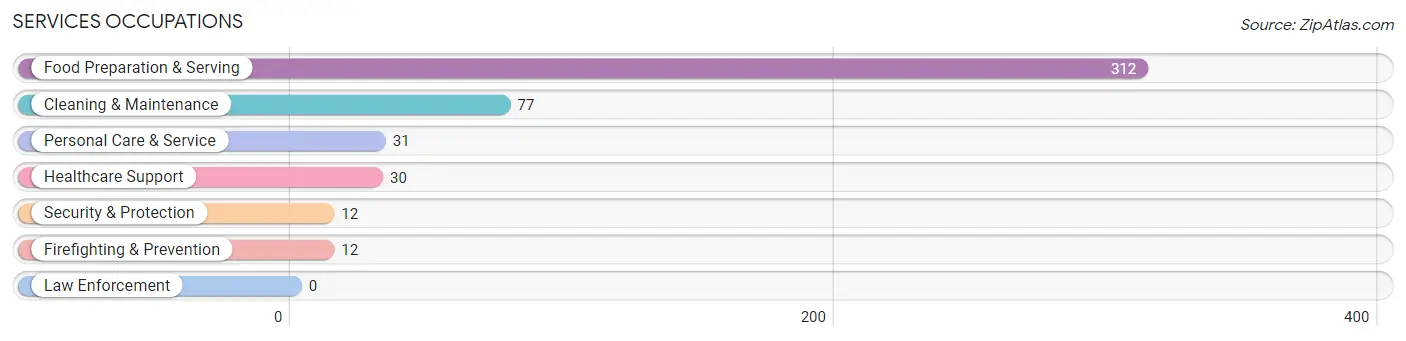
Services Occupations
The most common Services occupations in Mary Esther are Food Preparation & Serving (312 | 17.2%), Cleaning & Maintenance (77 | 4.3%), Personal Care & Service (31 | 1.7%), Healthcare Support (30 | 1.7%), and Security & Protection (12 | 0.7%).
Services Occupations by Sex
Within the Services occupations in Mary Esther, the most male-oriented occupations are Cleaning & Maintenance (68.8%), Food Preparation & Serving (34.3%), and Security & Protection (33.3%), while the most female-oriented occupations are Healthcare Support (100.0%), Personal Care & Service (100.0%), and Security & Protection (66.7%).
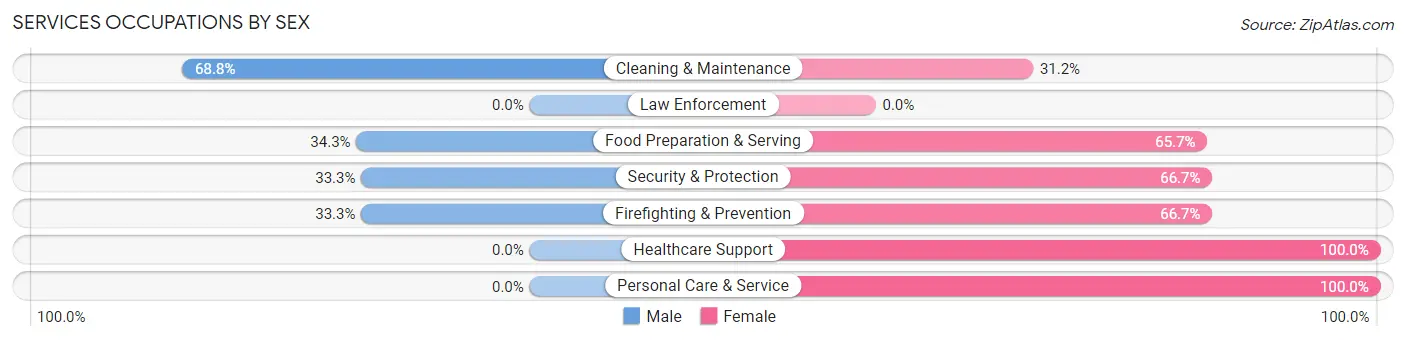
| Occupation | Male | Female |
| Healthcare Support | 0 (0.0%) | 30 (100.0%) |
| Security & Protection | 4 (33.3%) | 8 (66.7%) |
| Firefighting & Prevention | 4 (33.3%) | 8 (66.7%) |
| Law Enforcement | 0 (0.0%) | 0 (0.0%) |
| Food Preparation & Serving | 107 (34.3%) | 205 (65.7%) |
| Cleaning & Maintenance | 53 (68.8%) | 24 (31.2%) |
| Personal Care & Service | 0 (0.0%) | 31 (100.0%) |
| Total (Category) | 164 (35.5%) | 298 (64.5%) |
| Total (Overall) | 822 (45.3%) | 991 (54.7%) |
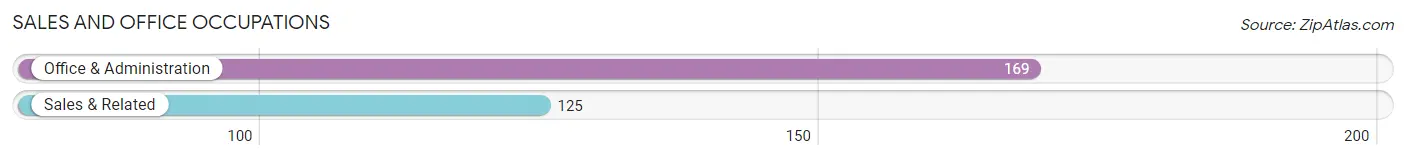
Sales and Office Occupations
The most common Sales and Office occupations in Mary Esther are Office & Administration (169 | 9.3%), and Sales & Related (125 | 6.9%).
Sales and Office Occupations by Sex
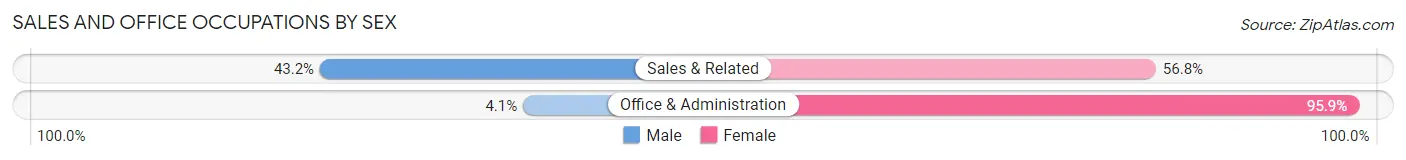
| Occupation | Male | Female |
| Sales & Related | 54 (43.2%) | 71 (56.8%) |
| Office & Administration | 7 (4.1%) | 162 (95.9%) |
| Total (Category) | 61 (20.7%) | 233 (79.2%) |
| Total (Overall) | 822 (45.3%) | 991 (54.7%) |
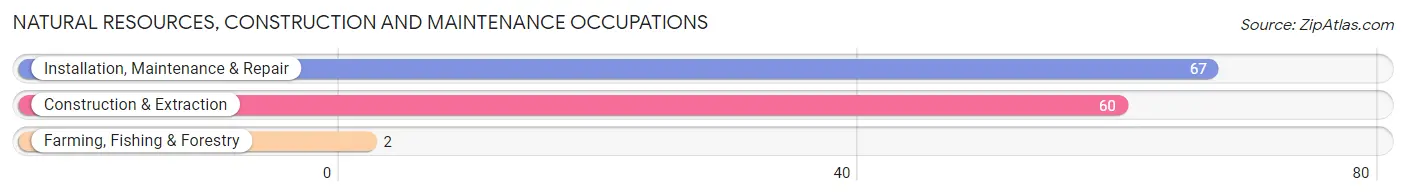
Natural Resources, Construction and Maintenance Occupations
The most common Natural Resources, Construction and Maintenance occupations in Mary Esther are Installation, Maintenance & Repair (67 | 3.7%), Construction & Extraction (60 | 3.3%), and Farming, Fishing & Forestry (2 | 0.1%).
Natural Resources, Construction and Maintenance Occupations by Sex
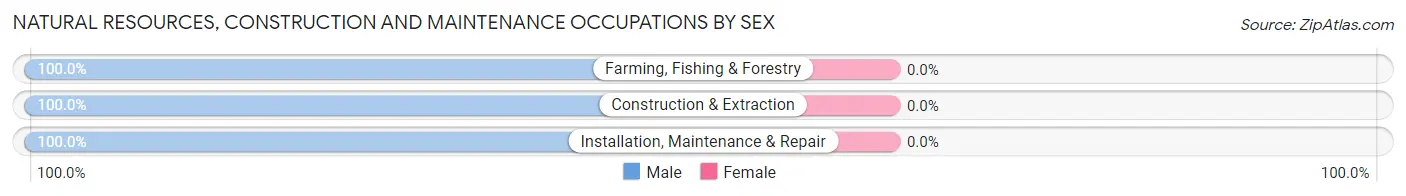
| Occupation | Male | Female |
| Farming, Fishing & Forestry | 2 (100.0%) | 0 (0.0%) |
| Construction & Extraction | 60 (100.0%) | 0 (0.0%) |
| Installation, Maintenance & Repair | 67 (100.0%) | 0 (0.0%) |
| Total (Category) | 129 (100.0%) | 0 (0.0%) |
| Total (Overall) | 822 (45.3%) | 991 (54.7%) |
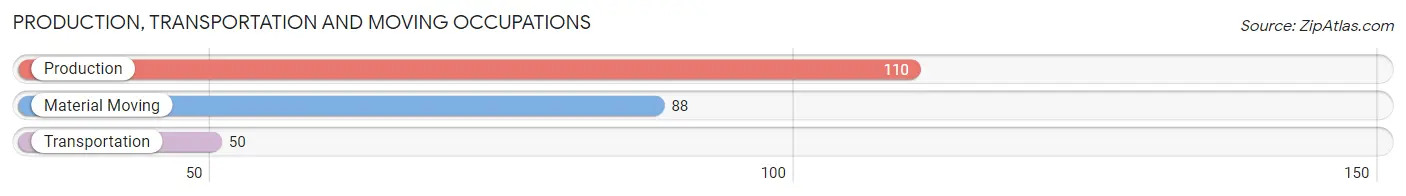
Production, Transportation and Moving Occupations
The most common Production, Transportation and Moving occupations in Mary Esther are Production (110 | 6.1%), Material Moving (88 | 4.9%), and Transportation (50 | 2.8%).
Production, Transportation and Moving Occupations by Sex
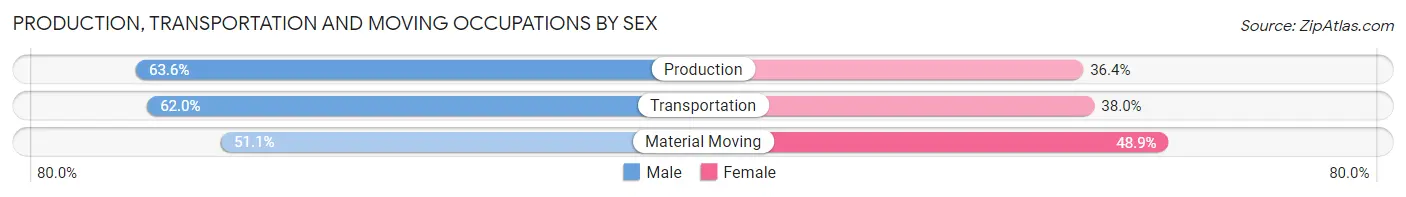
| Occupation | Male | Female |
| Production | 70 (63.6%) | 40 (36.4%) |
| Transportation | 31 (62.0%) | 19 (38.0%) |
| Material Moving | 45 (51.1%) | 43 (48.9%) |
| Total (Category) | 146 (58.9%) | 102 (41.1%) |
| Total (Overall) | 822 (45.3%) | 991 (54.7%) |
Employment Industries by Sex in Mary Esther
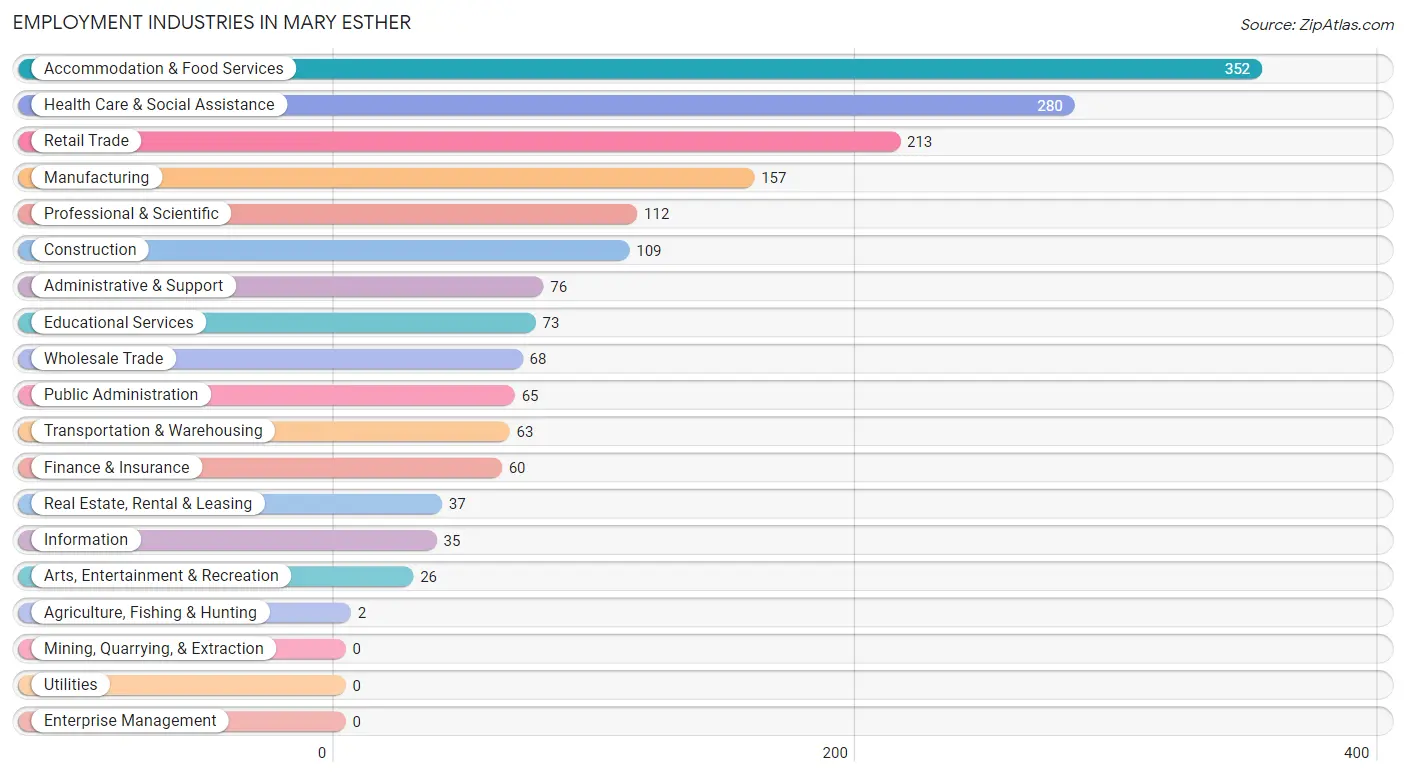
Employment Industries in Mary Esther
The major employment industries in Mary Esther include Accommodation & Food Services (352 | 19.4%), Health Care & Social Assistance (280 | 15.4%), Retail Trade (213 | 11.7%), Manufacturing (157 | 8.7%), and Professional & Scientific (112 | 6.2%).
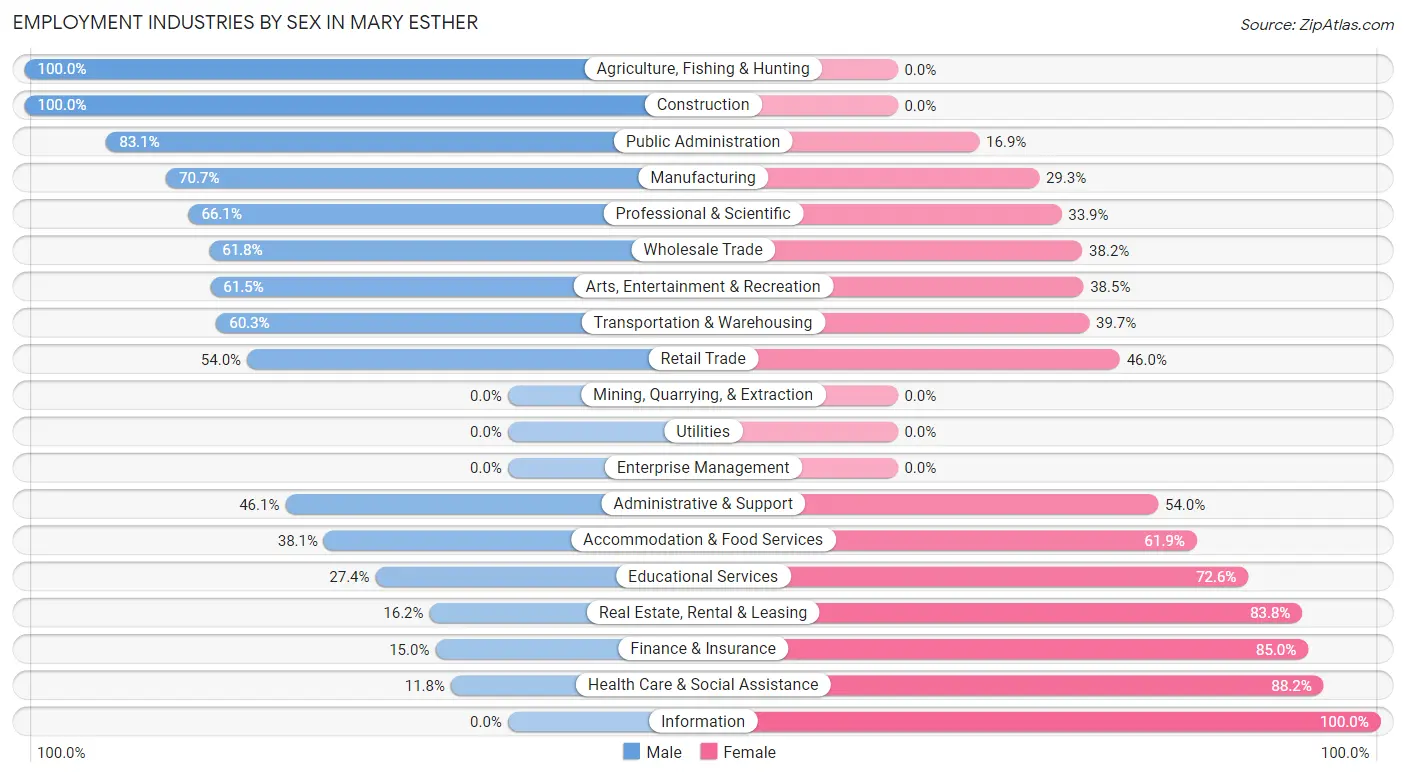
Employment Industries by Sex in Mary Esther
The Mary Esther industries that see more men than women are Agriculture, Fishing & Hunting (100.0%), Construction (100.0%), and Public Administration (83.1%), whereas the industries that tend to have a higher number of women are Information (100.0%), Health Care & Social Assistance (88.2%), and Finance & Insurance (85.0%).
| Industry | Male | Female |
| Agriculture, Fishing & Hunting | 2 (100.0%) | 0 (0.0%) |
| Mining, Quarrying, & Extraction | 0 (0.0%) | 0 (0.0%) |
| Construction | 109 (100.0%) | 0 (0.0%) |
| Manufacturing | 111 (70.7%) | 46 (29.3%) |
| Wholesale Trade | 42 (61.8%) | 26 (38.2%) |
| Retail Trade | 115 (54.0%) | 98 (46.0%) |
| Transportation & Warehousing | 38 (60.3%) | 25 (39.7%) |
| Utilities | 0 (0.0%) | 0 (0.0%) |
| Information | 0 (0.0%) | 35 (100.0%) |
| Finance & Insurance | 9 (15.0%) | 51 (85.0%) |
| Real Estate, Rental & Leasing | 6 (16.2%) | 31 (83.8%) |
| Professional & Scientific | 74 (66.1%) | 38 (33.9%) |
| Enterprise Management | 0 (0.0%) | 0 (0.0%) |
| Administrative & Support | 35 (46.1%) | 41 (53.9%) |
| Educational Services | 20 (27.4%) | 53 (72.6%) |
| Health Care & Social Assistance | 33 (11.8%) | 247 (88.2%) |
| Arts, Entertainment & Recreation | 16 (61.5%) | 10 (38.5%) |
| Accommodation & Food Services | 134 (38.1%) | 218 (61.9%) |
| Public Administration | 54 (83.1%) | 11 (16.9%) |
| Total | 822 (45.3%) | 991 (54.7%) |
Education in Mary Esther
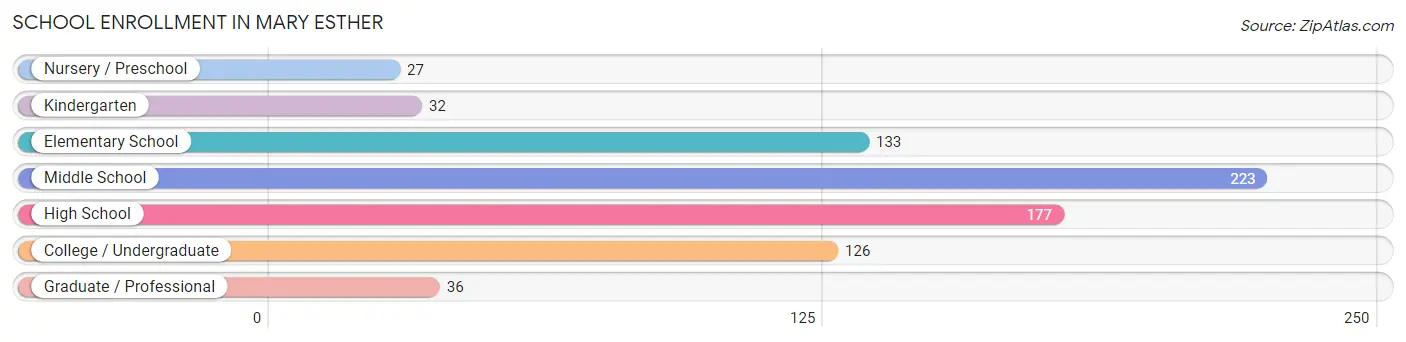
School Enrollment in Mary Esther
The most common levels of schooling among the 754 students in Mary Esther are middle school (223 | 29.6%), high school (177 | 23.5%), and elementary school (133 | 17.6%).
| School Level | # Students | % Students |
| Nursery / Preschool | 27 | 3.6% |
| Kindergarten | 32 | 4.2% |
| Elementary School | 133 | 17.6% |
| Middle School | 223 | 29.6% |
| High School | 177 | 23.5% |
| College / Undergraduate | 126 | 16.7% |
| Graduate / Professional | 36 | 4.8% |
| Total | 754 | 100.0% |
School Enrollment by Age by Funding Source in Mary Esther
Out of a total of 754 students who are enrolled in schools in Mary Esther, 68 (9.0%) attend a private institution, while the remaining 686 (91.0%) are enrolled in public schools. The age group of 25 to 34 year olds has the highest likelihood of being enrolled in private schools, with 7 (18.4% in the age bracket) enrolled. Conversely, the age group of 3 to 4 year olds has the lowest likelihood of being enrolled in a private school, with 20 (100.0% in the age bracket) attending a public institution.
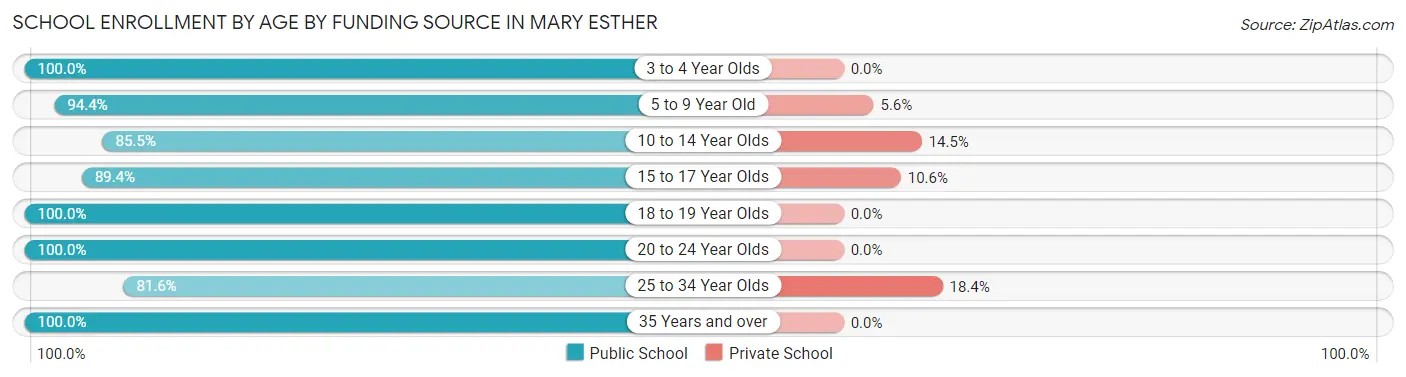
| Age Bracket | Public School | Private School |
| 3 to 4 Year Olds | 20 (100.0%) | 0 (0.0%) |
| 5 to 9 Year Old | 136 (94.4%) | 8 (5.6%) |
| 10 to 14 Year Olds | 253 (85.5%) | 43 (14.5%) |
| 15 to 17 Year Olds | 84 (89.4%) | 10 (10.6%) |
| 18 to 19 Year Olds | 38 (100.0%) | 0 (0.0%) |
| 20 to 24 Year Olds | 66 (100.0%) | 0 (0.0%) |
| 25 to 34 Year Olds | 31 (81.6%) | 7 (18.4%) |
| 35 Years and over | 58 (100.0%) | 0 (0.0%) |
| Total | 686 (91.0%) | 68 (9.0%) |
Educational Attainment by Field of Study in Mary Esther
Business (169 | 15.0%), science & technology (140 | 12.4%), engineering (135 | 12.0%), education (132 | 11.7%), and psychology (91 | 8.1%) are the most common fields of study among 1,125 individuals in Mary Esther who have obtained a bachelor's degree or higher.
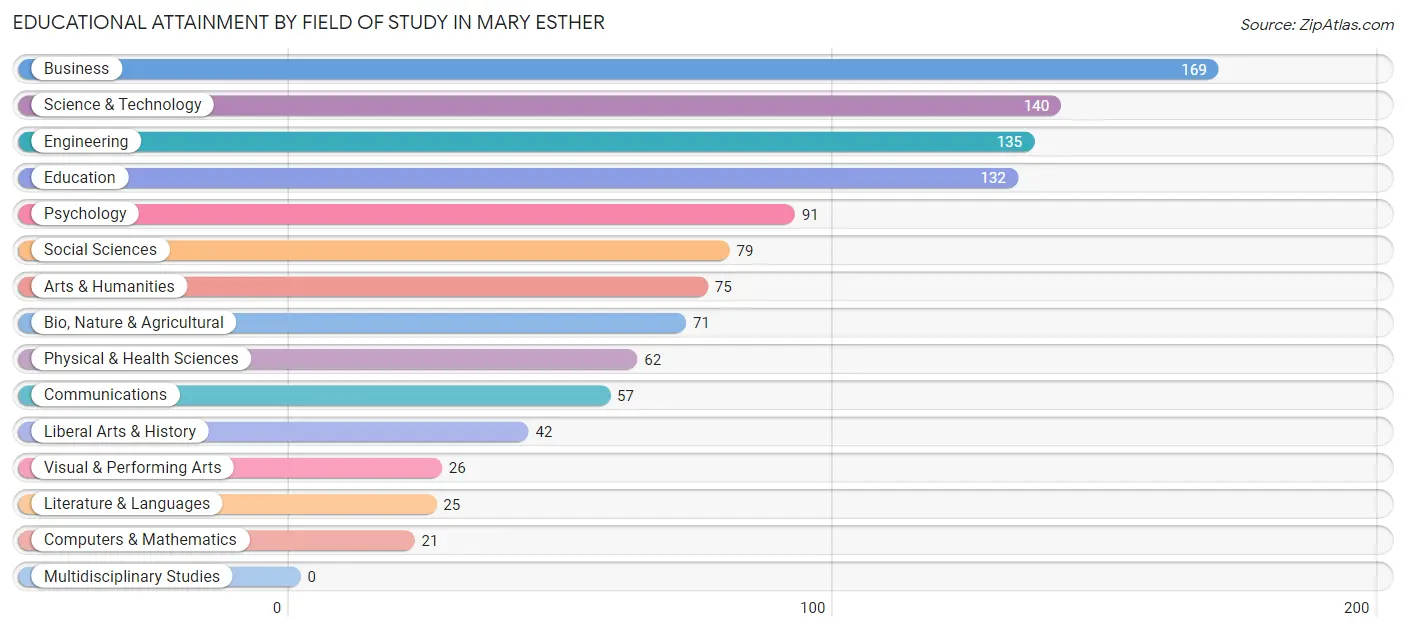
| Field of Study | # Graduates | % Graduates |
| Computers & Mathematics | 21 | 1.9% |
| Bio, Nature & Agricultural | 71 | 6.3% |
| Physical & Health Sciences | 62 | 5.5% |
| Psychology | 91 | 8.1% |
| Social Sciences | 79 | 7.0% |
| Engineering | 135 | 12.0% |
| Multidisciplinary Studies | 0 | 0.0% |
| Science & Technology | 140 | 12.4% |
| Business | 169 | 15.0% |
| Education | 132 | 11.7% |
| Literature & Languages | 25 | 2.2% |
| Liberal Arts & History | 42 | 3.7% |
| Visual & Performing Arts | 26 | 2.3% |
| Communications | 57 | 5.1% |
| Arts & Humanities | 75 | 6.7% |
| Total | 1,125 | 100.0% |
Transportation & Commute in Mary Esther
Vehicle Availability by Sex in Mary Esther
The most prevalent vehicle ownership categories in Mary Esther are males with 2 vehicles (532, accounting for 55.5%) and females with 2 vehicles (486, making up 53.8%).
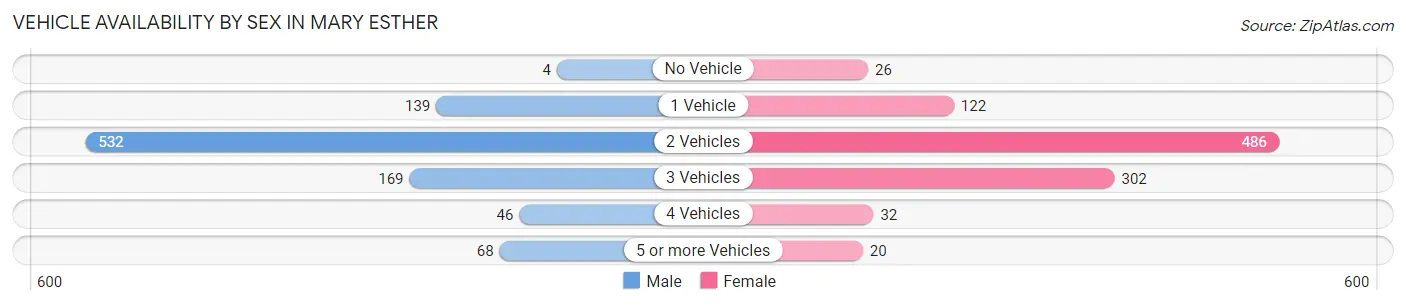
| Vehicles Available | Male | Female |
| No Vehicle | 4 (0.4%) | 26 (2.6%) |
| 1 Vehicle | 139 (14.5%) | 122 (12.3%) |
| 2 Vehicles | 532 (55.5%) | 486 (49.2%) |
| 3 Vehicles | 169 (17.6%) | 302 (30.6%) |
| 4 Vehicles | 46 (4.8%) | 32 (3.2%) |
| 5 or more Vehicles | 68 (7.1%) | 20 (2.0%) |
| Total | 958 (100.0%) | 988 (100.0%) |
Commute Time in Mary Esther
The most frequently occuring commute durations in Mary Esther are 5 to 9 minutes (443 commuters, 24.1%), 10 to 14 minutes (320 commuters, 17.4%), and 15 to 19 minutes (307 commuters, 16.7%).
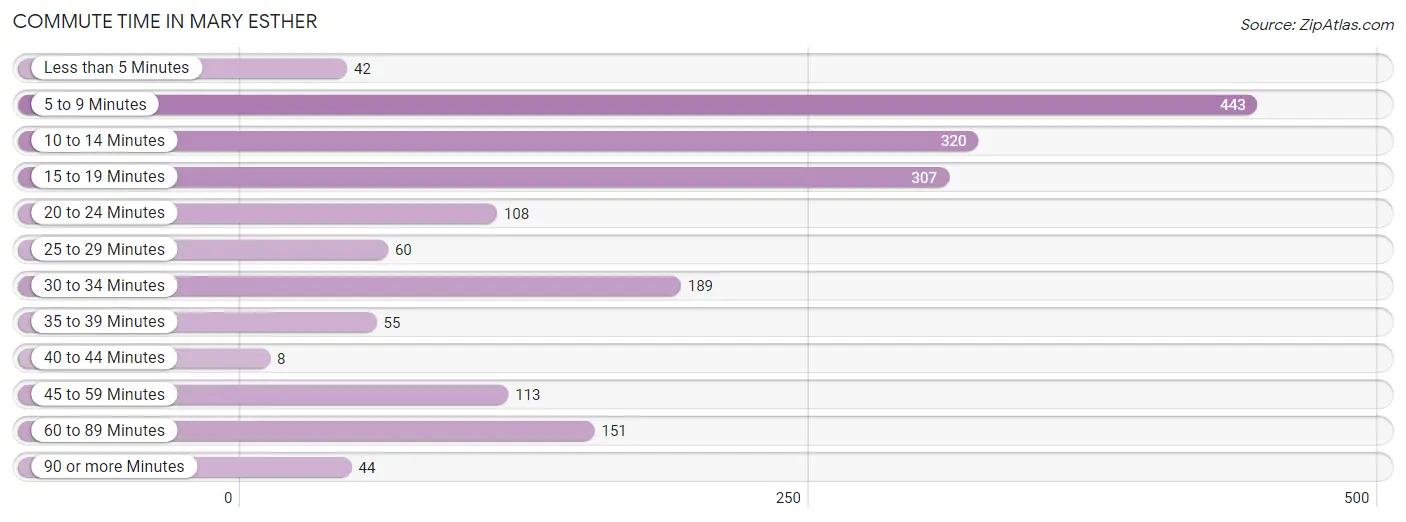
| Commute Time | # Commuters | % Commuters |
| Less than 5 Minutes | 42 | 2.3% |
| 5 to 9 Minutes | 443 | 24.1% |
| 10 to 14 Minutes | 320 | 17.4% |
| 15 to 19 Minutes | 307 | 16.7% |
| 20 to 24 Minutes | 108 | 5.9% |
| 25 to 29 Minutes | 60 | 3.3% |
| 30 to 34 Minutes | 189 | 10.3% |
| 35 to 39 Minutes | 55 | 3.0% |
| 40 to 44 Minutes | 8 | 0.4% |
| 45 to 59 Minutes | 113 | 6.1% |
| 60 to 89 Minutes | 151 | 8.2% |
| 90 or more Minutes | 44 | 2.4% |
Commute Time by Sex in Mary Esther
The most common commute times in Mary Esther are 5 to 9 minutes (195 commuters, 21.9%) for males and 5 to 9 minutes (248 commuters, 26.1%) for females.
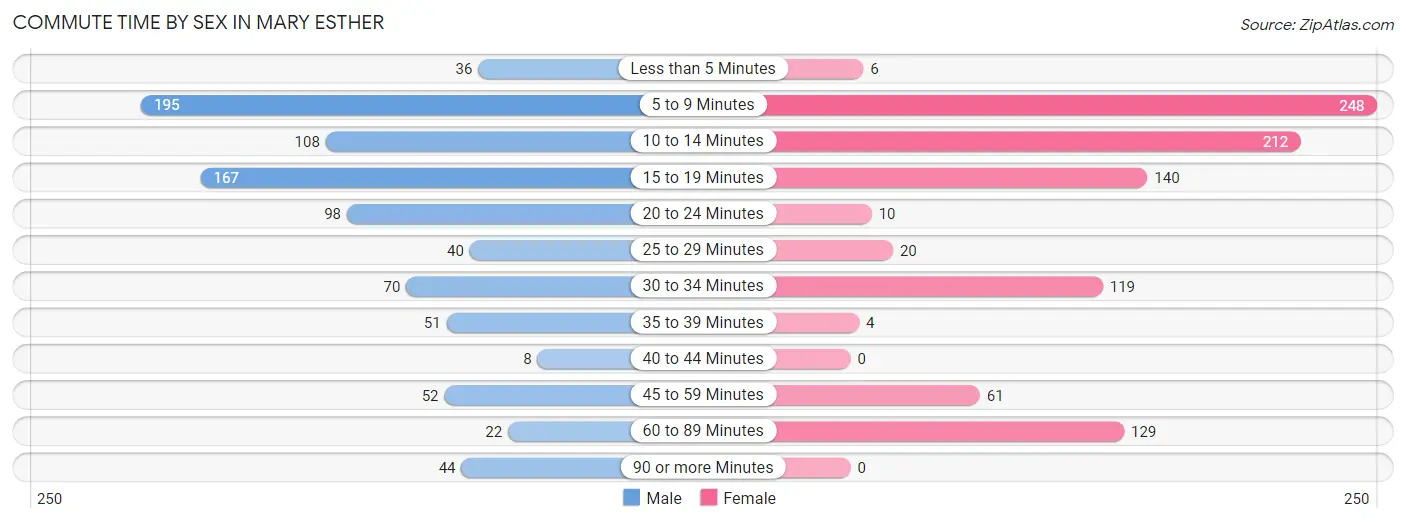
| Commute Time | Male | Female |
| Less than 5 Minutes | 36 (4.0%) | 6 (0.6%) |
| 5 to 9 Minutes | 195 (21.9%) | 248 (26.1%) |
| 10 to 14 Minutes | 108 (12.1%) | 212 (22.3%) |
| 15 to 19 Minutes | 167 (18.7%) | 140 (14.7%) |
| 20 to 24 Minutes | 98 (11.0%) | 10 (1.1%) |
| 25 to 29 Minutes | 40 (4.5%) | 20 (2.1%) |
| 30 to 34 Minutes | 70 (7.9%) | 119 (12.5%) |
| 35 to 39 Minutes | 51 (5.7%) | 4 (0.4%) |
| 40 to 44 Minutes | 8 (0.9%) | 0 (0.0%) |
| 45 to 59 Minutes | 52 (5.8%) | 61 (6.4%) |
| 60 to 89 Minutes | 22 (2.5%) | 129 (13.6%) |
| 90 or more Minutes | 44 (4.9%) | 0 (0.0%) |
Time of Departure to Work by Sex in Mary Esther
The most frequent times of departure to work in Mary Esther are 6:30 AM to 6:59 AM (222, 24.9%) for males and 7:30 AM to 7:59 AM (193, 20.3%) for females.
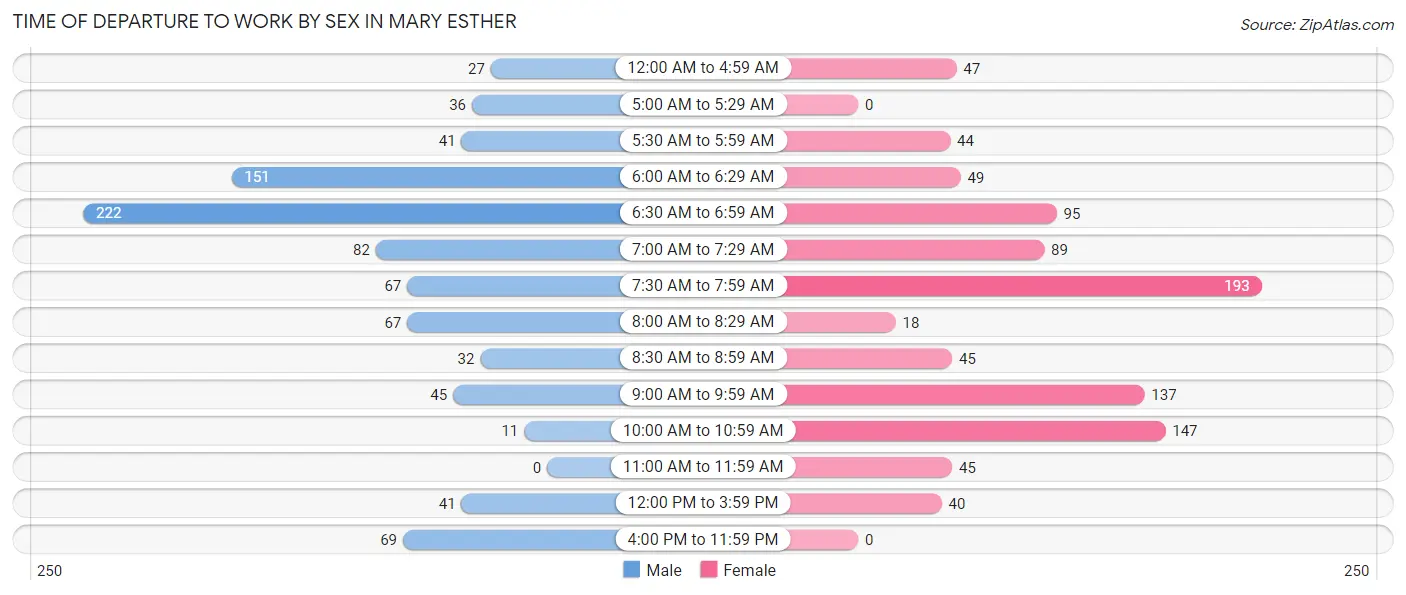
| Time of Departure | Male | Female |
| 12:00 AM to 4:59 AM | 27 (3.0%) | 47 (5.0%) |
| 5:00 AM to 5:29 AM | 36 (4.0%) | 0 (0.0%) |
| 5:30 AM to 5:59 AM | 41 (4.6%) | 44 (4.6%) |
| 6:00 AM to 6:29 AM | 151 (17.0%) | 49 (5.2%) |
| 6:30 AM to 6:59 AM | 222 (24.9%) | 95 (10.0%) |
| 7:00 AM to 7:29 AM | 82 (9.2%) | 89 (9.4%) |
| 7:30 AM to 7:59 AM | 67 (7.5%) | 193 (20.3%) |
| 8:00 AM to 8:29 AM | 67 (7.5%) | 18 (1.9%) |
| 8:30 AM to 8:59 AM | 32 (3.6%) | 45 (4.7%) |
| 9:00 AM to 9:59 AM | 45 (5.1%) | 137 (14.4%) |
| 10:00 AM to 10:59 AM | 11 (1.2%) | 147 (15.5%) |
| 11:00 AM to 11:59 AM | 0 (0.0%) | 45 (4.7%) |
| 12:00 PM to 3:59 PM | 41 (4.6%) | 40 (4.2%) |
| 4:00 PM to 11:59 PM | 69 (7.7%) | 0 (0.0%) |
| Total | 891 (100.0%) | 949 (100.0%) |
Housing Occupancy in Mary Esther
Occupancy by Ownership in Mary Esther
Of the total 1,504 dwellings in Mary Esther, owner-occupied units account for 1,082 (71.9%), while renter-occupied units make up 422 (28.1%).
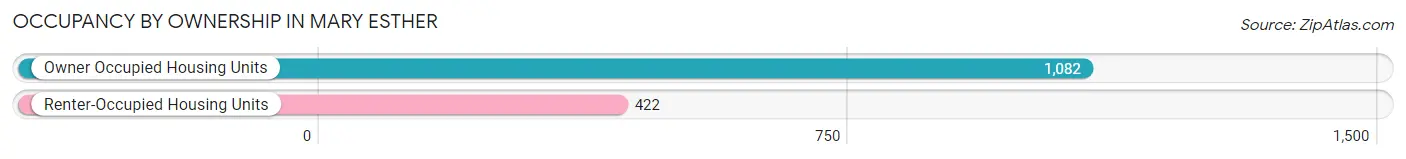
| Occupancy | # Housing Units | % Housing Units |
| Owner Occupied Housing Units | 1,082 | 71.9% |
| Renter-Occupied Housing Units | 422 | 28.1% |
| Total Occupied Housing Units | 1,504 | 100.0% |
Occupancy by Household Size in Mary Esther
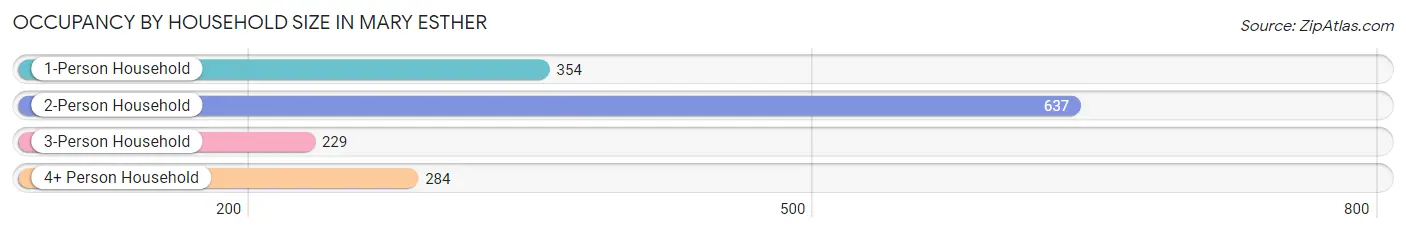
| Household Size | # Housing Units | % Housing Units |
| 1-Person Household | 354 | 23.5% |
| 2-Person Household | 637 | 42.3% |
| 3-Person Household | 229 | 15.2% |
| 4+ Person Household | 284 | 18.9% |
| Total Housing Units | 1,504 | 100.0% |
Occupancy by Ownership by Household Size in Mary Esther
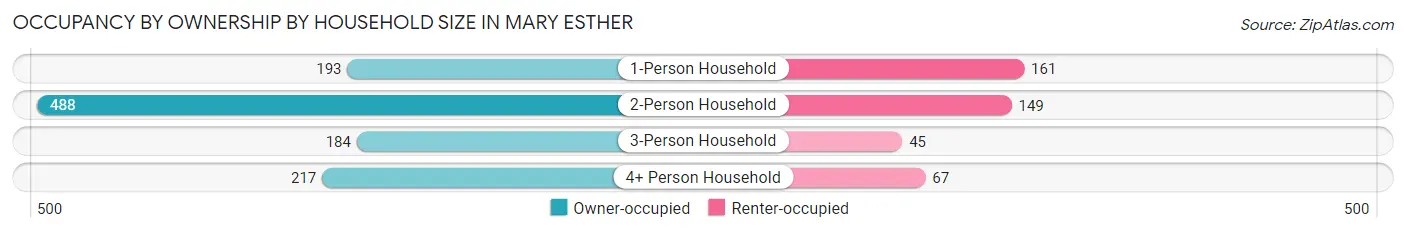
| Household Size | Owner-occupied | Renter-occupied |
| 1-Person Household | 193 (54.5%) | 161 (45.5%) |
| 2-Person Household | 488 (76.6%) | 149 (23.4%) |
| 3-Person Household | 184 (80.3%) | 45 (19.7%) |
| 4+ Person Household | 217 (76.4%) | 67 (23.6%) |
| Total Housing Units | 1,082 (71.9%) | 422 (28.1%) |
Occupancy by Educational Attainment in Mary Esther
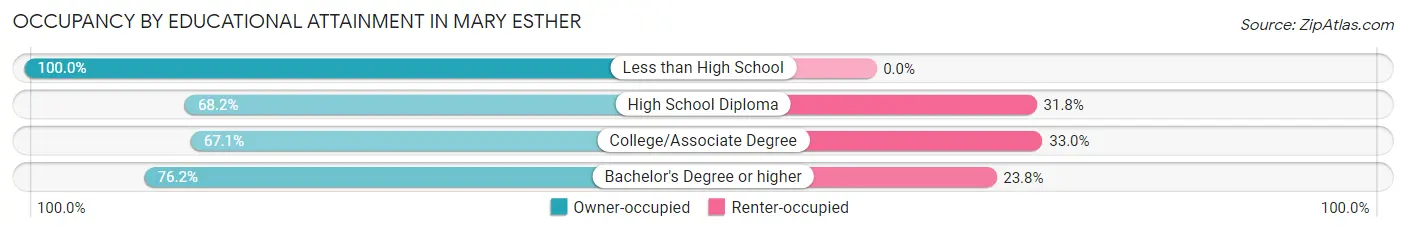
| Household Size | Owner-occupied | Renter-occupied |
| Less than High School | 59 (100.0%) | 0 (0.0%) |
| High School Diploma | 253 (68.2%) | 118 (31.8%) |
| College/Associate Degree | 354 (67.0%) | 174 (33.0%) |
| Bachelor's Degree or higher | 416 (76.2%) | 130 (23.8%) |
Occupancy by Age of Householder in Mary Esther
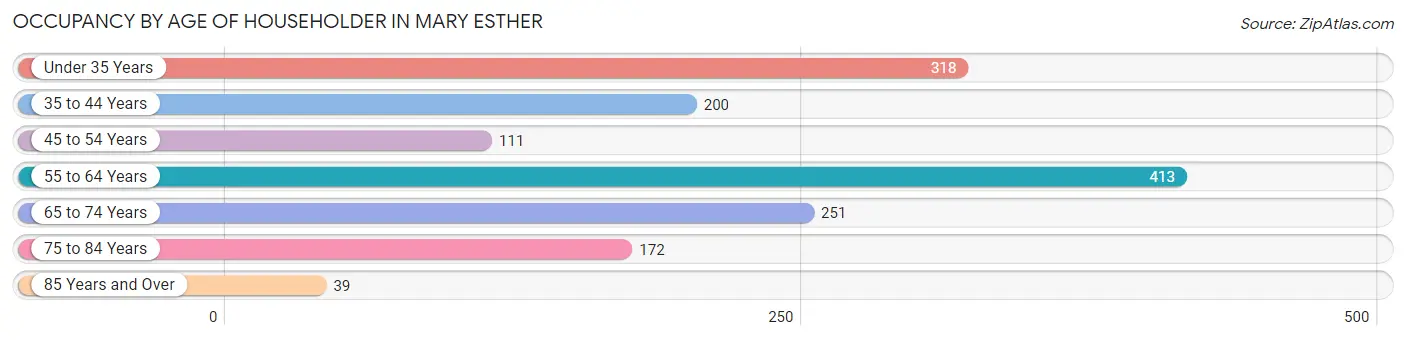
| Age Bracket | # Households | % Households |
| Under 35 Years | 318 | 21.1% |
| 35 to 44 Years | 200 | 13.3% |
| 45 to 54 Years | 111 | 7.4% |
| 55 to 64 Years | 413 | 27.5% |
| 65 to 74 Years | 251 | 16.7% |
| 75 to 84 Years | 172 | 11.4% |
| 85 Years and Over | 39 | 2.6% |
| Total | 1,504 | 100.0% |
Housing Finances in Mary Esther
Median Income by Occupancy in Mary Esther
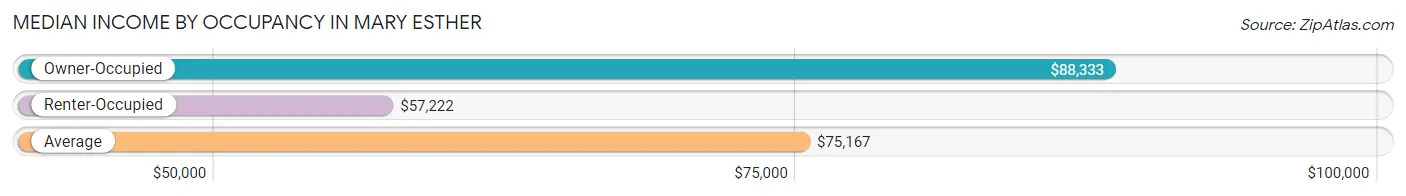
| Occupancy Type | # Households | Median Income |
| Owner-Occupied | 1,082 (71.9%) | $88,333 |
| Renter-Occupied | 422 (28.1%) | $57,222 |
| Average | 1,504 (100.0%) | $75,167 |
Occupancy by Householder Income Bracket in Mary Esther
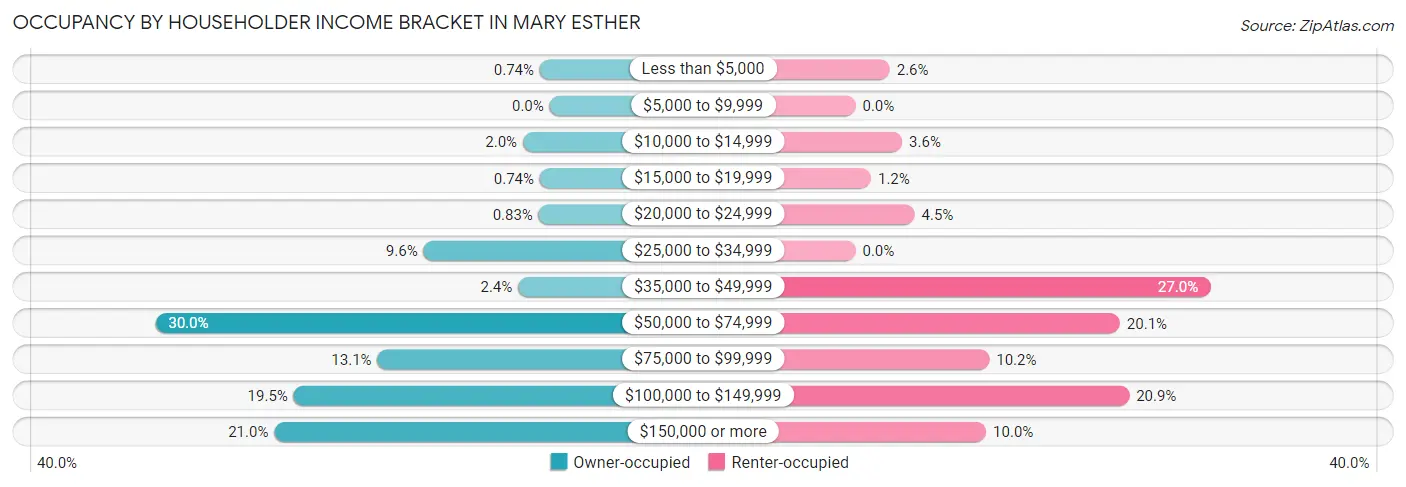
| Income Bracket | Owner-occupied | Renter-occupied |
| Less than $5,000 | 8 (0.7%) | 11 (2.6%) |
| $5,000 to $9,999 | 0 (0.0%) | 0 (0.0%) |
| $10,000 to $14,999 | 22 (2.0%) | 15 (3.5%) |
| $15,000 to $19,999 | 8 (0.7%) | 5 (1.2%) |
| $20,000 to $24,999 | 9 (0.8%) | 19 (4.5%) |
| $25,000 to $34,999 | 104 (9.6%) | 0 (0.0%) |
| $35,000 to $49,999 | 26 (2.4%) | 114 (27.0%) |
| $50,000 to $74,999 | 325 (30.0%) | 85 (20.1%) |
| $75,000 to $99,999 | 142 (13.1%) | 43 (10.2%) |
| $100,000 to $149,999 | 211 (19.5%) | 88 (20.8%) |
| $150,000 or more | 227 (21.0%) | 42 (10.0%) |
| Total | 1,082 (100.0%) | 422 (100.0%) |
Monthly Housing Cost Tiers in Mary Esther
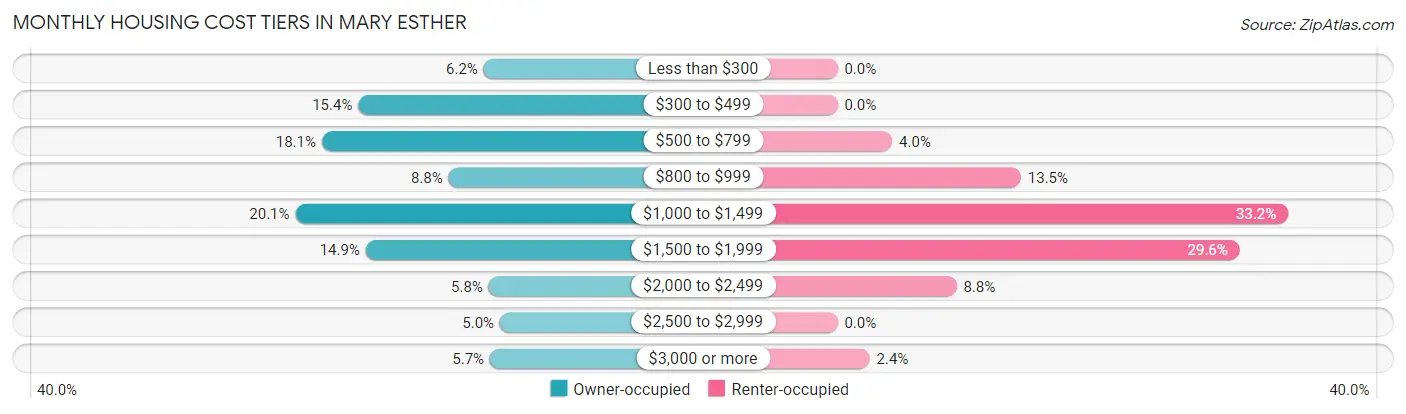
| Monthly Cost | Owner-occupied | Renter-occupied |
| Less than $300 | 67 (6.2%) | 0 (0.0%) |
| $300 to $499 | 167 (15.4%) | 0 (0.0%) |
| $500 to $799 | 196 (18.1%) | 17 (4.0%) |
| $800 to $999 | 95 (8.8%) | 57 (13.5%) |
| $1,000 to $1,499 | 217 (20.1%) | 140 (33.2%) |
| $1,500 to $1,999 | 161 (14.9%) | 125 (29.6%) |
| $2,000 to $2,499 | 63 (5.8%) | 37 (8.8%) |
| $2,500 to $2,999 | 54 (5.0%) | 0 (0.0%) |
| $3,000 or more | 62 (5.7%) | 10 (2.4%) |
| Total | 1,082 (100.0%) | 422 (100.0%) |
Physical Housing Characteristics in Mary Esther
Housing Structures in Mary Esther
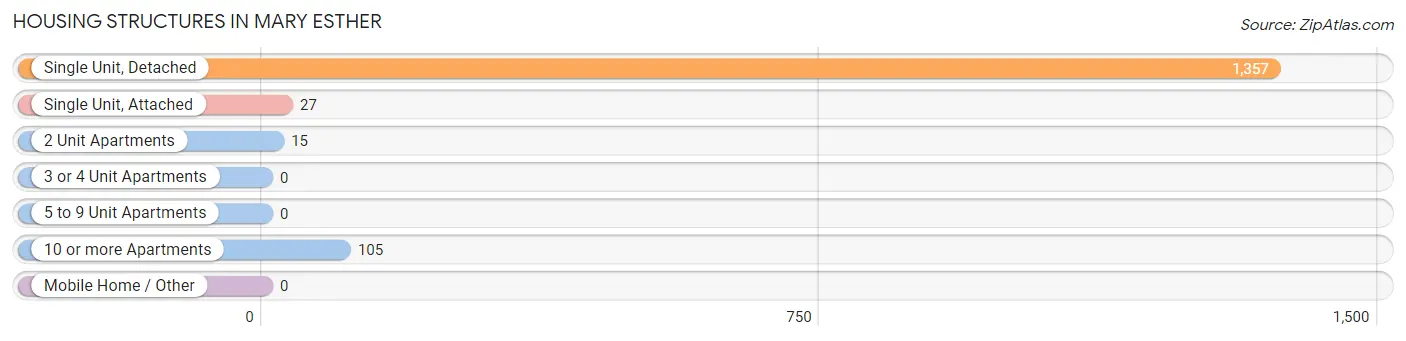
| Structure Type | # Housing Units | % Housing Units |
| Single Unit, Detached | 1,357 | 90.2% |
| Single Unit, Attached | 27 | 1.8% |
| 2 Unit Apartments | 15 | 1.0% |
| 3 or 4 Unit Apartments | 0 | 0.0% |
| 5 to 9 Unit Apartments | 0 | 0.0% |
| 10 or more Apartments | 105 | 7.0% |
| Mobile Home / Other | 0 | 0.0% |
| Total | 1,504 | 100.0% |
Housing Structures by Occupancy in Mary Esther
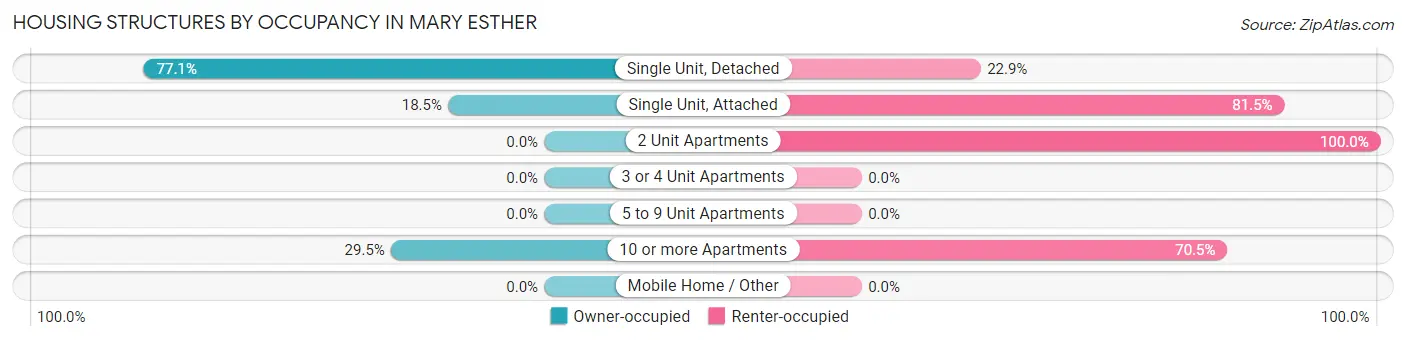
| Structure Type | Owner-occupied | Renter-occupied |
| Single Unit, Detached | 1,046 (77.1%) | 311 (22.9%) |
| Single Unit, Attached | 5 (18.5%) | 22 (81.5%) |
| 2 Unit Apartments | 0 (0.0%) | 15 (100.0%) |
| 3 or 4 Unit Apartments | 0 (0.0%) | 0 (0.0%) |
| 5 to 9 Unit Apartments | 0 (0.0%) | 0 (0.0%) |
| 10 or more Apartments | 31 (29.5%) | 74 (70.5%) |
| Mobile Home / Other | 0 (0.0%) | 0 (0.0%) |
| Total | 1,082 (71.9%) | 422 (28.1%) |
Housing Structures by Number of Rooms in Mary Esther
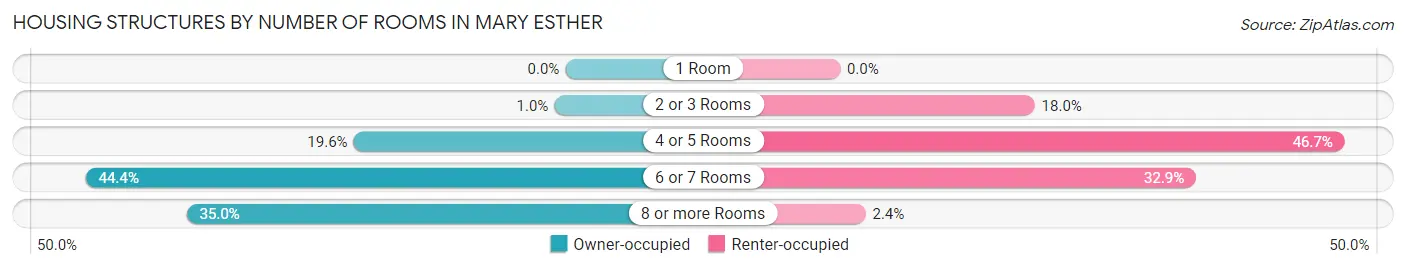
| Number of Rooms | Owner-occupied | Renter-occupied |
| 1 Room | 0 (0.0%) | 0 (0.0%) |
| 2 or 3 Rooms | 11 (1.0%) | 76 (18.0%) |
| 4 or 5 Rooms | 212 (19.6%) | 197 (46.7%) |
| 6 or 7 Rooms | 480 (44.4%) | 139 (32.9%) |
| 8 or more Rooms | 379 (35.0%) | 10 (2.4%) |
| Total | 1,082 (100.0%) | 422 (100.0%) |
Housing Structure by Heating Type in Mary Esther
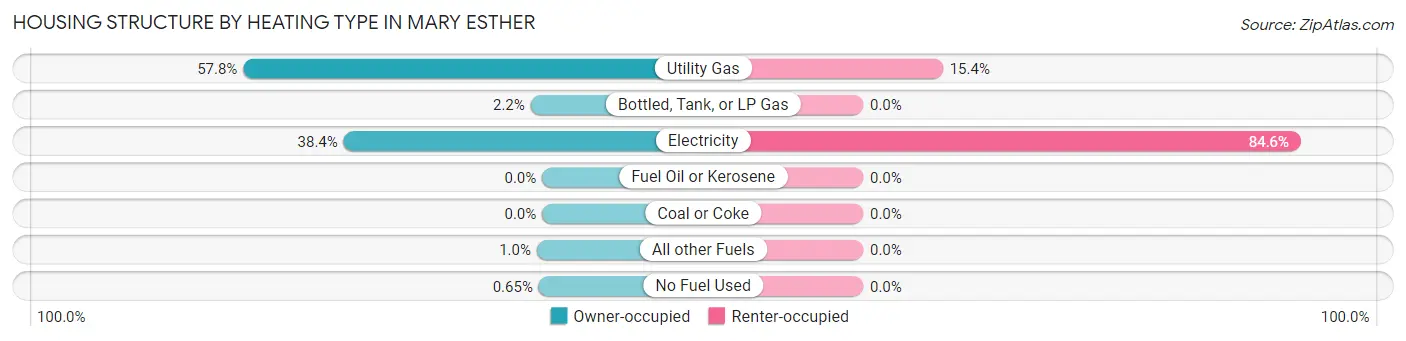
| Heating Type | Owner-occupied | Renter-occupied |
| Utility Gas | 625 (57.8%) | 65 (15.4%) |
| Bottled, Tank, or LP Gas | 24 (2.2%) | 0 (0.0%) |
| Electricity | 415 (38.4%) | 357 (84.6%) |
| Fuel Oil or Kerosene | 0 (0.0%) | 0 (0.0%) |
| Coal or Coke | 0 (0.0%) | 0 (0.0%) |
| All other Fuels | 11 (1.0%) | 0 (0.0%) |
| No Fuel Used | 7 (0.6%) | 0 (0.0%) |
| Total | 1,082 (100.0%) | 422 (100.0%) |
Household Vehicle Usage in Mary Esther
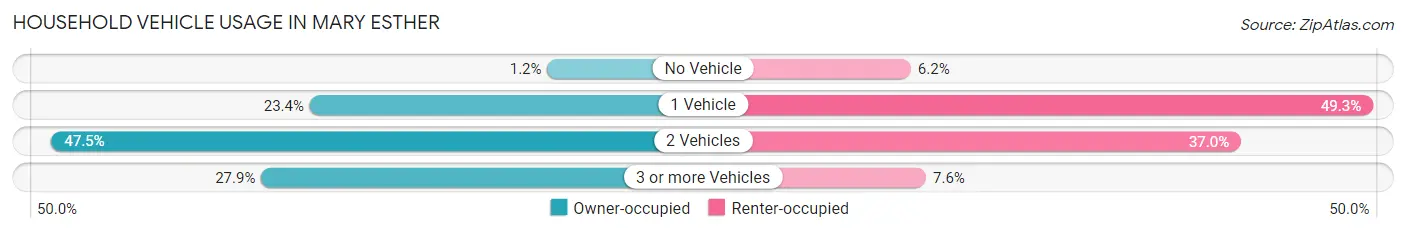
| Vehicles per Household | Owner-occupied | Renter-occupied |
| No Vehicle | 13 (1.2%) | 26 (6.2%) |
| 1 Vehicle | 253 (23.4%) | 208 (49.3%) |
| 2 Vehicles | 514 (47.5%) | 156 (37.0%) |
| 3 or more Vehicles | 302 (27.9%) | 32 (7.6%) |
| Total | 1,082 (100.0%) | 422 (100.0%) |
Real Estate & Mortgages in Mary Esther
Real Estate and Mortgage Overview in Mary Esther
| Characteristic | Without Mortgage | With Mortgage |
| Housing Units | 521 | 561 |
| Median Property Value | $214,300 | $259,800 |
| Median Household Income | $65,625 | $142 |
| Monthly Housing Costs | $565 | $62 |
| Real Estate Taxes | $1,477 | $12 |
Property Value by Mortgage Status in Mary Esther
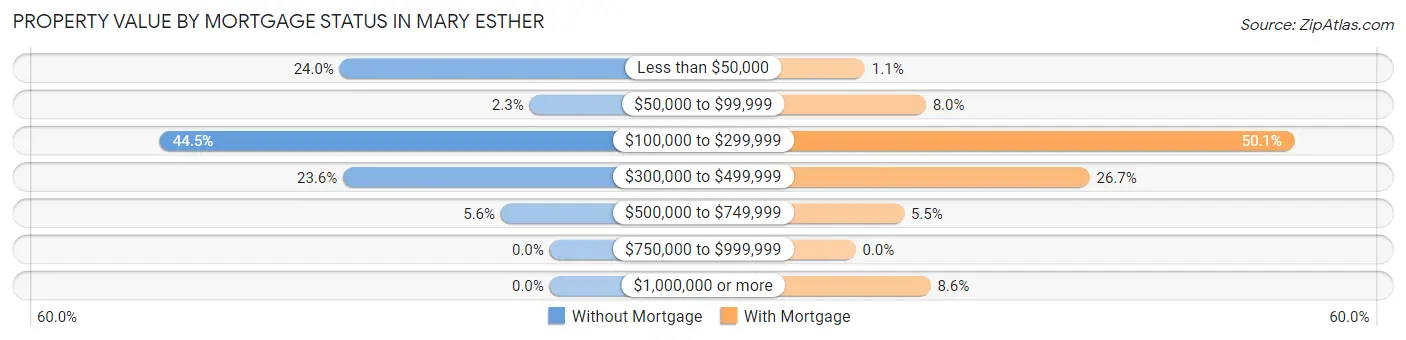
| Property Value | Without Mortgage | With Mortgage |
| Less than $50,000 | 125 (24.0%) | 6 (1.1%) |
| $50,000 to $99,999 | 12 (2.3%) | 45 (8.0%) |
| $100,000 to $299,999 | 232 (44.5%) | 281 (50.1%) |
| $300,000 to $499,999 | 123 (23.6%) | 150 (26.7%) |
| $500,000 to $749,999 | 29 (5.6%) | 31 (5.5%) |
| $750,000 to $999,999 | 0 (0.0%) | 0 (0.0%) |
| $1,000,000 or more | 0 (0.0%) | 48 (8.6%) |
| Total | 521 (100.0%) | 561 (100.0%) |
Household Income by Mortgage Status in Mary Esther
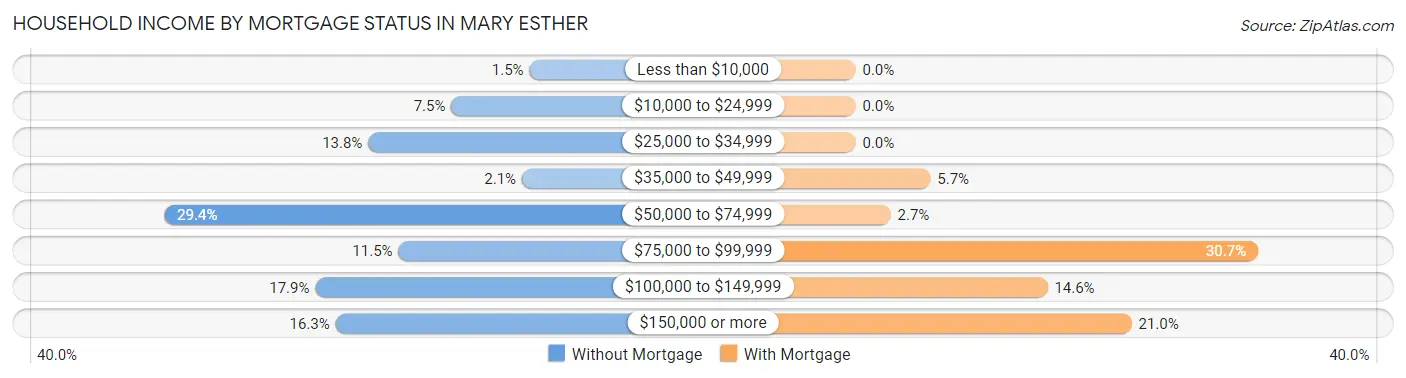
| Household Income | Without Mortgage | With Mortgage |
| Less than $10,000 | 8 (1.5%) | 0 (0.0%) |
| $10,000 to $24,999 | 39 (7.5%) | 0 (0.0%) |
| $25,000 to $34,999 | 72 (13.8%) | 0 (0.0%) |
| $35,000 to $49,999 | 11 (2.1%) | 32 (5.7%) |
| $50,000 to $74,999 | 153 (29.4%) | 15 (2.7%) |
| $75,000 to $99,999 | 60 (11.5%) | 172 (30.7%) |
| $100,000 to $149,999 | 93 (17.8%) | 82 (14.6%) |
| $150,000 or more | 85 (16.3%) | 118 (21.0%) |
| Total | 521 (100.0%) | 561 (100.0%) |
Property Value to Household Income Ratio in Mary Esther
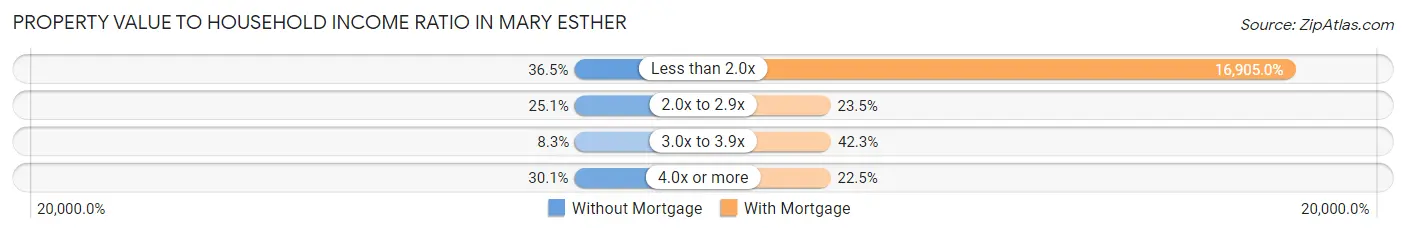
| Value-to-Income Ratio | Without Mortgage | With Mortgage |
| Less than 2.0x | 190 (36.5%) | 94,837 (16,905.0%) |
| 2.0x to 2.9x | 131 (25.1%) | 132 (23.5%) |
| 3.0x to 3.9x | 43 (8.3%) | 237 (42.2%) |
| 4.0x or more | 157 (30.1%) | 126 (22.5%) |
| Total | 521 (100.0%) | 561 (100.0%) |
Real Estate Taxes by Mortgage Status in Mary Esther
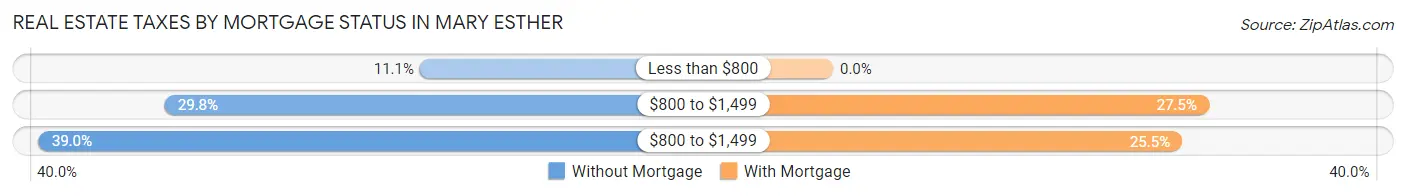
| Property Taxes | Without Mortgage | With Mortgage |
| Less than $800 | 58 (11.1%) | 0 (0.0%) |
| $800 to $1,499 | 155 (29.7%) | 154 (27.5%) |
| $800 to $1,499 | 203 (39.0%) | 143 (25.5%) |
| Total | 521 (100.0%) | 561 (100.0%) |
Health & Disability in Mary Esther
Health Insurance Coverage by Age in Mary Esther
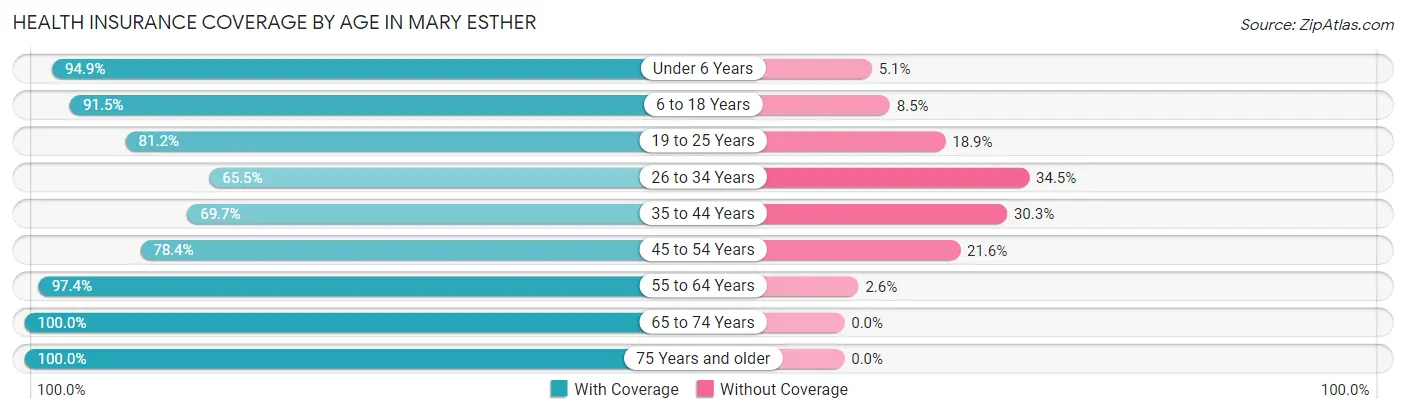
| Age Bracket | With Coverage | Without Coverage |
| Under 6 Years | 222 (94.9%) | 12 (5.1%) |
| 6 to 18 Years | 549 (91.5%) | 51 (8.5%) |
| 19 to 25 Years | 155 (81.1%) | 36 (18.9%) |
| 26 to 34 Years | 428 (65.5%) | 225 (34.5%) |
| 35 to 44 Years | 303 (69.7%) | 132 (30.3%) |
| 45 to 54 Years | 189 (78.4%) | 52 (21.6%) |
| 55 to 64 Years | 665 (97.4%) | 18 (2.6%) |
| 65 to 74 Years | 453 (100.0%) | 0 (0.0%) |
| 75 Years and older | 335 (100.0%) | 0 (0.0%) |
| Total | 3,299 (86.3%) | 526 (13.8%) |
Health Insurance Coverage by Citizenship Status in Mary Esther
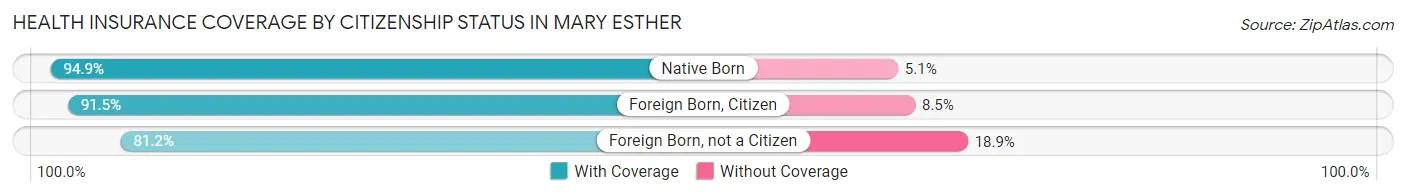
| Citizenship Status | With Coverage | Without Coverage |
| Native Born | 222 (94.9%) | 12 (5.1%) |
| Foreign Born, Citizen | 549 (91.5%) | 51 (8.5%) |
| Foreign Born, not a Citizen | 155 (81.1%) | 36 (18.9%) |
Health Insurance Coverage by Household Income in Mary Esther
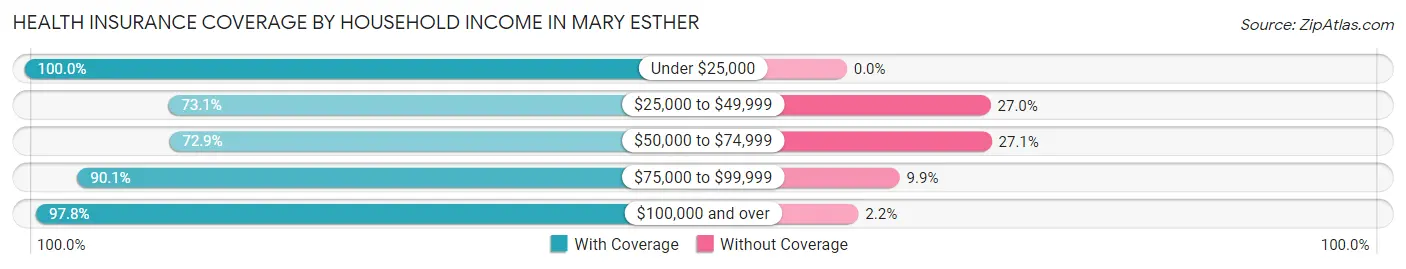
| Household Income | With Coverage | Without Coverage |
| Under $25,000 | 158 (100.0%) | 0 (0.0%) |
| $25,000 to $49,999 | 271 (73.1%) | 100 (27.0%) |
| $50,000 to $74,999 | 897 (72.9%) | 334 (27.1%) |
| $75,000 to $99,999 | 519 (90.1%) | 57 (9.9%) |
| $100,000 and over | 1,442 (97.8%) | 32 (2.2%) |
Public vs Private Health Insurance Coverage by Age in Mary Esther
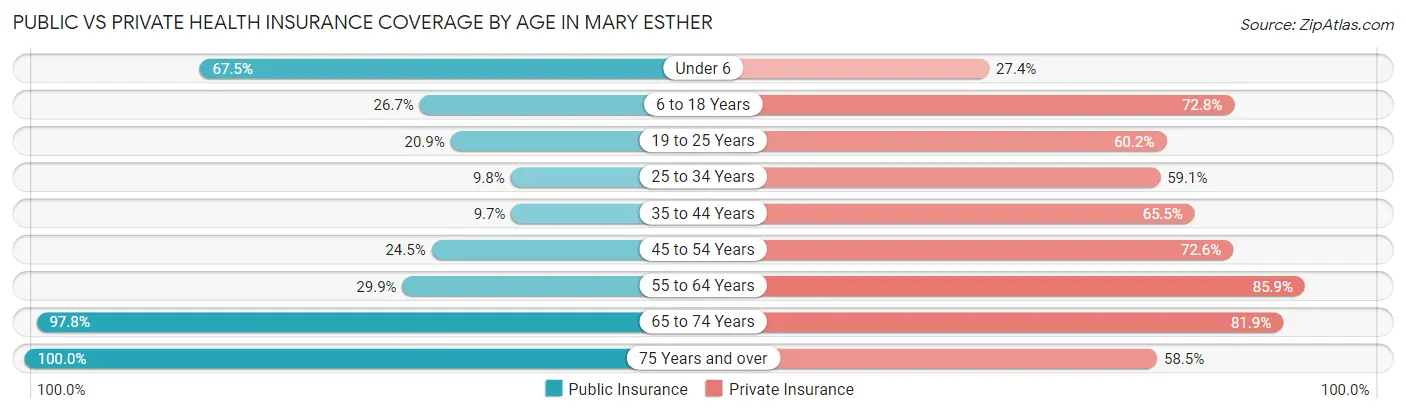
| Age Bracket | Public Insurance | Private Insurance |
| Under 6 | 158 (67.5%) | 64 (27.4%) |
| 6 to 18 Years | 160 (26.7%) | 437 (72.8%) |
| 19 to 25 Years | 40 (20.9%) | 115 (60.2%) |
| 25 to 34 Years | 64 (9.8%) | 386 (59.1%) |
| 35 to 44 Years | 42 (9.7%) | 285 (65.5%) |
| 45 to 54 Years | 59 (24.5%) | 175 (72.6%) |
| 55 to 64 Years | 204 (29.9%) | 587 (85.9%) |
| 65 to 74 Years | 443 (97.8%) | 371 (81.9%) |
| 75 Years and over | 335 (100.0%) | 196 (58.5%) |
| Total | 1,505 (39.4%) | 2,616 (68.4%) |
Disability Status by Sex by Age in Mary Esther
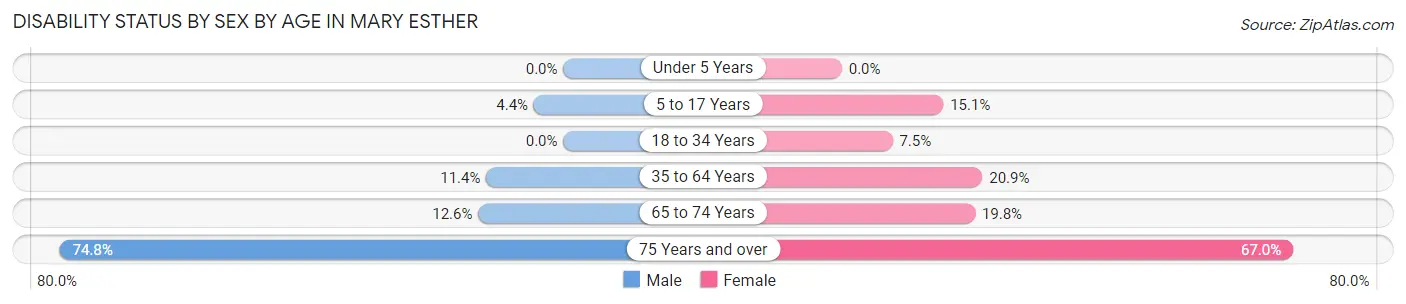
| Age Bracket | Male | Female |
| Under 5 Years | 0 (0.0%) | 0 (0.0%) |
| 5 to 17 Years | 9 (4.4%) | 53 (15.1%) |
| 18 to 34 Years | 0 (0.0%) | 36 (7.5%) |
| 35 to 64 Years | 82 (11.4%) | 134 (20.9%) |
| 65 to 74 Years | 24 (12.6%) | 52 (19.8%) |
| 75 Years and over | 101 (74.8%) | 134 (67.0%) |
Disability Class by Sex by Age in Mary Esther
Disability Class: Hearing Difficulty
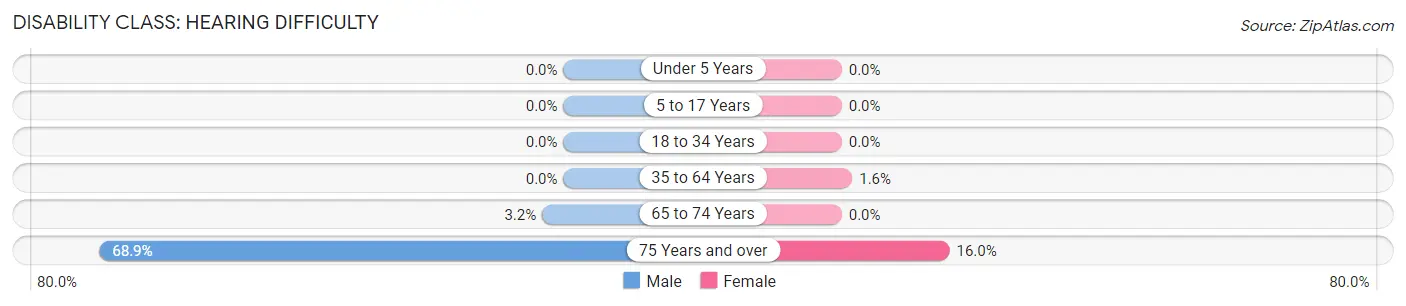
| Age Bracket | Male | Female |
| Under 5 Years | 0 (0.0%) | 0 (0.0%) |
| 5 to 17 Years | 0 (0.0%) | 0 (0.0%) |
| 18 to 34 Years | 0 (0.0%) | 0 (0.0%) |
| 35 to 64 Years | 0 (0.0%) | 10 (1.6%) |
| 65 to 74 Years | 6 (3.2%) | 0 (0.0%) |
| 75 Years and over | 93 (68.9%) | 32 (16.0%) |
Disability Class: Vision Difficulty
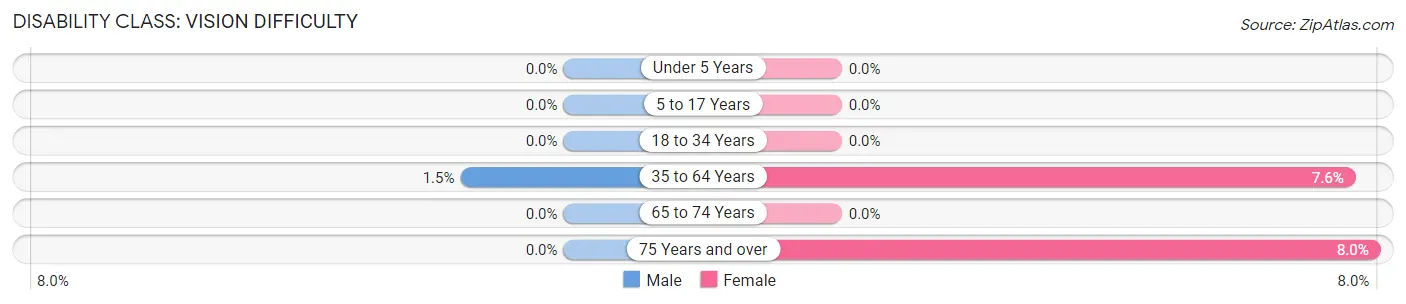
| Age Bracket | Male | Female |
| Under 5 Years | 0 (0.0%) | 0 (0.0%) |
| 5 to 17 Years | 0 (0.0%) | 0 (0.0%) |
| 18 to 34 Years | 0 (0.0%) | 0 (0.0%) |
| 35 to 64 Years | 11 (1.5%) | 49 (7.6%) |
| 65 to 74 Years | 0 (0.0%) | 0 (0.0%) |
| 75 Years and over | 0 (0.0%) | 16 (8.0%) |
Disability Class: Cognitive Difficulty
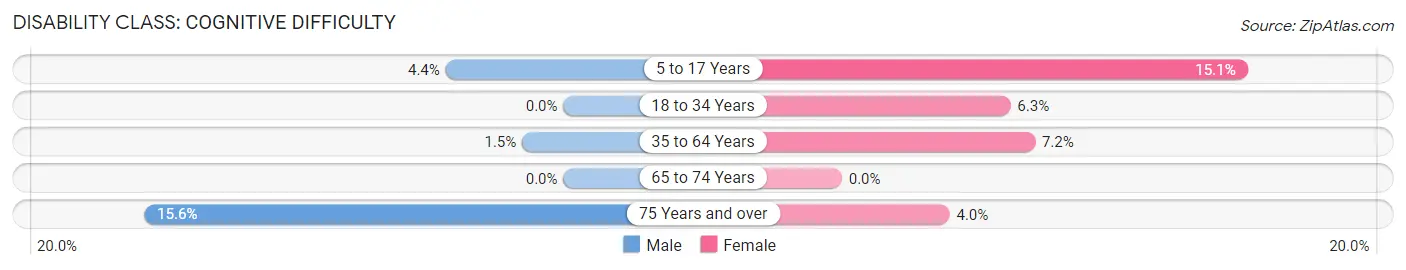
| Age Bracket | Male | Female |
| 5 to 17 Years | 9 (4.4%) | 53 (15.1%) |
| 18 to 34 Years | 0 (0.0%) | 30 (6.3%) |
| 35 to 64 Years | 11 (1.5%) | 46 (7.2%) |
| 65 to 74 Years | 0 (0.0%) | 0 (0.0%) |
| 75 Years and over | 21 (15.6%) | 8 (4.0%) |
Disability Class: Ambulatory Difficulty
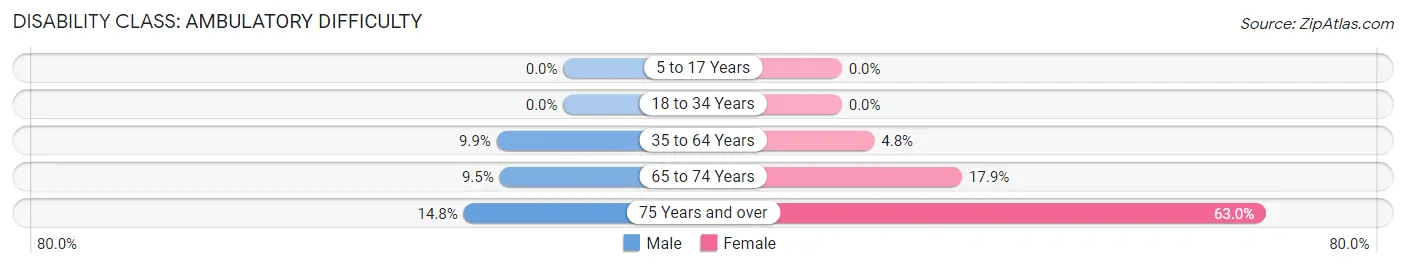
| Age Bracket | Male | Female |
| 5 to 17 Years | 0 (0.0%) | 0 (0.0%) |
| 18 to 34 Years | 0 (0.0%) | 0 (0.0%) |
| 35 to 64 Years | 71 (9.9%) | 31 (4.8%) |
| 65 to 74 Years | 18 (9.5%) | 47 (17.9%) |
| 75 Years and over | 20 (14.8%) | 126 (63.0%) |
Disability Class: Self-Care Difficulty
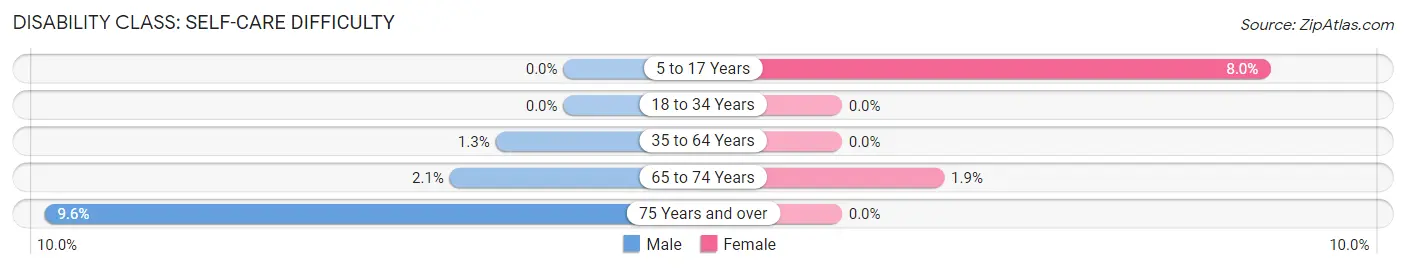
| Age Bracket | Male | Female |
| 5 to 17 Years | 0 (0.0%) | 28 (8.0%) |
| 18 to 34 Years | 0 (0.0%) | 0 (0.0%) |
| 35 to 64 Years | 9 (1.3%) | 0 (0.0%) |
| 65 to 74 Years | 4 (2.1%) | 5 (1.9%) |
| 75 Years and over | 13 (9.6%) | 0 (0.0%) |
Technology Access in Mary Esther
Computing Device Access in Mary Esther
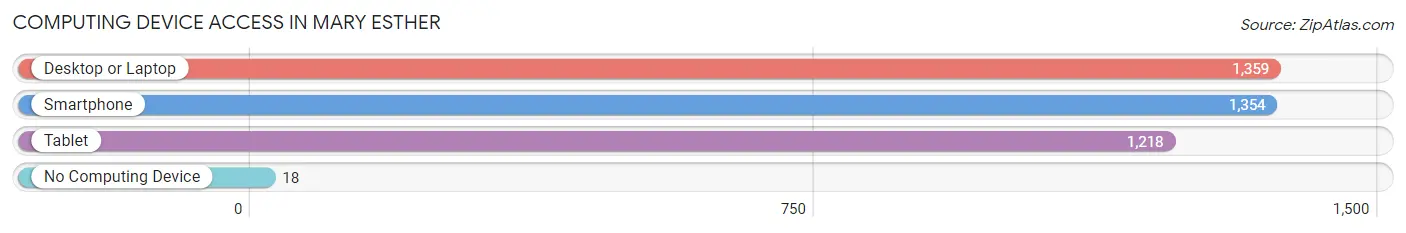
| Device Type | # Households | % Households |
| Desktop or Laptop | 1,359 | 90.4% |
| Smartphone | 1,354 | 90.0% |
| Tablet | 1,218 | 81.0% |
| No Computing Device | 18 | 1.2% |
| Total | 1,504 | 100.0% |
Internet Access in Mary Esther
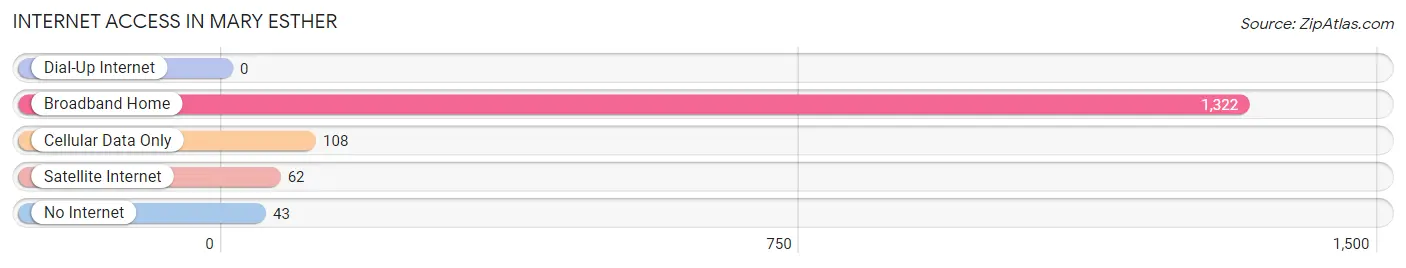
| Internet Type | # Households | % Households |
| Dial-Up Internet | 0 | 0.0% |
| Broadband Home | 1,322 | 87.9% |
| Cellular Data Only | 108 | 7.2% |
| Satellite Internet | 62 | 4.1% |
| No Internet | 43 | 2.9% |
| Total | 1,504 | 100.0% |
Mary Esther Summary
History
Mary Esther is a city located in Okaloosa County, Florida. It is part of the Fort Walton Beach-Crestview-Destin Metropolitan Statistical Area. The city was founded in the early 1900s and was originally known as “The Bluff”. The city was named after Mary Esther, the daughter of a local landowner. The city was incorporated in 1949 and has since grown to a population of over 5,000 people.
Geography
Mary Esther is located in the Florida Panhandle, approximately 20 miles east of Pensacola and 30 miles west of Panama City. The city is situated on the Santa Rosa Sound, which is part of the Gulf of Mexico. The city is bordered by the cities of Fort Walton Beach to the east and Niceville to the west. The city has a total area of 4.2 square miles, all of which is land.
Economy
The economy of Mary Esther is largely based on tourism and the military. The city is home to Eglin Air Force Base, which is the largest Air Force base in the United States. The base is a major employer in the area and provides a significant economic boost to the city. The city is also home to several tourist attractions, including the Gulfarium Marine Adventure Park, the Indian Temple Mound Museum, and the Air Force Armament Museum.
Demographics
As of the 2010 census, the population of Mary Esther was 5,092. The racial makeup of the city was 79.2% White, 11.2% African American, 0.7% Native American, 2.2% Asian, 0.1% Pacific Islander, 4.2% from other races, and 2.5% from two or more races. Hispanic or Latino of any race were 8.7% of the population. The median household income was $41,944 and the median family income was $50,944. The per capita income was $20,944.
Conclusion
Mary Esther is a city located in Okaloosa County, Florida. It is part of the Fort Walton Beach-Crestview-Destin Metropolitan Statistical Area and was founded in the early 1900s. The city is situated on the Santa Rosa Sound and is bordered by the cities of Fort Walton Beach and Niceville. The economy of Mary Esther is largely based on tourism and the military, with Eglin Air Force Base being a major employer in the area. As of the 2010 census, the population of Mary Esther was 5,092. The median household income was $41,944 and the median family income was $50,944.
Common Questions
What is Per Capita Income in Mary Esther?
Per Capita income in Mary Esther is $48,280.
What is the Median Family Income in Mary Esther?
Median Family Income in Mary Esther is $74,508.
What is the Median Household income in Mary Esther?
Median Household Income in Mary Esther is $75,167.
What is Income or Wage Gap in Mary Esther?
Income or Wage Gap in Mary Esther is 18.0%.
Women in Mary Esther earn 82.0 cents for every dollar earned by a man.
What is Inequality or Gini Index in Mary Esther?
Inequality or Gini Index in Mary Esther is 0.48.
What is the Total Population of Mary Esther?
Total Population of Mary Esther is 4,018.
What is the Total Male Population of Mary Esther?
Total Male Population of Mary Esther is 1,890.
What is the Total Female Population of Mary Esther?
Total Female Population of Mary Esther is 2,128.
What is the Ratio of Males per 100 Females in Mary Esther?
There are 88.82 Males per 100 Females in Mary Esther.
What is the Ratio of Females per 100 Males in Mary Esther?
There are 112.59 Females per 100 Males in Mary Esther.
What is the Median Population Age in Mary Esther?
Median Population Age in Mary Esther is 38.6 Years.
What is the Average Family Size in Mary Esther
Average Family Size in Mary Esther is 3.1 People.
What is the Average Household Size in Mary Esther
Average Household Size in Mary Esther is 2.7 People.
How Large is the Labor Force in Mary Esther?
There are 2,129 People in the Labor Forcein in Mary Esther.
What is the Percentage of People in the Labor Force in Mary Esther?
65.0% of People are in the Labor Force in Mary Esther.
What is the Unemployment Rate in Mary Esther?
Unemployment Rate in Mary Esther is 6.4%.