Mango, FL Map & Demographics
Mango Map
Mango Overview
$22,505
PER CAPITA INCOME
$49,069
AVG FAMILY INCOME
$43,571
AVG HOUSEHOLD INCOME
14.7%
WAGE / INCOME GAP [ % ]
85.3¢/ $1
WAGE / INCOME GAP [ $ ]
0.41
INEQUALITY / GINI INDEX
12,400
TOTAL POPULATION
5,803
MALE POPULATION
6,597
FEMALE POPULATION
87.96
MALES / 100 FEMALES
113.68
FEMALES / 100 MALES
39.2
MEDIAN AGE
3.1
AVG FAMILY SIZE
2.4
AVG HOUSEHOLD SIZE
5,699
LABOR FORCE [ PEOPLE ]
57.8%
PERCENT IN LABOR FORCE
5.3%
UNEMPLOYMENT RATE
Mango Area Codes
Income in Mango
Income Overview in Mango
Per Capita Income in Mango is $22,505, while median incomes of families and households are $49,069 and $43,571 respectively.
| Characteristic | Number | Measure |
| Per Capita Income | 12,400 | $22,505 |
| Median Family Income | 2,995 | $49,069 |
| Mean Family Income | 2,995 | $57,401 |
| Median Household Income | 5,098 | $43,571 |
| Mean Household Income | 5,098 | $53,131 |
| Income Deficit | 2,995 | $0 |
| Wage / Income Gap (%) | 12,400 | 14.68% |
| Wage / Income Gap ($) | 12,400 | 85.32¢ per $1 |
| Gini / Inequality Index | 12,400 | 0.41 |
Earnings by Sex in Mango
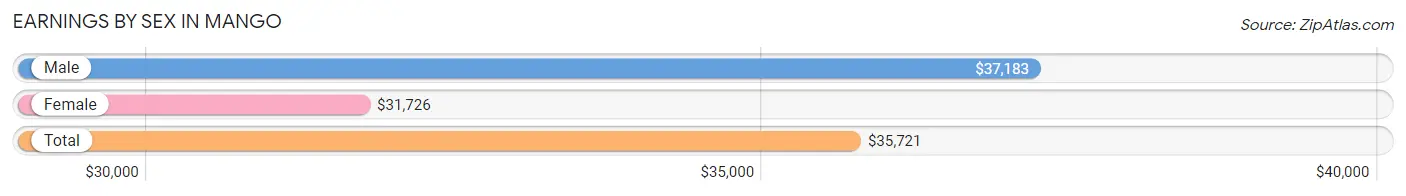
Average Earnings in Mango are $35,721, $37,183 for men and $31,726 for women, a difference of 14.7%.
| Sex | Number | Average Earnings |
| Male | 3,094 (55.4%) | $37,183 |
| Female | 2,493 (44.6%) | $31,726 |
| Total | 5,587 (100.0%) | $35,721 |
Earnings by Sex by Income Bracket in Mango
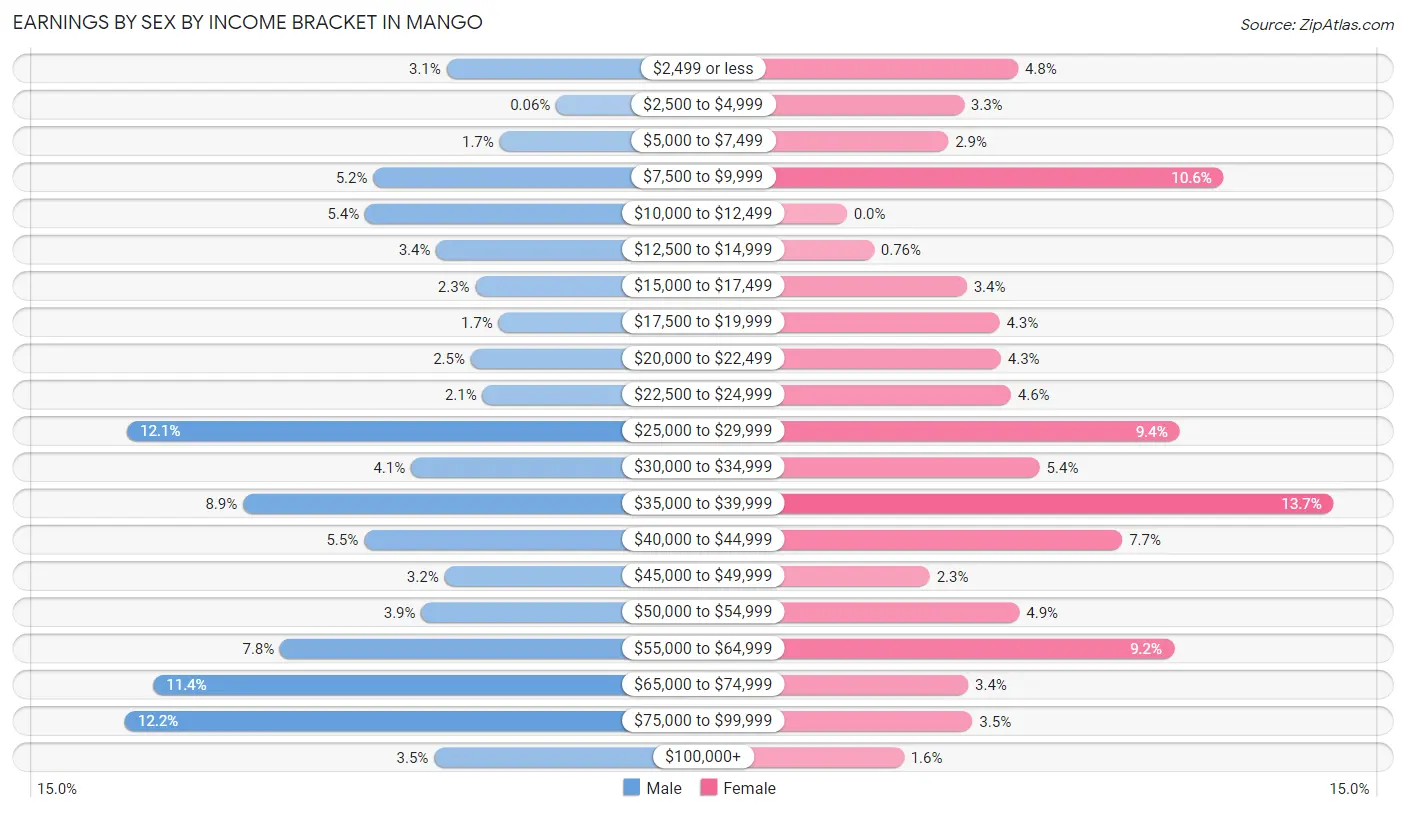
The most common earnings brackets in Mango are $75,000 to $99,999 for men (377 | 12.2%) and $35,000 to $39,999 for women (341 | 13.7%).
| Income | Male | Female |
| $2,499 or less | 97 (3.1%) | 120 (4.8%) |
| $2,500 to $4,999 | 2 (0.1%) | 82 (3.3%) |
| $5,000 to $7,499 | 51 (1.7%) | 71 (2.9%) |
| $7,500 to $9,999 | 161 (5.2%) | 264 (10.6%) |
| $10,000 to $12,499 | 168 (5.4%) | 0 (0.0%) |
| $12,500 to $14,999 | 106 (3.4%) | 19 (0.8%) |
| $15,000 to $17,499 | 72 (2.3%) | 84 (3.4%) |
| $17,500 to $19,999 | 52 (1.7%) | 107 (4.3%) |
| $20,000 to $22,499 | 76 (2.5%) | 108 (4.3%) |
| $22,500 to $24,999 | 66 (2.1%) | 115 (4.6%) |
| $25,000 to $29,999 | 375 (12.1%) | 233 (9.3%) |
| $30,000 to $34,999 | 128 (4.1%) | 135 (5.4%) |
| $35,000 to $39,999 | 274 (8.9%) | 341 (13.7%) |
| $40,000 to $44,999 | 169 (5.5%) | 193 (7.7%) |
| $45,000 to $49,999 | 99 (3.2%) | 58 (2.3%) |
| $50,000 to $54,999 | 119 (3.8%) | 121 (4.9%) |
| $55,000 to $64,999 | 242 (7.8%) | 229 (9.2%) |
| $65,000 to $74,999 | 352 (11.4%) | 85 (3.4%) |
| $75,000 to $99,999 | 377 (12.2%) | 88 (3.5%) |
| $100,000+ | 108 (3.5%) | 40 (1.6%) |
| Total | 3,094 (100.0%) | 2,493 (100.0%) |
Earnings by Sex by Educational Attainment in Mango
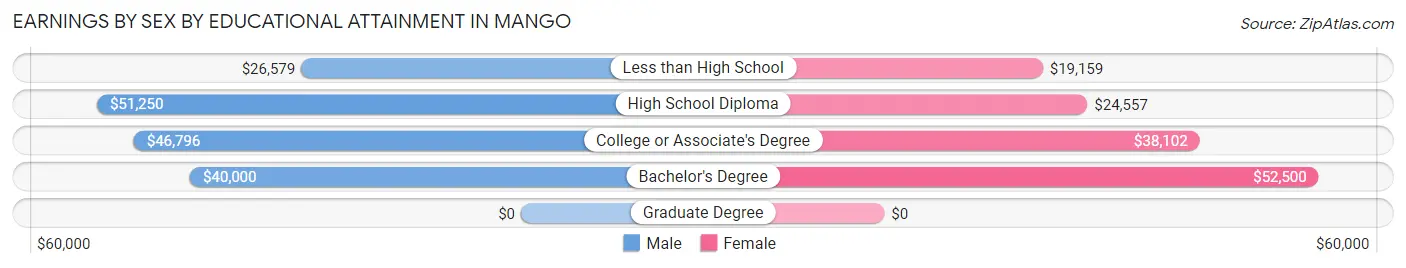
Average earnings in Mango are $41,337 for men and $33,819 for women, a difference of 18.2%. Men with an educational attainment of high school diploma enjoy the highest average annual earnings of $51,250, while those with less than high school education earn the least with $26,579. Women with an educational attainment of bachelor's degree earn the most with the average annual earnings of $52,500, while those with less than high school education have the smallest earnings of $19,159.
| Educational Attainment | Male Income | Female Income |
| Less than High School | $26,579 | $19,159 |
| High School Diploma | $51,250 | $24,557 |
| College or Associate's Degree | $46,796 | $38,102 |
| Bachelor's Degree | $40,000 | $52,500 |
| Graduate Degree | - | - |
| Total | $41,337 | $33,819 |
Family Income in Mango
Family Income Brackets in Mango
According to the Mango family income data, there are 773 families falling into the $50,000 to $74,999 income range, which is the most common income bracket and makes up 25.8% of all families. Conversely, the $150,000 to $199,999 income bracket is the least frequent group with only 30 families (1.0%) belonging to this category.
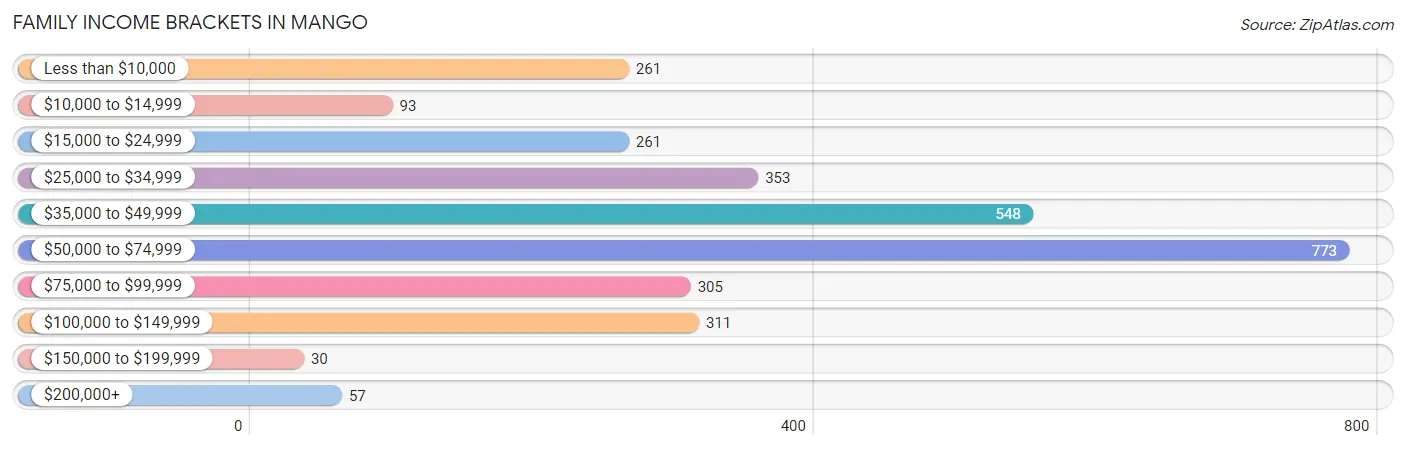
| Income Bracket | # Families | % Families |
| Less than $10,000 | 261 | 8.7% |
| $10,000 to $14,999 | 93 | 3.1% |
| $15,000 to $24,999 | 261 | 8.7% |
| $25,000 to $34,999 | 353 | 11.8% |
| $35,000 to $49,999 | 548 | 18.3% |
| $50,000 to $74,999 | 773 | 25.8% |
| $75,000 to $99,999 | 305 | 10.2% |
| $100,000 to $149,999 | 311 | 10.4% |
| $150,000 to $199,999 | 30 | 1.0% |
| $200,000+ | 57 | 1.9% |
Family Income by Famaliy Size in Mango
4-person families (711 | 23.7%) account for the highest median family income in Mango with $68,877 per family, while 2-person families (1,341 | 44.8%) have the highest median income of $24,668 per family member.
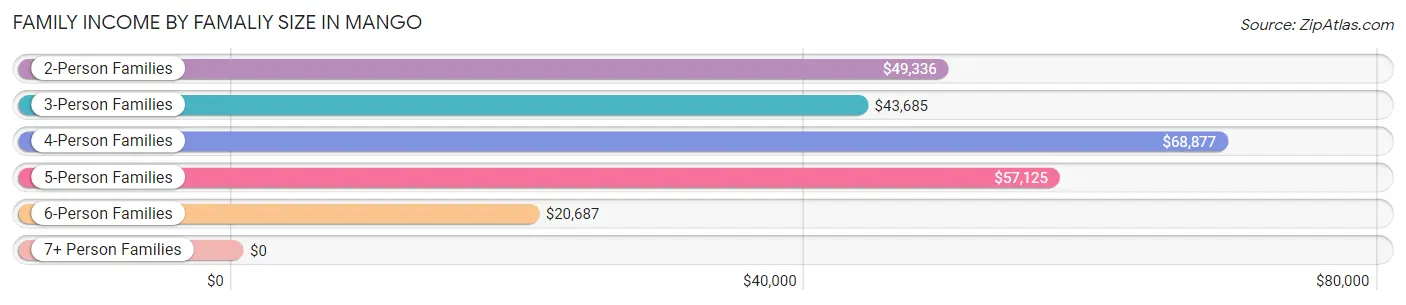
| Income Bracket | # Families | Median Income |
| 2-Person Families | 1,341 (44.8%) | $49,336 |
| 3-Person Families | 612 (20.4%) | $43,685 |
| 4-Person Families | 711 (23.7%) | $68,877 |
| 5-Person Families | 134 (4.5%) | $57,125 |
| 6-Person Families | 180 (6.0%) | $20,687 |
| 7+ Person Families | 17 (0.6%) | $0 |
| Total | 2,995 (100.0%) | $49,069 |
Family Income by Number of Earners in Mango
The median family income in Mango is $49,069, with families comprising 3+ earners (287) having the highest median family income of $100,797, while families with no earners (664) have the lowest median family income of $21,923, accounting for 9.6% and 22.2% of families, respectively.
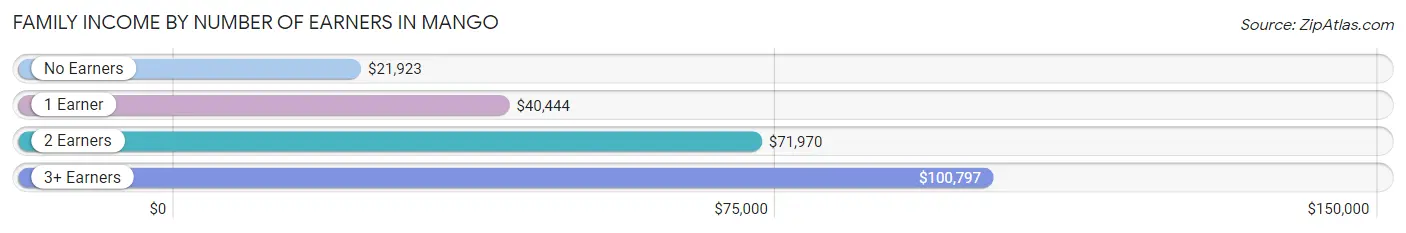
| Number of Earners | # Families | Median Income |
| No Earners | 664 (22.2%) | $21,923 |
| 1 Earner | 1,319 (44.0%) | $40,444 |
| 2 Earners | 725 (24.2%) | $71,970 |
| 3+ Earners | 287 (9.6%) | $100,797 |
| Total | 2,995 (100.0%) | $49,069 |
Household Income in Mango
Household Income Brackets in Mango
With 1,071 households falling in the category, the $35,000 to $49,999 income range is the most frequent in Mango, accounting for 21.0% of all households. In contrast, only 56 households (1.1%) fall into the $200,000+ income bracket, making it the least populous group.
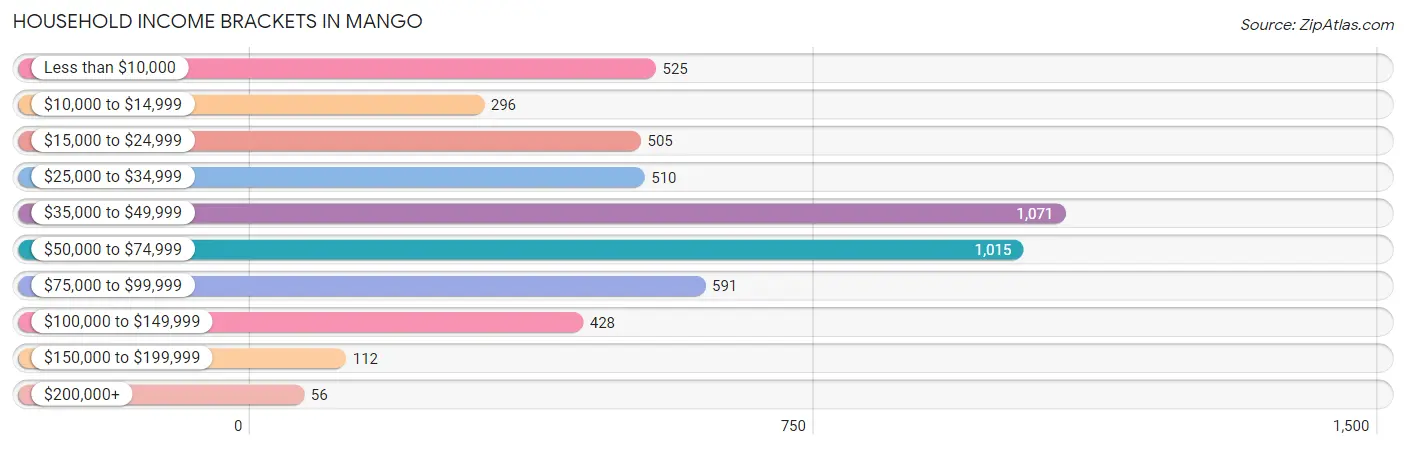
| Income Bracket | # Households | % Households |
| Less than $10,000 | 525 | 10.3% |
| $10,000 to $14,999 | 296 | 5.8% |
| $15,000 to $24,999 | 505 | 9.9% |
| $25,000 to $34,999 | 510 | 10.0% |
| $35,000 to $49,999 | 1,071 | 21.0% |
| $50,000 to $74,999 | 1,015 | 19.9% |
| $75,000 to $99,999 | 591 | 11.6% |
| $100,000 to $149,999 | 428 | 8.4% |
| $150,000 to $199,999 | 112 | 2.2% |
| $200,000+ | 56 | 1.1% |
Household Income by Householder Age in Mango
The median household income in Mango is $43,571, with the highest median household income of $49,696 found in the 45 to 64 years age bracket for the primary householder. A total of 1,721 households (33.8%) fall into this category. Meanwhile, the 65+ years age bracket for the primary householder has the lowest median household income of $31,884, with 1,120 households (22.0%) in this group.
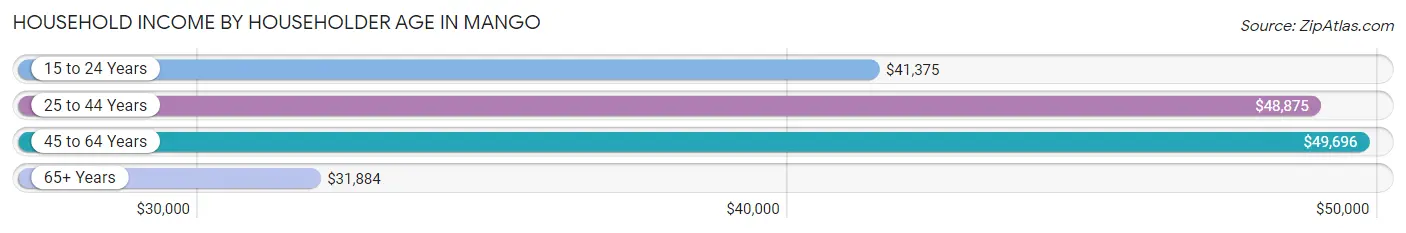
| Income Bracket | # Households | Median Income |
| 15 to 24 Years | 36 (0.7%) | $41,375 |
| 25 to 44 Years | 2,221 (43.6%) | $48,875 |
| 45 to 64 Years | 1,721 (33.8%) | $49,696 |
| 65+ Years | 1,120 (22.0%) | $31,884 |
| Total | 5,098 (100.0%) | $43,571 |
Poverty in Mango
Income Below Poverty by Sex and Age in Mango
With 23.1% poverty level for males and 24.5% for females among the residents of Mango, 15 year old males and 16 and 17 year old females are the most vulnerable to poverty, with 91 males (77.8%) and 112 females (69.1%) in their respective age groups living below the poverty level.
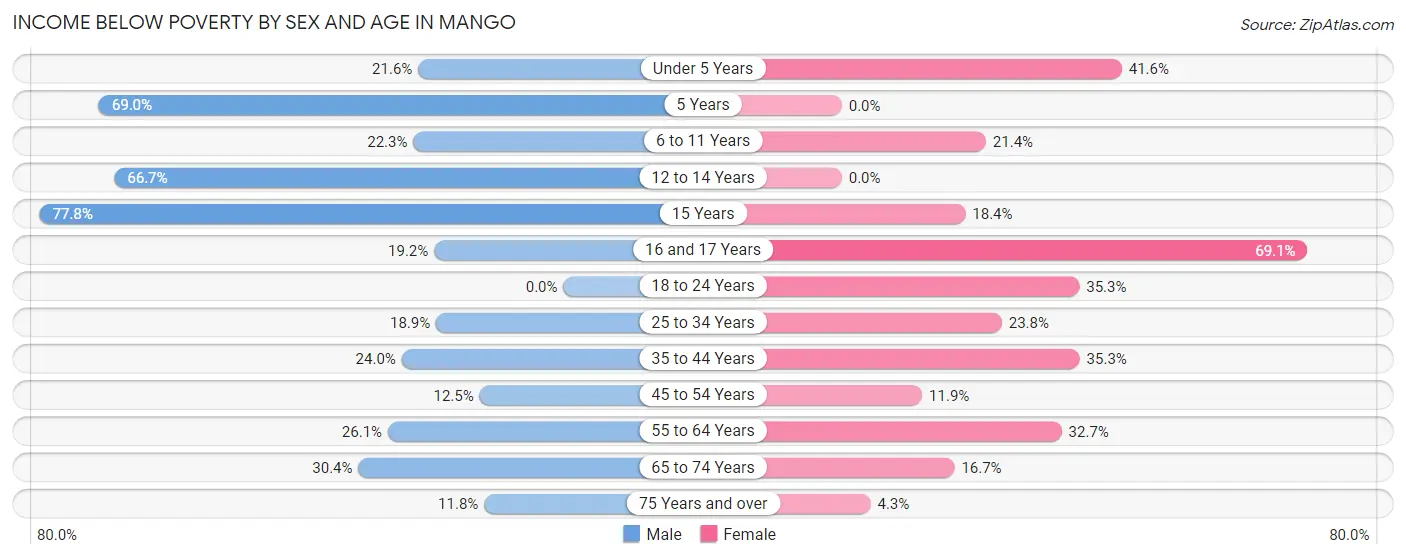
| Age Bracket | Male | Female |
| Under 5 Years | 94 (21.6%) | 190 (41.6%) |
| 5 Years | 60 (69.0%) | 0 (0.0%) |
| 6 to 11 Years | 84 (22.3%) | 92 (21.4%) |
| 12 to 14 Years | 90 (66.7%) | 0 (0.0%) |
| 15 Years | 91 (77.8%) | 20 (18.3%) |
| 16 and 17 Years | 33 (19.2%) | 112 (69.1%) |
| 18 to 24 Years | 0 (0.0%) | 91 (35.3%) |
| 25 to 34 Years | 202 (18.9%) | 259 (23.8%) |
| 35 to 44 Years | 243 (24.0%) | 278 (35.3%) |
| 45 to 54 Years | 87 (12.4%) | 124 (11.9%) |
| 55 to 64 Years | 210 (26.1%) | 319 (32.7%) |
| 65 to 74 Years | 137 (30.4%) | 91 (16.7%) |
| 75 Years and over | 12 (11.8%) | 15 (4.3%) |
| Total | 1,343 (23.1%) | 1,591 (24.5%) |
Income Above Poverty by Sex and Age in Mango
According to the poverty statistics in Mango, males aged 18 to 24 years and females aged 5 years are the age groups that are most secure financially, with 100.0% of males and 100.0% of females in these age groups living above the poverty line.
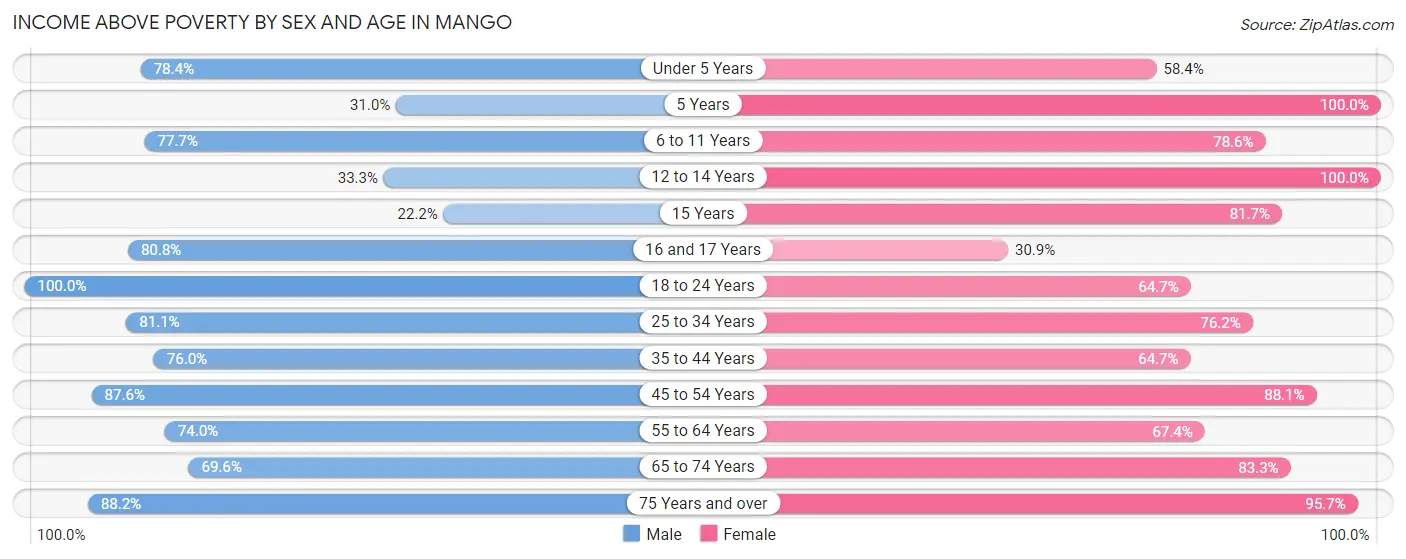
| Age Bracket | Male | Female |
| Under 5 Years | 342 (78.4%) | 267 (58.4%) |
| 5 Years | 27 (31.0%) | 87 (100.0%) |
| 6 to 11 Years | 293 (77.7%) | 338 (78.6%) |
| 12 to 14 Years | 45 (33.3%) | 210 (100.0%) |
| 15 Years | 26 (22.2%) | 89 (81.7%) |
| 16 and 17 Years | 139 (80.8%) | 50 (30.9%) |
| 18 to 24 Years | 341 (100.0%) | 167 (64.7%) |
| 25 to 34 Years | 867 (81.1%) | 831 (76.2%) |
| 35 to 44 Years | 769 (76.0%) | 509 (64.7%) |
| 45 to 54 Years | 612 (87.5%) | 915 (88.1%) |
| 55 to 64 Years | 596 (74.0%) | 658 (67.3%) |
| 65 to 74 Years | 313 (69.6%) | 453 (83.3%) |
| 75 Years and over | 90 (88.2%) | 336 (95.7%) |
| Total | 4,460 (76.9%) | 4,910 (75.5%) |
Income Below Poverty Among Married-Couple Families in Mango
The poverty statistics for married-couple families in Mango show that 16.4% or 329 of the total 2,007 families live below the poverty line. Families with 1 or 2 children have the highest poverty rate of 29.9%, comprising of 230 families. On the other hand, families with no children have the lowest poverty rate of 7.2%, which includes 82 families.
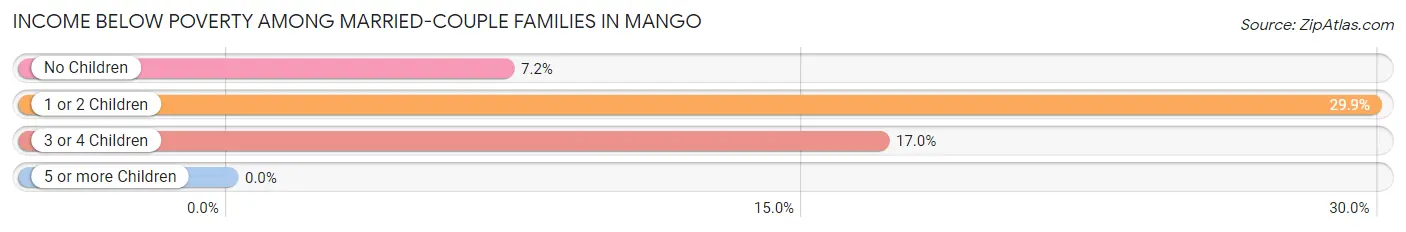
| Children | Above Poverty | Below Poverty |
| No Children | 1,055 (92.8%) | 82 (7.2%) |
| 1 or 2 Children | 540 (70.1%) | 230 (29.9%) |
| 3 or 4 Children | 83 (83.0%) | 17 (17.0%) |
| 5 or more Children | 0 (0.0%) | 0 (0.0%) |
| Total | 1,678 (83.6%) | 329 (16.4%) |
Income Below Poverty Among Single-Parent Households in Mango
According to the poverty data in Mango, 24.7% or 61 single-father households and 23.9% or 177 single-mother households are living below the poverty line. Among single-father households, those with 3 or 4 children have the highest poverty rate, with 52 households (100.0%) experiencing poverty. Likewise, among single-mother households, those with 3 or 4 children have the highest poverty rate, with 83 households (76.8%) falling below the poverty line.
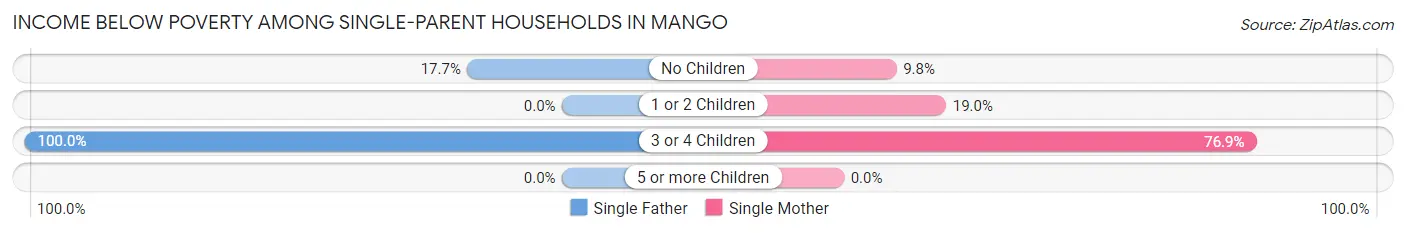
| Children | Single Father | Single Mother |
| No Children | 9 (17.6%) | 28 (9.8%) |
| 1 or 2 Children | 0 (0.0%) | 66 (19.0%) |
| 3 or 4 Children | 52 (100.0%) | 83 (76.8%) |
| 5 or more Children | 0 (0.0%) | 0 (0.0%) |
| Total | 61 (24.7%) | 177 (23.9%) |
Income Below Poverty Among Married-Couple vs Single-Parent Households in Mango
The poverty data for Mango shows that 329 of the married-couple family households (16.4%) and 238 of the single-parent households (24.1%) are living below the poverty level. Within the married-couple family households, those with 1 or 2 children have the highest poverty rate, with 230 households (29.9%) falling below the poverty line. Among the single-parent households, those with 3 or 4 children have the highest poverty rate, with 135 household (84.4%) living below poverty.
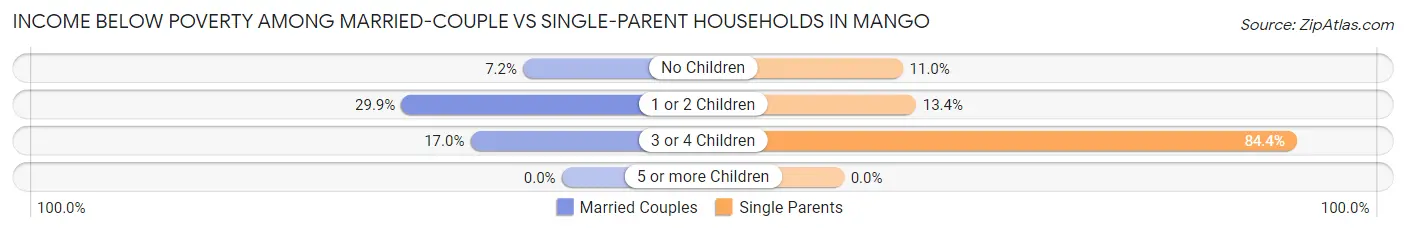
| Children | Married-Couple Families | Single-Parent Households |
| No Children | 82 (7.2%) | 37 (11.0%) |
| 1 or 2 Children | 230 (29.9%) | 66 (13.4%) |
| 3 or 4 Children | 17 (17.0%) | 135 (84.4%) |
| 5 or more Children | 0 (0.0%) | 0 (0.0%) |
| Total | 329 (16.4%) | 238 (24.1%) |
Race in Mango
The most populous races in Mango are White / Caucasian (7,187 | 58.0%), Hispanic or Latino (4,552 | 36.7%), and Two or more Races (1,977 | 15.9%).
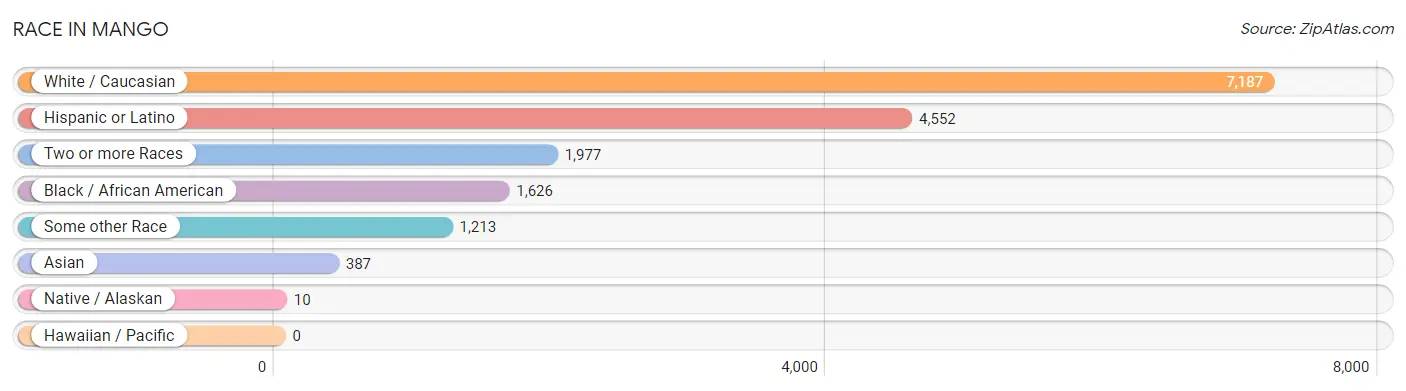
| Race | # Population | % Population |
| Asian | 387 | 3.1% |
| Black / African American | 1,626 | 13.1% |
| Hawaiian / Pacific | 0 | 0.0% |
| Hispanic or Latino | 4,552 | 36.7% |
| Native / Alaskan | 10 | 0.1% |
| White / Caucasian | 7,187 | 58.0% |
| Two or more Races | 1,977 | 15.9% |
| Some other Race | 1,213 | 9.8% |
| Total | 12,400 | 100.0% |
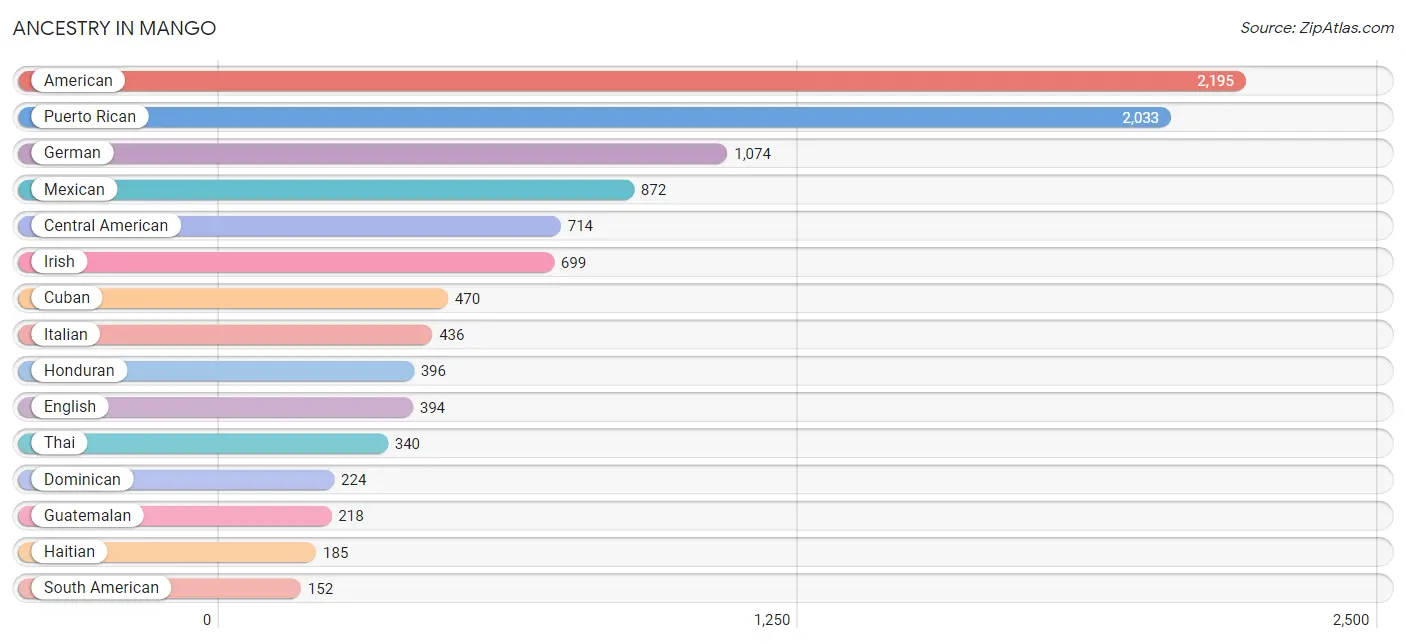
Ancestry in Mango
The most populous ancestries reported in Mango are American (2,195 | 17.7%), Puerto Rican (2,033 | 16.4%), German (1,074 | 8.7%), Mexican (872 | 7.0%), and Central American (714 | 5.8%), together accounting for 55.5% of all Mango residents.
| Ancestry | # Population | % Population |
| African | 52 | 0.4% |
| American | 2,195 | 17.7% |
| Arab | 80 | 0.6% |
| Argentinean | 90 | 0.7% |
| Armenian | 14 | 0.1% |
| Austrian | 8 | 0.1% |
| Bahamian | 23 | 0.2% |
| Belizean | 6 | 0.1% |
| Bhutanese | 43 | 0.4% |
| British | 71 | 0.6% |
| British West Indian | 68 | 0.5% |
| Burmese | 22 | 0.2% |
| Central American | 714 | 5.8% |
| Chilean | 24 | 0.2% |
| Choctaw | 47 | 0.4% |
| Colombian | 38 | 0.3% |
| Croatian | 9 | 0.1% |
| Cuban | 470 | 3.8% |
| Dominican | 224 | 1.8% |
| Dutch | 74 | 0.6% |
| Egyptian | 25 | 0.2% |
| English | 394 | 3.2% |
| European | 78 | 0.6% |
| Finnish | 7 | 0.1% |
| French | 116 | 0.9% |
| French American Indian | 26 | 0.2% |
| French Canadian | 27 | 0.2% |
| German | 1,074 | 8.7% |
| Guatemalan | 218 | 1.8% |
| Haitian | 185 | 1.5% |
| Honduran | 396 | 3.2% |
| Hungarian | 7 | 0.1% |
| Indian (Asian) | 21 | 0.2% |
| Irish | 699 | 5.6% |
| Italian | 436 | 3.5% |
| Jamaican | 121 | 1.0% |
| Korean | 11 | 0.1% |
| Lebanese | 44 | 0.4% |
| Lithuanian | 56 | 0.4% |
| Lumbee | 21 | 0.2% |
| Mexican | 872 | 7.0% |
| Nicaraguan | 100 | 0.8% |
| Norwegian | 15 | 0.1% |
| Pakistani | 19 | 0.2% |
| Polish | 59 | 0.5% |
| Portuguese | 15 | 0.1% |
| Puerto Rican | 2,033 | 16.4% |
| Romanian | 16 | 0.1% |
| Russian | 144 | 1.2% |
| Scotch-Irish | 50 | 0.4% |
| Scottish | 59 | 0.5% |
| South American | 152 | 1.2% |
| Spanish | 27 | 0.2% |
| Subsaharan African | 52 | 0.4% |
| Swedish | 23 | 0.2% |
| Swiss | 13 | 0.1% |
| Syrian | 11 | 0.1% |
| Thai | 340 | 2.7% |
| Ukrainian | 10 | 0.1% |
| Welsh | 36 | 0.3% |
| West Indian | 6 | 0.1% | View All 61 Rows |
Immigrants in Mango
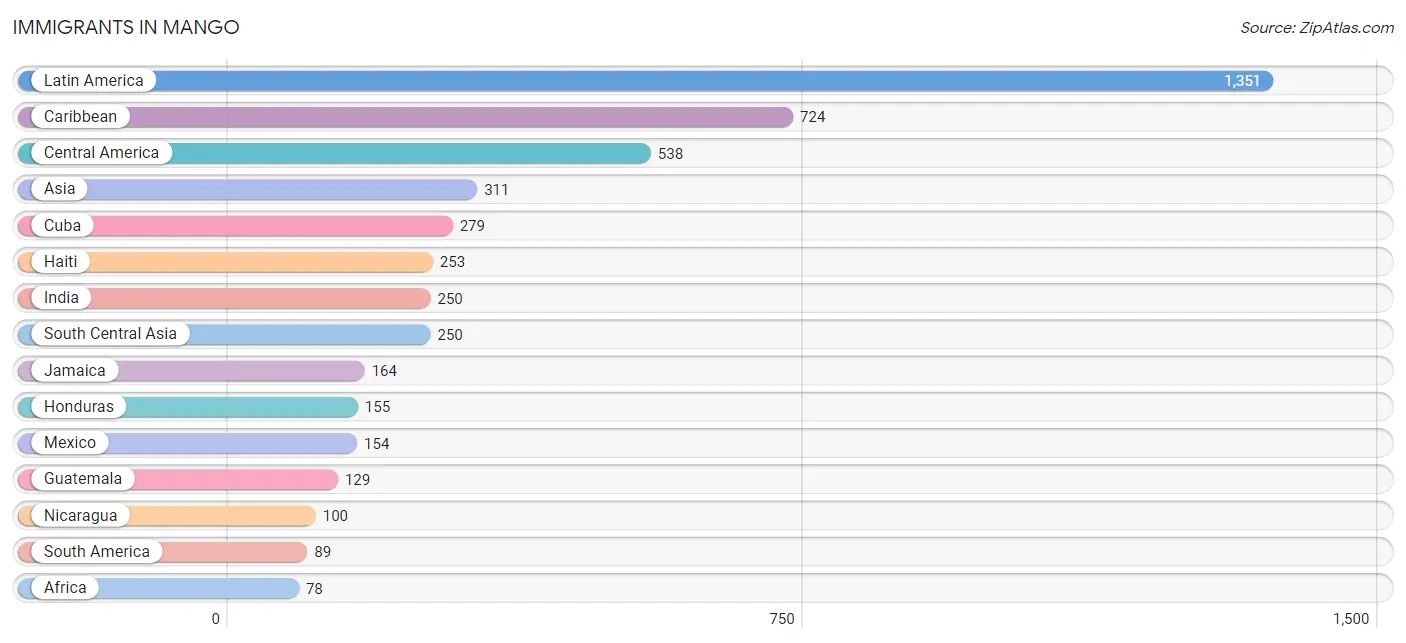
The most numerous immigrant groups reported in Mango came from Latin America (1,351 | 10.9%), Caribbean (724 | 5.8%), Central America (538 | 4.3%), Asia (311 | 2.5%), and Cuba (279 | 2.2%), together accounting for 25.8% of all Mango residents.
| Immigration Origin | # Population | % Population |
| Africa | 78 | 0.6% |
| Argentina | 42 | 0.3% |
| Asia | 311 | 2.5% |
| Cameroon | 13 | 0.1% |
| Caribbean | 724 | 5.8% |
| Central America | 538 | 4.3% |
| Chile | 24 | 0.2% |
| Colombia | 23 | 0.2% |
| Cuba | 279 | 2.2% |
| Dominican Republic | 22 | 0.2% |
| Eastern Africa | 22 | 0.2% |
| Eastern Asia | 21 | 0.2% |
| Egypt | 35 | 0.3% |
| Europe | 54 | 0.4% |
| Germany | 28 | 0.2% |
| Guatemala | 129 | 1.0% |
| Haiti | 253 | 2.0% |
| Honduras | 155 | 1.3% |
| India | 250 | 2.0% |
| Jamaica | 164 | 1.3% |
| Korea | 21 | 0.2% |
| Latin America | 1,351 | 10.9% |
| Lebanon | 29 | 0.2% |
| Mexico | 154 | 1.2% |
| Middle Africa | 13 | 0.1% |
| Nicaragua | 100 | 0.8% |
| Northern Africa | 35 | 0.3% |
| Northern Europe | 17 | 0.1% |
| Philippines | 11 | 0.1% |
| Portugal | 9 | 0.1% |
| Scotland | 17 | 0.1% |
| South Africa | 8 | 0.1% |
| South America | 89 | 0.7% |
| South Central Asia | 250 | 2.0% |
| South Eastern Asia | 11 | 0.1% |
| Southern Europe | 9 | 0.1% |
| Western Asia | 29 | 0.2% |
| Western Europe | 28 | 0.2% |
| Zimbabwe | 11 | 0.1% | View All 39 Rows |
Sex and Age in Mango
Sex and Age in Mango
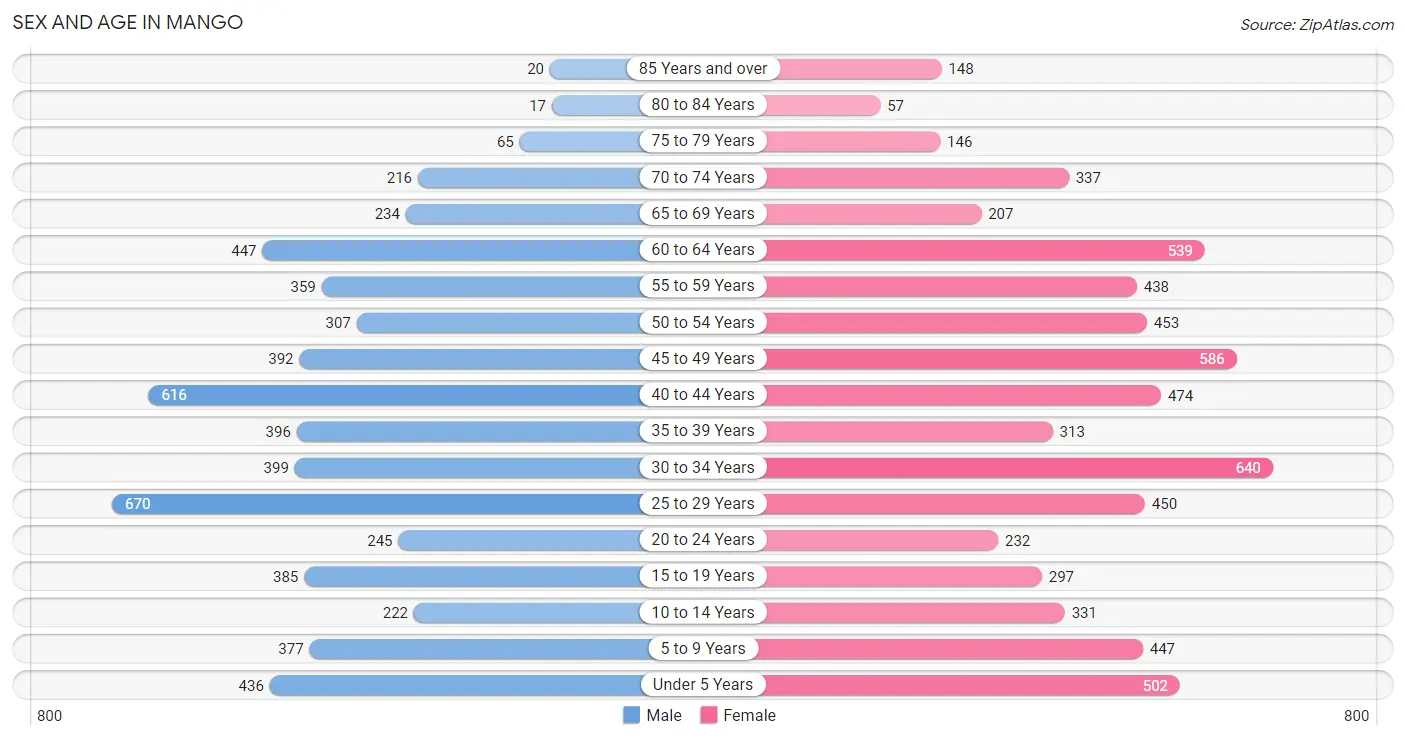
The most populous age groups in Mango are 25 to 29 Years (670 | 11.6%) for men and 30 to 34 Years (640 | 9.7%) for women.
| Age Bracket | Male | Female |
| Under 5 Years | 436 (7.5%) | 502 (7.6%) |
| 5 to 9 Years | 377 (6.5%) | 447 (6.8%) |
| 10 to 14 Years | 222 (3.8%) | 331 (5.0%) |
| 15 to 19 Years | 385 (6.6%) | 297 (4.5%) |
| 20 to 24 Years | 245 (4.2%) | 232 (3.5%) |
| 25 to 29 Years | 670 (11.6%) | 450 (6.8%) |
| 30 to 34 Years | 399 (6.9%) | 640 (9.7%) |
| 35 to 39 Years | 396 (6.8%) | 313 (4.7%) |
| 40 to 44 Years | 616 (10.6%) | 474 (7.2%) |
| 45 to 49 Years | 392 (6.8%) | 586 (8.9%) |
| 50 to 54 Years | 307 (5.3%) | 453 (6.9%) |
| 55 to 59 Years | 359 (6.2%) | 438 (6.6%) |
| 60 to 64 Years | 447 (7.7%) | 539 (8.2%) |
| 65 to 69 Years | 234 (4.0%) | 207 (3.1%) |
| 70 to 74 Years | 216 (3.7%) | 337 (5.1%) |
| 75 to 79 Years | 65 (1.1%) | 146 (2.2%) |
| 80 to 84 Years | 17 (0.3%) | 57 (0.9%) |
| 85 Years and over | 20 (0.3%) | 148 (2.2%) |
| Total | 5,803 (100.0%) | 6,597 (100.0%) |
Families and Households in Mango
Median Family Size in Mango
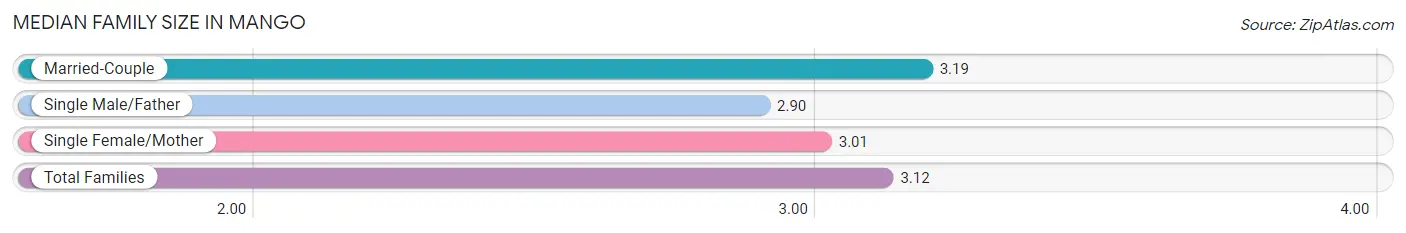
The median family size in Mango is 3.12 persons per family, with married-couple families (2,007 | 67.0%) accounting for the largest median family size of 3.19 persons per family. On the other hand, single male/father families (247 | 8.3%) represent the smallest median family size with 2.90 persons per family.
| Family Type | # Families | Family Size |
| Married-Couple | 2,007 (67.0%) | 3.19 |
| Single Male/Father | 247 (8.3%) | 2.90 |
| Single Female/Mother | 741 (24.7%) | 3.01 |
| Total Families | 2,995 (100.0%) | 3.12 |
Median Household Size in Mango
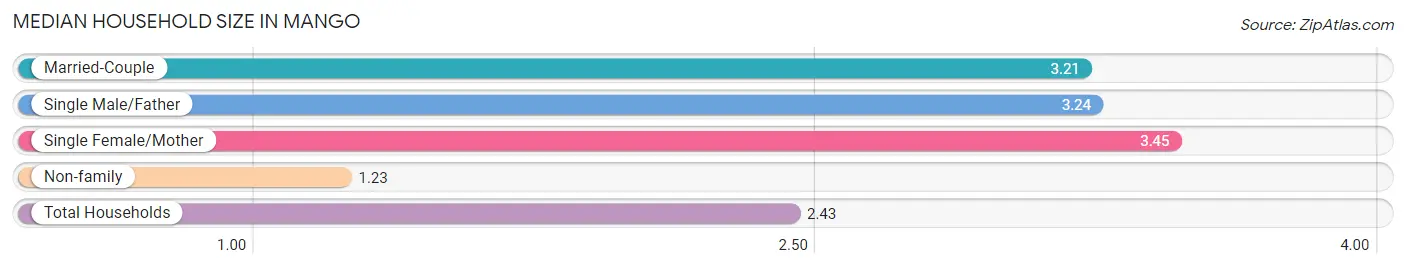
The median household size in Mango is 2.43 persons per household, with single female/mother households (741 | 14.5%) accounting for the largest median household size of 3.45 persons per household. non-family households (2,103 | 41.2%) represent the smallest median household size with 1.23 persons per household.
| Household Type | # Households | Household Size |
| Married-Couple | 2,007 (39.4%) | 3.21 |
| Single Male/Father | 247 (4.9%) | 3.24 |
| Single Female/Mother | 741 (14.5%) | 3.45 |
| Non-family | 2,103 (41.2%) | 1.23 |
| Total Households | 5,098 (100.0%) | 2.43 |
Household Size by Marriage Status in Mango
Out of a total of 5,098 households in Mango, 2,995 (58.8%) are family households, while 2,103 (41.2%) are nonfamily households. The most numerous type of family households are 2-person households, comprising 1,175, and the most common type of nonfamily households are 1-person households, comprising 1,680.
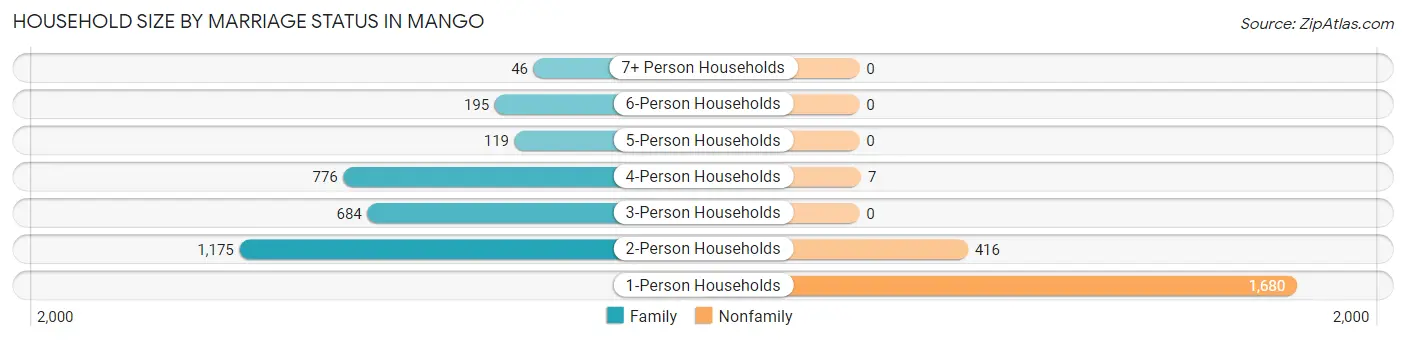
| Household Size | Family Households | Nonfamily Households |
| 1-Person Households | - | 1,680 (33.0%) |
| 2-Person Households | 1,175 (23.1%) | 416 (8.2%) |
| 3-Person Households | 684 (13.4%) | 0 (0.0%) |
| 4-Person Households | 776 (15.2%) | 7 (0.1%) |
| 5-Person Households | 119 (2.3%) | 0 (0.0%) |
| 6-Person Households | 195 (3.8%) | 0 (0.0%) |
| 7+ Person Households | 46 (0.9%) | 0 (0.0%) |
| Total | 2,995 (58.8%) | 2,103 (41.2%) |
Female Fertility in Mango
Fertility by Age in Mango
Average fertility rate in Mango is 57.0 births per 1,000 women. Women in the age bracket of 20 to 34 years have the highest fertility rate with 104.0 births per 1,000 women. Women in the age bracket of 20 to 34 years acount for 79.6% of all women with births.
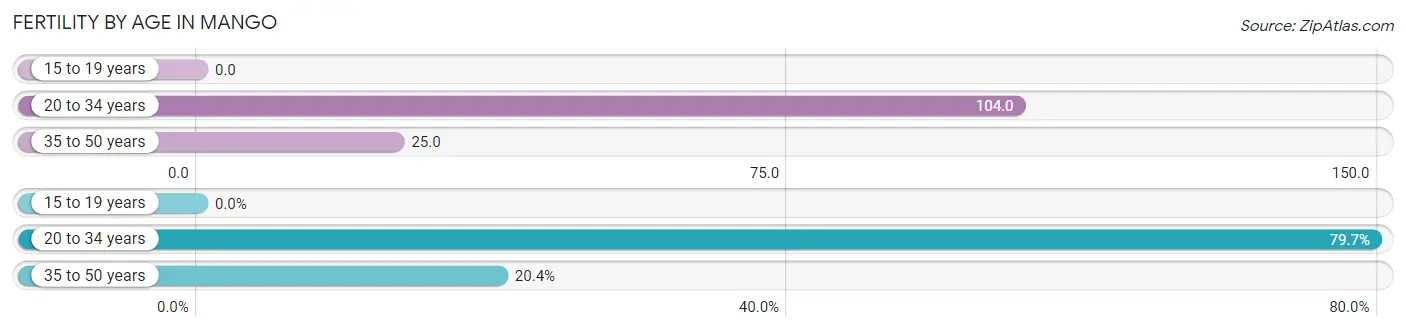
| Age Bracket | Women with Births | Births / 1,000 Women |
| 15 to 19 years | 0 (0.0%) | 0.0 |
| 20 to 34 years | 137 (79.6%) | 104.0 |
| 35 to 50 years | 35 (20.3%) | 25.0 |
| Total | 172 (100.0%) | 57.0 |
Fertility by Age by Marriage Status in Mango
74.4% of women with births (172) in Mango are married. The highest percentage of unmarried women with births falls into 35 to 50 years age bracket with 100.0% of them unmarried at the time of birth, while the lowest percentage of unmarried women with births belong to 20 to 34 years age bracket with 6.6% of them unmarried.
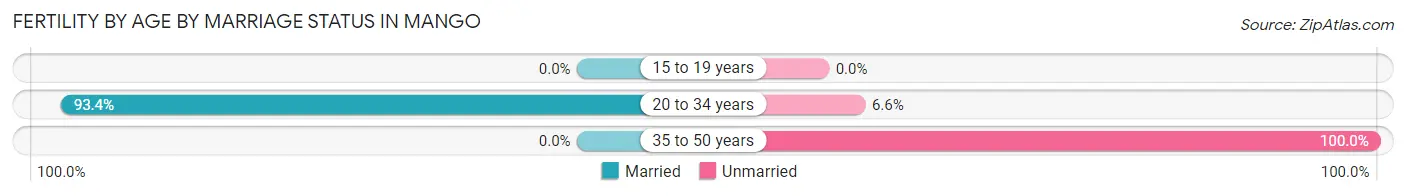
| Age Bracket | Married | Unmarried |
| 15 to 19 years | 0 (0.0%) | 0 (0.0%) |
| 20 to 34 years | 128 (93.4%) | 9 (6.6%) |
| 35 to 50 years | 0 (0.0%) | 35 (100.0%) |
| Total | 128 (74.4%) | 44 (25.6%) |
Fertility by Education in Mango
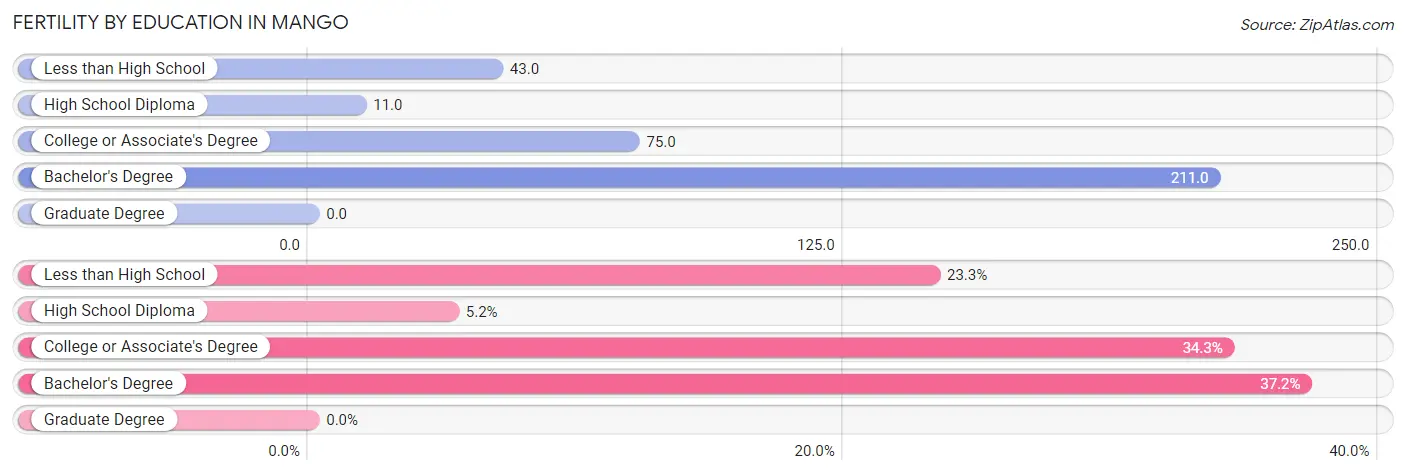
| Educational Attainment | Women with Births | Births / 1,000 Women |
| Less than High School | 40 (23.3%) | 43.0 |
| High School Diploma | 9 (5.2%) | 11.0 |
| College or Associate's Degree | 59 (34.3%) | 75.0 |
| Bachelor's Degree | 64 (37.2%) | 211.0 |
| Graduate Degree | 0 (0.0%) | 0.0 |
| Total | 172 (100.0%) | 57.0 |
Fertility by Education by Marriage Status in Mango
25.6% of women with births in Mango are unmarried. Women with the educational attainment of less than high school are most likely to be married with 100.0% of them married at childbirth, while women with the educational attainment of high school diploma are least likely to be married with 100.0% of them unmarried at childbirth.
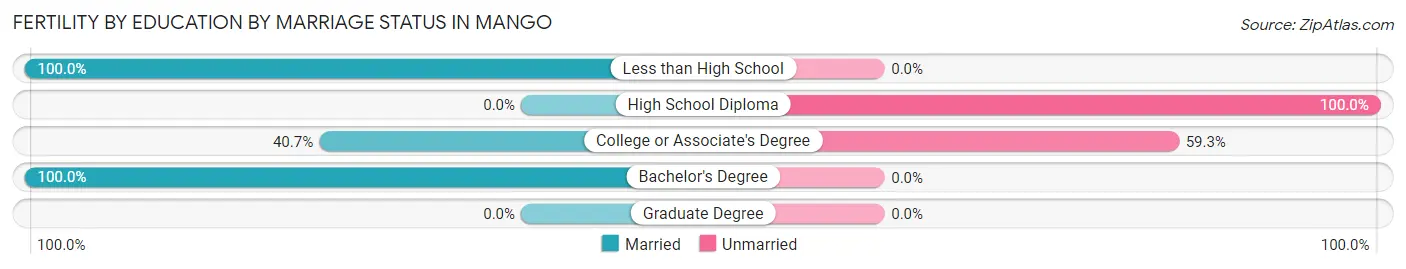
| Educational Attainment | Married | Unmarried |
| Less than High School | 40 (100.0%) | 0 (0.0%) |
| High School Diploma | 0 (0.0%) | 9 (100.0%) |
| College or Associate's Degree | 24 (40.7%) | 35 (59.3%) |
| Bachelor's Degree | 64 (100.0%) | 0 (0.0%) |
| Graduate Degree | 0 (0.0%) | 0 (0.0%) |
| Total | 128 (74.4%) | 44 (25.6%) |
Employment Characteristics in Mango
Employment by Class of Employer in Mango
Among the 5,350 employed individuals in Mango, private company employees (4,347 | 81.2%), local government employees (214 | 4.0%), and self-employed (not incorporated) (187 | 3.5%) make up the most common classes of employment.
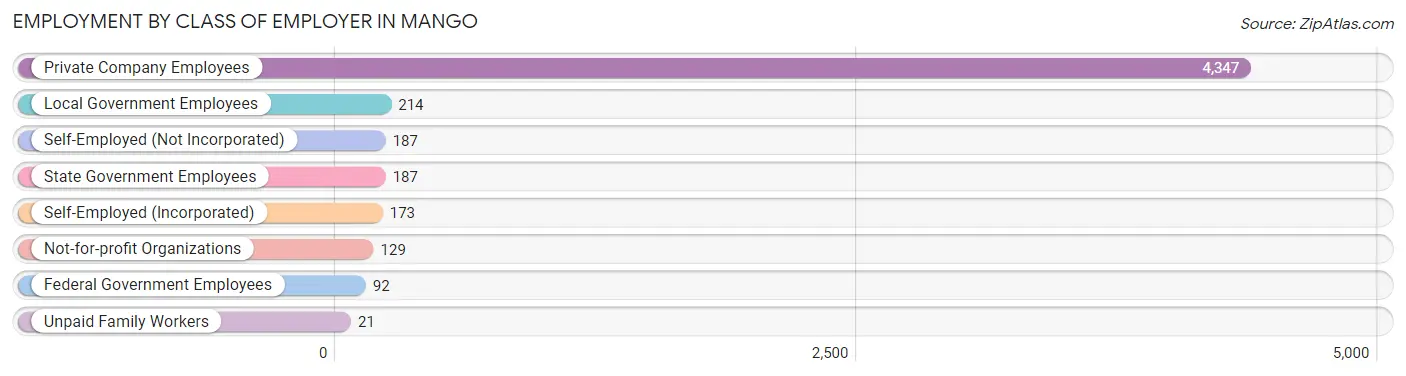
| Employer Class | # Employees | % Employees |
| Private Company Employees | 4,347 | 81.2% |
| Self-Employed (Incorporated) | 173 | 3.2% |
| Self-Employed (Not Incorporated) | 187 | 3.5% |
| Not-for-profit Organizations | 129 | 2.4% |
| Local Government Employees | 214 | 4.0% |
| State Government Employees | 187 | 3.5% |
| Federal Government Employees | 92 | 1.7% |
| Unpaid Family Workers | 21 | 0.4% |
| Total | 5,350 | 100.0% |
Employment Status by Age in Mango
According to the labor force statistics for Mango, out of the total population over 16 years of age (9,859), 57.8% or 5,699 individuals are in the labor force, with 5.3% or 302 of them unemployed. The age group with the highest labor force participation rate is 30 to 34 years, with 83.3% or 865 individuals in the labor force. Within the labor force, the 65 to 74 years age range has the highest percentage of unemployed individuals, with 16.3% or 30 of them being unemployed.
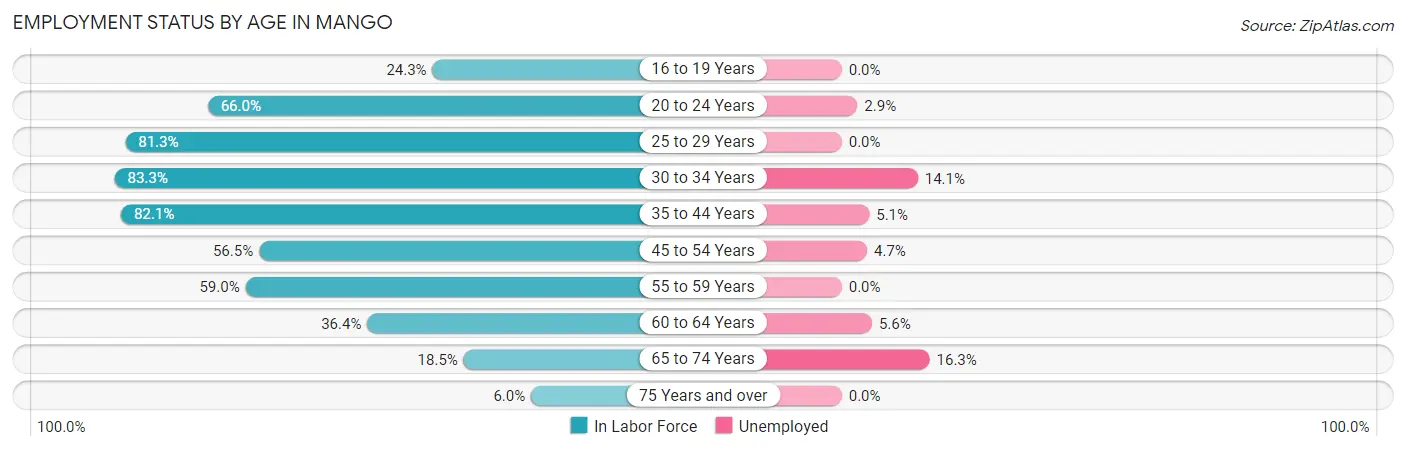
| Age Bracket | In Labor Force | Unemployed |
| 16 to 19 Years | 111 (24.3%) | 0 (0.0%) |
| 20 to 24 Years | 315 (66.0%) | 9 (2.9%) |
| 25 to 29 Years | 911 (81.3%) | 0 (0.0%) |
| 30 to 34 Years | 865 (83.3%) | 122 (14.1%) |
| 35 to 44 Years | 1,477 (82.1%) | 75 (5.1%) |
| 45 to 54 Years | 982 (56.5%) | 46 (4.7%) |
| 55 to 59 Years | 470 (59.0%) | 0 (0.0%) |
| 60 to 64 Years | 359 (36.4%) | 20 (5.6%) |
| 65 to 74 Years | 184 (18.5%) | 30 (16.3%) |
| 75 Years and over | 27 (6.0%) | 0 (0.0%) |
| Total | 5,699 (57.8%) | 302 (5.3%) |
Employment Status by Educational Attainment in Mango
According to labor force statistics for Mango, 67.7% of individuals (5,063) out of the total population between 25 and 64 years of age (7,479) are in the labor force, with 5.2% or 263 of them being unemployed. The group with the highest labor force participation rate are those with the educational attainment of bachelor's degree or higher, with 79.5% or 746 individuals in the labor force. Within the labor force, individuals with bachelor's degree or higher education have the highest percentage of unemployment, with 11.1% or 83 of them being unemployed.
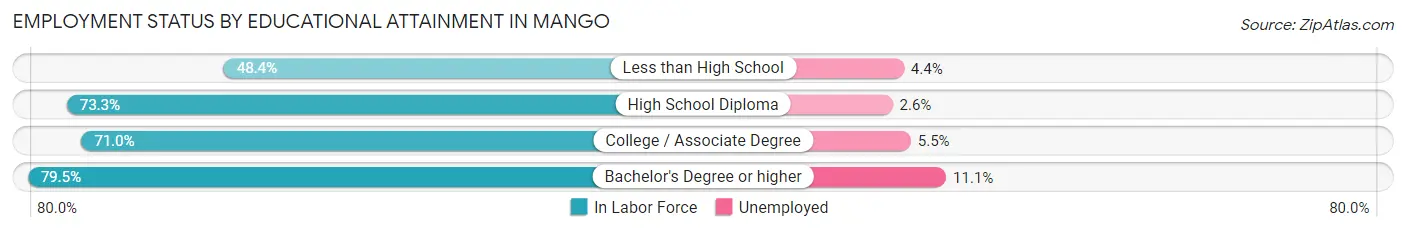
| Educational Attainment | In Labor Force | Unemployed |
| Less than High School | 804 (48.4%) | 73 (4.4%) |
| High School Diploma | 1,602 (73.3%) | 57 (2.6%) |
| College / Associate Degree | 1,913 (71.0%) | 148 (5.5%) |
| Bachelor's Degree or higher | 746 (79.5%) | 104 (11.1%) |
| Total | 5,063 (67.7%) | 389 (5.2%) |
Employment Occupations by Sex in Mango
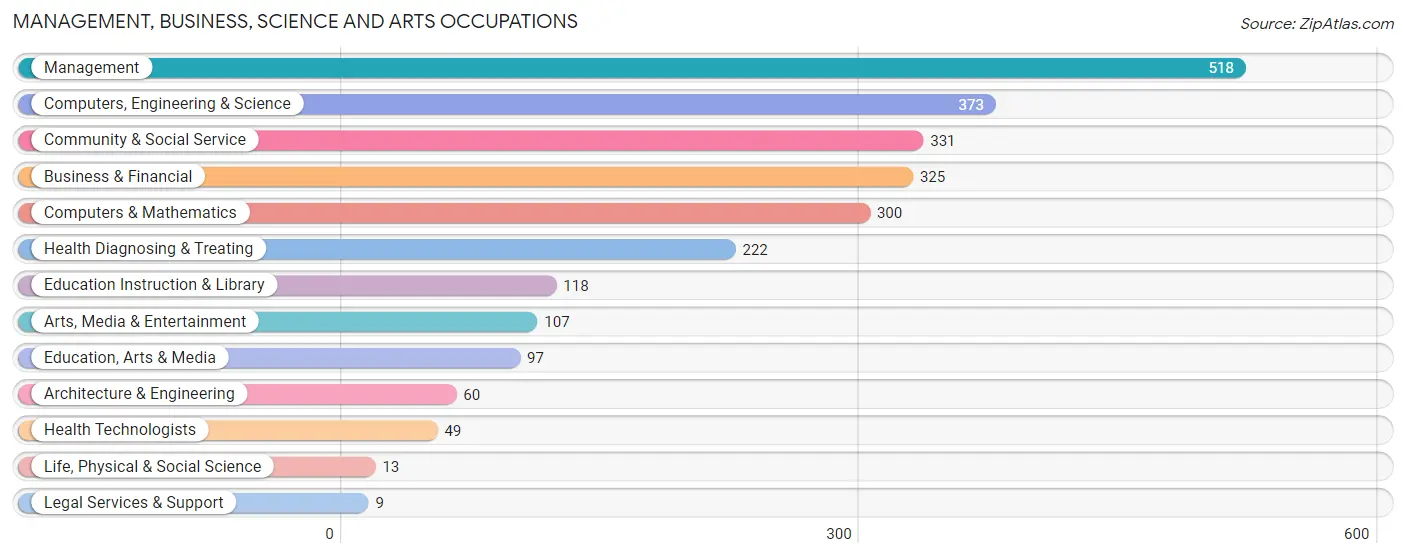
Management, Business, Science and Arts Occupations
The most common Management, Business, Science and Arts occupations in Mango are Management (518 | 9.7%), Computers, Engineering & Science (373 | 7.0%), Community & Social Service (331 | 6.2%), Business & Financial (325 | 6.1%), and Computers & Mathematics (300 | 5.6%).
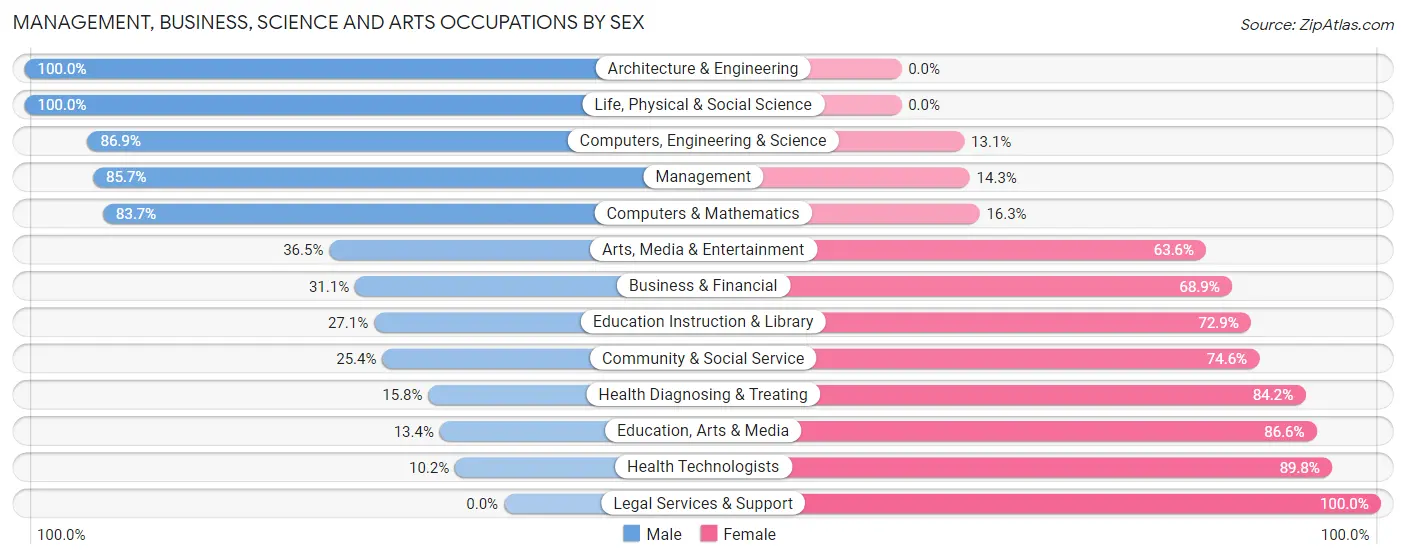
Management, Business, Science and Arts Occupations by Sex
Within the Management, Business, Science and Arts occupations in Mango, the most male-oriented occupations are Architecture & Engineering (100.0%), Life, Physical & Social Science (100.0%), and Computers, Engineering & Science (86.9%), while the most female-oriented occupations are Legal Services & Support (100.0%), Health Technologists (89.8%), and Education, Arts & Media (86.6%).
| Occupation | Male | Female |
| Management | 444 (85.7%) | 74 (14.3%) |
| Business & Financial | 101 (31.1%) | 224 (68.9%) |
| Computers, Engineering & Science | 324 (86.9%) | 49 (13.1%) |
| Computers & Mathematics | 251 (83.7%) | 49 (16.3%) |
| Architecture & Engineering | 60 (100.0%) | 0 (0.0%) |
| Life, Physical & Social Science | 13 (100.0%) | 0 (0.0%) |
| Community & Social Service | 84 (25.4%) | 247 (74.6%) |
| Education, Arts & Media | 13 (13.4%) | 84 (86.6%) |
| Legal Services & Support | 0 (0.0%) | 9 (100.0%) |
| Education Instruction & Library | 32 (27.1%) | 86 (72.9%) |
| Arts, Media & Entertainment | 39 (36.4%) | 68 (63.5%) |
| Health Diagnosing & Treating | 35 (15.8%) | 187 (84.2%) |
| Health Technologists | 5 (10.2%) | 44 (89.8%) |
| Total (Category) | 988 (55.8%) | 781 (44.2%) |
| Total (Overall) | 2,937 (54.9%) | 2,416 (45.1%) |
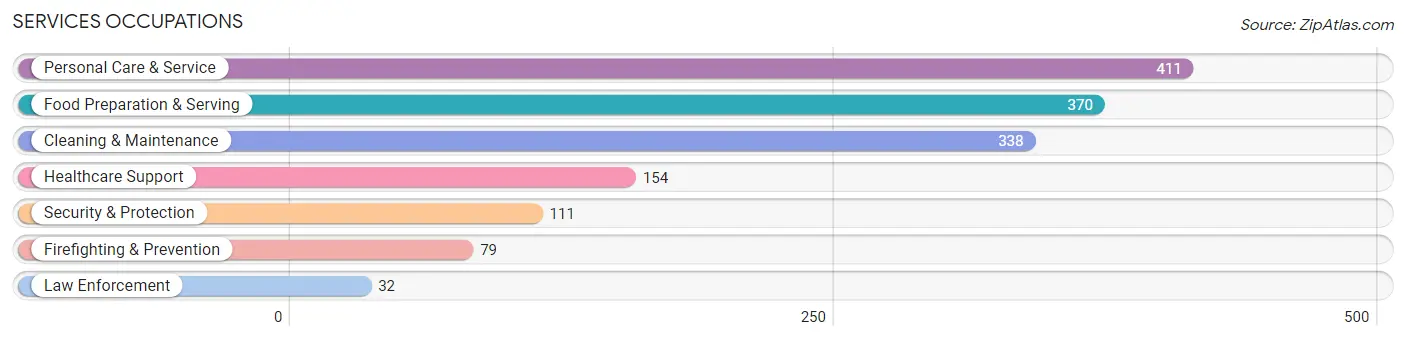
Services Occupations
The most common Services occupations in Mango are Personal Care & Service (411 | 7.7%), Food Preparation & Serving (370 | 6.9%), Cleaning & Maintenance (338 | 6.3%), Healthcare Support (154 | 2.9%), and Security & Protection (111 | 2.1%).
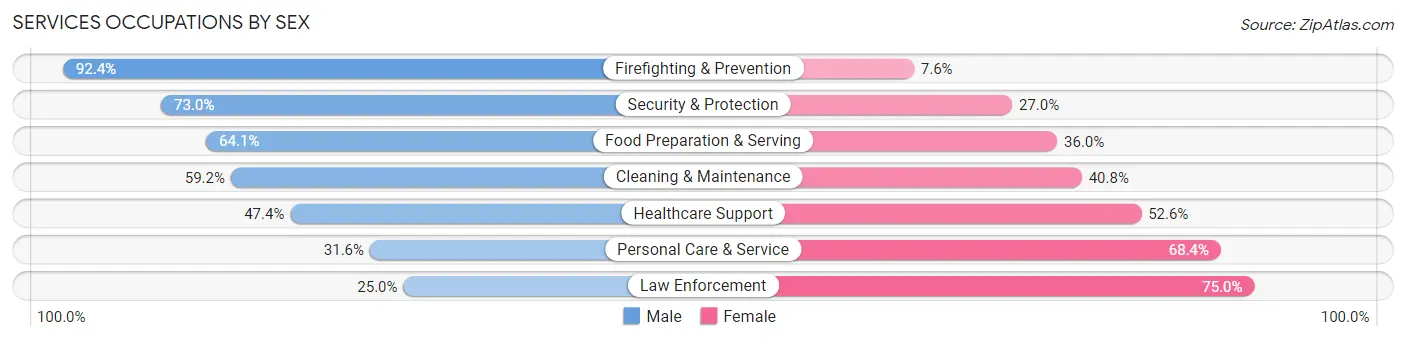
Services Occupations by Sex
Within the Services occupations in Mango, the most male-oriented occupations are Firefighting & Prevention (92.4%), Security & Protection (73.0%), and Food Preparation & Serving (64.0%), while the most female-oriented occupations are Law Enforcement (75.0%), Personal Care & Service (68.4%), and Healthcare Support (52.6%).
| Occupation | Male | Female |
| Healthcare Support | 73 (47.4%) | 81 (52.6%) |
| Security & Protection | 81 (73.0%) | 30 (27.0%) |
| Firefighting & Prevention | 73 (92.4%) | 6 (7.6%) |
| Law Enforcement | 8 (25.0%) | 24 (75.0%) |
| Food Preparation & Serving | 237 (64.0%) | 133 (35.9%) |
| Cleaning & Maintenance | 200 (59.2%) | 138 (40.8%) |
| Personal Care & Service | 130 (31.6%) | 281 (68.4%) |
| Total (Category) | 721 (52.1%) | 663 (47.9%) |
| Total (Overall) | 2,937 (54.9%) | 2,416 (45.1%) |
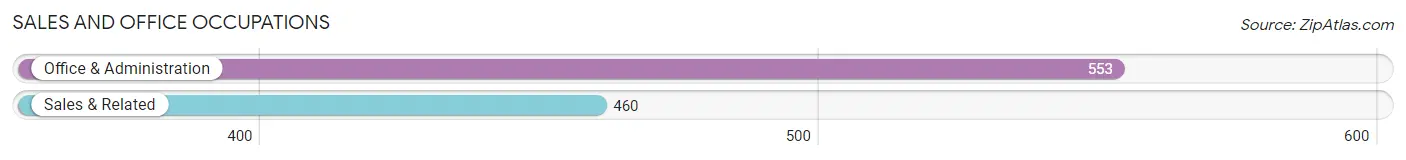
Sales and Office Occupations
The most common Sales and Office occupations in Mango are Office & Administration (553 | 10.3%), and Sales & Related (460 | 8.6%).
Sales and Office Occupations by Sex
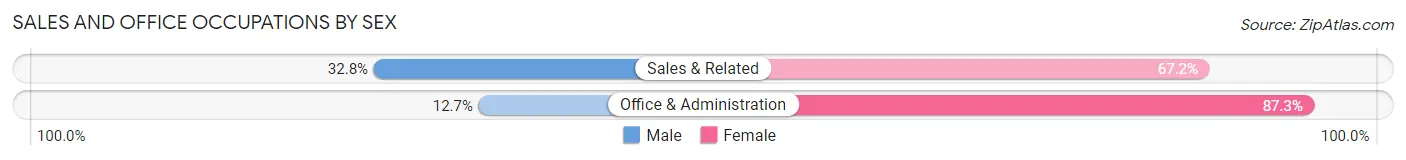
| Occupation | Male | Female |
| Sales & Related | 151 (32.8%) | 309 (67.2%) |
| Office & Administration | 70 (12.7%) | 483 (87.3%) |
| Total (Category) | 221 (21.8%) | 792 (78.2%) |
| Total (Overall) | 2,937 (54.9%) | 2,416 (45.1%) |
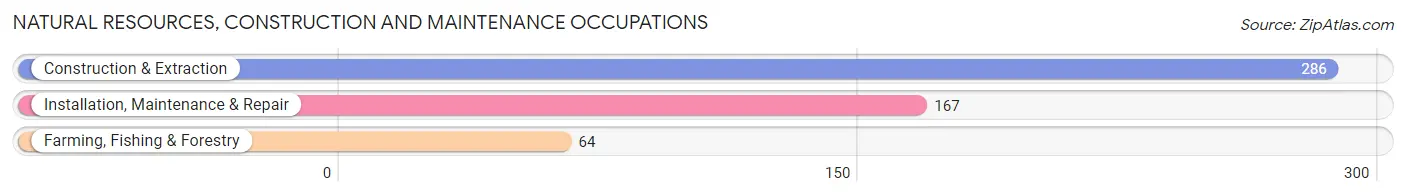
Natural Resources, Construction and Maintenance Occupations
The most common Natural Resources, Construction and Maintenance occupations in Mango are Construction & Extraction (286 | 5.3%), Installation, Maintenance & Repair (167 | 3.1%), and Farming, Fishing & Forestry (64 | 1.2%).
Natural Resources, Construction and Maintenance Occupations by Sex
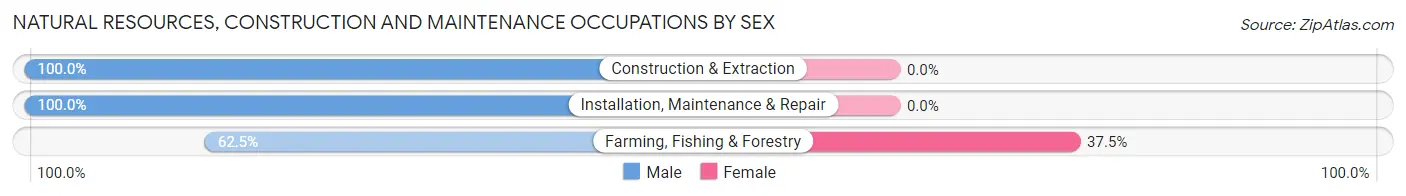
| Occupation | Male | Female |
| Farming, Fishing & Forestry | 40 (62.5%) | 24 (37.5%) |
| Construction & Extraction | 286 (100.0%) | 0 (0.0%) |
| Installation, Maintenance & Repair | 167 (100.0%) | 0 (0.0%) |
| Total (Category) | 493 (95.4%) | 24 (4.6%) |
| Total (Overall) | 2,937 (54.9%) | 2,416 (45.1%) |
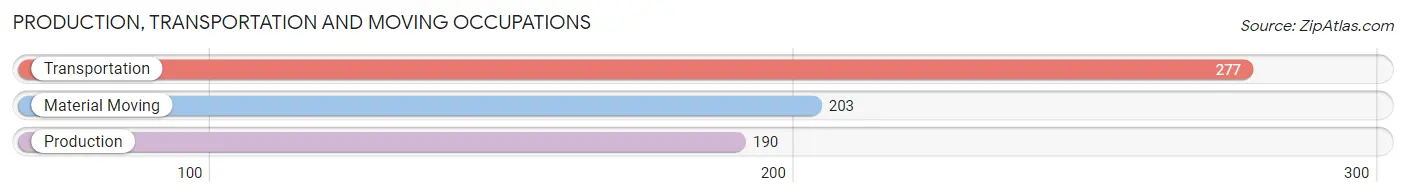
Production, Transportation and Moving Occupations
The most common Production, Transportation and Moving occupations in Mango are Transportation (277 | 5.2%), Material Moving (203 | 3.8%), and Production (190 | 3.5%).
Production, Transportation and Moving Occupations by Sex
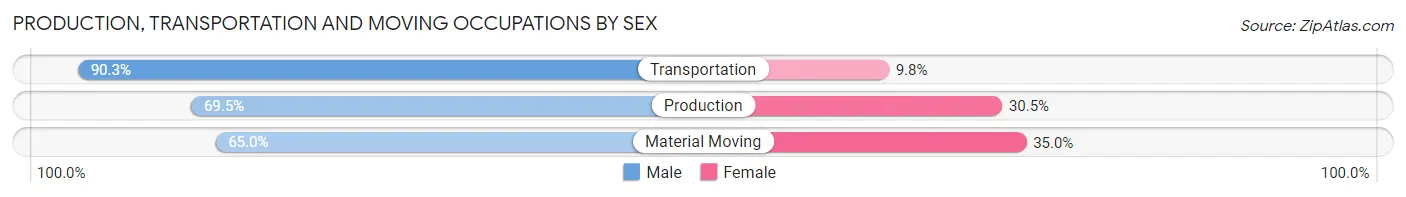
| Occupation | Male | Female |
| Production | 132 (69.5%) | 58 (30.5%) |
| Transportation | 250 (90.2%) | 27 (9.8%) |
| Material Moving | 132 (65.0%) | 71 (35.0%) |
| Total (Category) | 514 (76.7%) | 156 (23.3%) |
| Total (Overall) | 2,937 (54.9%) | 2,416 (45.1%) |
Employment Industries by Sex in Mango
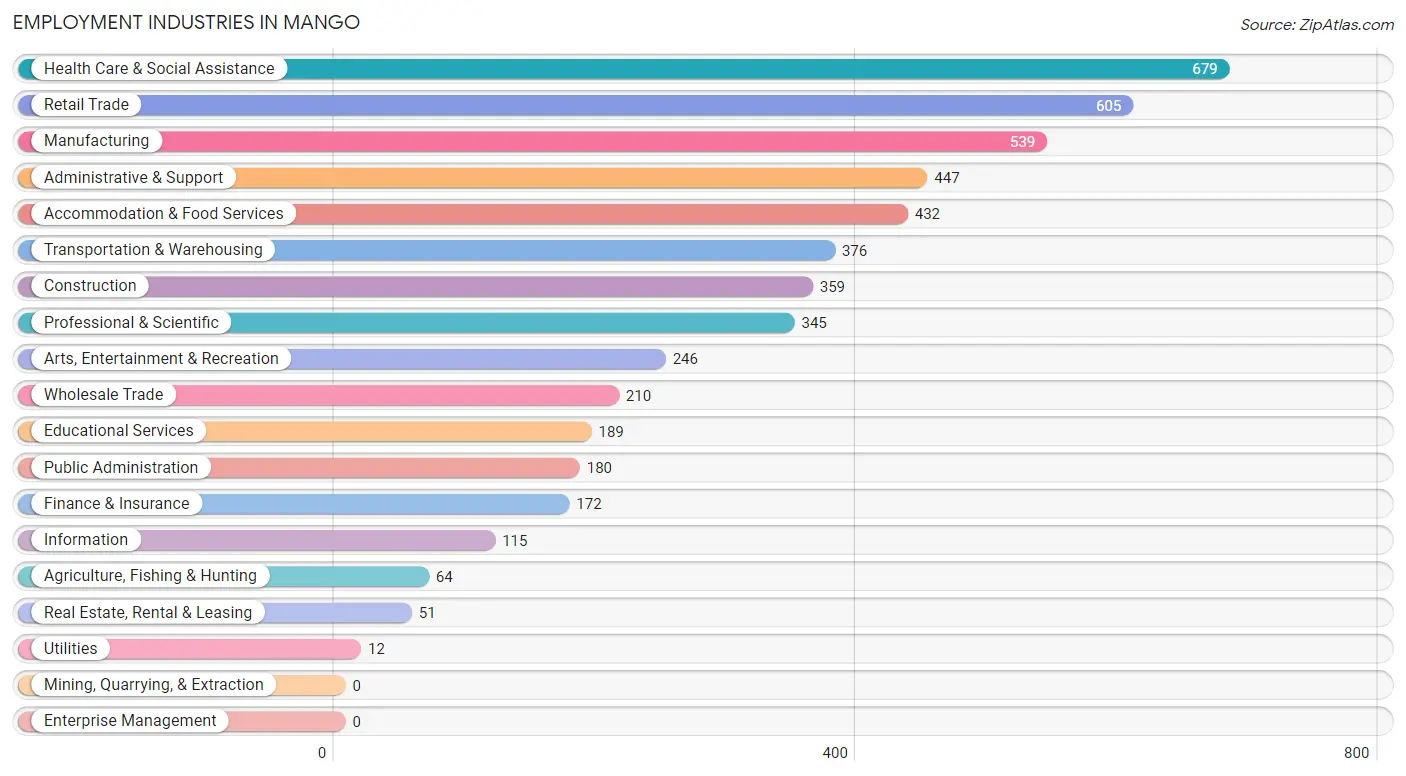
Employment Industries in Mango
The major employment industries in Mango include Health Care & Social Assistance (679 | 12.7%), Retail Trade (605 | 11.3%), Manufacturing (539 | 10.1%), Administrative & Support (447 | 8.4%), and Accommodation & Food Services (432 | 8.1%).
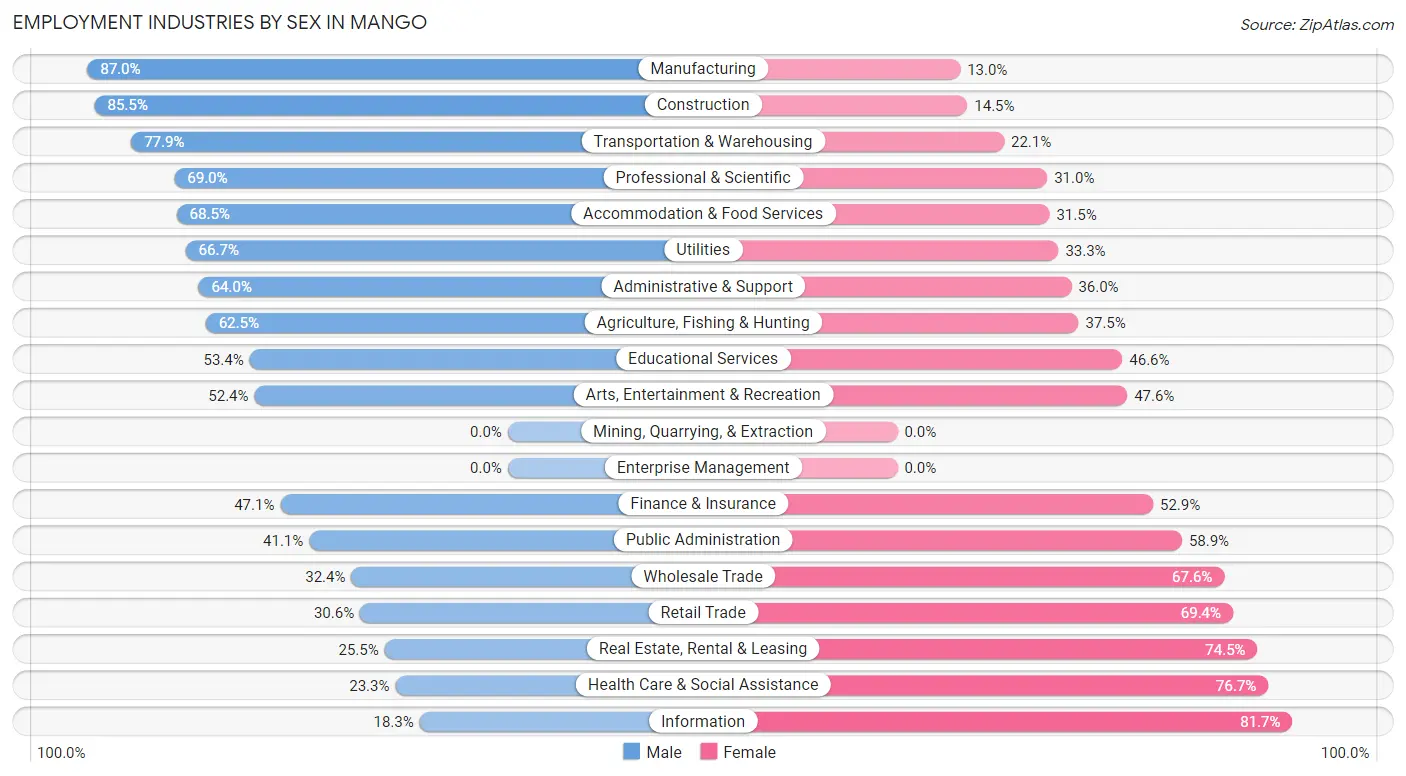
Employment Industries by Sex in Mango
The Mango industries that see more men than women are Manufacturing (87.0%), Construction (85.5%), and Transportation & Warehousing (77.9%), whereas the industries that tend to have a higher number of women are Information (81.7%), Health Care & Social Assistance (76.7%), and Real Estate, Rental & Leasing (74.5%).
| Industry | Male | Female |
| Agriculture, Fishing & Hunting | 40 (62.5%) | 24 (37.5%) |
| Mining, Quarrying, & Extraction | 0 (0.0%) | 0 (0.0%) |
| Construction | 307 (85.5%) | 52 (14.5%) |
| Manufacturing | 469 (87.0%) | 70 (13.0%) |
| Wholesale Trade | 68 (32.4%) | 142 (67.6%) |
| Retail Trade | 185 (30.6%) | 420 (69.4%) |
| Transportation & Warehousing | 293 (77.9%) | 83 (22.1%) |
| Utilities | 8 (66.7%) | 4 (33.3%) |
| Information | 21 (18.3%) | 94 (81.7%) |
| Finance & Insurance | 81 (47.1%) | 91 (52.9%) |
| Real Estate, Rental & Leasing | 13 (25.5%) | 38 (74.5%) |
| Professional & Scientific | 238 (69.0%) | 107 (31.0%) |
| Enterprise Management | 0 (0.0%) | 0 (0.0%) |
| Administrative & Support | 286 (64.0%) | 161 (36.0%) |
| Educational Services | 101 (53.4%) | 88 (46.6%) |
| Health Care & Social Assistance | 158 (23.3%) | 521 (76.7%) |
| Arts, Entertainment & Recreation | 129 (52.4%) | 117 (47.6%) |
| Accommodation & Food Services | 296 (68.5%) | 136 (31.5%) |
| Public Administration | 74 (41.1%) | 106 (58.9%) |
| Total | 2,937 (54.9%) | 2,416 (45.1%) |
Education in Mango
School Enrollment in Mango
The most common levels of schooling among the 2,454 students in Mango are high school (597 | 24.3%), elementary school (510 | 20.8%), and middle school (500 | 20.4%).
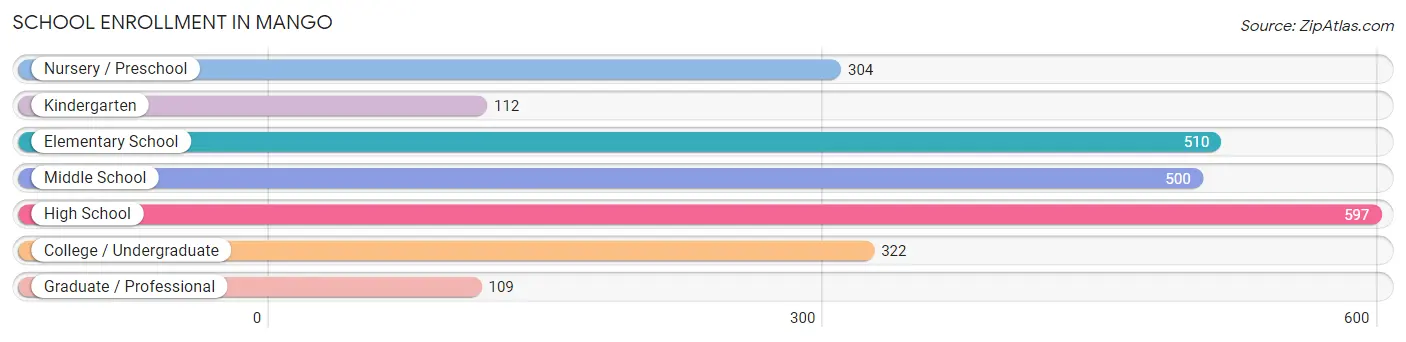
| School Level | # Students | % Students |
| Nursery / Preschool | 304 | 12.4% |
| Kindergarten | 112 | 4.6% |
| Elementary School | 510 | 20.8% |
| Middle School | 500 | 20.4% |
| High School | 597 | 24.3% |
| College / Undergraduate | 322 | 13.1% |
| Graduate / Professional | 109 | 4.4% |
| Total | 2,454 | 100.0% |
School Enrollment by Age by Funding Source in Mango
Out of a total of 2,454 students who are enrolled in schools in Mango, 167 (6.8%) attend a private institution, while the remaining 2,287 (93.2%) are enrolled in public schools. The age group of 35 years and over has the highest likelihood of being enrolled in private schools, with 23 (31.9% in the age bracket) enrolled. Conversely, the age group of 3 to 4 year olds has the lowest likelihood of being enrolled in a private school, with 218 (100.0% in the age bracket) attending a public institution.
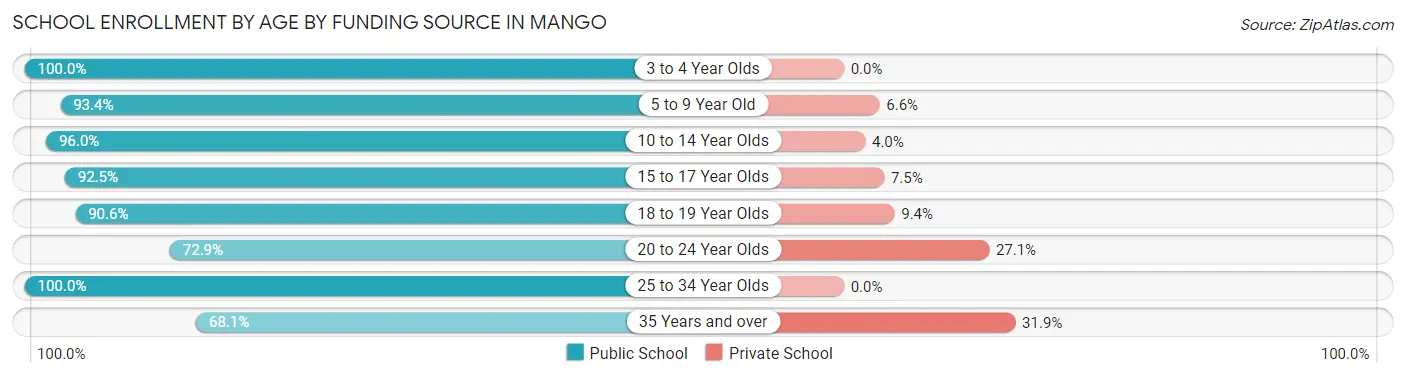
| Age Bracket | Public School | Private School |
| 3 to 4 Year Olds | 218 (100.0%) | 0 (0.0%) |
| 5 to 9 Year Old | 661 (93.4%) | 47 (6.6%) |
| 10 to 14 Year Olds | 507 (96.0%) | 21 (4.0%) |
| 15 to 17 Year Olds | 518 (92.5%) | 42 (7.5%) |
| 18 to 19 Year Olds | 96 (90.6%) | 10 (9.4%) |
| 20 to 24 Year Olds | 62 (72.9%) | 23 (27.1%) |
| 25 to 34 Year Olds | 177 (100.0%) | 0 (0.0%) |
| 35 Years and over | 49 (68.1%) | 23 (31.9%) |
| Total | 2,287 (93.2%) | 167 (6.8%) |
Educational Attainment by Field of Study in Mango
Business (383 | 32.7%), education (219 | 18.7%), visual & performing arts (97 | 8.3%), psychology (95 | 8.1%), and engineering (83 | 7.1%) are the most common fields of study among 1,170 individuals in Mango who have obtained a bachelor's degree or higher.
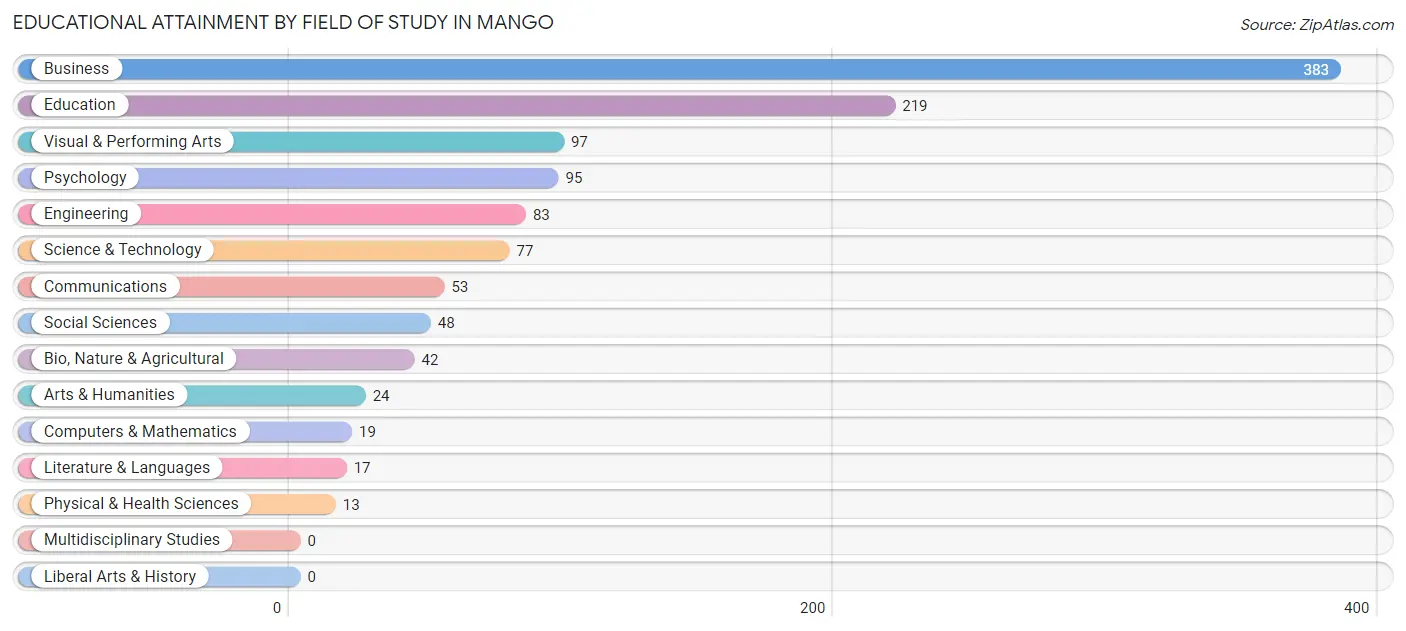
| Field of Study | # Graduates | % Graduates |
| Computers & Mathematics | 19 | 1.6% |
| Bio, Nature & Agricultural | 42 | 3.6% |
| Physical & Health Sciences | 13 | 1.1% |
| Psychology | 95 | 8.1% |
| Social Sciences | 48 | 4.1% |
| Engineering | 83 | 7.1% |
| Multidisciplinary Studies | 0 | 0.0% |
| Science & Technology | 77 | 6.6% |
| Business | 383 | 32.7% |
| Education | 219 | 18.7% |
| Literature & Languages | 17 | 1.5% |
| Liberal Arts & History | 0 | 0.0% |
| Visual & Performing Arts | 97 | 8.3% |
| Communications | 53 | 4.5% |
| Arts & Humanities | 24 | 2.1% |
| Total | 1,170 | 100.0% |
Transportation & Commute in Mango
Vehicle Availability by Sex in Mango
The most prevalent vehicle ownership categories in Mango are males with 2 vehicles (1,586, accounting for 53.7%) and females with 2 vehicles (930, making up 66.2%).
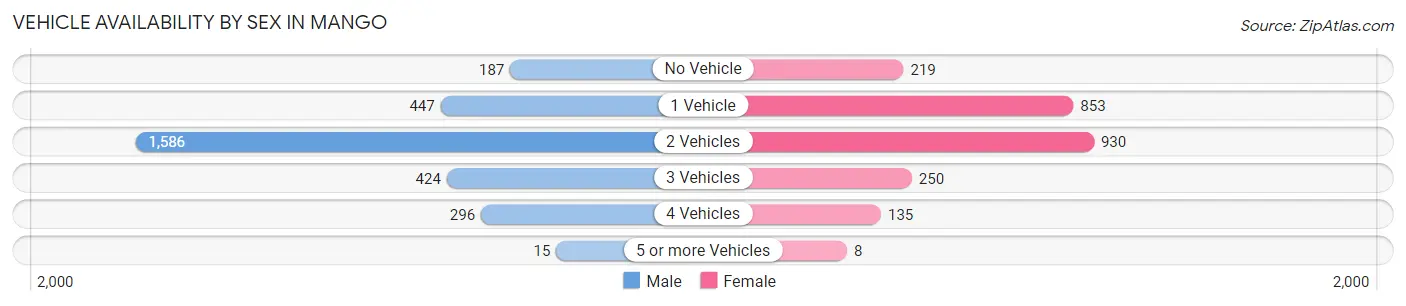
| Vehicles Available | Male | Female |
| No Vehicle | 187 (6.3%) | 219 (9.1%) |
| 1 Vehicle | 447 (15.1%) | 853 (35.6%) |
| 2 Vehicles | 1,586 (53.7%) | 930 (38.8%) |
| 3 Vehicles | 424 (14.3%) | 250 (10.4%) |
| 4 Vehicles | 296 (10.0%) | 135 (5.6%) |
| 5 or more Vehicles | 15 (0.5%) | 8 (0.3%) |
| Total | 2,955 (100.0%) | 2,395 (100.0%) |
Commute Time in Mango
The most frequently occuring commute durations in Mango are 30 to 34 minutes (1,094 commuters, 23.2%), 10 to 14 minutes (843 commuters, 17.9%), and 15 to 19 minutes (626 commuters, 13.3%).
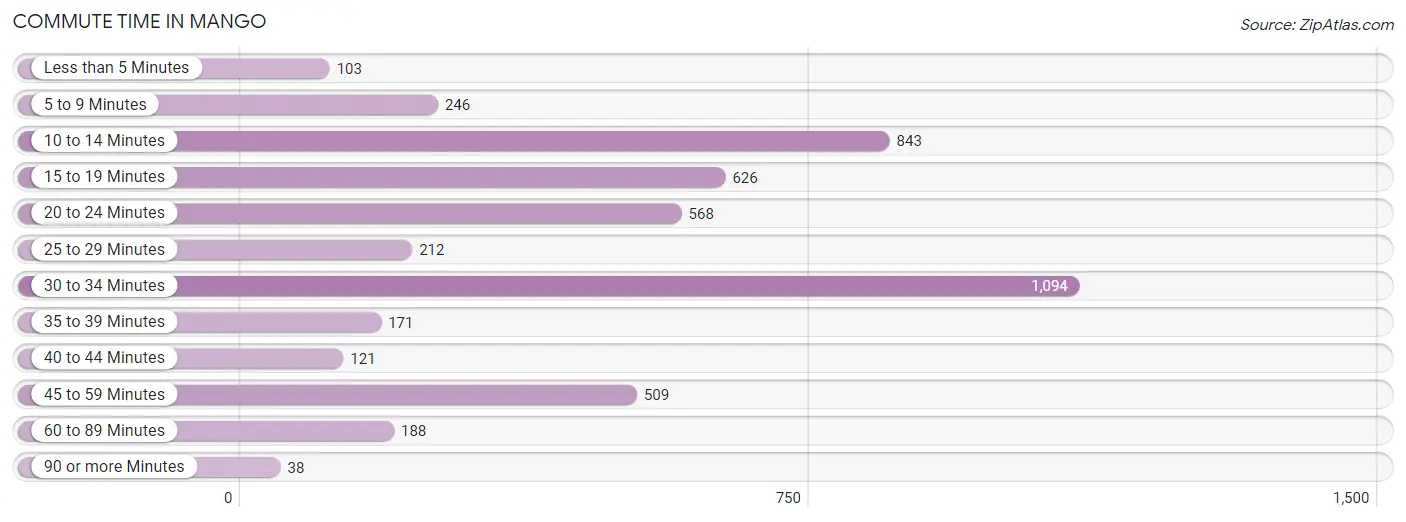
| Commute Time | # Commuters | % Commuters |
| Less than 5 Minutes | 103 | 2.2% |
| 5 to 9 Minutes | 246 | 5.2% |
| 10 to 14 Minutes | 843 | 17.9% |
| 15 to 19 Minutes | 626 | 13.3% |
| 20 to 24 Minutes | 568 | 12.0% |
| 25 to 29 Minutes | 212 | 4.5% |
| 30 to 34 Minutes | 1,094 | 23.2% |
| 35 to 39 Minutes | 171 | 3.6% |
| 40 to 44 Minutes | 121 | 2.6% |
| 45 to 59 Minutes | 509 | 10.8% |
| 60 to 89 Minutes | 188 | 4.0% |
| 90 or more Minutes | 38 | 0.8% |
Commute Time by Sex in Mango
The most common commute times in Mango are 30 to 34 minutes (860 commuters, 31.9%) for males and 45 to 59 minutes (409 commuters, 20.3%) for females.
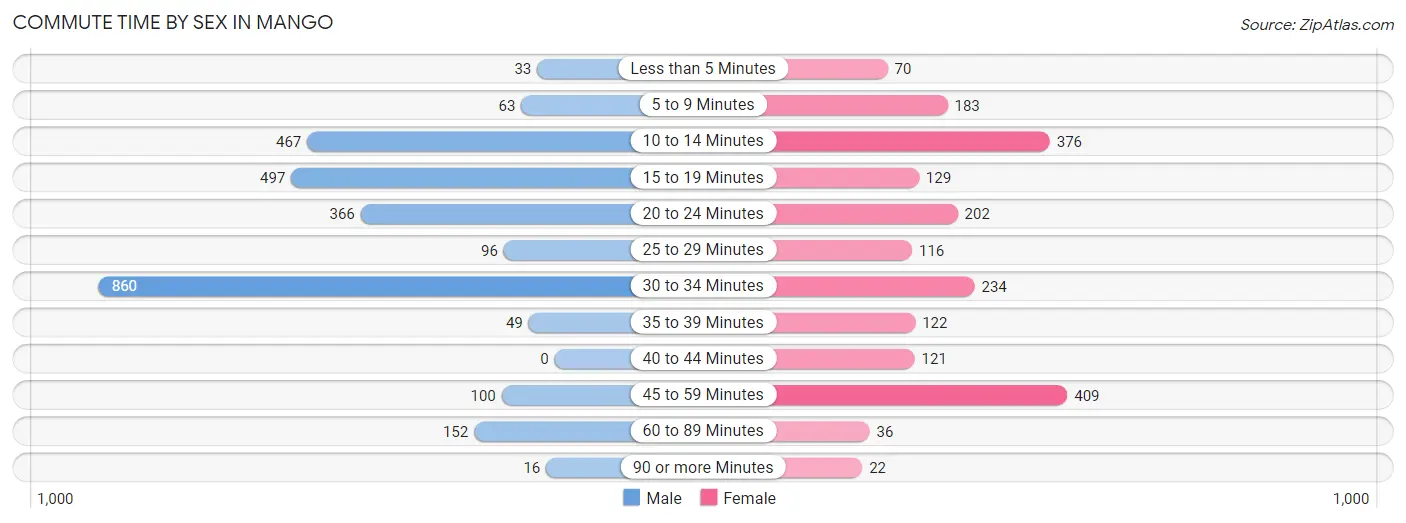
| Commute Time | Male | Female |
| Less than 5 Minutes | 33 (1.2%) | 70 (3.5%) |
| 5 to 9 Minutes | 63 (2.3%) | 183 (9.1%) |
| 10 to 14 Minutes | 467 (17.3%) | 376 (18.6%) |
| 15 to 19 Minutes | 497 (18.4%) | 129 (6.4%) |
| 20 to 24 Minutes | 366 (13.6%) | 202 (10.0%) |
| 25 to 29 Minutes | 96 (3.6%) | 116 (5.7%) |
| 30 to 34 Minutes | 860 (31.9%) | 234 (11.6%) |
| 35 to 39 Minutes | 49 (1.8%) | 122 (6.0%) |
| 40 to 44 Minutes | 0 (0.0%) | 121 (6.0%) |
| 45 to 59 Minutes | 100 (3.7%) | 409 (20.3%) |
| 60 to 89 Minutes | 152 (5.6%) | 36 (1.8%) |
| 90 or more Minutes | 16 (0.6%) | 22 (1.1%) |
Time of Departure to Work by Sex in Mango
The most frequent times of departure to work in Mango are 6:00 AM to 6:29 AM (717, 26.6%) for males and 7:00 AM to 7:29 AM (510, 25.3%) for females.
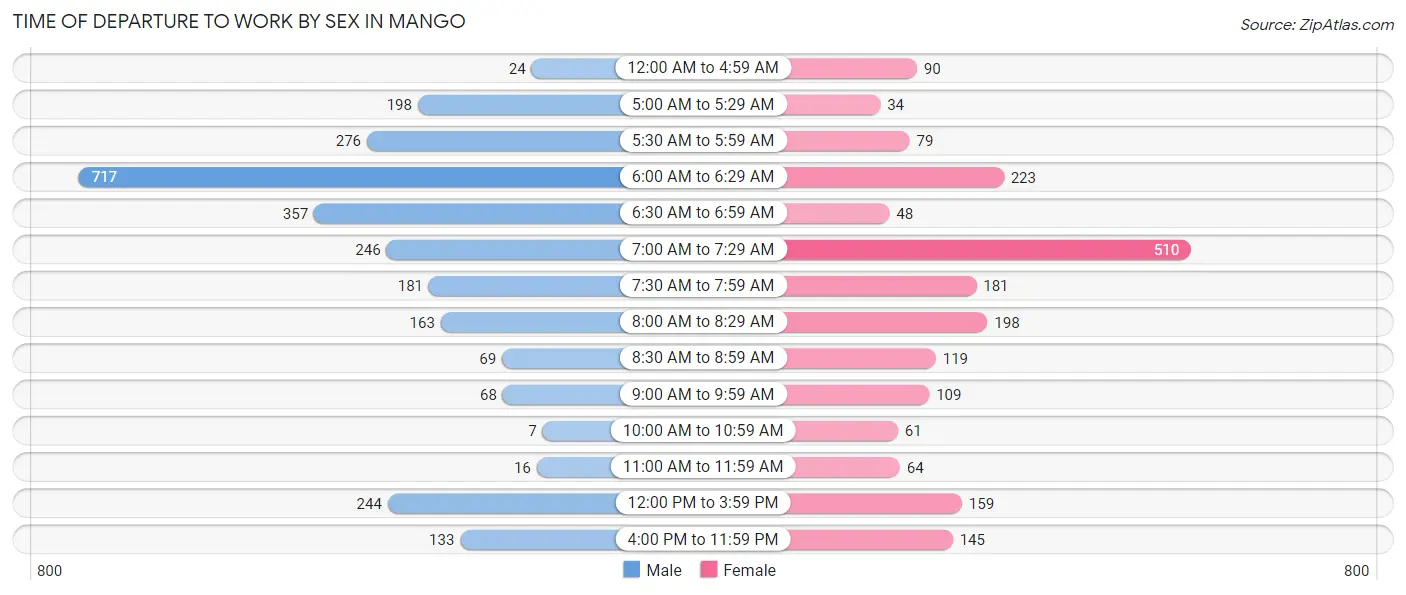
| Time of Departure | Male | Female |
| 12:00 AM to 4:59 AM | 24 (0.9%) | 90 (4.5%) |
| 5:00 AM to 5:29 AM | 198 (7.3%) | 34 (1.7%) |
| 5:30 AM to 5:59 AM | 276 (10.2%) | 79 (3.9%) |
| 6:00 AM to 6:29 AM | 717 (26.6%) | 223 (11.0%) |
| 6:30 AM to 6:59 AM | 357 (13.2%) | 48 (2.4%) |
| 7:00 AM to 7:29 AM | 246 (9.1%) | 510 (25.3%) |
| 7:30 AM to 7:59 AM | 181 (6.7%) | 181 (9.0%) |
| 8:00 AM to 8:29 AM | 163 (6.0%) | 198 (9.8%) |
| 8:30 AM to 8:59 AM | 69 (2.6%) | 119 (5.9%) |
| 9:00 AM to 9:59 AM | 68 (2.5%) | 109 (5.4%) |
| 10:00 AM to 10:59 AM | 7 (0.3%) | 61 (3.0%) |
| 11:00 AM to 11:59 AM | 16 (0.6%) | 64 (3.2%) |
| 12:00 PM to 3:59 PM | 244 (9.0%) | 159 (7.9%) |
| 4:00 PM to 11:59 PM | 133 (4.9%) | 145 (7.2%) |
| Total | 2,699 (100.0%) | 2,020 (100.0%) |
Housing Occupancy in Mango
Occupancy by Ownership in Mango
Of the total 5,098 dwellings in Mango, owner-occupied units account for 2,603 (51.1%), while renter-occupied units make up 2,495 (48.9%).
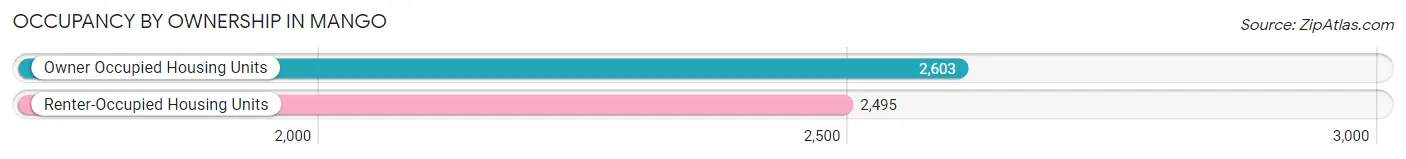
| Occupancy | # Housing Units | % Housing Units |
| Owner Occupied Housing Units | 2,603 | 51.1% |
| Renter-Occupied Housing Units | 2,495 | 48.9% |
| Total Occupied Housing Units | 5,098 | 100.0% |
Occupancy by Household Size in Mango
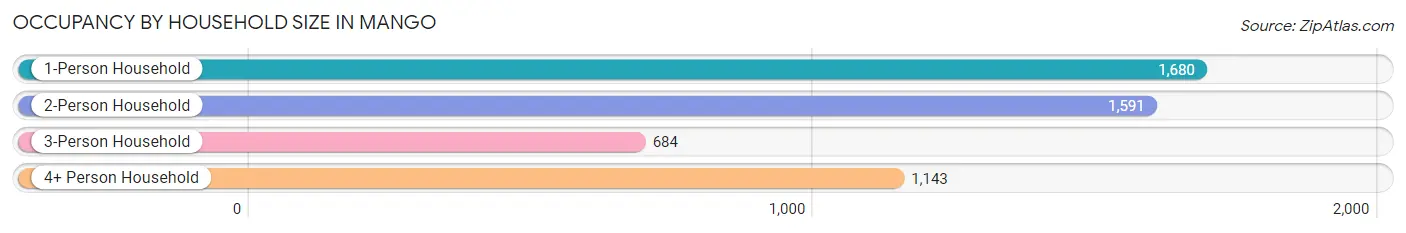
| Household Size | # Housing Units | % Housing Units |
| 1-Person Household | 1,680 | 33.0% |
| 2-Person Household | 1,591 | 31.2% |
| 3-Person Household | 684 | 13.4% |
| 4+ Person Household | 1,143 | 22.4% |
| Total Housing Units | 5,098 | 100.0% |
Occupancy by Ownership by Household Size in Mango
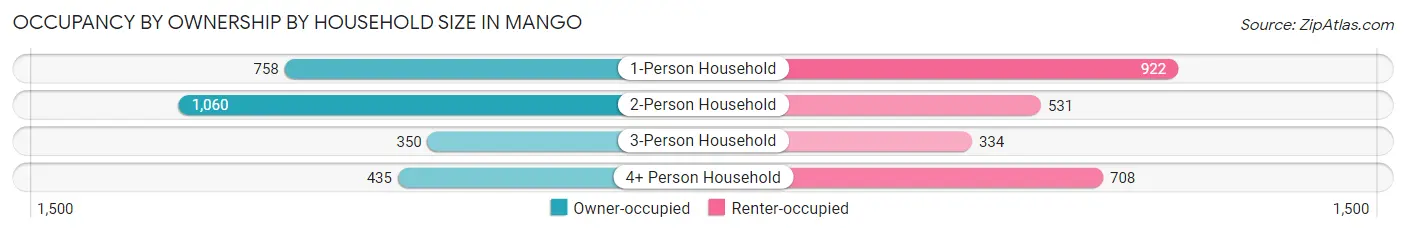
| Household Size | Owner-occupied | Renter-occupied |
| 1-Person Household | 758 (45.1%) | 922 (54.9%) |
| 2-Person Household | 1,060 (66.6%) | 531 (33.4%) |
| 3-Person Household | 350 (51.2%) | 334 (48.8%) |
| 4+ Person Household | 435 (38.1%) | 708 (61.9%) |
| Total Housing Units | 2,603 (51.1%) | 2,495 (48.9%) |
Occupancy by Educational Attainment in Mango
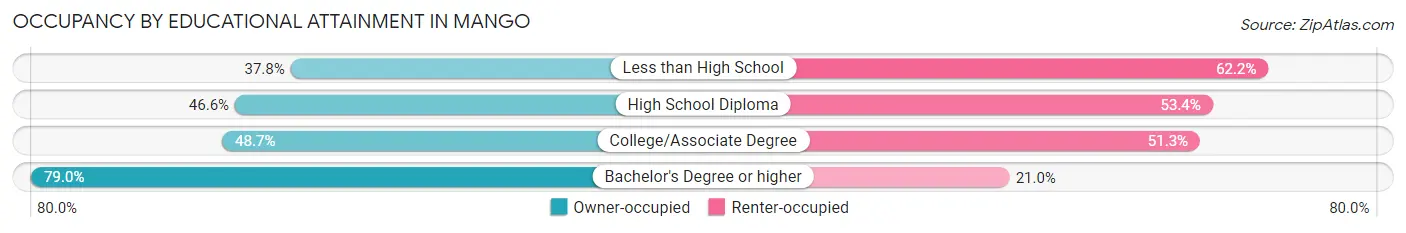
| Household Size | Owner-occupied | Renter-occupied |
| Less than High School | 371 (37.8%) | 610 (62.2%) |
| High School Diploma | 652 (46.6%) | 746 (53.4%) |
| College/Associate Degree | 911 (48.7%) | 961 (51.3%) |
| Bachelor's Degree or higher | 669 (79.0%) | 178 (21.0%) |
Occupancy by Age of Householder in Mango
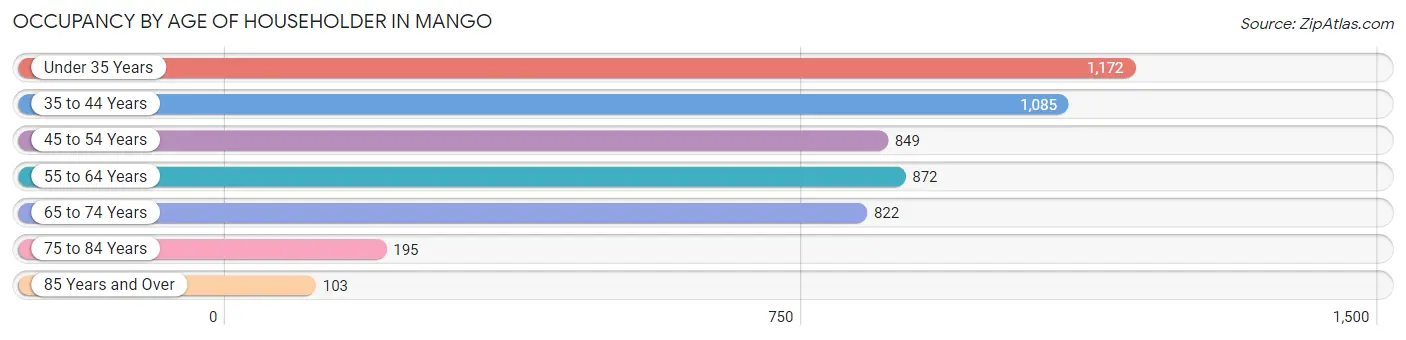
| Age Bracket | # Households | % Households |
| Under 35 Years | 1,172 | 23.0% |
| 35 to 44 Years | 1,085 | 21.3% |
| 45 to 54 Years | 849 | 16.7% |
| 55 to 64 Years | 872 | 17.1% |
| 65 to 74 Years | 822 | 16.1% |
| 75 to 84 Years | 195 | 3.8% |
| 85 Years and Over | 103 | 2.0% |
| Total | 5,098 | 100.0% |
Housing Finances in Mango
Median Income by Occupancy in Mango
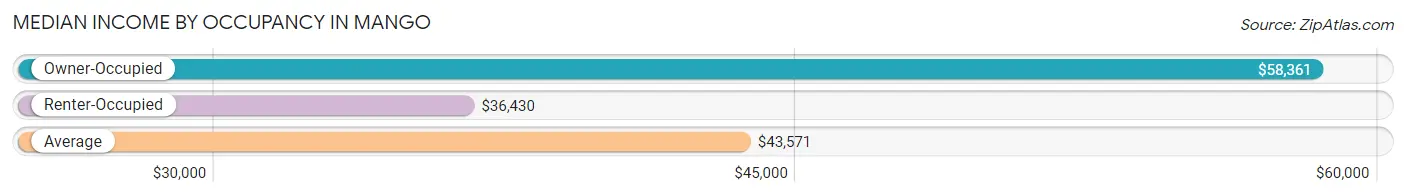
| Occupancy Type | # Households | Median Income |
| Owner-Occupied | 2,603 (51.1%) | $58,361 |
| Renter-Occupied | 2,495 (48.9%) | $36,430 |
| Average | 5,098 (100.0%) | $43,571 |
Occupancy by Householder Income Bracket in Mango
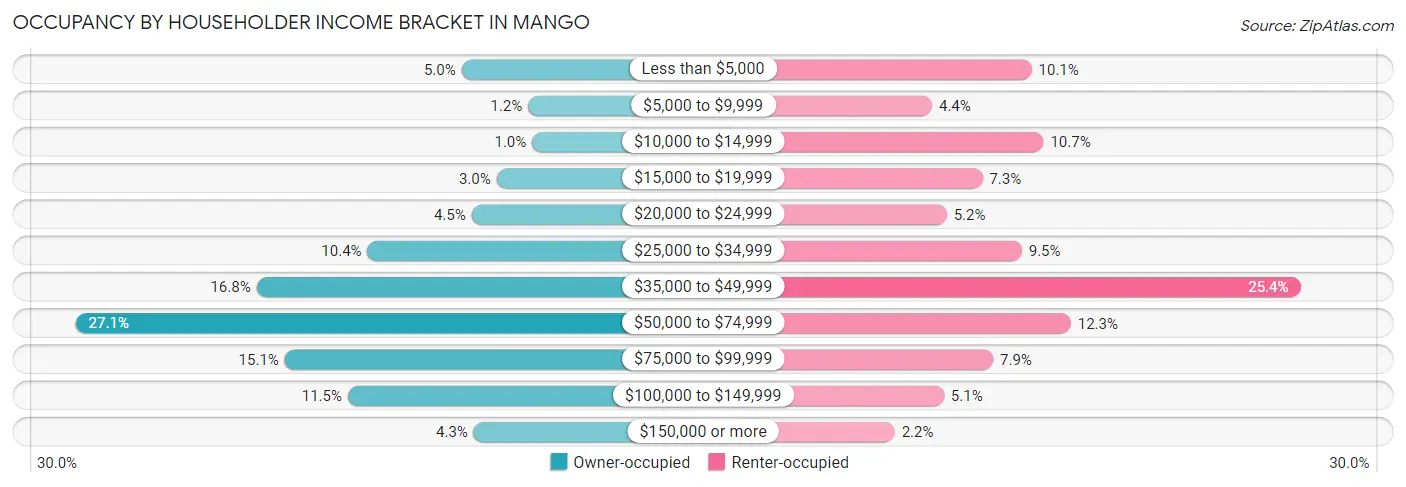
| Income Bracket | Owner-occupied | Renter-occupied |
| Less than $5,000 | 131 (5.0%) | 251 (10.1%) |
| $5,000 to $9,999 | 32 (1.2%) | 109 (4.4%) |
| $10,000 to $14,999 | 26 (1.0%) | 268 (10.7%) |
| $15,000 to $19,999 | 79 (3.0%) | 181 (7.2%) |
| $20,000 to $24,999 | 116 (4.5%) | 130 (5.2%) |
| $25,000 to $34,999 | 271 (10.4%) | 237 (9.5%) |
| $35,000 to $49,999 | 436 (16.8%) | 634 (25.4%) |
| $50,000 to $74,999 | 705 (27.1%) | 307 (12.3%) |
| $75,000 to $99,999 | 394 (15.1%) | 196 (7.9%) |
| $100,000 to $149,999 | 300 (11.5%) | 126 (5.1%) |
| $150,000 or more | 113 (4.3%) | 56 (2.2%) |
| Total | 2,603 (100.0%) | 2,495 (100.0%) |
Monthly Housing Cost Tiers in Mango
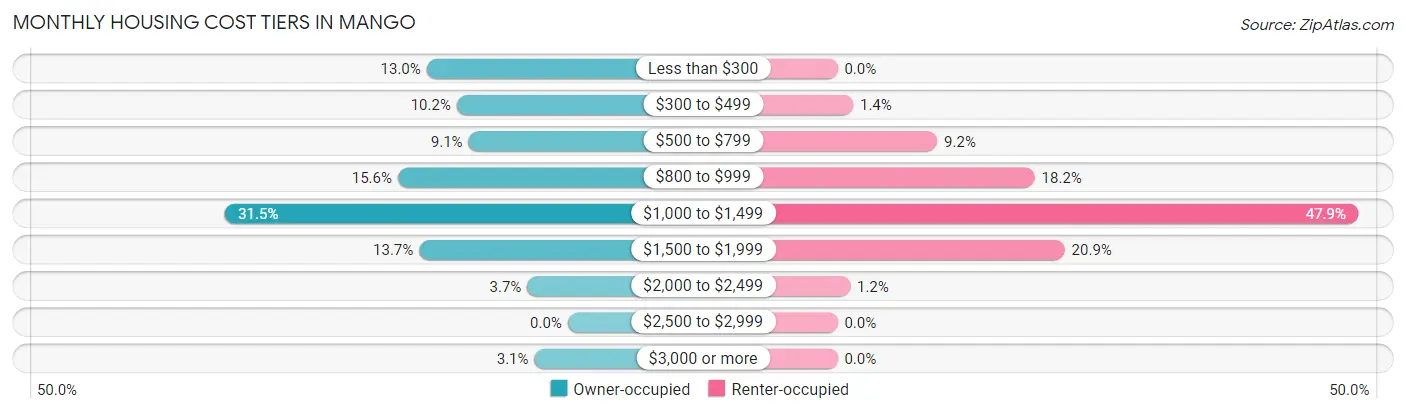
| Monthly Cost | Owner-occupied | Renter-occupied |
| Less than $300 | 338 (13.0%) | 0 (0.0%) |
| $300 to $499 | 266 (10.2%) | 36 (1.4%) |
| $500 to $799 | 238 (9.1%) | 229 (9.2%) |
| $800 to $999 | 407 (15.6%) | 453 (18.2%) |
| $1,000 to $1,499 | 821 (31.5%) | 1,195 (47.9%) |
| $1,500 to $1,999 | 356 (13.7%) | 522 (20.9%) |
| $2,000 to $2,499 | 97 (3.7%) | 29 (1.2%) |
| $2,500 to $2,999 | 0 (0.0%) | 0 (0.0%) |
| $3,000 or more | 80 (3.1%) | 0 (0.0%) |
| Total | 2,603 (100.0%) | 2,495 (100.0%) |
Physical Housing Characteristics in Mango
Housing Structures in Mango
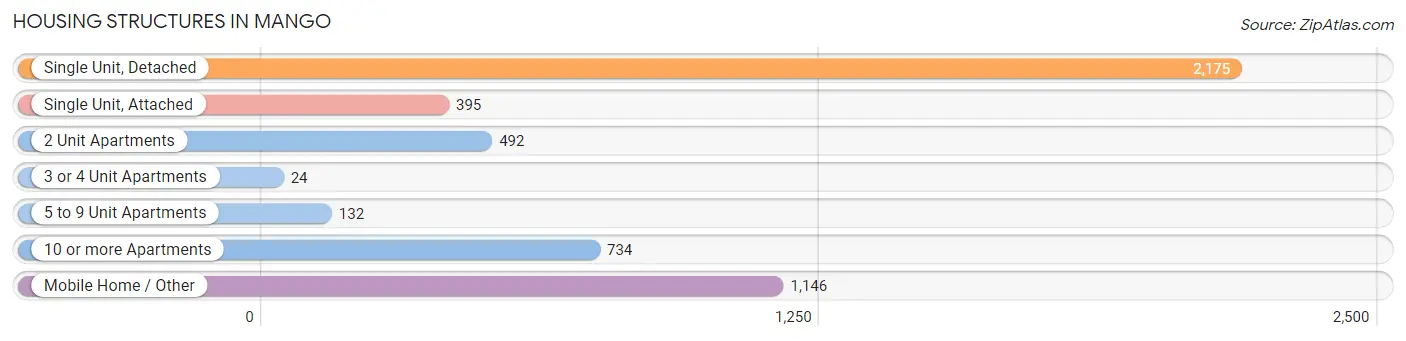
| Structure Type | # Housing Units | % Housing Units |
| Single Unit, Detached | 2,175 | 42.7% |
| Single Unit, Attached | 395 | 7.7% |
| 2 Unit Apartments | 492 | 9.7% |
| 3 or 4 Unit Apartments | 24 | 0.5% |
| 5 to 9 Unit Apartments | 132 | 2.6% |
| 10 or more Apartments | 734 | 14.4% |
| Mobile Home / Other | 1,146 | 22.5% |
| Total | 5,098 | 100.0% |
Housing Structures by Occupancy in Mango
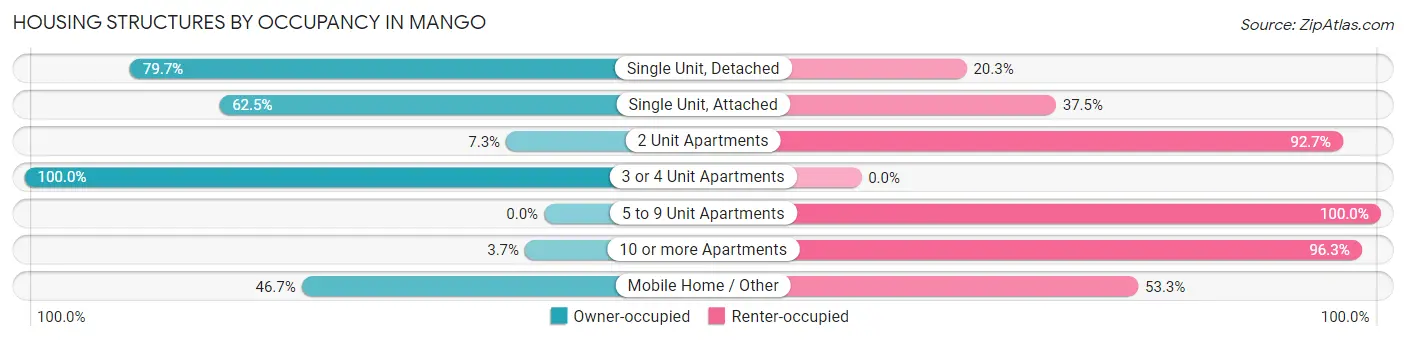
| Structure Type | Owner-occupied | Renter-occupied |
| Single Unit, Detached | 1,734 (79.7%) | 441 (20.3%) |
| Single Unit, Attached | 247 (62.5%) | 148 (37.5%) |
| 2 Unit Apartments | 36 (7.3%) | 456 (92.7%) |
| 3 or 4 Unit Apartments | 24 (100.0%) | 0 (0.0%) |
| 5 to 9 Unit Apartments | 0 (0.0%) | 132 (100.0%) |
| 10 or more Apartments | 27 (3.7%) | 707 (96.3%) |
| Mobile Home / Other | 535 (46.7%) | 611 (53.3%) |
| Total | 2,603 (51.1%) | 2,495 (48.9%) |
Housing Structures by Number of Rooms in Mango
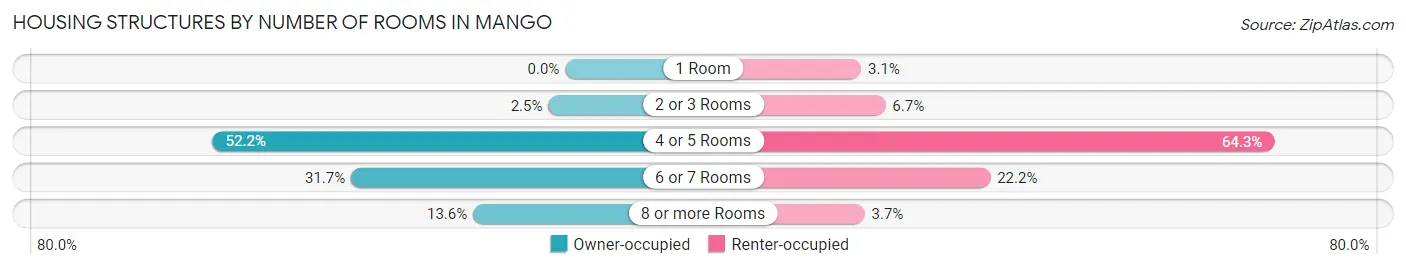
| Number of Rooms | Owner-occupied | Renter-occupied |
| 1 Room | 0 (0.0%) | 78 (3.1%) |
| 2 or 3 Rooms | 65 (2.5%) | 168 (6.7%) |
| 4 or 5 Rooms | 1,358 (52.2%) | 1,603 (64.2%) |
| 6 or 7 Rooms | 825 (31.7%) | 555 (22.2%) |
| 8 or more Rooms | 355 (13.6%) | 91 (3.6%) |
| Total | 2,603 (100.0%) | 2,495 (100.0%) |
Housing Structure by Heating Type in Mango
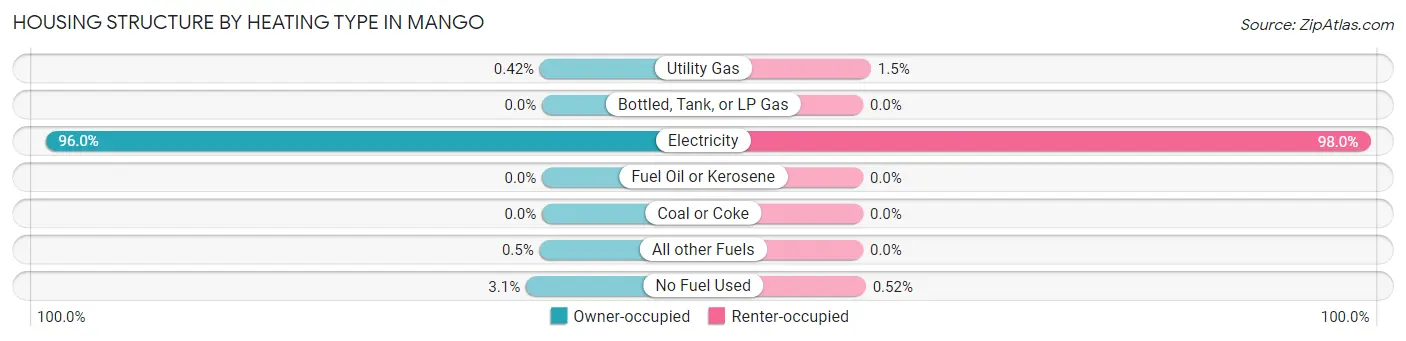
| Heating Type | Owner-occupied | Renter-occupied |
| Utility Gas | 11 (0.4%) | 38 (1.5%) |
| Bottled, Tank, or LP Gas | 0 (0.0%) | 0 (0.0%) |
| Electricity | 2,498 (96.0%) | 2,444 (98.0%) |
| Fuel Oil or Kerosene | 0 (0.0%) | 0 (0.0%) |
| Coal or Coke | 0 (0.0%) | 0 (0.0%) |
| All other Fuels | 13 (0.5%) | 0 (0.0%) |
| No Fuel Used | 81 (3.1%) | 13 (0.5%) |
| Total | 2,603 (100.0%) | 2,495 (100.0%) |
Household Vehicle Usage in Mango
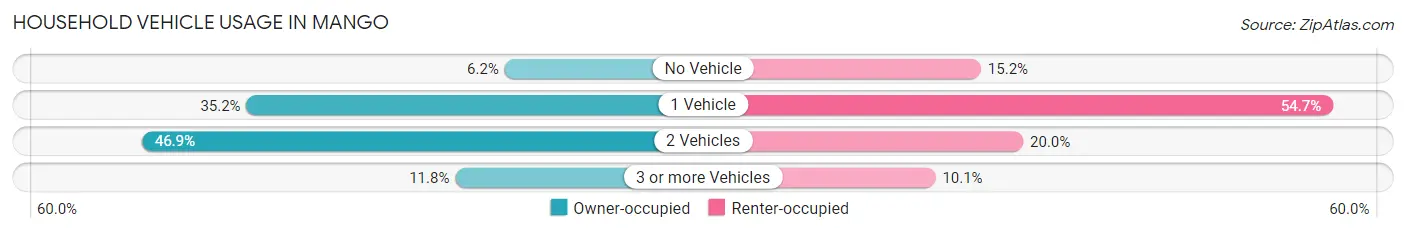
| Vehicles per Household | Owner-occupied | Renter-occupied |
| No Vehicle | 162 (6.2%) | 380 (15.2%) |
| 1 Vehicle | 915 (35.1%) | 1,364 (54.7%) |
| 2 Vehicles | 1,220 (46.9%) | 498 (20.0%) |
| 3 or more Vehicles | 306 (11.8%) | 253 (10.1%) |
| Total | 2,603 (100.0%) | 2,495 (100.0%) |
Real Estate & Mortgages in Mango
Real Estate and Mortgage Overview in Mango
| Characteristic | Without Mortgage | With Mortgage |
| Housing Units | 1,088 | 1,515 |
| Median Property Value | - | - |
| Median Household Income | $54,167 | $75 |
| Monthly Housing Costs | $463 | $80 |
| Real Estate Taxes | $1,122 | $48 |
Property Value by Mortgage Status in Mango
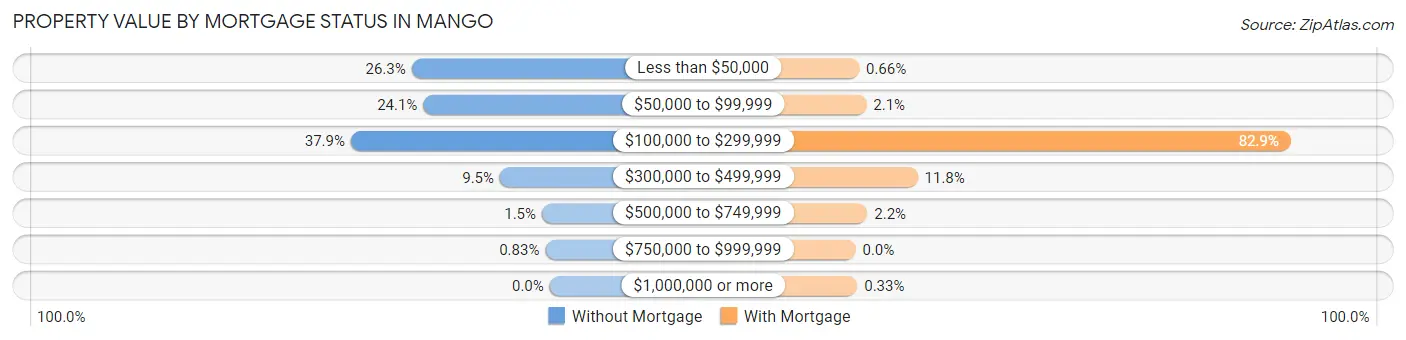
| Property Value | Without Mortgage | With Mortgage |
| Less than $50,000 | 286 (26.3%) | 10 (0.7%) |
| $50,000 to $99,999 | 262 (24.1%) | 31 (2.1%) |
| $100,000 to $299,999 | 412 (37.9%) | 1,256 (82.9%) |
| $300,000 to $499,999 | 103 (9.5%) | 179 (11.8%) |
| $500,000 to $749,999 | 16 (1.5%) | 34 (2.2%) |
| $750,000 to $999,999 | 9 (0.8%) | 0 (0.0%) |
| $1,000,000 or more | 0 (0.0%) | 5 (0.3%) |
| Total | 1,088 (100.0%) | 1,515 (100.0%) |
Household Income by Mortgage Status in Mango
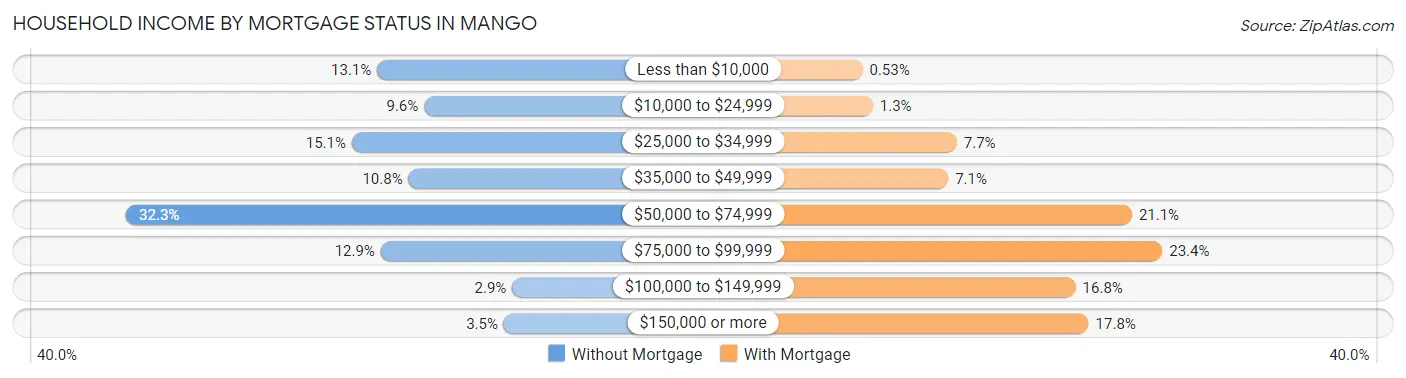
| Household Income | Without Mortgage | With Mortgage |
| Less than $10,000 | 143 (13.1%) | 8 (0.5%) |
| $10,000 to $24,999 | 104 (9.6%) | 20 (1.3%) |
| $25,000 to $34,999 | 164 (15.1%) | 117 (7.7%) |
| $35,000 to $49,999 | 117 (10.7%) | 107 (7.1%) |
| $50,000 to $74,999 | 351 (32.3%) | 319 (21.1%) |
| $75,000 to $99,999 | 140 (12.9%) | 354 (23.4%) |
| $100,000 to $149,999 | 31 (2.9%) | 254 (16.8%) |
| $150,000 or more | 38 (3.5%) | 269 (17.8%) |
| Total | 1,088 (100.0%) | 1,515 (100.0%) |
Property Value to Household Income Ratio in Mango
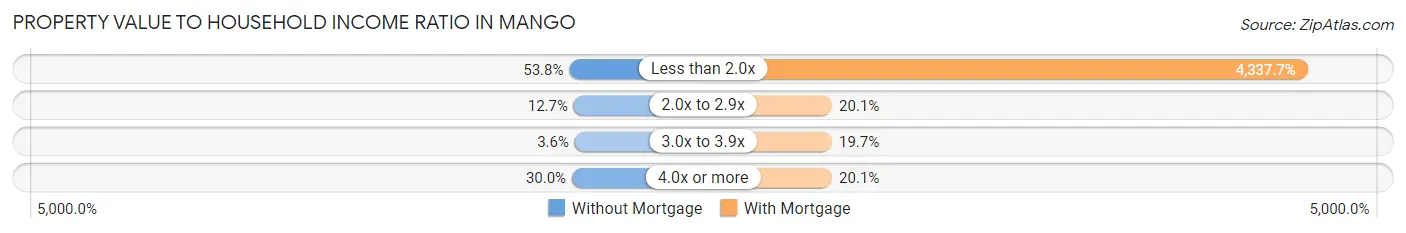
| Value-to-Income Ratio | Without Mortgage | With Mortgage |
| Less than 2.0x | 585 (53.8%) | 65,716 (4,337.7%) |
| 2.0x to 2.9x | 138 (12.7%) | 304 (20.1%) |
| 3.0x to 3.9x | 39 (3.6%) | 298 (19.7%) |
| 4.0x or more | 326 (30.0%) | 305 (20.1%) |
| Total | 1,088 (100.0%) | 1,515 (100.0%) |
Real Estate Taxes by Mortgage Status in Mango
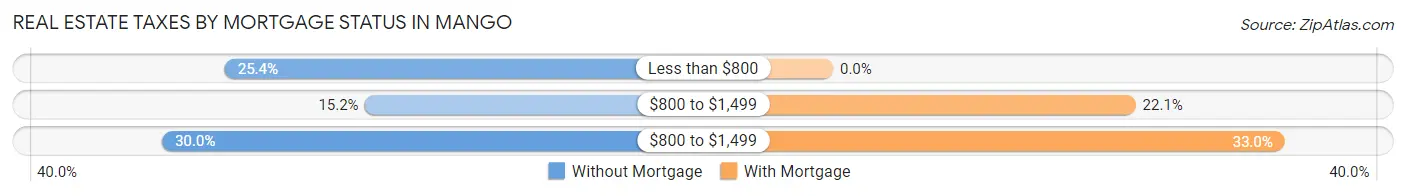
| Property Taxes | Without Mortgage | With Mortgage |
| Less than $800 | 276 (25.4%) | 0 (0.0%) |
| $800 to $1,499 | 165 (15.2%) | 335 (22.1%) |
| $800 to $1,499 | 326 (30.0%) | 500 (33.0%) |
| Total | 1,088 (100.0%) | 1,515 (100.0%) |
Health & Disability in Mango
Health Insurance Coverage by Age in Mango
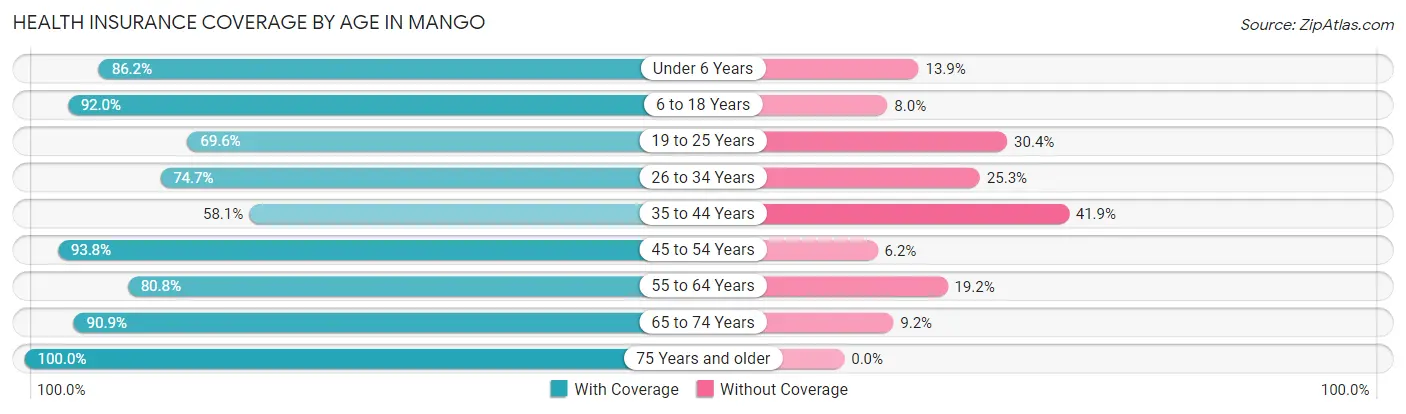
| Age Bracket | With Coverage | Without Coverage |
| Under 6 Years | 958 (86.2%) | 154 (13.9%) |
| 6 to 18 Years | 1,646 (92.0%) | 144 (8.0%) |
| 19 to 25 Years | 635 (69.6%) | 277 (30.4%) |
| 26 to 34 Years | 1,359 (74.7%) | 460 (25.3%) |
| 35 to 44 Years | 1,018 (58.1%) | 733 (41.9%) |
| 45 to 54 Years | 1,630 (93.8%) | 108 (6.2%) |
| 55 to 64 Years | 1,440 (80.8%) | 343 (19.2%) |
| 65 to 74 Years | 903 (90.8%) | 91 (9.1%) |
| 75 Years and older | 453 (100.0%) | 0 (0.0%) |
| Total | 10,042 (81.3%) | 2,310 (18.7%) |
Health Insurance Coverage by Citizenship Status in Mango
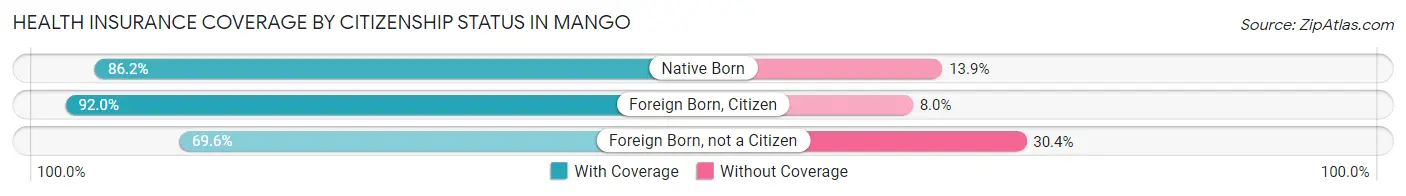
| Citizenship Status | With Coverage | Without Coverage |
| Native Born | 958 (86.2%) | 154 (13.9%) |
| Foreign Born, Citizen | 1,646 (92.0%) | 144 (8.0%) |
| Foreign Born, not a Citizen | 635 (69.6%) | 277 (30.4%) |
Health Insurance Coverage by Household Income in Mango
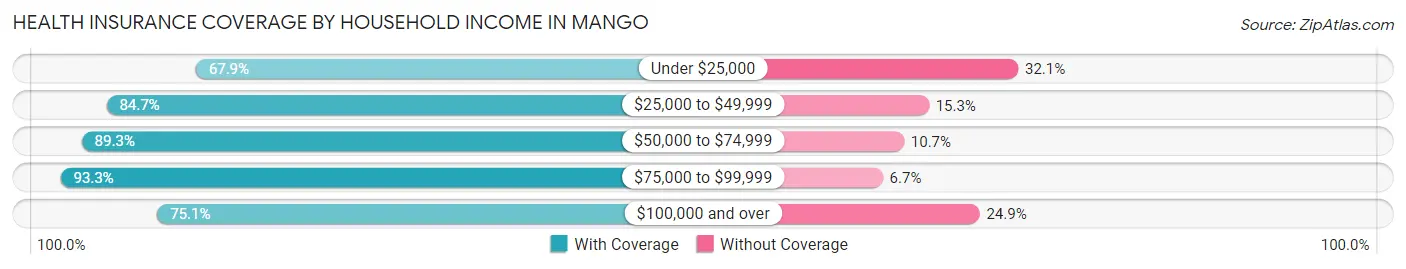
| Household Income | With Coverage | Without Coverage |
| Under $25,000 | 1,858 (67.9%) | 878 (32.1%) |
| $25,000 to $49,999 | 2,969 (84.7%) | 538 (15.3%) |
| $50,000 to $74,999 | 2,415 (89.3%) | 289 (10.7%) |
| $75,000 to $99,999 | 1,236 (93.3%) | 89 (6.7%) |
| $100,000 and over | 1,560 (75.1%) | 516 (24.9%) |
Public vs Private Health Insurance Coverage by Age in Mango
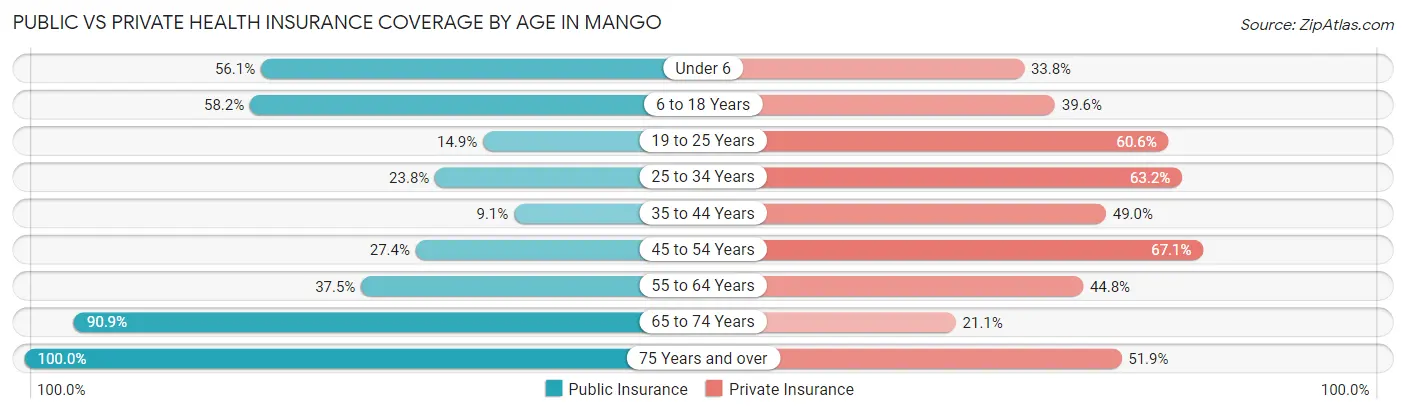
| Age Bracket | Public Insurance | Private Insurance |
| Under 6 | 624 (56.1%) | 376 (33.8%) |
| 6 to 18 Years | 1,041 (58.2%) | 708 (39.6%) |
| 19 to 25 Years | 136 (14.9%) | 553 (60.6%) |
| 25 to 34 Years | 433 (23.8%) | 1,149 (63.2%) |
| 35 to 44 Years | 160 (9.1%) | 858 (49.0%) |
| 45 to 54 Years | 476 (27.4%) | 1,166 (67.1%) |
| 55 to 64 Years | 669 (37.5%) | 798 (44.8%) |
| 65 to 74 Years | 903 (90.8%) | 210 (21.1%) |
| 75 Years and over | 453 (100.0%) | 235 (51.9%) |
| Total | 4,895 (39.6%) | 6,053 (49.0%) |
Disability Status by Sex by Age in Mango
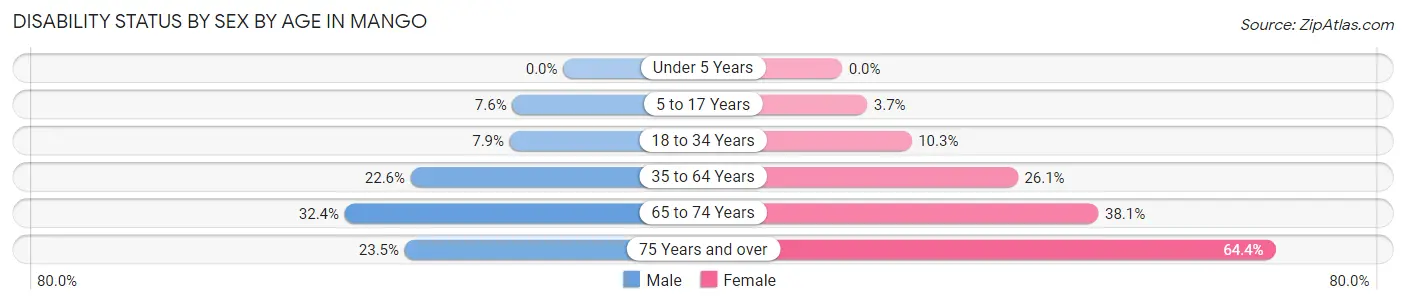
| Age Bracket | Male | Female |
| Under 5 Years | 0 (0.0%) | 0 (0.0%) |
| 5 to 17 Years | 67 (7.5%) | 39 (3.7%) |
| 18 to 34 Years | 112 (7.9%) | 139 (10.3%) |
| 35 to 64 Years | 559 (22.6%) | 731 (26.1%) |
| 65 to 74 Years | 146 (32.4%) | 207 (38.1%) |
| 75 Years and over | 24 (23.5%) | 226 (64.4%) |
Disability Class by Sex by Age in Mango
Disability Class: Hearing Difficulty
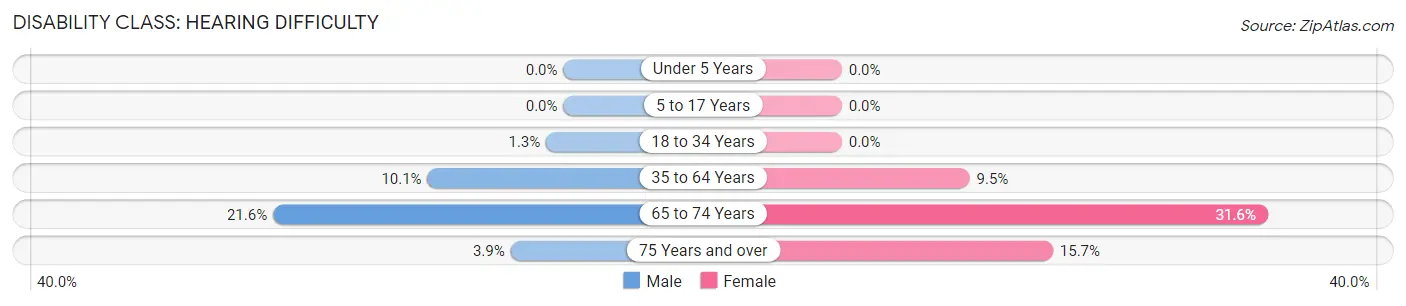
| Age Bracket | Male | Female |
| Under 5 Years | 0 (0.0%) | 0 (0.0%) |
| 5 to 17 Years | 0 (0.0%) | 0 (0.0%) |
| 18 to 34 Years | 18 (1.3%) | 0 (0.0%) |
| 35 to 64 Years | 249 (10.1%) | 266 (9.5%) |
| 65 to 74 Years | 97 (21.6%) | 172 (31.6%) |
| 75 Years and over | 4 (3.9%) | 55 (15.7%) |
Disability Class: Vision Difficulty
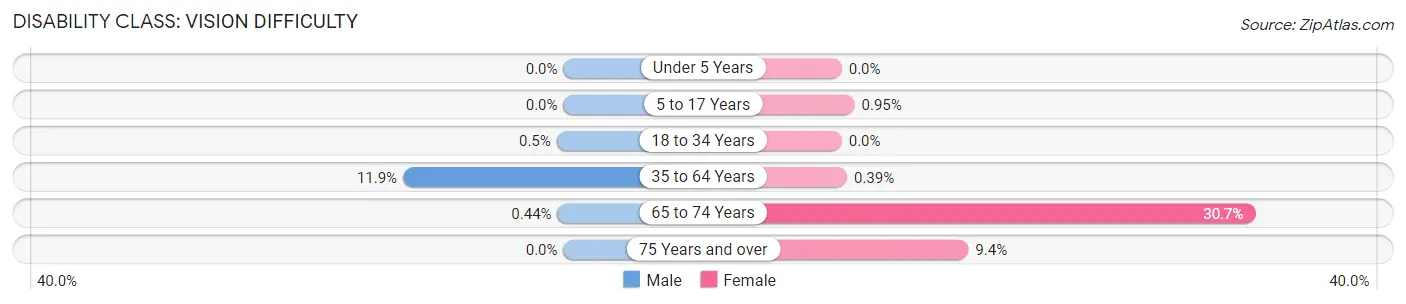
| Age Bracket | Male | Female |
| Under 5 Years | 0 (0.0%) | 0 (0.0%) |
| 5 to 17 Years | 0 (0.0%) | 10 (0.9%) |
| 18 to 34 Years | 7 (0.5%) | 0 (0.0%) |
| 35 to 64 Years | 294 (11.9%) | 11 (0.4%) |
| 65 to 74 Years | 2 (0.4%) | 167 (30.7%) |
| 75 Years and over | 0 (0.0%) | 33 (9.4%) |
Disability Class: Cognitive Difficulty
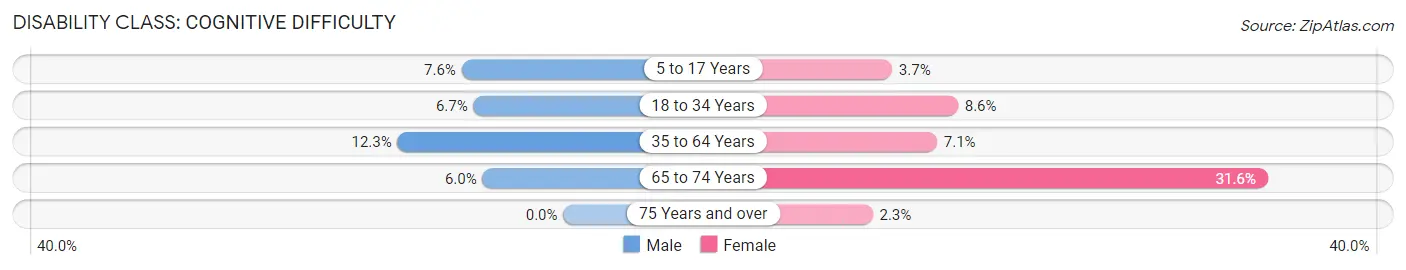
| Age Bracket | Male | Female |
| 5 to 17 Years | 67 (7.5%) | 39 (3.7%) |
| 18 to 34 Years | 94 (6.7%) | 116 (8.6%) |
| 35 to 64 Years | 304 (12.3%) | 198 (7.1%) |
| 65 to 74 Years | 27 (6.0%) | 172 (31.6%) |
| 75 Years and over | 0 (0.0%) | 8 (2.3%) |
Disability Class: Ambulatory Difficulty
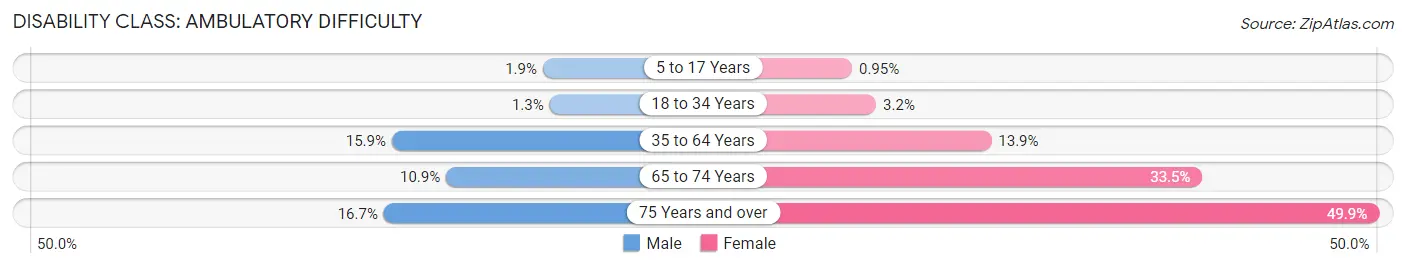
| Age Bracket | Male | Female |
| 5 to 17 Years | 17 (1.9%) | 10 (0.9%) |
| 18 to 34 Years | 18 (1.3%) | 43 (3.2%) |
| 35 to 64 Years | 393 (15.9%) | 389 (13.9%) |
| 65 to 74 Years | 49 (10.9%) | 182 (33.5%) |
| 75 Years and over | 17 (16.7%) | 175 (49.9%) |
Disability Class: Self-Care Difficulty
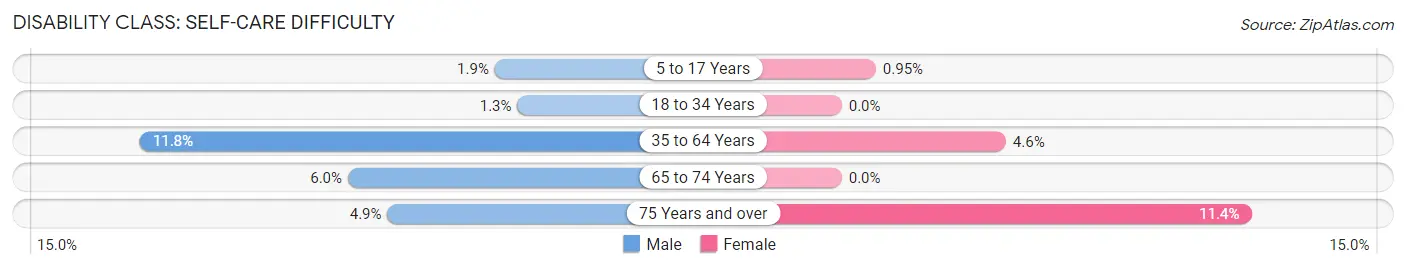
| Age Bracket | Male | Female |
| 5 to 17 Years | 17 (1.9%) | 10 (0.9%) |
| 18 to 34 Years | 18 (1.3%) | 0 (0.0%) |
| 35 to 64 Years | 291 (11.8%) | 128 (4.6%) |
| 65 to 74 Years | 27 (6.0%) | 0 (0.0%) |
| 75 Years and over | 5 (4.9%) | 40 (11.4%) |
Technology Access in Mango
Computing Device Access in Mango
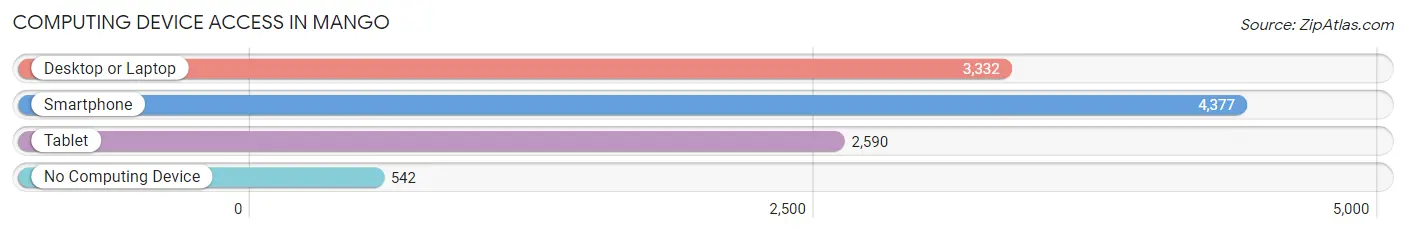
| Device Type | # Households | % Households |
| Desktop or Laptop | 3,332 | 65.4% |
| Smartphone | 4,377 | 85.9% |
| Tablet | 2,590 | 50.8% |
| No Computing Device | 542 | 10.6% |
| Total | 5,098 | 100.0% |
Internet Access in Mango
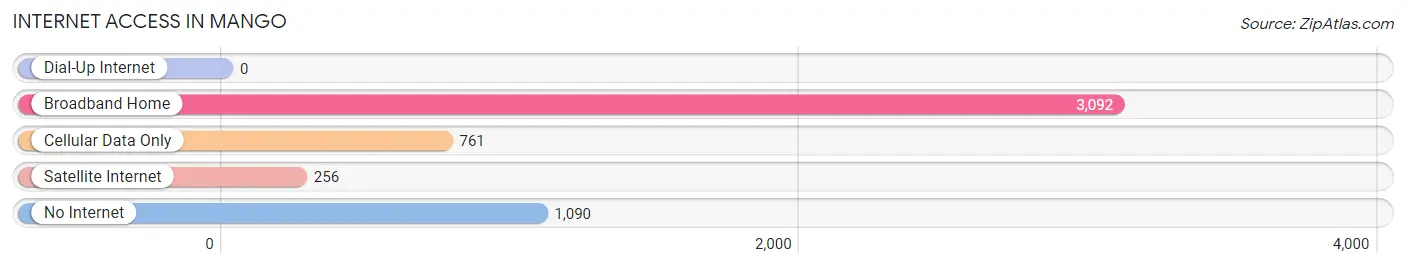
| Internet Type | # Households | % Households |
| Dial-Up Internet | 0 | 0.0% |
| Broadband Home | 3,092 | 60.7% |
| Cellular Data Only | 761 | 14.9% |
| Satellite Internet | 256 | 5.0% |
| No Internet | 1,090 | 21.4% |
| Total | 5,098 | 100.0% |
Mango Summary
Mango is an unincorporated community located in Hillsborough County, Florida, United States. It is located approximately 15 miles east of Tampa and is part of the Tampa-St. Petersburg-Clearwater Metropolitan Statistical Area. The population of Mango was estimated to be 8,845 in 2019.
History
Mango was first settled in the late 1800s by a group of settlers from the nearby town of Thonotosassa. The settlers named the area Mango after the abundance of mango trees in the area. The first post office was established in 1887 and the town was officially incorporated in 1891.
The town grew slowly over the years, but it was not until the 1950s that it began to experience significant growth. This was due to the construction of the nearby Interstate 4, which provided easy access to Tampa and other nearby cities.
Geography
Mango is located in Hillsborough County, Florida, approximately 15 miles east of Tampa. It is part of the Tampa-St. Petersburg-Clearwater Metropolitan Statistical Area. The town is situated on the northern edge of the Tampa Bay area, and is bordered by the cities of Thonotosassa, Seffner, and Valrico.
The terrain of Mango is mostly flat, with some rolling hills. The town is located in a humid subtropical climate zone, with hot, humid summers and mild winters. The average annual temperature is 73°F (23°C).
Economy
Mango’s economy is largely based on agriculture and tourism. The town is home to several farms, which produce a variety of fruits and vegetables, including oranges, strawberries, and tomatoes. The town is also home to several tourist attractions, including the Mango Historical Society Museum and the Mango Community Center.
The town is also home to several small businesses, including restaurants, retail stores, and auto repair shops. The town is served by the Hillsborough County School District, which operates several elementary, middle, and high schools in the area.
Demographics
As of 2019, the population of Mango was estimated to be 8,845. The racial makeup of the town was 79.3% White, 11.2% African American, 0.7% Native American, 0.7% Asian, 0.1% Pacific Islander, and 6.9% from other races. The median household income was $45,945, and the median age was 37.
Mango is a diverse community, with a variety of religious denominations represented. The largest religious group is the Catholic Church, followed by the Baptist Church, the Methodist Church, and the Church of Jesus Christ of Latter-day Saints.
Conclusion
Mango is a small unincorporated community located in Hillsborough County, Florida. It is part of the Tampa-St. Petersburg-Clearwater Metropolitan Statistical Area and is home to 8,845 people. The town’s economy is largely based on agriculture and tourism, and it is served by the Hillsborough County School District. Mango is a diverse community, with a variety of religious denominations represented.
Common Questions
What is Per Capita Income in Mango?
Per Capita income in Mango is $22,505.
What is the Median Family Income in Mango?
Median Family Income in Mango is $49,069.
What is the Median Household income in Mango?
Median Household Income in Mango is $43,571.
What is Income or Wage Gap in Mango?
Income or Wage Gap in Mango is 14.7%.
Women in Mango earn 85.3 cents for every dollar earned by a man.
What is Inequality or Gini Index in Mango?
Inequality or Gini Index in Mango is 0.41.
What is the Total Population of Mango?
Total Population of Mango is 12,400.
What is the Total Male Population of Mango?
Total Male Population of Mango is 5,803.
What is the Total Female Population of Mango?
Total Female Population of Mango is 6,597.
What is the Ratio of Males per 100 Females in Mango?
There are 87.96 Males per 100 Females in Mango.
What is the Ratio of Females per 100 Males in Mango?
There are 113.68 Females per 100 Males in Mango.
What is the Median Population Age in Mango?
Median Population Age in Mango is 39.2 Years.
What is the Average Family Size in Mango
Average Family Size in Mango is 3.1 People.
What is the Average Household Size in Mango
Average Household Size in Mango is 2.4 People.
How Large is the Labor Force in Mango?
There are 5,699 People in the Labor Forcein in Mango.
What is the Percentage of People in the Labor Force in Mango?
57.8% of People are in the Labor Force in Mango.
What is the Unemployment Rate in Mango?
Unemployment Rate in Mango is 5.3%.