Laurel Hill, FL Map & Demographics
Laurel Hill Map
Laurel Hill Overview
$28,747
PER CAPITA INCOME
$59,667
AVG FAMILY INCOME
$58,967
AVG HOUSEHOLD INCOME
55.6%
WAGE / INCOME GAP [ % ]
44.4¢/ $1
WAGE / INCOME GAP [ $ ]
0.39
INEQUALITY / GINI INDEX
469
TOTAL POPULATION
231
MALE POPULATION
238
FEMALE POPULATION
97.06
MALES / 100 FEMALES
103.03
FEMALES / 100 MALES
32.6
MEDIAN AGE
3.5
AVG FAMILY SIZE
2.6
AVG HOUSEHOLD SIZE
207
LABOR FORCE [ PEOPLE ]
62.2%
PERCENT IN LABOR FORCE
3.5%
UNEMPLOYMENT RATE
Laurel Hill Zip Codes
Laurel Hill Area Codes
Income in Laurel Hill
Income Overview in Laurel Hill
Per Capita Income in Laurel Hill is $28,747, while median incomes of families and households are $59,667 and $58,967 respectively.
| Characteristic | Number | Measure |
| Per Capita Income | 469 | $28,747 |
| Median Family Income | 102 | $59,667 |
| Mean Family Income | 102 | $73,703 |
| Median Household Income | 183 | $58,967 |
| Mean Household Income | 183 | $71,880 |
| Income Deficit | 102 | $0 |
| Wage / Income Gap (%) | 469 | 55.56% |
| Wage / Income Gap ($) | 469 | 44.44¢ per $1 |
| Gini / Inequality Index | 469 | 0.39 |
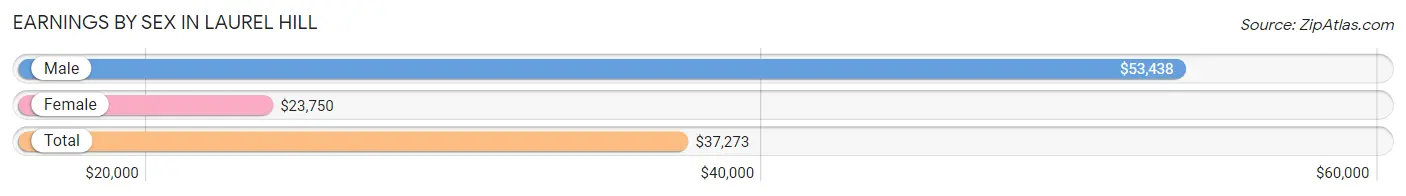
Earnings by Sex in Laurel Hill
Average Earnings in Laurel Hill are $37,273, $53,438 for men and $23,750 for women, a difference of 55.6%.
| Sex | Number | Average Earnings |
| Male | 132 (60.6%) | $53,438 |
| Female | 86 (39.5%) | $23,750 |
| Total | 218 (100.0%) | $37,273 |
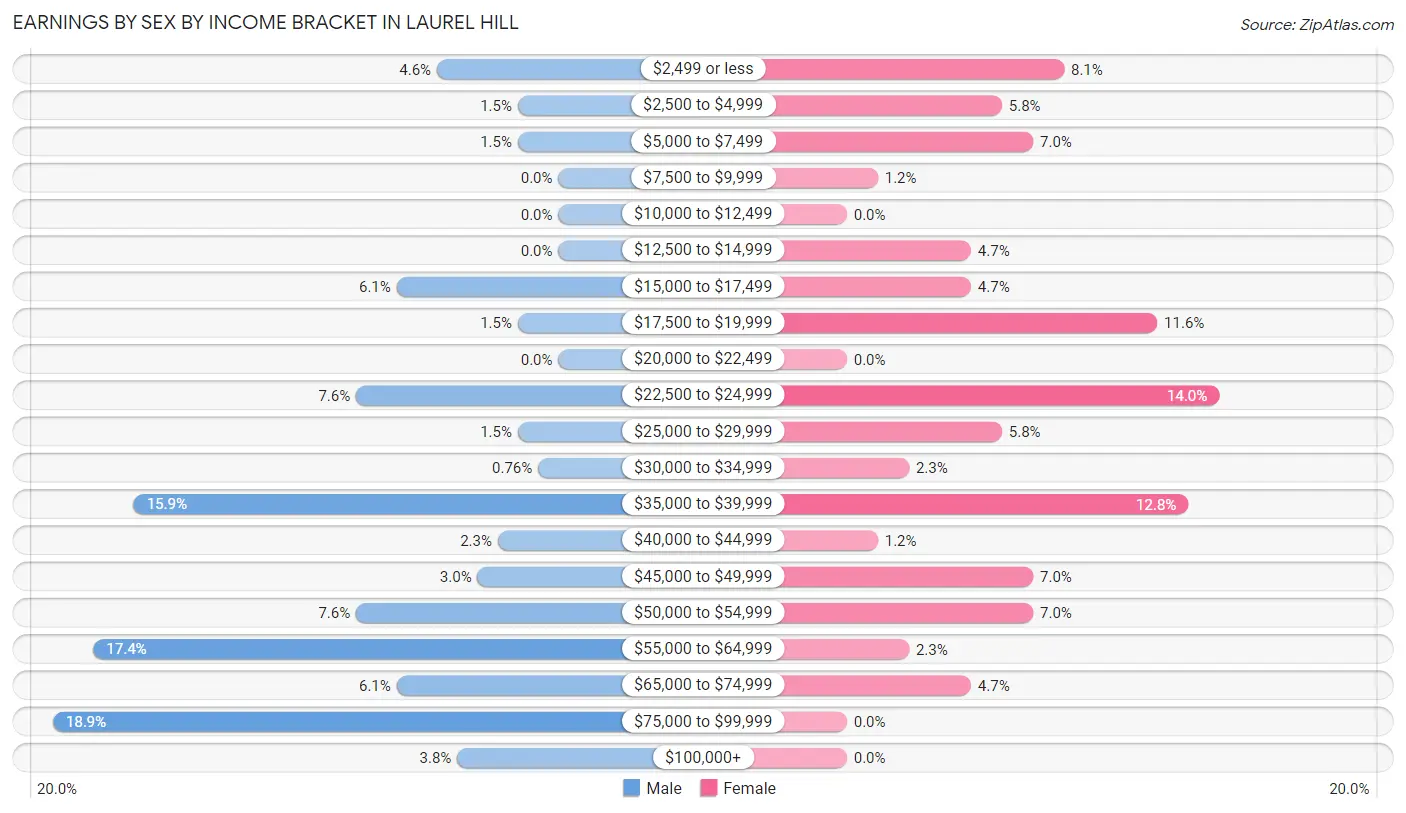
Earnings by Sex by Income Bracket in Laurel Hill
The most common earnings brackets in Laurel Hill are $75,000 to $99,999 for men (25 | 18.9%) and $22,500 to $24,999 for women (12 | 14.0%).
| Income | Male | Female |
| $2,499 or less | 6 (4.5%) | 7 (8.1%) |
| $2,500 to $4,999 | 2 (1.5%) | 5 (5.8%) |
| $5,000 to $7,499 | 2 (1.5%) | 6 (7.0%) |
| $7,500 to $9,999 | 0 (0.0%) | 1 (1.2%) |
| $10,000 to $12,499 | 0 (0.0%) | 0 (0.0%) |
| $12,500 to $14,999 | 0 (0.0%) | 4 (4.6%) |
| $15,000 to $17,499 | 8 (6.1%) | 4 (4.6%) |
| $17,500 to $19,999 | 2 (1.5%) | 10 (11.6%) |
| $20,000 to $22,499 | 0 (0.0%) | 0 (0.0%) |
| $22,500 to $24,999 | 10 (7.6%) | 12 (14.0%) |
| $25,000 to $29,999 | 2 (1.5%) | 5 (5.8%) |
| $30,000 to $34,999 | 1 (0.8%) | 2 (2.3%) |
| $35,000 to $39,999 | 21 (15.9%) | 11 (12.8%) |
| $40,000 to $44,999 | 3 (2.3%) | 1 (1.2%) |
| $45,000 to $49,999 | 4 (3.0%) | 6 (7.0%) |
| $50,000 to $54,999 | 10 (7.6%) | 6 (7.0%) |
| $55,000 to $64,999 | 23 (17.4%) | 2 (2.3%) |
| $65,000 to $74,999 | 8 (6.1%) | 4 (4.6%) |
| $75,000 to $99,999 | 25 (18.9%) | 0 (0.0%) |
| $100,000+ | 5 (3.8%) | 0 (0.0%) |
| Total | 132 (100.0%) | 86 (100.0%) |
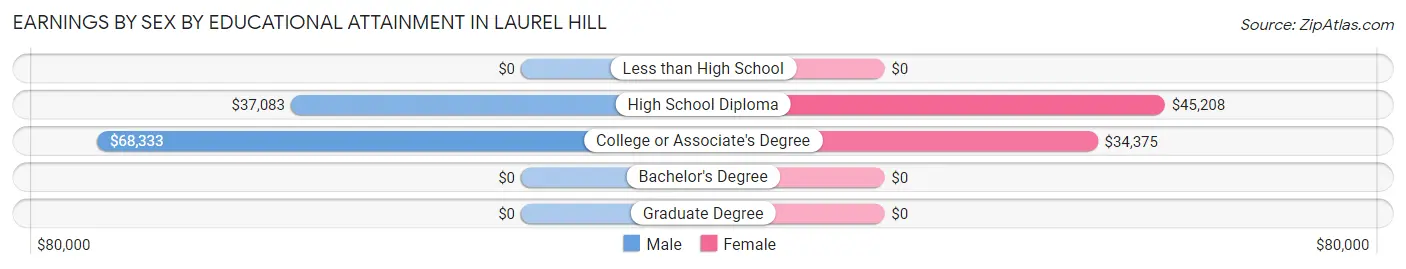
Earnings by Sex by Educational Attainment in Laurel Hill
Average earnings in Laurel Hill are $54,063 for men and $28,750 for women, a difference of 46.8%. Men with an educational attainment of college or associate's degree enjoy the highest average annual earnings of $68,333, while those with high school diploma education earn the least with $37,083. Women with an educational attainment of high school diploma earn the most with the average annual earnings of $45,208, while those with college or associate's degree education have the smallest earnings of $34,375.
| Educational Attainment | Male Income | Female Income |
| Less than High School | - | - |
| High School Diploma | $37,083 | $45,208 |
| College or Associate's Degree | $68,333 | $34,375 |
| Bachelor's Degree | - | - |
| Graduate Degree | - | - |
| Total | $54,063 | $28,750 |
Family Income in Laurel Hill
Family Income Brackets in Laurel Hill
According to the Laurel Hill family income data, there are 26 families falling into the $50,000 to $74,999 income range, which is the most common income bracket and makes up 25.5% of all families.
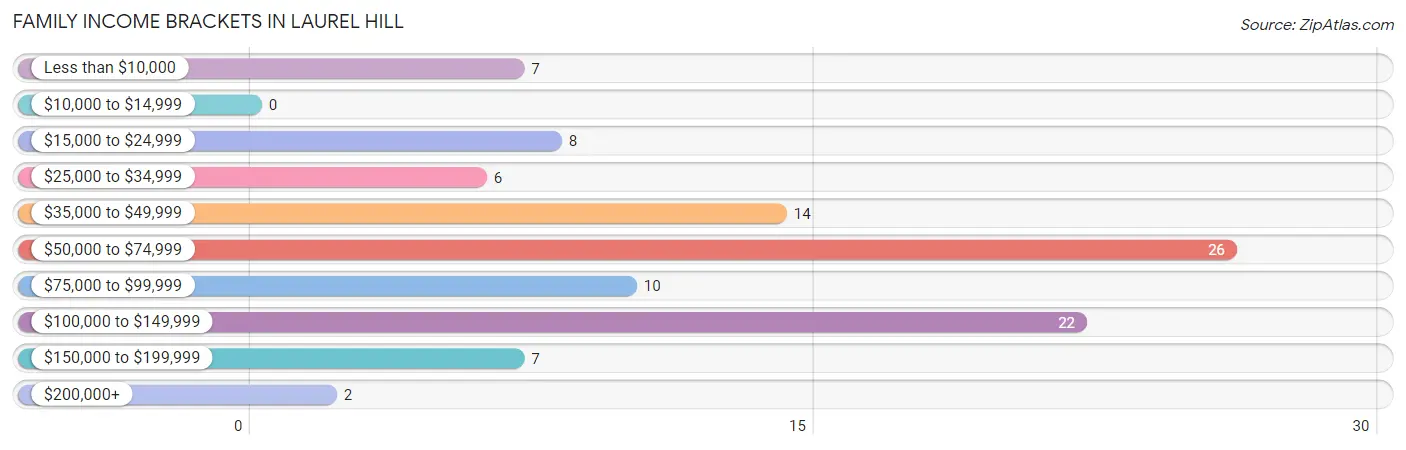
| Income Bracket | # Families | % Families |
| Less than $10,000 | 7 | 6.9% |
| $10,000 to $14,999 | 0 | 0.0% |
| $15,000 to $24,999 | 8 | 7.8% |
| $25,000 to $34,999 | 6 | 5.9% |
| $35,000 to $49,999 | 14 | 13.7% |
| $50,000 to $74,999 | 26 | 25.5% |
| $75,000 to $99,999 | 10 | 9.8% |
| $100,000 to $149,999 | 22 | 21.6% |
| $150,000 to $199,999 | 7 | 6.9% |
| $200,000+ | 2 | 2.0% |
Family Income by Famaliy Size in Laurel Hill
2-person families (55 | 53.9%) account for the highest median family income in Laurel Hill with $63,125 per family, while 2-person families (55 | 53.9%) have the highest median income of $31,562 per family member.
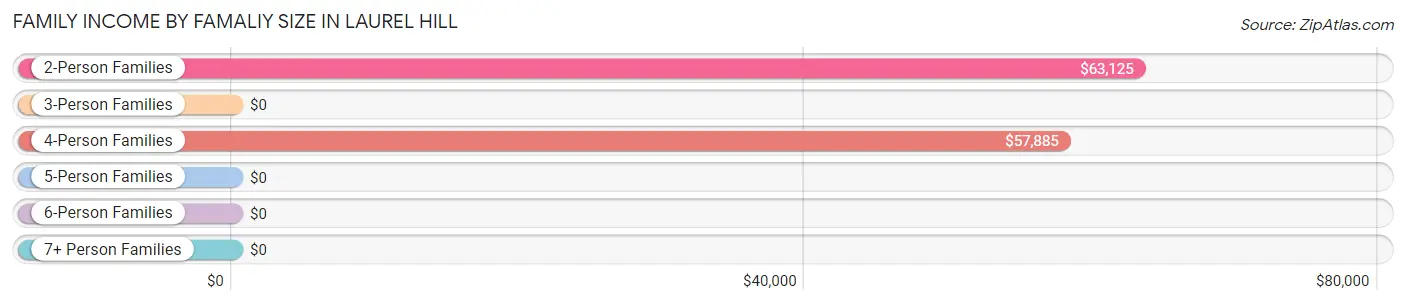
| Income Bracket | # Families | Median Income |
| 2-Person Families | 55 (53.9%) | $63,125 |
| 3-Person Families | 4 (3.9%) | $0 |
| 4-Person Families | 28 (27.5%) | $57,885 |
| 5-Person Families | 2 (2.0%) | $0 |
| 6-Person Families | 2 (2.0%) | $0 |
| 7+ Person Families | 11 (10.8%) | $0 |
| Total | 102 (100.0%) | $59,667 |
Family Income by Number of Earners in Laurel Hill
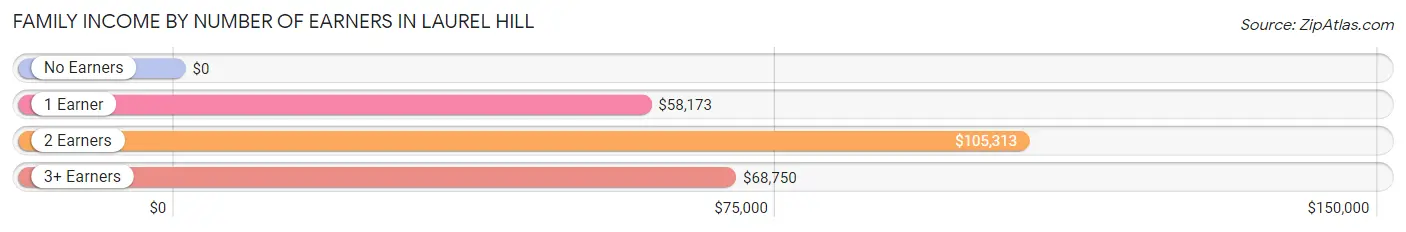
| Number of Earners | # Families | Median Income |
| No Earners | 20 (19.6%) | $0 |
| 1 Earner | 41 (40.2%) | $58,173 |
| 2 Earners | 29 (28.4%) | $105,313 |
| 3+ Earners | 12 (11.8%) | $68,750 |
| Total | 102 (100.0%) | $59,667 |
Household Income in Laurel Hill
Household Income Brackets in Laurel Hill
With 38 households falling in the category, the $50,000 to $74,999 income range is the most frequent in Laurel Hill, accounting for 20.8% of all households. In contrast, only 2 households (1.1%) fall into the $10,000 to $14,999 income bracket, making it the least populous group.
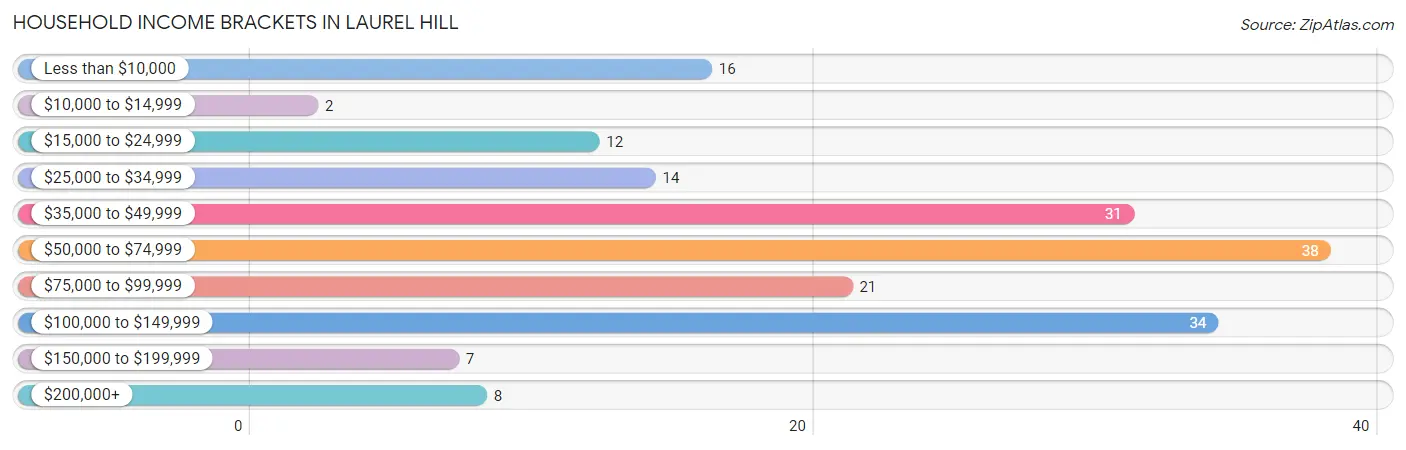
| Income Bracket | # Households | % Households |
| Less than $10,000 | 16 | 8.7% |
| $10,000 to $14,999 | 2 | 1.1% |
| $15,000 to $24,999 | 12 | 6.6% |
| $25,000 to $34,999 | 14 | 7.7% |
| $35,000 to $49,999 | 31 | 16.9% |
| $50,000 to $74,999 | 38 | 20.8% |
| $75,000 to $99,999 | 21 | 11.5% |
| $100,000 to $149,999 | 34 | 18.6% |
| $150,000 to $199,999 | 7 | 3.8% |
| $200,000+ | 8 | 4.4% |
Household Income by Householder Age in Laurel Hill
The median household income in Laurel Hill is $58,967, with the highest median household income of $62,188 found in the 45 to 64 years age bracket for the primary householder. A total of 47 households (25.7%) fall into this category. Meanwhile, the 15 to 24 years age bracket for the primary householder has the lowest median household income of $0, with 13 households (7.1%) in this group.
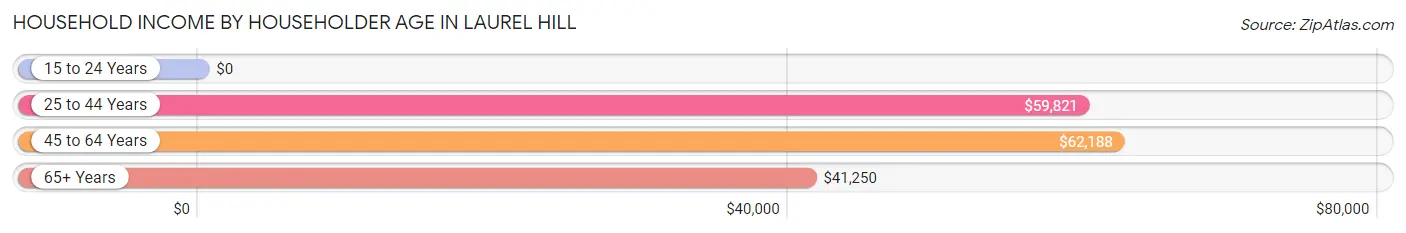
| Income Bracket | # Households | Median Income |
| 15 to 24 Years | 13 (7.1%) | $0 |
| 25 to 44 Years | 74 (40.4%) | $59,821 |
| 45 to 64 Years | 47 (25.7%) | $62,188 |
| 65+ Years | 49 (26.8%) | $41,250 |
| Total | 183 (100.0%) | $58,967 |
Poverty in Laurel Hill
Income Below Poverty by Sex and Age in Laurel Hill
With 8.2% poverty level for males and 18.0% for females among the residents of Laurel Hill, under 5 year old males and 16 and 17 year old females are the most vulnerable to poverty, with 11 males (78.6%) and 9 females (69.2%) in their respective age groups living below the poverty level.
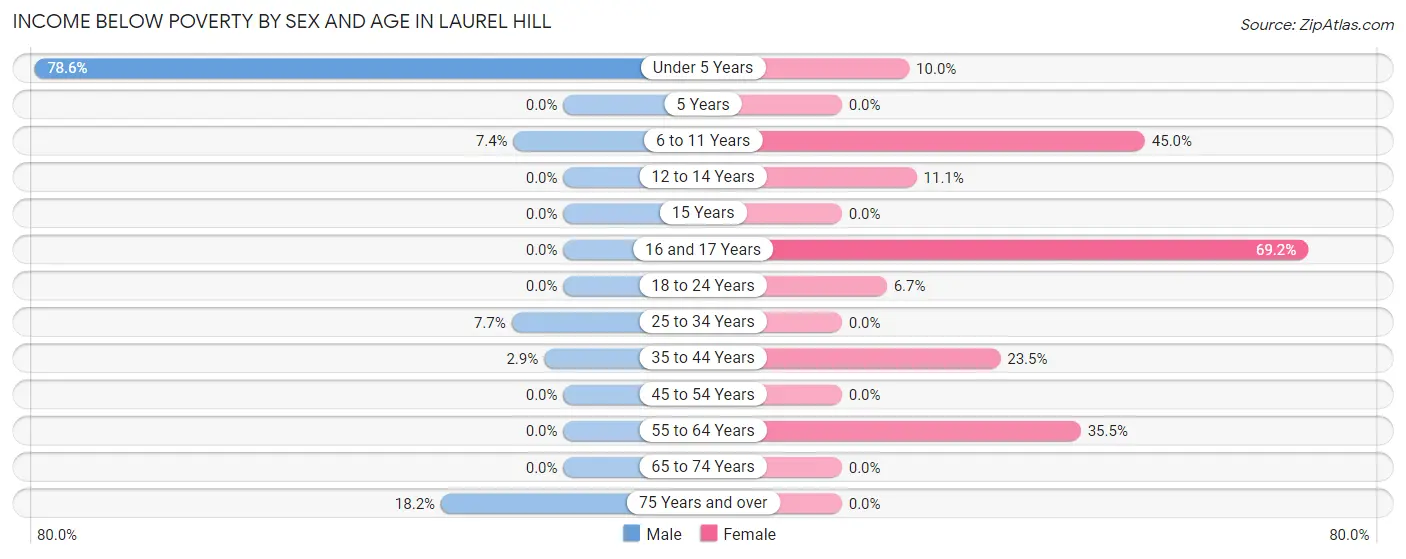
| Age Bracket | Male | Female |
| Under 5 Years | 11 (78.6%) | 2 (10.0%) |
| 5 Years | 0 (0.0%) | 0 (0.0%) |
| 6 to 11 Years | 2 (7.4%) | 9 (45.0%) |
| 12 to 14 Years | 0 (0.0%) | 2 (11.1%) |
| 15 Years | 0 (0.0%) | 0 (0.0%) |
| 16 and 17 Years | 0 (0.0%) | 9 (69.2%) |
| 18 to 24 Years | 0 (0.0%) | 1 (6.7%) |
| 25 to 34 Years | 3 (7.7%) | 0 (0.0%) |
| 35 to 44 Years | 1 (2.9%) | 8 (23.5%) |
| 45 to 54 Years | 0 (0.0%) | 0 (0.0%) |
| 55 to 64 Years | 0 (0.0%) | 11 (35.5%) |
| 65 to 74 Years | 0 (0.0%) | 0 (0.0%) |
| 75 Years and over | 2 (18.2%) | 0 (0.0%) |
| Total | 19 (8.2%) | 42 (18.0%) |
Income Above Poverty by Sex and Age in Laurel Hill
According to the poverty statistics in Laurel Hill, males aged 12 to 14 years and females aged 5 years are the age groups that are most secure financially, with 100.0% of males and 100.0% of females in these age groups living above the poverty line.
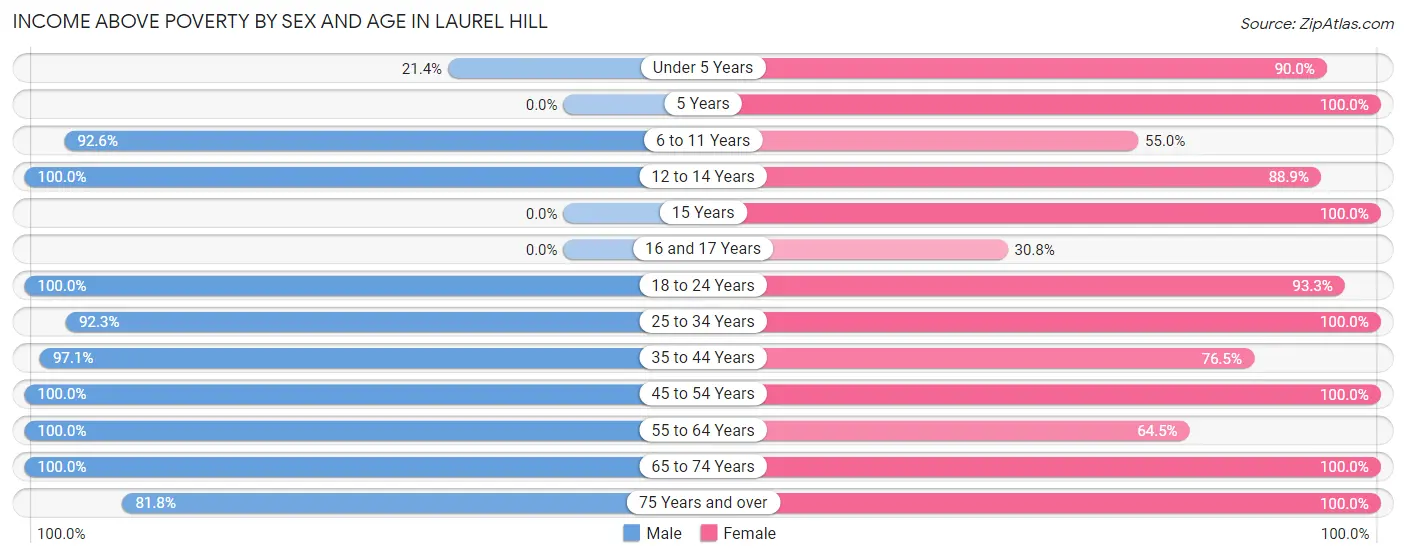
| Age Bracket | Male | Female |
| Under 5 Years | 3 (21.4%) | 18 (90.0%) |
| 5 Years | 0 (0.0%) | 9 (100.0%) |
| 6 to 11 Years | 25 (92.6%) | 11 (55.0%) |
| 12 to 14 Years | 15 (100.0%) | 16 (88.9%) |
| 15 Years | 0 (0.0%) | 8 (100.0%) |
| 16 and 17 Years | 0 (0.0%) | 4 (30.8%) |
| 18 to 24 Years | 20 (100.0%) | 14 (93.3%) |
| 25 to 34 Years | 36 (92.3%) | 21 (100.0%) |
| 35 to 44 Years | 34 (97.1%) | 26 (76.5%) |
| 45 to 54 Years | 22 (100.0%) | 21 (100.0%) |
| 55 to 64 Years | 22 (100.0%) | 20 (64.5%) |
| 65 to 74 Years | 26 (100.0%) | 15 (100.0%) |
| 75 Years and over | 9 (81.8%) | 8 (100.0%) |
| Total | 212 (91.8%) | 191 (82.0%) |
Income Below Poverty Among Married-Couple Families in Laurel Hill
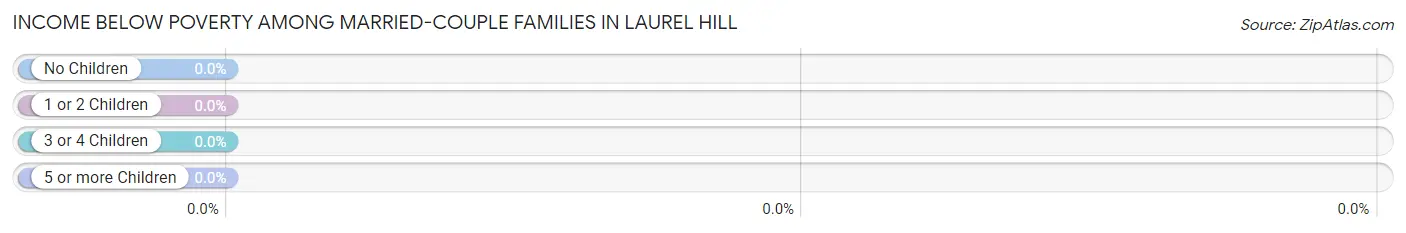
| Children | Above Poverty | Below Poverty |
| No Children | 40 (100.0%) | 0 (0.0%) |
| 1 or 2 Children | 21 (100.0%) | 0 (0.0%) |
| 3 or 4 Children | 6 (100.0%) | 0 (0.0%) |
| 5 or more Children | 7 (100.0%) | 0 (0.0%) |
| Total | 74 (100.0%) | 0 (0.0%) |
Income Below Poverty Among Single-Parent Households in Laurel Hill
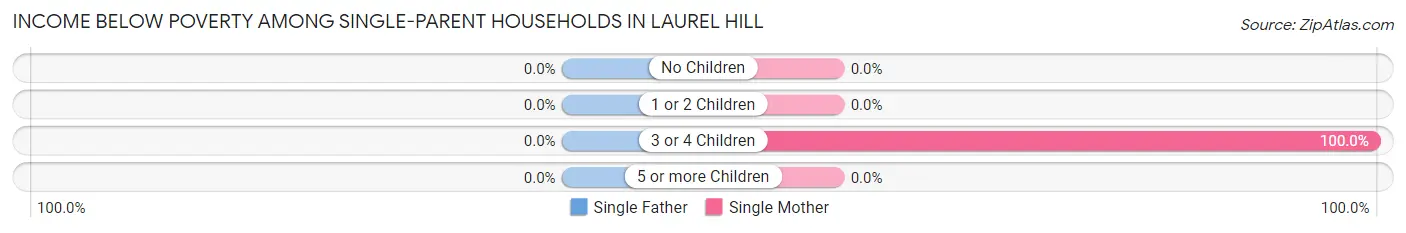
| Children | Single Father | Single Mother |
| No Children | 0 (0.0%) | 0 (0.0%) |
| 1 or 2 Children | 0 (0.0%) | 0 (0.0%) |
| 3 or 4 Children | 0 (0.0%) | 8 (100.0%) |
| 5 or more Children | 0 (0.0%) | 0 (0.0%) |
| Total | 0 (0.0%) | 8 (38.1%) |
Income Below Poverty Among Married-Couple vs Single-Parent Households in Laurel Hill
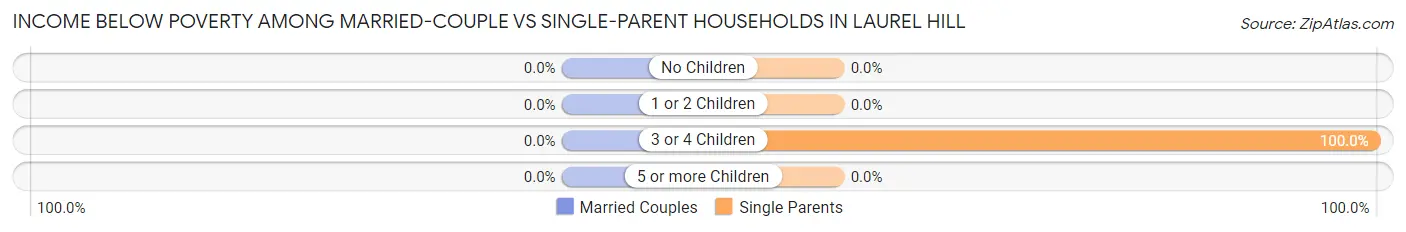
| Children | Married-Couple Families | Single-Parent Households |
| No Children | 0 (0.0%) | 0 (0.0%) |
| 1 or 2 Children | 0 (0.0%) | 0 (0.0%) |
| 3 or 4 Children | 0 (0.0%) | 8 (100.0%) |
| 5 or more Children | 0 (0.0%) | 0 (0.0%) |
| Total | 0 (0.0%) | 8 (28.6%) |
Race in Laurel Hill
The most populous races in Laurel Hill are White / Caucasian (405 | 86.4%), Black / African American (53 | 11.3%), and Hispanic or Latino (14 | 3.0%).
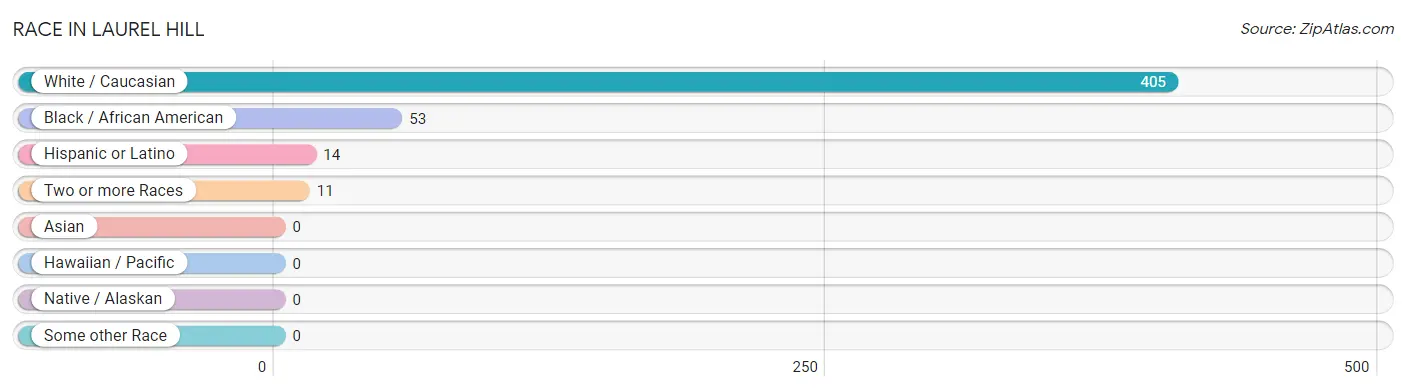
| Race | # Population | % Population |
| Asian | 0 | 0.0% |
| Black / African American | 53 | 11.3% |
| Hawaiian / Pacific | 0 | 0.0% |
| Hispanic or Latino | 14 | 3.0% |
| Native / Alaskan | 0 | 0.0% |
| White / Caucasian | 405 | 86.4% |
| Two or more Races | 11 | 2.4% |
| Some other Race | 0 | 0.0% |
| Total | 469 | 100.0% |
Ancestry in Laurel Hill
The most populous ancestries reported in Laurel Hill are Irish (66 | 14.1%), American (58 | 12.4%), English (57 | 12.1%), German (39 | 8.3%), and Polish (34 | 7.2%), together accounting for 54.2% of all Laurel Hill residents.
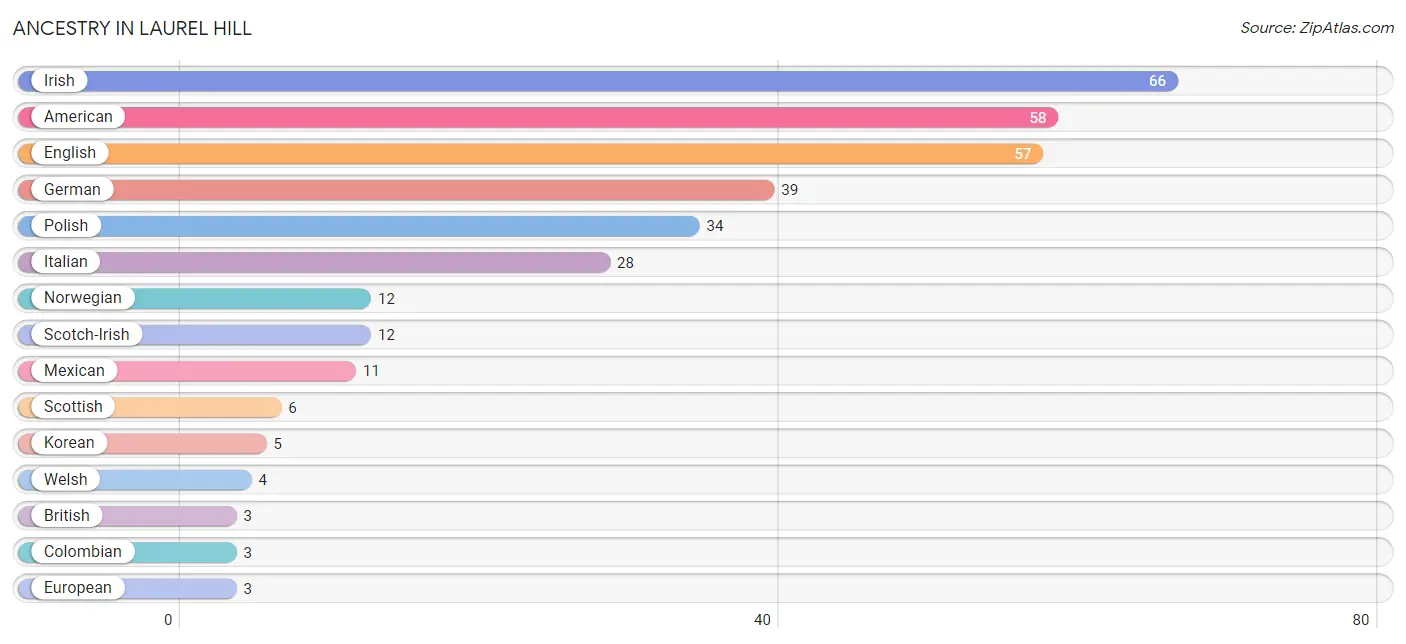
| Ancestry | # Population | % Population |
| American | 58 | 12.4% |
| British | 3 | 0.6% |
| Cherokee | 2 | 0.4% |
| Colombian | 3 | 0.6% |
| English | 57 | 12.1% |
| European | 3 | 0.6% |
| German | 39 | 8.3% |
| Irish | 66 | 14.1% |
| Italian | 28 | 6.0% |
| Korean | 5 | 1.1% |
| Mexican | 11 | 2.4% |
| Norwegian | 12 | 2.6% |
| Polish | 34 | 7.2% |
| Scotch-Irish | 12 | 2.6% |
| Scottish | 6 | 1.3% |
| South American | 3 | 0.6% |
| Swedish | 3 | 0.6% |
| Welsh | 4 | 0.9% | View All 18 Rows |
Immigrants in Laurel Hill

| Immigration Origin | # Population | % Population | View All 0 Rows |
Sex and Age in Laurel Hill
Sex and Age in Laurel Hill
The most populous age groups in Laurel Hill are 10 to 14 Years (32 | 13.9%) for men and 5 to 9 Years (29 | 12.2%) for women.
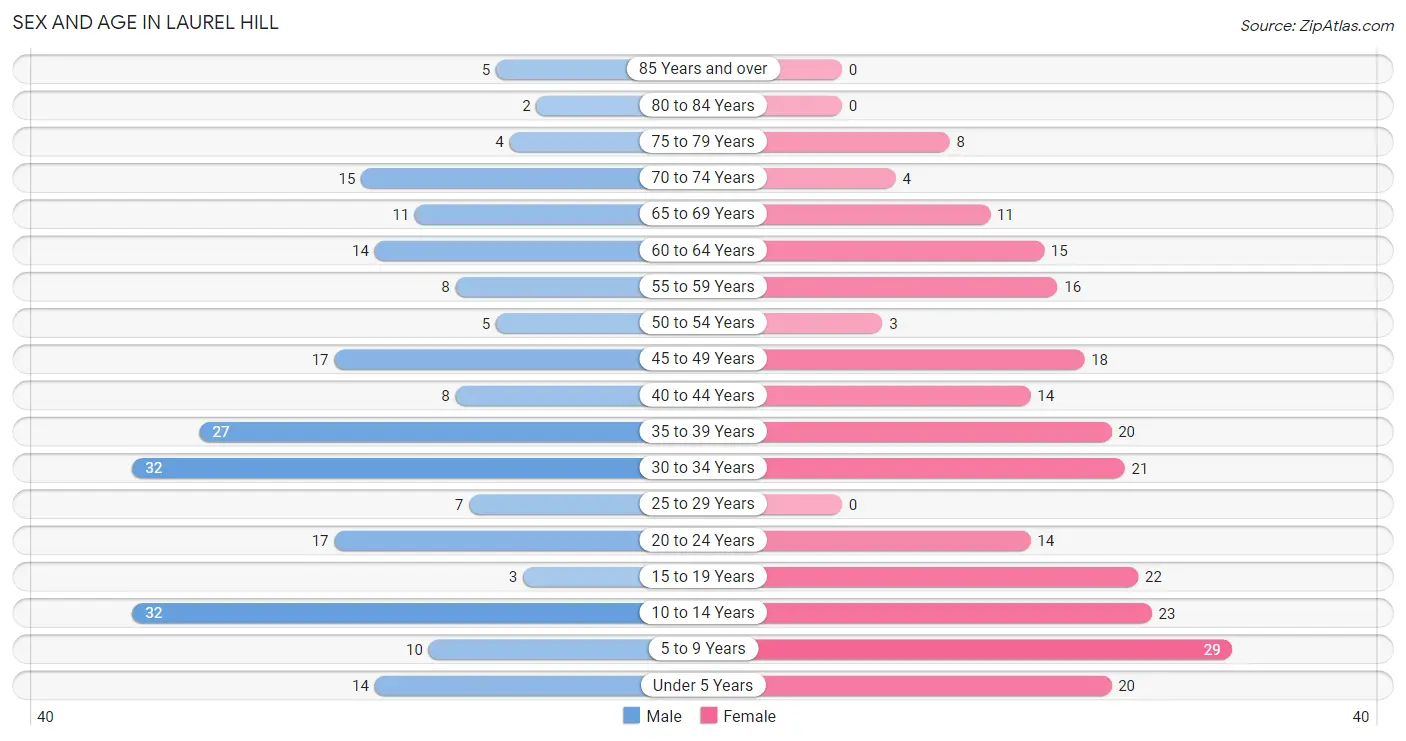
| Age Bracket | Male | Female |
| Under 5 Years | 14 (6.1%) | 20 (8.4%) |
| 5 to 9 Years | 10 (4.3%) | 29 (12.2%) |
| 10 to 14 Years | 32 (13.9%) | 23 (9.7%) |
| 15 to 19 Years | 3 (1.3%) | 22 (9.2%) |
| 20 to 24 Years | 17 (7.4%) | 14 (5.9%) |
| 25 to 29 Years | 7 (3.0%) | 0 (0.0%) |
| 30 to 34 Years | 32 (13.9%) | 21 (8.8%) |
| 35 to 39 Years | 27 (11.7%) | 20 (8.4%) |
| 40 to 44 Years | 8 (3.5%) | 14 (5.9%) |
| 45 to 49 Years | 17 (7.4%) | 18 (7.6%) |
| 50 to 54 Years | 5 (2.2%) | 3 (1.3%) |
| 55 to 59 Years | 8 (3.5%) | 16 (6.7%) |
| 60 to 64 Years | 14 (6.1%) | 15 (6.3%) |
| 65 to 69 Years | 11 (4.8%) | 11 (4.6%) |
| 70 to 74 Years | 15 (6.5%) | 4 (1.7%) |
| 75 to 79 Years | 4 (1.7%) | 8 (3.4%) |
| 80 to 84 Years | 2 (0.9%) | 0 (0.0%) |
| 85 Years and over | 5 (2.2%) | 0 (0.0%) |
| Total | 231 (100.0%) | 238 (100.0%) |
Families and Households in Laurel Hill
Median Family Size in Laurel Hill
The median family size in Laurel Hill is 3.46 persons per family, with married-couple families (74 | 72.6%) accounting for the largest median family size of 3.64 persons per family. On the other hand, single male/father families (7 | 6.9%) represent the smallest median family size with 2.00 persons per family.
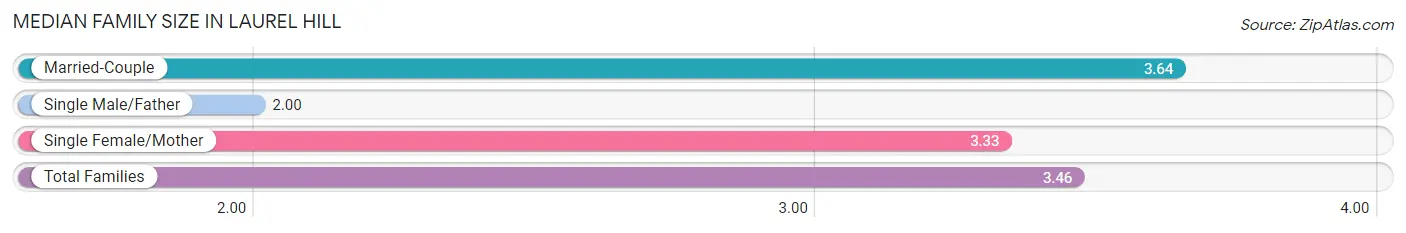
| Family Type | # Families | Family Size |
| Married-Couple | 74 (72.6%) | 3.64 |
| Single Male/Father | 7 (6.9%) | 2.00 |
| Single Female/Mother | 21 (20.6%) | 3.33 |
| Total Families | 102 (100.0%) | 3.46 |
Median Household Size in Laurel Hill
The median household size in Laurel Hill is 2.56 persons per household, with single female/mother households (21 | 11.5%) accounting for the largest median household size of 3.86 persons per household. non-family households (81 | 44.3%) represent the smallest median household size with 1.22 persons per household.
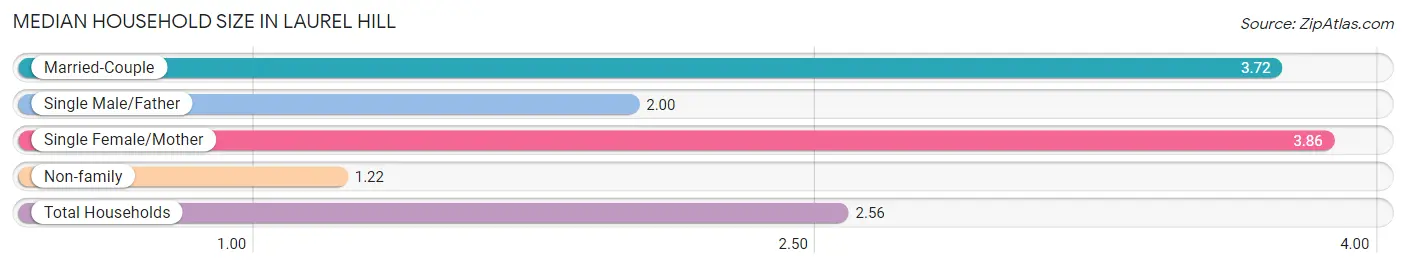
| Household Type | # Households | Household Size |
| Married-Couple | 74 (40.4%) | 3.72 |
| Single Male/Father | 7 (3.8%) | 2.00 |
| Single Female/Mother | 21 (11.5%) | 3.86 |
| Non-family | 81 (44.3%) | 1.22 |
| Total Households | 183 (100.0%) | 2.56 |
Household Size by Marriage Status in Laurel Hill
Out of a total of 183 households in Laurel Hill, 102 (55.7%) are family households, while 81 (44.3%) are nonfamily households. The most numerous type of family households are 2-person households, comprising 47, and the most common type of nonfamily households are 1-person households, comprising 65.
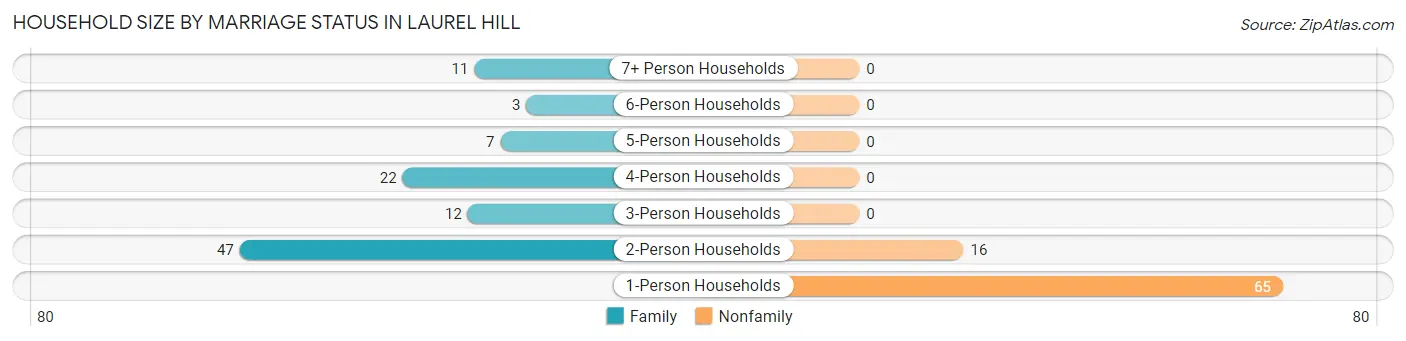
| Household Size | Family Households | Nonfamily Households |
| 1-Person Households | - | 65 (35.5%) |
| 2-Person Households | 47 (25.7%) | 16 (8.7%) |
| 3-Person Households | 12 (6.6%) | 0 (0.0%) |
| 4-Person Households | 22 (12.0%) | 0 (0.0%) |
| 5-Person Households | 7 (3.8%) | 0 (0.0%) |
| 6-Person Households | 3 (1.6%) | 0 (0.0%) |
| 7+ Person Households | 11 (6.0%) | 0 (0.0%) |
| Total | 102 (55.7%) | 81 (44.3%) |
Female Fertility in Laurel Hill
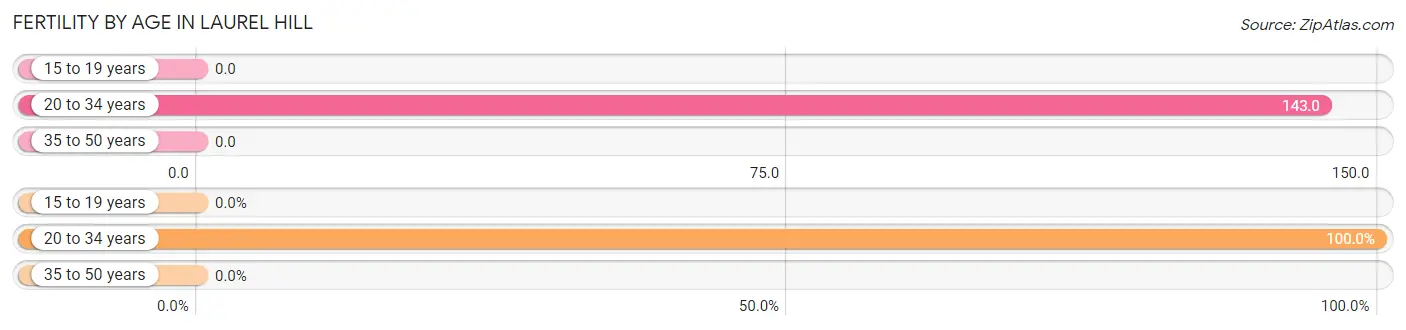
Fertility by Age in Laurel Hill
Average fertility rate in Laurel Hill is 46.0 births per 1,000 women. Women in the age bracket of 20 to 34 years have the highest fertility rate with 143.0 births per 1,000 women. Women in the age bracket of 20 to 34 years acount for 100.0% of all women with births.
| Age Bracket | Women with Births | Births / 1,000 Women |
| 15 to 19 years | 0 (0.0%) | 0.0 |
| 20 to 34 years | 5 (100.0%) | 143.0 |
| 35 to 50 years | 0 (0.0%) | 0.0 |
| Total | 5 (100.0%) | 46.0 |
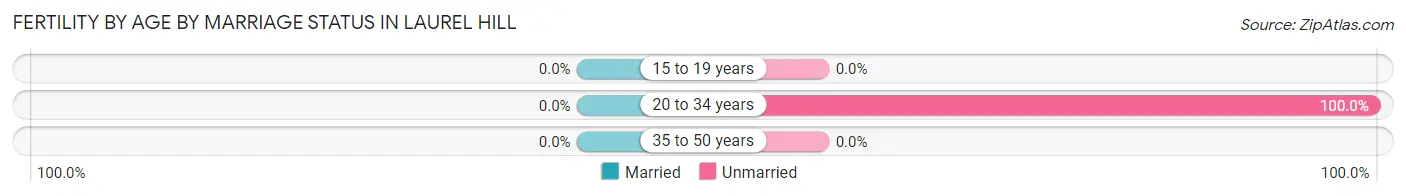
Fertility by Age by Marriage Status in Laurel Hill
| Age Bracket | Married | Unmarried |
| 15 to 19 years | 0 (0.0%) | 0 (0.0%) |
| 20 to 34 years | 0 (0.0%) | 5 (100.0%) |
| 35 to 50 years | 0 (0.0%) | 0 (0.0%) |
| Total | 0 (0.0%) | 5 (100.0%) |
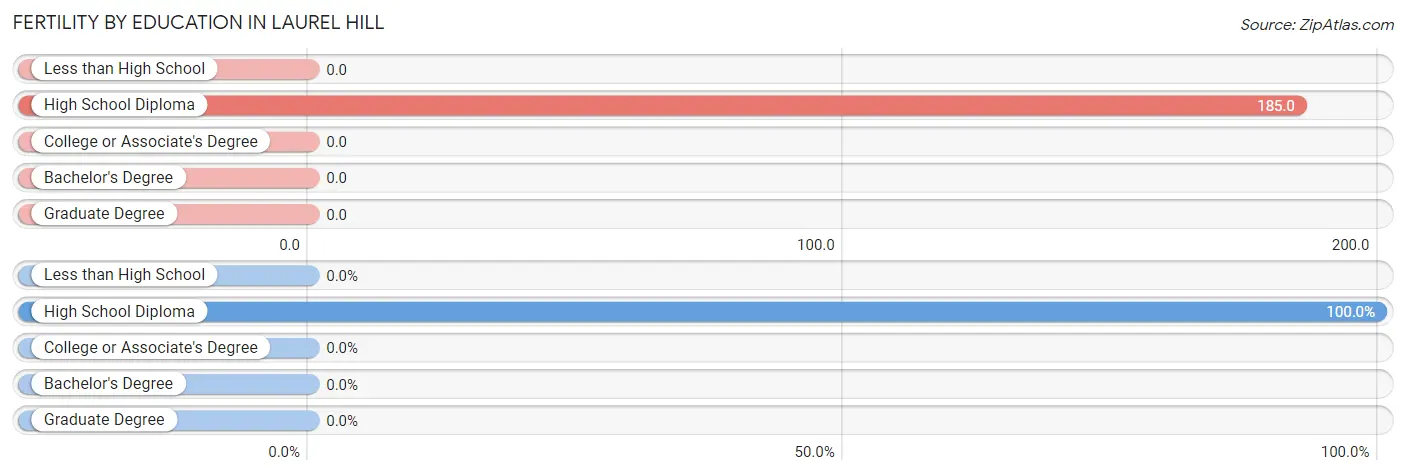
Fertility by Education in Laurel Hill
| Educational Attainment | Women with Births | Births / 1,000 Women |
| Less than High School | 0 (0.0%) | 0.0 |
| High School Diploma | 5 (100.0%) | 185.0 |
| College or Associate's Degree | 0 (0.0%) | 0.0 |
| Bachelor's Degree | 0 (0.0%) | 0.0 |
| Graduate Degree | 0 (0.0%) | 0.0 |
| Total | 5 (100.0%) | 46.0 |
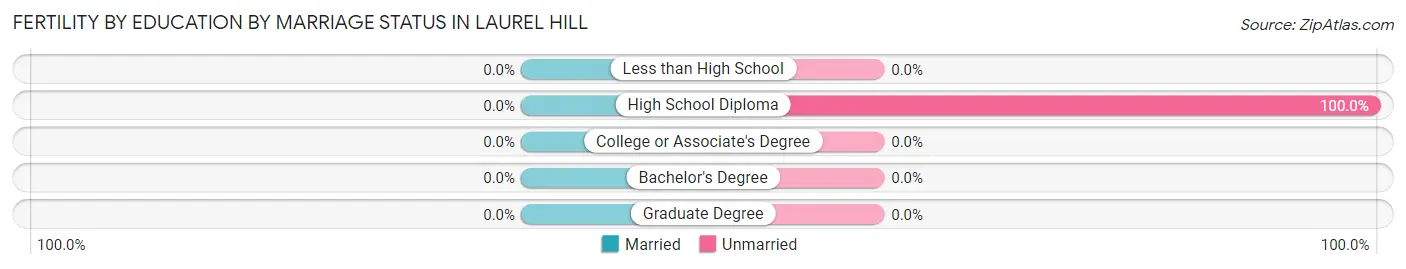
Fertility by Education by Marriage Status in Laurel Hill
| Educational Attainment | Married | Unmarried |
| Less than High School | 0 (0.0%) | 0 (0.0%) |
| High School Diploma | 0 (0.0%) | 5 (100.0%) |
| College or Associate's Degree | 0 (0.0%) | 0 (0.0%) |
| Bachelor's Degree | 0 (0.0%) | 0 (0.0%) |
| Graduate Degree | 0 (0.0%) | 0 (0.0%) |
| Total | 0 (0.0%) | 5 (100.0%) |
Employment Characteristics in Laurel Hill
Employment by Class of Employer in Laurel Hill
Among the 200 employed individuals in Laurel Hill, private company employees (112 | 56.0%), local government employees (31 | 15.5%), and self-employed (not incorporated) (17 | 8.5%) make up the most common classes of employment.
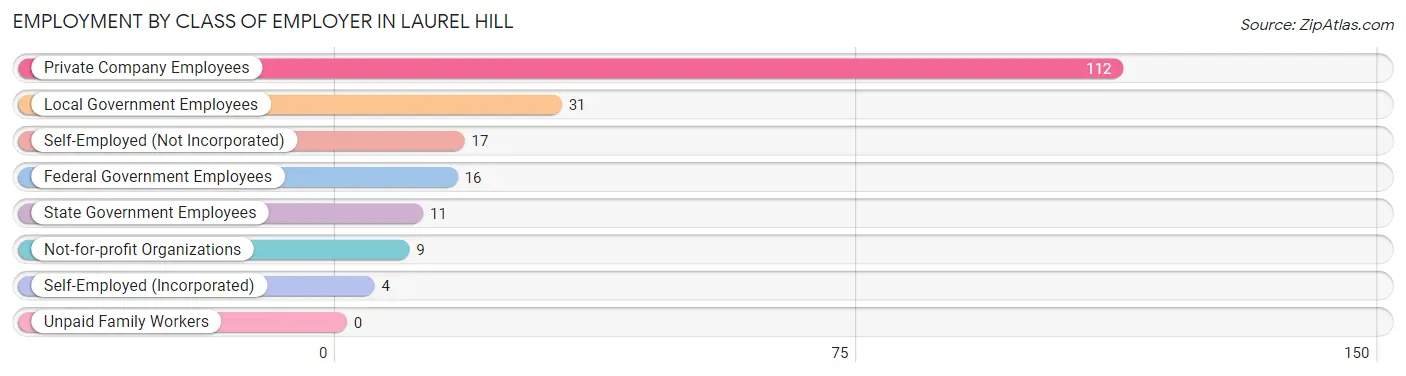
| Employer Class | # Employees | % Employees |
| Private Company Employees | 112 | 56.0% |
| Self-Employed (Incorporated) | 4 | 2.0% |
| Self-Employed (Not Incorporated) | 17 | 8.5% |
| Not-for-profit Organizations | 9 | 4.5% |
| Local Government Employees | 31 | 15.5% |
| State Government Employees | 11 | 5.5% |
| Federal Government Employees | 16 | 8.0% |
| Unpaid Family Workers | 0 | 0.0% |
| Total | 200 | 100.0% |
Employment Status by Age in Laurel Hill
According to the labor force statistics for Laurel Hill, out of the total population over 16 years of age (333), 62.2% or 207 individuals are in the labor force, with 3.5% or 7 of them unemployed. The age group with the highest labor force participation rate is 45 to 54 years, with 95.3% or 41 individuals in the labor force. Within the labor force, the 20 to 24 years age range has the highest percentage of unemployed individuals, with 25.9% or 7 of them being unemployed.
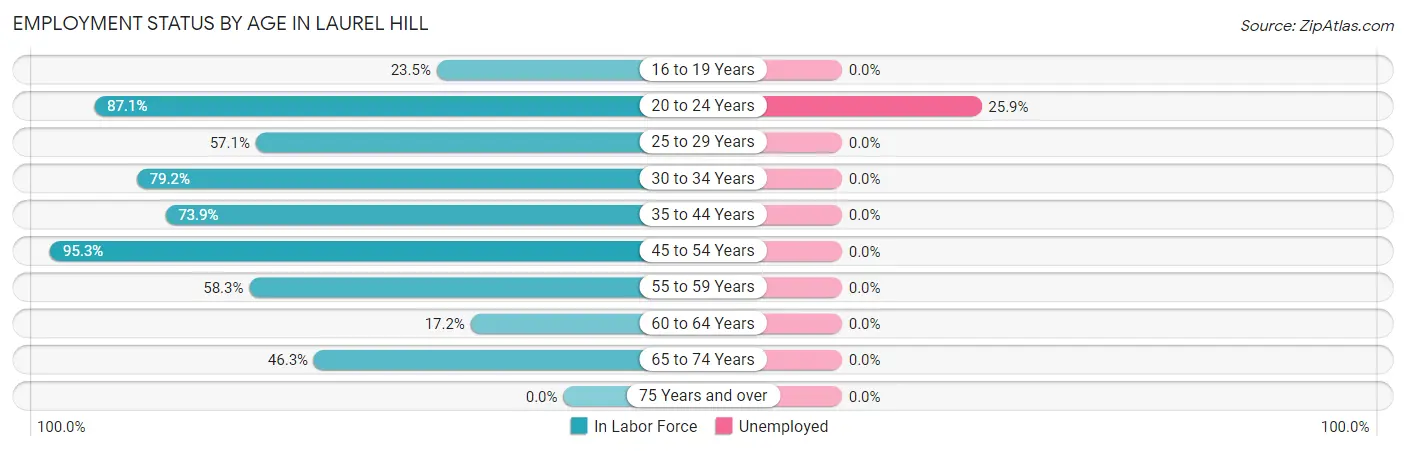
| Age Bracket | In Labor Force | Unemployed |
| 16 to 19 Years | 4 (23.5%) | 0 (0.0%) |
| 20 to 24 Years | 27 (87.1%) | 7 (25.9%) |
| 25 to 29 Years | 4 (57.1%) | 0 (0.0%) |
| 30 to 34 Years | 42 (79.2%) | 0 (0.0%) |
| 35 to 44 Years | 51 (73.9%) | 0 (0.0%) |
| 45 to 54 Years | 41 (95.3%) | 0 (0.0%) |
| 55 to 59 Years | 14 (58.3%) | 0 (0.0%) |
| 60 to 64 Years | 5 (17.2%) | 0 (0.0%) |
| 65 to 74 Years | 19 (46.3%) | 0 (0.0%) |
| 75 Years and over | 0 (0.0%) | 0 (0.0%) |
| Total | 207 (62.2%) | 7 (3.5%) |
Employment Status by Educational Attainment in Laurel Hill
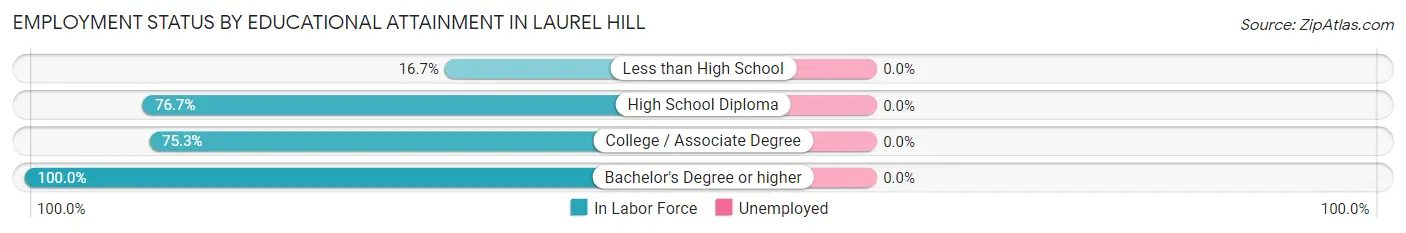
| Educational Attainment | In Labor Force | Unemployed |
| Less than High School | 5 (16.7%) | 0 (0.0%) |
| High School Diploma | 66 (76.7%) | 0 (0.0%) |
| College / Associate Degree | 70 (75.3%) | 0 (0.0%) |
| Bachelor's Degree or higher | 16 (100.0%) | 0 (0.0%) |
| Total | 157 (69.8%) | 0 (0.0%) |
Employment Occupations by Sex in Laurel Hill
Management, Business, Science and Arts Occupations
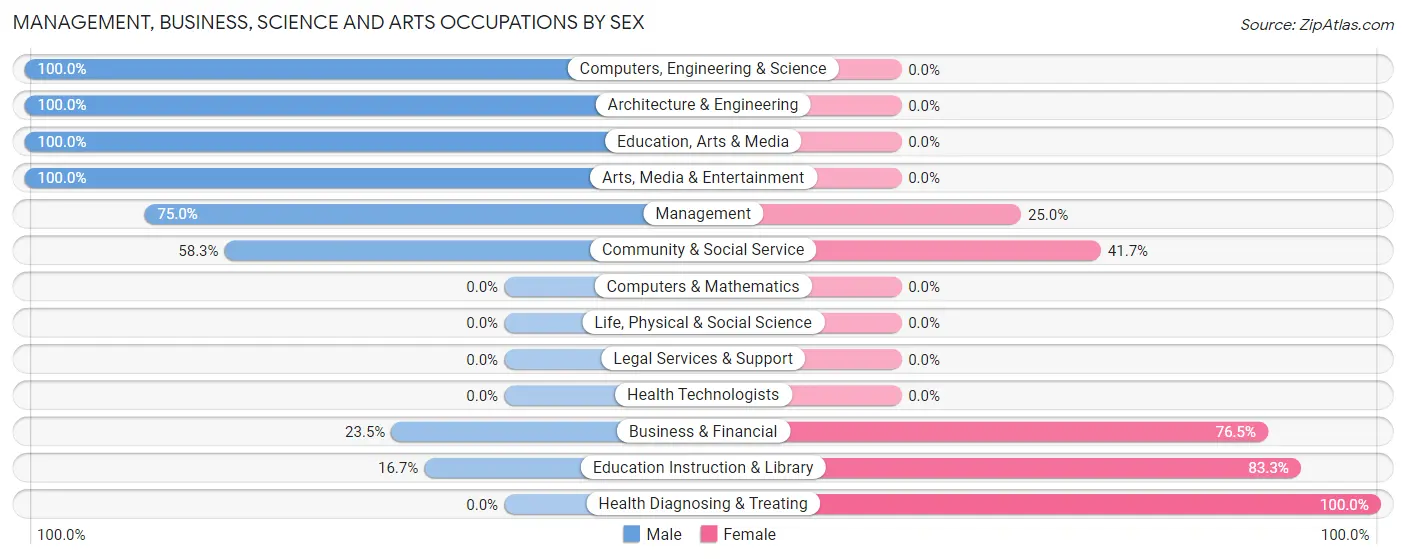
The most common Management, Business, Science and Arts occupations in Laurel Hill are Community & Social Service (24 | 12.5%), Business & Financial (17 | 8.8%), Education Instruction & Library (12 | 6.2%), Arts, Media & Entertainment (10 | 5.2%), and Management (8 | 4.2%).
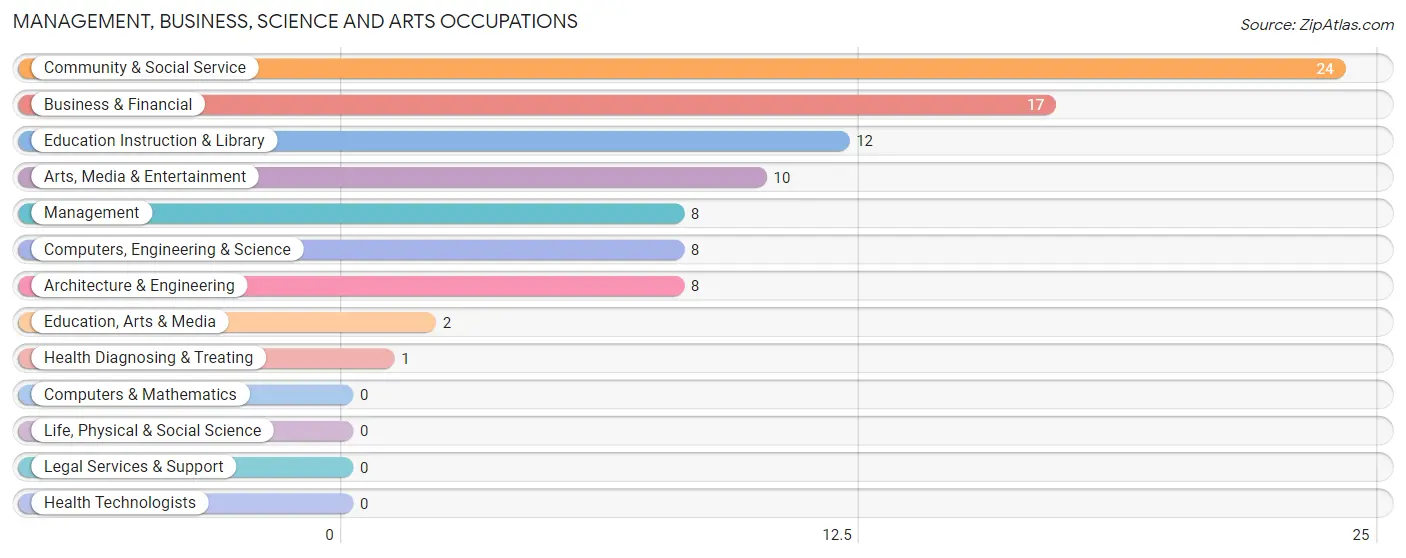
Management, Business, Science and Arts Occupations by Sex
Within the Management, Business, Science and Arts occupations in Laurel Hill, the most male-oriented occupations are Computers, Engineering & Science (100.0%), Architecture & Engineering (100.0%), and Education, Arts & Media (100.0%), while the most female-oriented occupations are Health Diagnosing & Treating (100.0%), Education Instruction & Library (83.3%), and Business & Financial (76.5%).
| Occupation | Male | Female |
| Management | 6 (75.0%) | 2 (25.0%) |
| Business & Financial | 4 (23.5%) | 13 (76.5%) |
| Computers, Engineering & Science | 8 (100.0%) | 0 (0.0%) |
| Computers & Mathematics | 0 (0.0%) | 0 (0.0%) |
| Architecture & Engineering | 8 (100.0%) | 0 (0.0%) |
| Life, Physical & Social Science | 0 (0.0%) | 0 (0.0%) |
| Community & Social Service | 14 (58.3%) | 10 (41.7%) |
| Education, Arts & Media | 2 (100.0%) | 0 (0.0%) |
| Legal Services & Support | 0 (0.0%) | 0 (0.0%) |
| Education Instruction & Library | 2 (16.7%) | 10 (83.3%) |
| Arts, Media & Entertainment | 10 (100.0%) | 0 (0.0%) |
| Health Diagnosing & Treating | 0 (0.0%) | 1 (100.0%) |
| Health Technologists | 0 (0.0%) | 0 (0.0%) |
| Total (Category) | 32 (55.2%) | 26 (44.8%) |
| Total (Overall) | 117 (60.9%) | 75 (39.1%) |
Services Occupations
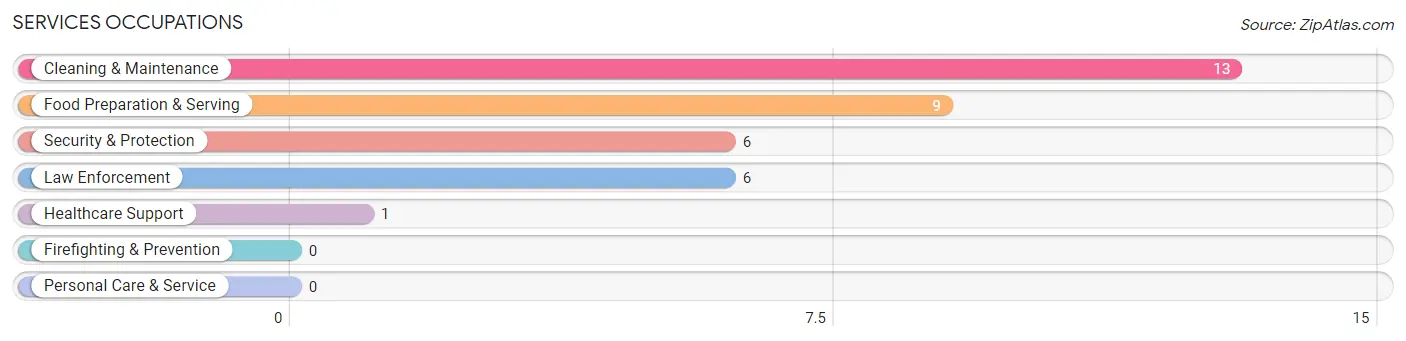
The most common Services occupations in Laurel Hill are Cleaning & Maintenance (13 | 6.8%), Food Preparation & Serving (9 | 4.7%), Security & Protection (6 | 3.1%), Law Enforcement (6 | 3.1%), and Healthcare Support (1 | 0.5%).
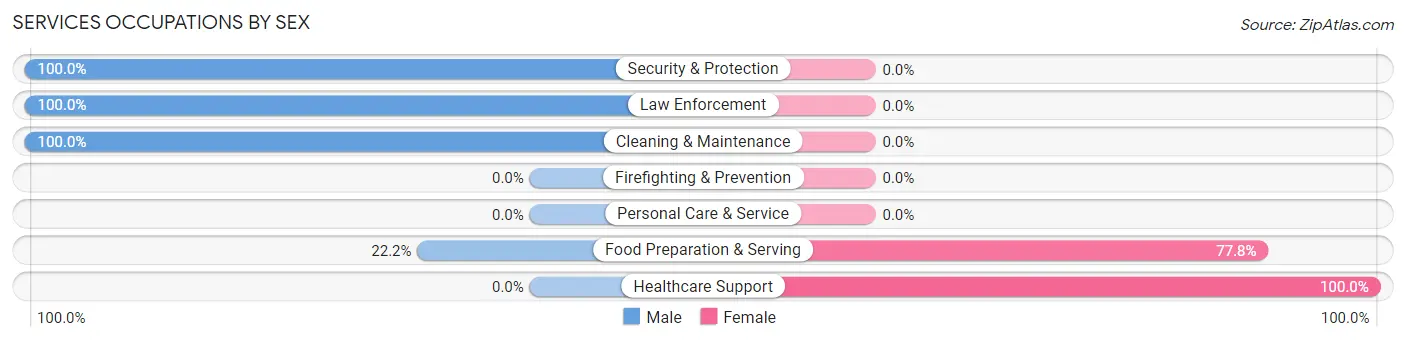
Services Occupations by Sex
Within the Services occupations in Laurel Hill, the most male-oriented occupations are Security & Protection (100.0%), Law Enforcement (100.0%), and Cleaning & Maintenance (100.0%), while the most female-oriented occupations are Healthcare Support (100.0%), and Food Preparation & Serving (77.8%).
| Occupation | Male | Female |
| Healthcare Support | 0 (0.0%) | 1 (100.0%) |
| Security & Protection | 6 (100.0%) | 0 (0.0%) |
| Firefighting & Prevention | 0 (0.0%) | 0 (0.0%) |
| Law Enforcement | 6 (100.0%) | 0 (0.0%) |
| Food Preparation & Serving | 2 (22.2%) | 7 (77.8%) |
| Cleaning & Maintenance | 13 (100.0%) | 0 (0.0%) |
| Personal Care & Service | 0 (0.0%) | 0 (0.0%) |
| Total (Category) | 21 (72.4%) | 8 (27.6%) |
| Total (Overall) | 117 (60.9%) | 75 (39.1%) |
Sales and Office Occupations
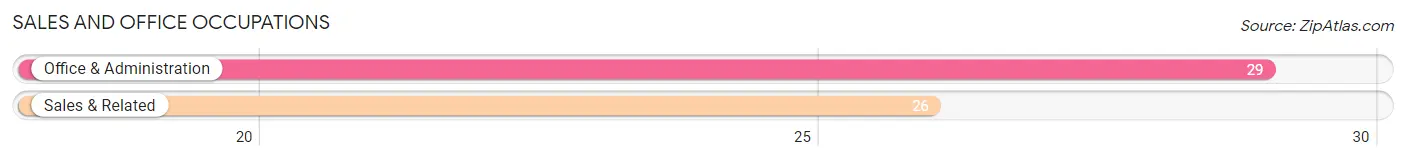
The most common Sales and Office occupations in Laurel Hill are Office & Administration (29 | 15.1%), and Sales & Related (26 | 13.5%).
Sales and Office Occupations by Sex
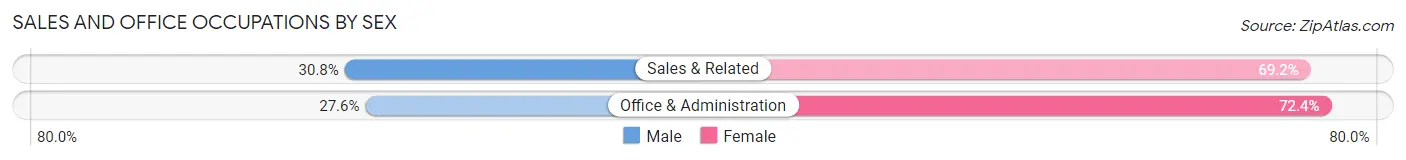
| Occupation | Male | Female |
| Sales & Related | 8 (30.8%) | 18 (69.2%) |
| Office & Administration | 8 (27.6%) | 21 (72.4%) |
| Total (Category) | 16 (29.1%) | 39 (70.9%) |
| Total (Overall) | 117 (60.9%) | 75 (39.1%) |
Natural Resources, Construction and Maintenance Occupations
The most common Natural Resources, Construction and Maintenance occupations in Laurel Hill are Construction & Extraction (17 | 8.8%), and Installation, Maintenance & Repair (15 | 7.8%).
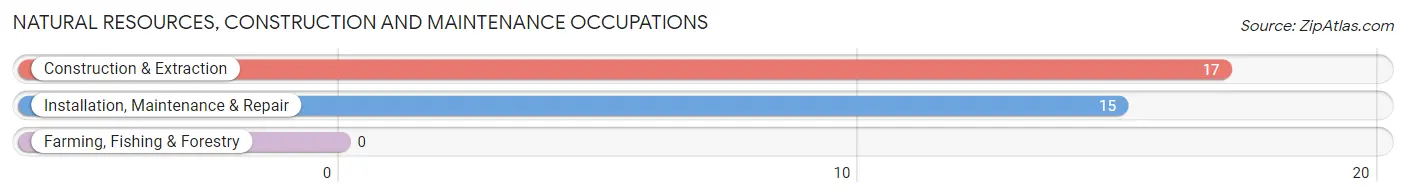
Natural Resources, Construction and Maintenance Occupations by Sex

| Occupation | Male | Female |
| Farming, Fishing & Forestry | 0 (0.0%) | 0 (0.0%) |
| Construction & Extraction | 17 (100.0%) | 0 (0.0%) |
| Installation, Maintenance & Repair | 15 (100.0%) | 0 (0.0%) |
| Total (Category) | 32 (100.0%) | 0 (0.0%) |
| Total (Overall) | 117 (60.9%) | 75 (39.1%) |
Production, Transportation and Moving Occupations
The most common Production, Transportation and Moving occupations in Laurel Hill are Transportation (12 | 6.2%), Production (4 | 2.1%), and Material Moving (2 | 1.0%).
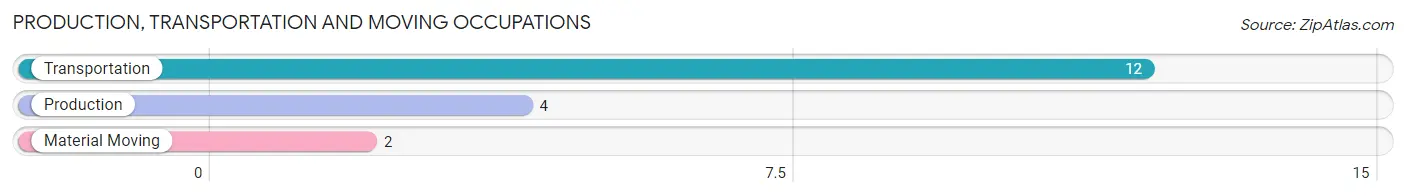
Production, Transportation and Moving Occupations by Sex
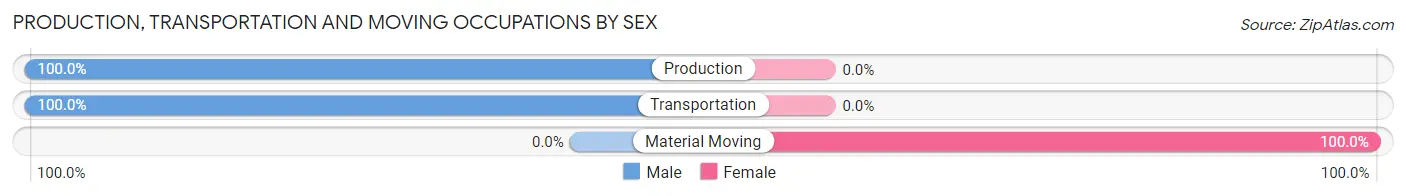
| Occupation | Male | Female |
| Production | 4 (100.0%) | 0 (0.0%) |
| Transportation | 12 (100.0%) | 0 (0.0%) |
| Material Moving | 0 (0.0%) | 2 (100.0%) |
| Total (Category) | 16 (88.9%) | 2 (11.1%) |
| Total (Overall) | 117 (60.9%) | 75 (39.1%) |
Employment Industries by Sex in Laurel Hill
Employment Industries in Laurel Hill
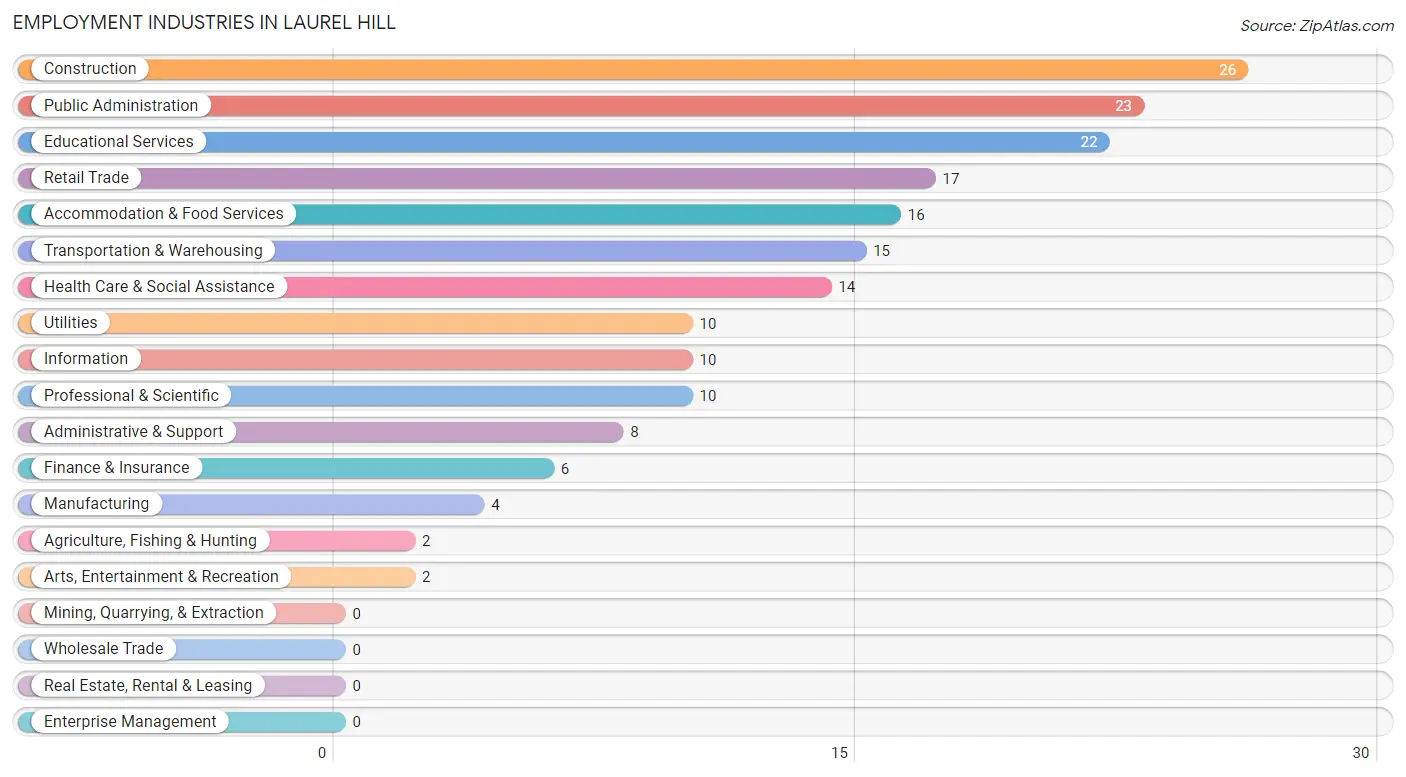
The major employment industries in Laurel Hill include Construction (26 | 13.5%), Public Administration (23 | 12.0%), Educational Services (22 | 11.5%), Retail Trade (17 | 8.8%), and Accommodation & Food Services (16 | 8.3%).
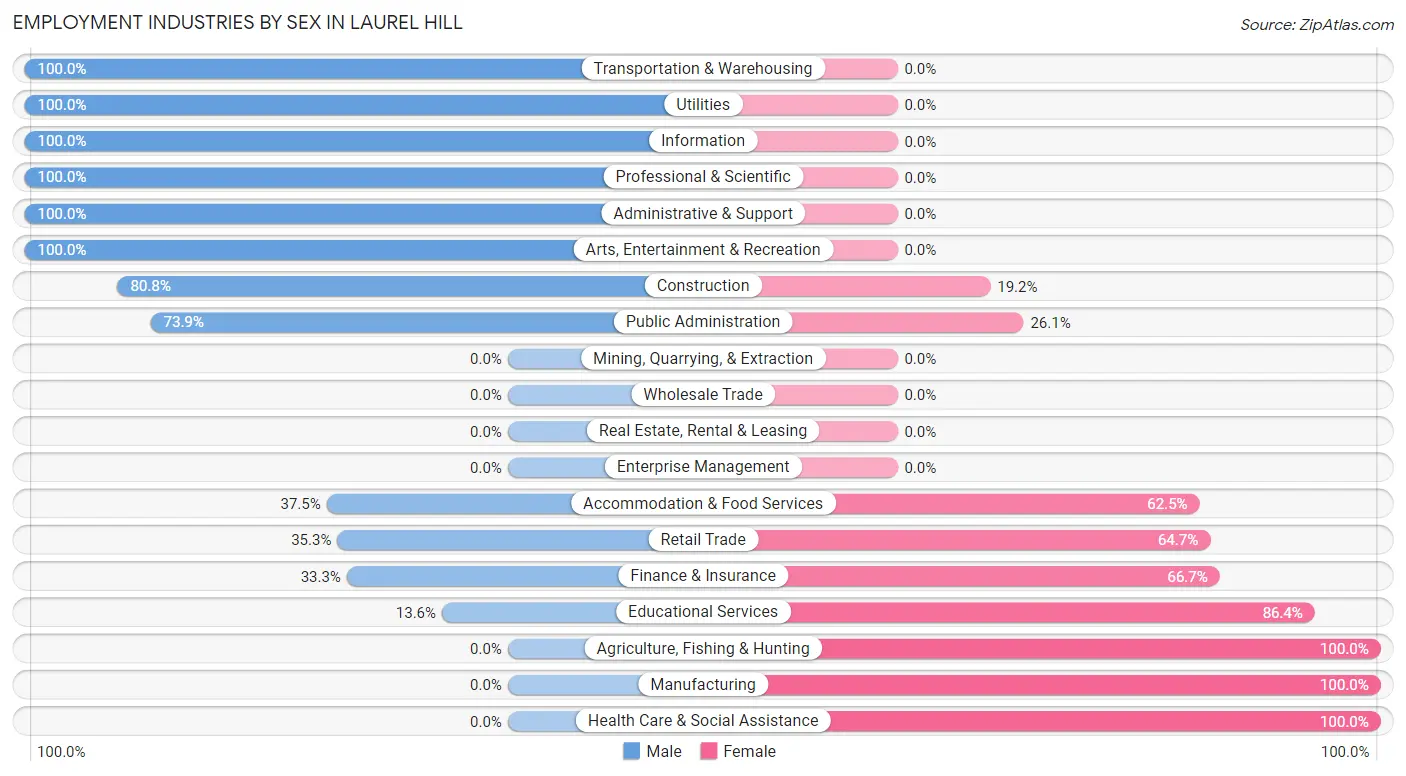
Employment Industries by Sex in Laurel Hill
The Laurel Hill industries that see more men than women are Transportation & Warehousing (100.0%), Utilities (100.0%), and Information (100.0%), whereas the industries that tend to have a higher number of women are Agriculture, Fishing & Hunting (100.0%), Manufacturing (100.0%), and Health Care & Social Assistance (100.0%).
| Industry | Male | Female |
| Agriculture, Fishing & Hunting | 0 (0.0%) | 2 (100.0%) |
| Mining, Quarrying, & Extraction | 0 (0.0%) | 0 (0.0%) |
| Construction | 21 (80.8%) | 5 (19.2%) |
| Manufacturing | 0 (0.0%) | 4 (100.0%) |
| Wholesale Trade | 0 (0.0%) | 0 (0.0%) |
| Retail Trade | 6 (35.3%) | 11 (64.7%) |
| Transportation & Warehousing | 15 (100.0%) | 0 (0.0%) |
| Utilities | 10 (100.0%) | 0 (0.0%) |
| Information | 10 (100.0%) | 0 (0.0%) |
| Finance & Insurance | 2 (33.3%) | 4 (66.7%) |
| Real Estate, Rental & Leasing | 0 (0.0%) | 0 (0.0%) |
| Professional & Scientific | 10 (100.0%) | 0 (0.0%) |
| Enterprise Management | 0 (0.0%) | 0 (0.0%) |
| Administrative & Support | 8 (100.0%) | 0 (0.0%) |
| Educational Services | 3 (13.6%) | 19 (86.4%) |
| Health Care & Social Assistance | 0 (0.0%) | 14 (100.0%) |
| Arts, Entertainment & Recreation | 2 (100.0%) | 0 (0.0%) |
| Accommodation & Food Services | 6 (37.5%) | 10 (62.5%) |
| Public Administration | 17 (73.9%) | 6 (26.1%) |
| Total | 117 (60.9%) | 75 (39.1%) |
Education in Laurel Hill
School Enrollment in Laurel Hill
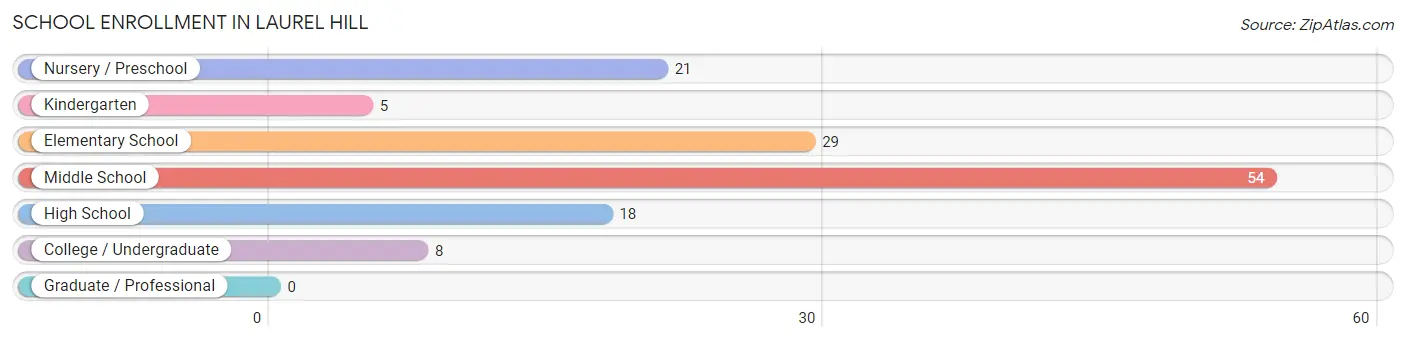
The most common levels of schooling among the 135 students in Laurel Hill are middle school (54 | 40.0%), elementary school (29 | 21.5%), and nursery / preschool (21 | 15.6%).
| School Level | # Students | % Students |
| Nursery / Preschool | 21 | 15.6% |
| Kindergarten | 5 | 3.7% |
| Elementary School | 29 | 21.5% |
| Middle School | 54 | 40.0% |
| High School | 18 | 13.3% |
| College / Undergraduate | 8 | 5.9% |
| Graduate / Professional | 0 | 0.0% |
| Total | 135 | 100.0% |
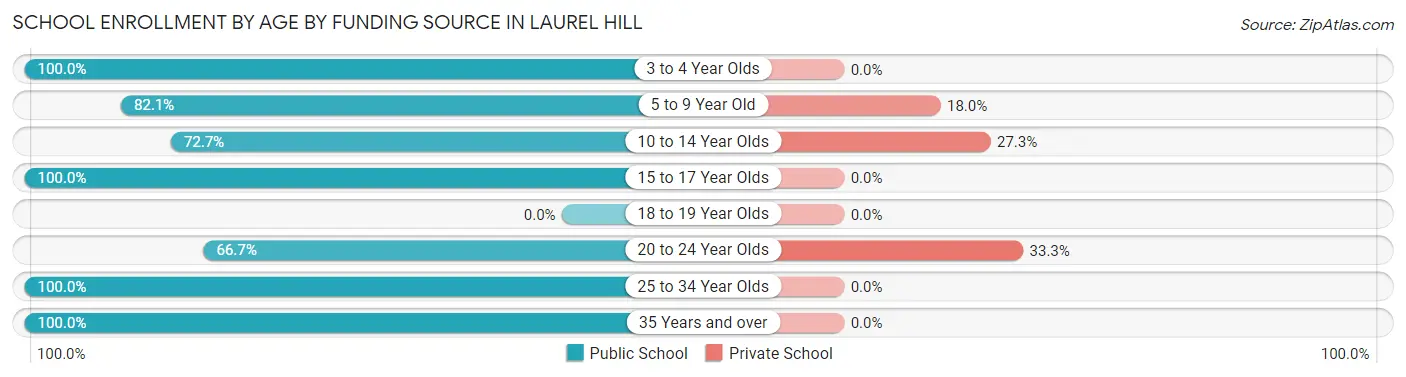
School Enrollment by Age by Funding Source in Laurel Hill
Out of a total of 135 students who are enrolled in schools in Laurel Hill, 24 (17.8%) attend a private institution, while the remaining 111 (82.2%) are enrolled in public schools. The age group of 20 to 24 year olds has the highest likelihood of being enrolled in private schools, with 2 (33.3% in the age bracket) enrolled. Conversely, the age group of 3 to 4 year olds has the lowest likelihood of being enrolled in a private school, with 12 (100.0% in the age bracket) attending a public institution.
| Age Bracket | Public School | Private School |
| 3 to 4 Year Olds | 12 (100.0%) | 0 (0.0%) |
| 5 to 9 Year Old | 32 (82.1%) | 7 (17.9%) |
| 10 to 14 Year Olds | 40 (72.7%) | 15 (27.3%) |
| 15 to 17 Year Olds | 21 (100.0%) | 0 (0.0%) |
| 18 to 19 Year Olds | 0 (0.0%) | 0 (0.0%) |
| 20 to 24 Year Olds | 4 (66.7%) | 2 (33.3%) |
| 25 to 34 Year Olds | 1 (100.0%) | 0 (0.0%) |
| 35 Years and over | 1 (100.0%) | 0 (0.0%) |
| Total | 111 (82.2%) | 24 (17.8%) |
Educational Attainment by Field of Study in Laurel Hill
Liberal arts & history (14 | 56.0%), education (9 | 36.0%), and arts & humanities (2 | 8.0%) are the most common fields of study among 25 individuals in Laurel Hill who have obtained a bachelor's degree or higher.
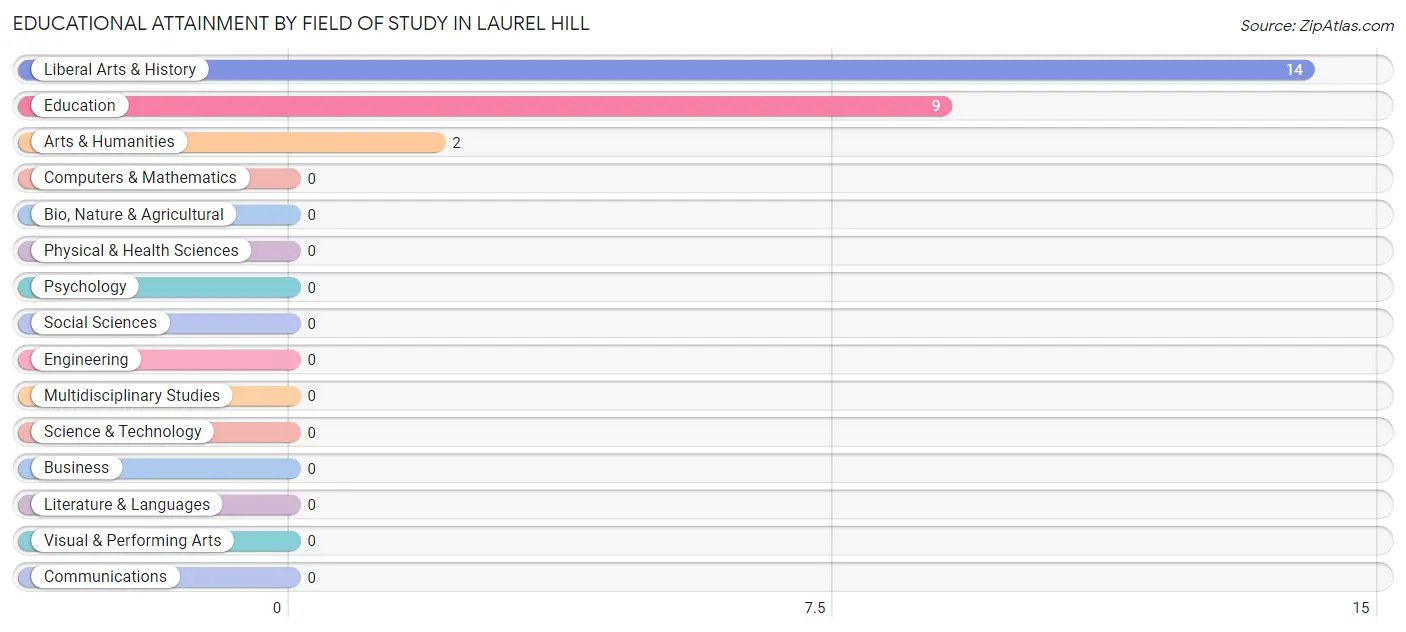
| Field of Study | # Graduates | % Graduates |
| Computers & Mathematics | 0 | 0.0% |
| Bio, Nature & Agricultural | 0 | 0.0% |
| Physical & Health Sciences | 0 | 0.0% |
| Psychology | 0 | 0.0% |
| Social Sciences | 0 | 0.0% |
| Engineering | 0 | 0.0% |
| Multidisciplinary Studies | 0 | 0.0% |
| Science & Technology | 0 | 0.0% |
| Business | 0 | 0.0% |
| Education | 9 | 36.0% |
| Literature & Languages | 0 | 0.0% |
| Liberal Arts & History | 14 | 56.0% |
| Visual & Performing Arts | 0 | 0.0% |
| Communications | 0 | 0.0% |
| Arts & Humanities | 2 | 8.0% |
| Total | 25 | 100.0% |
Transportation & Commute in Laurel Hill
Vehicle Availability by Sex in Laurel Hill
The most prevalent vehicle ownership categories in Laurel Hill are males with 2 vehicles (48, accounting for 38.4%) and females with 2 vehicles (31, making up 64.0%).
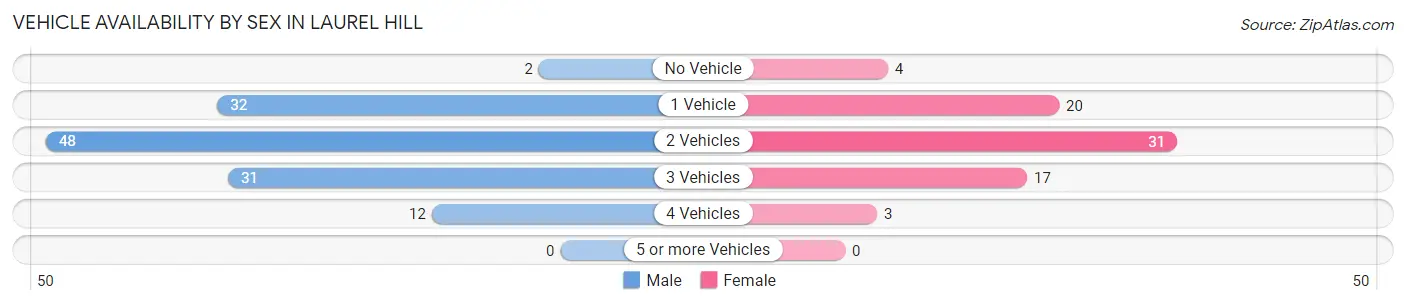
| Vehicles Available | Male | Female |
| No Vehicle | 2 (1.6%) | 4 (5.3%) |
| 1 Vehicle | 32 (25.6%) | 20 (26.7%) |
| 2 Vehicles | 48 (38.4%) | 31 (41.3%) |
| 3 Vehicles | 31 (24.8%) | 17 (22.7%) |
| 4 Vehicles | 12 (9.6%) | 3 (4.0%) |
| 5 or more Vehicles | 0 (0.0%) | 0 (0.0%) |
| Total | 125 (100.0%) | 75 (100.0%) |
Commute Time in Laurel Hill
The most frequently occuring commute durations in Laurel Hill are 30 to 34 minutes (39 commuters, 20.9%), 45 to 59 minutes (39 commuters, 20.9%), and 60 to 89 minutes (29 commuters, 15.5%).
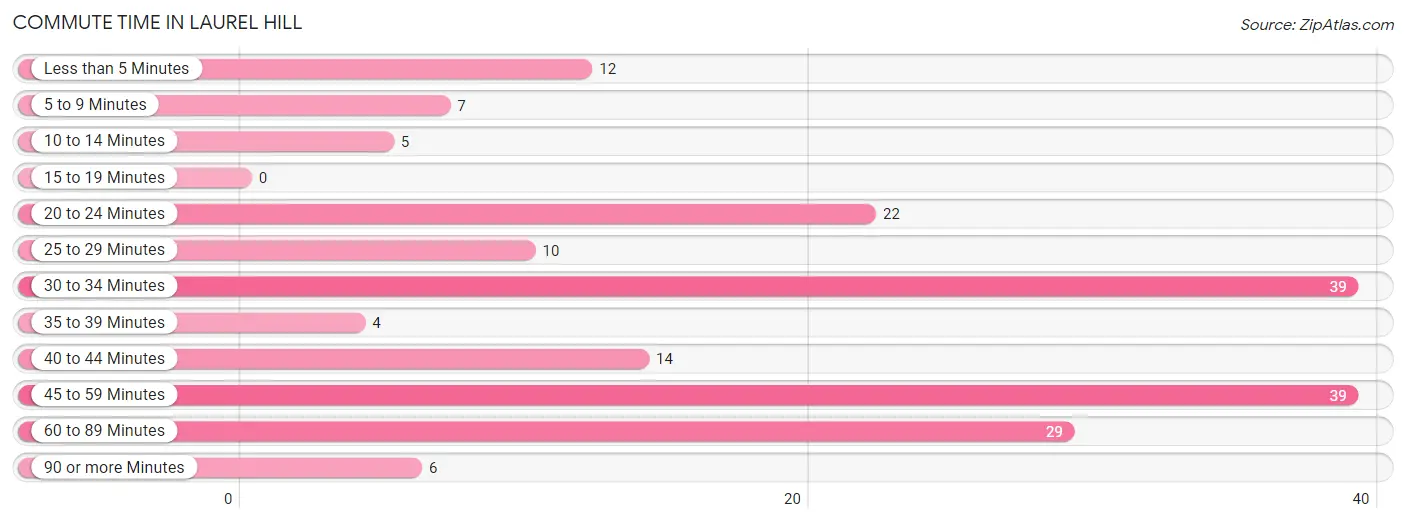
| Commute Time | # Commuters | % Commuters |
| Less than 5 Minutes | 12 | 6.4% |
| 5 to 9 Minutes | 7 | 3.7% |
| 10 to 14 Minutes | 5 | 2.7% |
| 15 to 19 Minutes | 0 | 0.0% |
| 20 to 24 Minutes | 22 | 11.8% |
| 25 to 29 Minutes | 10 | 5.3% |
| 30 to 34 Minutes | 39 | 20.9% |
| 35 to 39 Minutes | 4 | 2.1% |
| 40 to 44 Minutes | 14 | 7.5% |
| 45 to 59 Minutes | 39 | 20.9% |
| 60 to 89 Minutes | 29 | 15.5% |
| 90 or more Minutes | 6 | 3.2% |
Commute Time by Sex in Laurel Hill
The most common commute times in Laurel Hill are 45 to 59 minutes (23 commuters, 20.2%) for males and 30 to 34 minutes (19 commuters, 26.0%) for females.
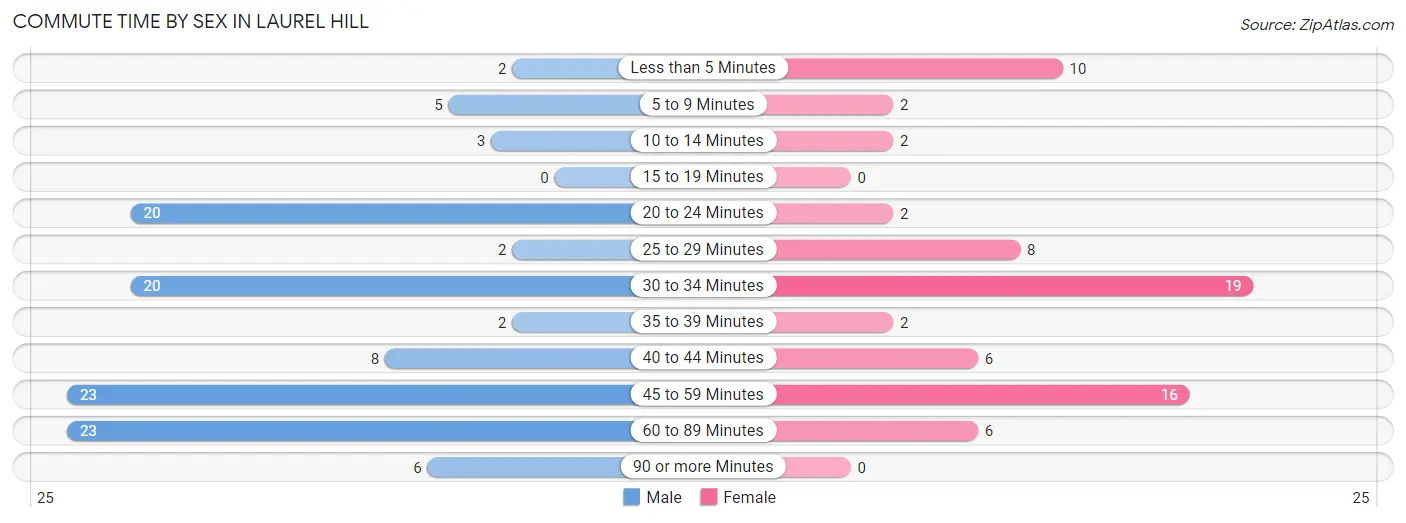
| Commute Time | Male | Female |
| Less than 5 Minutes | 2 (1.8%) | 10 (13.7%) |
| 5 to 9 Minutes | 5 (4.4%) | 2 (2.7%) |
| 10 to 14 Minutes | 3 (2.6%) | 2 (2.7%) |
| 15 to 19 Minutes | 0 (0.0%) | 0 (0.0%) |
| 20 to 24 Minutes | 20 (17.5%) | 2 (2.7%) |
| 25 to 29 Minutes | 2 (1.8%) | 8 (11.0%) |
| 30 to 34 Minutes | 20 (17.5%) | 19 (26.0%) |
| 35 to 39 Minutes | 2 (1.8%) | 2 (2.7%) |
| 40 to 44 Minutes | 8 (7.0%) | 6 (8.2%) |
| 45 to 59 Minutes | 23 (20.2%) | 16 (21.9%) |
| 60 to 89 Minutes | 23 (20.2%) | 6 (8.2%) |
| 90 or more Minutes | 6 (5.3%) | 0 (0.0%) |
Time of Departure to Work by Sex in Laurel Hill
The most frequent times of departure to work in Laurel Hill are 6:00 AM to 6:29 AM (32, 28.1%) for males and 7:00 AM to 7:29 AM (33, 45.2%) for females.
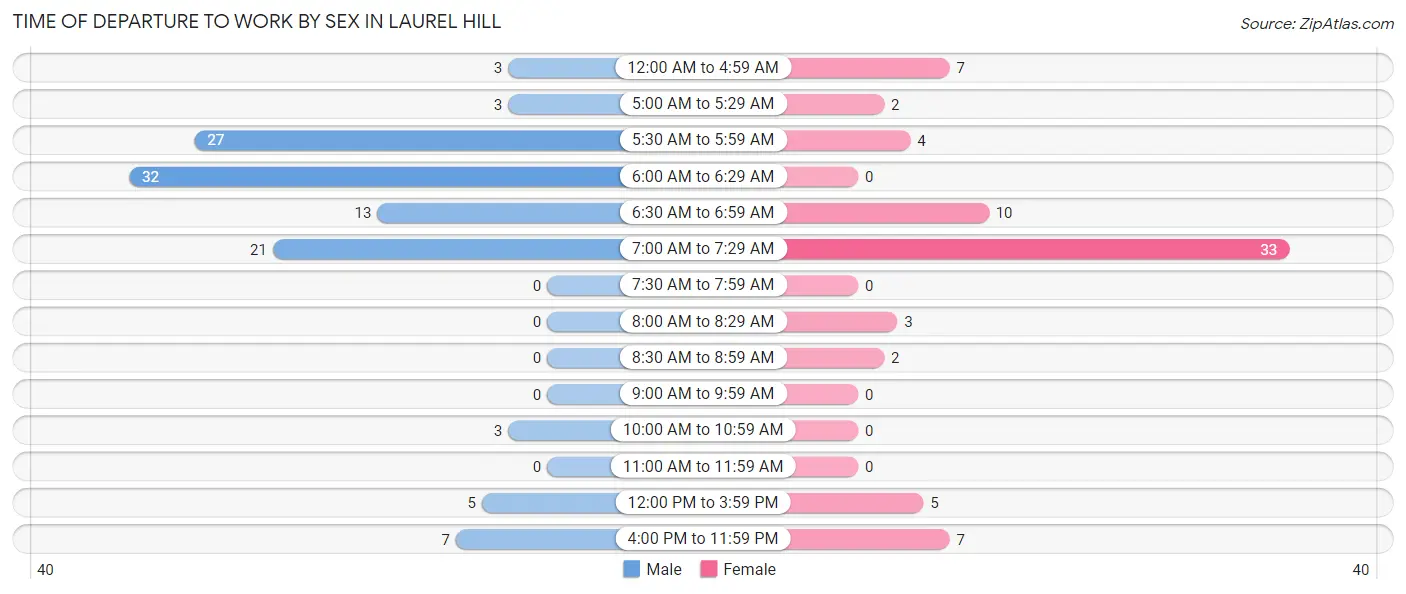
| Time of Departure | Male | Female |
| 12:00 AM to 4:59 AM | 3 (2.6%) | 7 (9.6%) |
| 5:00 AM to 5:29 AM | 3 (2.6%) | 2 (2.7%) |
| 5:30 AM to 5:59 AM | 27 (23.7%) | 4 (5.5%) |
| 6:00 AM to 6:29 AM | 32 (28.1%) | 0 (0.0%) |
| 6:30 AM to 6:59 AM | 13 (11.4%) | 10 (13.7%) |
| 7:00 AM to 7:29 AM | 21 (18.4%) | 33 (45.2%) |
| 7:30 AM to 7:59 AM | 0 (0.0%) | 0 (0.0%) |
| 8:00 AM to 8:29 AM | 0 (0.0%) | 3 (4.1%) |
| 8:30 AM to 8:59 AM | 0 (0.0%) | 2 (2.7%) |
| 9:00 AM to 9:59 AM | 0 (0.0%) | 0 (0.0%) |
| 10:00 AM to 10:59 AM | 3 (2.6%) | 0 (0.0%) |
| 11:00 AM to 11:59 AM | 0 (0.0%) | 0 (0.0%) |
| 12:00 PM to 3:59 PM | 5 (4.4%) | 5 (6.9%) |
| 4:00 PM to 11:59 PM | 7 (6.1%) | 7 (9.6%) |
| Total | 114 (100.0%) | 73 (100.0%) |
Housing Occupancy in Laurel Hill
Occupancy by Ownership in Laurel Hill
Of the total 183 dwellings in Laurel Hill, owner-occupied units account for 151 (82.5%), while renter-occupied units make up 32 (17.5%).
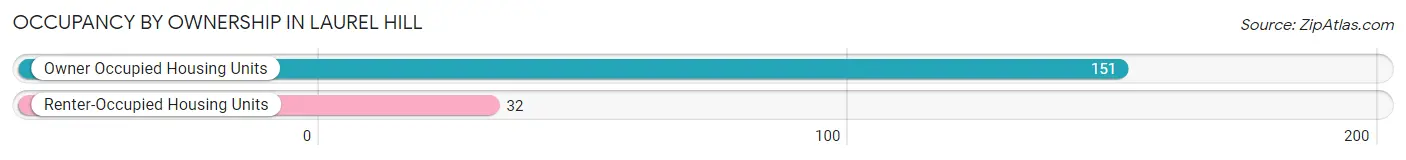
| Occupancy | # Housing Units | % Housing Units |
| Owner Occupied Housing Units | 151 | 82.5% |
| Renter-Occupied Housing Units | 32 | 17.5% |
| Total Occupied Housing Units | 183 | 100.0% |
Occupancy by Household Size in Laurel Hill
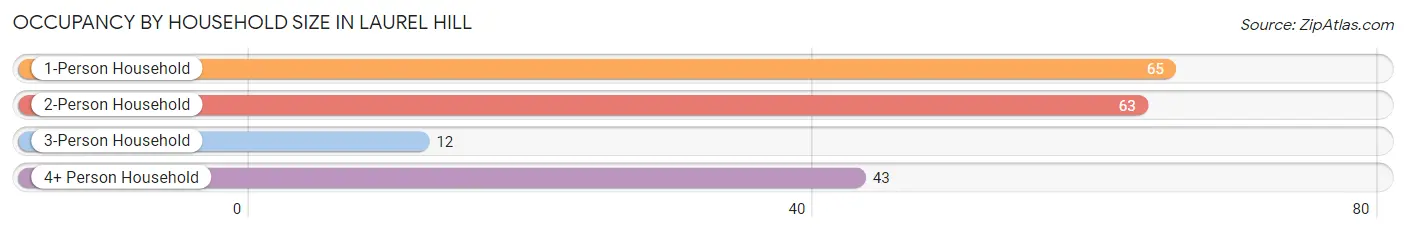
| Household Size | # Housing Units | % Housing Units |
| 1-Person Household | 65 | 35.5% |
| 2-Person Household | 63 | 34.4% |
| 3-Person Household | 12 | 6.6% |
| 4+ Person Household | 43 | 23.5% |
| Total Housing Units | 183 | 100.0% |
Occupancy by Ownership by Household Size in Laurel Hill
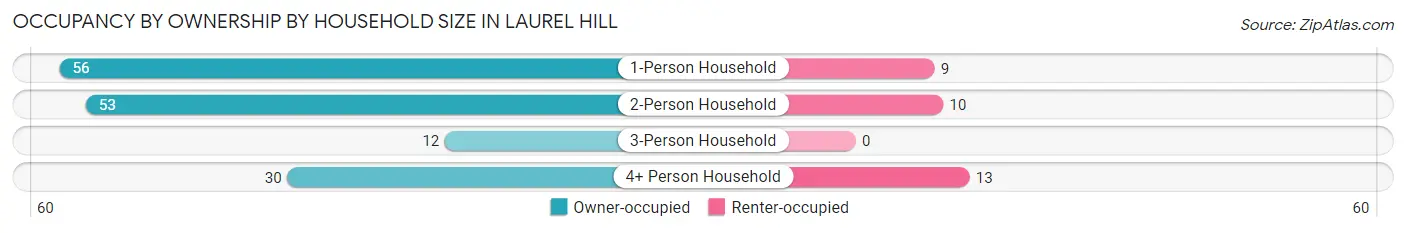
| Household Size | Owner-occupied | Renter-occupied |
| 1-Person Household | 56 (86.2%) | 9 (13.9%) |
| 2-Person Household | 53 (84.1%) | 10 (15.9%) |
| 3-Person Household | 12 (100.0%) | 0 (0.0%) |
| 4+ Person Household | 30 (69.8%) | 13 (30.2%) |
| Total Housing Units | 151 (82.5%) | 32 (17.5%) |
Occupancy by Educational Attainment in Laurel Hill
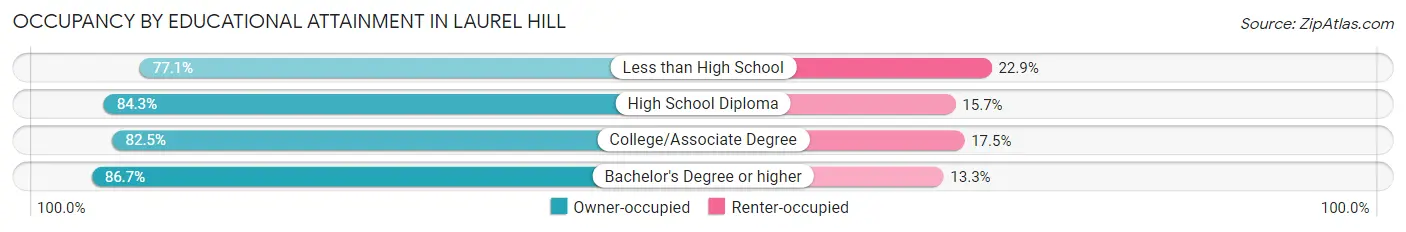
| Household Size | Owner-occupied | Renter-occupied |
| Less than High School | 27 (77.1%) | 8 (22.9%) |
| High School Diploma | 59 (84.3%) | 11 (15.7%) |
| College/Associate Degree | 52 (82.5%) | 11 (17.5%) |
| Bachelor's Degree or higher | 13 (86.7%) | 2 (13.3%) |
Occupancy by Age of Householder in Laurel Hill
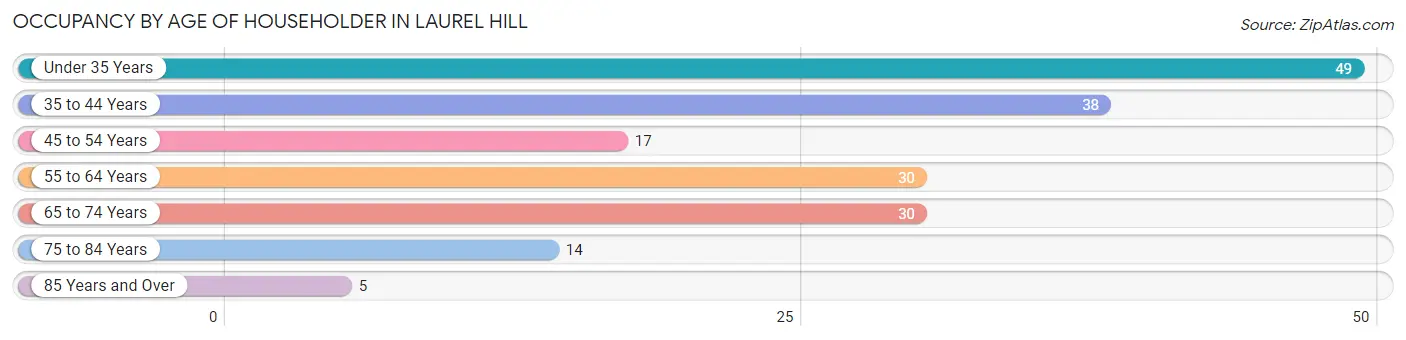
| Age Bracket | # Households | % Households |
| Under 35 Years | 49 | 26.8% |
| 35 to 44 Years | 38 | 20.8% |
| 45 to 54 Years | 17 | 9.3% |
| 55 to 64 Years | 30 | 16.4% |
| 65 to 74 Years | 30 | 16.4% |
| 75 to 84 Years | 14 | 7.6% |
| 85 Years and Over | 5 | 2.7% |
| Total | 183 | 100.0% |
Housing Finances in Laurel Hill
Median Income by Occupancy in Laurel Hill
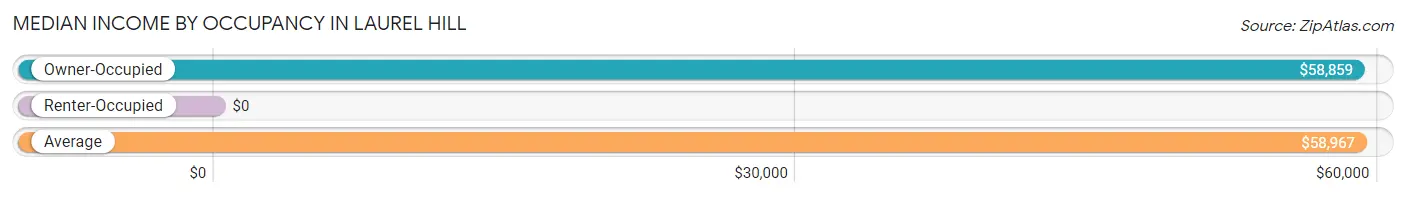
| Occupancy Type | # Households | Median Income |
| Owner-Occupied | 151 (82.5%) | $58,859 |
| Renter-Occupied | 32 (17.5%) | $0 |
| Average | 183 (100.0%) | $58,967 |
Occupancy by Householder Income Bracket in Laurel Hill
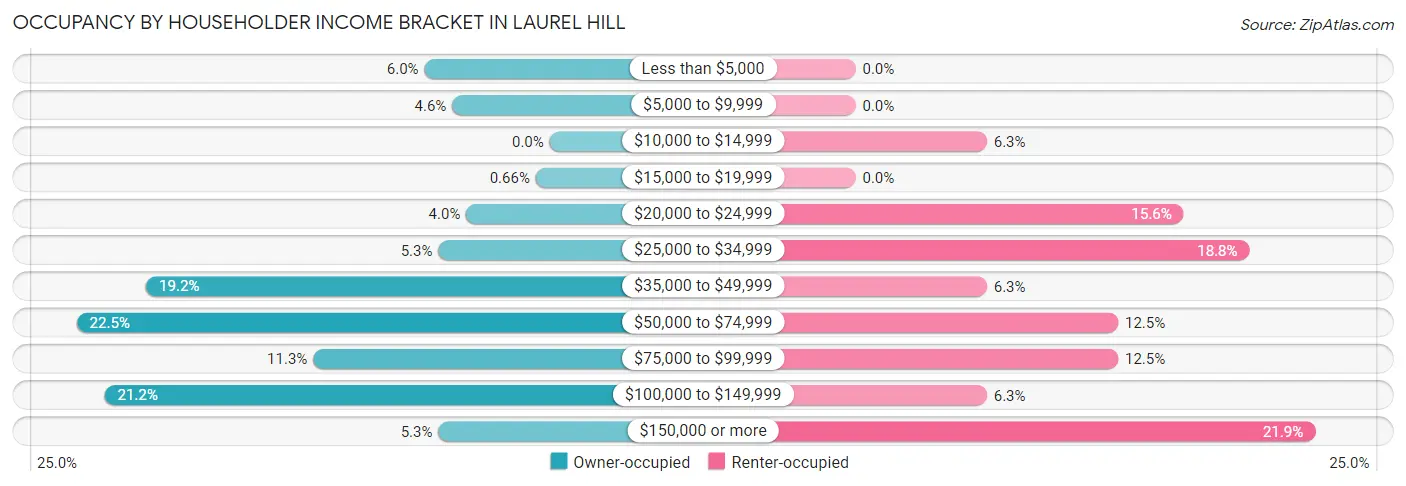
| Income Bracket | Owner-occupied | Renter-occupied |
| Less than $5,000 | 9 (6.0%) | 0 (0.0%) |
| $5,000 to $9,999 | 7 (4.6%) | 0 (0.0%) |
| $10,000 to $14,999 | 0 (0.0%) | 2 (6.2%) |
| $15,000 to $19,999 | 1 (0.7%) | 0 (0.0%) |
| $20,000 to $24,999 | 6 (4.0%) | 5 (15.6%) |
| $25,000 to $34,999 | 8 (5.3%) | 6 (18.8%) |
| $35,000 to $49,999 | 29 (19.2%) | 2 (6.2%) |
| $50,000 to $74,999 | 34 (22.5%) | 4 (12.5%) |
| $75,000 to $99,999 | 17 (11.3%) | 4 (12.5%) |
| $100,000 to $149,999 | 32 (21.2%) | 2 (6.2%) |
| $150,000 or more | 8 (5.3%) | 7 (21.9%) |
| Total | 151 (100.0%) | 32 (100.0%) |
Monthly Housing Cost Tiers in Laurel Hill
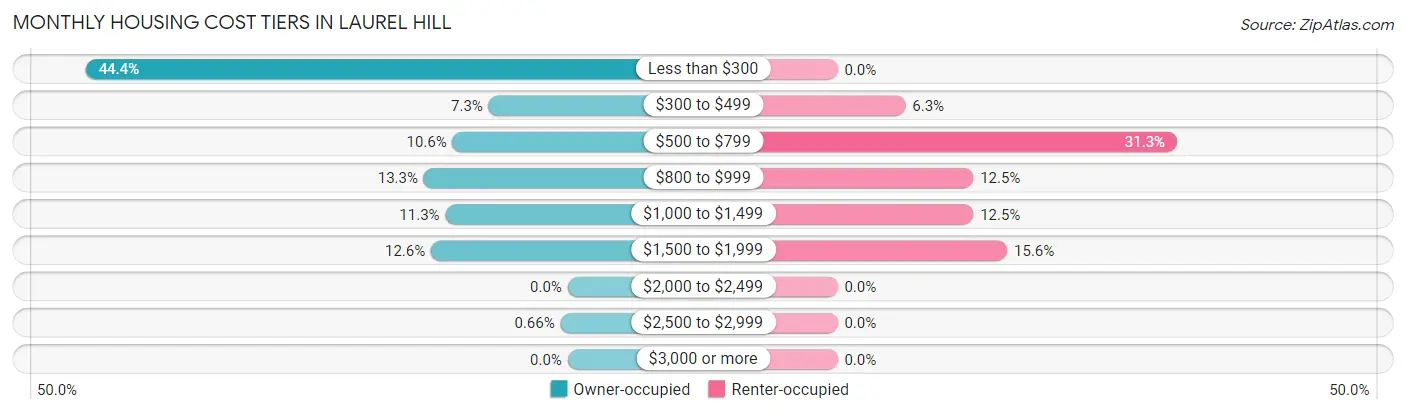
| Monthly Cost | Owner-occupied | Renter-occupied |
| Less than $300 | 67 (44.4%) | 0 (0.0%) |
| $300 to $499 | 11 (7.3%) | 2 (6.2%) |
| $500 to $799 | 16 (10.6%) | 10 (31.2%) |
| $800 to $999 | 20 (13.3%) | 4 (12.5%) |
| $1,000 to $1,499 | 17 (11.3%) | 4 (12.5%) |
| $1,500 to $1,999 | 19 (12.6%) | 5 (15.6%) |
| $2,000 to $2,499 | 0 (0.0%) | 0 (0.0%) |
| $2,500 to $2,999 | 1 (0.7%) | 0 (0.0%) |
| $3,000 or more | 0 (0.0%) | 0 (0.0%) |
| Total | 151 (100.0%) | 32 (100.0%) |
Physical Housing Characteristics in Laurel Hill
Housing Structures in Laurel Hill
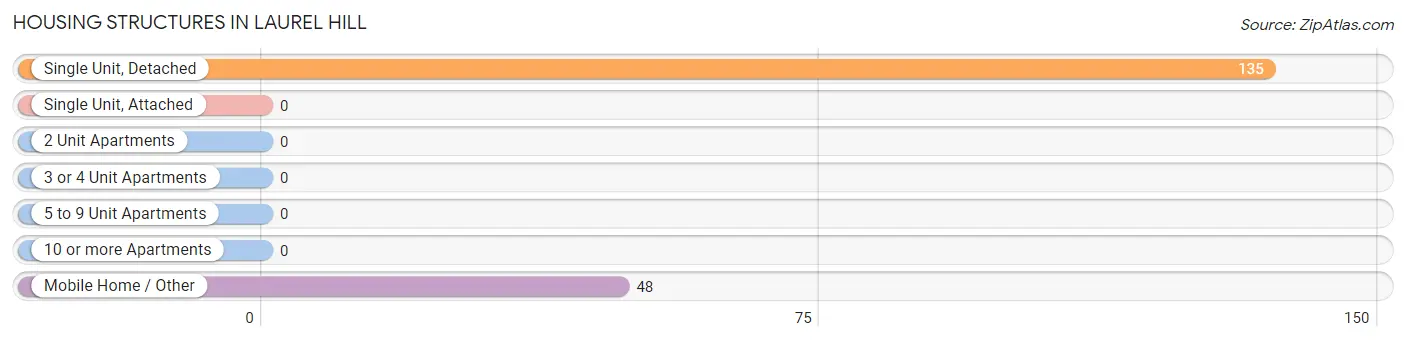
| Structure Type | # Housing Units | % Housing Units |
| Single Unit, Detached | 135 | 73.8% |
| Single Unit, Attached | 0 | 0.0% |
| 2 Unit Apartments | 0 | 0.0% |
| 3 or 4 Unit Apartments | 0 | 0.0% |
| 5 to 9 Unit Apartments | 0 | 0.0% |
| 10 or more Apartments | 0 | 0.0% |
| Mobile Home / Other | 48 | 26.2% |
| Total | 183 | 100.0% |
Housing Structures by Occupancy in Laurel Hill
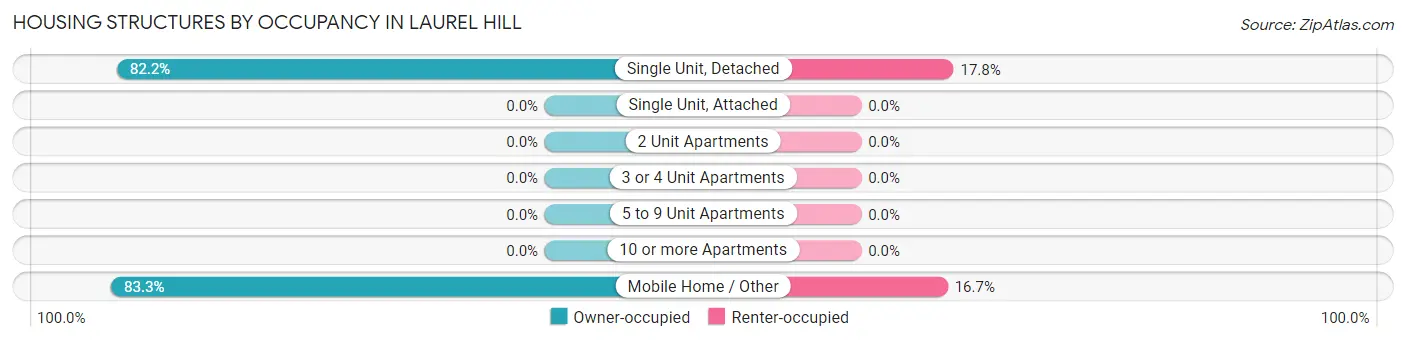
| Structure Type | Owner-occupied | Renter-occupied |
| Single Unit, Detached | 111 (82.2%) | 24 (17.8%) |
| Single Unit, Attached | 0 (0.0%) | 0 (0.0%) |
| 2 Unit Apartments | 0 (0.0%) | 0 (0.0%) |
| 3 or 4 Unit Apartments | 0 (0.0%) | 0 (0.0%) |
| 5 to 9 Unit Apartments | 0 (0.0%) | 0 (0.0%) |
| 10 or more Apartments | 0 (0.0%) | 0 (0.0%) |
| Mobile Home / Other | 40 (83.3%) | 8 (16.7%) |
| Total | 151 (82.5%) | 32 (17.5%) |
Housing Structures by Number of Rooms in Laurel Hill
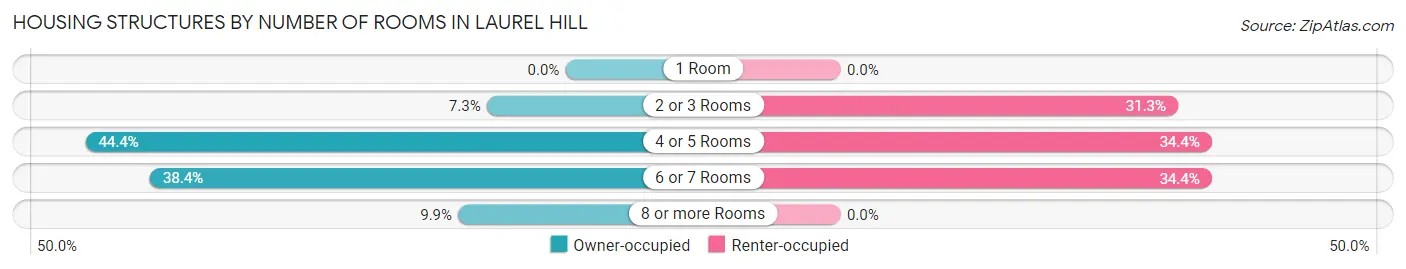
| Number of Rooms | Owner-occupied | Renter-occupied |
| 1 Room | 0 (0.0%) | 0 (0.0%) |
| 2 or 3 Rooms | 11 (7.3%) | 10 (31.2%) |
| 4 or 5 Rooms | 67 (44.4%) | 11 (34.4%) |
| 6 or 7 Rooms | 58 (38.4%) | 11 (34.4%) |
| 8 or more Rooms | 15 (9.9%) | 0 (0.0%) |
| Total | 151 (100.0%) | 32 (100.0%) |
Housing Structure by Heating Type in Laurel Hill
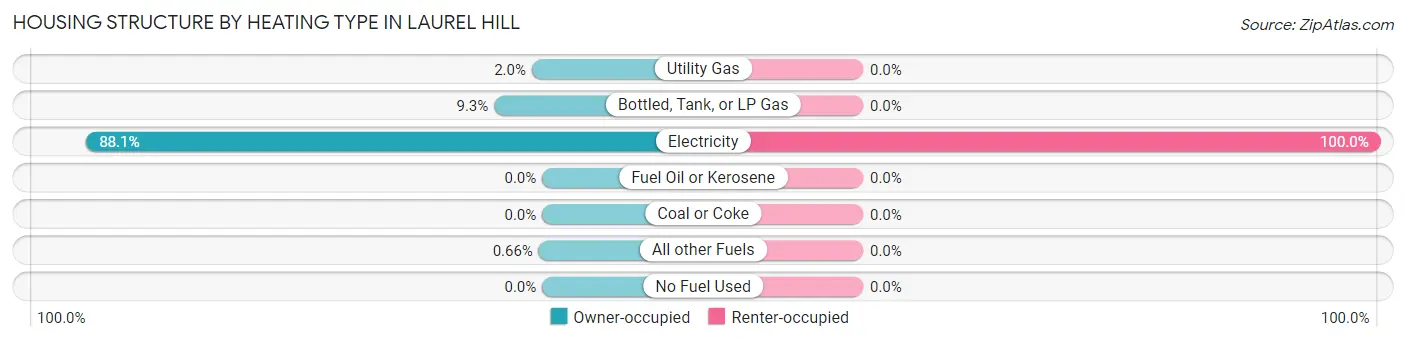
| Heating Type | Owner-occupied | Renter-occupied |
| Utility Gas | 3 (2.0%) | 0 (0.0%) |
| Bottled, Tank, or LP Gas | 14 (9.3%) | 0 (0.0%) |
| Electricity | 133 (88.1%) | 32 (100.0%) |
| Fuel Oil or Kerosene | 0 (0.0%) | 0 (0.0%) |
| Coal or Coke | 0 (0.0%) | 0 (0.0%) |
| All other Fuels | 1 (0.7%) | 0 (0.0%) |
| No Fuel Used | 0 (0.0%) | 0 (0.0%) |
| Total | 151 (100.0%) | 32 (100.0%) |
Household Vehicle Usage in Laurel Hill
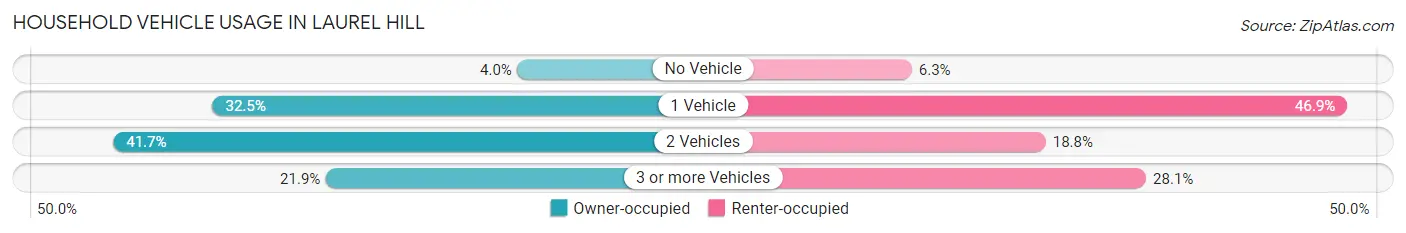
| Vehicles per Household | Owner-occupied | Renter-occupied |
| No Vehicle | 6 (4.0%) | 2 (6.2%) |
| 1 Vehicle | 49 (32.5%) | 15 (46.9%) |
| 2 Vehicles | 63 (41.7%) | 6 (18.8%) |
| 3 or more Vehicles | 33 (21.8%) | 9 (28.1%) |
| Total | 151 (100.0%) | 32 (100.0%) |
Real Estate & Mortgages in Laurel Hill
Real Estate and Mortgage Overview in Laurel Hill
| Characteristic | Without Mortgage | With Mortgage |
| Housing Units | 82 | 69 |
| Median Property Value | $64,000 | $179,200 |
| Median Household Income | $52,500 | $2 |
| Monthly Housing Costs | $231 | $0 |
| Real Estate Taxes | $387 | $1 |
Property Value by Mortgage Status in Laurel Hill
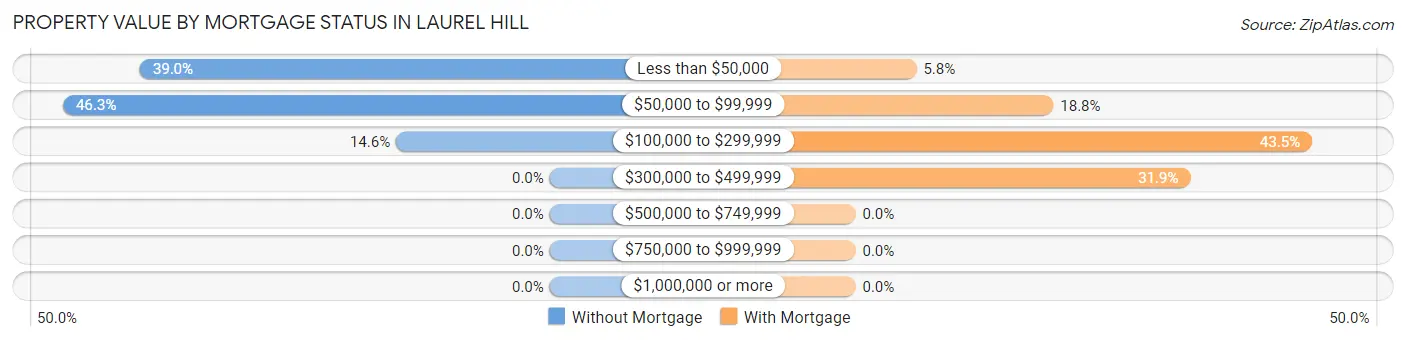
| Property Value | Without Mortgage | With Mortgage |
| Less than $50,000 | 32 (39.0%) | 4 (5.8%) |
| $50,000 to $99,999 | 38 (46.3%) | 13 (18.8%) |
| $100,000 to $299,999 | 12 (14.6%) | 30 (43.5%) |
| $300,000 to $499,999 | 0 (0.0%) | 22 (31.9%) |
| $500,000 to $749,999 | 0 (0.0%) | 0 (0.0%) |
| $750,000 to $999,999 | 0 (0.0%) | 0 (0.0%) |
| $1,000,000 or more | 0 (0.0%) | 0 (0.0%) |
| Total | 82 (100.0%) | 69 (100.0%) |
Household Income by Mortgage Status in Laurel Hill
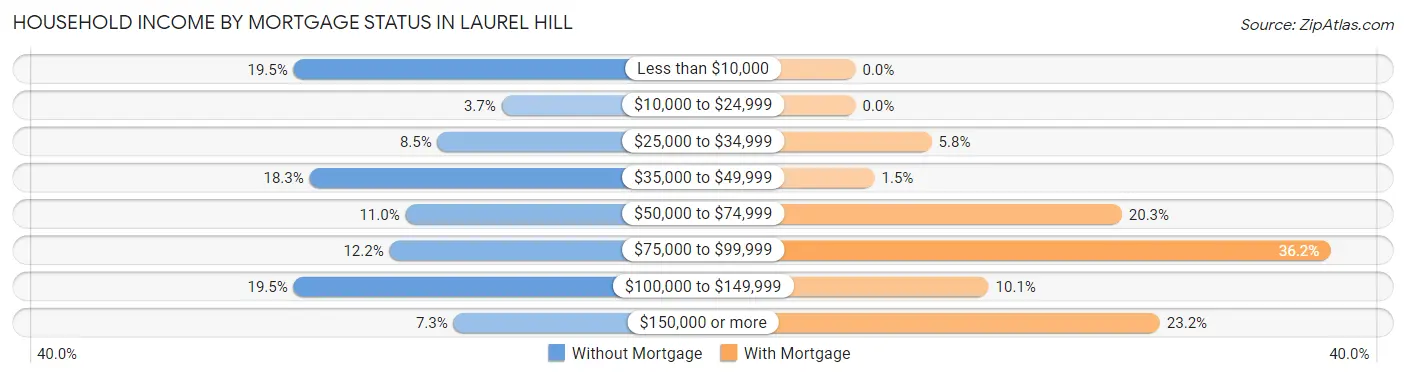
| Household Income | Without Mortgage | With Mortgage |
| Less than $10,000 | 16 (19.5%) | 0 (0.0%) |
| $10,000 to $24,999 | 3 (3.7%) | 0 (0.0%) |
| $25,000 to $34,999 | 7 (8.5%) | 4 (5.8%) |
| $35,000 to $49,999 | 15 (18.3%) | 1 (1.5%) |
| $50,000 to $74,999 | 9 (11.0%) | 14 (20.3%) |
| $75,000 to $99,999 | 10 (12.2%) | 25 (36.2%) |
| $100,000 to $149,999 | 16 (19.5%) | 7 (10.1%) |
| $150,000 or more | 6 (7.3%) | 16 (23.2%) |
| Total | 82 (100.0%) | 69 (100.0%) |
Property Value to Household Income Ratio in Laurel Hill
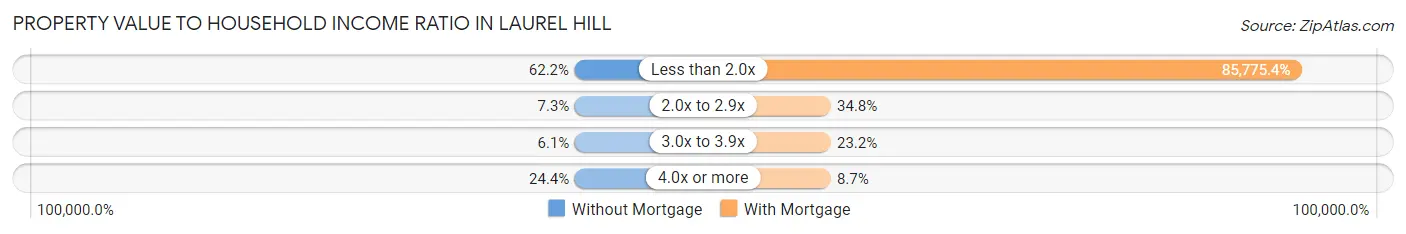
| Value-to-Income Ratio | Without Mortgage | With Mortgage |
| Less than 2.0x | 51 (62.2%) | 59,185 (85,775.4%) |
| 2.0x to 2.9x | 6 (7.3%) | 24 (34.8%) |
| 3.0x to 3.9x | 5 (6.1%) | 16 (23.2%) |
| 4.0x or more | 20 (24.4%) | 6 (8.7%) |
| Total | 82 (100.0%) | 69 (100.0%) |
Real Estate Taxes by Mortgage Status in Laurel Hill
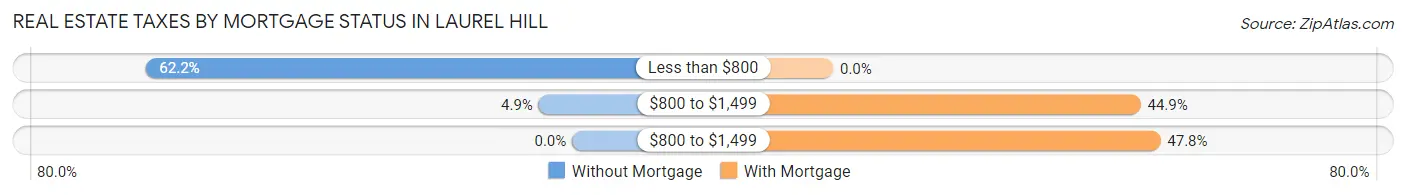
| Property Taxes | Without Mortgage | With Mortgage |
| Less than $800 | 51 (62.2%) | 0 (0.0%) |
| $800 to $1,499 | 4 (4.9%) | 31 (44.9%) |
| $800 to $1,499 | 0 (0.0%) | 33 (47.8%) |
| Total | 82 (100.0%) | 69 (100.0%) |
Health & Disability in Laurel Hill
Health Insurance Coverage by Age in Laurel Hill
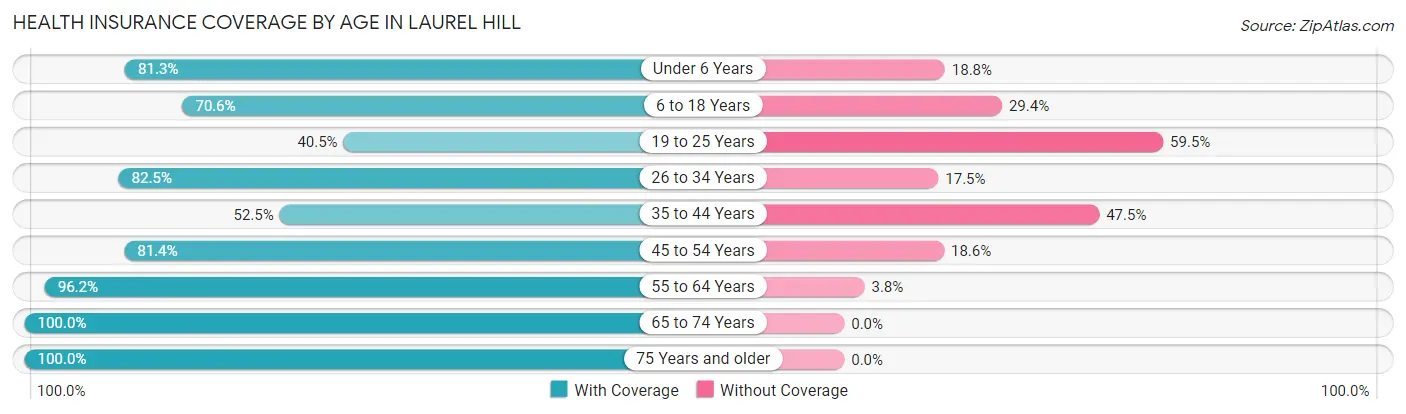
| Age Bracket | With Coverage | Without Coverage |
| Under 6 Years | 39 (81.2%) | 9 (18.8%) |
| 6 to 18 Years | 72 (70.6%) | 30 (29.4%) |
| 19 to 25 Years | 15 (40.5%) | 22 (59.5%) |
| 26 to 34 Years | 47 (82.5%) | 10 (17.5%) |
| 35 to 44 Years | 32 (52.5%) | 29 (47.5%) |
| 45 to 54 Years | 35 (81.4%) | 8 (18.6%) |
| 55 to 64 Years | 51 (96.2%) | 2 (3.8%) |
| 65 to 74 Years | 41 (100.0%) | 0 (0.0%) |
| 75 Years and older | 19 (100.0%) | 0 (0.0%) |
| Total | 351 (76.1%) | 110 (23.9%) |
Health Insurance Coverage by Citizenship Status in Laurel Hill
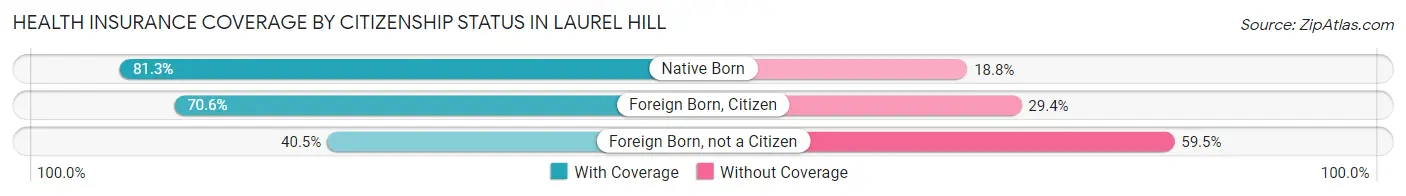
| Citizenship Status | With Coverage | Without Coverage |
| Native Born | 39 (81.2%) | 9 (18.8%) |
| Foreign Born, Citizen | 72 (70.6%) | 30 (29.4%) |
| Foreign Born, not a Citizen | 15 (40.5%) | 22 (59.5%) |
Health Insurance Coverage by Household Income in Laurel Hill
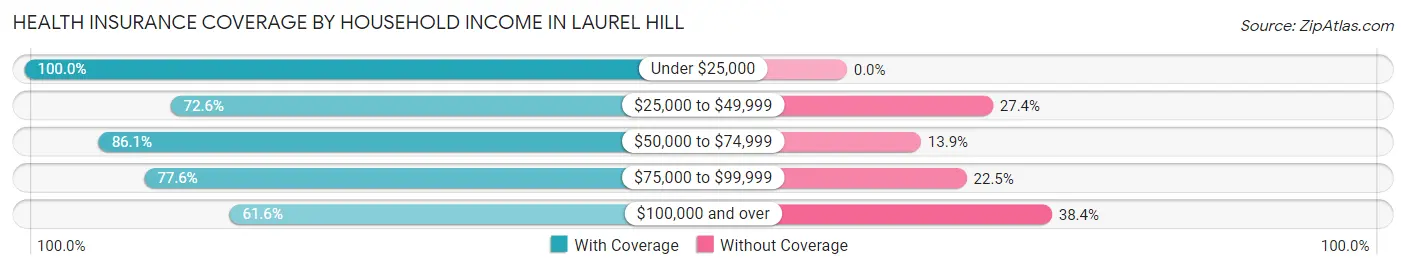
| Household Income | With Coverage | Without Coverage |
| Under $25,000 | 58 (100.0%) | 0 (0.0%) |
| $25,000 to $49,999 | 69 (72.6%) | 26 (27.4%) |
| $50,000 to $74,999 | 93 (86.1%) | 15 (13.9%) |
| $75,000 to $99,999 | 38 (77.5%) | 11 (22.5%) |
| $100,000 and over | 93 (61.6%) | 58 (38.4%) |
Public vs Private Health Insurance Coverage by Age in Laurel Hill
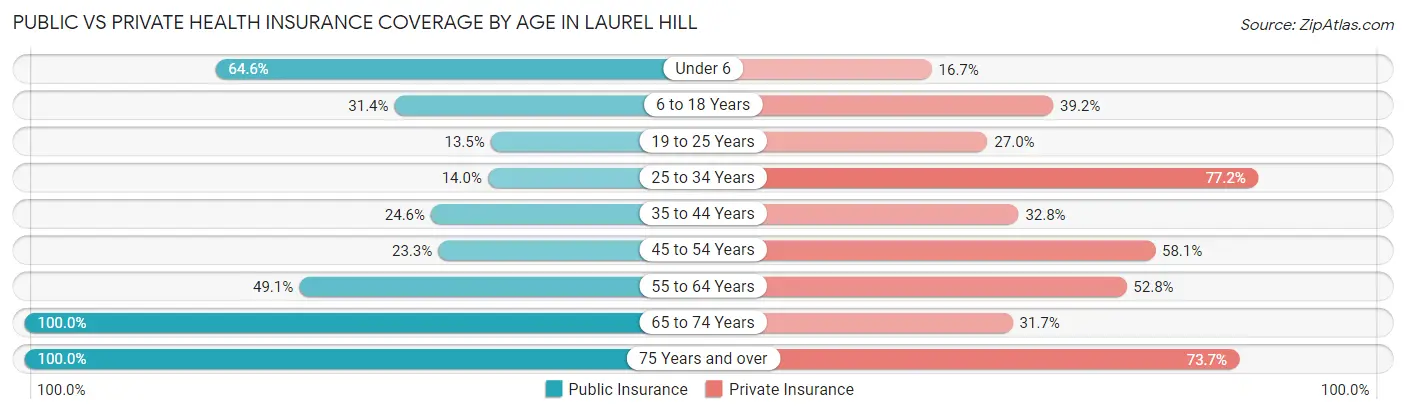
| Age Bracket | Public Insurance | Private Insurance |
| Under 6 | 31 (64.6%) | 8 (16.7%) |
| 6 to 18 Years | 32 (31.4%) | 40 (39.2%) |
| 19 to 25 Years | 5 (13.5%) | 10 (27.0%) |
| 25 to 34 Years | 8 (14.0%) | 44 (77.2%) |
| 35 to 44 Years | 15 (24.6%) | 20 (32.8%) |
| 45 to 54 Years | 10 (23.3%) | 25 (58.1%) |
| 55 to 64 Years | 26 (49.1%) | 28 (52.8%) |
| 65 to 74 Years | 41 (100.0%) | 13 (31.7%) |
| 75 Years and over | 19 (100.0%) | 14 (73.7%) |
| Total | 187 (40.6%) | 202 (43.8%) |
Disability Status by Sex by Age in Laurel Hill
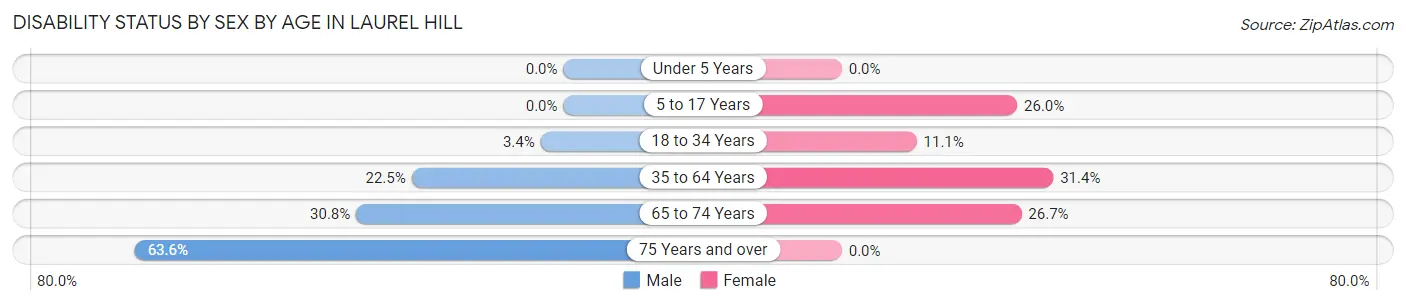
| Age Bracket | Male | Female |
| Under 5 Years | 0 (0.0%) | 0 (0.0%) |
| 5 to 17 Years | 0 (0.0%) | 19 (26.0%) |
| 18 to 34 Years | 2 (3.4%) | 4 (11.1%) |
| 35 to 64 Years | 16 (22.5%) | 27 (31.4%) |
| 65 to 74 Years | 8 (30.8%) | 4 (26.7%) |
| 75 Years and over | 7 (63.6%) | 0 (0.0%) |
Disability Class by Sex by Age in Laurel Hill
Disability Class: Hearing Difficulty
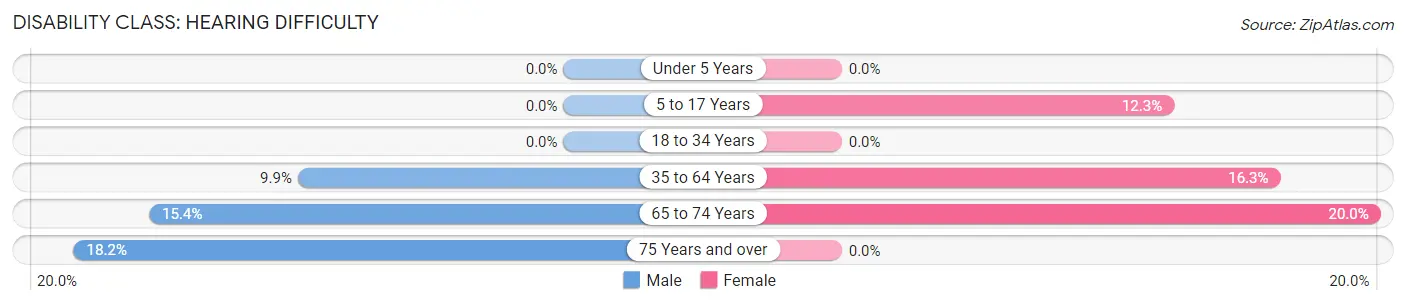
| Age Bracket | Male | Female |
| Under 5 Years | 0 (0.0%) | 0 (0.0%) |
| 5 to 17 Years | 0 (0.0%) | 9 (12.3%) |
| 18 to 34 Years | 0 (0.0%) | 0 (0.0%) |
| 35 to 64 Years | 7 (9.9%) | 14 (16.3%) |
| 65 to 74 Years | 4 (15.4%) | 3 (20.0%) |
| 75 Years and over | 2 (18.2%) | 0 (0.0%) |
Disability Class: Vision Difficulty
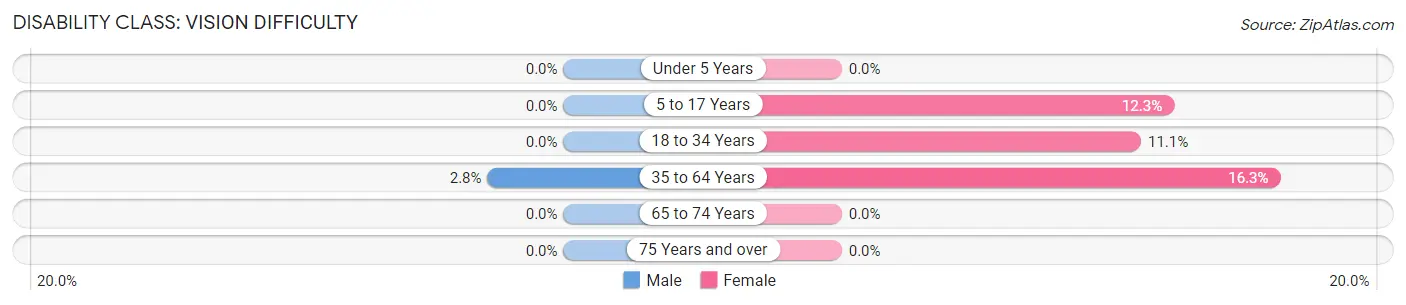
| Age Bracket | Male | Female |
| Under 5 Years | 0 (0.0%) | 0 (0.0%) |
| 5 to 17 Years | 0 (0.0%) | 9 (12.3%) |
| 18 to 34 Years | 0 (0.0%) | 4 (11.1%) |
| 35 to 64 Years | 2 (2.8%) | 14 (16.3%) |
| 65 to 74 Years | 0 (0.0%) | 0 (0.0%) |
| 75 Years and over | 0 (0.0%) | 0 (0.0%) |
Disability Class: Cognitive Difficulty
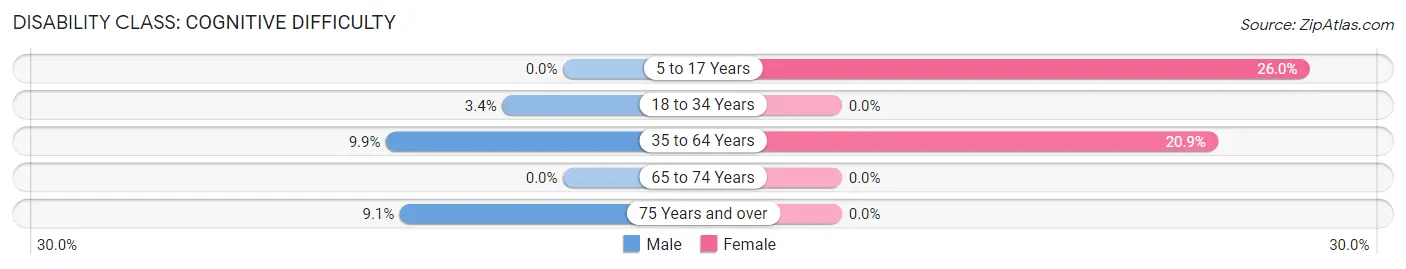
| Age Bracket | Male | Female |
| 5 to 17 Years | 0 (0.0%) | 19 (26.0%) |
| 18 to 34 Years | 2 (3.4%) | 0 (0.0%) |
| 35 to 64 Years | 7 (9.9%) | 18 (20.9%) |
| 65 to 74 Years | 0 (0.0%) | 0 (0.0%) |
| 75 Years and over | 1 (9.1%) | 0 (0.0%) |
Disability Class: Ambulatory Difficulty
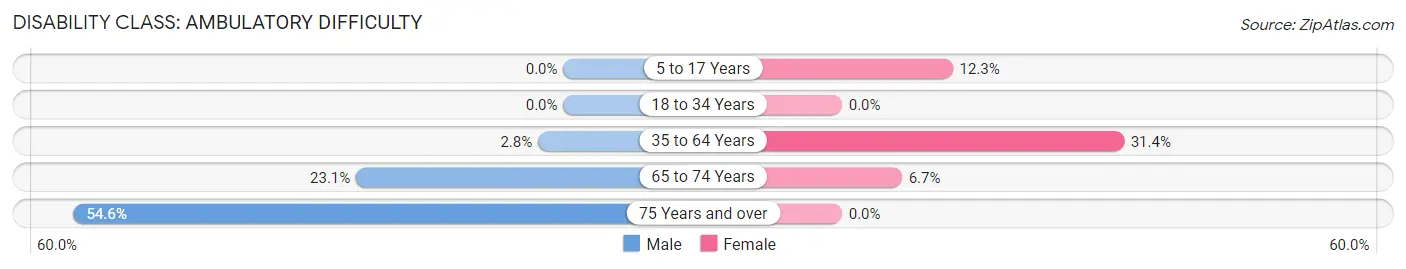
| Age Bracket | Male | Female |
| 5 to 17 Years | 0 (0.0%) | 9 (12.3%) |
| 18 to 34 Years | 0 (0.0%) | 0 (0.0%) |
| 35 to 64 Years | 2 (2.8%) | 27 (31.4%) |
| 65 to 74 Years | 6 (23.1%) | 1 (6.7%) |
| 75 Years and over | 6 (54.5%) | 0 (0.0%) |
Disability Class: Self-Care Difficulty
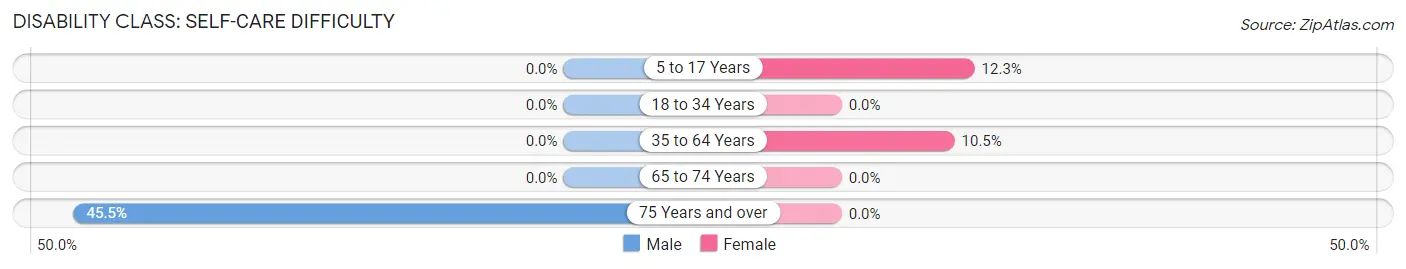
| Age Bracket | Male | Female |
| 5 to 17 Years | 0 (0.0%) | 9 (12.3%) |
| 18 to 34 Years | 0 (0.0%) | 0 (0.0%) |
| 35 to 64 Years | 0 (0.0%) | 9 (10.5%) |
| 65 to 74 Years | 0 (0.0%) | 0 (0.0%) |
| 75 Years and over | 5 (45.5%) | 0 (0.0%) |
Technology Access in Laurel Hill
Computing Device Access in Laurel Hill
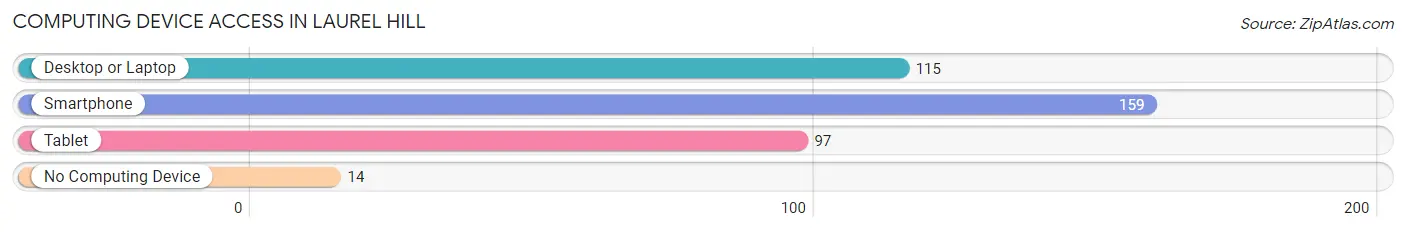
| Device Type | # Households | % Households |
| Desktop or Laptop | 115 | 62.8% |
| Smartphone | 159 | 86.9% |
| Tablet | 97 | 53.0% |
| No Computing Device | 14 | 7.6% |
| Total | 183 | 100.0% |
Internet Access in Laurel Hill
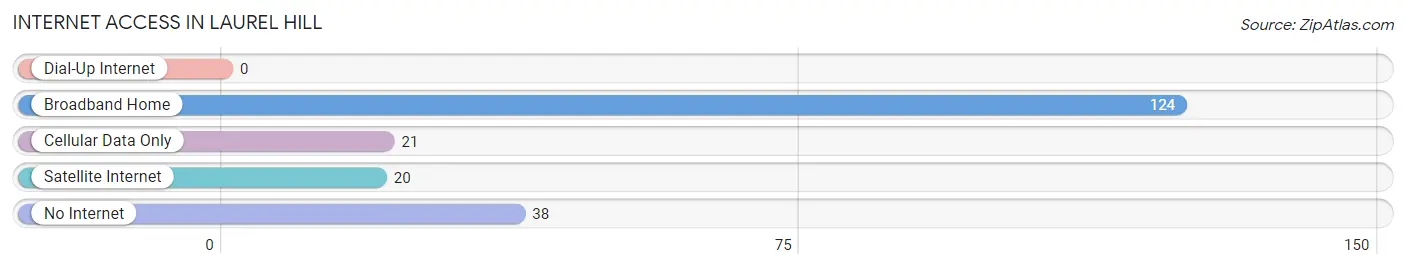
| Internet Type | # Households | % Households |
| Dial-Up Internet | 0 | 0.0% |
| Broadband Home | 124 | 67.8% |
| Cellular Data Only | 21 | 11.5% |
| Satellite Internet | 20 | 10.9% |
| No Internet | 38 | 20.8% |
| Total | 183 | 100.0% |
Laurel Hill Summary
Laurel Hill is a small city located in Okaloosa County, Florida. It is situated in the Florida Panhandle, approximately 25 miles east of Pensacola and 30 miles west of Crestview. The city is part of the Fort Walton Beach-Crestview-Destin Metropolitan Statistical Area. As of the 2010 census, the population of Laurel Hill was 1,567.
History
The area that is now Laurel Hill was originally inhabited by Native American tribes, including the Choctaw and Creek. The first European settlers arrived in the area in the early 1800s. The town was originally known as “Macedonia” and was established in 1845. The name was changed to “Laurel Hill” in 1883, after the local post office was established.
The town was a major center for the timber industry in the late 19th and early 20th centuries. The timber industry was the primary source of employment for the town’s residents. The town also had a thriving agricultural industry, with cotton, corn, and peanuts being the primary crops.
In the early 20th century, the town began to experience a decline in population as many of its residents moved away in search of better economic opportunities. The population of Laurel Hill continued to decline until the late 1970s, when the town began to experience a resurgence in population growth.
Geography
Laurel Hill is located in the Florida Panhandle, approximately 25 miles east of Pensacola and 30 miles west of Crestview. The city is situated on the banks of the Yellow River, which flows through the city. The city is located in a rural area, with the nearest major city being Pensacola.
The city has a total area of 2.2 square miles, all of which is land. The terrain is mostly flat, with some rolling hills. The climate is humid subtropical, with hot, humid summers and mild winters.
Economy
The economy of Laurel Hill is largely based on agriculture and timber. The timber industry is the primary source of employment for the town’s residents. The city also has a thriving agricultural industry, with cotton, corn, and peanuts being the primary crops.
The city also has a growing tourism industry, with many visitors coming to the area to enjoy the natural beauty of the area. The city is home to several parks and recreational areas, including the Yellow River Wildlife Management Area and the Yellow River State Forest.
Demographics
As of the 2010 census, the population of Laurel Hill was 1,567. The racial makeup of the city was 79.3% White, 16.2% African American, 0.3% Native American, 0.7% Asian, 0.1% Pacific Islander, 1.2% from other races, and 2.4% from two or more races. Hispanic or Latino of any race were 4.2% of the population.
The median income for a household in the city was $31,250, and the median income for a family was $37,500. The per capita income for the city was $15,945. About 17.2% of families and 20.2% of the population were below the poverty line, including 28.3% of those under age 18 and 11.2% of those age 65 or over.
Common Questions
What is Per Capita Income in Laurel Hill?
Per Capita income in Laurel Hill is $28,747.
What is the Median Family Income in Laurel Hill?
Median Family Income in Laurel Hill is $59,667.
What is the Median Household income in Laurel Hill?
Median Household Income in Laurel Hill is $58,967.
What is Income or Wage Gap in Laurel Hill?
Income or Wage Gap in Laurel Hill is 55.6%.
Women in Laurel Hill earn 44.4 cents for every dollar earned by a man.
What is Inequality or Gini Index in Laurel Hill?
Inequality or Gini Index in Laurel Hill is 0.39.
What is the Total Population of Laurel Hill?
Total Population of Laurel Hill is 469.
What is the Total Male Population of Laurel Hill?
Total Male Population of Laurel Hill is 231.
What is the Total Female Population of Laurel Hill?
Total Female Population of Laurel Hill is 238.
What is the Ratio of Males per 100 Females in Laurel Hill?
There are 97.06 Males per 100 Females in Laurel Hill.
What is the Ratio of Females per 100 Males in Laurel Hill?
There are 103.03 Females per 100 Males in Laurel Hill.
What is the Median Population Age in Laurel Hill?
Median Population Age in Laurel Hill is 32.6 Years.
What is the Average Family Size in Laurel Hill
Average Family Size in Laurel Hill is 3.5 People.
What is the Average Household Size in Laurel Hill
Average Household Size in Laurel Hill is 2.6 People.
How Large is the Labor Force in Laurel Hill?
There are 207 People in the Labor Forcein in Laurel Hill.
What is the Percentage of People in the Labor Force in Laurel Hill?
62.2% of People are in the Labor Force in Laurel Hill.
What is the Unemployment Rate in Laurel Hill?
Unemployment Rate in Laurel Hill is 3.5%.