Lake Magdalene, FL Map & Demographics
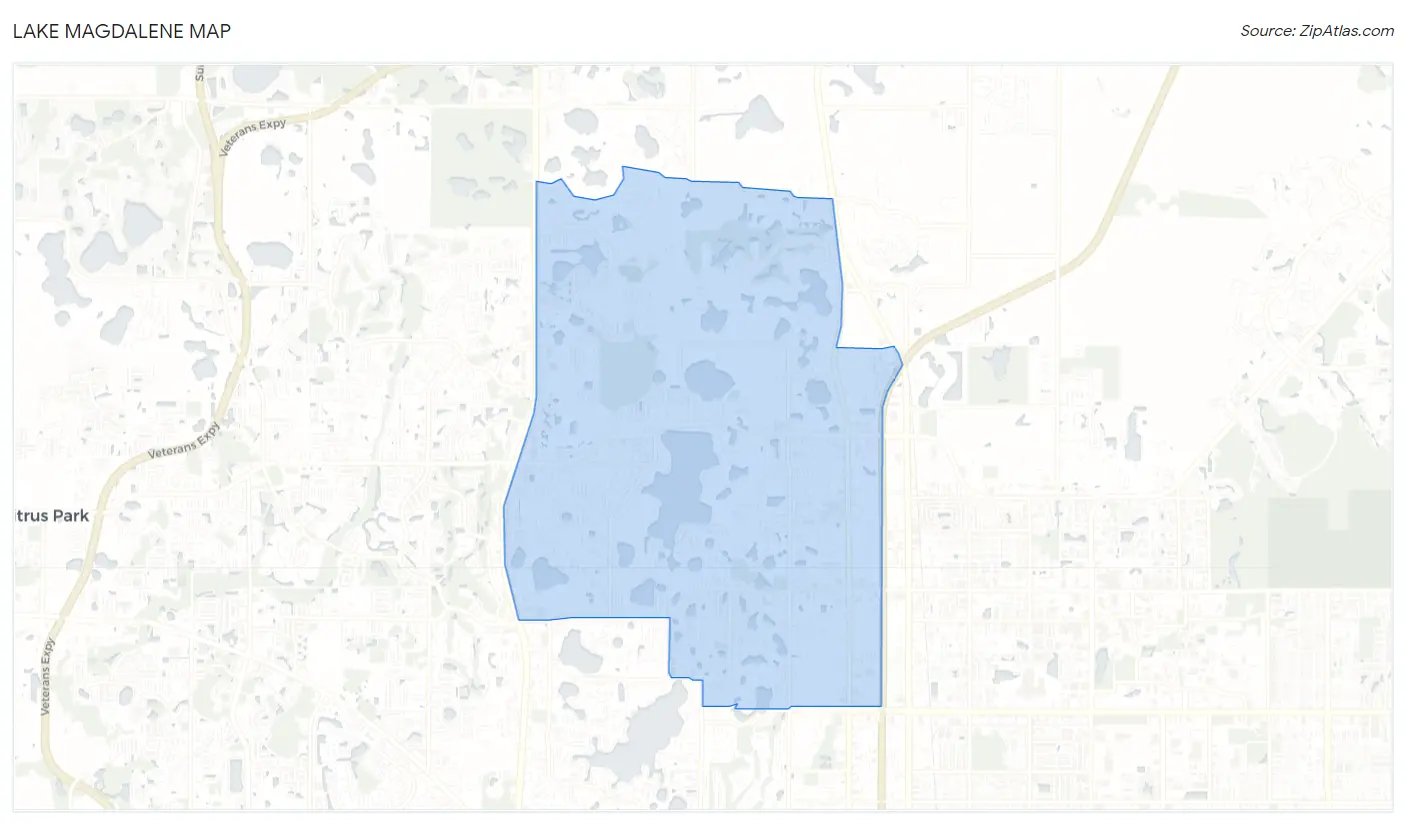
Lake Magdalene Map
Lake Magdalene Overview
$44,914
PER CAPITA INCOME
$87,069
AVG FAMILY INCOME
$69,898
AVG HOUSEHOLD INCOME
13.2%
WAGE / INCOME GAP [ % ]
86.8¢/ $1
WAGE / INCOME GAP [ $ ]
$8,325
FAMILY INCOME DEFICIT
0.49
INEQUALITY / GINI INDEX
31,546
TOTAL POPULATION
15,633
MALE POPULATION
15,913
FEMALE POPULATION
98.24
MALES / 100 FEMALES
101.79
FEMALES / 100 MALES
41.1
MEDIAN AGE
3.0
AVG FAMILY SIZE
2.4
AVG HOUSEHOLD SIZE
16,330
LABOR FORCE [ PEOPLE ]
63.9%
PERCENT IN LABOR FORCE
3.4%
UNEMPLOYMENT RATE
Income in Lake Magdalene
Income Overview in Lake Magdalene
Per Capita Income in Lake Magdalene is $44,914, while median incomes of families and households are $87,069 and $69,898 respectively.
| Characteristic | Number | Measure |
| Per Capita Income | 31,546 | $44,914 |
| Median Family Income | 8,038 | $87,069 |
| Mean Family Income | 8,038 | $126,562 |
| Median Household Income | 12,868 | $69,898 |
| Mean Household Income | 12,868 | $107,129 |
| Income Deficit | 8,038 | $8,325 |
| Wage / Income Gap (%) | 31,546 | 13.23% |
| Wage / Income Gap ($) | 31,546 | 86.77¢ per $1 |
| Gini / Inequality Index | 31,546 | 0.49 |
Earnings by Sex in Lake Magdalene
Average Earnings in Lake Magdalene are $46,292, $48,174 for men and $41,801 for women, a difference of 13.2%.
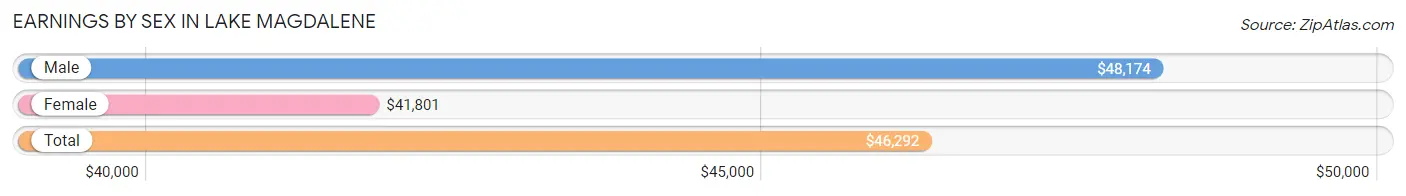
| Sex | Number | Average Earnings |
| Male | 9,005 (53.5%) | $48,174 |
| Female | 7,816 (46.5%) | $41,801 |
| Total | 16,821 (100.0%) | $46,292 |
Earnings by Sex by Income Bracket in Lake Magdalene
The most common earnings brackets in Lake Magdalene are $100,000+ for men (1,409 | 15.7%) and $75,000 to $99,999 for women (855 | 10.9%).
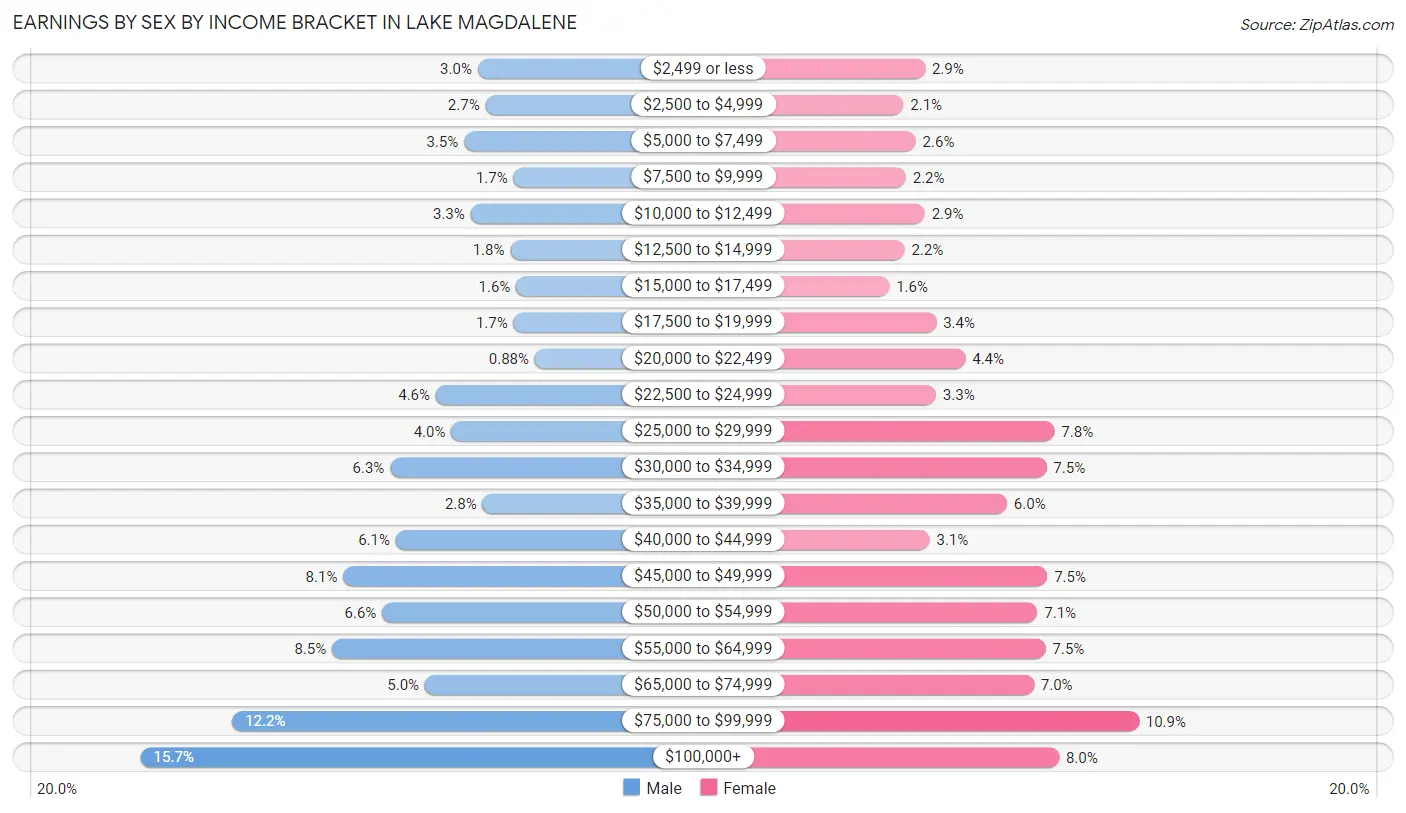
| Income | Male | Female |
| $2,499 or less | 272 (3.0%) | 229 (2.9%) |
| $2,500 to $4,999 | 246 (2.7%) | 166 (2.1%) |
| $5,000 to $7,499 | 318 (3.5%) | 202 (2.6%) |
| $7,500 to $9,999 | 151 (1.7%) | 173 (2.2%) |
| $10,000 to $12,499 | 296 (3.3%) | 228 (2.9%) |
| $12,500 to $14,999 | 162 (1.8%) | 169 (2.2%) |
| $15,000 to $17,499 | 142 (1.6%) | 124 (1.6%) |
| $17,500 to $19,999 | 151 (1.7%) | 262 (3.4%) |
| $20,000 to $22,499 | 79 (0.9%) | 347 (4.4%) |
| $22,500 to $24,999 | 413 (4.6%) | 261 (3.3%) |
| $25,000 to $29,999 | 361 (4.0%) | 608 (7.8%) |
| $30,000 to $34,999 | 567 (6.3%) | 585 (7.5%) |
| $35,000 to $39,999 | 256 (2.8%) | 469 (6.0%) |
| $40,000 to $44,999 | 548 (6.1%) | 242 (3.1%) |
| $45,000 to $49,999 | 726 (8.1%) | 587 (7.5%) |
| $50,000 to $54,999 | 594 (6.6%) | 558 (7.1%) |
| $55,000 to $64,999 | 764 (8.5%) | 582 (7.4%) |
| $65,000 to $74,999 | 450 (5.0%) | 548 (7.0%) |
| $75,000 to $99,999 | 1,100 (12.2%) | 855 (10.9%) |
| $100,000+ | 1,409 (15.7%) | 621 (8.0%) |
| Total | 9,005 (100.0%) | 7,816 (100.0%) |
Earnings by Sex by Educational Attainment in Lake Magdalene
Average earnings in Lake Magdalene are $51,980 for men and $46,620 for women, a difference of 10.3%. Men with an educational attainment of graduate degree enjoy the highest average annual earnings of $102,917, while those with high school diploma education earn the least with $42,639. Women with an educational attainment of graduate degree earn the most with the average annual earnings of $70,838, while those with less than high school education have the smallest earnings of $21,250.
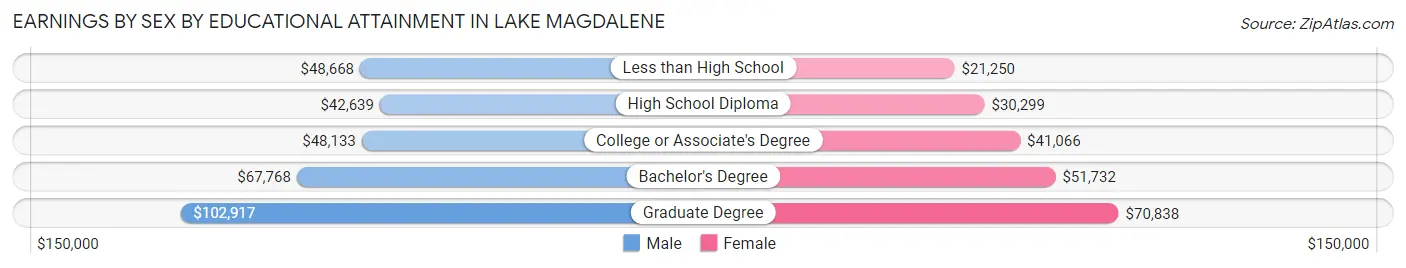
| Educational Attainment | Male Income | Female Income |
| Less than High School | $48,668 | $21,250 |
| High School Diploma | $42,639 | $30,299 |
| College or Associate's Degree | $48,133 | $41,066 |
| Bachelor's Degree | $67,768 | $51,732 |
| Graduate Degree | $102,917 | $70,838 |
| Total | $51,980 | $46,620 |
Family Income in Lake Magdalene
Family Income Brackets in Lake Magdalene
According to the Lake Magdalene family income data, there are 1,688 families falling into the $100,000 to $149,999 income range, which is the most common income bracket and makes up 21.0% of all families. Conversely, the $10,000 to $14,999 income bracket is the least frequent group with only 72 families (0.9%) belonging to this category.
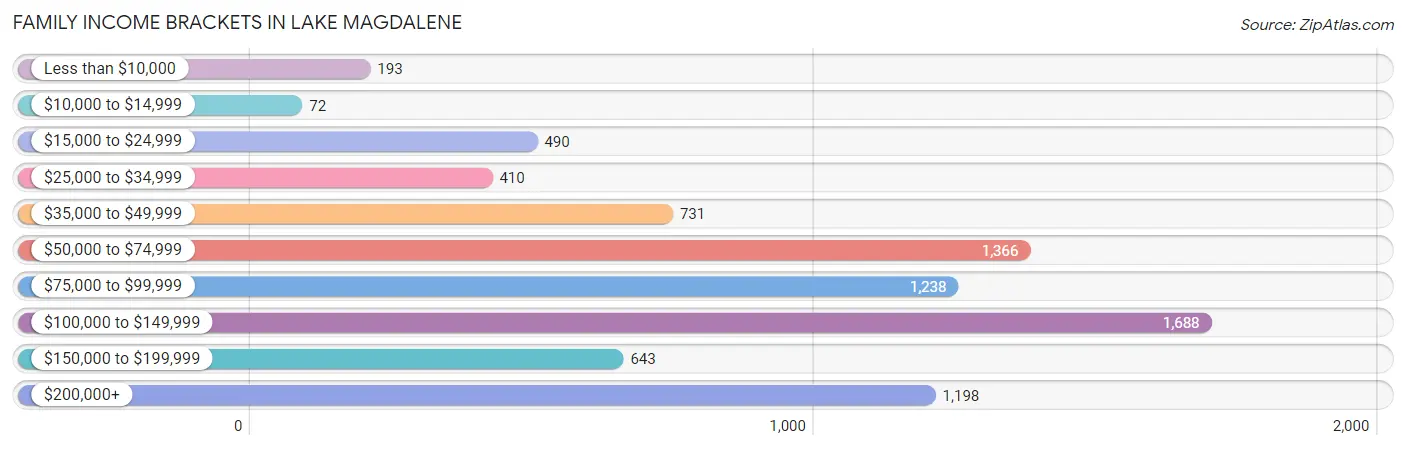
| Income Bracket | # Families | % Families |
| Less than $10,000 | 193 | 2.4% |
| $10,000 to $14,999 | 72 | 0.9% |
| $15,000 to $24,999 | 490 | 6.1% |
| $25,000 to $34,999 | 410 | 5.1% |
| $35,000 to $49,999 | 731 | 9.1% |
| $50,000 to $74,999 | 1,366 | 17.0% |
| $75,000 to $99,999 | 1,238 | 15.4% |
| $100,000 to $149,999 | 1,688 | 21.0% |
| $150,000 to $199,999 | 643 | 8.0% |
| $200,000+ | 1,198 | 14.9% |
Family Income by Famaliy Size in Lake Magdalene
5-person families (266 | 3.3%) account for the highest median family income in Lake Magdalene with $148,462 per family, while 2-person families (4,058 | 50.5%) have the highest median income of $42,236 per family member.
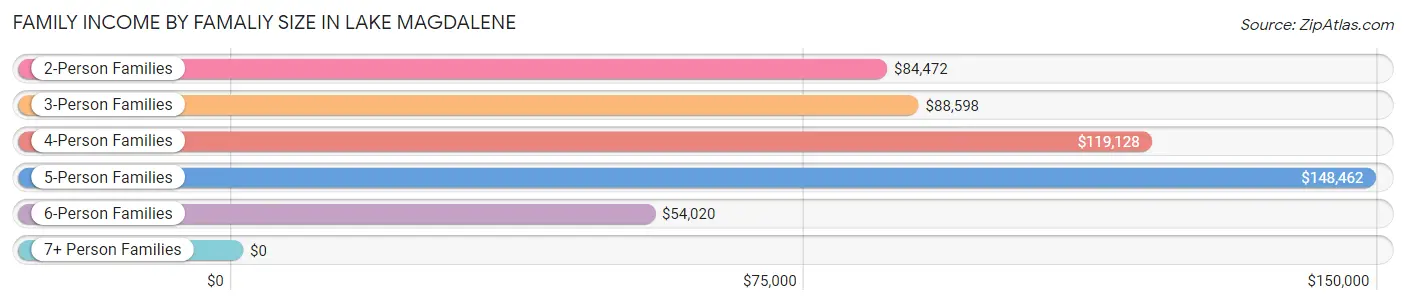
| Income Bracket | # Families | Median Income |
| 2-Person Families | 4,058 (50.5%) | $84,472 |
| 3-Person Families | 2,151 (26.8%) | $88,598 |
| 4-Person Families | 1,224 (15.2%) | $119,128 |
| 5-Person Families | 266 (3.3%) | $148,462 |
| 6-Person Families | 217 (2.7%) | $54,020 |
| 7+ Person Families | 122 (1.5%) | $0 |
| Total | 8,038 (100.0%) | $87,069 |
Family Income by Number of Earners in Lake Magdalene
The median family income in Lake Magdalene is $87,069, with families comprising 3+ earners (520) having the highest median family income of $168,088, while families with 1 earner (2,933) have the lowest median family income of $62,038, accounting for 6.5% and 36.5% of families, respectively.
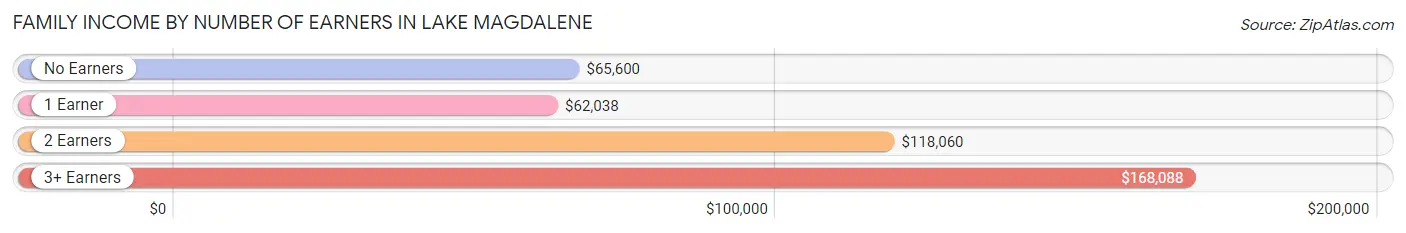
| Number of Earners | # Families | Median Income |
| No Earners | 1,076 (13.4%) | $65,600 |
| 1 Earner | 2,933 (36.5%) | $62,038 |
| 2 Earners | 3,509 (43.7%) | $118,060 |
| 3+ Earners | 520 (6.5%) | $168,088 |
| Total | 8,038 (100.0%) | $87,069 |
Household Income in Lake Magdalene
Household Income Brackets in Lake Magdalene
With 2,458 households falling in the category, the $50,000 to $74,999 income range is the most frequent in Lake Magdalene, accounting for 19.1% of all households. In contrast, only 193 households (1.5%) fall into the $10,000 to $14,999 income bracket, making it the least populous group.
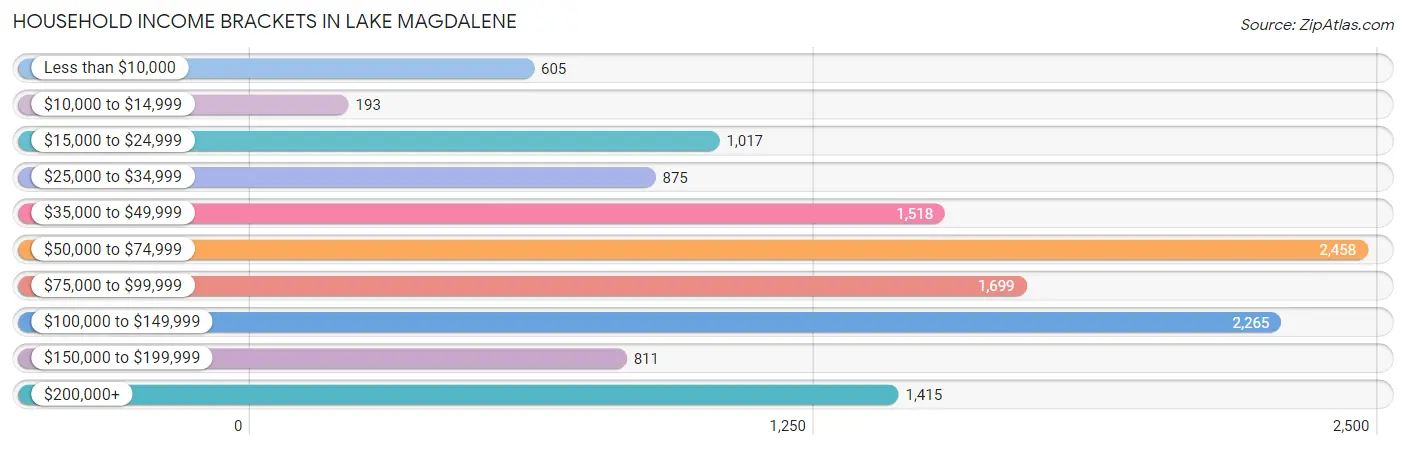
| Income Bracket | # Households | % Households |
| Less than $10,000 | 605 | 4.7% |
| $10,000 to $14,999 | 193 | 1.5% |
| $15,000 to $24,999 | 1,017 | 7.9% |
| $25,000 to $34,999 | 875 | 6.8% |
| $35,000 to $49,999 | 1,518 | 11.8% |
| $50,000 to $74,999 | 2,458 | 19.1% |
| $75,000 to $99,999 | 1,699 | 13.2% |
| $100,000 to $149,999 | 2,265 | 17.6% |
| $150,000 to $199,999 | 811 | 6.3% |
| $200,000+ | 1,415 | 11.0% |
Household Income by Householder Age in Lake Magdalene
The median household income in Lake Magdalene is $69,898, with the highest median household income of $77,589 found in the 45 to 64 years age bracket for the primary householder. A total of 4,630 households (36.0%) fall into this category. Meanwhile, the 15 to 24 years age bracket for the primary householder has the lowest median household income of $47,981, with 326 households (2.5%) in this group.
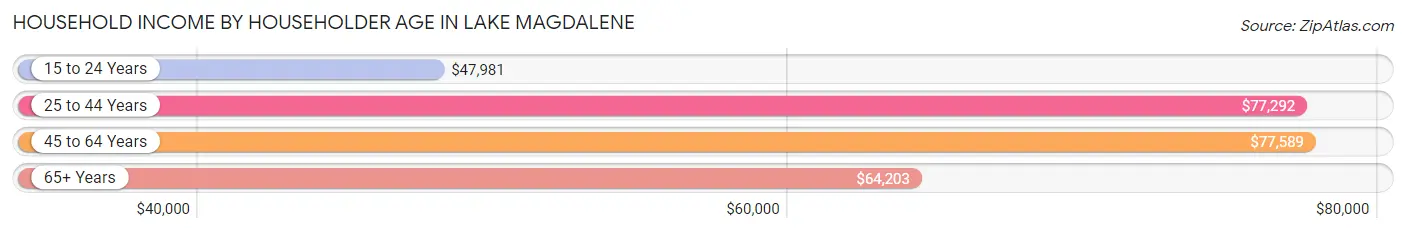
| Income Bracket | # Households | Median Income |
| 15 to 24 Years | 326 (2.5%) | $47,981 |
| 25 to 44 Years | 4,450 (34.6%) | $77,292 |
| 45 to 64 Years | 4,630 (36.0%) | $77,589 |
| 65+ Years | 3,462 (26.9%) | $64,203 |
| Total | 12,868 (100.0%) | $69,898 |
Poverty in Lake Magdalene
Income Below Poverty by Sex and Age in Lake Magdalene
With 11.2% poverty level for males and 14.9% for females among the residents of Lake Magdalene, 12 to 14 year old males and 5 year old females are the most vulnerable to poverty, with 132 males (24.5%) and 46 females (37.1%) in their respective age groups living below the poverty level.
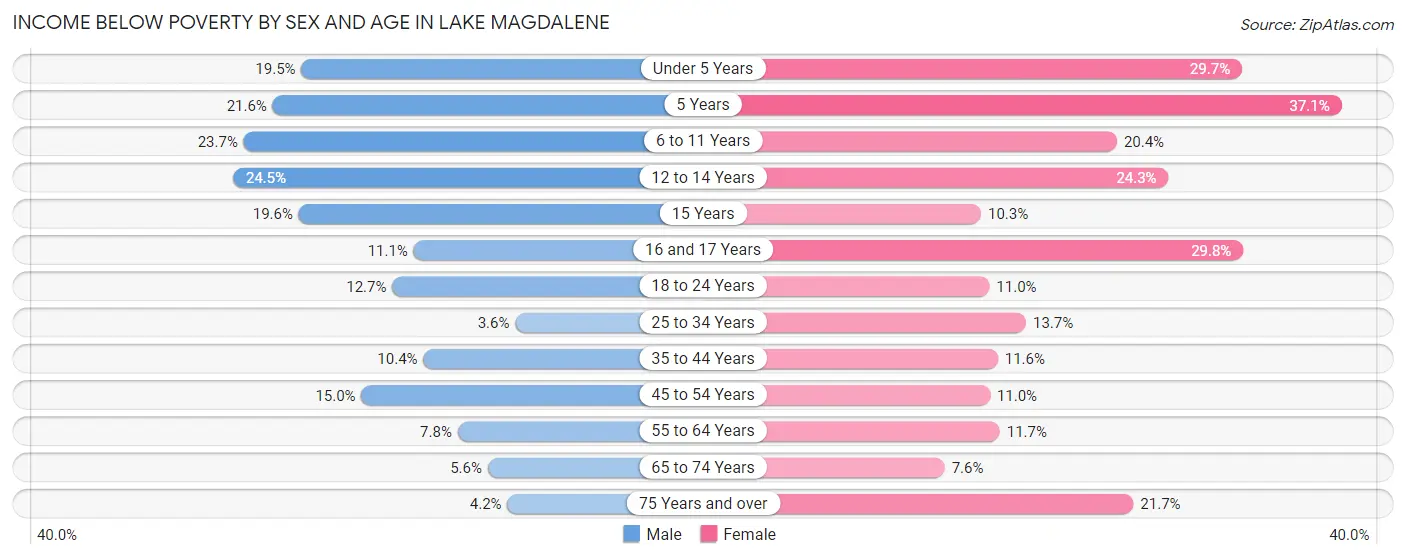
| Age Bracket | Male | Female |
| Under 5 Years | 267 (19.5%) | 306 (29.7%) |
| 5 Years | 60 (21.6%) | 46 (37.1%) |
| 6 to 11 Years | 224 (23.7%) | 181 (20.4%) |
| 12 to 14 Years | 132 (24.5%) | 146 (24.2%) |
| 15 Years | 11 (19.6%) | 9 (10.3%) |
| 16 and 17 Years | 37 (11.1%) | 90 (29.8%) |
| 18 to 24 Years | 117 (12.7%) | 99 (11.0%) |
| 25 to 34 Years | 84 (3.6%) | 321 (13.7%) |
| 35 to 44 Years | 209 (10.4%) | 222 (11.6%) |
| 45 to 54 Years | 296 (15.0%) | 188 (11.0%) |
| 55 to 64 Years | 151 (7.8%) | 290 (11.7%) |
| 65 to 74 Years | 100 (5.6%) | 144 (7.6%) |
| 75 Years and over | 38 (4.2%) | 289 (21.6%) |
| Total | 1,726 (11.2%) | 2,331 (14.9%) |
Income Above Poverty by Sex and Age in Lake Magdalene
According to the poverty statistics in Lake Magdalene, males aged 25 to 34 years and females aged 65 to 74 years are the age groups that are most secure financially, with 96.4% of males and 92.4% of females in these age groups living above the poverty line.
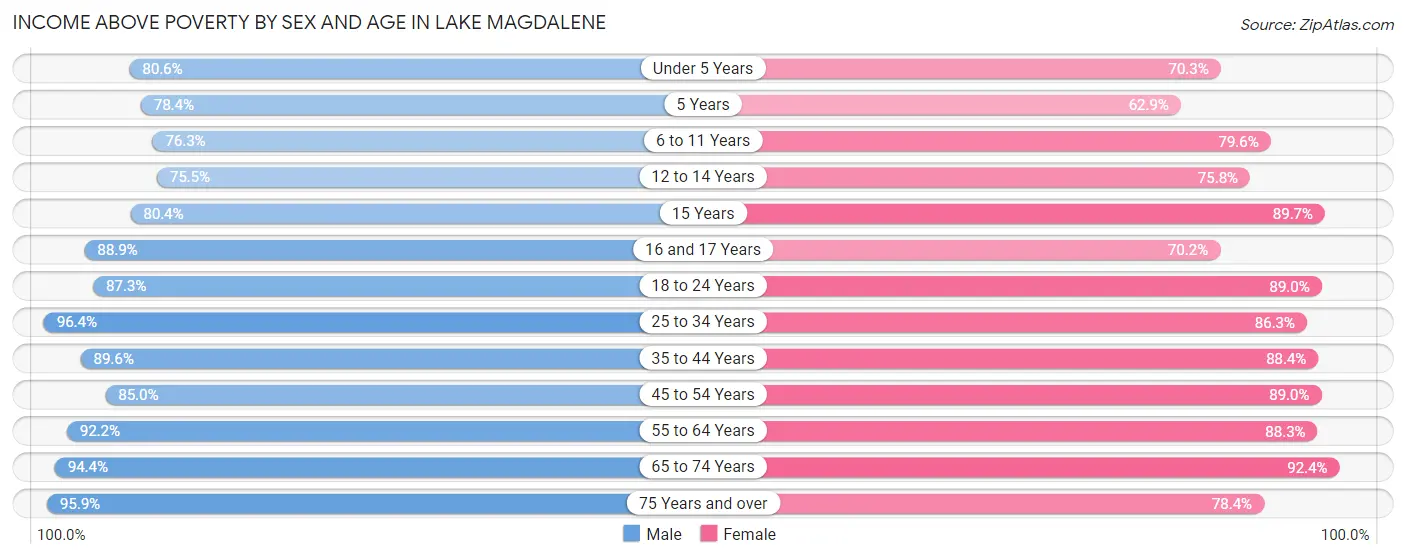
| Age Bracket | Male | Female |
| Under 5 Years | 1,106 (80.5%) | 724 (70.3%) |
| 5 Years | 218 (78.4%) | 78 (62.9%) |
| 6 to 11 Years | 720 (76.3%) | 705 (79.6%) |
| 12 to 14 Years | 406 (75.5%) | 456 (75.7%) |
| 15 Years | 45 (80.4%) | 78 (89.7%) |
| 16 and 17 Years | 296 (88.9%) | 212 (70.2%) |
| 18 to 24 Years | 804 (87.3%) | 804 (89.0%) |
| 25 to 34 Years | 2,266 (96.4%) | 2,026 (86.3%) |
| 35 to 44 Years | 1,802 (89.6%) | 1,695 (88.4%) |
| 45 to 54 Years | 1,679 (85.0%) | 1,521 (89.0%) |
| 55 to 64 Years | 1,774 (92.2%) | 2,183 (88.3%) |
| 65 to 74 Years | 1,683 (94.4%) | 1,742 (92.4%) |
| 75 Years and over | 878 (95.9%) | 1,046 (78.3%) |
| Total | 13,677 (88.8%) | 13,270 (85.1%) |
Income Below Poverty Among Married-Couple Families in Lake Magdalene
The poverty statistics for married-couple families in Lake Magdalene show that 6.6% or 392 of the total 5,938 families live below the poverty line. Families with 5 or more children have the highest poverty rate of 100.0%, comprising of 64 families. On the other hand, families with no children have the lowest poverty rate of 3.6%, which includes 136 families.
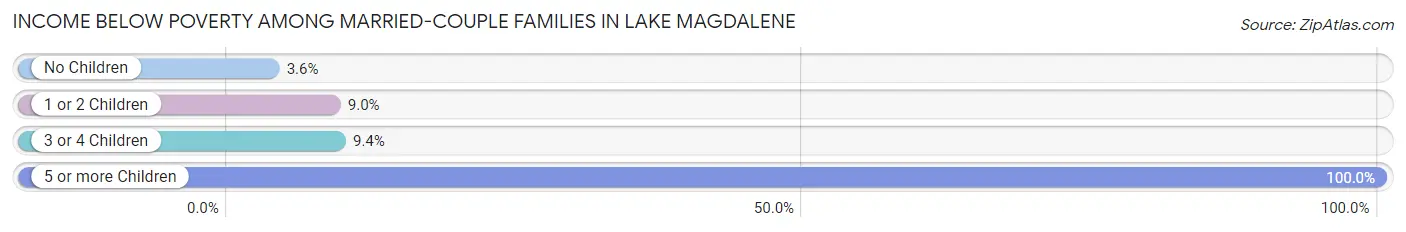
| Children | Above Poverty | Below Poverty |
| No Children | 3,608 (96.4%) | 136 (3.6%) |
| 1 or 2 Children | 1,649 (91.0%) | 162 (8.9%) |
| 3 or 4 Children | 289 (90.6%) | 30 (9.4%) |
| 5 or more Children | 0 (0.0%) | 64 (100.0%) |
| Total | 5,546 (93.4%) | 392 (6.6%) |
Income Below Poverty Among Single-Parent Households in Lake Magdalene
According to the poverty data in Lake Magdalene, 11.1% or 53 single-father households and 20.8% or 337 single-mother households are living below the poverty line. Among single-father households, those with 3 or 4 children have the highest poverty rate, with 46 households (100.0%) experiencing poverty. Likewise, among single-mother households, those with 5 or more children have the highest poverty rate, with 25 households (62.5%) falling below the poverty line.
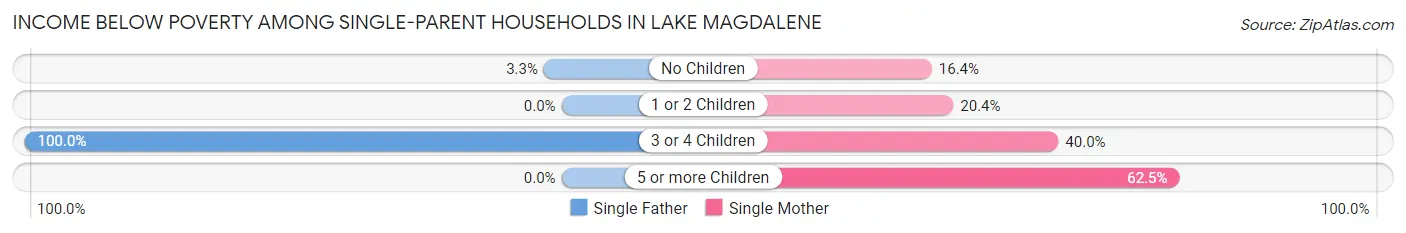
| Children | Single Father | Single Mother |
| No Children | 7 (3.3%) | 103 (16.4%) |
| 1 or 2 Children | 0 (0.0%) | 181 (20.4%) |
| 3 or 4 Children | 46 (100.0%) | 28 (40.0%) |
| 5 or more Children | 0 (0.0%) | 25 (62.5%) |
| Total | 53 (11.1%) | 337 (20.8%) |
Income Below Poverty Among Married-Couple vs Single-Parent Households in Lake Magdalene
The poverty data for Lake Magdalene shows that 392 of the married-couple family households (6.6%) and 390 of the single-parent households (18.6%) are living below the poverty level. Within the married-couple family households, those with 5 or more children have the highest poverty rate, with 64 households (100.0%) falling below the poverty line. Among the single-parent households, those with 3 or 4 children have the highest poverty rate, with 74 household (63.8%) living below poverty.
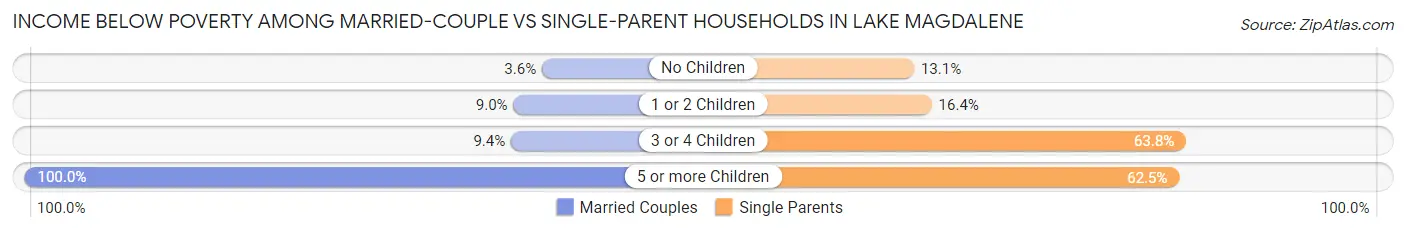
| Children | Married-Couple Families | Single-Parent Households |
| No Children | 136 (3.6%) | 110 (13.1%) |
| 1 or 2 Children | 162 (8.9%) | 181 (16.4%) |
| 3 or 4 Children | 30 (9.4%) | 74 (63.8%) |
| 5 or more Children | 64 (100.0%) | 25 (62.5%) |
| Total | 392 (6.6%) | 390 (18.6%) |
Race in Lake Magdalene
The most populous races in Lake Magdalene are White / Caucasian (22,547 | 71.5%), Hispanic or Latino (9,418 | 29.8%), and Two or more Races (4,581 | 14.5%).
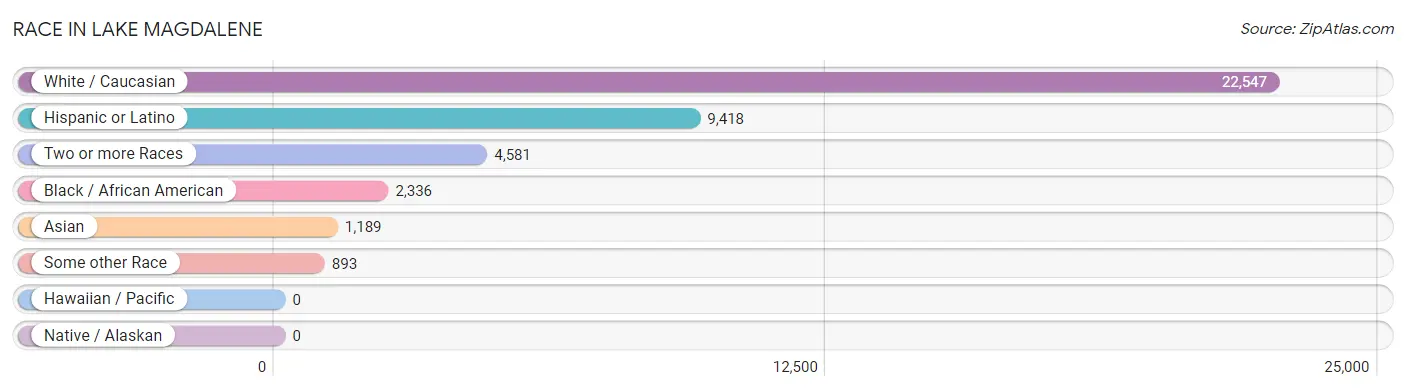
| Race | # Population | % Population |
| Asian | 1,189 | 3.8% |
| Black / African American | 2,336 | 7.4% |
| Hawaiian / Pacific | 0 | 0.0% |
| Hispanic or Latino | 9,418 | 29.8% |
| Native / Alaskan | 0 | 0.0% |
| White / Caucasian | 22,547 | 71.5% |
| Two or more Races | 4,581 | 14.5% |
| Some other Race | 893 | 2.8% |
| Total | 31,546 | 100.0% |
Ancestry in Lake Magdalene
The most populous ancestries reported in Lake Magdalene are German (4,055 | 12.9%), Irish (3,493 | 11.1%), English (3,418 | 10.8%), Italian (2,989 | 9.5%), and Cuban (2,843 | 9.0%), together accounting for 53.2% of all Lake Magdalene residents.
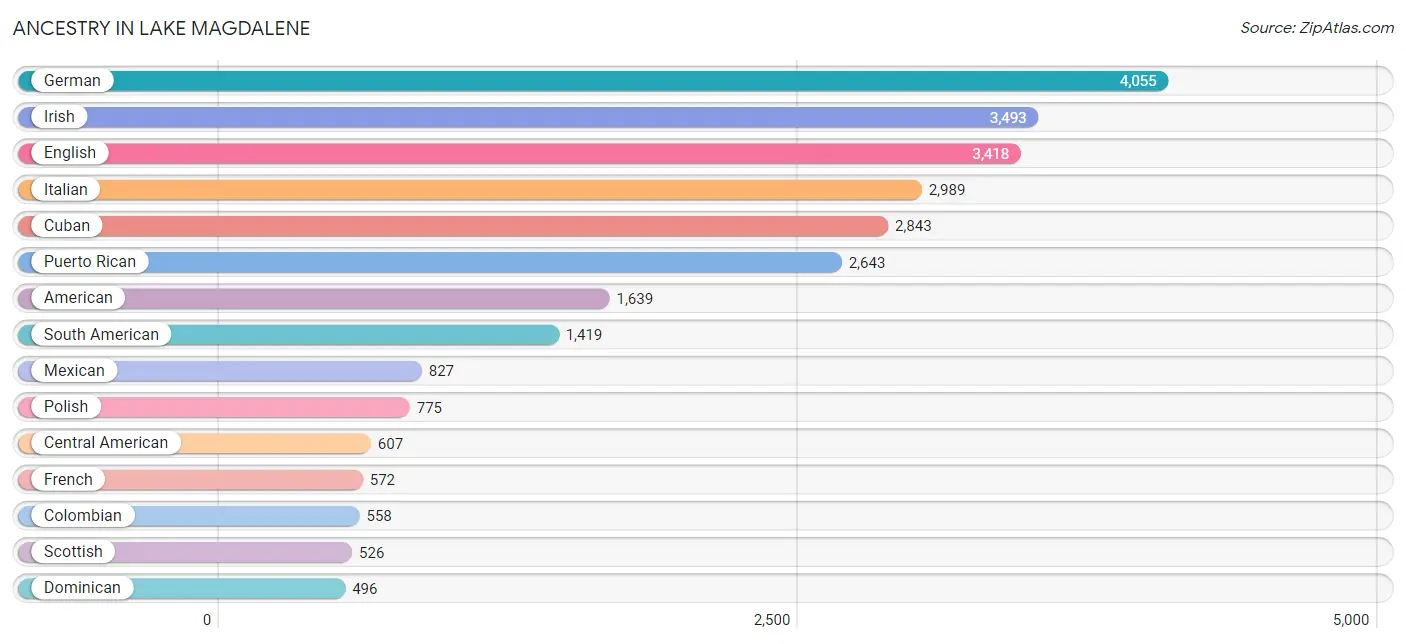
| Ancestry | # Population | % Population |
| African | 94 | 0.3% |
| Alaska Native | 26 | 0.1% |
| Albanian | 21 | 0.1% |
| American | 1,639 | 5.2% |
| Arab | 147 | 0.5% |
| Argentinean | 28 | 0.1% |
| Austrian | 73 | 0.2% |
| Bahamian | 35 | 0.1% |
| Bangladeshi | 76 | 0.2% |
| Barbadian | 26 | 0.1% |
| Basque | 28 | 0.1% |
| Bhutanese | 28 | 0.1% |
| Blackfeet | 8 | 0.0% |
| Bolivian | 85 | 0.3% |
| Brazilian | 89 | 0.3% |
| British | 303 | 1.0% |
| Burmese | 164 | 0.5% |
| Canadian | 68 | 0.2% |
| Cape Verdean | 11 | 0.0% |
| Carpatho Rusyn | 11 | 0.0% |
| Central American | 607 | 1.9% |
| Cherokee | 64 | 0.2% |
| Colombian | 558 | 1.8% |
| Croatian | 19 | 0.1% |
| Cuban | 2,843 | 9.0% |
| Czech | 60 | 0.2% |
| Czechoslovakian | 20 | 0.1% |
| Danish | 123 | 0.4% |
| Dominican | 496 | 1.6% |
| Dutch | 256 | 0.8% |
| Eastern European | 248 | 0.8% |
| Ecuadorian | 7 | 0.0% |
| Egyptian | 38 | 0.1% |
| English | 3,418 | 10.8% |
| European | 376 | 1.2% |
| Finnish | 7 | 0.0% |
| French | 572 | 1.8% |
| French Canadian | 58 | 0.2% |
| German | 4,055 | 12.9% |
| Greek | 115 | 0.4% |
| Guatemalan | 5 | 0.0% |
| Haitian | 74 | 0.2% |
| Honduran | 330 | 1.1% |
| Hungarian | 75 | 0.2% |
| Indian (Asian) | 357 | 1.1% |
| Iranian | 8 | 0.0% |
| Irish | 3,493 | 11.1% |
| Iroquois | 3 | 0.0% |
| Israeli | 12 | 0.0% |
| Italian | 2,989 | 9.5% |
| Jamaican | 112 | 0.4% |
| Korean | 178 | 0.6% |
| Latvian | 16 | 0.1% |
| Lebanese | 22 | 0.1% |
| Lithuanian | 42 | 0.1% |
| Mexican | 827 | 2.6% |
| Mongolian | 12 | 0.0% |
| Moroccan | 15 | 0.1% |
| Nicaraguan | 259 | 0.8% |
| Northern European | 23 | 0.1% |
| Norwegian | 134 | 0.4% |
| Pakistani | 22 | 0.1% |
| Paraguayan | 29 | 0.1% |
| Peruvian | 189 | 0.6% |
| Polish | 775 | 2.5% |
| Portuguese | 19 | 0.1% |
| Puerto Rican | 2,643 | 8.4% |
| Romanian | 32 | 0.1% |
| Russian | 169 | 0.5% |
| Salvadoran | 13 | 0.0% |
| Scandinavian | 36 | 0.1% |
| Scotch-Irish | 176 | 0.6% |
| Scottish | 526 | 1.7% |
| Serbian | 8 | 0.0% |
| Slavic | 105 | 0.3% |
| Slovak | 11 | 0.0% |
| Slovene | 8 | 0.0% |
| South American | 1,419 | 4.5% |
| Spaniard | 199 | 0.6% |
| Spanish | 235 | 0.7% |
| Sri Lankan | 408 | 1.3% |
| Subsaharan African | 105 | 0.3% |
| Swedish | 234 | 0.7% |
| Swiss | 61 | 0.2% |
| Syrian | 37 | 0.1% |
| Thai | 387 | 1.2% |
| Trinidadian and Tobagonian | 33 | 0.1% |
| Turkish | 232 | 0.7% |
| U.S. Virgin Islander | 37 | 0.1% |
| Ukrainian | 27 | 0.1% |
| Uruguayan | 81 | 0.3% |
| Venezuelan | 442 | 1.4% |
| Welsh | 159 | 0.5% |
| Yugoslavian | 6 | 0.0% | View All 94 Rows |
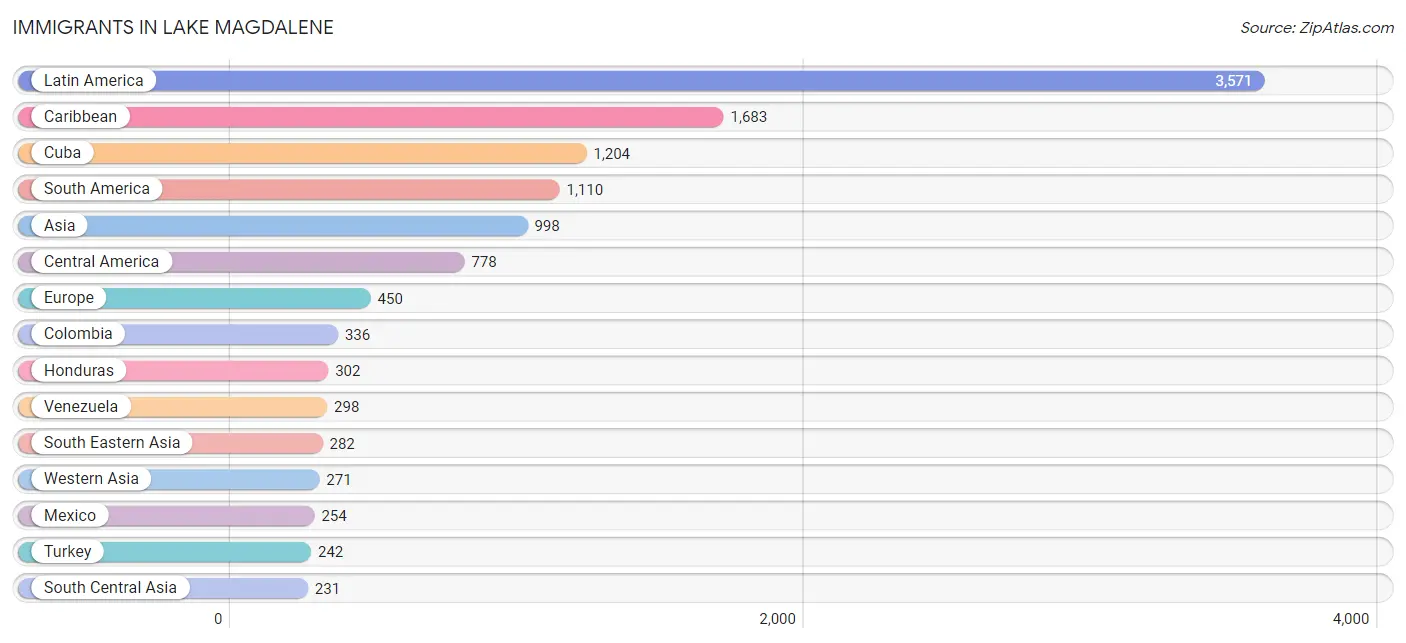
Immigrants in Lake Magdalene
The most numerous immigrant groups reported in Lake Magdalene came from Latin America (3,571 | 11.3%), Caribbean (1,683 | 5.3%), Cuba (1,204 | 3.8%), South America (1,110 | 3.5%), and Asia (998 | 3.2%), together accounting for 27.2% of all Lake Magdalene residents.
| Immigration Origin | # Population | % Population |
| Africa | 104 | 0.3% |
| Argentina | 8 | 0.0% |
| Asia | 998 | 3.2% |
| Bahamas | 35 | 0.1% |
| Barbados | 26 | 0.1% |
| Belarus | 4 | 0.0% |
| Belgium | 36 | 0.1% |
| Belize | 16 | 0.1% |
| Bolivia | 58 | 0.2% |
| Brazil | 101 | 0.3% |
| Canada | 108 | 0.3% |
| Caribbean | 1,683 | 5.3% |
| Central America | 778 | 2.5% |
| China | 124 | 0.4% |
| Colombia | 336 | 1.1% |
| Cuba | 1,204 | 3.8% |
| Dominica | 15 | 0.1% |
| Dominican Republic | 213 | 0.7% |
| Eastern Asia | 214 | 0.7% |
| Eastern Europe | 140 | 0.4% |
| Ecuador | 7 | 0.0% |
| Egypt | 9 | 0.0% |
| El Salvador | 13 | 0.0% |
| England | 59 | 0.2% |
| Europe | 450 | 1.4% |
| France | 9 | 0.0% |
| Germany | 109 | 0.4% |
| Guatemala | 5 | 0.0% |
| Haiti | 47 | 0.2% |
| Honduras | 302 | 1.0% |
| Hong Kong | 40 | 0.1% |
| Hungary | 8 | 0.0% |
| India | 148 | 0.5% |
| Iran | 8 | 0.0% |
| Iraq | 29 | 0.1% |
| Ireland | 12 | 0.0% |
| Italy | 13 | 0.0% |
| Jamaica | 119 | 0.4% |
| Japan | 10 | 0.0% |
| Kazakhstan | 13 | 0.0% |
| Korea | 80 | 0.3% |
| Latin America | 3,571 | 11.3% |
| Latvia | 16 | 0.1% |
| Lithuania | 13 | 0.0% |
| Malaysia | 12 | 0.0% |
| Mexico | 254 | 0.8% |
| Morocco | 15 | 0.1% |
| Nepal | 29 | 0.1% |
| Netherlands | 8 | 0.0% |
| Nicaragua | 82 | 0.3% |
| Northern Africa | 30 | 0.1% |
| Northern Europe | 101 | 0.3% |
| Pakistan | 12 | 0.0% |
| Panama | 106 | 0.3% |
| Peru | 166 | 0.5% |
| Philippines | 68 | 0.2% |
| Poland | 50 | 0.2% |
| Russia | 11 | 0.0% |
| South Africa | 74 | 0.2% |
| South America | 1,110 | 3.5% |
| South Central Asia | 231 | 0.7% |
| South Eastern Asia | 282 | 0.9% |
| Southern Europe | 47 | 0.2% |
| Spain | 34 | 0.1% |
| Sri Lanka | 21 | 0.1% |
| Sweden | 15 | 0.1% |
| Taiwan | 38 | 0.1% |
| Thailand | 12 | 0.0% |
| Trinidad and Tobago | 24 | 0.1% |
| Turkey | 242 | 0.8% |
| Ukraine | 38 | 0.1% |
| Uruguay | 81 | 0.3% |
| Venezuela | 298 | 0.9% |
| Vietnam | 190 | 0.6% |
| Western Asia | 271 | 0.9% |
| Western Europe | 162 | 0.5% | View All 76 Rows |
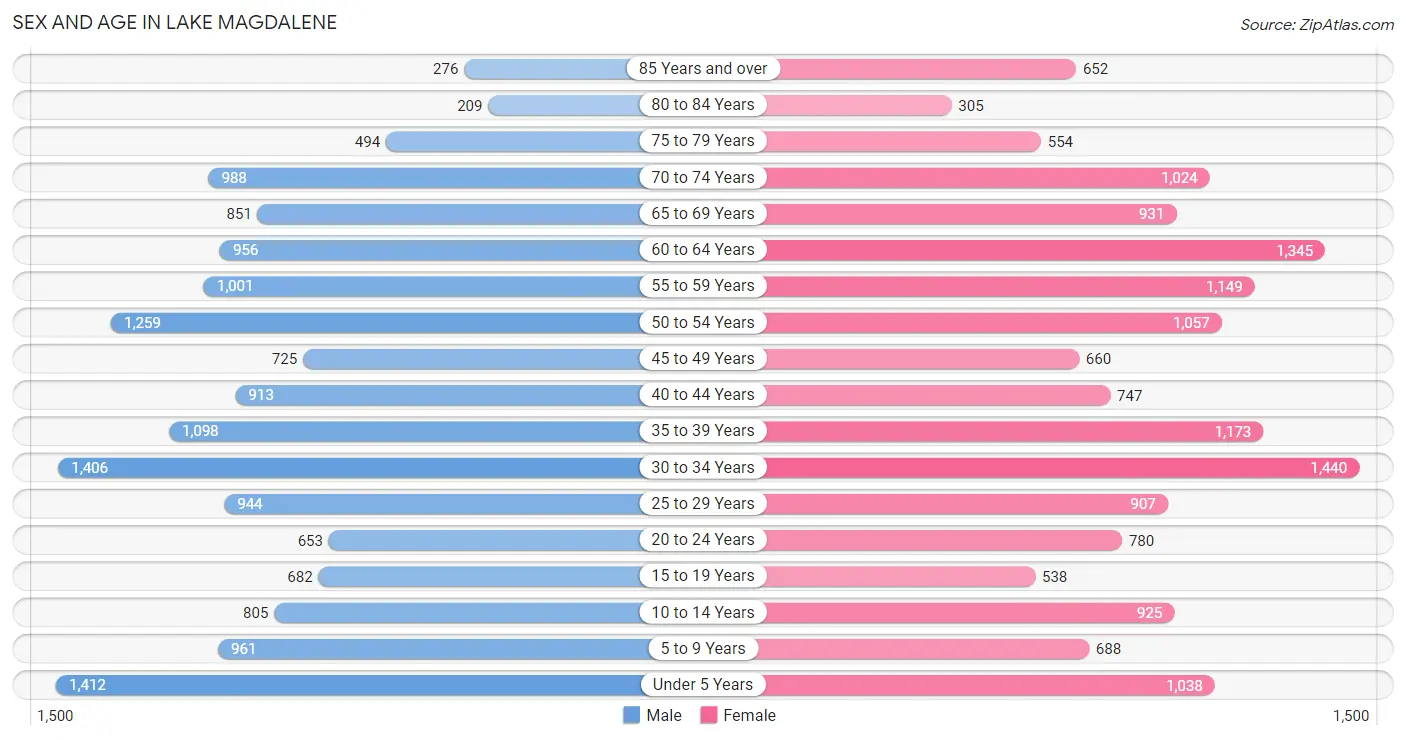
Sex and Age in Lake Magdalene
Sex and Age in Lake Magdalene
The most populous age groups in Lake Magdalene are Under 5 Years (1,412 | 9.0%) for men and 30 to 34 Years (1,440 | 9.0%) for women.
| Age Bracket | Male | Female |
| Under 5 Years | 1,412 (9.0%) | 1,038 (6.5%) |
| 5 to 9 Years | 961 (6.1%) | 688 (4.3%) |
| 10 to 14 Years | 805 (5.1%) | 925 (5.8%) |
| 15 to 19 Years | 682 (4.4%) | 538 (3.4%) |
| 20 to 24 Years | 653 (4.2%) | 780 (4.9%) |
| 25 to 29 Years | 944 (6.0%) | 907 (5.7%) |
| 30 to 34 Years | 1,406 (9.0%) | 1,440 (9.0%) |
| 35 to 39 Years | 1,098 (7.0%) | 1,173 (7.4%) |
| 40 to 44 Years | 913 (5.8%) | 747 (4.7%) |
| 45 to 49 Years | 725 (4.6%) | 660 (4.2%) |
| 50 to 54 Years | 1,259 (8.1%) | 1,057 (6.6%) |
| 55 to 59 Years | 1,001 (6.4%) | 1,149 (7.2%) |
| 60 to 64 Years | 956 (6.1%) | 1,345 (8.5%) |
| 65 to 69 Years | 851 (5.4%) | 931 (5.9%) |
| 70 to 74 Years | 988 (6.3%) | 1,024 (6.4%) |
| 75 to 79 Years | 494 (3.2%) | 554 (3.5%) |
| 80 to 84 Years | 209 (1.3%) | 305 (1.9%) |
| 85 Years and over | 276 (1.8%) | 652 (4.1%) |
| Total | 15,633 (100.0%) | 15,913 (100.0%) |
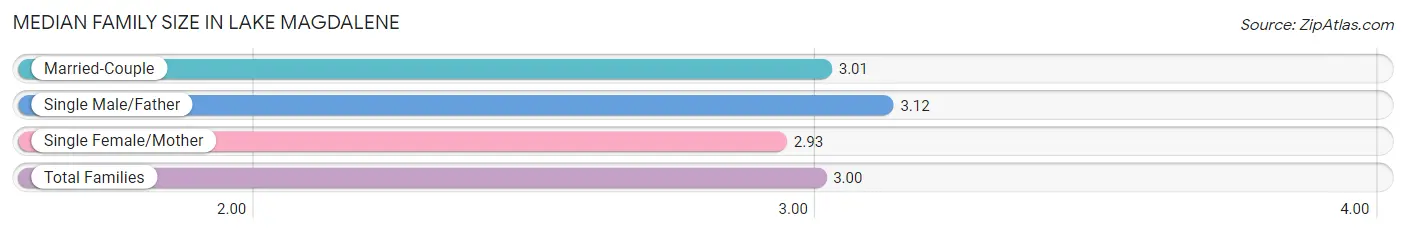
Families and Households in Lake Magdalene
Median Family Size in Lake Magdalene
The median family size in Lake Magdalene is 3.00 persons per family, with single male/father families (477 | 5.9%) accounting for the largest median family size of 3.12 persons per family. On the other hand, single female/mother families (1,623 | 20.2%) represent the smallest median family size with 2.93 persons per family.
| Family Type | # Families | Family Size |
| Married-Couple | 5,938 (73.9%) | 3.01 |
| Single Male/Father | 477 (5.9%) | 3.12 |
| Single Female/Mother | 1,623 (20.2%) | 2.93 |
| Total Families | 8,038 (100.0%) | 3.00 |
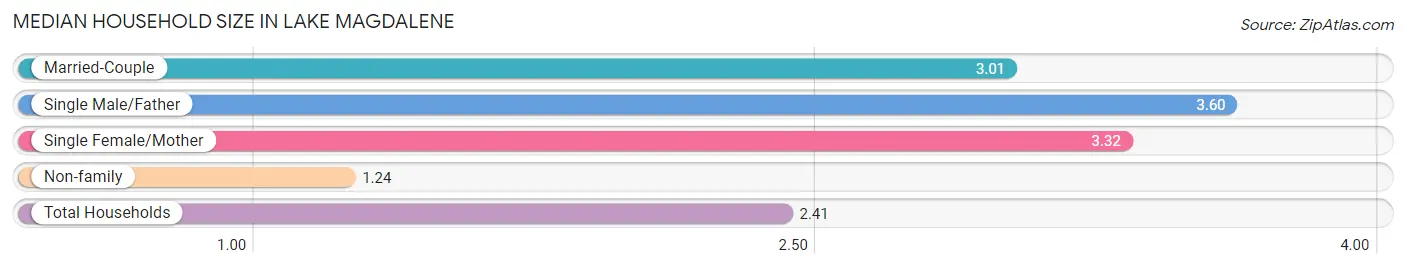
Median Household Size in Lake Magdalene
The median household size in Lake Magdalene is 2.41 persons per household, with single male/father households (477 | 3.7%) accounting for the largest median household size of 3.6 persons per household. non-family households (4,830 | 37.5%) represent the smallest median household size with 1.24 persons per household.
| Household Type | # Households | Household Size |
| Married-Couple | 5,938 (46.2%) | 3.01 |
| Single Male/Father | 477 (3.7%) | 3.60 |
| Single Female/Mother | 1,623 (12.6%) | 3.32 |
| Non-family | 4,830 (37.5%) | 1.24 |
| Total Households | 12,868 (100.0%) | 2.41 |
Household Size by Marriage Status in Lake Magdalene
Out of a total of 12,868 households in Lake Magdalene, 8,038 (62.5%) are family households, while 4,830 (37.5%) are nonfamily households. The most numerous type of family households are 2-person households, comprising 3,804, and the most common type of nonfamily households are 1-person households, comprising 3,928.
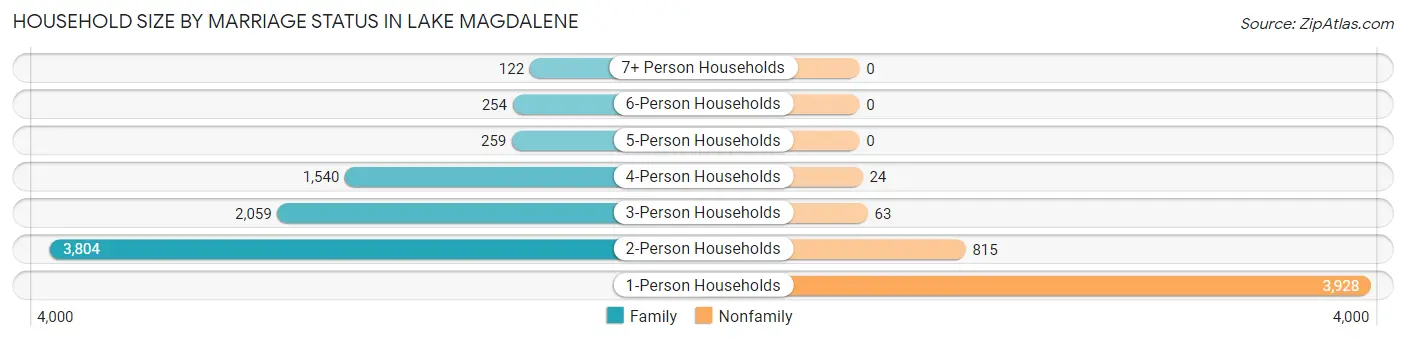
| Household Size | Family Households | Nonfamily Households |
| 1-Person Households | - | 3,928 (30.5%) |
| 2-Person Households | 3,804 (29.6%) | 815 (6.3%) |
| 3-Person Households | 2,059 (16.0%) | 63 (0.5%) |
| 4-Person Households | 1,540 (12.0%) | 24 (0.2%) |
| 5-Person Households | 259 (2.0%) | 0 (0.0%) |
| 6-Person Households | 254 (2.0%) | 0 (0.0%) |
| 7+ Person Households | 122 (0.9%) | 0 (0.0%) |
| Total | 8,038 (62.5%) | 4,830 (37.5%) |
Female Fertility in Lake Magdalene
Fertility by Age in Lake Magdalene
Average fertility rate in Lake Magdalene is 71.0 births per 1,000 women. Women in the age bracket of 20 to 34 years have the highest fertility rate with 115.0 births per 1,000 women. Women in the age bracket of 20 to 34 years acount for 77.7% of all women with births.
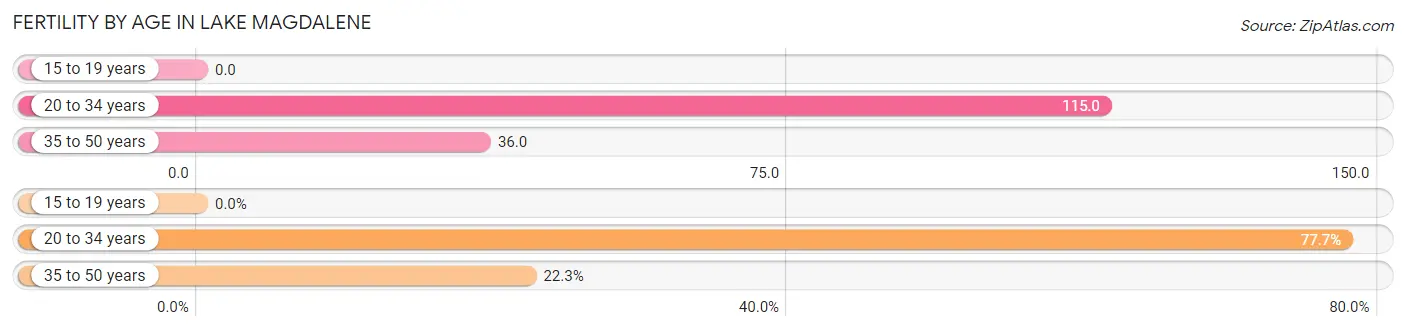
| Age Bracket | Women with Births | Births / 1,000 Women |
| 15 to 19 years | 0 (0.0%) | 0.0 |
| 20 to 34 years | 359 (77.7%) | 115.0 |
| 35 to 50 years | 103 (22.3%) | 36.0 |
| Total | 462 (100.0%) | 71.0 |
Fertility by Age by Marriage Status in Lake Magdalene
79.7% of women with births (462) in Lake Magdalene are married. The highest percentage of unmarried women with births falls into 20 to 34 years age bracket with 26.2% of them unmarried at the time of birth, while the lowest percentage of unmarried women with births belong to 35 to 50 years age bracket with 0.0% of them unmarried.
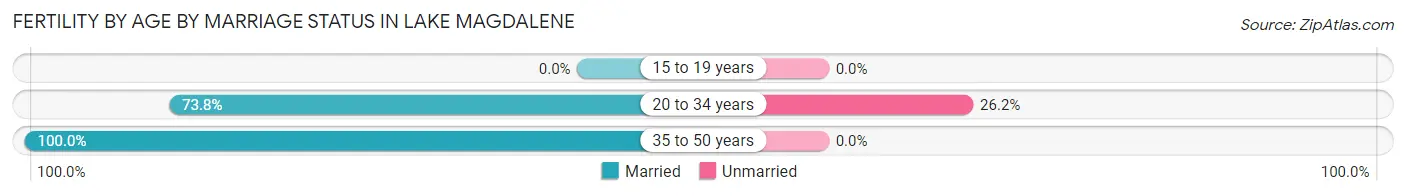
| Age Bracket | Married | Unmarried |
| 15 to 19 years | 0 (0.0%) | 0 (0.0%) |
| 20 to 34 years | 265 (73.8%) | 94 (26.2%) |
| 35 to 50 years | 103 (100.0%) | 0 (0.0%) |
| Total | 368 (79.6%) | 94 (20.3%) |
Fertility by Education in Lake Magdalene
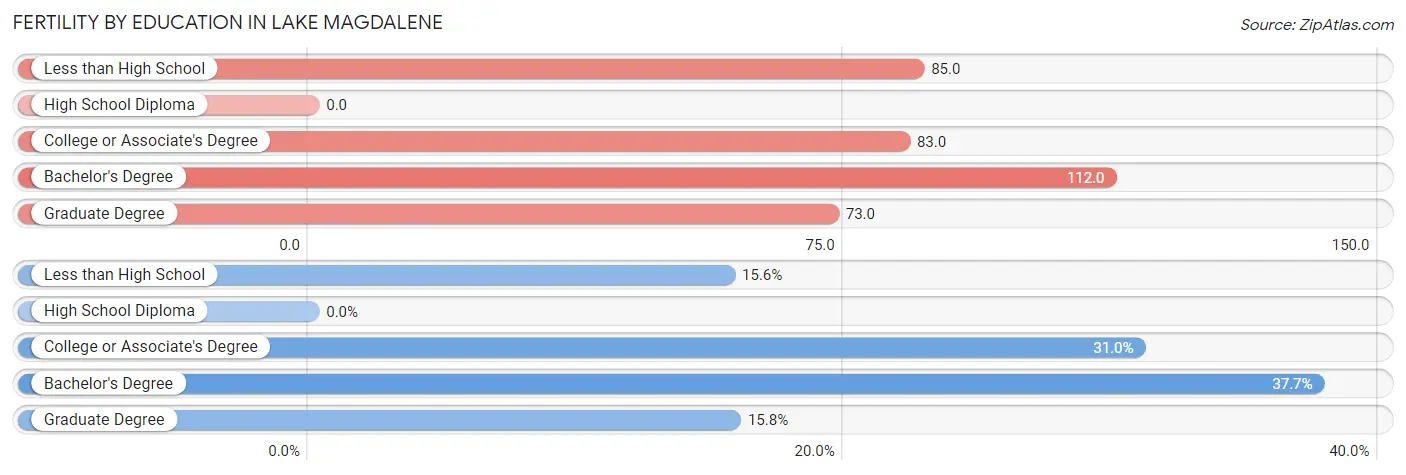
| Educational Attainment | Women with Births | Births / 1,000 Women |
| Less than High School | 72 (15.6%) | 85.0 |
| High School Diploma | 0 (0.0%) | 0.0 |
| College or Associate's Degree | 143 (30.9%) | 83.0 |
| Bachelor's Degree | 174 (37.7%) | 112.0 |
| Graduate Degree | 73 (15.8%) | 73.0 |
| Total | 462 (100.0%) | 71.0 |
Fertility by Education by Marriage Status in Lake Magdalene
20.3% of women with births in Lake Magdalene are unmarried. Women with the educational attainment of less than high school are most likely to be married with 100.0% of them married at childbirth, while women with the educational attainment of college or associate's degree are least likely to be married with 58.0% of them unmarried at childbirth.
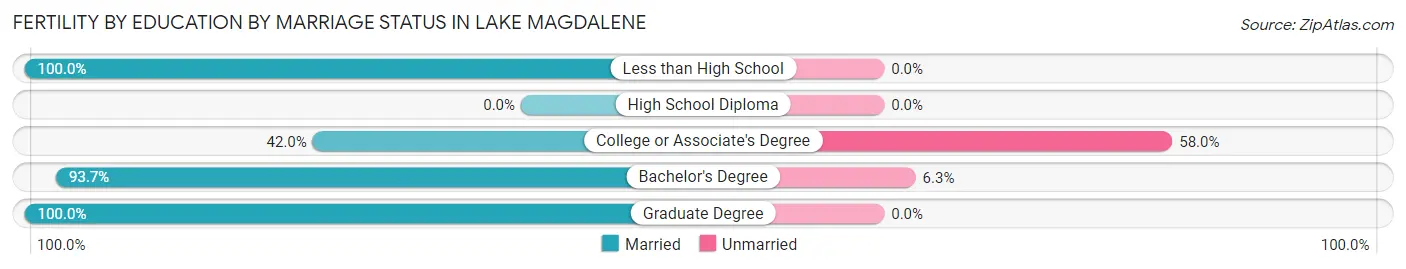
| Educational Attainment | Married | Unmarried |
| Less than High School | 72 (100.0%) | 0 (0.0%) |
| High School Diploma | 0 (0.0%) | 0 (0.0%) |
| College or Associate's Degree | 60 (42.0%) | 83 (58.0%) |
| Bachelor's Degree | 163 (93.7%) | 11 (6.3%) |
| Graduate Degree | 73 (100.0%) | 0 (0.0%) |
| Total | 368 (79.6%) | 94 (20.3%) |
Employment Characteristics in Lake Magdalene
Employment by Class of Employer in Lake Magdalene
Among the 15,484 employed individuals in Lake Magdalene, private company employees (10,634 | 68.7%), not-for-profit organizations (1,235 | 8.0%), and self-employed (incorporated) (1,126 | 7.3%) make up the most common classes of employment.
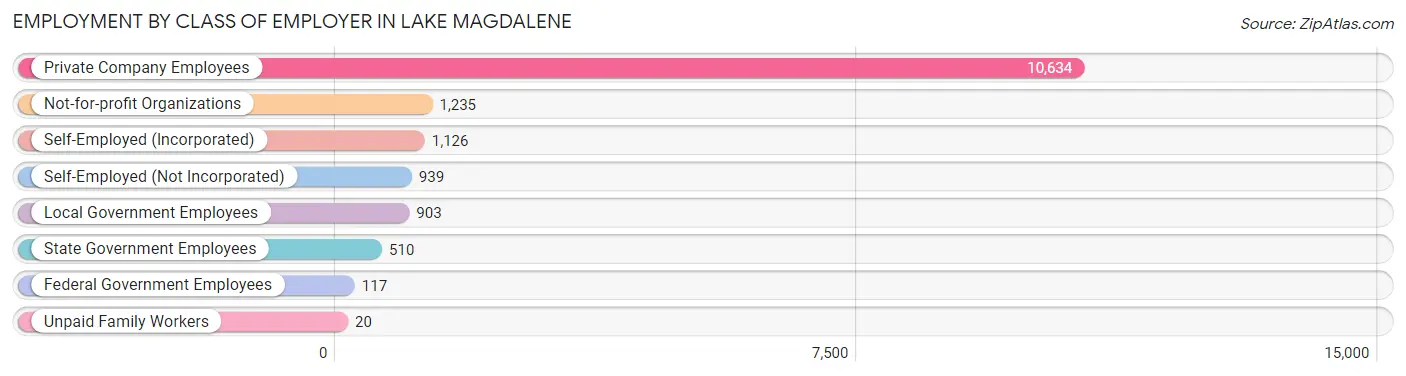
| Employer Class | # Employees | % Employees |
| Private Company Employees | 10,634 | 68.7% |
| Self-Employed (Incorporated) | 1,126 | 7.3% |
| Self-Employed (Not Incorporated) | 939 | 6.1% |
| Not-for-profit Organizations | 1,235 | 8.0% |
| Local Government Employees | 903 | 5.8% |
| State Government Employees | 510 | 3.3% |
| Federal Government Employees | 117 | 0.8% |
| Unpaid Family Workers | 20 | 0.1% |
| Total | 15,484 | 100.0% |
Employment Status by Age in Lake Magdalene
According to the labor force statistics for Lake Magdalene, out of the total population over 16 years of age (25,555), 63.9% or 16,330 individuals are in the labor force, with 3.4% or 555 of them unemployed. The age group with the highest labor force participation rate is 25 to 29 years, with 87.9% or 1,627 individuals in the labor force. Within the labor force, the 16 to 19 years age range has the highest percentage of unemployed individuals, with 11.1% or 41 of them being unemployed.
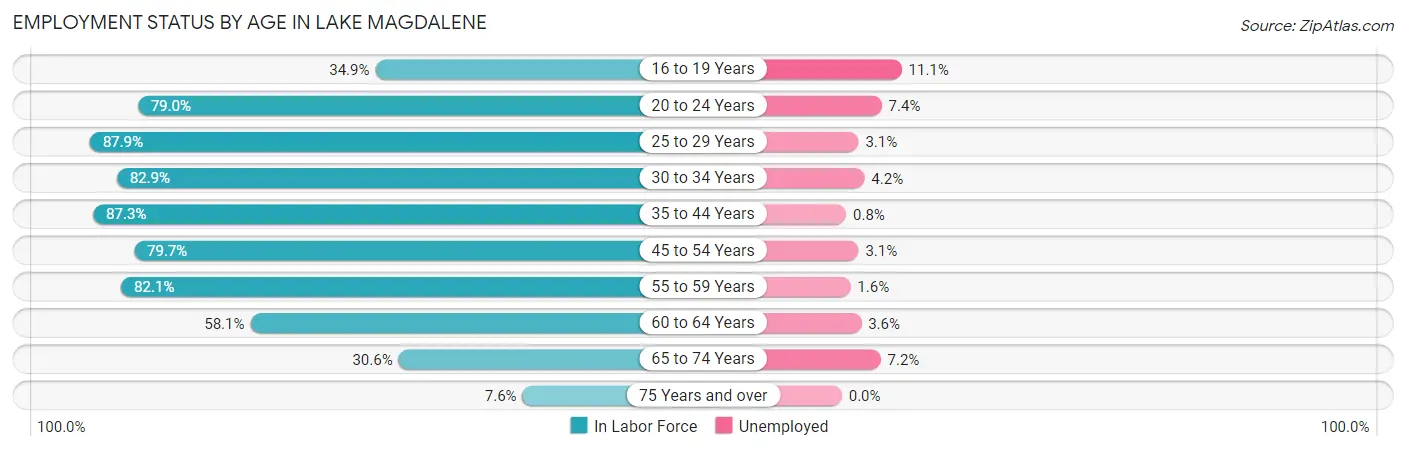
| Age Bracket | In Labor Force | Unemployed |
| 16 to 19 Years | 369 (34.9%) | 41 (11.1%) |
| 20 to 24 Years | 1,132 (79.0%) | 84 (7.4%) |
| 25 to 29 Years | 1,627 (87.9%) | 50 (3.1%) |
| 30 to 34 Years | 2,359 (82.9%) | 99 (4.2%) |
| 35 to 44 Years | 3,432 (87.3%) | 27 (0.8%) |
| 45 to 54 Years | 2,950 (79.7%) | 91 (3.1%) |
| 55 to 59 Years | 1,765 (82.1%) | 28 (1.6%) |
| 60 to 64 Years | 1,337 (58.1%) | 48 (3.6%) |
| 65 to 74 Years | 1,161 (30.6%) | 84 (7.2%) |
| 75 Years and over | 189 (7.6%) | 0 (0.0%) |
| Total | 16,330 (63.9%) | 555 (3.4%) |
Employment Status by Educational Attainment in Lake Magdalene
According to labor force statistics for Lake Magdalene, 80.3% of individuals (13,474) out of the total population between 25 and 64 years of age (16,780) are in the labor force, with 2.6% or 350 of them being unemployed. The group with the highest labor force participation rate are those with the educational attainment of bachelor's degree or higher, with 87.7% or 5,535 individuals in the labor force. Within the labor force, individuals with college / associate degree education have the highest percentage of unemployment, with 3.1% or 132 of them being unemployed.
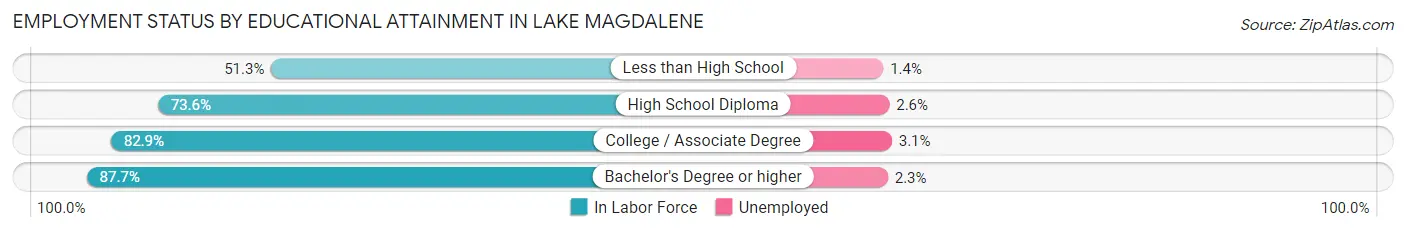
| Educational Attainment | In Labor Force | Unemployed |
| Less than High School | 569 (51.3%) | 16 (1.4%) |
| High School Diploma | 3,098 (73.6%) | 109 (2.6%) |
| College / Associate Degree | 4,269 (82.9%) | 160 (3.1%) |
| Bachelor's Degree or higher | 5,535 (87.7%) | 145 (2.3%) |
| Total | 13,474 (80.3%) | 436 (2.6%) |
Employment Occupations by Sex in Lake Magdalene
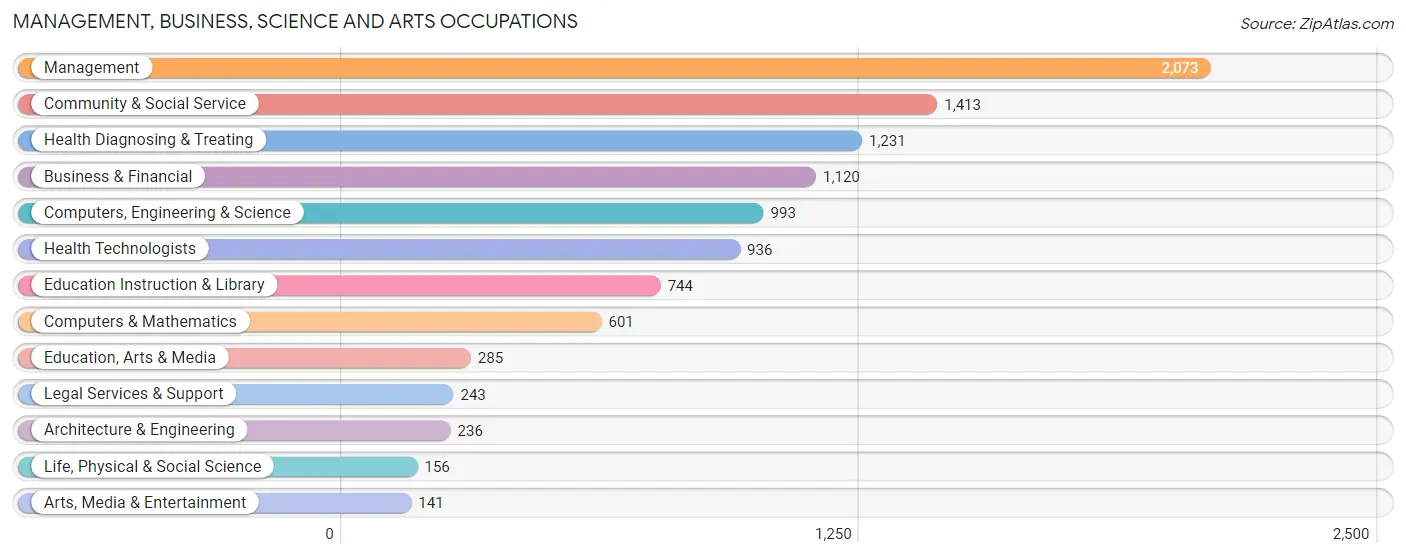
Management, Business, Science and Arts Occupations
The most common Management, Business, Science and Arts occupations in Lake Magdalene are Management (2,073 | 13.2%), Community & Social Service (1,413 | 9.0%), Health Diagnosing & Treating (1,231 | 7.8%), Business & Financial (1,120 | 7.1%), and Computers, Engineering & Science (993 | 6.3%).
Management, Business, Science and Arts Occupations by Sex
Within the Management, Business, Science and Arts occupations in Lake Magdalene, the most male-oriented occupations are Computers & Mathematics (78.2%), Computers, Engineering & Science (70.2%), and Architecture & Engineering (69.9%), while the most female-oriented occupations are Education, Arts & Media (77.5%), Health Diagnosing & Treating (67.7%), and Legal Services & Support (66.3%).
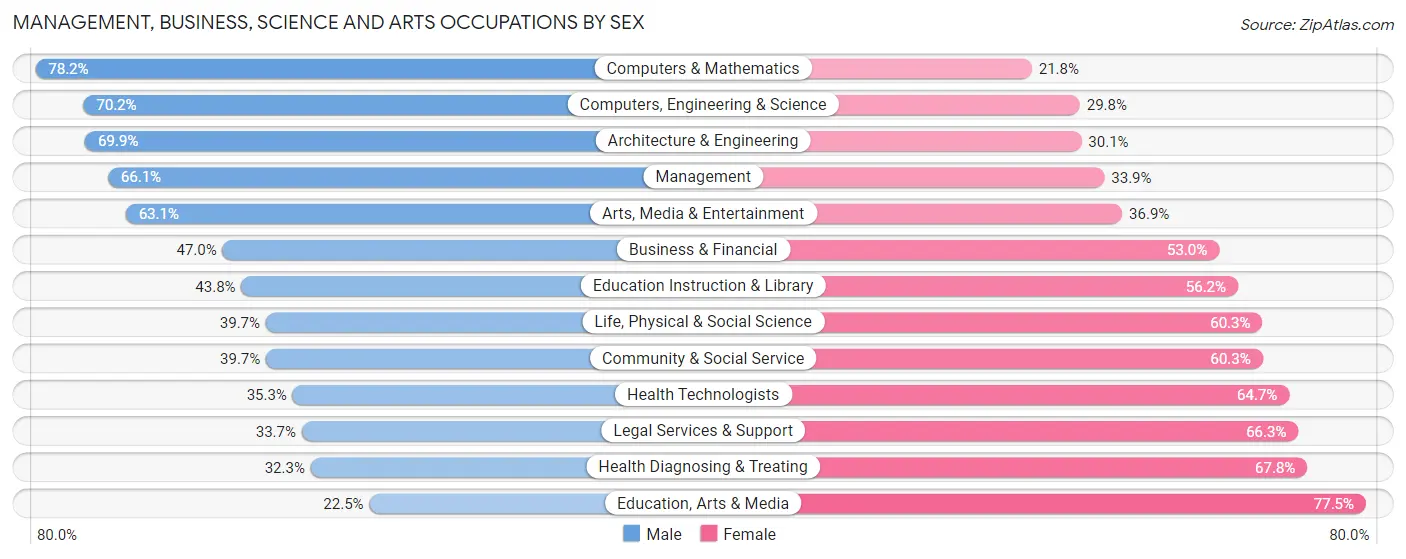
| Occupation | Male | Female |
| Management | 1,370 (66.1%) | 703 (33.9%) |
| Business & Financial | 526 (47.0%) | 594 (53.0%) |
| Computers, Engineering & Science | 697 (70.2%) | 296 (29.8%) |
| Computers & Mathematics | 470 (78.2%) | 131 (21.8%) |
| Architecture & Engineering | 165 (69.9%) | 71 (30.1%) |
| Life, Physical & Social Science | 62 (39.7%) | 94 (60.3%) |
| Community & Social Service | 561 (39.7%) | 852 (60.3%) |
| Education, Arts & Media | 64 (22.5%) | 221 (77.5%) |
| Legal Services & Support | 82 (33.7%) | 161 (66.3%) |
| Education Instruction & Library | 326 (43.8%) | 418 (56.2%) |
| Arts, Media & Entertainment | 89 (63.1%) | 52 (36.9%) |
| Health Diagnosing & Treating | 397 (32.3%) | 834 (67.7%) |
| Health Technologists | 330 (35.3%) | 606 (64.7%) |
| Total (Category) | 3,551 (52.0%) | 3,279 (48.0%) |
| Total (Overall) | 8,415 (53.4%) | 7,353 (46.6%) |
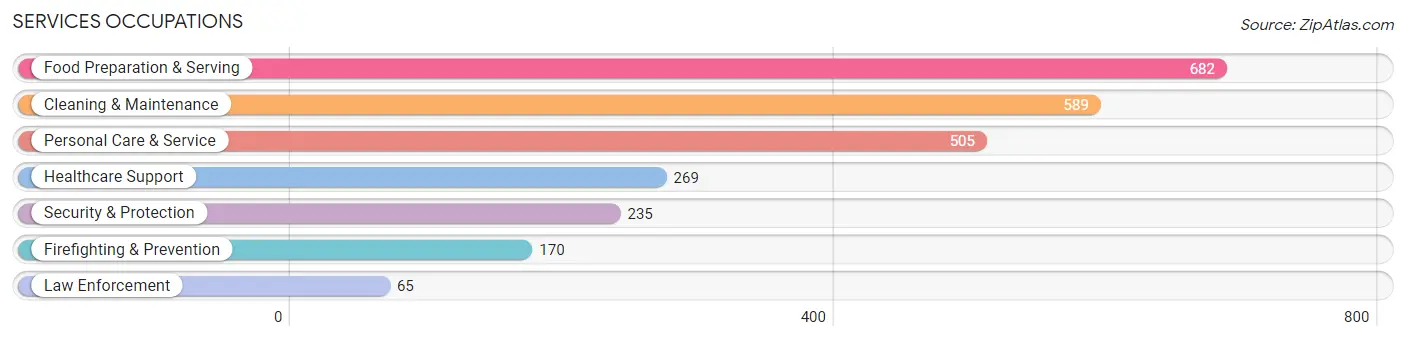
Services Occupations
The most common Services occupations in Lake Magdalene are Food Preparation & Serving (682 | 4.3%), Cleaning & Maintenance (589 | 3.7%), Personal Care & Service (505 | 3.2%), Healthcare Support (269 | 1.7%), and Security & Protection (235 | 1.5%).
Services Occupations by Sex
Within the Services occupations in Lake Magdalene, the most male-oriented occupations are Law Enforcement (70.8%), Cleaning & Maintenance (67.4%), and Security & Protection (47.7%), while the most female-oriented occupations are Personal Care & Service (86.9%), Healthcare Support (69.5%), and Firefighting & Prevention (61.2%).
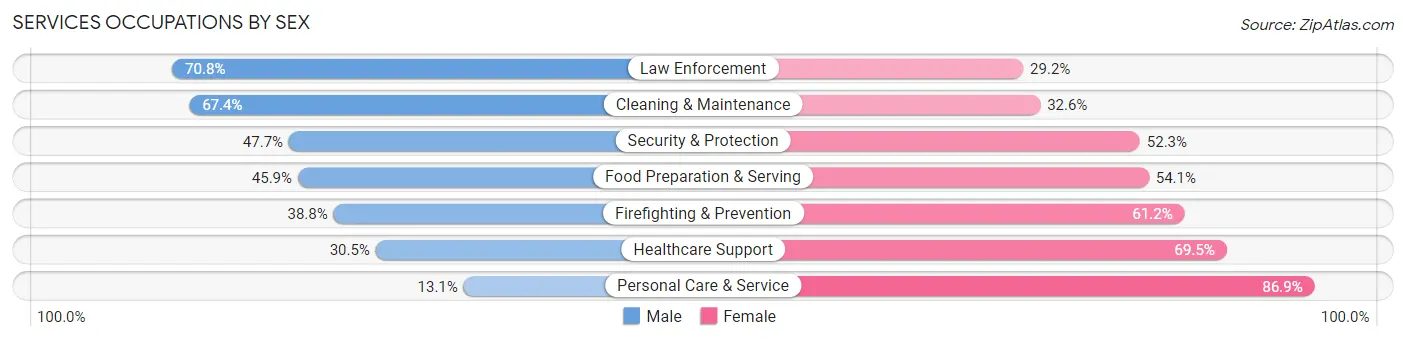
| Occupation | Male | Female |
| Healthcare Support | 82 (30.5%) | 187 (69.5%) |
| Security & Protection | 112 (47.7%) | 123 (52.3%) |
| Firefighting & Prevention | 66 (38.8%) | 104 (61.2%) |
| Law Enforcement | 46 (70.8%) | 19 (29.2%) |
| Food Preparation & Serving | 313 (45.9%) | 369 (54.1%) |
| Cleaning & Maintenance | 397 (67.4%) | 192 (32.6%) |
| Personal Care & Service | 66 (13.1%) | 439 (86.9%) |
| Total (Category) | 970 (42.5%) | 1,310 (57.5%) |
| Total (Overall) | 8,415 (53.4%) | 7,353 (46.6%) |
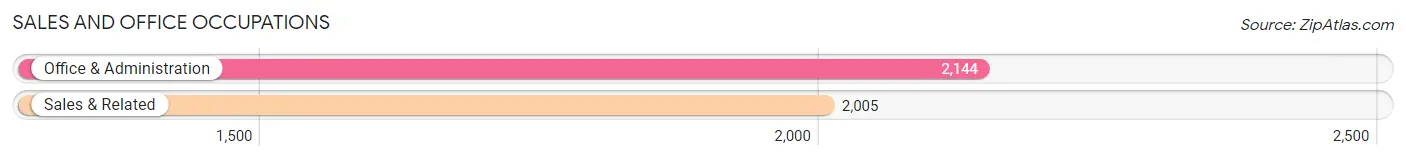
Sales and Office Occupations
The most common Sales and Office occupations in Lake Magdalene are Office & Administration (2,144 | 13.6%), and Sales & Related (2,005 | 12.7%).
Sales and Office Occupations by Sex
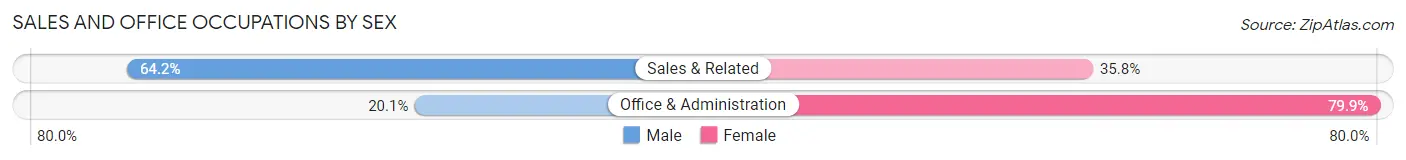
| Occupation | Male | Female |
| Sales & Related | 1,288 (64.2%) | 717 (35.8%) |
| Office & Administration | 430 (20.1%) | 1,714 (79.9%) |
| Total (Category) | 1,718 (41.4%) | 2,431 (58.6%) |
| Total (Overall) | 8,415 (53.4%) | 7,353 (46.6%) |
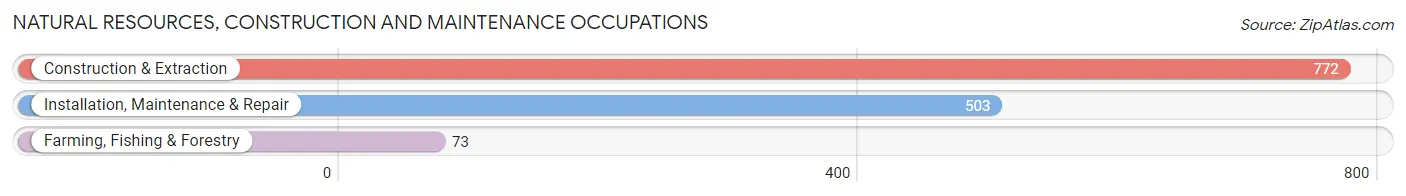
Natural Resources, Construction and Maintenance Occupations
The most common Natural Resources, Construction and Maintenance occupations in Lake Magdalene are Construction & Extraction (772 | 4.9%), Installation, Maintenance & Repair (503 | 3.2%), and Farming, Fishing & Forestry (73 | 0.5%).
Natural Resources, Construction and Maintenance Occupations by Sex
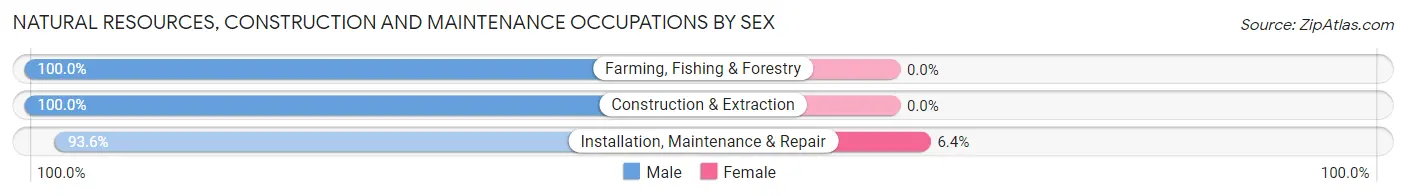
| Occupation | Male | Female |
| Farming, Fishing & Forestry | 73 (100.0%) | 0 (0.0%) |
| Construction & Extraction | 772 (100.0%) | 0 (0.0%) |
| Installation, Maintenance & Repair | 471 (93.6%) | 32 (6.4%) |
| Total (Category) | 1,316 (97.6%) | 32 (2.4%) |
| Total (Overall) | 8,415 (53.4%) | 7,353 (46.6%) |
Production, Transportation and Moving Occupations
The most common Production, Transportation and Moving occupations in Lake Magdalene are Transportation (528 | 3.4%), Production (464 | 2.9%), and Material Moving (169 | 1.1%).
Production, Transportation and Moving Occupations by Sex
| Occupation | Male | Female |
| Production | 278 (59.9%) | 186 (40.1%) |
| Transportation | 496 (93.9%) | 32 (6.1%) |
| Material Moving | 86 (50.9%) | 83 (49.1%) |
| Total (Category) | 860 (74.1%) | 301 (25.9%) |
| Total (Overall) | 8,415 (53.4%) | 7,353 (46.6%) |
Employment Industries by Sex in Lake Magdalene
Employment Industries in Lake Magdalene
The major employment industries in Lake Magdalene include Health Care & Social Assistance (2,138 | 13.6%), Retail Trade (2,119 | 13.4%), Professional & Scientific (1,888 | 12.0%), Educational Services (1,541 | 9.8%), and Accommodation & Food Services (1,263 | 8.0%).
Employment Industries by Sex in Lake Magdalene
The Lake Magdalene industries that see more men than women are Agriculture, Fishing & Hunting (93.2%), Construction (90.8%), and Utilities (90.1%), whereas the industries that tend to have a higher number of women are Health Care & Social Assistance (73.3%), Educational Services (68.2%), and Enterprise Management (63.8%).
| Industry | Male | Female |
| Agriculture, Fishing & Hunting | 109 (93.2%) | 8 (6.8%) |
| Mining, Quarrying, & Extraction | 0 (0.0%) | 0 (0.0%) |
| Construction | 974 (90.8%) | 99 (9.2%) |
| Manufacturing | 271 (51.1%) | 259 (48.9%) |
| Wholesale Trade | 257 (58.0%) | 186 (42.0%) |
| Retail Trade | 1,130 (53.3%) | 989 (46.7%) |
| Transportation & Warehousing | 575 (77.9%) | 163 (22.1%) |
| Utilities | 91 (90.1%) | 10 (9.9%) |
| Information | 130 (47.6%) | 143 (52.4%) |
| Finance & Insurance | 436 (46.3%) | 506 (53.7%) |
| Real Estate, Rental & Leasing | 185 (68.5%) | 85 (31.5%) |
| Professional & Scientific | 1,202 (63.7%) | 686 (36.3%) |
| Enterprise Management | 34 (36.2%) | 60 (63.8%) |
| Administrative & Support | 571 (65.9%) | 295 (34.1%) |
| Educational Services | 490 (31.8%) | 1,051 (68.2%) |
| Health Care & Social Assistance | 572 (26.8%) | 1,566 (73.3%) |
| Arts, Entertainment & Recreation | 128 (48.5%) | 136 (51.5%) |
| Accommodation & Food Services | 740 (58.6%) | 523 (41.4%) |
| Public Administration | 195 (61.5%) | 122 (38.5%) |
| Total | 8,415 (53.4%) | 7,353 (46.6%) |
Education in Lake Magdalene
School Enrollment in Lake Magdalene
The most common levels of schooling among the 5,583 students in Lake Magdalene are middle school (1,409 | 25.2%), college / undergraduate (1,194 | 21.4%), and high school (1,072 | 19.2%).
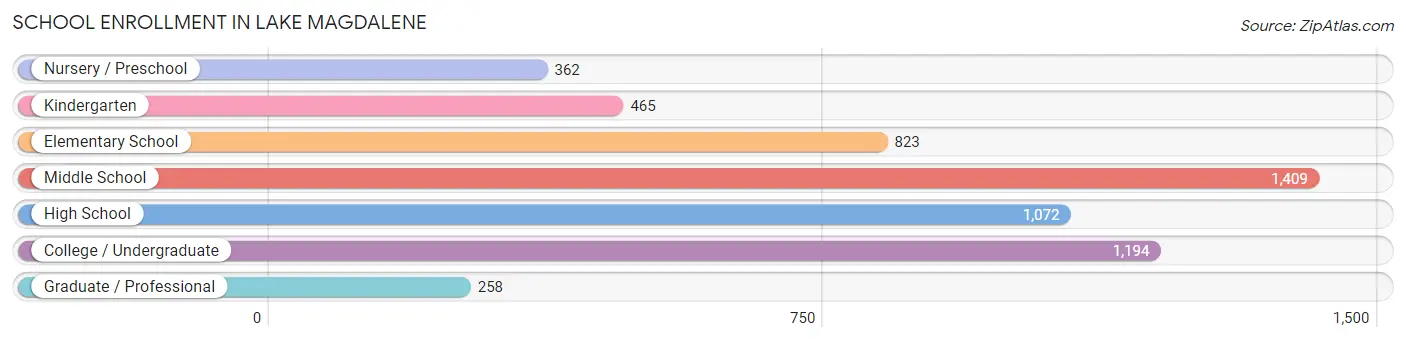
| School Level | # Students | % Students |
| Nursery / Preschool | 362 | 6.5% |
| Kindergarten | 465 | 8.3% |
| Elementary School | 823 | 14.7% |
| Middle School | 1,409 | 25.2% |
| High School | 1,072 | 19.2% |
| College / Undergraduate | 1,194 | 21.4% |
| Graduate / Professional | 258 | 4.6% |
| Total | 5,583 | 100.0% |
School Enrollment by Age by Funding Source in Lake Magdalene
Out of a total of 5,583 students who are enrolled in schools in Lake Magdalene, 1,184 (21.2%) attend a private institution, while the remaining 4,399 (78.8%) are enrolled in public schools. The age group of 35 years and over has the highest likelihood of being enrolled in private schools, with 93 (40.8% in the age bracket) enrolled. Conversely, the age group of 20 to 24 year olds has the lowest likelihood of being enrolled in a private school, with 630 (92.4% in the age bracket) attending a public institution.
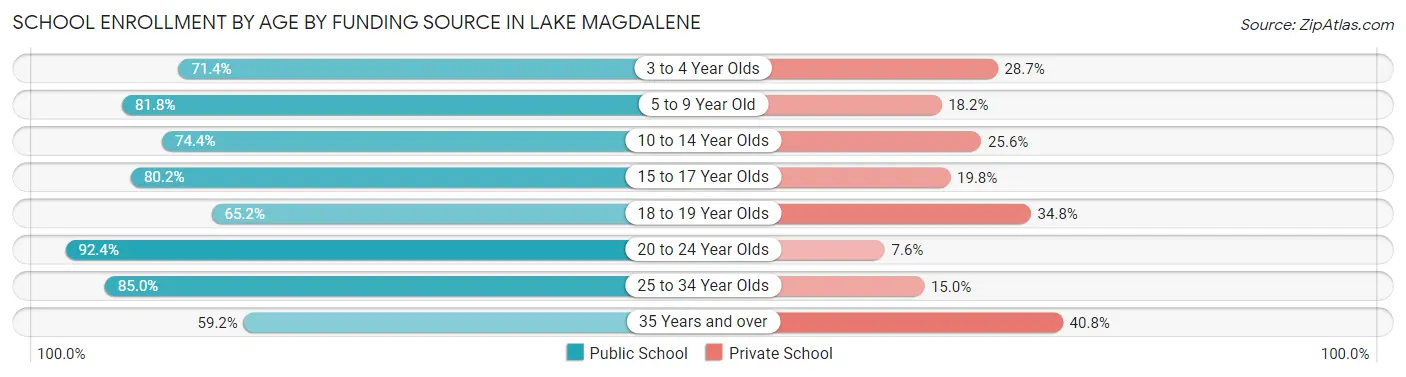
| Age Bracket | Public School | Private School |
| 3 to 4 Year Olds | 122 (71.4%) | 49 (28.6%) |
| 5 to 9 Year Old | 1,108 (81.8%) | 246 (18.2%) |
| 10 to 14 Year Olds | 1,246 (74.4%) | 429 (25.6%) |
| 15 to 17 Year Olds | 627 (80.2%) | 155 (19.8%) |
| 18 to 19 Year Olds | 189 (65.2%) | 101 (34.8%) |
| 20 to 24 Year Olds | 630 (92.4%) | 52 (7.6%) |
| 25 to 34 Year Olds | 341 (85.0%) | 60 (15.0%) |
| 35 Years and over | 135 (59.2%) | 93 (40.8%) |
| Total | 4,399 (78.8%) | 1,184 (21.2%) |
Educational Attainment by Field of Study in Lake Magdalene
Business (2,153 | 23.5%), education (1,188 | 13.0%), science & technology (1,179 | 12.9%), social sciences (595 | 6.5%), and psychology (572 | 6.2%) are the most common fields of study among 9,177 individuals in Lake Magdalene who have obtained a bachelor's degree or higher.
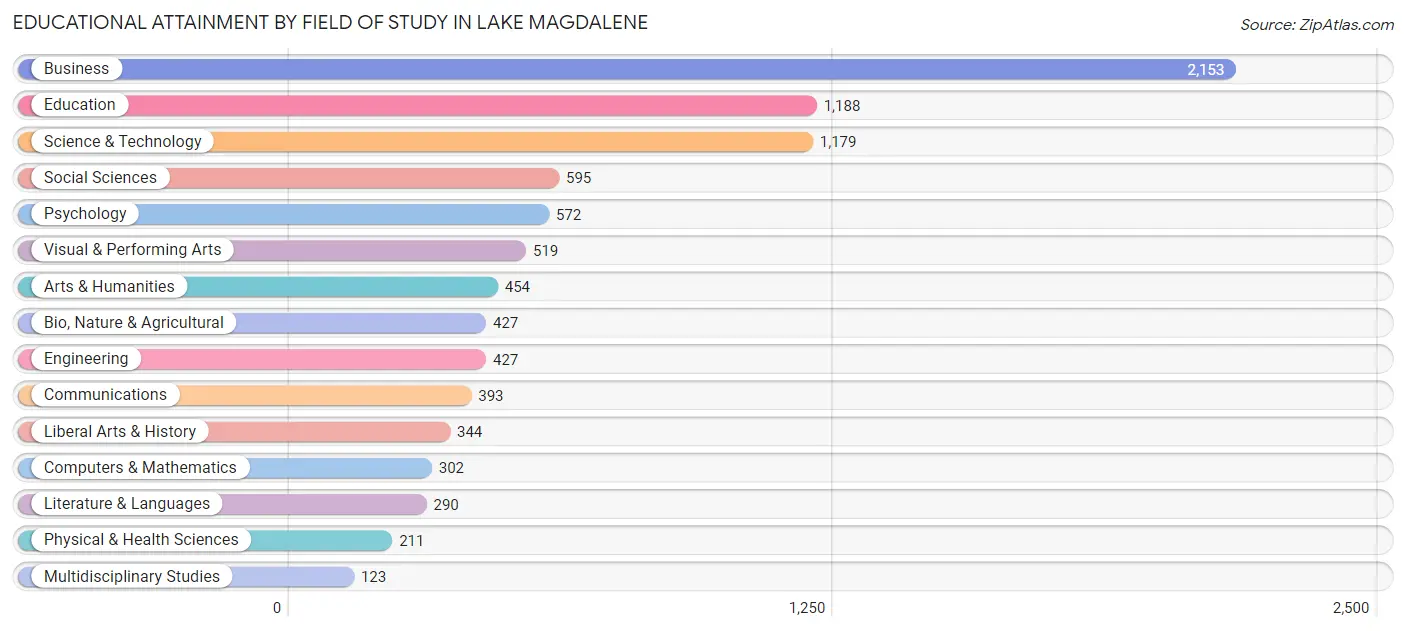
| Field of Study | # Graduates | % Graduates |
| Computers & Mathematics | 302 | 3.3% |
| Bio, Nature & Agricultural | 427 | 4.6% |
| Physical & Health Sciences | 211 | 2.3% |
| Psychology | 572 | 6.2% |
| Social Sciences | 595 | 6.5% |
| Engineering | 427 | 4.6% |
| Multidisciplinary Studies | 123 | 1.3% |
| Science & Technology | 1,179 | 12.9% |
| Business | 2,153 | 23.5% |
| Education | 1,188 | 13.0% |
| Literature & Languages | 290 | 3.2% |
| Liberal Arts & History | 344 | 3.7% |
| Visual & Performing Arts | 519 | 5.7% |
| Communications | 393 | 4.3% |
| Arts & Humanities | 454 | 5.0% |
| Total | 9,177 | 100.0% |
Transportation & Commute in Lake Magdalene
Vehicle Availability by Sex in Lake Magdalene
The most prevalent vehicle ownership categories in Lake Magdalene are males with 2 vehicles (4,308, accounting for 51.8%) and females with 2 vehicles (3,391, making up 60.2%).
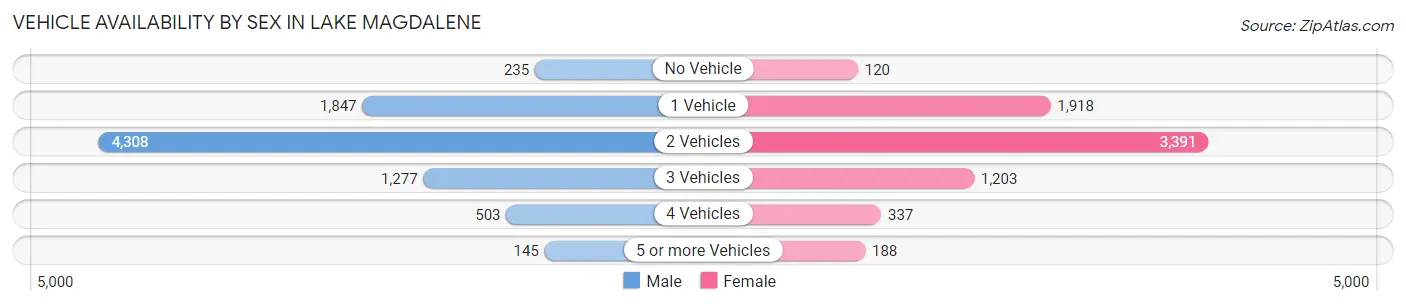
| Vehicles Available | Male | Female |
| No Vehicle | 235 (2.8%) | 120 (1.7%) |
| 1 Vehicle | 1,847 (22.2%) | 1,918 (26.8%) |
| 2 Vehicles | 4,308 (51.8%) | 3,391 (47.4%) |
| 3 Vehicles | 1,277 (15.4%) | 1,203 (16.8%) |
| 4 Vehicles | 503 (6.0%) | 337 (4.7%) |
| 5 or more Vehicles | 145 (1.7%) | 188 (2.6%) |
| Total | 8,315 (100.0%) | 7,157 (100.0%) |
Commute Time in Lake Magdalene
The most frequently occuring commute durations in Lake Magdalene are 30 to 34 minutes (2,592 commuters, 19.5%), 20 to 24 minutes (2,253 commuters, 16.9%), and 15 to 19 minutes (1,610 commuters, 12.1%).
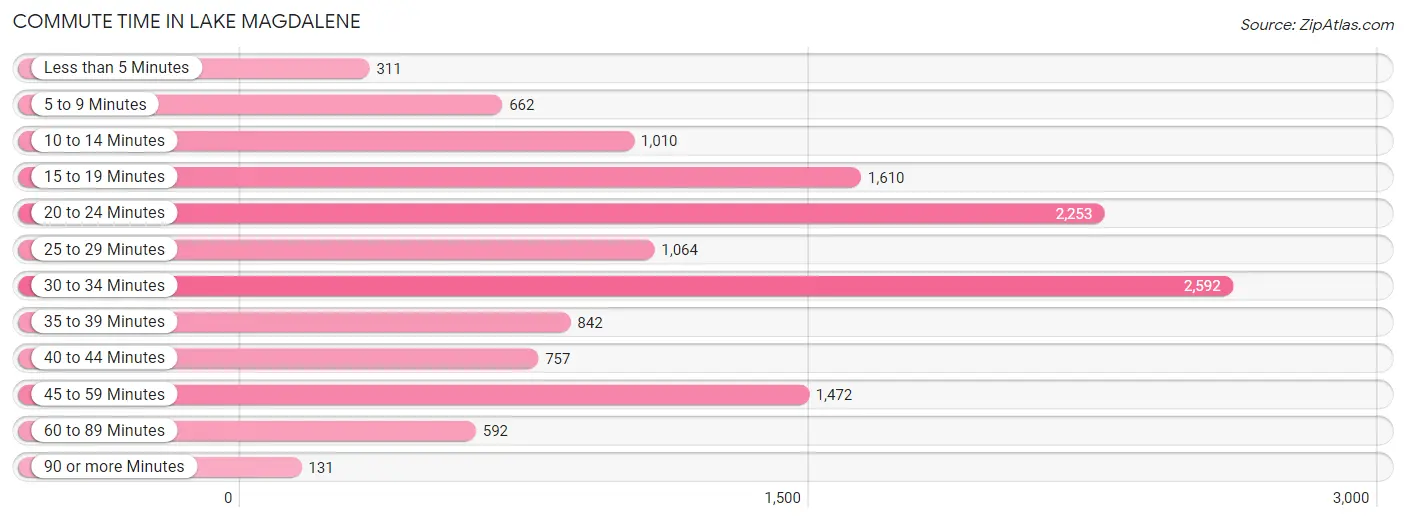
| Commute Time | # Commuters | % Commuters |
| Less than 5 Minutes | 311 | 2.3% |
| 5 to 9 Minutes | 662 | 5.0% |
| 10 to 14 Minutes | 1,010 | 7.6% |
| 15 to 19 Minutes | 1,610 | 12.1% |
| 20 to 24 Minutes | 2,253 | 16.9% |
| 25 to 29 Minutes | 1,064 | 8.0% |
| 30 to 34 Minutes | 2,592 | 19.5% |
| 35 to 39 Minutes | 842 | 6.3% |
| 40 to 44 Minutes | 757 | 5.7% |
| 45 to 59 Minutes | 1,472 | 11.1% |
| 60 to 89 Minutes | 592 | 4.4% |
| 90 or more Minutes | 131 | 1.0% |
Commute Time by Sex in Lake Magdalene
The most common commute times in Lake Magdalene are 30 to 34 minutes (1,438 commuters, 20.3%) for males and 30 to 34 minutes (1,154 commuters, 18.6%) for females.
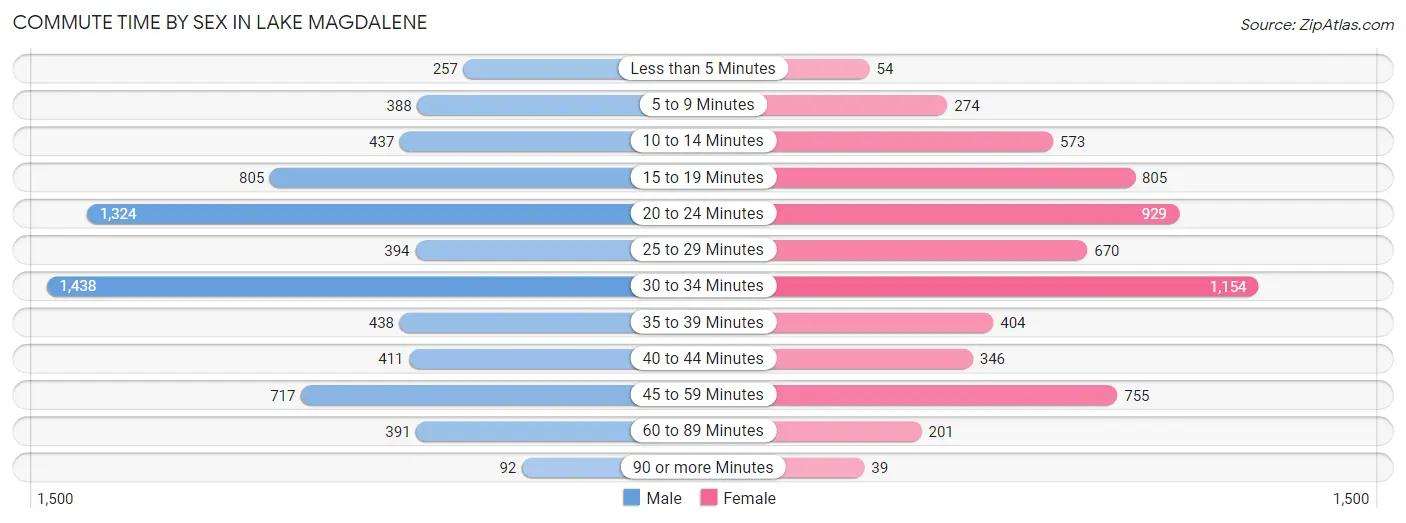
| Commute Time | Male | Female |
| Less than 5 Minutes | 257 (3.6%) | 54 (0.9%) |
| 5 to 9 Minutes | 388 (5.5%) | 274 (4.4%) |
| 10 to 14 Minutes | 437 (6.2%) | 573 (9.2%) |
| 15 to 19 Minutes | 805 (11.4%) | 805 (13.0%) |
| 20 to 24 Minutes | 1,324 (18.7%) | 929 (15.0%) |
| 25 to 29 Minutes | 394 (5.6%) | 670 (10.8%) |
| 30 to 34 Minutes | 1,438 (20.3%) | 1,154 (18.6%) |
| 35 to 39 Minutes | 438 (6.2%) | 404 (6.5%) |
| 40 to 44 Minutes | 411 (5.8%) | 346 (5.6%) |
| 45 to 59 Minutes | 717 (10.1%) | 755 (12.2%) |
| 60 to 89 Minutes | 391 (5.5%) | 201 (3.2%) |
| 90 or more Minutes | 92 (1.3%) | 39 (0.6%) |
Time of Departure to Work by Sex in Lake Magdalene
The most frequent times of departure to work in Lake Magdalene are 8:00 AM to 8:29 AM (1,240, 17.5%) for males and 7:30 AM to 7:59 AM (1,214, 19.6%) for females.
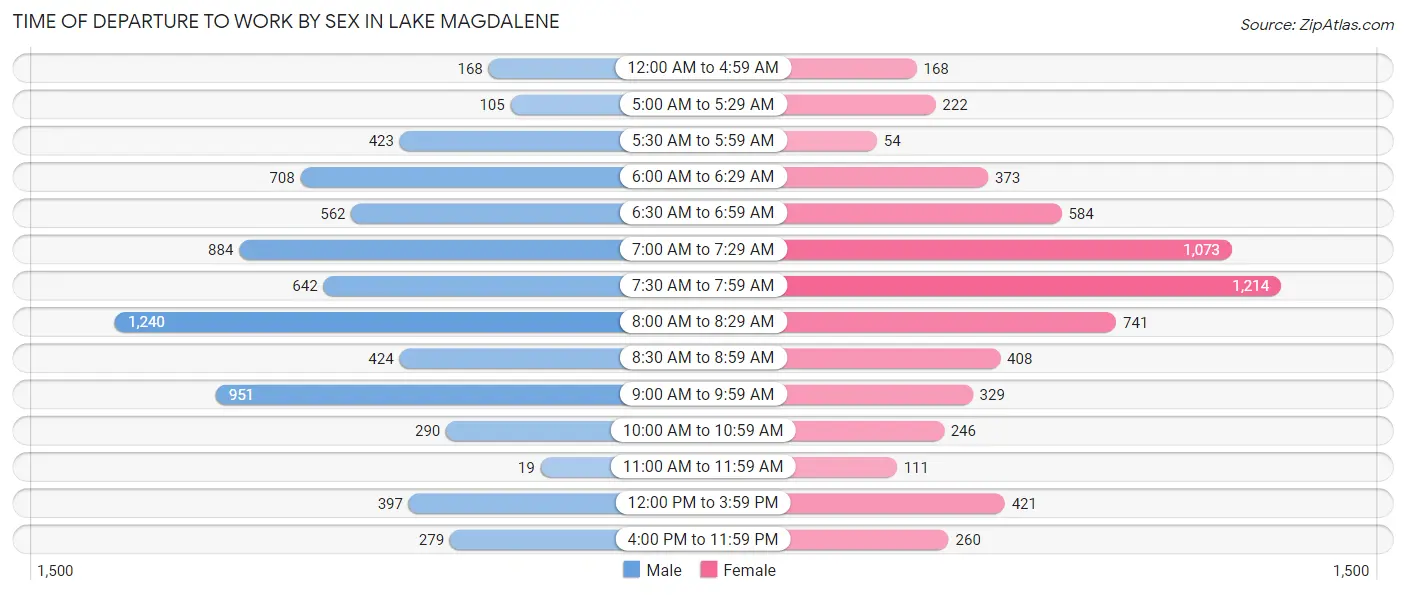
| Time of Departure | Male | Female |
| 12:00 AM to 4:59 AM | 168 (2.4%) | 168 (2.7%) |
| 5:00 AM to 5:29 AM | 105 (1.5%) | 222 (3.6%) |
| 5:30 AM to 5:59 AM | 423 (6.0%) | 54 (0.9%) |
| 6:00 AM to 6:29 AM | 708 (10.0%) | 373 (6.0%) |
| 6:30 AM to 6:59 AM | 562 (7.9%) | 584 (9.4%) |
| 7:00 AM to 7:29 AM | 884 (12.5%) | 1,073 (17.3%) |
| 7:30 AM to 7:59 AM | 642 (9.0%) | 1,214 (19.6%) |
| 8:00 AM to 8:29 AM | 1,240 (17.5%) | 741 (11.9%) |
| 8:30 AM to 8:59 AM | 424 (6.0%) | 408 (6.6%) |
| 9:00 AM to 9:59 AM | 951 (13.4%) | 329 (5.3%) |
| 10:00 AM to 10:59 AM | 290 (4.1%) | 246 (4.0%) |
| 11:00 AM to 11:59 AM | 19 (0.3%) | 111 (1.8%) |
| 12:00 PM to 3:59 PM | 397 (5.6%) | 421 (6.8%) |
| 4:00 PM to 11:59 PM | 279 (3.9%) | 260 (4.2%) |
| Total | 7,092 (100.0%) | 6,204 (100.0%) |
Housing Occupancy in Lake Magdalene
Occupancy by Ownership in Lake Magdalene
Of the total 12,868 dwellings in Lake Magdalene, owner-occupied units account for 9,117 (70.9%), while renter-occupied units make up 3,751 (29.1%).
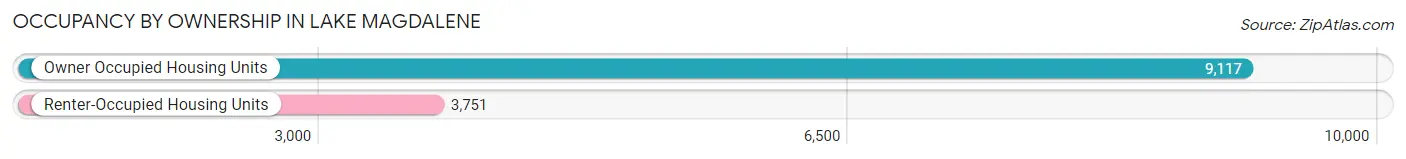
| Occupancy | # Housing Units | % Housing Units |
| Owner Occupied Housing Units | 9,117 | 70.9% |
| Renter-Occupied Housing Units | 3,751 | 29.1% |
| Total Occupied Housing Units | 12,868 | 100.0% |
Occupancy by Household Size in Lake Magdalene
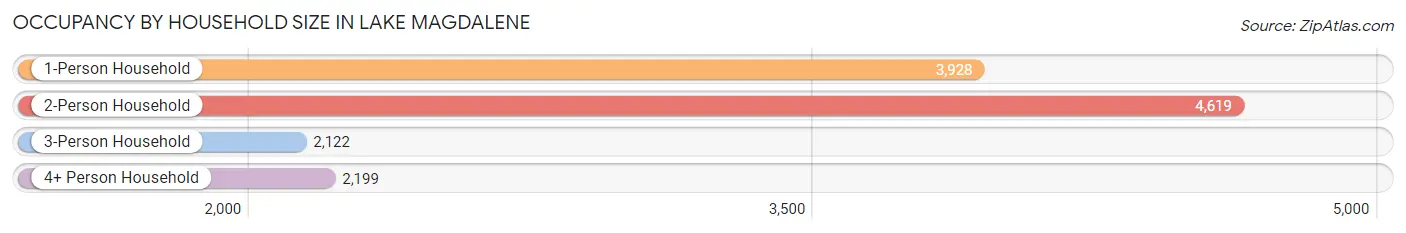
| Household Size | # Housing Units | % Housing Units |
| 1-Person Household | 3,928 | 30.5% |
| 2-Person Household | 4,619 | 35.9% |
| 3-Person Household | 2,122 | 16.5% |
| 4+ Person Household | 2,199 | 17.1% |
| Total Housing Units | 12,868 | 100.0% |
Occupancy by Ownership by Household Size in Lake Magdalene
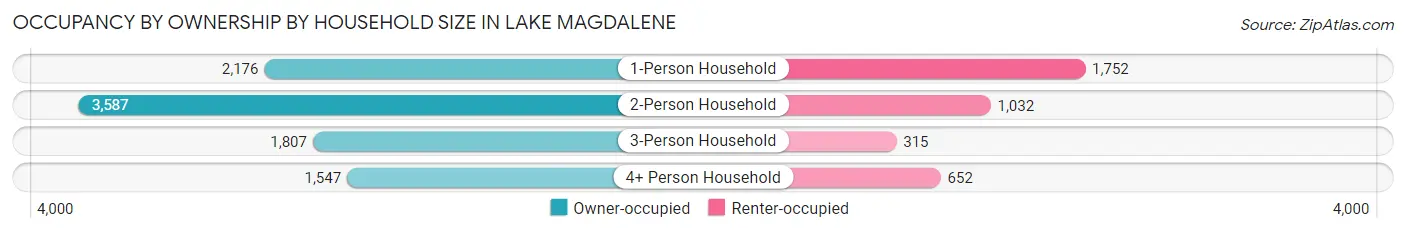
| Household Size | Owner-occupied | Renter-occupied |
| 1-Person Household | 2,176 (55.4%) | 1,752 (44.6%) |
| 2-Person Household | 3,587 (77.7%) | 1,032 (22.3%) |
| 3-Person Household | 1,807 (85.2%) | 315 (14.8%) |
| 4+ Person Household | 1,547 (70.4%) | 652 (29.6%) |
| Total Housing Units | 9,117 (70.9%) | 3,751 (29.1%) |
Occupancy by Educational Attainment in Lake Magdalene
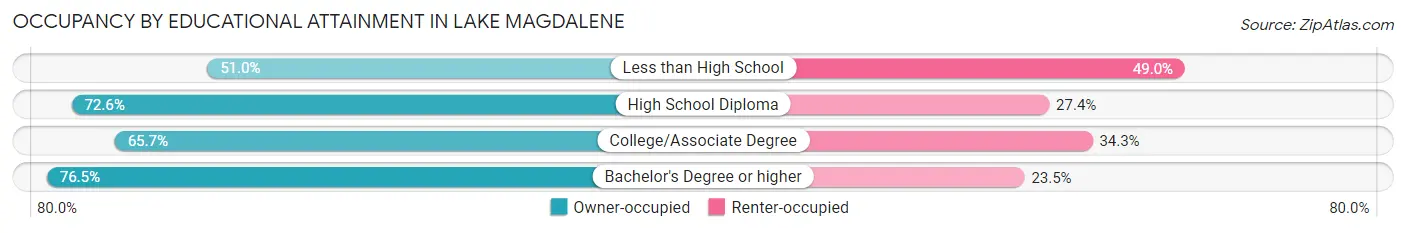
| Household Size | Owner-occupied | Renter-occupied |
| Less than High School | 371 (51.0%) | 356 (49.0%) |
| High School Diploma | 1,978 (72.6%) | 748 (27.4%) |
| College/Associate Degree | 2,636 (65.7%) | 1,376 (34.3%) |
| Bachelor's Degree or higher | 4,132 (76.5%) | 1,271 (23.5%) |
Occupancy by Age of Householder in Lake Magdalene
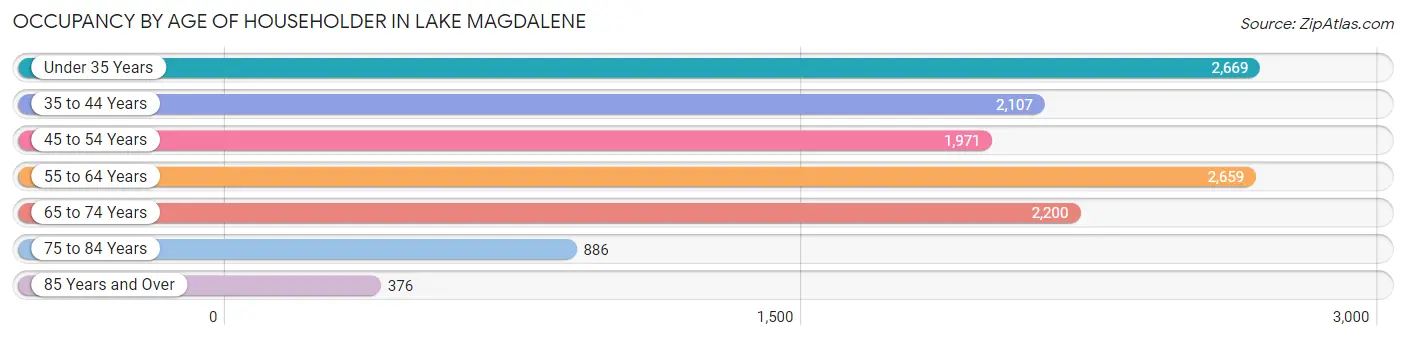
| Age Bracket | # Households | % Households |
| Under 35 Years | 2,669 | 20.7% |
| 35 to 44 Years | 2,107 | 16.4% |
| 45 to 54 Years | 1,971 | 15.3% |
| 55 to 64 Years | 2,659 | 20.7% |
| 65 to 74 Years | 2,200 | 17.1% |
| 75 to 84 Years | 886 | 6.9% |
| 85 Years and Over | 376 | 2.9% |
| Total | 12,868 | 100.0% |
Housing Finances in Lake Magdalene
Median Income by Occupancy in Lake Magdalene
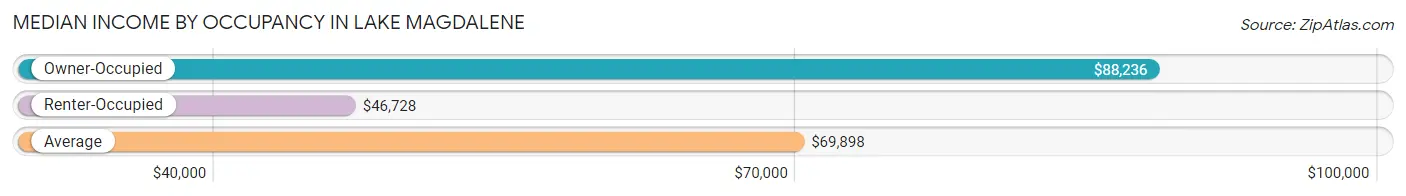
| Occupancy Type | # Households | Median Income |
| Owner-Occupied | 9,117 (70.9%) | $88,236 |
| Renter-Occupied | 3,751 (29.1%) | $46,728 |
| Average | 12,868 (100.0%) | $69,898 |
Occupancy by Householder Income Bracket in Lake Magdalene
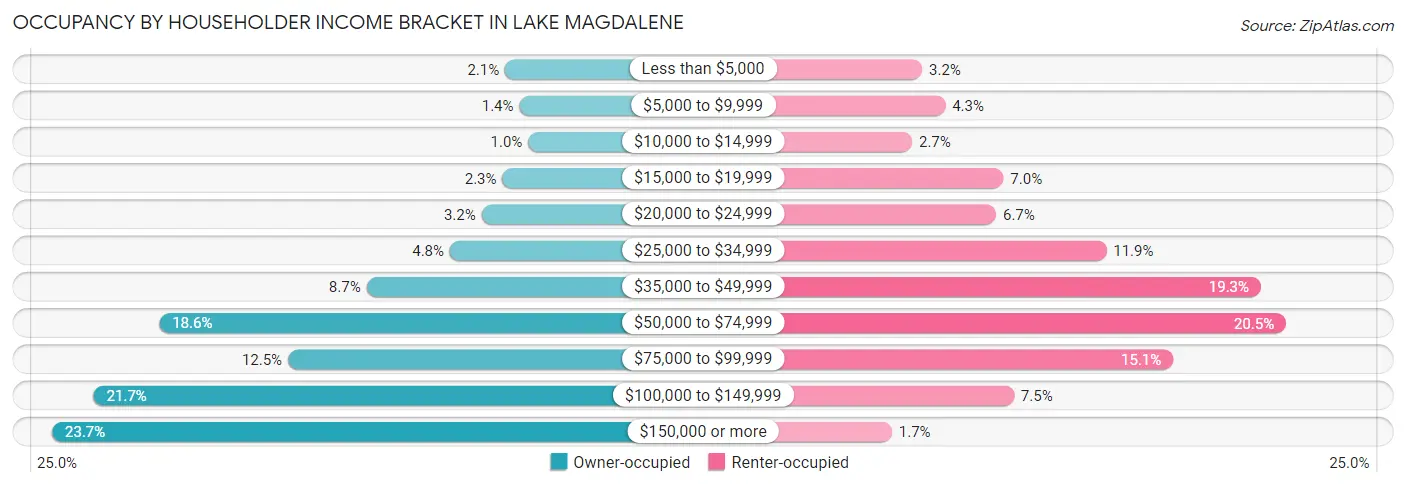
| Income Bracket | Owner-occupied | Renter-occupied |
| Less than $5,000 | 193 (2.1%) | 119 (3.2%) |
| $5,000 to $9,999 | 131 (1.4%) | 160 (4.3%) |
| $10,000 to $14,999 | 93 (1.0%) | 101 (2.7%) |
| $15,000 to $19,999 | 205 (2.2%) | 264 (7.0%) |
| $20,000 to $24,999 | 295 (3.2%) | 251 (6.7%) |
| $25,000 to $34,999 | 433 (4.8%) | 448 (11.9%) |
| $35,000 to $49,999 | 795 (8.7%) | 724 (19.3%) |
| $50,000 to $74,999 | 1,695 (18.6%) | 769 (20.5%) |
| $75,000 to $99,999 | 1,136 (12.5%) | 567 (15.1%) |
| $100,000 to $149,999 | 1,980 (21.7%) | 283 (7.5%) |
| $150,000 or more | 2,161 (23.7%) | 65 (1.7%) |
| Total | 9,117 (100.0%) | 3,751 (100.0%) |
Monthly Housing Cost Tiers in Lake Magdalene
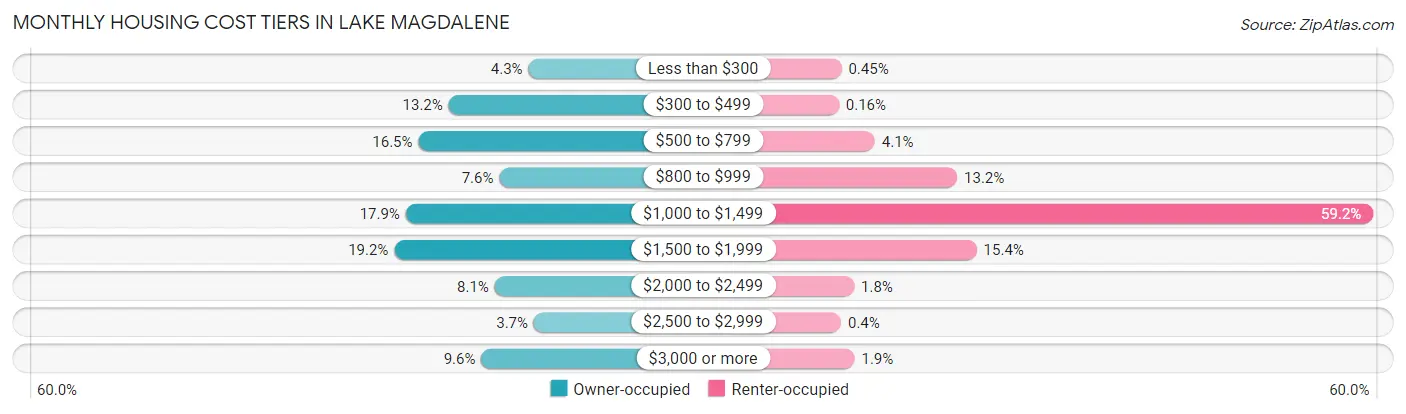
| Monthly Cost | Owner-occupied | Renter-occupied |
| Less than $300 | 396 (4.3%) | 17 (0.4%) |
| $300 to $499 | 1,200 (13.2%) | 6 (0.2%) |
| $500 to $799 | 1,504 (16.5%) | 155 (4.1%) |
| $800 to $999 | 689 (7.6%) | 496 (13.2%) |
| $1,000 to $1,499 | 1,632 (17.9%) | 2,220 (59.2%) |
| $1,500 to $1,999 | 1,748 (19.2%) | 577 (15.4%) |
| $2,000 to $2,499 | 736 (8.1%) | 69 (1.8%) |
| $2,500 to $2,999 | 341 (3.7%) | 15 (0.4%) |
| $3,000 or more | 871 (9.6%) | 71 (1.9%) |
| Total | 9,117 (100.0%) | 3,751 (100.0%) |
Physical Housing Characteristics in Lake Magdalene
Housing Structures in Lake Magdalene
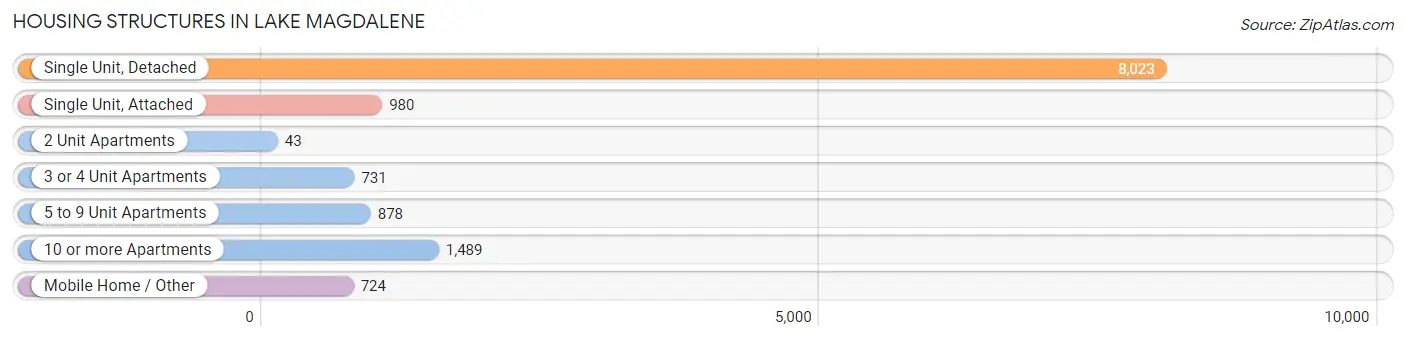
| Structure Type | # Housing Units | % Housing Units |
| Single Unit, Detached | 8,023 | 62.4% |
| Single Unit, Attached | 980 | 7.6% |
| 2 Unit Apartments | 43 | 0.3% |
| 3 or 4 Unit Apartments | 731 | 5.7% |
| 5 to 9 Unit Apartments | 878 | 6.8% |
| 10 or more Apartments | 1,489 | 11.6% |
| Mobile Home / Other | 724 | 5.6% |
| Total | 12,868 | 100.0% |
Housing Structures by Occupancy in Lake Magdalene
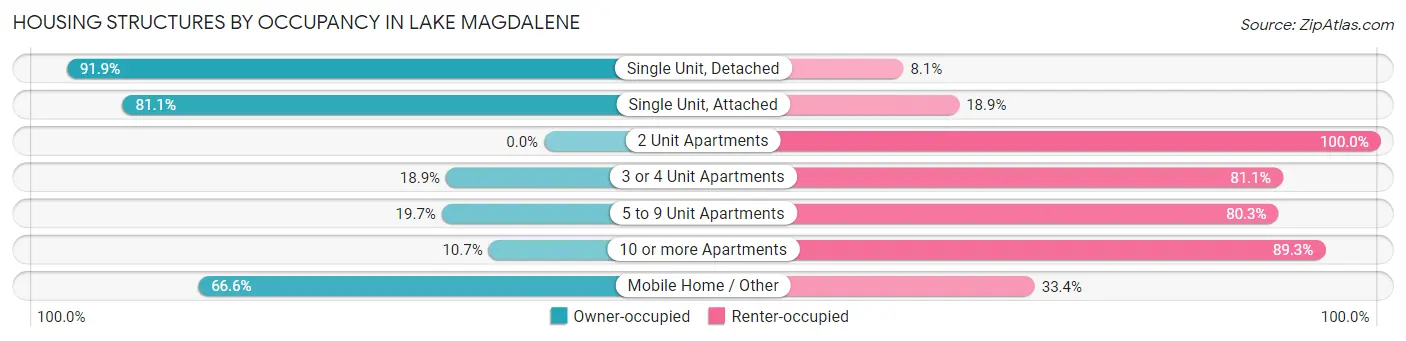
| Structure Type | Owner-occupied | Renter-occupied |
| Single Unit, Detached | 7,370 (91.9%) | 653 (8.1%) |
| Single Unit, Attached | 795 (81.1%) | 185 (18.9%) |
| 2 Unit Apartments | 0 (0.0%) | 43 (100.0%) |
| 3 or 4 Unit Apartments | 138 (18.9%) | 593 (81.1%) |
| 5 to 9 Unit Apartments | 173 (19.7%) | 705 (80.3%) |
| 10 or more Apartments | 159 (10.7%) | 1,330 (89.3%) |
| Mobile Home / Other | 482 (66.6%) | 242 (33.4%) |
| Total | 9,117 (70.9%) | 3,751 (29.1%) |
Housing Structures by Number of Rooms in Lake Magdalene
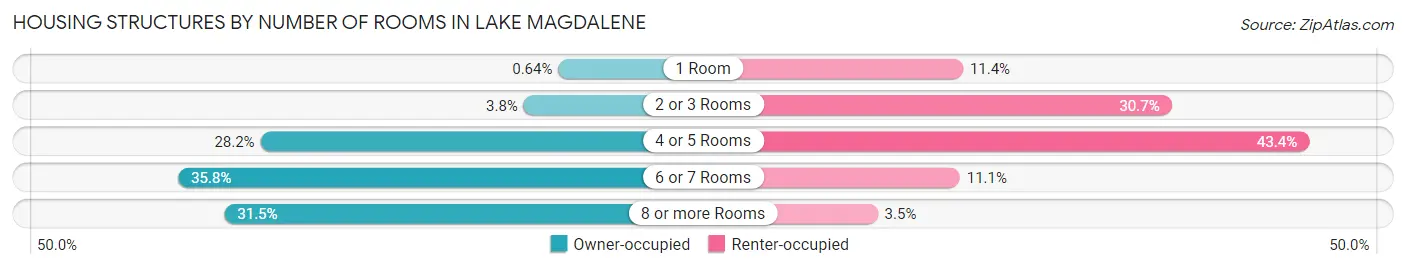
| Number of Rooms | Owner-occupied | Renter-occupied |
| 1 Room | 58 (0.6%) | 427 (11.4%) |
| 2 or 3 Rooms | 350 (3.8%) | 1,150 (30.7%) |
| 4 or 5 Rooms | 2,570 (28.2%) | 1,627 (43.4%) |
| 6 or 7 Rooms | 3,265 (35.8%) | 416 (11.1%) |
| 8 or more Rooms | 2,874 (31.5%) | 131 (3.5%) |
| Total | 9,117 (100.0%) | 3,751 (100.0%) |
Housing Structure by Heating Type in Lake Magdalene
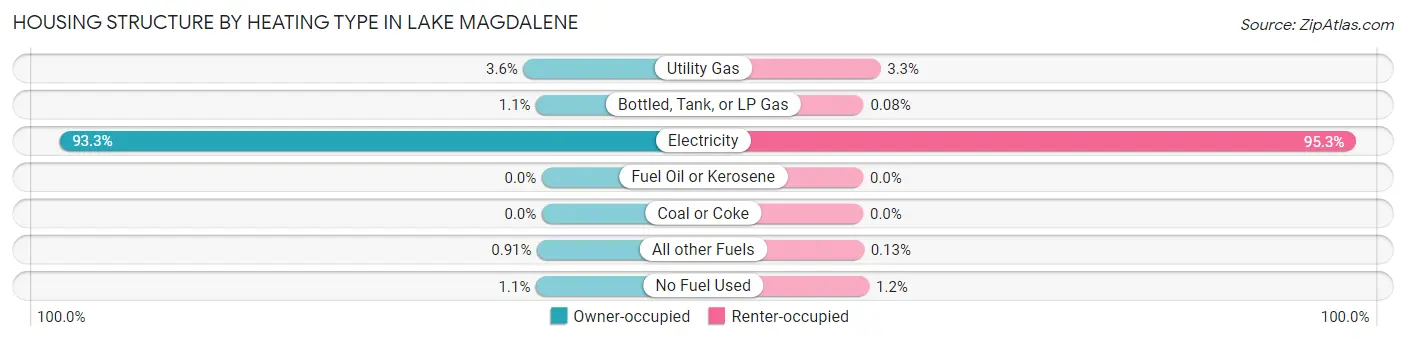
| Heating Type | Owner-occupied | Renter-occupied |
| Utility Gas | 325 (3.6%) | 125 (3.3%) |
| Bottled, Tank, or LP Gas | 100 (1.1%) | 3 (0.1%) |
| Electricity | 8,506 (93.3%) | 3,574 (95.3%) |
| Fuel Oil or Kerosene | 0 (0.0%) | 0 (0.0%) |
| Coal or Coke | 0 (0.0%) | 0 (0.0%) |
| All other Fuels | 83 (0.9%) | 5 (0.1%) |
| No Fuel Used | 103 (1.1%) | 44 (1.2%) |
| Total | 9,117 (100.0%) | 3,751 (100.0%) |
Household Vehicle Usage in Lake Magdalene
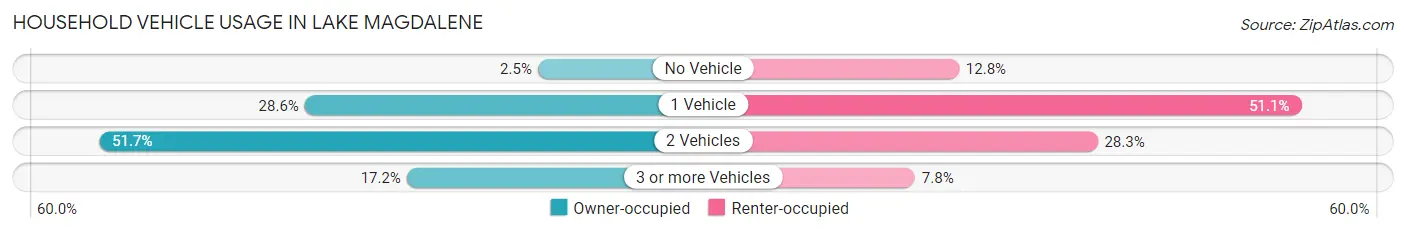
| Vehicles per Household | Owner-occupied | Renter-occupied |
| No Vehicle | 230 (2.5%) | 479 (12.8%) |
| 1 Vehicle | 2,610 (28.6%) | 1,917 (51.1%) |
| 2 Vehicles | 4,709 (51.6%) | 1,061 (28.3%) |
| 3 or more Vehicles | 1,568 (17.2%) | 294 (7.8%) |
| Total | 9,117 (100.0%) | 3,751 (100.0%) |
Real Estate & Mortgages in Lake Magdalene
Real Estate and Mortgage Overview in Lake Magdalene
| Characteristic | Without Mortgage | With Mortgage |
| Housing Units | 3,782 | 5,335 |
| Median Property Value | $283,800 | $326,100 |
| Median Household Income | $71,667 | $1,396 |
| Monthly Housing Costs | $578 | $769 |
| Real Estate Taxes | $2,168 | $134 |
Property Value by Mortgage Status in Lake Magdalene
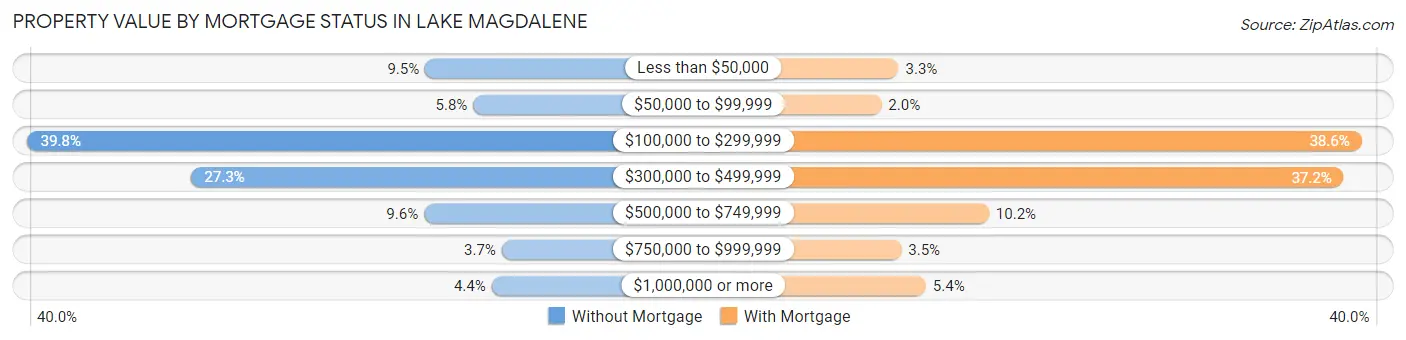
| Property Value | Without Mortgage | With Mortgage |
| Less than $50,000 | 359 (9.5%) | 175 (3.3%) |
| $50,000 to $99,999 | 220 (5.8%) | 105 (2.0%) |
| $100,000 to $299,999 | 1,504 (39.8%) | 2,057 (38.6%) |
| $300,000 to $499,999 | 1,032 (27.3%) | 1,984 (37.2%) |
| $500,000 to $749,999 | 362 (9.6%) | 542 (10.2%) |
| $750,000 to $999,999 | 138 (3.6%) | 186 (3.5%) |
| $1,000,000 or more | 167 (4.4%) | 286 (5.4%) |
| Total | 3,782 (100.0%) | 5,335 (100.0%) |
Household Income by Mortgage Status in Lake Magdalene
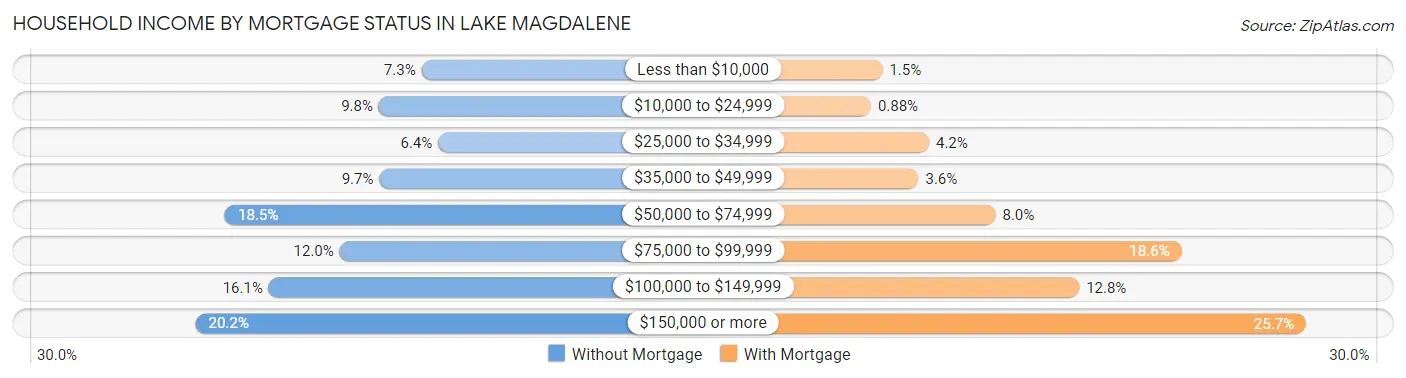
| Household Income | Without Mortgage | With Mortgage |
| Less than $10,000 | 277 (7.3%) | 82 (1.5%) |
| $10,000 to $24,999 | 369 (9.8%) | 47 (0.9%) |
| $25,000 to $34,999 | 241 (6.4%) | 224 (4.2%) |
| $35,000 to $49,999 | 368 (9.7%) | 192 (3.6%) |
| $50,000 to $74,999 | 701 (18.5%) | 427 (8.0%) |
| $75,000 to $99,999 | 454 (12.0%) | 994 (18.6%) |
| $100,000 to $149,999 | 607 (16.1%) | 682 (12.8%) |
| $150,000 or more | 765 (20.2%) | 1,373 (25.7%) |
| Total | 3,782 (100.0%) | 5,335 (100.0%) |
Property Value to Household Income Ratio in Lake Magdalene
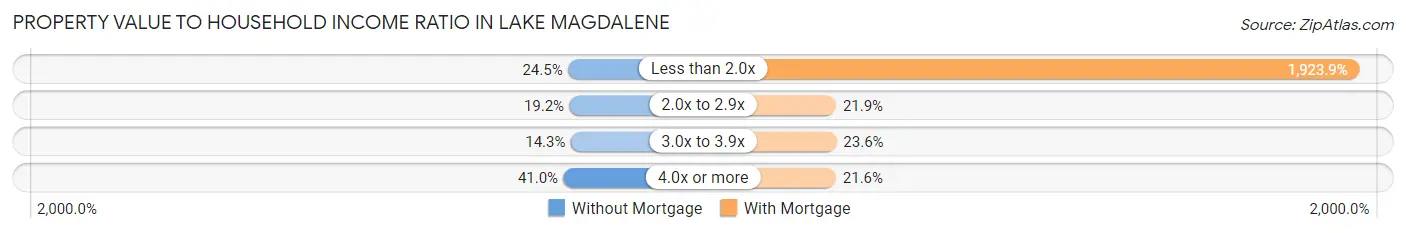
| Value-to-Income Ratio | Without Mortgage | With Mortgage |
| Less than 2.0x | 925 (24.5%) | 102,638 (1,923.9%) |
| 2.0x to 2.9x | 725 (19.2%) | 1,169 (21.9%) |
| 3.0x to 3.9x | 541 (14.3%) | 1,260 (23.6%) |
| 4.0x or more | 1,549 (41.0%) | 1,152 (21.6%) |
| Total | 3,782 (100.0%) | 5,335 (100.0%) |
Real Estate Taxes by Mortgage Status in Lake Magdalene
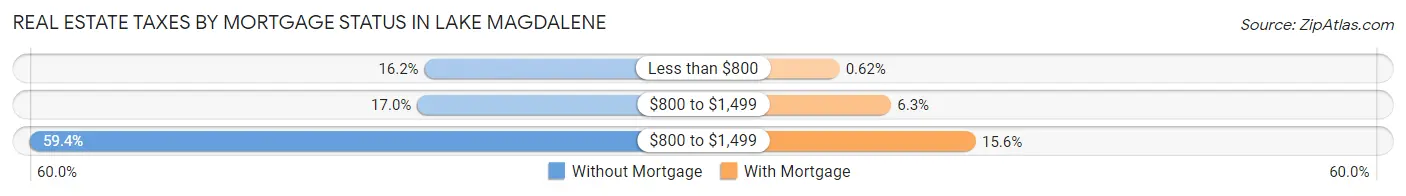
| Property Taxes | Without Mortgage | With Mortgage |
| Less than $800 | 612 (16.2%) | 33 (0.6%) |
| $800 to $1,499 | 642 (17.0%) | 335 (6.3%) |
| $800 to $1,499 | 2,247 (59.4%) | 830 (15.6%) |
| Total | 3,782 (100.0%) | 5,335 (100.0%) |
Health & Disability in Lake Magdalene
Health Insurance Coverage by Age in Lake Magdalene
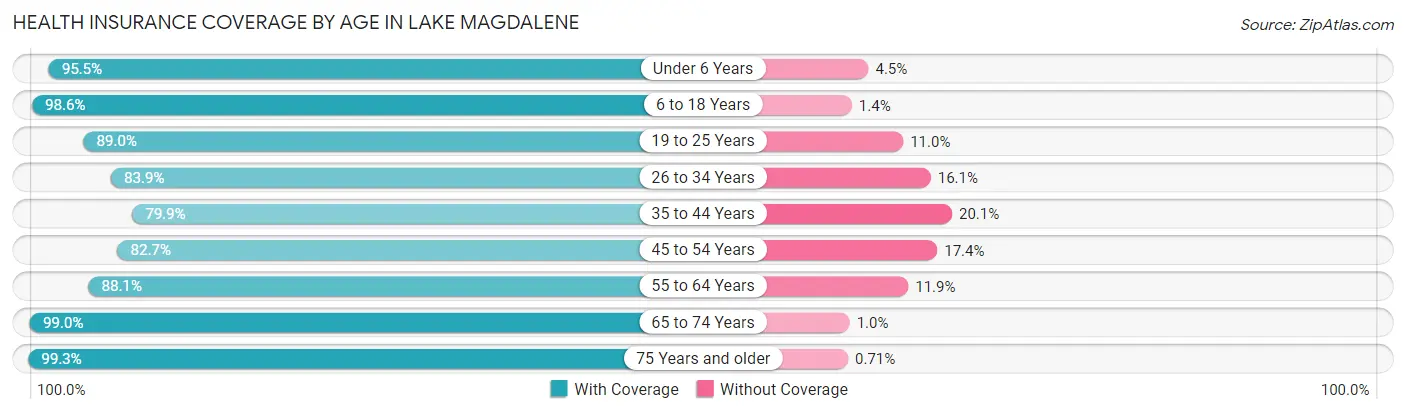
| Age Bracket | With Coverage | Without Coverage |
| Under 6 Years | 2,723 (95.5%) | 129 (4.5%) |
| 6 to 18 Years | 3,885 (98.6%) | 56 (1.4%) |
| 19 to 25 Years | 1,798 (89.0%) | 222 (11.0%) |
| 26 to 34 Years | 3,613 (83.9%) | 695 (16.1%) |
| 35 to 44 Years | 3,139 (79.9%) | 789 (20.1%) |
| 45 to 54 Years | 3,045 (82.7%) | 639 (17.3%) |
| 55 to 64 Years | 3,873 (88.1%) | 525 (11.9%) |
| 65 to 74 Years | 3,632 (99.0%) | 37 (1.0%) |
| 75 Years and older | 2,235 (99.3%) | 16 (0.7%) |
| Total | 27,943 (90.0%) | 3,108 (10.0%) |
Health Insurance Coverage by Citizenship Status in Lake Magdalene
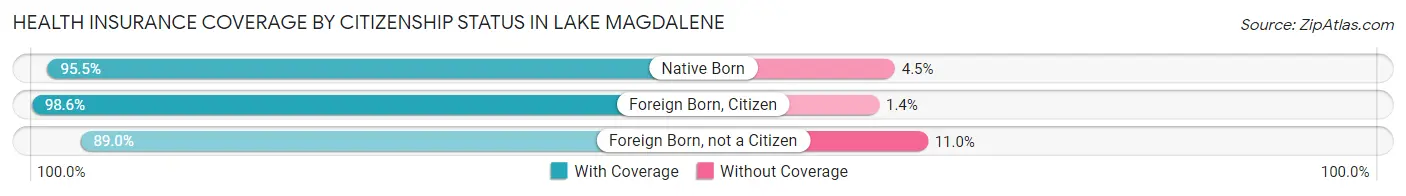
| Citizenship Status | With Coverage | Without Coverage |
| Native Born | 2,723 (95.5%) | 129 (4.5%) |
| Foreign Born, Citizen | 3,885 (98.6%) | 56 (1.4%) |
| Foreign Born, not a Citizen | 1,798 (89.0%) | 222 (11.0%) |
Health Insurance Coverage by Household Income in Lake Magdalene
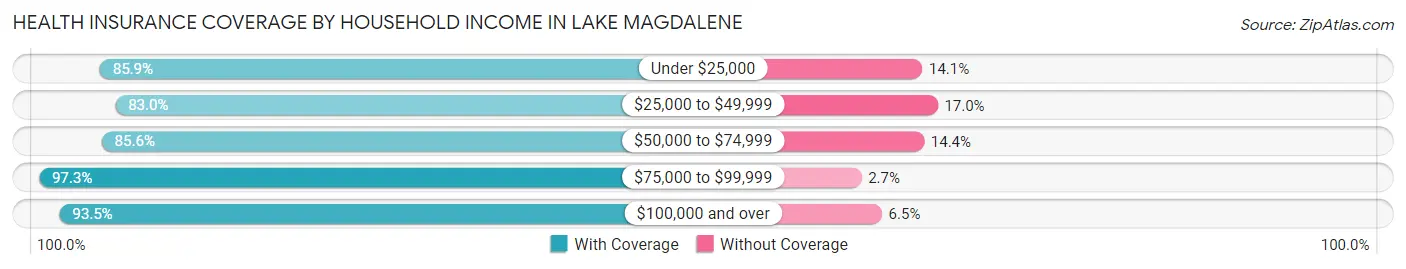
| Household Income | With Coverage | Without Coverage |
| Under $25,000 | 2,949 (85.9%) | 484 (14.1%) |
| $25,000 to $49,999 | 3,834 (83.0%) | 784 (17.0%) |
| $50,000 to $74,999 | 5,219 (85.6%) | 881 (14.4%) |
| $75,000 to $99,999 | 3,886 (97.3%) | 108 (2.7%) |
| $100,000 and over | 11,996 (93.5%) | 838 (6.5%) |
Public vs Private Health Insurance Coverage by Age in Lake Magdalene
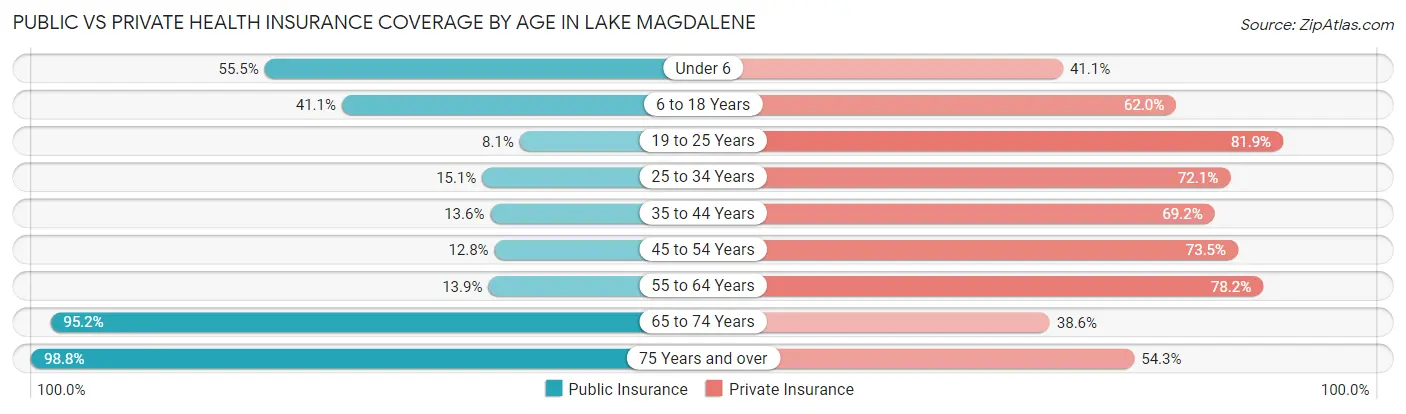
| Age Bracket | Public Insurance | Private Insurance |
| Under 6 | 1,582 (55.5%) | 1,171 (41.1%) |
| 6 to 18 Years | 1,621 (41.1%) | 2,445 (62.0%) |
| 19 to 25 Years | 164 (8.1%) | 1,654 (81.9%) |
| 25 to 34 Years | 649 (15.1%) | 3,104 (72.1%) |
| 35 to 44 Years | 533 (13.6%) | 2,717 (69.2%) |
| 45 to 54 Years | 471 (12.8%) | 2,708 (73.5%) |
| 55 to 64 Years | 613 (13.9%) | 3,439 (78.2%) |
| 65 to 74 Years | 3,494 (95.2%) | 1,417 (38.6%) |
| 75 Years and over | 2,224 (98.8%) | 1,222 (54.3%) |
| Total | 11,351 (36.6%) | 19,877 (64.0%) |
Disability Status by Sex by Age in Lake Magdalene
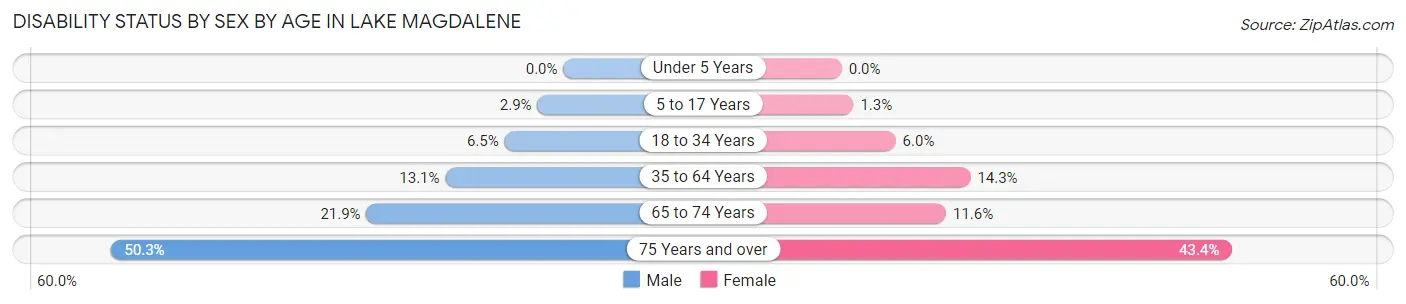
| Age Bracket | Male | Female |
| Under 5 Years | 0 (0.0%) | 0 (0.0%) |
| 5 to 17 Years | 62 (2.9%) | 26 (1.3%) |
| 18 to 34 Years | 214 (6.5%) | 195 (6.0%) |
| 35 to 64 Years | 777 (13.1%) | 874 (14.3%) |
| 65 to 74 Years | 391 (21.9%) | 219 (11.6%) |
| 75 Years and over | 461 (50.3%) | 579 (43.4%) |
Disability Class by Sex by Age in Lake Magdalene
Disability Class: Hearing Difficulty
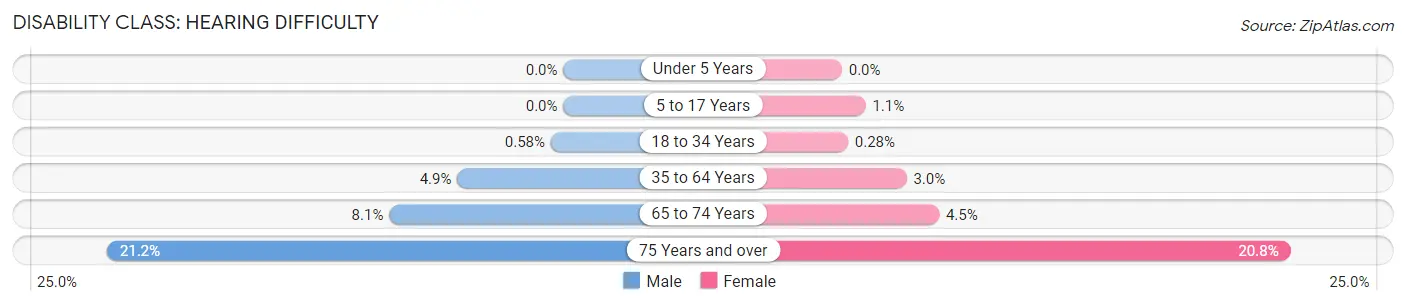
| Age Bracket | Male | Female |
| Under 5 Years | 0 (0.0%) | 0 (0.0%) |
| 5 to 17 Years | 0 (0.0%) | 22 (1.1%) |
| 18 to 34 Years | 19 (0.6%) | 9 (0.3%) |
| 35 to 64 Years | 291 (4.9%) | 183 (3.0%) |
| 65 to 74 Years | 144 (8.1%) | 85 (4.5%) |
| 75 Years and over | 194 (21.2%) | 278 (20.8%) |
Disability Class: Vision Difficulty
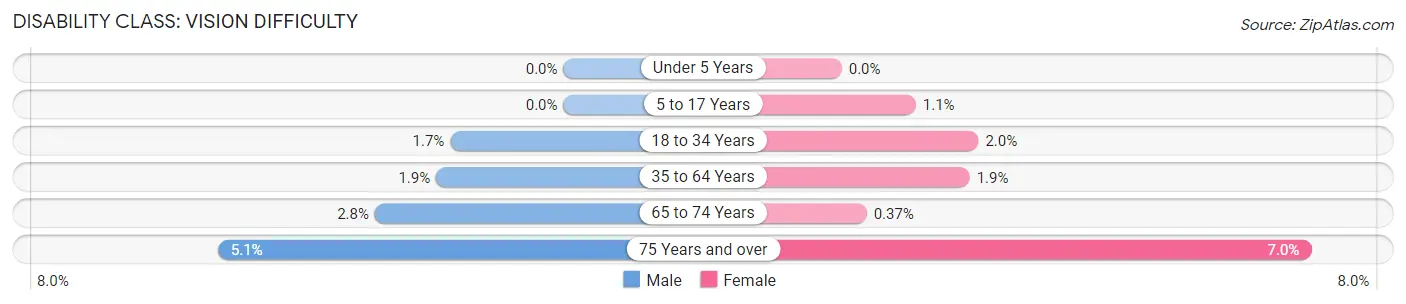
| Age Bracket | Male | Female |
| Under 5 Years | 0 (0.0%) | 0 (0.0%) |
| 5 to 17 Years | 0 (0.0%) | 22 (1.1%) |
| 18 to 34 Years | 55 (1.7%) | 66 (2.0%) |
| 35 to 64 Years | 112 (1.9%) | 116 (1.9%) |
| 65 to 74 Years | 50 (2.8%) | 7 (0.4%) |
| 75 Years and over | 47 (5.1%) | 93 (7.0%) |
Disability Class: Cognitive Difficulty
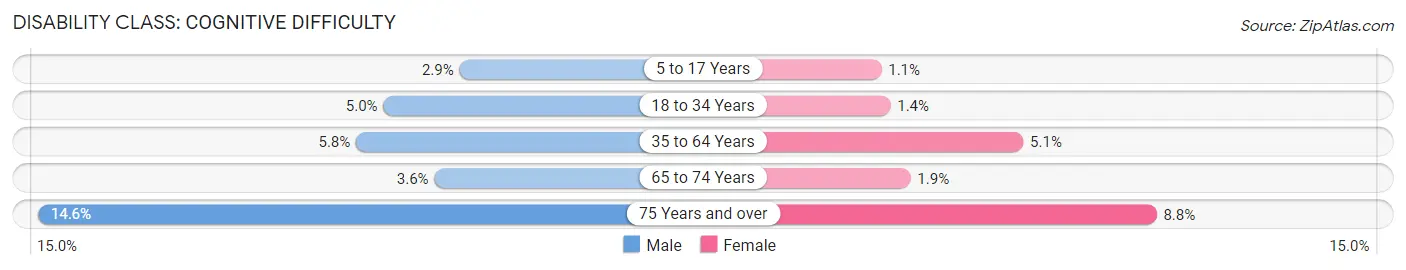
| Age Bracket | Male | Female |
| 5 to 17 Years | 62 (2.9%) | 22 (1.1%) |
| 18 to 34 Years | 164 (5.0%) | 44 (1.3%) |
| 35 to 64 Years | 341 (5.8%) | 308 (5.1%) |
| 65 to 74 Years | 64 (3.6%) | 36 (1.9%) |
| 75 Years and over | 134 (14.6%) | 117 (8.8%) |
Disability Class: Ambulatory Difficulty
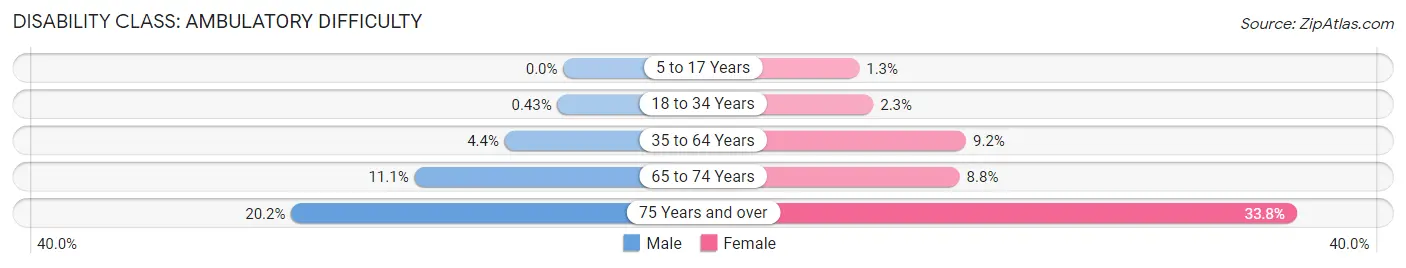
| Age Bracket | Male | Female |
| 5 to 17 Years | 0 (0.0%) | 26 (1.3%) |
| 18 to 34 Years | 14 (0.4%) | 76 (2.3%) |
| 35 to 64 Years | 257 (4.3%) | 563 (9.2%) |
| 65 to 74 Years | 197 (11.1%) | 165 (8.7%) |
| 75 Years and over | 185 (20.2%) | 451 (33.8%) |
Disability Class: Self-Care Difficulty
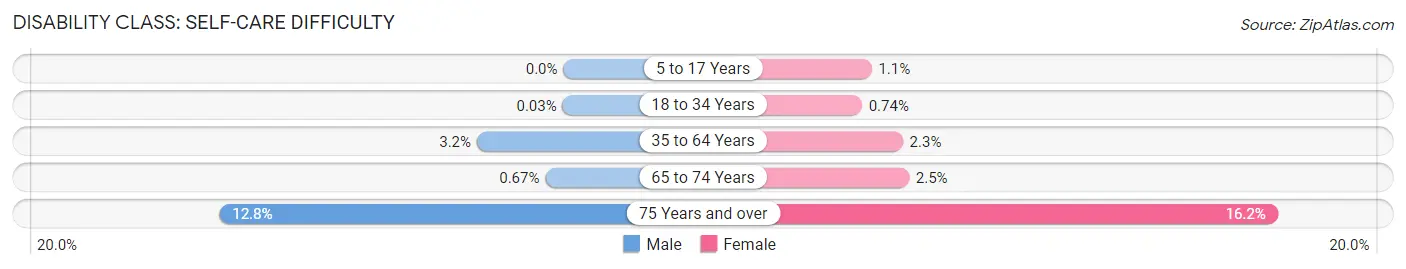
| Age Bracket | Male | Female |
| 5 to 17 Years | 0 (0.0%) | 22 (1.1%) |
| 18 to 34 Years | 1 (0.0%) | 24 (0.7%) |
| 35 to 64 Years | 190 (3.2%) | 138 (2.3%) |
| 65 to 74 Years | 12 (0.7%) | 47 (2.5%) |
| 75 Years and over | 117 (12.8%) | 216 (16.2%) |
Technology Access in Lake Magdalene
Computing Device Access in Lake Magdalene
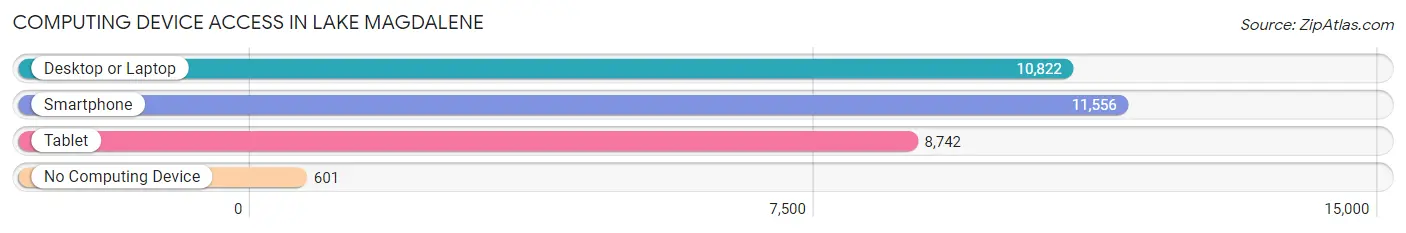
| Device Type | # Households | % Households |
| Desktop or Laptop | 10,822 | 84.1% |
| Smartphone | 11,556 | 89.8% |
| Tablet | 8,742 | 67.9% |
| No Computing Device | 601 | 4.7% |
| Total | 12,868 | 100.0% |
Internet Access in Lake Magdalene
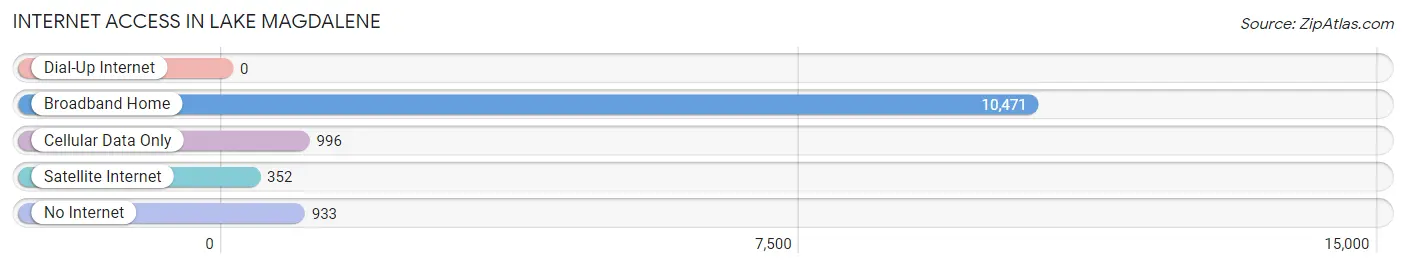
| Internet Type | # Households | % Households |
| Dial-Up Internet | 0 | 0.0% |
| Broadband Home | 10,471 | 81.4% |
| Cellular Data Only | 996 | 7.7% |
| Satellite Internet | 352 | 2.7% |
| No Internet | 933 | 7.2% |
| Total | 12,868 | 100.0% |
Lake Magdalene Summary
Magdalene Lake is a small lake located in Hillsborough County, Florida. It is located just north of Tampa and is part of the Tampa Bay area. The lake is approximately 1,000 acres in size and is surrounded by residential neighborhoods. It is a popular spot for fishing, boating, and other recreational activities.
History
The lake was originally named Lake Magdalene by early settlers in the area. The name was derived from the nearby Magdalene River, which was named after Mary Magdalene, a follower of Jesus Christ. The lake was first settled in the late 1800s and was used for fishing and recreation. In the early 1900s, the lake was used as a source of drinking water for the city of Tampa.
In the 1950s, the lake was developed into a residential area. The lake was dredged and filled in order to create more land for development. The lake was also connected to the Hillsborough River, which allowed for better access to the lake.
Geography
Magdalene Lake is located in Hillsborough County, Florida. It is located just north of Tampa and is part of the Tampa Bay area. The lake is approximately 1,000 acres in size and is surrounded by residential neighborhoods. The lake is fed by the Hillsborough River and is connected to the Tampa Bay estuary. The lake is also connected to the Hillsborough River by a canal.
The lake is located in a flat, low-lying area and is surrounded by wetlands. The lake is shallow, with an average depth of only three feet. The lake is also home to a variety of wildlife, including fish, turtles, and birds.
Economy
The economy of Magdalene Lake is largely based on tourism and recreation. The lake is a popular spot for fishing, boating, and other recreational activities. The lake is also home to several marinas, which provide boat rentals and other services.
The lake is also home to several restaurants and bars, which cater to tourists and locals alike. The lake is also home to several residential neighborhoods, which provide housing for those who live in the area.
Demographics
The population of Magdalene Lake is approximately 5,000 people. The population is largely made up of families and retirees. The median age of the population is 44 years old. The median household income is $50,000.
The majority of the population is white, with a small percentage of African Americans and Hispanics. The majority of the population is Christian, with a small percentage of other religions.
Conclusion
Magdalene Lake is a small lake located in Hillsborough County, Florida. It is located just north of Tampa and is part of the Tampa Bay area. The lake is approximately 1,000 acres in size and is surrounded by residential neighborhoods. The lake is a popular spot for fishing, boating, and other recreational activities. The economy of Magdalene Lake is largely based on tourism and recreation. The population of Magdalene Lake is approximately 5,000 people. The population is largely made up of families and retirees. The majority of the population is white, with a small percentage of African Americans and Hispanics. The majority of the population is Christian, with a small percentage of other religions.
Common Questions
What is Per Capita Income in Lake Magdalene?
Per Capita income in Lake Magdalene is $44,914.
What is the Median Family Income in Lake Magdalene?
Median Family Income in Lake Magdalene is $87,069.
What is the Median Household income in Lake Magdalene?
Median Household Income in Lake Magdalene is $69,898.
What is Income or Wage Gap in Lake Magdalene?
Income or Wage Gap in Lake Magdalene is 13.2%.
Women in Lake Magdalene earn 86.8 cents for every dollar earned by a man.
What is Family Income Deficit in Lake Magdalene?
Family Income Deficit in Lake Magdalene is $8,325.
Families that are below poverty line in Lake Magdalene earn $8,325 less on average than the poverty threshold level.
What is Inequality or Gini Index in Lake Magdalene?
Inequality or Gini Index in Lake Magdalene is 0.49.
What is the Total Population of Lake Magdalene?
Total Population of Lake Magdalene is 31,546.
What is the Total Male Population of Lake Magdalene?
Total Male Population of Lake Magdalene is 15,633.
What is the Total Female Population of Lake Magdalene?
Total Female Population of Lake Magdalene is 15,913.
What is the Ratio of Males per 100 Females in Lake Magdalene?
There are 98.24 Males per 100 Females in Lake Magdalene.
What is the Ratio of Females per 100 Males in Lake Magdalene?
There are 101.79 Females per 100 Males in Lake Magdalene.
What is the Median Population Age in Lake Magdalene?
Median Population Age in Lake Magdalene is 41.1 Years.
What is the Average Family Size in Lake Magdalene
Average Family Size in Lake Magdalene is 3.0 People.
What is the Average Household Size in Lake Magdalene
Average Household Size in Lake Magdalene is 2.4 People.
How Large is the Labor Force in Lake Magdalene?
There are 16,330 People in the Labor Forcein in Lake Magdalene.
What is the Percentage of People in the Labor Force in Lake Magdalene?
63.9% of People are in the Labor Force in Lake Magdalene.
What is the Unemployment Rate in Lake Magdalene?
Unemployment Rate in Lake Magdalene is 3.4%.